Fuel Price Subsidies in Gabon: Fiscal Cost and ... · II. The Magnitude of ... subsidization) fee...
17
WP/06/243 Fuel Price Subsidies in Gabon: Fiscal Cost and Distributional Impact Moataz El Said and Daniel Leigh
Transcript of Fuel Price Subsidies in Gabon: Fiscal Cost and ... · II. The Magnitude of ... subsidization) fee...

WP/06/243
Fuel Price Subsidies in Gabon: Fiscal Cost and Distributional Impact
Moataz El Said and Daniel Leigh

© 2006 International Monetary Fund WP/06/243 IMF Working Paper Fiscal Affairs Department
Fuel Price Subsidies in Gabon: Fiscal Cost and Distributional Impact
Prepared by Moataz El Said and Daniel Leigh
Authorized for distribution by Manmohan S. Kumar and Gerd Schwartz
October 2006
Abstract
This Working Paper should not be reported as representing the views of the IMF. The views expressed in this Working Paper are those of the author(s) and do not necessarily represent those of the IMF or IMF policy. Working Papers describe research in progress by the author(s) and are published to elicit comments and to further debate.
This paper looks at the fiscal cost and distributional impact of implicit fuel price subsidies in Gabon, where fuel prices have remained largely unchanged since 2002. Using estimated implicit import parity prices, we evaluate the total fiscal cost of the subsidies at 3.2 percent of non-oil GDP in 2005—more than total public health expenditures. We also analyze the distribution of the subsidies using household survey data and find that the bulk of the subsidies benefit higher-income households. Finally, we suggest use of a number of existing programs to provide a more targeted and cost-effective means of protecting the real incomes of lower-income households from the effects of energy price increases. JEL Classification Numbers: H20, H22, H23 Keywords: Fuel-price subsidies, Gabon, income distribution Author’s E-Mail Address: [email protected]; [email protected]
- 2 -
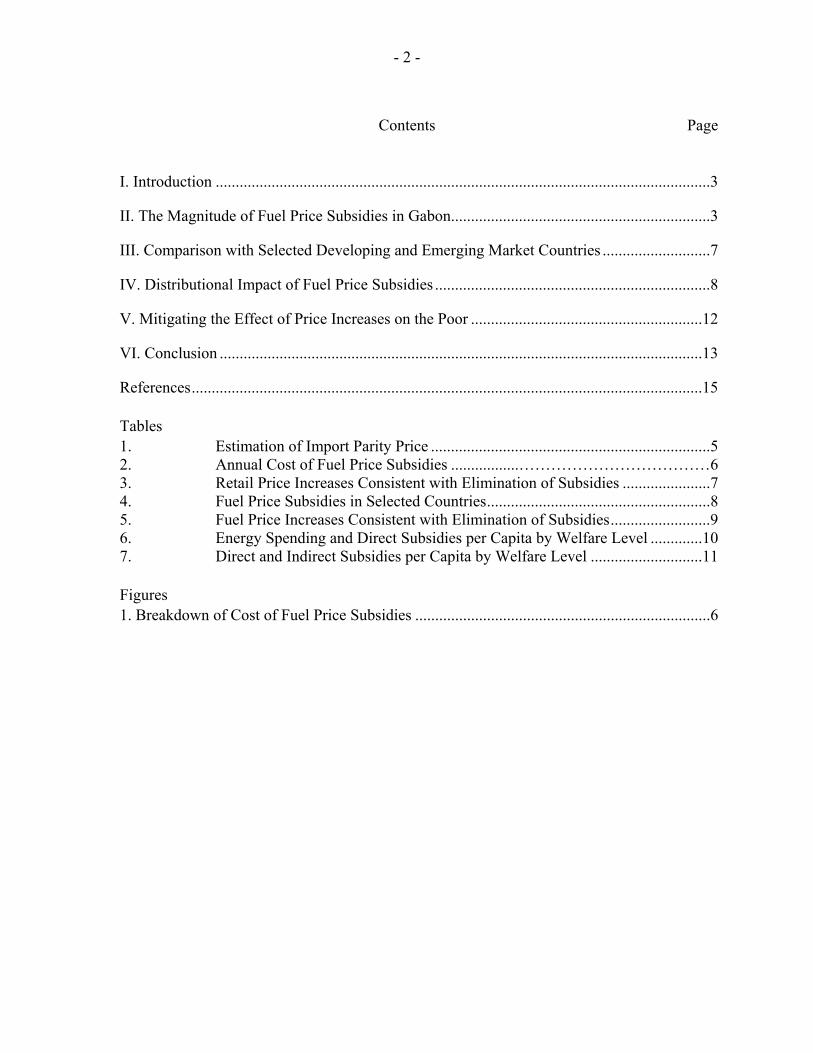
Contents Page
I. Introduction ............................................................................................................................3
II. The Magnitude of Fuel Price Subsidies in Gabon.................................................................3
III. Comparison with Selected Developing and Emerging Market Countries ...........................7
IV. Distributional Impact of Fuel Price Subsidies .....................................................................8
V. Mitigating the Effect of Price Increases on the Poor ..........................................................12
VI. Conclusion .........................................................................................................................13
References................................................................................................................................15 Tables 1. Estimation of Import Parity Price ......................................................................5 2. Annual Cost of Fuel Price Subsidies .................………………………………6 3. Retail Price Increases Consistent with Elimination of Subsidies ......................7 4. Fuel Price Subsidies in Selected Countries........................................................8 5. Fuel Price Increases Consistent with Elimination of Subsidies.........................9 6. Energy Spending and Direct Subsidies per Capita by Welfare Level .............10 7. Direct and Indirect Subsidies per Capita by Welfare Level ............................11 Figures 1. Breakdown of Cost of Fuel Price Subsidies ..........................................................................6
- 3 -
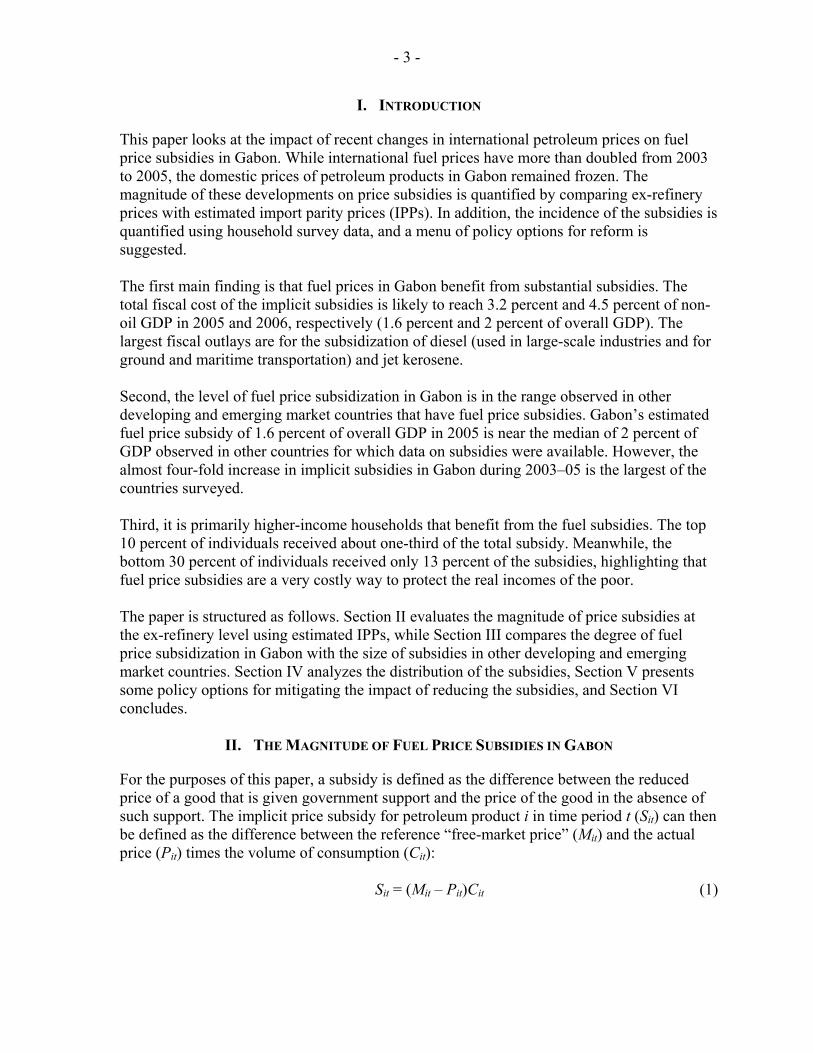
I. INTRODUCTION
This paper looks at the impact of recent changes in international petroleum prices on fuel price subsidies in Gabon. While international fuel prices have more than doubled from 2003 to 2005, the domestic prices of petroleum products in Gabon remained frozen. The magnitude of these developments on price subsidies is quantified by comparing ex-refinery prices with estimated import parity prices (IPPs). In addition, the incidence of the subsidies is quantified using household survey data, and a menu of policy options for reform is suggested. The first main finding is that fuel prices in Gabon benefit from substantial subsidies. The total fiscal cost of the implicit subsidies is likely to reach 3.2 percent and 4.5 percent of non-oil GDP in 2005 and 2006, respectively (1.6 percent and 2 percent of overall GDP). The largest fiscal outlays are for the subsidization of diesel (used in large-scale industries and for ground and maritime transportation) and jet kerosene. Second, the level of fuel price subsidization in Gabon is in the range observed in other developing and emerging market countries that have fuel price subsidies. Gabon’s estimated fuel price subsidy of 1.6 percent of overall GDP in 2005 is near the median of 2 percent of GDP observed in other countries for which data on subsidies were available. However, the almost four-fold increase in implicit subsidies in Gabon during 2003–05 is the largest of the countries surveyed. Third, it is primarily higher-income households that benefit from the fuel subsidies. The top 10 percent of individuals received about one-third of the total subsidy. Meanwhile, the bottom 30 percent of individuals received only 13 percent of the subsidies, highlighting that fuel price subsidies are a very costly way to protect the real incomes of the poor. The paper is structured as follows. Section II evaluates the magnitude of price subsidies at the ex-refinery level using estimated IPPs, while Section III compares the degree of fuel price subsidization in Gabon with the size of subsidies in other developing and emerging market countries. Section IV analyzes the distribution of the subsidies, Section V presents some policy options for mitigating the impact of reducing the subsidies, and Section VI concludes.
II. THE MAGNITUDE OF FUEL PRICE SUBSIDIES IN GABON
For the purposes of this paper, a subsidy is defined as the difference between the reduced price of a good that is given government support and the price of the good in the absence of such support. The implicit price subsidy for petroleum product i in time period t (Sit) can then be defined as the difference between the reference “free-market price” (Mit) and the actual price (Pit) times the volume of consumption (Cit):
Sit = (Mit – Pit)Cit (1)

- 4 -
At the core of the fuel price subsidies in Gabon are the ex-refinery prices of the seven petroleum products that have been frozen since 2002.1 The sole supplier of these products to the domestic market is the majority-privately-owned refinery SOGARA,2 which purchases the crude oil required for its operations on the Gabonese market at an international market price. Due to the freeze on prices, the refinery sustains a loss when it sells the refined products on the Gabonese market. To quantify the loss, i.e., the value of the fuel price subsidy, a reference price (Mit) is computed every month by SOGARA using an IPP formula. The difference between the IPP and the frozen ex-refinery price multiplied by the quantity sold equals the monthly loss to the refinery, for which it is compensated fully by the government. Payment is made in the form of crude oil delivered free of charge to SOGARA. SOGARA calculates the IPP using the items shown in Table 1. The IPP equals the f.o.b. Mediterranean price reported in Platt’s (row 1), plus a number of import costs (transportation and financial costs, rows 3-6) and customs duties (rows 16–19). An equalization (cross-subsidization) fee is applied to super and aviation jet fuel (Jet A1) to cover discounts applicable on other petroleum products (row 33). Importantly, the IPP also includes a fee, called the “competitiveness differential,” of 15,000 CFAF per cubic meter (for super gasoline, diesel, lighting kerosene, and jet kerosene) or per metric ton (for fuel oil, asphalt, and butane), row 31, i.e., collected on account of SOGARA’s production inefficiency.3 The “volume adjustment factors” (line 27) serve to convert the units of measurement for super gasoline, lighting kerosene, jet kerosene, and diesel from metric tons into cubic meters.4 The fiscal cost of the subsidies due to the ex-refinery price freeze is estimated to have reached 3.2 percent of non-oil GDP in 2005, and is expected to rise to 4.5 percent in 2006 (Table 2). This cost exceeds total public spending on health (2.2 percent of non-oil GDP) and national education (3.1 percent of non-oil GDP) in 2005. In contrast, in 2003, the estimated cost of the subsidies represented less than 1 percent of non-oil GDP. Two-thirds of the cost of the subsidies corresponds to diesel (Figure 1).5 The second largest share of the total cost of 1 The seven fuel products are super gasoline, diesel, lighting kerosene, butane gas, jet kerosene, fuel oil, and asphalt. Prior to August 2002, ex-refinery prices had been adjusted in line with an automatic mechanism based on the IPP formula. According to the formula, ex-refinery prices are adjusted to the new IPP levels if the weighted average of the seven IPPs changes by 4 percent or more relative to the previous month’s level. However, the adjustment mechanism was suspended in August 2002.
2 SOGARA is owned by the Gabonese government (25 percent); Total (49.25 percent); Mobil, Shell; ChevronTexaco, Agip (6.25 percent each); and others (7 percent). Because domestic demand exceeds SOGARA’s output, the refinery satisfies the domestic shortage by importing the products. 3 The “competitiveness differential” was originally intended to allow SOGARA to make a modest profit, assuming it kept control of its costs. The authorities had intended for the competitiveness differential to gradually be reduced as SOGARA’s throughput increased and as it reduced its administrative expenses. However, maintaining the competitiveness differential has been necessary due to the refinery’s production inefficiency.
4 The conversion factors are computed using standard densities for the products at 15oC.
5 More than 80 percent of the total cost is due to subsidies on diesel, super gasoline, lighting kerosene, and butane, the prices of which are frozen at the retail level (as well as at the ex-refinery level).

- 5 -
subsidies (15 percent) corresponds to jet kerosene, used for air transport.6 The third largest share (more than 7 percent) corresponds to super gasoline, used in private motor vehicles.
6 In August 2006, the jet kerosene subsidy was eliminated by raising jet kerosene prices to the IPP level and reinstating the IPP adjustment mechanism for this one product. Therefore, the share of the jet kerosene subsidy in 2006 may be less than 15 percent. In 2007, the share of the jet kerosene subsidy would, by definition, be zero.
Super gasoline Light. kerosene Jet kerosene Diesel Butane Fuel oil Asphaltrow 1 FOB MED (USD/T) 472.6
507.0
507.0
439.8
329.8
217.8
247.6 2
3 Direct maritime freight costs (USD) 66.4
66.4
66.4
66.4
100.0 66.4
100.0
4 Merchant margin (USD) 4.0
4.0
4.0
4.0
4.0 4.0
4.0
5 Insurance 0.15% (FOB + freight + margin) 0.8
0.9
0.9
0.8
0.7 0.4
0.5
6 Losses 0.25% (FOB + freight + margin + insurance) 1.4
1.4
1.4
1.3
1.1 0.7
0.9
7 Total international freight costs 72.6
72.7
72.7
72.4
105.7 71.6
105.4
8 9 CIF price, Port Gentil (USD/T) 545.2 579.7 579.7 512.3 435.5 289.4 353.010 11 Finance charges (applied to CIF price) 12 Libor + 2% 5.3 5.7 5.0 5.0 4.1 2.9 3.313 CREDIT letter (0.75% of CIF price) 4.1 4.3 4.3 3.8 3.3 2.2 2.614 Total finance charges 9.4 10.0 9.4 8.9 7.4 5.1 6.015 16 Direct import costs (USD/T) 0.5 0.5 0.5 0.5 0.5 0.5 0.517 Customs duties 11.4% of CIF price 62.1 66.1 66.1 58.4 49.7 33.0 40.218 Port royalties (USD/T) 2.4 2.4 2.4 2.4 2.4 2.4 2.419 Passage charges at SOGARA terminal 4.5 4.5 4.5 4.5 4.5 4.5 4.520 21 IPP, Port Gentil (USD/T) 624.1 663.1 662.5 586.9 499.9 334.8 406.622 23 CFAF/USD exchange rate 539.7 539.7 539.7 539.7 539.7 539.7 539.724 25 IPP, Port Gentil in (CFAF/T) 336,814.2 357,865.8 357,525.8 316,728.1 269,777.9 180,701.4 219,431.626 27 Volume adjustment factor 0.7 0.8 0.8 0.9 1.0 1.0 1.028 29 IPP, Port Gentil in (CFAF per M3 or T) 1/ 245,874.4 286,292.6 286,020.7 269,218.8 269,777.9 180,701.4 219,431.630 31 "Competitiveness differential" (CFAF/M3 or T) 1/ 10,950.0 12,000.0 12,000.0 12,750.0 15,000.0 15,000.0 15,000.032 33 Equalization factor "péréquation entre produits" 31,600.0 -29,000.0 23,000.0 -4,600.0 -55,115.0 -14,000.0 -34,000.034 35 Implicit IPP - POG (in CFAF/M3) 288,424.4 269,292.6 321,020.7 277,368.8 229,662.9 181,701.4 200,431.636 Actual ex-refinery price (frozen since August 2002) 214,404.0 145,693.0 197,693.0 172,313.0 155,717.0 142,348.0 146,857.037 Required price increase (percent) 34.5 84.8 62.4 61.0 47.5 27.6 36.538 Ex-refinery subsidy (FCFA/M3 or T) 1/ 74,020.4 123,599.6 123,327.7 105,055.8 73,945.9 39,353.4 53,574.639 40 Quantity sold on domestic market (M3 or T) 1/ 4,735.0 3,707.0 5,959.0 31,609.0 2,098.0 8,897.0 122.041 Monthly loss incurred (CFAF) 350,486,381.2 458,183,875.2 734,909,489.5 3,320,710,225.2 155,138,542.7 350,127,130.5 6,536,102.142 Annualized loss (in percent of annual NOGDP) 2/ 0.2 0.2 0.4 1.8 0.1 0.2 0.0
1/ Asphalt, butane, and fuel oil quantities are in metric tones (T). The rest are in cubic meters (M3).2/ Costs in this table are annualized by multiplying the June amount by 12.
Table 1. Estimation of Import Parity Price, June 2005

- 6 -
2003 2004 2005 2006 1/
Total cost (billions of CFAF) 14 28 72 107(percent of GDP) 0.4 0.7 1.6 2.2(percent of non-oil GDP) 0.7 1.3 3.3 4.4
Memo itemsTotal public education expenditure (billions of CFAF) 2/ 70.0Total public health expenditure (billions of CFAF) 2/ 50.3Source: Gabonese authorities and IMF staff calculations and projections.1/ Projection for 2006 incorporates increase in jet fuel price in August, and assumes unchanged ex-refinery prices
for the remaining products, international fuel prices evolving following World Economic Outlook projections,
and domestic fuel consumption expanding at the rate of real non-oil GDP growth.2/ Total appropriations in the supplementary budget on wages and salaries, goods and services,
transfers, and domestically financed investment spending, in the education and health sectors, respectively.
Table 2. Annual Cost of Fuel Price Subsidies, 2003-06
Figure 1. Breakdown of Cost of Fuel Price Subsidies, 2005 (Percent of total cost)
66
15
7
5
4
3
0
0 10 20 30 40 50 60 70
Diesel
Jet kerosene
Super gasoline
Lampant kerosene
Fuel oil
Butane gas
Asphalt
The new 2006 supplementary budget includes the fuel price subsidies explicitly. In previous years, the cost of the subsidies was not reported in the fiscal accounts but was instead netted against oil revenue. In other words, expenditure on the subsidies was conducted off budget, and was financed by off-budget oil revenue. The 2006 supplementary budget has contributed to improving fiscal transparency by including a budgetary appropriation for the fuel price subsidies of CFAF 110 billion. However, the final cost of subsidies in 2006 is likely to be lower than this amount, due to the elimination of the jet kerosene subsidy in August (15% of the total cost of the subsidies).
- 7 -
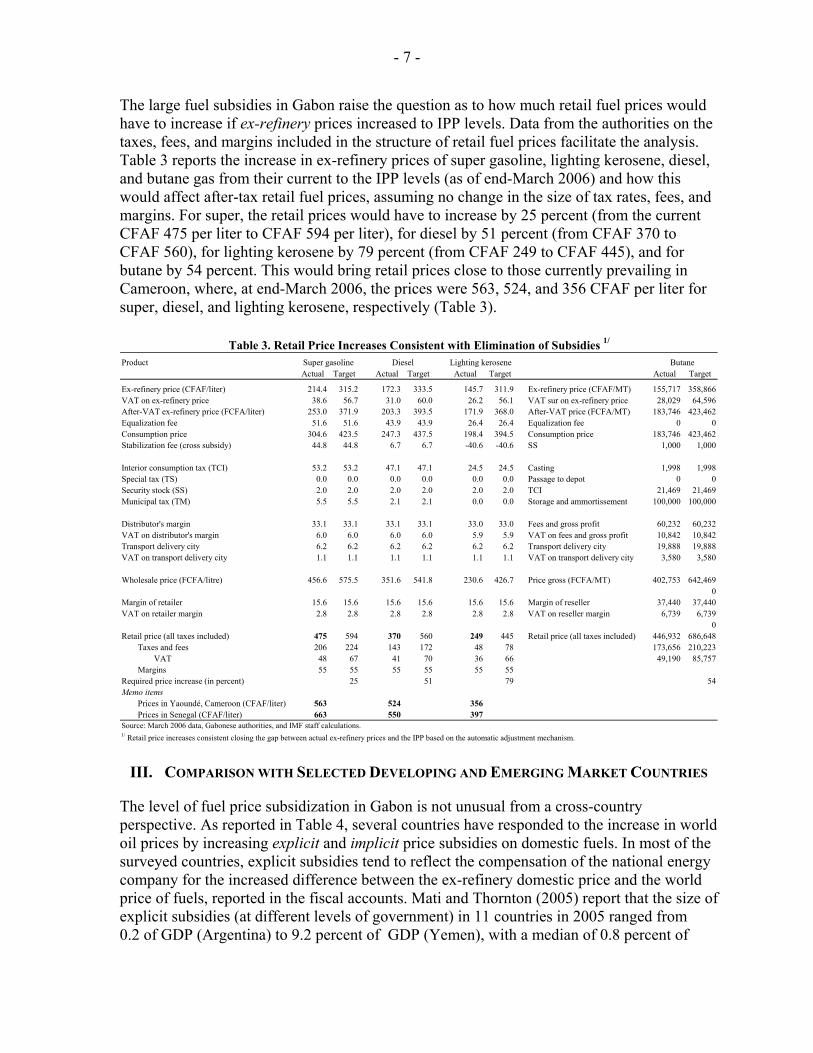
The large fuel subsidies in Gabon raise the question as to how much retail fuel prices would have to increase if ex-refinery prices increased to IPP levels. Data from the authorities on the taxes, fees, and margins included in the structure of retail fuel prices facilitate the analysis. Table 3 reports the increase in ex-refinery prices of super gasoline, lighting kerosene, diesel, and butane gas from their current to the IPP levels (as of end-March 2006) and how this would affect after-tax retail fuel prices, assuming no change in the size of tax rates, fees, and margins. For super, the retail prices would have to increase by 25 percent (from the current CFAF 475 per liter to CFAF 594 per liter), for diesel by 51 percent (from CFAF 370 to CFAF 560), for lighting kerosene by 79 percent (from CFAF 249 to CFAF 445), and for butane by 54 percent. This would bring retail prices close to those currently prevailing in Cameroon, where, at end-March 2006, the prices were 563, 524, and 356 CFAF per liter for super, diesel, and lighting kerosene, respectively (Table 3).
ProductActual Target Actual Target Actual Target Actual Target
Ex-refinery price (CFAF/liter) 214.4 315.2 172.3 333.5 145.7 311.9 Ex-refinery price (CFAF/MT) 155,717 358,866VAT on ex-refinery price 38.6 56.7 31.0 60.0 26.2 56.1 VAT sur on ex-refinery price 28,029 64,596After-VAT ex-refinery price (FCFA/liter) 253.0 371.9 203.3 393.5 171.9 368.0 After-VAT price (FCFA/MT) 183,746 423,462Equalization fee 51.6 51.6 43.9 43.9 26.4 26.4 Equalization fee 0 0Consumption price 304.6 423.5 247.3 437.5 198.4 394.5 Consumption price 183,746 423,462Stabilization fee (cross subsidy) 44.8 44.8 6.7 6.7 -40.6 -40.6 SS 1,000 1,000
Interior consumption tax (TCI) 53.2 53.2 47.1 47.1 24.5 24.5 Casting 1,998 1,998Special tax (TS) 0.0 0.0 0.0 0.0 0.0 0.0 Passage to depot 0 0Security stock (SS) 2.0 2.0 2.0 2.0 2.0 2.0 TCI 21,469 21,469Municipal tax (TM) 5.5 5.5 2.1 2.1 0.0 0.0 Storage and ammortissement 100,000 100,000
Distributor's margin 33.1 33.1 33.1 33.1 33.0 33.0 Fees and gross profit 60,232 60,232VAT on distributor's margin 6.0 6.0 6.0 6.0 5.9 5.9 VAT on fees and gross profit 10,842 10,842Transport delivery city 6.2 6.2 6.2 6.2 6.2 6.2 Transport delivery city 19,888 19,888VAT on transport delivery city 1.1 1.1 1.1 1.1 1.1 1.1 VAT on transport delivery city 3,580 3,580
Wholesale price (FCFA/litre) 456.6 575.5 351.6 541.8 230.6 426.7 Price gross (FCFA/MT) 402,753 642,4690
Margin of retailer 15.6 15.6 15.6 15.6 15.6 15.6 Margin of reseller 37,440 37,440VAT on retailer margin 2.8 2.8 2.8 2.8 2.8 2.8 VAT on reseller margin 6,739 6,739
0Retail price (all taxes included) 475 594 370 560 249 445 Retail price (all taxes included) 446,932 686,648
Taxes and fees 206 224 143 172 48 78 173,656 210,223VAT 48 67 41 70 36 66 49,190 85,757
Margins 55 55 55 55 55 55Required price increase (in percent) 25 51 79 54Memo items
Prices in Yaoundé, Cameroon (CFAF/liter) 563 524 356Prices in Senegal (CFAF/liter) 663 550 397
Source: March 2006 data, Gabonese authorities, and IMF staff calculations.1/ Retail price increases consistent closing the gap between actual ex-refinery prices and the IPP based on the automatic adjustment mechanism.
ButaneSuper gasoline Lighting keroseneDiesel
Table 3. Retail Price Increases Consistent with Elimination of Subsidies 1/
III. COMPARISON WITH SELECTED DEVELOPING AND EMERGING MARKET COUNTRIES
The level of fuel price subsidization in Gabon is not unusual from a cross-country perspective. As reported in Table 4, several countries have responded to the increase in world oil prices by increasing explicit and implicit price subsidies on domestic fuels. In most of the surveyed countries, explicit subsidies tend to reflect the compensation of the national energy company for the increased difference between the ex-refinery domestic price and the world price of fuels, reported in the fiscal accounts. Mati and Thornton (2005) report that the size of explicit subsidies (at different levels of government) in 11 countries in 2005 ranged from 0.2 of GDP (Argentina) to 9.2 percent of GDP (Yemen), with a median of 0.8 percent of

- 8 -
GDP. Regarding implicit subsidies, Mati and Thornton (2005) report projections for eight countries for 2005 in the range of 0.3 percent of GDP (Cameroon) to 9.9 percent (Azerbaijan), with a median of 2.0 percent of GDP. Gabon’s implicit subsidy for 2005 of 1.5 percent of overall GDP is thus well within the range of shares observed in the countries surveyed. However, the almost fourfold increase in implicit subsidies in Gabon during 2003–05 is the largest among the countries in the sample.
2003 2005 1/
(a) ExplicitArgentina 0.2Azerbaijan 5.5 2.8Bolivia 0.6 0.8Congo, Rep. of 0.8 1.0Ghana 0.2 0.4Indonesia 1.5 3.2Jordan 6.6Pakistan 0.1 0.2Senegal 0.7Sri Lanka 0.8Yemen 5.0 9.2average 2.0 2.4median 0.8 0.8
(b) ImplicitAzerbaijan 8.2 9.9Bolivia 2.3Cameroon 0.3Colombia 1.2 1.3Ecuador 1.4 3.6Egypt 3.9 4.1Gabon 0.4 1.6Nigeria 1.6 1.6average 2.8 3.1median 1.5 2.0Source: Mati and Thornton (2005).1/ Estimates based on preliminary data.
(In percent of GDP)Table 4. Fuel Price Subsidies in Selected Countries
IV. DISTRIBUTIONAL IMPACT OF FUEL PRICE SUBSIDIES
Who benefits from the fuel price subsidies? The distribution of the subsidies is calculated by simulating the impact of removing the subsidies on household real incomes across the income distribution using the 2005 Gabonese Survey for the Evaluation and Tracking of Poverty (EGEP) household data set. The simulation involves raising ex-refinery prices to IPP levels, while keeping tax rates, fees, and margins unchanged. Table 5 shows the simulated fuel price increases, which averaged 54 percent at end-March 2006.

- 9 -
Product Price IncreaseSuper gasoline 25Lighting kerosene 79Diesel 51Butane gas 54Jet kerosene 69Asphalt 50Fuel oil 51
Average 54Transport fuel2/ 401/ Increases in retail prices (all taxes included) for super gasoline, lighting kerosene, diesel, and butane. Increases in ex-refinery prices for jet kerosene, asphalt, and fuel oil,based on March 2006 data.2/ The price of transport fuel is a weighted average of diesel (57 percent) andsuper gasoline (43 percent), based on SOGARA data on fuel use in Gabon.
(In percent) 1/Table 5. Fuel Price Increases Consistent with Elimination of Subsidies
Higher domestic prices for petroleum products would affect household real incomes through two channels: directly from an increase in the prices paid by households for their direct consumption of petroleum products, and indirectly from increases in prices of other goods and services (e.g., higher prices for food and transportation) consumed by households as producers pass on the higher costs of fuel inputs. Calculating the direct effect requires information on the level of consumption of fuel by individual households in different parts of the national income distribution. The Gabon 2005 EGEP household survey contains reported expenditure by households on individual fuel products. A “first-order” estimate of the direct real income effect of fuel price increases can be calculated as follows. For each household, one calculates the budget share of fuel expenditure items, i.e., fuel expenditures divided by total household consumption. The data indicate that poor households report smaller budget shares for transport fuel than do higher- income groups. Also, poor consumers have larger lighting kerosene budget shares than do rich households. Then multiplying the budget shares by the required percentage increase in retail fuel prices (Table 5) gives a first-order estimate of the real income effect of the price rise, which assumes that fuel consumption stays fixed (Table 6).7
7 This overestimates the real income effect, since, in practice, households can reduce this impact by substituting away from fuel. For a discussion of the theoretical foundations of this approach in the context of price and tax reforms, see Ahmad and Stern (1984, 1991), Newbery and Stern (1987), and Deaton (1997).

- 10 -
Identifying the magnitude of the indirect effect requires an estimate of the effect of higher fuel costs on the prices of other goods and services consumed by households. These price effects can be estimated using an input-output table of the economy showing the energy intensity of each sector and a price-shifting model of the effect of higher fuel costs on prices.8 The indirect real-income effect is then calculated by multiplying the household expenditure shares (from the EGEP survey) for the various goods by their estimated final price increases. Table 7 reports the incidence of both the indirect and direct effect for households at different points of the welfare distribution.9
8 For a detailed presentation of the price-shifting model used for the case of Gabon, see Coady and Newhouse (2005). A multiplier approach yields the cumulative effect of an increase in fuel prices on the prices of goods and services in the other sectors of the economy. The input-output (IO) coefficient matrix used was obtained from the Gabon office of statistics based on 2001 data.
9 There can also be other indirect effects not considered in the analysis, for example, through lower employment in sectors that use petroleum products as inputs.
Product Poorest 2 3 4 5 6 7 8 9 Richest Summary
AverageTransport fuel
2/ 0.0 0.1 0.1 0.3 0.2 0.3 0.5 1.1 1.4 2.5 0.63Lighting kerosene 1.3 0.8 0.6 0.5 0.4 0.4 0.3 0.2 0.2 0.1 0.50Butane cooking gas 1.2 1.6 1.6 1.8 1.6 1.8 1.7 1.6 1.5 1.1 1.54Total 2.59 2.51 2.29 2.53 2.16 2.44 2.48 2.88 3.03 3.71 2.66
AverageTransport fuel 0.00 0.02 0.03 0.12 0.08 0.12 0.19 0.43 0.54 0.98 0.25Lighting kerosene 1.08 0.67 0.50 0.37 0.32 0.31 0.26 0.20 0.16 0.11 0.40Butane cooking gas 0.66 0.86 0.85 0.95 0.85 0.94 0.90 0.84 0.79 0.60 0.82Total 1.74 1.56 1.38 1.44 1.24 1.37 1.35 1.46 1.49 1.69 1.47
AverageTransport fuel 9 99 163 750 543 984 1,916 5,424 8,900 33,259 5204.80Lighting kerosene 2,879 2,704 2,519 2,236 2,261 2,644 2,691 2,512 2,595 3,690 2673.13Butane cooking gas 1,763 3,471 4,289 5,760 6,043 7,927 9,220 10,592 12,955 20,347 8236.90Total 4,651 6,275 6,971 8,747 8,847 11,556 13,827 18,528 24,449 57,296 16,115
TotalTransport fuel 0.0 0.2 0.3 1.4 1.0 1.9 3.7 10.4 17.1 63.9 100.0Lighting kerosene 10.8 10.1 9.4 8.4 8.5 9.9 10.1 9.4 9.7 13.8 100.0Butane cooking gas 2.1 4.2 5.2 7.0 7.3 9.6 11.2 12.9 15.7 24.7 100.0Average 4.3 4.8 5.0 5.6 5.6 7.1 8.3 10.9 14.2 34.1 100.01/ Source: Gabonese authorities (2004 EGEP household survey), and IMF staff calculations.2/ Transport fuel is a weighted average of diesel (57 percent) and super gasoline (43 percent), based on SOGARA data on fuel use in Gabon.
Welfare Decile
Table 6. Energy Spending and Direct Subsidies per Capita by Welfare Level 1/
Distribution of aggregate direct subsidies across welfare groups (percent)
Direct subsidies per capita (CFAF per year)
Direct subsidies as a share of total expenditure (percent)
Expenditure on fuel as a share of total expenditure (percent)

- 11 -
Four main conclusions emerge from the distributional analysis: 1. Most of the subsidy goes to higher-income households. The richest 10 percent of
individuals received about one-third of the total subsidy. Meanwhile, the poorest 30 percent of individuals receive only 13 percent of all the subsidies, highlighting that fuel subsidies are a costly approach to protecting the real incomes of the poor.10 The finding that fuel subsidies are pro-rich in Gabon is consistent with the analysis of the distributional effects of fuel subsidies in other countries.11
2. Even an equal transfer to all households would be better targeted than the existing
subsidies, since 30 percent of benefits would then accrue to the poorest 30 percent of households. The very poor targeting of fuel subsidies is not surprising; almost any universal consumption subsidy disproportionately benefits the rich since they, by definition, account for a relatively high proportion of total income and consumption. In Gabon, the richest 10 percent of households consume more than 30 percent of total consumption, while the poorest 10 percent of households consume only 2.5 percent of the total.
3. The total (direct plus indirect) impact of increasing fuel prices to levels consistent with
IPP would be an average of 6.3 percent of real per capita income (Table 7). This impact corresponds to an average price increase of 54 percent and is consistent with the range
10 The official poverty rate is 33 percent according to the 2005 World Bank Gabon Poverty Assessment (also based on the 2005 EGEP household survey).
11 See Coady and others (2006) for an overview of the distributional impact of fuel-price subsidies in Bolivia, Ghana, Jordan, Mali, and Sri Lanka.
Type of subsidy Poorest 2 3 4 5 6 7 8 9 Richest Summary
AverageDirect subsidies 1.7 1.6 1.4 1.4 1.2 1.4 1.4 1.5 1.5 1.7 1.5Indirect subsidies 4.7 4.8 4.8 4.9 4.9 4.9 4.9 4.9 4.9 4.8 4.8Total 6.5 6.3 6.2 6.3 6.1 6.2 6.2 6.3 6.4 6.4 6.3
AverageDirect subsidies 4,651 6,275 6,971 8,747 8,847 11,556 13,827 18,528 24,449 57,296 16,115Indirect subsidies 12,569 19,196 24,297 29,810 34,927 41,141 49,648 61,536 80,123 161,258 51,450Total 17,220 25,472 31,268 38,557 43,774 52,697 63,475 80,064 104,572 218,554 67,565
TotalDirect subsidies 4.3 4.8 5.0 5.6 5.6 7.1 8.3 10.9 14.2 34.1 100.00Indirect subsidies 2.4 3.7 4.7 5.8 6.8 8.0 9.6 12.0 15.6 31.3 100.00Average 3.4 4.3 4.9 5.7 6.2 7.6 9.0 11.4 14.9 32.7 100.001/ Source: Gabonese authorities (2004 EGEP household survey), and IMF staff calculations.
Direct and indirect subsidies per capita in CFAF per year
Distribution of aggregate direct and indirect subsidies across welfare groups
Table 7. Direct and Indirect Subsidies per Capita by Welfare Level 1/
Welfare Decile
Direct and indirect subsidies as a share of total expenditure (in percent)

- 12 -
observed in other countries (3–9 percent real income decline for average price increases ranging from 34–68 percent), as reported in Coady and others (2006).
4. The indirect effect, at 4.8 percent of real income, is larger than the direct effect. This
finding reflects the fact that a substantial proportion of diesel and other fuel is used in the production and distribution of other goods and services.
V. MITIGATING THE EFFECT OF PRICE INCREASES ON THE POOR
The escalating fiscal cost of the subsidies, and their pro-rich bias, suggests the need to reduce them. There is also a consensus that fuel subsidies are inappropriate on efficiency grounds, as they discourage producers from acquiring more energy-efficient technologies, so as to remain competitive in worlds markets.12 However, governments are often reluctant to allow fuel prices to increase due to the adverse effect that such price increases would have on the real incomes of poor households. Fortunately, as most fuel subsidies accrue to higher-income households, it is often possible to eliminate the subsidies while using some of the budgetary savings to finance better targeted programs to protect the real incomes of the poor from energy price increases. This section suggests a number of mitigating measures that could accompany an increase in fuel prices in Gabon. The suggested measures draw on discussions with the Gabonese authorities and are consistent with policies implemented in other countries that reduced fuel price subsidies, as discussed in Coady and others (2006). Increasing expenditure on poverty-reduction projects. The authorities completed a Poverty Reduction Strategy Paper (PRSP) in early 2006 that includes a number of projects in the health, education, and infrastructure sectors that could offset the impact on the poor of increasing fuel prices. PRSP projects that could benefit from increased budgetary support following the reduction of fuel price subsidies include the following: • Providing additional funding to the National Pharmaceutical Office (OPN) for purchases
of medical supplies and to ensure effective distribution of supplies to remote areas. • Reinforcing the delivery of equipment and of supplies to Regional Centers of Blood
Transfusion (CRTS). • Purchasing equipment for primary schools, improving teacher-training facilities, and
building new primary schools. • Promoting rural electrification, including the construction of small-scale hydroelectric
dams and connection of remote areas to the national electricity grid. • Constructing water purification centers and networks of potable water distribution to
villages. Increasing financial support for Gabon’s existing welfare programs. The National Social Guarantee Fund (CNGS) is responsible for providing family and school tuition allowance 12 See Gupta and others (2003), for example.

- 13 -
payments in favor of indigents. Indigents are defined as Gabonese citizens that have a monetary income below the minimum wage level and are identified using means-based testing. In 2006, the authorities announced an increase in budgetary support for CNGS cash transfer programs. Reducing Gabon’s existing electricity and water “social” tariffs. Given that electricity is an important source of energy for poor households and its cost is closely correlated with fuel prices, reforming the level of electricity prices can mitigate the effect of higher average tariffs on poorer households with access to electricity. In Gabon, the privately owned electricity provider, the Company of Energy and Water of Gabon (SEEG), already offers lower “social” tariffs for electricity and water consumption below certain “social” limits. The lifeline tariffs could be reduced, with the government compensating the SEEG for the resulting losses or with higher tariffs for larger-scale users. Providing utilities free of charge to selected households for a limited period of time was implemented recently in Gabon—during the electoral campaign of late 2005, the government paid for the free provision of water and electricity for one month to all households with a September electricity bill of less than 50,000 CFAF.13
Increasing the geographic targeting of social expenditures. Gabon’s existing rural road network maintenance program, and other public works programs, can be expanded. Such programs not only protect household real incomes in the short run, they can also contribute to the medium-term objective of improving public infrastructure. Reducing or eliminating user charges for education and health services in rural areas can enhance Gabon’s stock of human capital and, over time, growth in the non-oil economy.
Eliminating the subsidies gradually. Phasing the subsidies out over two to three years would allow firms in export-oriented industries, such as those in the forestry sector, to catch up with the fuel-efficiency levels of competitive firms in countries without fuel price subsidies.14 In addition, maintaining the relatively less pro-rich lighting kerosene subsidy for a year or two while reducing subsidies on diesel and super gasoline would give time to implement better targeted expenditure programs. However, price differentials between lighting kerosene and diesel should not be maintained over the medium term as the two products are substitutable.
VI. CONCLUSION
This paper evaluates the fiscal cost and distributional impact of fuel price subsidies in Gabon. The results suggest that the total fiscal cost of the implicit subsidies reached 3.2 percent of
13 Note that this particular temporary measure during the electoral campaign appears to have had a strong pro- rich bias. Analysis using the EGEP survey indicates that, of the total amount spent by the government on the free utilities, 22 percent reached households in the top 10 percent of the population. Half of the total amount reached the top 30 percent of households. Meanwhile, households in the bottom 30 percent of the income distribution received only 15 percent of the free utilities subsidy.
14 See Coady and others (2006) for a discussion of formulae that can be used to smooth the price adjustment.

- 14 -
non-oil GDP in 2005—more than total public health expenditure—and could rise to 4.5 percent of non-oil GDP in 2006. In addition, the fuel subsidies are strongly biased towards higher-income households. The top 10 percent of the income distribution benefits from one-third of the total subsidy, while the bottom 30 percent of the distribution benefits from only 13 percent of the subsidy. The reform of fuel price subsidies in Gabon may therefore be necessary to release resources for critical social services for the poor and to facilitate pro-poor economic growth. At the same time, increases in prices of basic commodities such as lighting kerosene and butane cooking gas may be associated with real income losses for the poor. Therefore, these effects need to be mitigated or eliminated by phasing out the subsidies gradually and reorienting expenditure towards targeted programs and growth-enhancing infrastructure spending. The current period of strong economic growth could offer a useful window to mobilize support for a reduction in the fuel price subsidy. Educating the public about the size and distribution of the subsidies, and depoliticizing fuel prices by using a pre-announced formula-based adjustment path, would further help to generate support for reform.
- 15 -
REFERENCES
Ahmad, E., and N. Stern, 1984, “The Theory of Tax Reform and Indian Indirect Taxes,” Journal of Public Economics, Vol. 25, No. 3, pp. 259–98.
Ahmad, E., and N. Stern, 1991, The Theory and Practice of Tax Reform in Developing Countries (Cambridge, Massachusetts: Cambridge University Press).
Chu, Ke-young, Sanjeev Gupta, Benedict Clements, Daniel Hewitt, Sergio Lugaresi, Jerald Schiff, Ludger Schuknecht, and Gerd Schwartz, 1995, Unproductive Public Expenditures: A Pragmatic Approach to Policy Analysis, IMF Pamphlet Series, No. 48 (Washington: International Monetary Fund).
Coady, David, Moataz El-Said, Robert Gillingham, Roland Kpodar, Paolo Medas, and David Newhouse, 2006, “The Magnitude and Distribution of Fuel Subsidies: Evidence from Bolivia, Jordan, Mali, and Sri Lanka” IMF Working Paper (forthcoming; Washington: International Monetary Fund).
Coady, David, Margaret Grosh, and John Hoddinott, 2004, “Targeting of Transfers in Developing Countries: Review of Lessons and Experiences,” Regional and Sector Studies Series (Washington: IFPRI and World Bank).
Coady, David, and David Newhouse, 2006, “Ghana: Evaluating the fiscal and social costs of increases in domestic fuel prices,” in A. Coudouel, A. Dani, and S. Paternostro, eds., “Analyzing the distributional impacts of reforms: Operational experience in implementing poverty and social impact analysis.” (Washington: World Bank).
Deaton, A., 1989, The Analysis of Household Surveys: A Microeconometric Approach to Development Policy (Baltimore: John Hopkins University Press).
Gupta, Sanjeev, Benedict Clements, Kevin Fletcher, and Gabriela Inchauste, 2003, “Issues in Domestic Petroleum Pricing in Oil-Producing Countries,” in Jeffrey Davis, Rolando Ossowski, and Annalisa Fedelino, 2eds., Fiscal Policy Formulation and Implementation in Oil-Producing Countries. (Washington: International Monetary Fund).
Gupta, Sanjeev, Marijn Verhoeven, Robert Gillingham, Christian Schiller, Ali Mansoor, and Juan Pablo Cordoba, 2000, Equity and Efficiency in the Reform of Price Subsidies, (Washington: International Monetary Fund).
International Monetary Fund, 2005, Yemen Country Report No. 05/111, March 23, 2005 (Washington: International Monetary Fund).
Newbery, D., and N. Stern, eds.,1987, The Theory of Taxation for Developing Countries (New York: Oxford University Press).
Mati, Amine, and John Thornton, 2005, “Developments in Domestic Fuel Prices, Taxes, and Subsidies in Selected Countries,” Fiscal Affairs Department (unpublished, Washington: International Monetary Fund).