Complex Fluids with Applications to Biology 2011/2012 VIGRE RFG

Detailed CA-GREET Pathway for California Reformulated Gasoline Blendstock for
Oxygenate Blending (CARBOB) from Average Crude Refined in California
Industrial Strategies Division Release Date: December 15, 2014
Version: 3

The staff of the Air Resources Board developed this fuel pathway as part of the Low Carbon Fuel Standard regulatory process
The ARB acknowledges contributions from the Energy Commission, TIAX and Life Cycle Associates during the
development of this document
Please direct correspondence concerning this document to:
Chan Pham: [email protected] Wes Ingram: [email protected]

TABLE OF CONTENTS
TABLE OF CONTENTS ................................................................................................... i LIST OF FIGURES ........................................................................................................... ii LIST OF TABLES ............................................................................................................. ii ADDENDUM: PATHWAY CARBON INTENSITY UPDATE ............................................ 1 SUMMARY ...................................................................................................................... 3
CA-GREET Pathway: CARBOB from Average Crude Refined In California ................ 3 WTT Details-Crude Recovery ...................................................................................... 6 WTT Details-Crude Transport and Storage ................................................................. 8 WTT Details-CARBOB Transport and Storage ............................................................ 9 TTW Details-CARBOB Carbon in Fuel ...................................................................... 10
APPENDIX A ................................................................................................................. 11 Section 1. CRUDE RECOVERY ................................................................................ 12
1.1 Energy Use for Crude Recovery ...................................................................... 13 1.2 GHG Emissions from Crude Recovery ............................................................. 16
Section 2. CRUDE TRANSPORT .............................................................................. 22 2.1 Energy Use for Crude Transport ...................................................................... 23 2.2 GHG Emissions for Crude Transportation ........................................................ 24
Section 3. CRUDE REFINING ................................................................................... 28 3.1 Energy Use for Crude Refining ........................................................................ 29
Section 4. CARBOB TRANSPORT AND DISTRIBUTION ......................................... 38 4.1 Energy Use for Transport and Distribution of CARBOB ................................... 39 4.2 GHG Emissions for Transportation and Distribution of CARBOB ..................... 42
Section 5. CARBON EMISSIONS FROM CARBOB COMBUSTION ......................... 43 5.1 Combustion Emissions from Fuel ..................................................................... 44
APPENDIX B: CARBOB Input Values ........................................................................... 45 Scenario: Average Crude Oil to California refineries to make CARBOB .................... 46
Endnotes ....................................................................................................................... 48
i

LIST OF FIGURES Figure 1. Discrete Components of the Crude to CARBOB Pathway ............................... 4 Figure 2. Percent Energy and Emissions Contributions for the CARBOB Pathway ........ 6 Figure 3. Production Efficiencies for Various Fuels ....................................................... 29
LIST OF TABLES Table A-1: Carbon intensity of CARBOB refined from average California crude oil ........ 2 Discrete Components of the Crude to CARBOB Pathway .............................................. 4 Table S-1. Summary Energy and GHG Values for the CARBOB Pathway ..................... 5 Percent Energy and Emissions Contributions for the CARBOB Pathway ....................... 6 Table S-2. Total Energy use for Crude Recovery ............................................................ 7 Table S-3. Total GHG Emissions from Crude Recovery ................................................. 7 Table S-4. Energy Consumed for Crude Transport ......................................................... 8 Table S-5. Total GHG Emissions Crude Transport and Distribution ............................... 8 Table S-6. Energy Required for Crude Refining to CARBOB .......................................... 9 Table S-7. GHG Emissions from Crude Refining to CARBOB ........................................ 9 Table S-8. Energy Use for CARBOB Transportation and Distribution ........................... 10 Table S-9. GHG Emissions from Transporting and Distributing CARBOB .................... 10 Table S-10. Carbon in Fuel Calculations for CARBOB.................................................. 10 Table 1.01. Crude Oil Sources for California Refineries (barrels/year).......................... 13 Table 1.02. Details on How Efficiency is Used to Calculate Energy Consumption for
Crude Recovery .................................................................................................. 14 Table 1.03. Adjustment to Crude Recovery Energy to Account for Losses and WTT
Energy Inputs ..................................................................................................... 15 Table 1.04. Details for Formulas in Table 1.03 .............................................................. 15 Table 1.05. Global Warming Potentials for Gases ........................................................ 16 Table 1.06. CO2 Emissions by Fuel Type ...................................................................... 16 Table 1.07. Specific Fuel Shares Contributing to CO2 Emissions ................................. 17 Table 1.08. Values Used in Table 1.07 ......................................................................... 18 Table 1.09A. CO2 Emissions from Diesel ...................................................................... 19 Table 1.09B. CO2 Emissions from Natural Gas ............................................................. 20 Table 1.10. Energy Breakdown from Electricity (Feedstock Consumption) ................... 20 Table 1.11. Detailed CO2 Emissions from Feedstock Production ................................. 20 Table 1.12. CH4, N2O, VOC and CO Emissions from Crude Recovery ......................... 20 Table 1.13. Total GHG emissions from Crude Recovery .............................................. 21 Table 2.01. Crude Oil Transport Details ........................................................................ 23
ii

Table 2.02. Details of Energy Consumed for Crude Transport ...................................... 24 Table 2.03. Values for formulas in Table 2.02 ............................................................... 24 Table 2.04. Crude Transport CO2 Emissions ................................................................ 25 Table 2.05. Values of Properties Used in Table 2.04 .................................................... 26 Table 2.06. Crude Transport CH4 Emissions ................................................................ 26 Table 2.07. Total GHG Emissions Crude Transport and Distribution ............................ 27 Production Efficiencies for Various Fuels ...................................................................... 29 Table 3.01. Details on How Efficiency is Used to Calculate Energy Needs for Crude
Refining .............................................................................................................. 30 Table 3.02. Adjustment to Crude Refining to Account for Loss Factors and Other
Factors ............................................................................................................... 30 Table 3.03. Details for Entries in Table 3.02 ................................................................. 31 Table 3.04. CO2 Emissions by Fuel Type ...................................................................... 31 Table 3.05. CO2 Emissions from Residual Oil Use in Refineries from Table 3.04 ......... 32 Table 3.06. Values for use in Table 3.05 ....................................................................... 32 Table 3.07. CO2 Emissions from Natural Gas from Table 3.04 ..................................... 32 Table 3.08. Details of Values Used in Table 3.07 ......................................................... 33 Table 3.09. CO2 Emissions from Electricity from Table 3.04 ......................................... 33 Table 3.10. Type of Power Generation Plant and Associated Emission Factors ........... 33 Table 3.11. CO2 Emissions from Electricity ................................................................... 34 Table 3.12. CO2 Emissions from Non-Combustion Sources ......................................... 34 Table 3.13. CO2 Emissions from Electricity (feedstock production) ............................... 34 Table 3.14. Factors and Values for Use in Table 3.13 .................................................. 35 Table 3.15. Energy Breakdown from Electricity (Feedstock Consumption) ................... 36 Table 3.16. CO2 Emissions from Use of Refinery Still Gas ........................................... 36 Table 3.17. Values Used in Table 3.16 ......................................................................... 36 Table 3.18. CH4 Emissions Converted to CO2e ............................................................ 37 Table 3.19. N2O Emissions ........................................................................................... 37 Table 3.20. GHG Emissions from Crude Refining ......................................................... 37 Table 4.01. Energy use for Transport and Distribution via Pipeline ............................... 39 Table 4.02. Energy use for Transportation and Distribution CARBOB via HDD Truck .. 40 Table 4.03. Details of Energy Uses for CARBOB Transportation and Distribution ........ 40 Table 4.04. Values of Properties Used in Table 4.03 .................................................... 41 Table 4.05. CO2 from CARBOB Transportation and Distribution .................................. 42 Table 4.06. Details of GHG from CARBOB Transportation and Distribution ................. 42 Table 5.01. Inputs and Assumptions used for Calculating Combustion GHG Emissions
........................................................................................................................... 44
iii

ADDENDUM
PATHWAY CARBON INTENSITY UPDATE At its February 2015 hearing, the California Air Resources Board will consider re-adopting the California Low Carbon Fuel Standard (LCFS). Among the regulatory items it will be considering will be updated carbon intensity (CI) values for the LCFS Tier 2 Lookup Table fuel pathways. The CIs for those pathways must be calculated using the CA-GREET 2.0 model. Under the proposed regulation, CA-GREET 2.0 will replace CA-GREET 1.8b as the required LCFS fuel pathway direct CI model. The pathway described in this document will be among that group of Lookup Table pathways. The California Reformulated Gasoline Blendstock for Oxygenate Blending (CARBOB) pathway described in this document was originally published on February 27, 20091. This update contains the text of the original document, but appends the following updated CI information to that text. As such, the qualitative description of the fuel pathway contained in the original text remains valid and accurate. However, the quantitative, CI-related information in that original text is replaced with the information presented in the Table A-1.
1 California Air Resources Board:: “Detailed CA-GREET Pathway for California Reformulated Gasoline Blendstock for Oxygenate Blending (CARBOB) from Average Crude Refined in California” published February 29th, 2009 retrieved from: http://www.arb.ca.gov/fuels/lcfs/022709lcfs_carbob.pdf
1

Table A-1: Carbon intensity of CARBOB refined from average California crude oil
Parameter Inputs Output: Carbon
Intensity (gCO2e/MJ)
Notes Units Value
Crude Recovery Energy Btu/MMBtu 99.952
12.71
CI estimated from OPGEEa
for the year 2010b with
average U.S. electricity from
eGRIDc
Recovery Energy Efficiency 92.07% Crude Source
Domestic - Alaska 14.70%
Domestic - California 37.73% Domestic - Others 0.08%
Canada (conventional) 0.46% Canada (oil sand) 3.38%
Middle East 20.83% Latin America 18.29%
Africa 1.38% Others 3.14%
CARBOB Refining Upstream Energy
Btu/MMBtu 36,404
13.52
CA-GREET2.0 with California
average electricity from
eGRIDc
CARBOB Refining In-plant Energy
Btu/MMBtu 123,630
Refining Energy Efficiency 89% CARBOB Transport
0.41
80% by Pipeline miles 50 20% Heavy Duty Truck miles 50
CARBOB Distribution
0.6% by Pipeline miles 0 99.4% by Heavy Duty Truck miles 50
Fuel Use In-Vehicle
73.94 From ARB
Greenhouse Gas Inventoryd
CH4 and N2O from tailpipe gCO2e/MJ 1.05 Carbon in fuel gCO2e/MJ 72.89
Total Well-to-Wheels CI 100.58
a El-Houjeiri, H.M., Vafi, K., Duffy, J., McNally, S., and A.R. Brandt, Oil Production Greenhouse Gas Emissions Estimator (OPGEE) Model Version 1.1 Draft D, October 1, 2014. b Industrial Strategies Division of the California Air Resources Board. Staff Report: Initial Statement of Reasons for Proposed Rulemaking. Proposed Re-adoption of the Low Carbon Fuel Standard. December 2014. Appendix F: Estimating Carbon Intensity Values for the Crude Lookup Table. c U.S. Environmental Protection Agency, 2014. Emissions and Generation Resource Integrated Database (eGRID); Ninth Edition, Version 1.0: 2010 data. http://www.epa.gov/cleanenergy/energy-resources/egrid/. d California Air Resources Board. May 2014. California’s 2000-2012 Greenhouse Gas Emissions Inventory Technical Support Document. State of California Air Resources Board. Air Quality Planning and Science Division.. http://www.arb.ca.gov/cc/inventory/doc/methods_00-12/ghg_inventory_00-12_technical_support_document.pdf
2
SUMMARY
CA-GREET Model Pathway for CARBOB from Average Crude Refined In California
Well-To-Tank (WTT) Life Cycle Analysis of a petroleum based fuel pathway includes all steps from crude oil recovery to final finished fuel. Tank-To-Wheel (TTW) analysis includes actual combustion of fuel in a motor vehicle for motive power. WTT and TTW analysis are combined to provide a total Well-To-Wheel (WTW) analysis.
A Life Cycle Analysis Model called the Greenhouse gases, Regulated Emissions, and Energy use in Transportation (GREET)1 developed by Argonne National Laboratory and modified by TIAX during the AB 1007 process2 was used to calculate the energy use and greenhouse gas (GHG) emissions generated during the process of transforming crude to produce California Reformulated Gasoline Blendstock for Oxygenate Blending (CARBOB)3. Using this model, staff developed a pathway document for CARBOB which was made available in mid-2008 on the Low Carbon Fuel Standard (LCFS) website (http://www.arb.ca.gov/fuels/lcfs/lcfs.htm) Subsequent to this, the Argonne Model was updated in September 2008. To reflect the update and to incorporate other changes, staff contracted with Life Cycle Associates to update the CA-GREET model4. This updated California modified GREET model (version 1.8b) (released February 2009) forms the basis of this document. It has been used to calculate the energy use and greenhouse gas (GHG) emissions associated with the production and use of CARBOB.
The pathway includes crude recovery, transport, refining of crude in a typical California refinery and transport of finished product (CARBOB). For the CARBOB pathway, the TTW does not truly include combustion since CARBOB can not be used as a fuel per regulations established by the Air Resources Board. A similar analysis of an oxygenate such as ethanol is necessary to allow for combining the necessary energy and GHG contributions to provide for a total WTW analysis of California Reformulated Gasoline (CaRFG), a mixture of ethanol (3.5 wt.% oxygen) in CARBOB. ARB staff has developed a similar analysis for ethanol which is combined with this analysis to provide a WTW analysis for CaRFG, also available on the LCFS website. Figure 1 show below details the discrete components that form the CARBOB pathway, from crude recovery through final finished fuel blending component. Utilizing the energy and GHG emissions from each component, a total for the entire CARBOB pathway is then calculated.
3
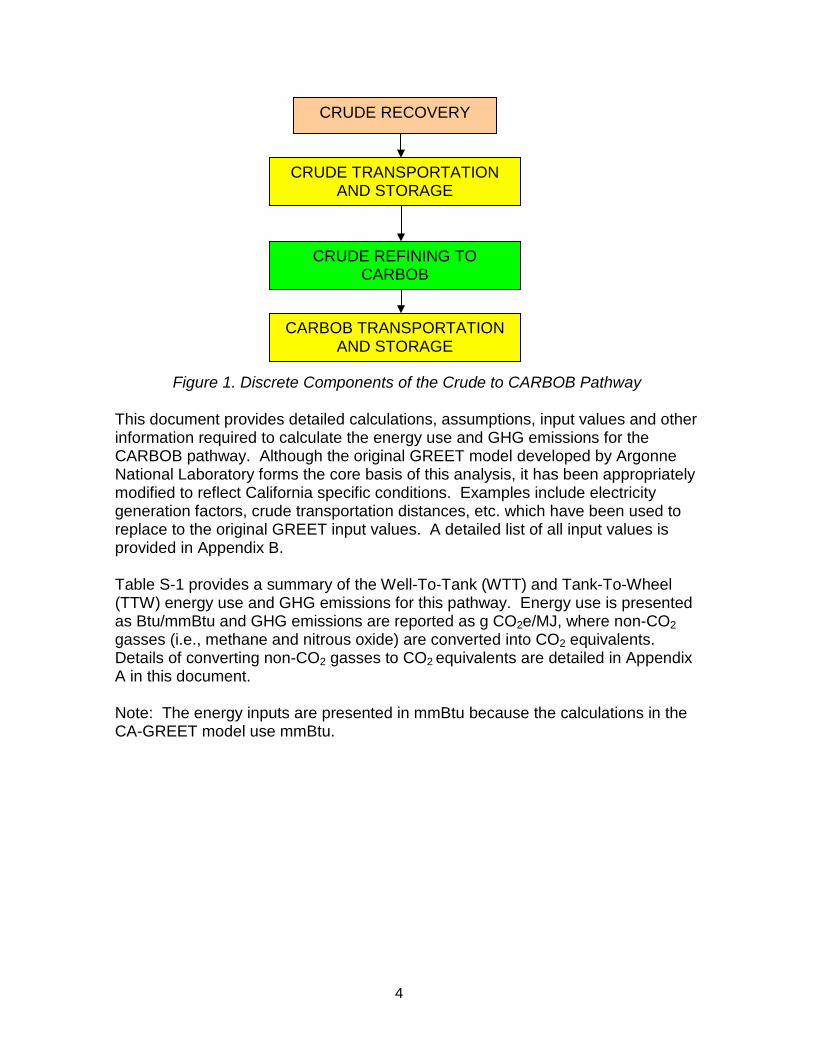
Figure 1. Discrete Components of the Crude to CARBOB Pathway
This document provides detailed calculations, assumptions, input values and other information required to calculate the energy use and GHG emissions for the CARBOB pathway. Although the original GREET model developed by Argonne National Laboratory forms the core basis of this analysis, it has been appropriately modified to reflect California specific conditions. Examples include electricity generation factors, crude transportation distances, etc. which have been used to replace to the original GREET input values. A detailed list of all input values is provided in Appendix B.
Table S-1 provides a summary of the Well-To-Tank (WTT) and Tank-To-Wheel (TTW) energy use and GHG emissions for this pathway. Energy use is presented as Btu/mmBtu and GHG emissions are reported as g CO2e/MJ, where non-CO2 gasses (i.e., methane and nitrous oxide) are converted into CO2 equivalents. Details of converting non-CO2 gasses to CO2 equivalents are detailed in Appendix A in this document. Note: The energy inputs are presented in mmBtu because the calculations in the CA-GREET model use mmBtu.
CRUDE RECOVERY
CRUDE TRANSPORTATION AND STORAGE
CRUDE REFINING TO CARBOB
CARBOB TRANSPORTATION AND STORAGE
4

Table S-1. Summary Energy and GHG Values for the CARBOB Pathway Energy
Required (Btu/mmBtu)
% Energy Contribution
Emissions (gCO2e/MJ)
% Emissions
Contribution Crude
Recovery 80,345 6.14% 6.93 7.29%
Crude Transport 16,265 1.24% 1.14 1.20%
Crude Refining (CA) 206,372 15.77% 13.72 14.43%
CARBOB Transport 5,632 0.43% 0.36 0.38%
Total (Well To Tank) 308,614 23.58% 22.04 23.19%
Total (Tank To Wheel) 1,000,000 76.42% 72.91 76.81%
Total (Well To Wheel) 1,308,614 100% 95.06* 100%
Note: percentages may not add to 100 due to rounding *Allocating tailpipe emission factors to CARBOB when used in CaRFG leads to a total of WTW emissions for CARBOB of 95.86 gCO2e/MJ. Please refer to CaRFG document for details of this calculation. From Table S-1 above, the WTW analysis of CARBOB indicates that 1,308,614 Btu of energy is required to produce 1 (one) mmBtu of available fuel energy delivered to the vehicle. From a GHG perspective, 95.06 gCO2e of GHGs are released during the production of 1 (one) MJ of CARBOB. Note that this analysis uses average crude recovery which takes into consideration crude extracted in California as well as crude recovered overseas. The transportation of crude via ocean tanker from overseas locations and pipeline from Alaska is also weighted to reflect average crude available in California.
Note that WTW values calculated in Table S-1 do not represent a true WTW since CARBOB is prohibited from being used as a fuel in a motor vehicle. Only the carbon in fuel which is transformed into CO2 is included in the WTW analysis in this document and the calculations are provided in Appendix A. A complete WTW analysis would include not only the CO2 generated from carbon in the fuel but would also account for N2O and CH4. Using a similar analysis for ethanol (used as an oxygenate), staff has provided details of a WTW analysis for CARBOB blended with ethanol fuel to make CaRFG (California Reformulated Gasoline). When tailpipe emission factors are included in the CARBOB pathway, WTW emissions are calculated to be 95.86 gCO2e/MJ details of which are included in the CaRFG pathway document.
The values in Table S-1 are illustrated in Figure 2, showing specific contributions of each of the discrete components of the fuel pathway. The charts are shown separately for energy use and GHG emissions. From an energy use viewpoint,
5

energy in fuel (76.42%) and crude refining (15.77%) components dominate the WTW energy use. From a GHG perspective, carbon in fuel (76.81%), crude refining (14.43%), and crude recovery (7.29%) components dominate the GHG emissions for this pathway.
Figure 2. Percent Energy and Emissions Contributions for the CARBOB Pathway
WTT Details-Crude Recovery
% WTW Energy Contributions
Total Tank To Wheel 76.42% Crude Recovery
6.14%
Crude Transport 1.24%
Crude Refining 15.77%CARBOB Transport
0.43%
% WTW GHG Contributions
CARBOB Transport 0.38%
Crude Refining 14.43%
Crude Transport 1.20%
Crude Recovery 7.29%
Total Tank To Wheel 76.81%
6
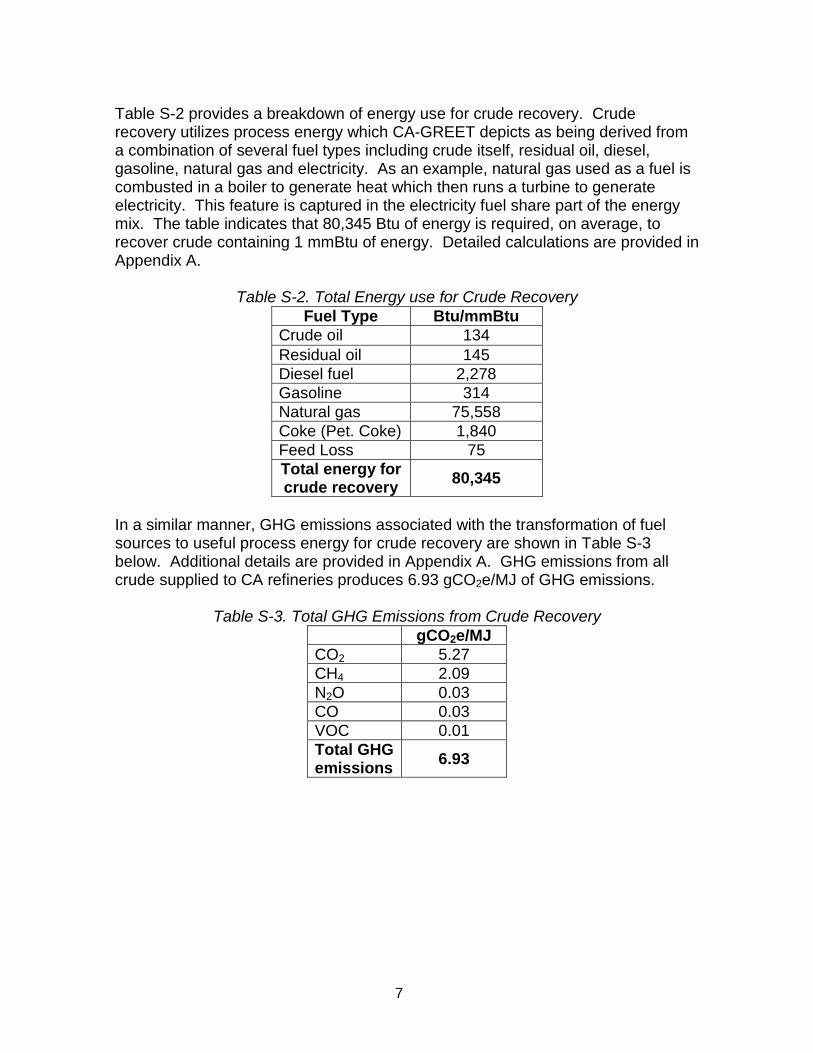
Table S-2 provides a breakdown of energy use for crude recovery. Crude recovery utilizes process energy which CA-GREET depicts as being derived from a combination of several fuel types including crude itself, residual oil, diesel, gasoline, natural gas and electricity. As an example, natural gas used as a fuel is combusted in a boiler to generate heat which then runs a turbine to generate electricity. This feature is captured in the electricity fuel share part of the energy mix. The table indicates that 80,345 Btu of energy is required, on average, to recover crude containing 1 mmBtu of energy. Detailed calculations are provided in Appendix A.
Table S-2. Total Energy use for Crude Recovery
Fuel Type Btu/mmBtu Crude oil 134 Residual oil 145 Diesel fuel 2,278 Gasoline 314 Natural gas 75,558 Coke (Pet. Coke) 1,840 Feed Loss 75 Total energy for crude recovery 80,345
In a similar manner, GHG emissions associated with the transformation of fuel sources to useful process energy for crude recovery are shown in Table S-3 below. Additional details are provided in Appendix A. GHG emissions from all crude supplied to CA refineries produces 6.93 gCO2e/MJ of GHG emissions.
Table S-3. Total GHG Emissions from Crude Recovery gCO2e/MJ CO2 5.27 CH4 2.09 N2O 0.03 CO 0.03 VOC 0.01 Total GHG emissions 6.93
7

WTT Details-Crude Transport and Storage
Table S-4 shows the energy necessary for transporting crude via ocean tanker and pipeline to California refineries. The proportional split between these two modes of transport is calculated from the average crude mix arriving in California, both from within the state as well as from overseas. Detailed breakdown of proportions utilized in the calculations are provided in Appendix A. A small energy loss attributable to feed losses is also captured in this analysis. As shown in Table S-4, crude transport utilizes an average of 16,265 Btu of energy for every 1 mmBtu of crude transported.
Table S-4. Energy Consumed for Crude Transport Btu/mmBtu
Feed Loss 62 Ocean Tanker 7,104
Pipeline 9,073 Barge 88
Total Crude Recovery 16,265
Table S-5 captures GHG emissions from crude transport in ocean tankers and pipelines. The fuel consumption and other specifics necessary for this calculation are detailed in the Appendix A. Crude transport by the two types of transport weighted proportionally generates 1.14 gCO2e GHG emissions for every 1 MJ of crude transported.
Table S-5. Total GHG Emissions Crude Transport and Distribution
GHG g CO2e/MJ CO2 1.07 CH4 0.04 N2O 0.01 CO 0.00
VOC 0.00 Total GHG emissions 1.14
WTT Details-Crude Refining Table S-6 provides energy source mix used in refining of California average crude mix to CARBOB. This is similar to the energy mix analysis presented in crude recovery earlier. As can be seen in the Table below, 206,372 Btu of energy is required to produce 1 mmBtu of finished CARBOB. Again here, each source of fuel has associated GHG emissions in its transformation into useful energy and these are shown in Table S-7 below. The refining process generates 13.72 grams of CO2e per MJ of finished fuel. Details of all the calculations are presented in Appendix A.
8

Table S-6. Energy Required for Crude Refining to CARBOB
Fuel Type Btu/mmBtu Residual Oil 6,421 Natural Gas 58,841 Pet. Coke 24,321 Electricity 16,682
Refinery still gas 100,107 Total energy for
refining 206,372
Table S-7. GHG Emissions from Crude Refining to CARBOB
GHG g CO2e/MJ CO2 11.94 CH4 (combustion) 0.30 N2O 0.04 CO 0.01 VOC 0.00 VOC, CO and CO2 from non-combustion sources 1.40
Total 13.72 WTT Details-CARBOB Transport and Storage Table S-8 provides a summary of the energy used to transport finished CARBOB via pipeline and Heavy Duty Diesel (HDD) truck from refineries to a blending station. From Table S-8, this component of the pathway utilizes 5,632 Btu of energy for every 1 mmBtu of CARBOB transported. The transportation through pipeline and HDD truck generates GHG emissions which are shown in Table S-9 below. A total of 0.36 gCO2e GHG emissions are generated for every 1 MJ of CARBOB transported.
9

Table S-8. Energy Use for CARBOB Transportation and Distribution Transport mode Btu/mmBtu
Feed Loss 813 CARBOB transported by pipeline 642
CARBOB Transport by HDD truck 699
CARBOB Distribution by HDD truck 3477
Total 5,632 Table S-9. GHG Emissions from Transporting and Distributing CARBOB
GHGs
Total (gCO2e/MJ)
CO2 0.34 CH4 (converted to CO2e) <0.01 N2O (converted to CO2e) <0.01 CO (converted to CO2) <0.01 VOC (converted to CO2) <0.01
Total GHGs 0.36 TTW Details-CARBOB Carbon in Fuel Since CARBOB cannot be used as a fuel per Air Resources Board regulations (no oxygenate in CARBOB), actual TTW calculations cannot be made for CARBOB to account for CO2, CH4, CO, N2O and VOC emissions. Table S-10 below provides a summary of the carbon in fuel calculations, details of which are provided in Appendix A. The carbon content of CARBOB generates 72.91 gCO2e/MJ, which, in effect, represents perfect combustion of the carbon in CARBOB to CO2 and water.
Table S-10. Carbon in Fuel Calculations for CARBOB CO2 from fuel = Density * carbon ratio in gasoline/(C factor * Lower Heating Value) = 72.91 g CO2/MJ
10

APPENDIX A
11

Section 1. CRUDE RECOVERY
12
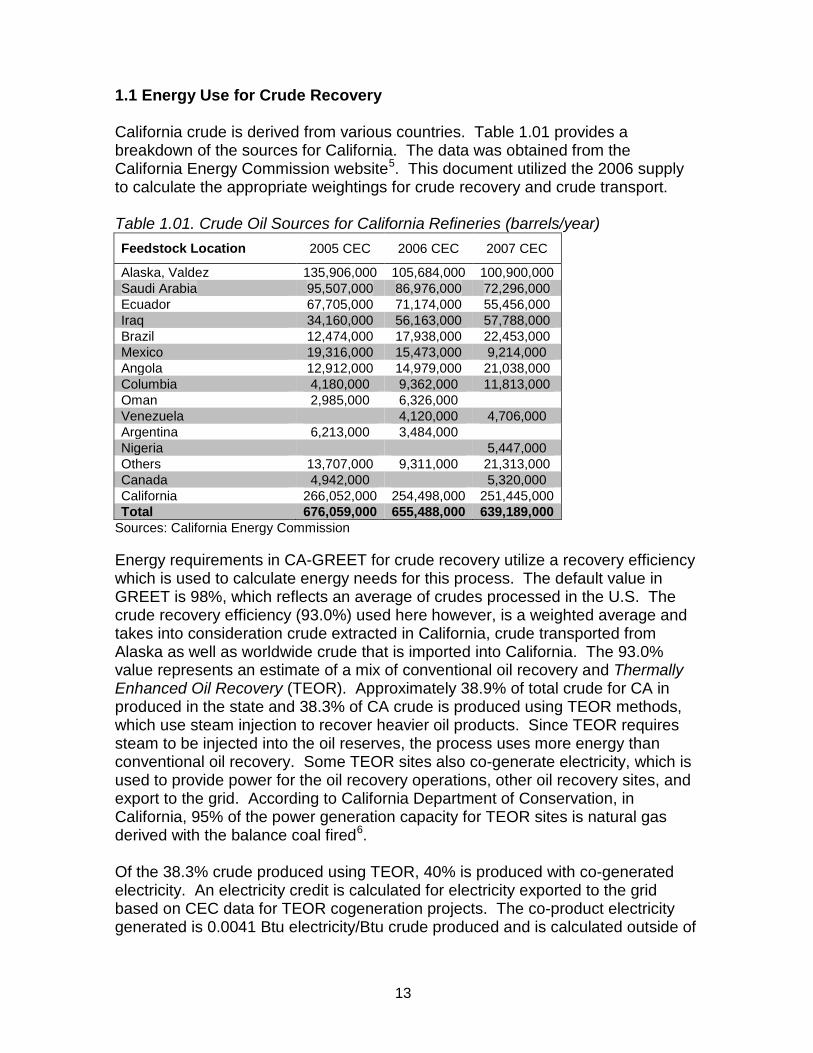
1.1 Energy Use for Crude Recovery California crude is derived from various countries. Table 1.01 provides a breakdown of the sources for California. The data was obtained from the California Energy Commission website5. This document utilized the 2006 supply to calculate the appropriate weightings for crude recovery and crude transport. Table 1.01. Crude Oil Sources for California Refineries (barrels/year) Feedstock Location 2005 CEC 2006 CEC 2007 CEC
Alaska, Valdez 135,906,000 105,684,000 100,900,000 Saudi Arabia 95,507,000 86,976,000 72,296,000 Ecuador 67,705,000 71,174,000 55,456,000 Iraq 34,160,000 56,163,000 57,788,000 Brazil 12,474,000 17,938,000 22,453,000 Mexico 19,316,000 15,473,000 9,214,000 Angola 12,912,000 14,979,000 21,038,000 Columbia 4,180,000 9,362,000 11,813,000 Oman 2,985,000 6,326,000 Venezuela 4,120,000 4,706,000 Argentina 6,213,000 3,484,000 Nigeria 5,447,000 Others 13,707,000 9,311,000 21,313,000 Canada 4,942,000 5,320,000 California 266,052,000 254,498,000 251,445,000 Total 676,059,000 655,488,000 639,189,000
Sources: California Energy Commission Energy requirements in CA-GREET for crude recovery utilize a recovery efficiency which is used to calculate energy needs for this process. The default value in GREET is 98%, which reflects an average of crudes processed in the U.S. The crude recovery efficiency (93.0%) used here however, is a weighted average and takes into consideration crude extracted in California, crude transported from Alaska as well as worldwide crude that is imported into California. The 93.0% value represents an estimate of a mix of conventional oil recovery and Thermally Enhanced Oil Recovery (TEOR). Approximately 38.9% of total crude for CA in produced in the state and 38.3% of CA crude is produced using TEOR methods, which use steam injection to recover heavier oil products. Since TEOR requires steam to be injected into the oil reserves, the process uses more energy than conventional oil recovery. Some TEOR sites also co-generate electricity, which is used to provide power for the oil recovery operations, other oil recovery sites, and export to the grid. According to California Department of Conservation, in California, 95% of the power generation capacity for TEOR sites is natural gas derived with the balance coal fired6.
Of the 38.3% crude produced using TEOR, 40% is produced with co-generated electricity. An electricity credit is calculated for electricity exported to the grid based on CEC data for TEOR cogeneration projects. The co-product electricity generated is 0.0041 Btu electricity/Btu crude produced and is calculated outside of
13

CA-GREET based on CA crude data. The credit is based on the net electricity export after the input electricity has been subtracted. Table 1.02 shows details of the types and proportion of various fuels used in crude recovery. The values in Table 1.02 are adjusted to account for the WTT energy used to produce each fuel. Table 1.03 depicts the adjustments to the values from the table above for each fuel type, accounting for loss factors associated with the WTT energy for each fuel used during crude recovery operations. Table 1.04 provides values and descriptions for the equations used in Table 1.03.
Table 1.02. Details on How Efficiency is Used to Calculate Energy Consumption for Crude Recovery
Fuel Type Fuel Shares
Relationship of Recovery Efficiency (0.93) and Fuel
Shares
Direct Energy
(Btu/mmBtu) Crude oil 0.2% (106)(1/0.93 – 1)(0.002) = 124 124
Residual oil 0.2% (106)(1/0.93 – 1) (0.002) = 124 124 Diesel fuel 2.5% (106)(1/0.93 – 1) (0.086) = 1,867 1,867 Gasoline 0.3% (106)(1/0.93 – 1)(0.011) = 249 249
Natural gas 94.3% (106)(1/0.93 – 1)(0.943) = 70,595 70,595 Coal and Pet. Coke 2.4% (106)(1/0.93 – 1)(0.0024) = 1,803 1,803
Electricity 0% (106)(1/0.93 – 1)(0) = 0 0 Feed Loss 0.1% (106)(1/0.93 – 1)(0.001) = 75 75
Natural Gas Flared Weighted average for worldwide
crude for CA refineries 13,107 *Additional 4,314 Btu/mmBtu credit for electricity co-produced is applied to average petroleum.
14

Table 1.03. Adjustment to Crude Recovery Energy to Account for Losses and WTT Energy Inputs
Fuel Type Formula Btu/mmBtu Crude oil 124 (1 + A/106) 134 Residual oil 124 (1 + (B*D+ C)/ 106) 145 Diesel fuel 1867 (1 + (B*F + E)/ 106) 2,278 Gasoline 249 (1 + (B*H + G)/ 106) 314 Natural gas 70,595 (1 + I/106) 75,558 Coke (Pet. Coke) 1,803 (1+J/106) 1,840 Electricity 0 (K + L)/ 106 0 Feed Loss 75 75
Total WTT energy for crude recovery 80,345 Table 1.04. Details for Formulas in Table 1.03
Quantity Description
A = 80,345
WTT energy in Btu for crude recovery at the oil field. This value calculated as the total WTT energy for crude recovery in Table 1.02 above. It is also an input the total WTT energy calculation This is one instance of a “recursive” calculation in CA-GREET.
B = 91,815 WTT energy of crude in Btu consumed to recover one million Btu as feedstock used in US refineries. This is a CA-GREET calculation that includes losses and delivery to the oil refinery.
C = 77,138 WTT energy in Btu required to produce 1 million Btu of residual oil. This is calculated from the WTT analysis of residual oil similar to the CARBOB calculations being detailed in this document.
D = 1.0000 Loss factor for Residual Oil which is a CA-GREET default value.
E = 128,548
WTT energy required in Btu to produce one million Btu of diesel. This value is calculated from the WTT analysis of diesel from CA-GREET similar to the CARBOB calculations being detailed in this document.
F = 1.0000 Loss factor1 for diesel fuel which is default CA-GREET value.
G = 169,132 WTT energy in Btu to produce one million Btu of gasoline. This value is calculated from the WTT analysis of gasoline from CA-GREET similar to the CARBOB calculations being detailed in this document.
H = 1.00008 Loss factor1 for gasoline which is default CA-GREET value.
I = 70,299 WTT energy in Btu used to produce natural gas as stationary fuel. This is a CA-GREET calculated value.
J = 20,961 WTT energy in Btu used to produce coal as stationary fuel. This is a CA-GREET calculated value.
K = 2,793,243 Total energy required in Btu to produce one million Btu of electricity. This is derived from the electricity analysis by CA-GREET.
L = 192,311 Total energy required Btu to produce one million Btu of electricity feedstock. This is derived from the electricity analysis by CA-GREET.
1Loss factors for petroleum fuels include refueling spillage plus evaporative losses from vehicle fueling and fuel transfer operations.
15

1.2 GHG Emissions from Crude Recovery For all greenhouse gas (GHG) emissions, CA-GREET accounts for only three GHGs: CO2, CH4 and N2O. For CO and VOCs, the model calculates the CO2 when these components are oxidized in the atmosphere. The Global Warming Potentials (GWP) for all gases are default CA-GREET values and listed in Table 1.05. Information on VOC and CO conversion calculations is provided as a note below. Table 1.05. Global Warming Potentials for Gases (CA-GREET Default per IPCC7)
Species GWP (relative to CO2) CO2 1 CH4 25 N2O 298
Note: values from mmBtu to MJ have been calculated using 1 mmBtu = (1/1055) MJ Carbon ratio of VOC = 0.85which is converted to gCO2e/MJ = grams VOC*(0.85 gC/gVOC)*(44 gCO2/12 g C). Carbon ratio of CO = 0.43 which is converted to gCO2e/MJ = grams CO*(0.43 gC/gCO)*(44 gCO2/12 g C) The transformation of various fuel types into energy generates emissions, specific to each type of fuel and the equipment used in the transformation. An example is natural gas being combusted to generate electricity in turbines. Table 1.06 details only CO2 emissions for each fuel type used in crude recovery. CH4, N2O, VOC and CO contributions to total GHG emissions are detailed later in this section. Additional details for each specific fuel type are provided in sections to follow. The table provides GHG values both in g CO2/mmBtu and g CO2/MJ. As an example, the use of diesel fuel in crude recovery generates 0.61 g CO2/MJ. Table 1.06. CO2 Emissions by Fuel Type (does not include other GHGs).
Fuel Type g CO2/mmBtu g CO2/MJ Crude oil 10 0.01 Residual oil 12 0.01 Diesel fuel 174 0.17 Gasoline 17 0.02 Natural Gas 4,413 4.18 Coke (Pet. Coke) 176 0.17 Electricity 0 0 Natural Gas (flared) 761 0.72
Total 5,564 5.27 Table 1.07 utilizes the energy use by fuel type from Table 1.02 and calculates GHG emissions utilizing emission factors which are provided in Table 1.08. The CO2 emission factors represent the carbon in fuel minus carbon emissions associated with VOC and CO emissions. Thus, the emission factor is different among equipment types such as engines and turbines. The carbon in fuel factors
16

are CA-GREET default values, except for natural gas, which is slightly different based on the AB 10072 analysis. However, the calculations in the fuel cycle reflect the estimated direct emissions of CO2 from the different equipment types excluding the carbon in VOC and CO. Note that energy use is used from Table 1.02 of this document (as an example, the value 124 is from Table 1.02 for crude oil). Table 1.08 essentially provides details on how CO2 emissions were calculated and provided in Table 1.07. Table 1.07. Specific Fuel Shares Contributing to CO2 Emissions (see Table 1.06)
Fuel Calculations CO2 emissions (g CO2/mmBtu)
Crude Oil 124 *(crude oil emissions factor + total CO2 emissions from crude recovery)/ 106 10
Residual Oil
124 *(Fraction of residual oil consumed in a commercial boiler*emissions factor of a commercial boiler + emissions from crude*loss factor for emissions from crude + total emissions from residual oil)/ 106
12
Diesel fuel
1,867*(percentage from diesel boiler*emission factor for diesel boiler + percentage from stationary diesel engine*emissions factor for diesel engine + percentage from stationary diesel turbine*emission factor of diesel turbine + emissions from crude*loss factor + total emissions from diesel)/ 106 (see Table 1.08A for further details)
174
Gasoline 249*(emissions factor of reciprocating engine + crude emissions* loss factor + emissions from conventional gasoline)/ 106
17
Natural Gas
70,595*(percentage of natural gas used in an engine*emissions factor for natural gas engine + percentage of natural gas used in a small industrial boiler*emissions factor for small industrial boiler + emissions from natural gas as a stationary fuel)/106 (see Table 1.08B for further details)
4,413
Coal (Pet. Coke)
1803*(emission factor for coal boiler + WTT emissions for coal) 176
Electricity 0*(emissions from producing feedstock + emissions from consuming feedstock)/106 0
Natural Gas (flared) 13,107*(emissions factor for natural gas flaring)/106 761
17
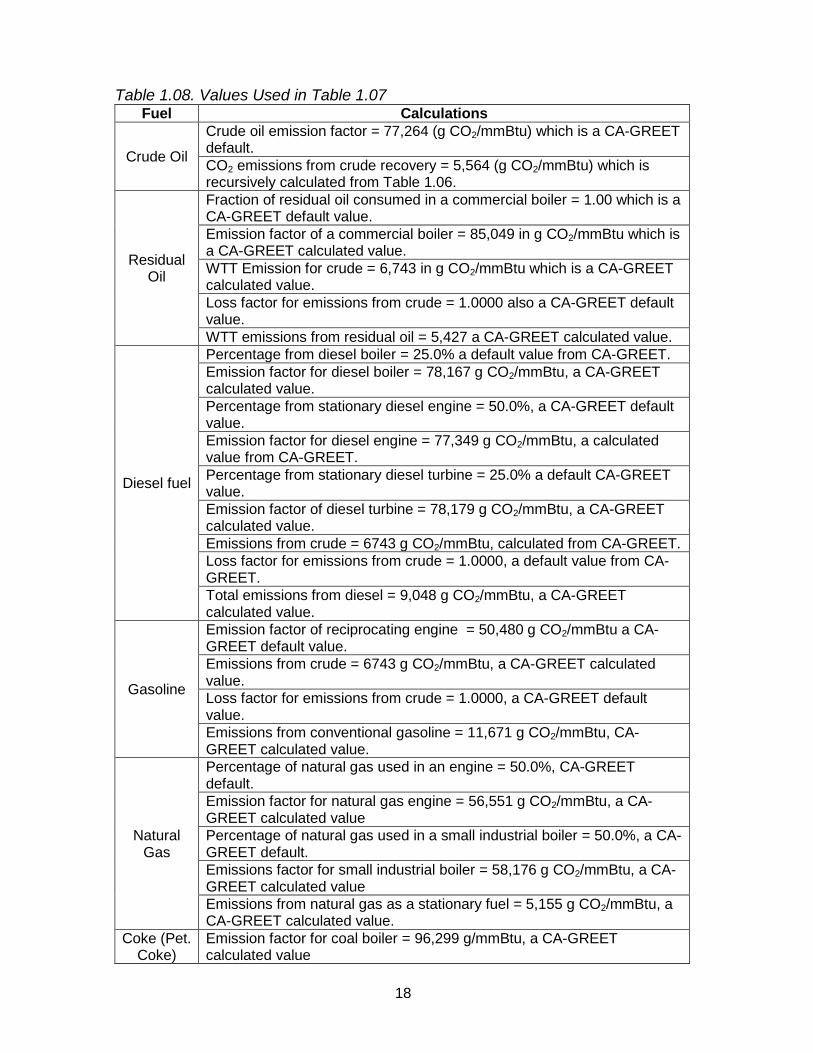
Table 1.08. Values Used in Table 1.07 Fuel Calculations
Crude Oil
Crude oil emission factor = 77,264 (g CO2/mmBtu) which is a CA-GREET default. CO2 emissions from crude recovery = 5,564 (g CO2/mmBtu) which is recursively calculated from Table 1.06.
Residual Oil
Fraction of residual oil consumed in a commercial boiler = 1.00 which is a CA-GREET default value. Emission factor of a commercial boiler = 85,049 in g CO2/mmBtu which is a CA-GREET calculated value. WTT Emission for crude = 6,743 in g CO2/mmBtu which is a CA-GREET calculated value. Loss factor for emissions from crude = 1.0000 also a CA-GREET default value. WTT emissions from residual oil = 5,427 a CA-GREET calculated value.
Diesel fuel
Percentage from diesel boiler = 25.0% a default value from CA-GREET. Emission factor for diesel boiler = 78,167 g CO2/mmBtu, a CA-GREET calculated value. Percentage from stationary diesel engine = 50.0%, a CA-GREET default value. Emission factor for diesel engine = 77,349 g CO2/mmBtu, a calculated value from CA-GREET. Percentage from stationary diesel turbine = 25.0% a default CA-GREET value. Emission factor of diesel turbine = 78,179 g CO2/mmBtu, a CA-GREET calculated value. Emissions from crude = 6743 g CO2/mmBtu, calculated from CA-GREET. Loss factor for emissions from crude = 1.0000, a default value from CA-GREET. Total emissions from diesel = 9,048 g CO2/mmBtu, a CA-GREET calculated value.
Gasoline
Emission factor of reciprocating engine = 50,480 g CO2/mmBtu a CA-GREET default value. Emissions from crude = 6743 g CO2/mmBtu, a CA-GREET calculated value. Loss factor for emissions from crude = 1.0000, a CA-GREET default value. Emissions from conventional gasoline = 11,671 g CO2/mmBtu, CA-GREET calculated value.
Natural Gas
Percentage of natural gas used in an engine = 50.0%, CA-GREET default. Emission factor for natural gas engine = 56,551 g CO2/mmBtu, a CA-GREET calculated value Percentage of natural gas used in a small industrial boiler = 50.0%, a CA-GREET default. Emissions factor for small industrial boiler = 58,176 g CO2/mmBtu, a CA-GREET calculated value Emissions from natural gas as a stationary fuel = 5,155 g CO2/mmBtu, a CA-GREET calculated value.
Coke (Pet. Coke)
Emission factor for coal boiler = 96,299 g/mmBtu, a CA-GREET calculated value
18

Emissions from natural gas a processing fuel = 1,505 g/mmBtu
Electricity
Emissions from producing feedstock = 14,305 g CO2/mmBtu, a CA-GREET calculated value from electricity pathway. Emissions from consuming feedstock = 162,627 g CO2/mmBtu, a CA-GREET calculated from electricity pathway.
Natural Gas
(flared)
Emissions factor for natural gas flaring =58,048 g CO2/mmBtu, a CA-GREET default value.
Tables 1.09A and 1.09B provide additional details on emissions resulting from use of diesel, natural gas and electricity generation. CO2 emissions from crude oil, residual oil, and gasoline combustion cannot be further broken down according to equipment type because they are used in only one equipment type: industrial boilers (crude oil and residual oil) and reciprocating engines (gasoline). The values from crude oil, residual oil, and gasoline combustion are provided by the emission factors for these fuels as detailed in Tables 1.07 and 1.08. In Tables 1.09A and 1.09B, details for CO2 emissions are provided for diesel and natural gas used as a fuel in crude recovery operations. All values in Tables 1.09A and 1.09B are CA-GREET default values and subsequent CA-GREET calculated values. Note that Tables 1.09A and 1.09B detail how values reported in Table 1.07 for diesel and natural gas are calculated. Table 1.09A. CO2 Emissions from Diesel
Equipment Type Equipment Shares
Emissions Factor
(g/mmBtu) g
CO2/mmBtu
Commercial Boiler 25% 78,167 36
Stationary Reciprocating Engine
50% 77,349 72
Turbine 25% 78,179 36 Crude Oil and Diesel Production 29
Total 174
19

Table 1.09B. CO2 Emissions from Natural Gas
Equipment Type Equipment Shares
Emissions Factor
g CO2/mmBtu
Stationary Reciprocating Engine
50% 56,551 1,996
Small Industrial Boiler 50% 58,176 2,053
As Stationary Fuel 5,349 364
Total 4,413 Tables 1.10 through 1.13 are detail CO2 emissions from electricity generation. The emissions factor is CA-GREET calculations. For electricity, it is broken down into emissions from feedstock production (recovering feedstock such as coal from mines and transporting to a facility) and feedstock consumption (actual use in a boiler). Table 1.10 details the net and individual equipment generation efficiencies and upstream energy for natural gas based electricity. Table 1.10. Energy Breakdown from Electricity (Feedstock Consumption)
Fuel Conv. Efficiency
Generation Mix
Relationship of Conversion Efficiency and
Energy Use
Energy Use
(Btu/mmBtu)
Description
Nat. Gas 39.0% 100% (106/0.394)*(1/
1-0.081) 2,793,243
Energy used as natural gas (Btu/mmBtu), a CA-GREET calculation
Table 1.11 summarizes upstream CO2 emissions from feedstock production related to electricity Table 1.11. Detailed CO2 Emissions from Feedstock Production
Feedstock Calculation g CO2/mmBtu Natural Gas 9,971*(2,793,243*5,084)/106)/106 142
Where 9,971 Btu/mmBtu is the electricity input, 2,793,243 Btu/mmBtu is the fuel cycle electricity energy and 5,084 g-CO2/mmBtu electricity is the fuel cycle CO2 emissions for natural gas destined for electricity production. Table 1.12 provides details on CH4, N2O, VOC and CO emissions generated during the combustion of the different fuels listed in these tables. These values are calculated from default CA-GREET values for sources that are used in crude recovery. Table 1.12. CH4, N2O, VOC and CO Emissions from Crude Recovery
20

Fuel Type (g /mmBtu) CH4 N2O VOC CO
Crude oil 0.003 0.000 0.000 0.005 Residual oil 0.014 0.000 0.001 0.005 Diesel fuel 0.220 0.003 0.097 0.398 Gasoline 0.053 0.001 0.449 3.262 Natural gas 22.158 0.069 1.981 13.914 Electricity 0.000 0.000 0.000 0.000 Natural gas (flared) 0.642 0.014 0.033 0.341
Total (without non-combustion)
23.090 0.088 2.561 17.925
Non-combustion 11.0 0.702
Vented 54.2 Total 88.29 0.088 3.263 17.925
Table 1.13 summarizes the total GHG emissions for crude recovery. The total is calculated as g CO2e where non-CO2 GHG gasses have been converted to CO2 equivalents using their GWP detailed earlier. It also shows how CA-GREET account for CO and VOC emissions in its calculation of pathway GHG emissions. The electricity emission credit is equal the net electricity export in J/J crude multiplied by the fuel cycle GHG emissions associated with 100% NG (124.1 g/MJ): (-0.0041 J net electricity/J crude)*(124.10 gCO2/MJ) = -0.51 gCO2/MJ. Note: 124.10 gCO2/MJ is the pathway carbon intensity for average CA electricity. Please refer to the “Electricity” pathway document for details on this value. Table 1.13. Total GHG emissions from Crude Recovery (g/mmBtu) Formula gCO2e/mmBtu gCO2e/MJ CO2 5,564 5,564*1 5,564 5.27 CH4 88.290 88,290*25 2207.253 2.09 N2O 0.088 0.088*298 26.095 0.03 CO 17.925 17.925*0.43*(44/12) 28.168 0.03 VOC 3.263 3.263*0.85*(44/12) 10.169 0.01 Total GHG emissions 7,836 7.43 Electricity Co-Product Credit -0.51 Total GHG emissions 6.93
21

Section 2. CRUDE TRANSPORT
22

2.1 Energy Use for Crude Transport
Crude transportation energy use is based on the weighted mix for crude recovery (average CA crude) and the corresponding transport mode. Table 2.01 provides details on the various modes of transport for crude used in CA refineries. The electricity mix is assumed to be 100% NG-based. The transport distances have been calculated to be 442 miles via pipeline, 7,063 miles via oil tanker, and 200 miles via barge.
Table 2.01. Crude Oil Transport Details
Transport distance for imported foreign oil is based on California Energy Commission’s summary of Energy Information Agency data for crude oil sources combined with transport distances determined from the shipping’s8 on-line calculator. The average pipeline and ocean tanker distances and average barge share were calculated using the weighted consumption data in Table 2.01 and shown below:
• Average Pipeline Distance: 442 mi = (870*16.1%) + (200*38.9%) + (498*45.0%)
• Average Ocean Tanker Distance: 7,063 mi = [(1,974*16.1%) + (8,884*45.0%)]/(16.1% + 45.0%)
• Average Barge Distance: 200 mi = (38.9%*5.0%*200)/(38.9%*5%) Average Barge Average Share: 1.9% = (38.9%)*(5.0%)
Note: The average barge share must be calculated separately and input into CA-GREET as one number because GREET only has one input for barge share. The three modes of transport are utilized to transport crude to California refineries.
Crude Pipeline Ocean Tanker Crude Supply
(2005) Mix Dest. Source Share
Distance (miles) Dest. Source
Share Distance (miles)
Alaska 16.1% Valdez 100% 870 SF 100% 1,974 Domestic 38.9% Refineries 100% 200 - -
Foreign 45.0% Weighted Calc.
100% 498 Weighted Calc. 100% 8,884
Annual Total Weighted Average
442 Weighted Average 7,063
Barge Crude Supply
(2005) Destination Source Share Distance (miles)
Alaska Domestic CA 5.0% 200 Foreign
Annual Total Weighted Average 1.9% 200
23
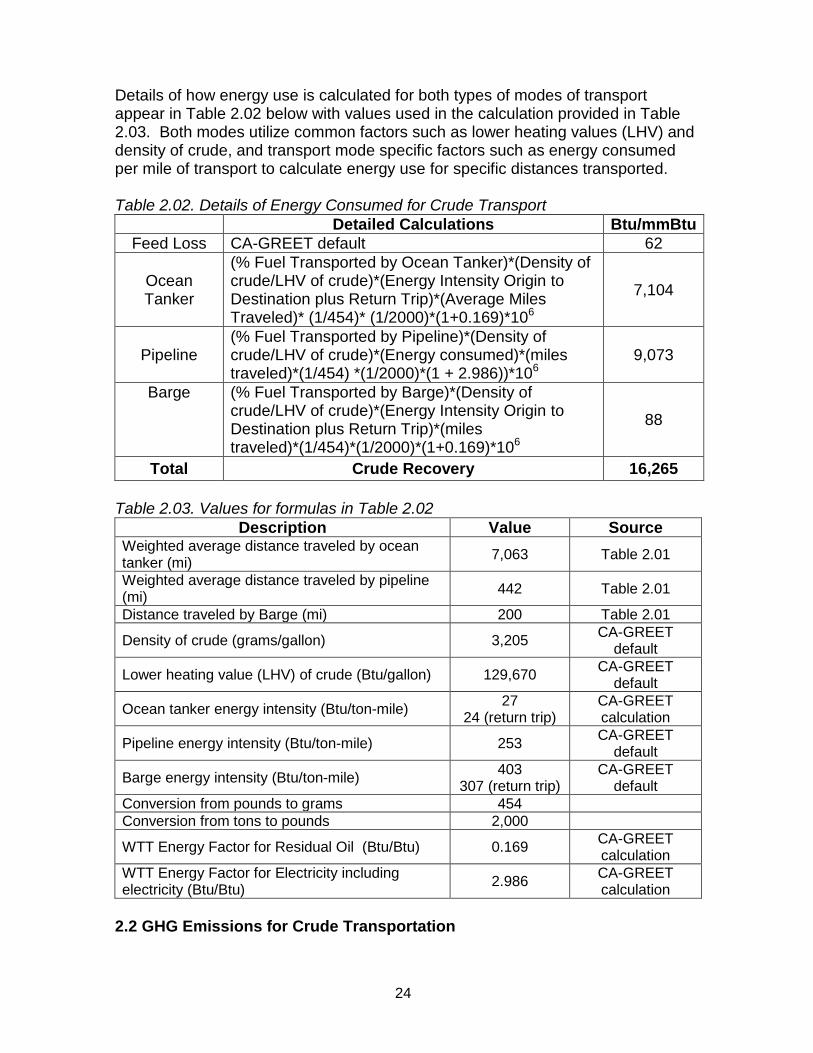
Details of how energy use is calculated for both types of modes of transport appear in Table 2.02 below with values used in the calculation provided in Table 2.03. Both modes utilize common factors such as lower heating values (LHV) and density of crude, and transport mode specific factors such as energy consumed per mile of transport to calculate energy use for specific distances transported. Table 2.02. Details of Energy Consumed for Crude Transport
Detailed Calculations Btu/mmBtu Feed Loss CA-GREET default 62
Ocean Tanker
(% Fuel Transported by Ocean Tanker)*(Density of crude/LHV of crude)*(Energy Intensity Origin to Destination plus Return Trip)*(Average Miles Traveled)* (1/454)* (1/2000)*(1+0.169)*106
7,104
Pipeline (% Fuel Transported by Pipeline)*(Density of crude/LHV of crude)*(Energy consumed)*(miles traveled)*(1/454) *(1/2000)*(1 + 2.986))*106
9,073
Barge (% Fuel Transported by Barge)*(Density of crude/LHV of crude)*(Energy Intensity Origin to Destination plus Return Trip)*(miles traveled)*(1/454)*(1/2000)*(1+0.169)*106
88
Total Crude Recovery 16,265 Table 2.03. Values for formulas in Table 2.02
Description Value Source Weighted average distance traveled by ocean tanker (mi) 7,063 Table 2.01
Weighted average distance traveled by pipeline (mi) 442 Table 2.01
Distance traveled by Barge (mi) 200 Table 2.01
Density of crude (grams/gallon) 3,205 CA-GREET default
Lower heating value (LHV) of crude (Btu/gallon) 129,670 CA-GREET default
Ocean tanker energy intensity (Btu/ton-mile) 27 24 (return trip)
CA-GREET calculation
Pipeline energy intensity (Btu/ton-mile) 253 CA-GREET default
Barge energy intensity (Btu/ton-mile) 403 307 (return trip)
CA-GREET default
Conversion from pounds to grams 454 Conversion from tons to pounds 2,000
WTT Energy Factor for Residual Oil (Btu/Btu) 0.169 CA-GREET calculation
WTT Energy Factor for Electricity including electricity (Btu/Btu) 2.986 CA-GREET
calculation 2.2 GHG Emissions for Crude Transportation
24

Table 2.04 details CO2 emissions related to crude transport and distribution. These calculations assume 7,063 miles for ocean tankers and 442 miles for pipelines, as detailed in section 2.1. Table 2.05 provides values for various terms used in Table 2.04. Table 2.04. Crude Transport CO2 Emissions
Mode Formula gCO2/mmBtu gCO2/MJ
Ocean Tanker
(Density of crude/LHV of crude)*(miles traveled) *(1/454)*(1/2000)*((Energy intensity on trip from origin to destination*(emission factor for residual oil+ WTT CO2 for residual oil)) + (Energy intensity on return trip* (emission factor for bunker fuel + emission factor for residual oil))
586 0.56
Pipeline (Density of crude/LHV of crude)*(Energy intensity of pipeline)*(miles traveled)*(1/454)*(1/2000) *(WTT emissions for electricity)
538 0.51
Barge
(Density of crude/LHV of crude)*(miles traveled) *(1/454)*(1/2000)*((Energy intensity on trip from origin to destination*(emission factor for residual oil + WTT residual oil CO2)) + (Energy intensity on return trip*(emission factor for residual oil + WTT residual oil CO2))
7 0.01
Total 1,131 1.07
25

Table 2.05. Values of Properties Used in Table 2.04 Parameters Values Sources
Miles traveled by Ocean Tanker (miles) 7,063 Table 2.01 Pipeline transport (miles) 442 Table 2.01 Density of crude (grams/gallon) 3,205 CA-GREET default Lower heating value (LHV) of crude (Btu/gallon) 129,670 CA-GREET default
Energy intensity of Ocean Tanker on trip to destination (Btu/ton-mile) 27 CA-GREET default
Energy intensity of Ocean Tanker on return trip (Btu/ton-mile) 24 CA-GREET default
Energy intensity of Pipeline (Btu/ton-mile) 253 CA-GREET default
Energy intensity of Barge on trip to destination (Btu/ton-mile) 403 CA-GREET default
Energy intensity of Barge on trip to destination (Btu/ton-mile) 307 CA-GREET default
Conversion from pounds to grams 454 Conversion from tons to pounds 2,000 Conversion from MJ to mmBtu 1055 CO2 EF for residual oil in barge (g/mmBtu fuel burned)
84,515 (both trips) CA-GREET default
WTT electricity CO2 emissions (g/mmBtu) 176,891 CA-GREET
calculated WTT Emission factor for Residual Oil (g/mmBtu) 11,920 CA-GREET default
Table 2.06 details CH4 emissions for crude transport and distribution utilizing ocean tanker and pipeline transport modes. The emissions are CA-GREET defaults. VOC, CO, and N2O emissions are small for this group and not detailed, but are included in the total GHG emissions calculations for this part and shown in Table 2.07.
Table 2.06. Crude Transport CH4 Emissions g CH4/mmBtu Ocean Tanker (residual oil) 0.699
Pipeline (electricity) 1.121
Barge 0.008 Total 1.83
26

Table 2.07. Total GHG Emissions Crude Transport and Distribution
GHG (g/mmBtu) Formula to convert to CO2e
g CO2e/mmBtu g CO2e/MJ
CO2 1,131 1,131*1 1,131 1.07 CH4 1.829 1.829*25 46 0.04 N2O 0.024 0.024*298 7 0.01 CO 1.601 1.601*0.43*(44/12) 3 0.00
VOC 0.619 0.619*0.85*(44/12) 2 0.00 Total GHG emissions 1.14
27

Section 3. CRUDE REFINING
28

3.1 Energy Use for Crude Refining Wang et al.8 analyzed refining efficiency on a process allocation basis and, based on this analysis, calculated energy efficiency for the various fuels produced from a crude refining facility. The refinery efficiency is based on a model refinery result combined with EIA data for petroleum production. The 84.5% refinery efficiency value for CARBOB is based on the AB 1007 report2 and is consistent with other well to wheel studies. This refinery efficiency takes into account additional energy used to depentanize gasoline and additional hydrogen required for sulfur removal. Figure 3 is derived from Wang et al.9 and provides refining efficiencies for the various streams exiting a modern refinery.
Figure 3. Production Efficiencies for Various Fuels
70% 75% 80% 85% 90% 95% 100%
Residual Oil
Fuel (Still Gas)
Naphtha
Diesel
Kerosene
Gasoline
LPG
Gas Oil
Heavy Fuel Oil
Lube Stocks
Asphalt
Waxes
Coke
H2 gas
H2S gas
Efficiency
29

The AB 1007 study used an average gasoline refining efficiency of 84.5% from the study above which is for average CA crude. This value is used to calculate the energy inputs necessary for gasoline as detailed in Table 3.01. The CA average electricity mix is assumed for refining (see Electricity pathway document for energy use and emissions details). Table 3.01. Details on How Efficiency is Used to Calculate Energy Needs for Crude Refining
Fuel Type Fuel Shares
Relationship of Refinery Efficiency (0.845) and Fuel
Shares Btu/mmBtu Fuel
Residual Oil 3% (1,000,000)(1/0.845 – 1)(0.03) 5,503 Natural Gas 30% (1,000,000)(1/0.845 – 1) (0.30) 55,030
Pet Coke 13% (1,000,000)(1/0.845 – 1) (0.13) 23,846 Electricity 4% (1,000,000)(1/0.845 – 1)(0.04) 7,337
Refinery Still Gas 50% (1,000,000)(1/0.845 – 1)(0.50) 91,716
Total 100% 183,432
The values in Table 3.01 are adjusted to account for upstream WTT energy use. Table 3.02 depicts the adjustments to the values from the table above for each fuel type accounting for loss factors associated with the WTT energy for each fuel used during crude refining operations. Table 3.03 details the values and descriptions for the formulas presented in Table 3.02. Table 3.02. Adjustment to Crude Refining to Account for Loss Factors and Other Factors
Fuel Type Formula Btu/mmBtu Residual Oil 5,503*(1 + (A*B+C/106)) 6,421 Natural Gas 55,030*(1 + D/ 106) 58,841 Pet. Coke 23,846*(1 + E/ 106) 24,321 Electricity 7,337*((F+G)/ 106) 16,682
Refinery still gas 91,716*(1 + (A/ 106)) 100,107 Total energy for refining 206,372
30

Table 3.03. Details for Entries in Table 3.02 Quantity Description
A = 91,493 Energy required to produce crude as feedstock for use in US refineries, a CA-GREET calculated value. (Btu/mmBtu)
B = 1.0000 Loss factor, a CA-GREET default.
C = 75,286 Energy in Btu required to produce 1 million Btu of residual oil, a CA-GREET calculated value.
D = 69,327 Energy required to produce natural gas as a stationary fuel, a CA-GREET calculated value.
E = 19,910 Total energy required to produce Pet. Coke for refining.
F = 100,413 Total energy required to produce feedstock for power generation, calculated in CA-GREET electricity analysis.
G = 2,173,222 Energy required in Btu to produce one million Btu of electricity which is calculated in CA-GREET electricity analysis.
3.2 GHG Emissions from Crude Refining The transformation of energy from the various fuels above to useful energy required in the processing of crude to CARBOB generates equipment specific GHG emissions. GHG emissions include CO2 as well as non-CO2 GHG gases. This document first presents the CO2 emissions, followed by non-CO2 emissions, which are then converted to CO2 equivalents and summarized at the end of this section (section 3.2).
Table 3.04 lists CO2 emissions by fuel type generated during the refining of crude to CARBOB. Tables 3.05 and 3.06 provide details of CO2 emissions related to use of residual oil in refineries for processing crude to CARBOB. Table 3.04. CO2 Emissions by Fuel Type
Fuel Type (g CO2/mmBtu) (g CO2e/MJ) Residual oil 533 0.50 Natural gas 3,482 3.30
Coal 2,332 2.21 Electricity 917 0.87
Refinery Still Gas 5,337 5.06
Total 12,600 11.94
31

Table 3.05. CO2 Emissions from Residual Oil Use in Refineries from Table 3.04 Calculation Details g CO2/mmBtu Reference
5,503*(emissions factor for an industrial residual oil boiler*Loss Factor + emissions from residual oil + emissions from crude oil)/106
533 CA-GREET default
Table 3.06. Values for use in Table 3.05
Factor Value Reference Emissions factor for an industrial residual oil boiler 85,045 g CO2/mmBtu CA-GREET default
Residual oil loss factor 1.0000 CA-GREET default Emissions from residual oil 5,292 grams CO2/mmBtu CA-GREET default Emissions from crude oil 6,470 grams CO2/mmBtu CA-GREET default
Tables 3.07 and 3.08 provide details on CO2 emissions from natural gas use in crude refining to CARBOB. Table 3.07. CO2 Emissions from Natural Gas from Table 3.04
Calculation details g CO2/mmBtu Reference 55,030*( share from NG engine*emission factor for NG engine)+(share from large turbine*emission factor for large turbine +( share from large industrial boiler*emission factor for large industrial boiler) + (share from small industrial boiler *emission factor for small industrial boiler) + Emissions from natural gas as a stationary fuel/106
3,482 CA-GREET default
32

Table 3.08. Details of Values Used in Table 3.07
Shares Emissions Factors (g CO2/mmBtu) Reference
Share from natural gas engine 0% 56,551 CA-GREET default Share from large turbine 25% 58,179 CA-GREET default Share from large industrial boiler 60% 58,198 CA-GREET default Share from small industrial boiler 15% 58,176 CA-GREET default Emissions from natural gas as a stationary fuel 3,482 CA-GREET default
Electricity contributions to GHG emissions are provided in Tables 3.09 to 3.15, both for feedstock production and feedstock consumption. Table 3.09. CO2 Emissions from Electricity from Table 3.04
Details Calculation g CO2/mmBtu Electricity as feedstock 7,337*7,116/106 54 Electricity as fuels 7,337*117,633/106 863 Total 917
Note: 7,337 Btu/mmBtu is energy of electricity used in CARBOB refining (see table 3.01) To calculate CO2 emissions above: CO2 emission from power plant + VOC and CO emissions conversion from power plant, where:
• CO2 from power plant = 7,337*(Specific Power Plant Emission Factor)* % of generation mix/(1- % assumed loss in transmission)/106, then convert from g/kWh to gCO2e/mmBtu by multiplying g/kWhr by (106/3,412).
• VOC and CO conversion are from CA-GREET defaults. Table 3.10. Type of Power Generation Plant and Associated Emission Factors
Power Plant Type Generation Mix
CO2 Emission Factor
(g/kWhr) Loss in
transmission
Oil-fired 0.1% 907 8.1% Nat. Gas-fired 43.1% 554 8.1% Coal-fired 15.4% 1,050 8.1% Nuclear 14.8% 0 8.1% Biomass 1.1% 0 8.1% Renewables 25.6% 0 8.1%
Table 3.11 provides a breakdown of CO2 emissions from electricity generation into feedstock production and feedstock consumption (as fuels). Production refers to mining or other methods to actually procure the feedstock necessary for use in electricity generation. Feedstock production accounts for about 5.3% of the total emissions and feedstock consumption to generate electricity accounts for the balance of 94.7%.
33
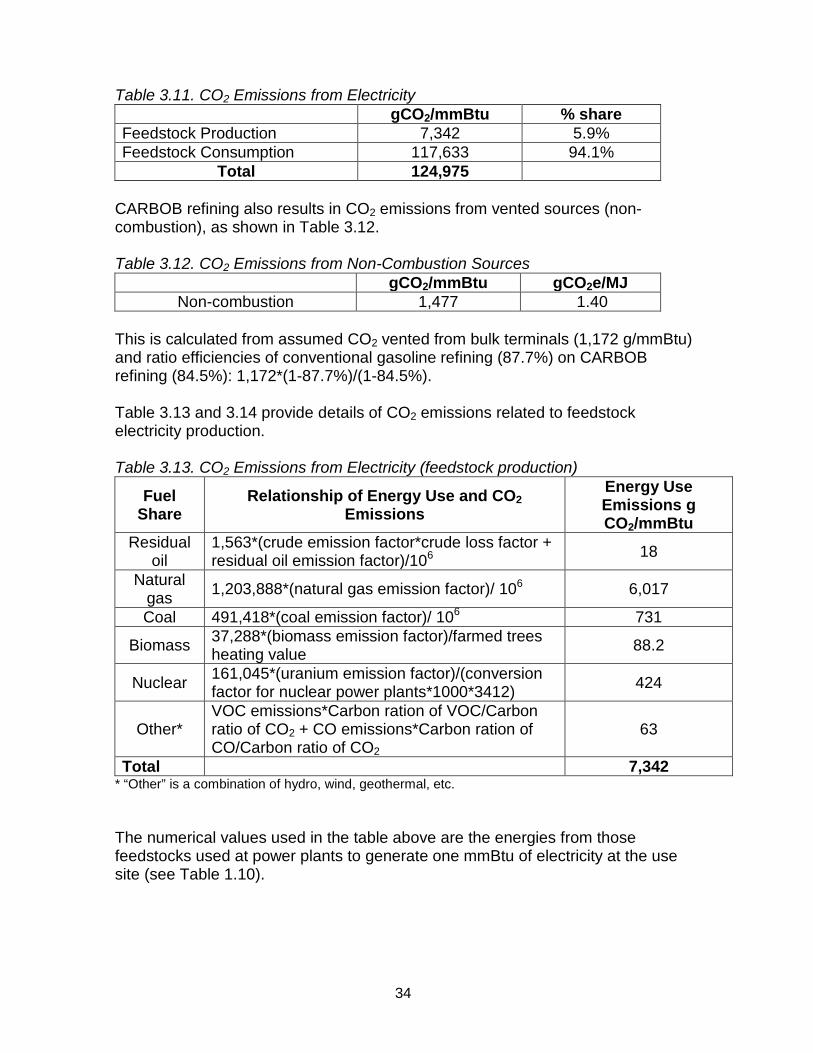
Table 3.11. CO2 Emissions from Electricity gCO2/mmBtu % share Feedstock Production 7,342 5.9% Feedstock Consumption 117,633 94.1%
Total 124,975 CARBOB refining also results in CO2 emissions from vented sources (non-combustion), as shown in Table 3.12.
Table 3.12. CO2 Emissions from Non-Combustion Sources gCO2/mmBtu gCO2e/MJ
Non-combustion 1,477 1.40 This is calculated from assumed CO2 vented from bulk terminals (1,172 g/mmBtu) and ratio efficiencies of conventional gasoline refining (87.7%) on CARBOB refining (84.5%): 1,172*(1-87.7%)/(1-84.5%). Table 3.13 and 3.14 provide details of CO2 emissions related to feedstock electricity production. Table 3.13. CO2 Emissions from Electricity (feedstock production)
Fuel Share
Relationship of Energy Use and CO2 Emissions
Energy Use Emissions g CO2/mmBtu
Residual oil
1,563*(crude emission factor*crude loss factor + residual oil emission factor)/106 18
Natural gas 1,203,888*(natural gas emission factor)/ 106 6,017
Coal 491,418*(coal emission factor)/ 106 731
Biomass 37,288*(biomass emission factor)/farmed trees heating value 88.2
Nuclear 161,045*(uranium emission factor)/(conversion factor for nuclear power plants*1000*3412) 424
Other* VOC emissions*Carbon ration of VOC/Carbon ratio of CO2 + CO emissions*Carbon ration of CO/Carbon ratio of CO2
63
Total 7,342 * “Other” is a combination of hydro, wind, geothermal, etc.
The numerical values used in the table above are the energies from those feedstocks used at power plants to generate one mmBtu of electricity at the use site (see Table 1.10).
34

Table 3.14. Factors and Values for Use in Table 3.13 Description CA-GREET
worksheets CA-GREET
default values Crude WTT emissions (to U.S refineries) Petroleum worksheet 6,579 g CO2/mmBtu
Crude loss factor 1.000 Residual oil WTT emissions Petroleum worksheet 5,292 g CO2/mmBtu Natural gas WTT emissions NG worksheet 5,079 g CO2/mmBtu Coal WTT emissions Coal worksheet 1,487 g CO2/mmBtu Biomass WTT emissions (Farmed Trees) (sum of factors for trees farming, fertilizer, pesticides, and trees T&D)
EtOH worksheet 17,623 g CO2/mmBtu
Farmed trees heating value (LHV, Btu/ton) Fuel_Specs worksheet 16,811,000 Btu/ton
Uranium WTT CO2 emissions Uranium worksheet 62,270 g CO2/mmBtu
Conversion factor for nuclear power plants
6.926 MWh/g of U-235
Carbon Ratio of VOC 0.85 Carbon Ratio of CO 0.43 Carbon Ratio of CO2 (12/44) 0.27
Table 3.15 shows the relationship between the energies used from feedstocks at a power plant (to produce one mmBtu of electricity to the use site) and the conversion efficiencies of electrical generation for each feedstock used, after taking into account the loss (8.1%) from the transmission of electricity.
35

Table 3.15. Energy Breakdown from Electricity (Feedstock Consumption)
Fuel Shares
Conversion Efficiency
Generation Mix
Relationship of Conversion Efficiency
and Energy Use Energy Use (Btu/mmBtu
Residual oil 34.8% 0.05% (106/0.348)*(1/1-
0.081)*0.0005 1,563
Natural gas 39.0% 43.1% (106/0.390)*(1/1-
0.081)*0.431 1,203,888
Coal 34.1% 15.4% (106/0.341)*(1/1-0.081)*0.154 491,418
Biomass 32.1% 1.1% (106/0.321)*(1/1-0.081)*0.011 37,288
Nuclear 100% 14.8% (106/1.00)*(1/1-0.081)*0.148 161,045
Others* 100% 25.6% (106/1.00)*(1/1-0.081)*0.255 278,020
Total 2,173,222 * “Others” is a combination of hydro, wind, geothermal, etc. Tables 3.16 and 3.17 detail CO2 emissions from use of refinery still gas in crude refining operations. Table 3.16. CO2 Emissions from Use of Refinery Still Gas
Calculation Value (g CO2/mmBtu) Reference
Emissions from refinery still gas as a stationary fuel* (share from engine*natural gas engine emission factor) + (share from large turbine*emission factor for large natural gas turbine) + (share from large industrial boiler*emission factor for large industrial boiler) + (share from small industrial boiler *emission factor for small industrial boiler) + (Emissions from natural gas as a stationary fuel)/106
5,337 CA-GREET
default calculation
Table 3.17. Values Used in Table 3.16
Description Shares Emission Factor (g CO2/mmBtu) Reference
Natural Gas, engine 0 56,551 CA-GREET default
Natural Gas, large turbine 25% 58,179 CA-GREET default
Natural Gas, large Industrial boiler 60% 58,198 CA-GREET default
Natural Gas, small Industrial boiler 15% 58,176 CA-GREET default
Emissions from natural gas as a stationary fuel 5,088 CA-GREET
default
36

CH4 emissions and N2O emissions from crude refining are shown in Tables 3.18 and 3.19. VOC and CO contributions are small and not further detailed here. They are however included in Table 3.20 below.
Table 3.18. CH4 Emissions Converted to CO2e
Fuels g CH4/mmBtu g CO2e/MJ
Residual oil 0.624 0.01 Natural gas 7.192 0.17 Coal 2.886 0.07 Electricity 1.614 0.04 Refinery Still Gas 0.173 0.00 Total 12.49 0.30
Table 3.19. N2O Emissions
Fuel g N2O/mmBtu g CO2e/MJ Residual oil 0.003 0.00 Natural gas 0.037 0.01 Coal 0.014 0.00 Electricity 0.016 0.00 Refinery Still Gas 0.056 0.02 Total 0.126 0.04
Table 3.20 summarizes the total GHG emissions from crude refining. Note that non-CO2 gases have been converted to CO2 equivalents using conversion factors detailed earlier in this document.
Table 3.20. GHG Emissions from Crude Refining
GHG (g/mmBtu) Conversion to CO2e
g CO2e/mmBtu g CO2e/MJ
CO2 12,600 12,600 *1 12,600 11.94 CH4 (combustion) 12.489 12.489*25 312 0.30 N2O 0.126 0.126*298 38 0.04
CO 6.994 6.994*0.43 *(44/12) 11 0.01
VOC 0.944 0.944*0.85*(44/12) 3 0.00 Non-combustion CO2
1,477 1.40
Non-combustion VOC 3.764 < 0.01
Non-combustion CO 3.733 < 0.01
Total 13.72
37

Section 4. CARBOB TRANSPORT AND DISTRIBUTION
38

4.1 Energy Use for Transport and Distribution of CARBOB Table 4.01 shows the energy inputs used in transporting CARBOB to trucking terminals. The energy intensity of 253 Btu/ton-mi is a default CA-GREET value based on a composite of natural gas compressor prime movers. The 50 mile distance is based on an average for California pipeline delivery and is documented in the AB 1007 report. The fuel shares input assumption is 100% electric motors based on the AB 1007 analysis of petroleum infrastructure in California. The energy intensity is multiplied by an adjustment factor for each type of pipeline motor. In this case the electric motor adjustment factor is 100% (a CA-GREET default value). The total energy is then calculated, including the WTT energy to produce electricity.
Table 4.02 shows the energy inputs for truck transport. The calculation is based on a tanker truck capacity of 9,000 gallons (25 metric tons) and a transport distance of 50 miles. The 50 mile distance is based on a survey of California fuel delivery trucks and is documented in the AB 1007 report. CA-GREET calculates the diesel energy per ton-mile based on the cargo capacity of the truck and its fuel economy.
Table 4.03 shows the total energy calculations used in CA-GREET. Here the pipeline and truck values are weighted by the fraction of fuel delivered by each mode. 80% of the gasoline is assumed to be piped to a blending terminal because some refineries fill trucks at the loading rack adjacent to the refinery. 99.4% of the gasoline is assumed to be transported to fueling stations by delivery trucks. The remaining 0.6% corresponds to the few fueling stations where gasoline is provided directly by pipeline. Table 4.04 details the values used in the formulas presented in Table 4.03. The total transport energy for CARBOB shown in Table 4.03 includes energy associated with feed loss, which is calculated based on the VOC emissions (g/mmBtu) from the bulk terminal and refinery stations (see note below Table 4.03).
Table 4.01. Energy use for Transport and Distribution via Pipeline
Energy Intensity (Btu/ton-
mile)
Distance from Origin
to Destination
(miles)
Type of Power
Generation
Shares of the type of
turbine used
Distributed by pipeline
Pipeline 253 50 Electric Motor 100 % 80%*
*Assumed 20% transported directly from refinery terminal rack
39

Table 4.02. Energy use for Transportation and Distribution CARBOB via HDD Truck
Energy Intensity (Btu/ton-
mile)
Distance from Origin
to Dest. (miles)
Capacity (tons)
Fuel Used
(miles/gal)
Energy Used by HDD
truck (Btu/ mile)
Share of
Diesel used
Transp/ Dist. by
truck
HDD Truck Transport 1,028 50 25 5 25,690 100% 20%
HDD Truck Distribution 1,028 50 25 5 25,690 100% 99.4%*
* Assumed 0.6% CARBOB is transported directly by pipeline to about 50 stations Table 4.03. Details of Energy Uses for CARBOB Transportation and Distribution
Transport mode Details Calculations Btu/ mmBtu
Feed Loss (Loss Factor – 1)*106 813
CARBOB transported by pipeline
(Density of CARBOB/LHV of CARBOB)*(1/454)*(1/2000)*(energy consumed by pipeline)*(miles transported one-way)*100%*100%* (2.276)*80%*106
642
CARBOB Transport by HDD truck
(Density of CARBOB/LHV of CARBOB)*(1/454)*(1/2000)*(energy consumed by HDD truck)*(miles transported one-way+ miles transported one-way backhaul)*100%*(1+0.232)*20%*106
699
CARBOB Distribution by HDD truck
(Density of CARBOB/LHV of CARBOB)*(1/454)*(1/2000)*(energy consumed by HDD truck)*(miles transported one-way+ miles transported one-way backhaul)*100%*(1+0.232)*99.4%*106
3,477
Total 5,632 Note: Loss factor = [(VOC from bulk terminal + VOC from refinery stations)/CARBOB Density)*(CARBOB LHV/106)] + 1
40

Table 4.04. Values of Properties Used in Table 4.03 Properties Values Source
Feed loss (Btu/mmBtu) 813 CA-GREET calculation Lower heating value of CARBOB (Btu/gallon) 113,300 AB 1007 value Density of CARBOB (grams/gallon) 2,819 CA-GREET default Energy consumed by Pipeline (Btu/ton-mile) 253 CA-GREET default Conversion from pounds to grams 454 Conversion from tons to pounds 2,000 Energy intensity of CARBOB transported by HDD truck (Btu/ton-mile) 1,028 AB 1007 value
CARBOB transport one-way (mile) 50 AB 1007 value Energy consumed in electricity used as transportation fuel in CARBOB Production (Btu/Btu)
2.274 CA-GREET calculation
Energy consumed in diesel used as transportation fuel in CARBOB Production (Btu/Btu)
0.217 CA-GREET calculation
VOC from bulk terminal (g/mmBtu) 6.667 CA-GREET default VOC from refinery stations (g/mmBtu) 13.082 CA-GREET default
Note: • 2.276 is the WTT energy for electricity calculated in CA-GREET = (energy consumed to
produce feedstock + Energy consumed to produce electricity)/106 = (2,173,222+102,959)/106
• 0.228 is the diesel adjustment factor = energy of crude oil transported to the US refineries*loss factor of diesel + WTT energy of conventional diesel.
41

4.2 GHG Emissions for Transportation and Distribution of CARBOB
Table 4.05 details only CO2 emissions for the transport and distribution of finished CARBOB.
Table 4.05. CO2 from CARBOB Transportation and Distribution
Miles
traveled 1-way
Energy Intensity (Btu/mile-
ton)
Assumed % usage
CO2 (g/mmBtu)
CO2e (g/MJ)
Transported by Pipeline 50 253 80% 35 0.03
Transport by HDD Truck 50 1028 20% 53 0.05
Distributed by HDD Truck 50 1028 99.4% 266 0.26
Total 0.34 Note:
• For pipeline: assumed shares of power generation are divided as following: turbine 55%, current NG engine 33%, and 12% future NG engine (CA-GREET defaults)
• For HDD Truck: assumed energy consumption at 25,690 Btu/mile, average speed 5 mph, and 25 tons capacity load of CARBOB. for delivery to a blending station after taking consideration of 80% and 99.4% mode shares of pipeline
Table 4.06 provides details for all GHG emissions for CARBOB transport and distribution. This includes CH4, N2O, VOC combined with CO2.
Table 4.06. Details of GHG from CARBOB Transportation and Distribution
g-CO2e/mmBtu g-CO2e/MJ Total (gCO2e/MJ) Transp. Distr. Transp. Distr.
CO2 88 266 0.08 0.26 0.34 CH4 3.199 8.176 <0.01 <0.01 <0.01 N2O 0.573 1.955 <0.01 <0.01 <0.01 CO 0.204 0.803 <0.01 <0.01 <0.01
VOC 0.084 0.352 <0.01 <0.01 <0.01 Total GHG 92.9 277.4 0.09 0.27 0.36
42

Section 5. CARBON EMISSIONS FROM CARBOB COMBUSTION
43
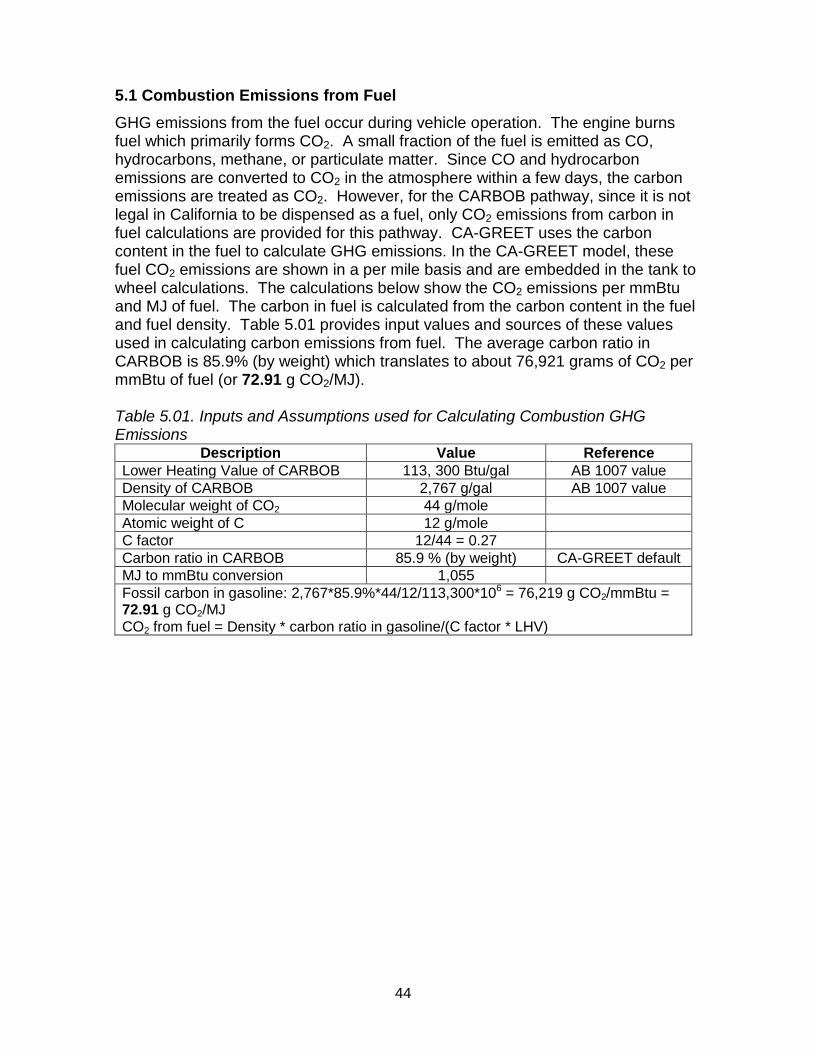
5.1 Combustion Emissions from Fuel GHG emissions from the fuel occur during vehicle operation. The engine burns fuel which primarily forms CO2. A small fraction of the fuel is emitted as CO, hydrocarbons, methane, or particulate matter. Since CO and hydrocarbon emissions are converted to CO2 in the atmosphere within a few days, the carbon emissions are treated as CO2. However, for the CARBOB pathway, since it is not legal in California to be dispensed as a fuel, only CO2 emissions from carbon in fuel calculations are provided for this pathway. CA-GREET uses the carbon content in the fuel to calculate GHG emissions. In the CA-GREET model, these fuel CO2 emissions are shown in a per mile basis and are embedded in the tank to wheel calculations. The calculations below show the CO2 emissions per mmBtu and MJ of fuel. The carbon in fuel is calculated from the carbon content in the fuel and fuel density. Table 5.01 provides input values and sources of these values used in calculating carbon emissions from fuel. The average carbon ratio in CARBOB is 85.9% (by weight) which translates to about 76,921 grams of CO2 per mmBtu of fuel (or 72.91 g CO2/MJ). Table 5.01. Inputs and Assumptions used for Calculating Combustion GHG Emissions
Description Value Reference Lower Heating Value of CARBOB 113, 300 Btu/gal AB 1007 value Density of CARBOB 2,767 g/gal AB 1007 value Molecular weight of CO2 44 g/mole Atomic weight of C 12 g/mole C factor 12/44 = 0.27 Carbon ratio in CARBOB 85.9 % (by weight) CA-GREET default MJ to mmBtu conversion 1,055 Fossil carbon in gasoline: 2,767*85.9%*44/12/113,300*106 = 76,219 g CO2/mmBtu = 72.91 g CO2/MJ CO2 from fuel = Density * carbon ratio in gasoline/(C factor * LHV)
44

APPENDIX B
CARBOB Pathway Input Values
45

Scenario: Average Crude Oil to California refineries to make CARBOB Parameters Units Values Note
GHG Equivalent CO2 1 CH4 25 N2O 298
VOC 3.1 CO 1.6
Crude Recovery Efficiency 92.7%
Process Shares Crude 0.6%
Residual Oil 0.6% Conventional Diesel 8.6%
Pet. Coke 0.4% Conventional Gasoline 1.1%
Natural Gas 72.1% Electricity 16.5%
Feed Loss crude recovery 0.1% Equipment Shares These are CA-GREET Defaults
Commercial Boiler - Diesel 25% The Emission factor for CO2 is misleading as it subtracts out the methane and CO and VOC
CO2 Emission Factor gCO2/mmBtu 78,167 Stationary Reciprocating Eng. - Diesel 50%
CO2 Emission Factor gCO2/mmBtu 77,349 Turbine - Diesel 25%
CO2 Emission Factor gCO2/mmBtu 78,179 Stationary Reciprocating Eng. - NG 50%
CO2 Emission Factor gCO2/mmBtu 56,551 Small Industrial Boiler - NG 50%
CO2 Emission Factor gCO2/mmBtu 58,176 Transportation to CA refineries
Pipeline shares 42% by pipeline to CA Pipeline distance miles 150 One way
Pipeline Energy Intensity Btu/mile-ton 253 Transportation to US refineries
Pipeline distance miles 266 One way Pipeline Energy Intensity Btu/mile-ton 253
Ocean Tanker distance traveled miles 3,550 One way Ocean Tanker Energy Intensity Btu/mile-ton 27 24 Btu/mile-ton for return trip
Loss Factor in Crude T&D 1.000062 CARBOB Refining
Efficiency 84.5% CARBOB Refining for year 2010 - user input Process Shares
Residual Oil 3% Natural Gas 30%
Pet. Coke 13% Electricity 4% Still Gas 50%
Equipment shares Large Turbine - Natural Gas 25% Same comment
CO2 Emission Factor gCO2/mmBtu 58,179
Parameters Units Values Note
46

Large Industrial Boiler - Natural Gas 60% CO2 Emission Factor gCO2/mmBtu 58,198
Small Industrial Boiler - Natural Gas 15% CO2 Emission Factor gCO2/mmBtu 58,176
Industrial Boiler - Residual Oil 100% CO2 Emission Factor gCO2/mmBtu 85,045
Transportation
Transportation by pipeline 80% 20% directly from refinery terminal rack Distance miles 50
Energy Intensity Btu/ton-mile 253 Transportation by truck 20%
Distance miles 50 Energy Intensity Btu/ton-mile 1028
Distribution by truck 99.4% 0.6% directly supplied by pipeline Distance miles 50
Energy Intensity Btu/ton-mile 1,028 Loss Factor in CARBOB T&D 1.000201
Fuels Properties LHV (Btu/gal)
Density (g/gal)
Crude 129,670 3,205 Residual Oil 140,353 3,752
Conventional Diesel 128,450 3,167 Conventional Gasoline 116,090 2,819
CaRFG 111,289 2,828 CARBOB 113,300 2,767
Natural Gas 83,686 2,651 NG Liquids Ethanol 76,330 2,988
Still Gas 128,590 Transportation Mode
Ocean Tanker tons 250,000 Crude Oil. This is a change, the others are not tons 150,000 Gasoline
Heavy Duty Truck tons 25 Crude Oil tons 25 Gasoline
47

Endnotes 1 GREET Model: Argonne National Laboratory: http://www.transportation.anl.gov/modeling_simulation/GREET/index.html 2 California Assembly Bill AB 1007 Study: http://www.energy.ca.gov/ab1007 3 RFG is actually blended with 10% ethanol (by volume, nominal). Ethanol free RFG is potentially also a fuel, but the fuel cycle energy inputs would differ somewhat from CARBOB. In CA, CARBOB by itself can not be used as a motor vehicle fuel but needs to be blended with an oxygenate before use. 4 CA-GREET Model (modified by Lifecycle Associates ) released February 2009 (http://www.arb.ca.gov/fuels/lcfs/lcfs.htm) 5 California Energy Commission – Energy Almanac http://www.energyalmanac.ca.gov/petroleum/statistics/crude_oil_receipts.html 6 Division of Oil, Gas & Geothermal Resources, http://www.conservation.ca.gov/dog/Pages/Index.aspx. 7 Intergovernmental Panel on Climate Change a scientific intergovernmental body tasked to evaluate the risk of climate change caused by human activity established by United Nations in 1988. “IPCC Technical Report 2007” – Table TS-2 – page 33 (http://www.ipcc.ch/pdf/assessment-report/ar4/wg1/ar4-wg1-ts.pdf) 8 The sea shipping line website: http://www.seashipping.com/tools.htm 9 Refinery Energy Efficiency Allocation Analysis based on: Wang, M., et al. (2004) “Allocation of Energy Use in Petroleum Refineries to Petroleum Products Implications for Life-Cycle Energy Use and Emission Inventory of Petroleum Transportation Fuels”. LCA Case Studies.
48


![[RFG]] Österreichischer Gemeindebund...Schriftenreihe Rechts- und Finanzierungspraxis der Gemeinden 4 4b / 2006 [RFG]] P.b.b.Verlagspostamt 1010 Wien Erscheinungsort Wien 03Z035091M](https://static.fdocuments.net/doc/165x107/5f377efeb6d95c51ee5560ee/rfg-sterreichischer-gemeindebund-schriftenreihe-rechts-und-finanzierungspraxis.jpg)