Fuel cells, hydrogen production and implementation in the ...
56
Final Master Thesis Fuel cells, hydrogen production and implementation in the public transport services Tutor: Krzysztof Krzysztofowicz Student: Pablo Campos Rams Academic Year: 2019-20
Transcript of Fuel cells, hydrogen production and implementation in the ...

Final Master Thesis
Fuel cells, hydrogen production and implementation in the public transport services
Tutor: Krzysztof Krzysztofowicz
Student: Pablo Campos Rams
Academic Year: 2019-20

2

3
INDEX 1.Abstract ...................................................................................................................................... 7
2.Introduction ................................................................................................................................ 7
2.1 History of hydrogen ............................................................................................................. 7
2.2 Hydrogen Europe ................................................................................................................. 9
3.Background ............................................................................................................................... 10
3.1 State of the art ................................................................................................................... 10
3.2 Security .............................................................................................................................. 10
3.3 Hydrogen extraction .......................................................................................................... 11
3.2 PEM batteries .................................................................................................................... 13
3.2.1 Nafion ® Electrolyte .................................................................................................... 13
3.2.2 Electrode..................................................................................................................... 14
3.1.3 MEA (Electrode-Membrane Assembly) ....................................................................... 15
3.3 FUEL CELL .......................................................................................................................... 15
3.4 Hydrogen vehicles ............................................................................................................. 16
3.4.1 Electrical technology ................................................................................................... 16
3.4.2 Electric motors ............................................................................................................ 16
3.4.3 Hydrogen cars ............................................................................................................. 18
3.4.3 Electric buses .............................................................................................................. 20
3.5 Hydrogen stations .............................................................................................................. 21
3.5.1 Infrastructure .............................................................................................................. 21
3.5.2 Types of hydrogen stations ......................................................................................... 23
3.6 Hydrogen vs. traditional fuels ............................................................................................ 24
3.6.1 Greenhouse effect ...................................................................................................... 24
3.6.2 Fuel cell vs Hydrogen combustion .............................................................................. 26
3.7 Disadvantages .................................................................................................................... 27
4.Description of the project ......................................................................................................... 28
5 Design ....................................................................................................................................... 29
5 .1 Design of the solar plant ................................................................................................... 29
5.1.1 Introduction ................................................................................................................ 29
5.1.2 Selected solar panel .................................................................................................... 31
5.1.3 Solar plant located in Valencia .................................................................................... 32
5.1.4 Solar plant in Poland ................................................................................................... 34
5.1.5 Spain-Poland comparison ........................................................................................... 36
5.1.6 Solar Plant Summary ................................................................................................... 37
5.2 Design of the electrolyser .................................................................................................. 38

4
5.2.1 Introduction ................................................................................................................ 38
5.2.2 Selected Electrolyzer .................................................................................................. 39
5 . 2. 3 Production of the electrolyser ................................................................................. 40
5 .2.4 Electrolyzer Summary ................................................................................................ 42
5 .3 Buses ................................................................................................................................. 42
5 .3.1 Background ................................................................................................................ 42
5 .3.2 Selected bus ............................................................................................................... 45
5 .3.3 Bus Summary ............................................................................................................. 46
5.4 Route design ...................................................................................................................... 47
5.4.1 route mileage.............................................................................................................. 47
5.4.2 Route in Valencia ........................................................................................................ 47
5.4.3 Gdansk route .............................................................................................................. 49
5.4.4 Route summary .......................................................................................................... 50
6. Conclusions .............................................................................................................................. 51
6.1 Spain-Poland comparison .................................................................................................. 51
6.2 Conclusions ........................................................................................................................ 52
6.2.1 Cost reduction ............................................................................................................ 52
6.2.2 Research ..................................................................................................................... 53
6.2.3 Conclusion .................................................................................................................. 54
7. Bibliography ............................................................................................................................. 54
Table Index
Table 1. Technical and economic of the different hydrogen production methods .................... 12
Table 2. Production of the mains pollutants 2014 ...................................................................... 25
Table 3. Physics and chemical properties for safety consideration of three incestigated fuels . 26
Table 4. Safety level reached in the combustion processes of gasoline, methane and hydrogen
..................................................................................................................................................... 26
Table 5. PV-GIS Valencia information 100kW ............................................................................. 32
Table 6. Outputs from PV-GIS Valencia ....................................................................................... 34
Table 7. PV-GIS Gdansk information 100kW ............................................................................... 35
Table 8. Outputs from PV-GIS Gdansk ........................................................................................ 36
Table 9. Production per month and per day of 100kWh. Production of the fully plant. (Table in
kWh) ............................................................................................................................................ 37
Table 10. Production of solar plant ............................................................................................. 38
Table 11. Electrolyser selected datasheet. Proton onsite 570254 .............................................. 40
Table 12. Production of electrolyser Spain-Poland ..................................................................... 42
Table 13. Toyota Sora Datasheet ................................................................................................ 46
Table 14. Summary of production and travel capacity Spain-Poland ......................................... 46

5
Table 15. Travel capacity Spain-Poland ....................................................................................... 47
Table 16. Laps in valencian route ................................................................................................ 48
Table 17. Laps Gdansk route ....................................................................................................... 50
Table 18. Aceptable laps ............................................................................................................. 51
Table 19. Comparation 100kWh Spain-Poland ........................................................................... 52
Illustrations Index
Illustration 1. Fuel Cell scheme ..................................................................................................... 8
Illustration 2. Roadmap for Europe. Source: Hydrogen Europe ................................................... 9
Illustration 3. Hydrogen .............................................................................................................. 10
Illustration 4. Hydrogen vs gasoline test ..................................................................................... 11
Illustration 5.Classification of hydrogen production methods ................................................... 12
Illustration 6. Chemical structure of Nafion by DuPont .............................................................. 13
Illustration 7. Battery and fuel cell scheme ................................................................................ 14
Illustration 8. Original drawing of the first fuel cell by William robert grove called gas voltaic
battery (Source: W.R on voltaic series and the combination of gases by platinum. In:
Philosophical Magazine 14) ......................................................................................................... 15
Illustration 9. Hyundai kona datasheet ....................................................................................... 16
Illustration 10. BMW i3 datasheet .............................................................................................. 17
Illustration 11. Renault ZOE III datasheet ................................................................................... 17
Illustration 12. Nissan leaf datasheet .......................................................................................... 18
Illustration 13. Toyota Mirai datasheet ....................................................................................... 18
Illustration 14. Hyundai Nexo datasheet..................................................................................... 19
Illustration 15. Hyundai Nexo engine .......................................................................................... 20
Illustration 16. Toyota Sora Bus .................................................................................................. 20
Illustration 17. Nikola Tre truck ................................................................................................... 21
Illustration 18. Hydrogen stations around the world by H2stations.org .................................... 22
Illustration 19. Hydrogen stations in Europe by H2stations.org ................................................. 22
Illustration 20. Typical elements of a hydrogen fuelling station with hydrogen delivery .......... 24
Illustration 21. Main CO2 sources ............................................................................................... 25
Illustration 22. Percentage contribution provided by different greenhouse gases to the earth’s
average temperature increment. ................................................................................................ 25
Illustration 23. Project scheme ................................................................................................... 29
Illustration 24. Spanish Photovoltaic Union study of annual installed power ............................ 30
Illustration 25. Spanish Photovoltaic Union study of accumulated installed power .................. 30
Illustration 26. BiHiKu solar panel datasheet .............................................................................. 31
Illustration 27. Electrical data of BiHiKu panel ............................................................................ 31
Illustration 28. Monthly energy output from fix-angle PV system, PV-GIS Valencia .................. 33
Illustration 29. Monthly energy output from fix-angle PV system. PV-GIS Gdansk .................... 35
Illustration 30. Comparation kWh produced in Gdansk(orange) and Valencia(blue) per 100 kWh
installed ....................................................................................................................................... 36
Illustration 31. Nafion® structure ................................................................................................ 39
Illustration 32. Selected electrolyser........................................................................................... 39
Illustration 33. Calculations of energy production per mol of hydrogen 100% efficiency ......... 41
Illustration 34. Real. Electrolyser consumption .......................................................................... 41
Illustration 35. Febus Project city of Pau..................................................................................... 43

6
Illustration 36. Japan-Australia agreement to supply Hydrogen ................................................ 44
Illustration 37. Toyota Sora ......................................................................................................... 45
Illustration 38. Valencian route ................................................................................................... 48
Illustration 39. Gdansk route ...................................................................................................... 49
Illustration 40. Annex10 Hydrogen council report cost reduction provided .............................. 53

7
1.Abstract
" I believe that water will one day be employed as fuel, that hydrogen and oxygen which constitute it, used singly or together, will furnish an inexhaustible source of heat and light, of an intensity of which coal is not capable. "
Jules Verne, "The mysterious island" 1874
Humanity has experienced unbridled growth since its inception. Making the world its home and source of resources, reaching the point where the planet earth has stopped appearing immense and making it our responsibility to maintain it. In the search for sustainability, there are many problems that we face. In this context of change towards a sustainable future, hydrogen technologies and fuel cells appear. This technology has undergone incredible development in the last 40 years, but the room for improvement is still very wide. The electrolysis of water is such a sustainable process that its contamination only depends on the energy source with which it is fed. And its only residue is liquid water. In this thesis, a review will be made of the situation of hydrogen technologies, especially the electrolysis of water. And a sustainable project based on this phenomenon will be designed.
2.Introduction
2.1 History of hydrogen
Hydrogen was discovered by Paracelsus in the 16th century and later Cavendish rediscovered it as a flammable gas that when burned produced water. Finally, A. Lavoiseier identified it as a new element and gave it the name of Hydrogen, that is, a generator of water, since its combustion produces water.
In 1800 Alessandro Volta invented the electrochemical cell, on March 20 of that same year he communicated it to the Royal Society, it was two Englishmen, Nicholson and Carlisle, who produced the first electrolysis of water. Without knowing exactly the meaning of the detected bubbling as the electric current passes through the water.
It was Faraday in 1834 who explained all these events.

8
Illustration 1. Fuel Cell scheme
𝐴𝑛𝑜𝑑𝑒 𝑟𝑒𝑎𝑐𝑡𝑖𝑜𝑛: 2𝐻2𝑂 → 𝑂2 + 4𝐻+ + 4𝑒−
𝐶𝑎𝑡𝑜𝑑𝑒 𝑟𝑒𝑎𝑐𝑡𝑖𝑜𝑛: 4𝐻+ + 4𝑒− → 2𝐻2
Enunciating in turn the laws of Faraday that govern the behavior of electrochemical cells.
Faraday's First Law: The mass of a deposited substance is directly proportional to the electricity transferred from the electrode.
Faraday's second law: For a given electric charge the deposited mass is directly proportional to the equivalent weight of the deposited element.
𝑚 =𝑄
𝐹∗
𝑀
𝑧
m: deposited mass (grams)
Q: electric charge (coulombs)
F: Faraday constant (9 8485 columbs/mol of e-)
M: molecular mass of the deposited substance (grams/mol)
z: valence number of the ion in the solution
𝑄 =𝐼
𝑡
I: current intensity (amps)
t: time (seconds)
The following relationships are known.
𝑊𝑒1 = 𝑉 ∗ 𝑖 ∗ 𝑡(𝐽)
𝑛 =𝑚
𝑀𝑎
(𝑚𝑜𝑙𝑒𝑠)
𝑄 = 𝑖 ∗ 𝑡(𝐶)
𝑛𝑒− = 𝑛 ∗ 𝑍(𝑚𝑜𝑙𝑒𝑠 𝑒−)
Reaching the following equality that relates the necessary energy to be applied per mole of hydrogen.
𝑊𝑒1 = 𝑛𝑒− ∗ 𝐹 ∗ 𝐸(𝐽)

9
Where E symbolizes the electrical potential (V) to be applied. Obtained based on the standard reduction potentials of the two independent reactions.
2𝐻2 → 4𝐻+ + 4𝑒− 𝐸0 = 0𝑉
𝑂2 + 4𝐻+ + 4𝑒− → 2𝐻2𝑂 𝐸0 = 1.229𝑉
Being the global reaction
𝐻2𝑂 →1
2𝑂2 + 𝐻2 𝐸0 = −1,229𝑉
This being the minimum potential to be applied for the reaction to occur.
Currently, the most standardized electrolysis of water is carried out with PEM (Proton Exchange Membrane) electrolysers.
2.2 Hydrogen Europe
Currently, the hydrogen technology described in depth in the following points is fully operational, and is capable of incorporating itself into daily life as well as having a great deal of room for improvement. Proof of this is Europe's plan for the incorporation of this technology.
Currently one of the most widely discussed topics regarding sustainability is the search for environmentally friendly fuels and energy sources. In this context, Europe launches its development plan towards a sustainable economy through “Hydrogen Europe”, an association supported by various companies whose objective is to mark and support the development of hydrogen technologies.
Illustration 2. Roadmap for Europe. Source: Hydrogen Europe

10
In the image we can see the general hydrogen roadmap in Europe. However, annexed to the thesis (Europe Roadmaps hydrogen) it can see the specific plan of each of the parts involved in the development of hydrogen technology.
The EU is determined to promote hydrogen in this way, among the objectives of 2030 are:
Replace 95,000 fossil fuel trucks with environmentally friendly hydrogen trucks. Long-haul trucks are one of the largest sources of CO2 production on the European continent. Construction of more than 1000 hydrogen stations. Construction of gas pipelines for the supply of hydrogen. The EU is also considering the possibility of reusing gas pipelines that are used for fossil fuels.
On the other hand, the world, led by Japan, also marks its development roadmap, through the “Hydrogen council” held in Japan in January 2020.
3.Background
3.1 State of the art Hydrogen is also considered one of the great advances that never come, despite the environmental advantages that it is true that despite being a recurring theme and in which each country has its own development plan. Year after year we see how this incorporation is not effective. However, private companies do bet on this new renewable energy.
3.2 Security
Hydrogen is the simplest and most abundant chemical element in the universe. With atomic number 1, represented by the symbol H. With an atomic mass of 1.00797 it is the lightest element on the periodic table. At room temperature it has the diatomic molecular form and its state is gaseous, it is part of the carbon chains due to its ability to combine with most elements. The human body is made up of 10% hydrogen, coal has a hydrogen percentage of between 5-10% and the largest source of hydrogen is water that covers 71% of the planet earth.
Illustration 3. Hydrogen
It is a colourless, odourless and tasteless gas at room temperature. It is not
toxic. It burn easily at room temperature, should be careful because the
hydrogen burns with a colourless flame almost invisible. Hydrogen has a high laminar combustion rate (2.37 m/s) and a lower ignition energy (0.02mJ) than gasoline (0.24mJ) or methane (0.29mJ). The hydrogen ignition temperature (585ºC) is significantly higher than for gasoline (228-501ºC) and natural gas (540ºC) . It is almost impossible to make hydrogen explode in an open area due to its high volatility. Since hydrogen is 14 times lighter than air, it disperses at 20 m/s. Therefore, hydrogen is usually safer

11
than other fuels in terms of leaks. When it is stored at high pressures, it follows the rules and standards for common pressurized gas.
After many tests carried out, it is concluded that in cases of leaks it disperses at such a fast speed that it greatly reduces the risk of fire or explosion. The image below shows the evidence.
Illustration 4. Hydrogen vs gasoline test
3.3 Hydrogen extraction
The main methods for producing hydrogen are presented in the Illustration 5. Hydrogen can be produced directly from fossil fuels by the following processes reforming with steam - methane (SMR), thermal cracking (TC), partial oxidation
(POX) and coal gasification (CG).
The main processes for producing hydrogen from biomass are biochemistry and thermochemistry (by gasification). It will also be produced by dissociating water by electrolysis (HE), photoelectrolysis (PHE) or photolysis (also called photoelectrochemical or photo- catalytic water division), water thermolysis (WT) (also called thermochemical water division) and photobiological processes.

12
Illustration 5.Classification of hydrogen production methods
All of these processes require energy inputs. In the case of conventional electrolysis, for example, the input of electrical energy can be electricity generated by fossil fuels, nuclear or renewable energy plants.
In the case of this project, a photovoltaic solar power plant and a subsequent electrolysis of water have been selected.
Table 1. Technical and economic of the different hydrogen production methods

13
The table is referenced to internal references of “Automotive hydrogen fueling stations: An international review.”
The table presents an overview of the technical and economic aspects of the different hydrogen production methods described above.
Production processes 1–5 in the table use hydrocarbons as raw material, so all of these emit greenhouse gases (CO2).
The gasification process has the highest greenhouse gas emissions into the atmosphere (11 kg of CO2 for every kg of H2), while SMR is the lowest emitting 7.05 kg of CO2 per kg H2. The production of hydrogen by biomass emits about 5.43 kg of CO2 /kg of H2. Partial oxidation of methane has the lowest CO2 production, emitting less than 3 kg. The methane thermal cracking process does not emit greenhouse gases. Therefore, it can be zero emission if you use a clean energy source, however, it produces less hydrogen per unit mass of methane.
Processes 6-7 use water as raw material. Therefore, emissions depend solely on the energy resources used to fuel hydrogen production processes. If the process used renewable sources, the greenhouse effect emissions would be 0.
Processes 8-9 do not emit greenhouse gases, although these processes are under development.
3.2 PEM batteries
3.2.1 Nafion ® Electrolyte
Polymeric membrane PEM cells. So called because they are ion exchange membranes. The most widespread membrane is the Nafion Membrane (Nafion ®
N-117 PFSA DuPontTM Plastic Polymeter) A plastic polymer created by the Dupont company that meets the specific needs of electrochemical cells.
Illustration 6. Chemical structure of Nafion by DuPont
Nafion is a brand name for a sulfonated tetrafluoroethylene based fluoropolymer-copolymer. There are two reactions at the electrodes, first the hydrogen dissociates at the anode giving rise to two protons and two electrons, while the two protons are led through the electrolyte through the membrane, the electrons are led by the external circuit towards the cathode generating electric current. At the cathode, oxygen reacts with the protons that cross the membrane, generating

14
water. The membrane is selective and only protons will be able to pass through it.
The crucial point for this membrane to be a proton conductor is that it is strongly hydrated, to the point that the inlet gases must be humidified without reaching the flooding of the electrodes. The negative point of this type of membranes is that the operating conditions are very rigorous.
Illustration 7. Battery and fuel cell scheme
In section a), water reacts at the anode to form oxygen and positively charged hydrogen ions (protons). These ions flow through the membrane to the cathode where they combine with the electrons in the external circuit to form hydrogen gas. Consuming energy.
𝐴𝑛𝑜𝑑𝑖𝑐 𝑟𝑒𝑎𝑐𝑡𝑖𝑜𝑛: 2𝐻2𝑂 → 𝑂2 + 4𝐻+ + 4𝑒−
𝐶𝑎𝑡𝑜𝑑𝑖𝑐 𝑟𝑒𝑎𝑐𝑡𝑖𝑜𝑛: 4𝐻+ + 4𝑒− → 2𝐻2
The reverse process is found in section b). Hydrogen gas is supplied to the anode where it reacts forming positively charged hydrogen ions (protons), these ions flow through the membrane where they react with Oxygen gas to form water. Producing energy. This process is the beginning of the fuel cell.
𝐶𝑎𝑡𝑜𝑑𝑖𝑐 𝑟𝑒𝑎𝑐𝑡𝑖𝑜𝑛: 2𝐻2 → 4𝐻+ + 4𝑒−
𝐴𝑛𝑜𝑑𝑖𝑐 𝑟𝑒𝑎𝑐𝑡𝑖𝑜𝑛: 𝑂2 + 4𝐻+ + 4𝑒− → 2𝐻2𝑂
3.2.2 Electrode
Porous electrodes formed by a thin layer of Pt on carbon are used, with platinum acting as a catalyst. The required amount of platinum is 0.5 mg/cm. In the working conditions 70-90ºC the catalyst is very sensitive to CO, below 150 ºC the CO joins the Pt occupying places where H2 cannot access.

15
Finding a substitute for platinum is one of the main research challenges. Due to its price and because it is a worse catalyst for the reduction of oxygen than for the oxidation of hydrogen, however, a material that exceeds Pt has not been discovered.
3.1.3 MEA (Electrode-Membrane Assembly)
At the interface electrode-membrane must be in contact gas, Pt/C and the electrolyte. Dissociation of hydrogen on Pt must occur, protons must be transported through the membrane to the cathode, and electrons to the external circuit. Simultaneously at the cathode the protons and electrons must reach Pt/C and react with the oxygen in the water.
For all these events to occur at the same time, there must be a perfect contact between all the parts. For this, is created the MEA assembly that maximizes this contact. There are different ways of preparing it.
3.3 FUEL CELL
Already exposed how an electrochemical cell works which obtains energy from the oxidation/reduction of a substance. Will expand on these fuel cells.
A fuel cell is called an electrochemical cell in which a continuous flow of fuel and oxidant generates a continuous flow of electrical energy. Similar to a battery, however, it enables continuous supply of reagents, as opposed to the limited energy storage capacity of a conventional battery.
In 1842 William R. Grove developed a gas-powered electrochemical cell. Hydrogen and oxygen demonstrating that the electrolysis process of water was reversible and creating the first fuel cell "On the Gas Voltaic Battery" (1839).
Illustration 8. Original drawing of the first fuel cell by William robert grove called gas voltaic battery (Source: W.R on voltaic series and the combination of gases by platinum. In: Philosophical Magazine 14)
Image. Original drawing of the first fuel cell by William Robert grove called gas voltaic battery (Source: WR on voltaic series and the combination of gases by platinum. In: Philosophical Magazine 14)

16
"Formed by a zinc anode in dilute sulfuric acid and a platinum cathode in concentrated nitric acid, both separated by a porous ceramic pot."
In 1899 Ludwing Mond and Charles Lanfer first used the name fuel cell.
Francis Thomas Bacon was the first to build the first cell from which hydrogen fuel cells were built. Later, in the special program of the USA of the 60s, the hydrogen fuel cells would be used in Apollo11 that would take the first man to the moon.
3.4 Hydrogen vehicles
3.4.1 Electrical technology
The technology of electric cars began in the 1930s and since then investment in this type of technology has grown with social concern for sustainability. In 1996 Nissan began series production of its 100% electric Nissan Prairie vehicle. Other large brands such as Toyota are betting on hybrid options such as the Toyota Prius marketed from 1997.
As of 5/9/2020, there are many commercialized vehicles whose engines are powered by rechargeable batteries. In fact, it is increasingly common to see charging points for electric cars.
The list is somewhat smaller for cars powered by fuel cells. In any case, the technology is viable and there is the possibility of its commercialization.
3.4.2 Electric motors
Hyundai Kona 100% electric
Illustration 9. Hyundai kona datasheet

17
The model that heads Hyundai's electric models is the Kona, as all Japanese brands make a strong commitment to renewable energy. This model has a competitive autonomy with the gasoline models although its maximum speed is below the competitors.
BMW i3
Illustration 10. BMW i3 datasheet
Another of the most commercialized electric cars is the BMW i3. Germany is also one of the great nations that is committed to renewable energy and hydrogen technologies. BMW has also had to bet on clean energy. In this case the i3 in a hybrid car with limited autonomy.
Renault ZOE III
Illustration 11. Renault ZOE III datasheet

18
Renault was one of the first companies to launch an electric range. The commissioning of the Renault ZOE I dates from 2013. It is currently one of the most commercialized electric cars with great autonomy despite the maximum speed of 135km/h.
Nissan leaf
Illustration 12. Nissan leaf datasheet
The latest model is from the Nissan brand, the model is one-year-old. The autonomy of the vehicle is competitive despite a limited maximum speed.
3.4.3 Hydrogen vehicles
Toyota Mirai
Illustration 13. Toyota Mirai datasheet

19
Fuel cell cars are scarce, also due to a lack of infrastructure. Companies are the ones that use this technology the most for internal work. However, the Japanese brand Toyota is betting very strongly on hydrogen technology supported by the Japanese government, as it will be expanded in later points.
The Toyota Mirai has been on the market for many years, but it is rather a test, because the introduction of hydrogen stations is still in its initial phase.
Regarding its benefits, the maximum speed is higher than the average for cars powered by an electric battery. And its autonomy is similar.
Hyundai Nexo
In 2013 Hyundai released the first mass-produced fuel cell car Hyundai ix35 Fuel Cell (also called Tucson Fuel Cell). Currently still betting on this type of technology as the Hyundai Nexo.
Illustration 14. Hyundai Nexo datasheet
In this case it is a car powered by electric and hydrogen technology, with a top speed above the average of cars powered by electric batteries. And autonomy can compete with gasoline cars.
However, it is in large-scale transports where hydrogen has its highest performance.

20
Illustration 15. Hyundai Nexo engine
The image shows the Hyundai nexo engine, the hydrogen tanks are separated from the fuel cell, the water tank stores the waste produced in the cell.
3.4.3 Electric buses
Large vehicles get incredibly higher performance because their mobility is constant and they don't have to waste energy by pressurizing hydrogen while the vehicle is stopped. Furthermore, its large size allows large amounts of hydrogen to be stored, which is also positive due to the low density of hydrogen.
In addition to buses, hydrogen is planned to be incorporated into ships, which is even more advantageous for hydrogen technology.
Toyota Sora
Illustration 16. Toyota Sora Bus

21
The first fuel cell bus uses the FC Toyota Fuel Cell System. Created by Toyota, it is the bus selected for the next project and is developed later.
Nikola Tre
Illustration 17. Nikola Tre truck
The large truck powered by hydrogen. The brand first introduced the Nikola one which also had a lithium battery however since the European Union is interested in changing its power source for long distance transport. The Nikola brand is making trucks powered by hydrogen. The objective is to change the trucks that circulate in Europe for hydrogen trucks. In the signed in the agreement promoted by the EU "Hydrogen Europe", which is developed later, objectives are outlined in this regard.
3.5 Hydrogen stations
3.5.1 Infrastructure
Hydrogen is currently undergoing an expansion, similar to that experienced by lithium ion batteries in their beginnings. Faced with the advantages of fast charging and the greater autonomy provided by the fuel cell, it has a major drawback, the infrastructure.
As this is a main point of incorporation of hydrogen , the German website H2stations (https://www.h2stations.org/ ) provides periodic studies of the progress
of all hydrogen supply points in the world.
If there is to be substantial market penetration of hydrogen vehicles in the
transport sector, the introduction of commercial hydrogen vehicles and the
network of fuelling stations to supply them with hydrogen must take place
simultaneously.

22
It was found in 2013, there were 224 working hydrogen stations spread across 28 countries. About 43% of these stations were located in North and South America, 34% in Europe, 23% in Asia, and none in Australia .
Illustration 18. Hydrogen stations around the world by H2stations.org
In the world there are currently (2020) 369 hydrogen stations, 273 of public access that work as a conventional service station. The rest of the hydrogen stations work for individuals, to feed bus fleets or internal systems of any factory.
There are 152 hydrogen supply stations in Europe, 136 in Asia and 78 in North America. It is clear that Europe accumulates the largest number of hydrogen
supply stations.
Illustration 19. Hydrogen stations in Europe by H2stations.org

23
The reasons are simple, Europe imports much of the oil. To Spain it comes from Algeria while to the rest of Europe it comes from Russia. Therefore, if hydrogen were a viable energy source. Europe could build an energy system without depending on other powers.
Poland
In Poland there are two hydrogen stations planned to start operation in 2021, both from the LOTOS station company. One in Warsaw and a second hydrogen station in Gdansk, where the feasibility of incorporating a fleet of hydrogen buses is to be studied.
Spain
In Spain there are three active private access hydrogen stations. The first one is in Ciudad Real on the enclosure belonging to the National Hydrogen Center and energy that feeds the electrolyser is obtained by burning fossil fuels. Although it is private access, they allow refuelling by contacting the center. The second is located in Albacete in the business park of Ajusa, it can be considered public access, however it is mainly used to refuel the company's buses and is 40% Green hydrogen. The third is in Aragon, in the Aragon Hydrogen Foundation, where Green hydrogen is produced entirely, although less than 100kg/day the refuelling is not public, but it can be refilled by contacting the foundation.
3.5.2 Types of hydrogen stations
Two types of hydrogen stations can be differentiated according to the place of production of the hydrogen:
1. Hydrogen is produced elsewhere and taken to the hydrogen station.
2. Hydrogen is produced in the same place where it is supplied to vehicles. In this case, the hydrogen station must have the energy source, the electrolyzer
and a storage and distribution system.
Six main elements in hydrogen stations can be highlighted, if the energy sources
are not taken into account. (Illustration 20)
1. Receiving port, used to receive compressed or liquid hydrogen from a tank truck or pipeline.
2. A control system that manages the transfers and storage of hydrogen, including pneumatic valves, pumps, sensors and supervising the safety of the
general.
3. Heat exchangers to heat liquid hydrogen and change it to gas. To later be
compressed. System consisting of valves, pipes, gauges and pressure relief.

24
4. The compressor to compress hydrogen typically more than 350 or 700 bar for
high pressure storage.
5. A liquid hydrogen tank (delivered in liquid hydrogen), low pressure hydrogen storage tanks (after the conversion from liquid to gas), and high pressure
hydrogen storage tanks.
6. Dispensers which take high pressure hydrogen from the storage tanks, and fill the hydrogen tanks on board 350 or 700 bar Nozzle vehicles.
Illustration 20. Typical elements of a hydrogen fuelling station with hydrogen delivery
3.6 Hydrogen vs traditional fuels
3.6.1 Greenhouse effect
Currently, the use of fossil fuels is so widespread that there is speculation about a turning point in the history of ending this energy medium. And so much so that we continue to use them despite the known damage to the planet that they cause.
The greenhouse effect is one of many problems caused by the abusive consumption of fossil fuels, the greenhouse effect is produced by CO2, water vapour, CFCs ...
CO2 production has been increasing every year since 1890 the following table shows the world production of the main pollutants.

25
Table 2. Production of the mains pollutants 2014
Illustration 21. Main CO2 sources
Illustration 22. Percentage contribution provided by different greenhouse gases to the earth’s average temperature increment.

26
Recent studies have hypothesized how in the next 200-500 years, there will be a rise in sea level up to 3-4m. Furthermore, there will be an increase of 0.2-1.5m only in the next century. The graphs above show how the majority of CO2 is produced by the combustion of fossil fuels and that it is responsible for the greenhouse effect.
The paper “A technical and environmental comparison between hydrogen and some fossil fuels” says that hydrogen technology is already cheaper than any other type of traditional energy supply since it values the costs due to the social and environmental impact.
Table 3. Physics and chemical properties for safety consideration of three incestigated fuels
Table 4. Safety level reached in the combustion processes of gasoline, methane and hydrogen
Another important point of hydrogen compared to traditional energies is safety. It is worth remembering the fire test between gasoline and hydrogen that was exposed in previous section (3.2 Safety).
3.6.2 Fuel cell vs Hydrogen combustion
Taking all this into account, hydrogen has several possibilities of exploitation:
- The combustion of hydrogen as an energy source, despite the fact that it produces water vapour and NOx.

27
-Fuel cell fed with Hydrogen obtained by means of fossil fuels. This improves the treatment of waste, but continues to produce greenhouse gases (CO2).
-Fuel cell fed with green Hydrogen (Renewable Energies).
Currently, the use of hydrogen combustion is no longer valued because not only would it not improve the environmental characteristics of gasoline, it could worsen them.
Hydrogen combustion:
2𝐻2 + 𝑂2 + 𝑁2(𝑎𝑖𝑟) → 2𝐻2𝑂(𝑣𝑎𝑝𝑜𝑟) + 𝑁𝑂𝑥
The heat and pressure exerted by the piston excite the nitrogen molecules by making them react with oxygen.
The water in the vapor state disperses in the air favoring the greenhouse effect.
The reaction does not produce CO2
Fuel cell:
2𝐻2 + 𝑂2 → 2𝐻2𝑂(𝑙𝑖𝑞𝑢𝑖𝑑)
Does not produce CO2 emissions
Does not produce NOx
Furthermore, the efficiency of the fuel cell is higher (60%) compared to the combustion engine (25%)
On the other hand, feeding an electrolyzer with green hydrogen is always better from an ecological point of view. However, it would be quicker to implement hydrogen in today's society by starting by feeding electrolyzers with hydrogen produced from fossil fuels.
3.7 Disadvantages
Hydrogen is theoretically the future of energy, it can be stored in a liquid or gaseous state and does not emit greenhouse gases. The disadvantages that prevent its industrialization are the following.
The first point is to obtain hydrogen, for this it is necessary to resort to the electrolysis process of water that inevitably needs electrical energy. This energy can be obtained from non-renewable sources, but today it is still a more expensive process than using this energy directly.
In fact, depending on its origin it is classified as:
-Grey Hydrogen: from non-renewable sources
-Blue hydrogen: from non-renewable sources, but a post-treatment is performed to minimize emissions.

28
-Green hydrogen: from renewable sources.
Hydrogen is currently obtained mainly from non-renewable sources.
The second point hydrogen has a density of 0.071 g/L while gasoline 689 g/L at 1atm that implies a much higher necessary deposit in the case of a conventional car.
This leads to point three, the hydrological needs to be pressurized at all times. As a consequence, the tank of the car must be much thicker wall, which implies a greater volume of the car. And the hydrogen must be kept under pressure in the storage tank, which entails an energy expenditure for storage.
The fourth major drawback is the evident lack of incorporation of hydrogen in today's world. Multiplying hydrogen refueling points is a crucial point to direct a country towards hydrogen-based energy.
Fifth, the transportation and storage of hydrogen is relatively difficult since it must be kept at 350 or 700 bars. It can be transported long distances liquefied, but that involves an even higher energy expenditure.
Due to these drawbacks many derive. It can be said that hydrogen is much more efficient in public transport since they are constantly in operation.
4.Description of the project
The project to be carried out covers the technical design of a hydrogen production plant. Firstly, the construction of the photovoltaic plant, selection of components and sizing of installations. The selection and design of the electrolyser and the dimensioning of its production. The selection of buses and the design of service routes.
The objective is to create a fleet of public transport buses that can be operational for a minimum life of 30 years.
Regarding the location, two possibilities will be considered, since the present work is carried out in Poland by a Spanish exchange student. The viability of the facilities in Valencia (Spain) and Gdansk (Poland) will be compared and it will be concluded whether it is a real possibility to implement this system in any, one or both locations.

29
Illustration 23. Project scheme
5 Design
5 .1 Design of the solar plant
5.1.1 Introduction
Photovoltaic solar energy has become in recent years one of the priority sources of electricity generation in the fight to stop climate change. The reasons for its widespread use are several, one of the most important being the incredible cheaper prices of solar panels.
The first solar cell was manufactured in 1954 by Bell Telephone Laboratories (USA). Due to the high cost of energy produced by these cells 100€/kWh the technology was reserved for space applications. In 1975, thanks to a gradual reduction in costs, the technology acquired an almost competitive price and since then its development has been exponential.
The oil crises of 1973 and 1979 encouraged support for energy sources without fossil fuel origin. In 1985 the price of a barrel of oil stabilized, leading to a withdrawal of budgets for renewable energy. Starting in the year 2000, together with the development and significant reduction in cost of solar technology, many countries once again encouraged obtaining solar energy.

30
Illustration 24. Spanish Photovoltaic Union study of annual installed power
Illustration 25. Spanish Photovoltaic Union study of accumulated installed power
The panels are currently made of polycrystalline silicon and the energy efficiency produced by a unit of captured solar energy is limited. However, research in solar energy is moving steadily to improve this performance. The fields under investigation are monocrystals to avoid energy losses due to grain edges, and new materials such as lead perovskites that could achieve higher efficiencies.
I personally had the opportunity to work in the Elena Segura team at the Polytechnic University of Valencia (UPV) where they synthesized and characterized revolutionary materials for solar panels.

31
5.1.2 Selected solar panel
For the project, the BiHiKu Super high power bifacial poly perc module solar panel from the Canadian Solar brand has been chosen.
Illustration 26. BiHiKu solar panel datasheet
The panel is made of polycrystalline silicon and has dimensions of 1,048m and 2,132m.
Illustration 27. Electrical data of BiHiKu panel

32
The manufacturer provides us with a table of data prepared at Standard conditions (STC) of irradiance 1000 W/m2 under these conditions, a production per panel of 410-533W is obtained, this being an efficiency of 18.35-23.85%. This is not the production or efficiency of the panels due to we will have to study the production according to the influence of the sun. Since there will not be 100W/m2 of sunlight throughout the year. For this we will use PV-GIS in the next section.
The solar panel chosen is a standard plate from a widely used brand that has ISO9001 and ISO14001 certifications. This panel has not been chosen for its innovation since the present TFM focuses on the production of hydrogen.
5.1.3 Solar plant located in Valencia
Regarding the design of the solar plant, the PV-GIS program will be used for the simulation. This program is launched by the European Commission through the Joint Research Center with the aim of sharing data on solar irradiation (https://ec.europa.eu/jrc/en/pvgis ) The Joint Research Center (JRC) is the European
Commission's science and knowledge service which employs scientists to carry out research in order to provide independent scientific advice and support to EU policy.
The PV-GIS database has been operating across Europe for years and now also in the United States and countries around the world.
The data requested by PV-GIS for the installation are the following:
-The first location is Valencia
-The calculation will be made for a base installation of 100kW of installed power.
-System losses are estimated at 12%
-The price of the installation is considered € 8000 taking into account only the price of the plates € 80 x 100 units.
-It is considered an interest of 1% since only the maintenance of the equipment is considered.
-A life of the installation of 25 years.
Regarding the design of the solar plant, it is chosen to design a Free-standing, that is, the panels will be freely placed on the ground.
Despite the fact that the program provides a large number of data, it only allows knowing the monthly energy production, therefore, we will use the estimated production and divide it by the number of days to obtain the average daily production.
Table 5. PV-GIS Valencia information 100kW

33
The program considers that the inclination of the plates must be 35 degrees, it obtains the annual energy productions and the energy production variability. The table 5 also lists the losses of the equipment and the price of electricity, estimated from the price of the installation and the years of life of the equipment. 0.003 €/kWh compared to the usual electricity price in Spain 0.1216 €/kWh.
Illustration 28. Monthly energy output from fix-angle PV system, PV-GIS Valencia

34
Table 6. Outputs from PV-GIS Valencia
Where:
E_m: Average monthly electricity production from the given system [kWh].
H (i) _m: Average monthly sum of global irradiation per square meter received by the modules of the given system [kWh/m²].
SD_m: Standard deviation of the monthly electricity production due to year-to-year variation [kWh].
It can be extracted from the graph that December is the least productive month, so the options are to size the solar plant for the production of the worst month of the year and use the excess energy to pour it into the electricity grid. Or dimension the solar plant for a production of an intermediate point between the most productive month and the least. Using an alternative energy source for the months that the necessary energy quantity is not reached, and pouring the excess energy into the grid when this limit is exceeded.
5.1.4 Solar plant in Poland
The data requested by PV-GIS for the installation are the following:
-The second location is Gdansk
-The calculation will be made for a base installation of 100kW of installed power.
-System losses are estimated at 12%
-The price of the installation is considered 8000€ taking into account only the price of the panels 80€ x 100 units.
-It is considered an interest of 1% since only the maintenance of the equipment is considered.
-A life of the installation of 25 years.

35
Table 7. PV-GIS Gdansk information 100kW
The program considers that the inclination of the panels must be 40 degrees, it obtains the annual energy productions and the variability of energy production. The table also states the losses of the equipment and the price of electricity, estimated from the price of the installation and the years of life of the equipment 0.005 €/kWh compared to the price of normal light in Poland 0.691 zlt/kWh (0.17 €).
Illustration 29. Monthly energy output from fix-angle PV system. PV-GIS Gdansk

36
Table 8. Outputs from PV-GIS Gdansk
Where:
E_m: Average monthly electricity production from the given system [kWh].
H (i) _m: Average monthly sum of global irradiation per square meter received by the modules of the given system [kWh/m²].
SD_m: Standard deviation of the monthly electricity production due to year-to-year variation [kWh].
5.1.5 Spain-Poland comparison
The intention of comparing Spain and Poland is not to evaluate where it would be better to install the hydrogen plant and the bus fleet, but rather to justify that it is viable in both places.
Illustration 30. Comparation kWh produced in Gdansk(orange) and Valencia(blue) per 100 kWh installed
The graph makes evident what was supposed from the beginning. The solar plant in Valencia, Spain has a much higher production. However, although it reaches values higher than double in the case of the winter months, during the summer
0
2000
4000
6000
8000
10000
12000
14000
16000
18000
Jan Feb Mar Apr May Jun Jul Aug Sep Oct Nov Dic
PV
en
erfy
ou
tpu
t [k
Wh
]
Spain
Poland
37
months the production is more similar: in July Spain: 16810kWh and Poland 13153kWh.
5.1.6 Solar Plant Summary
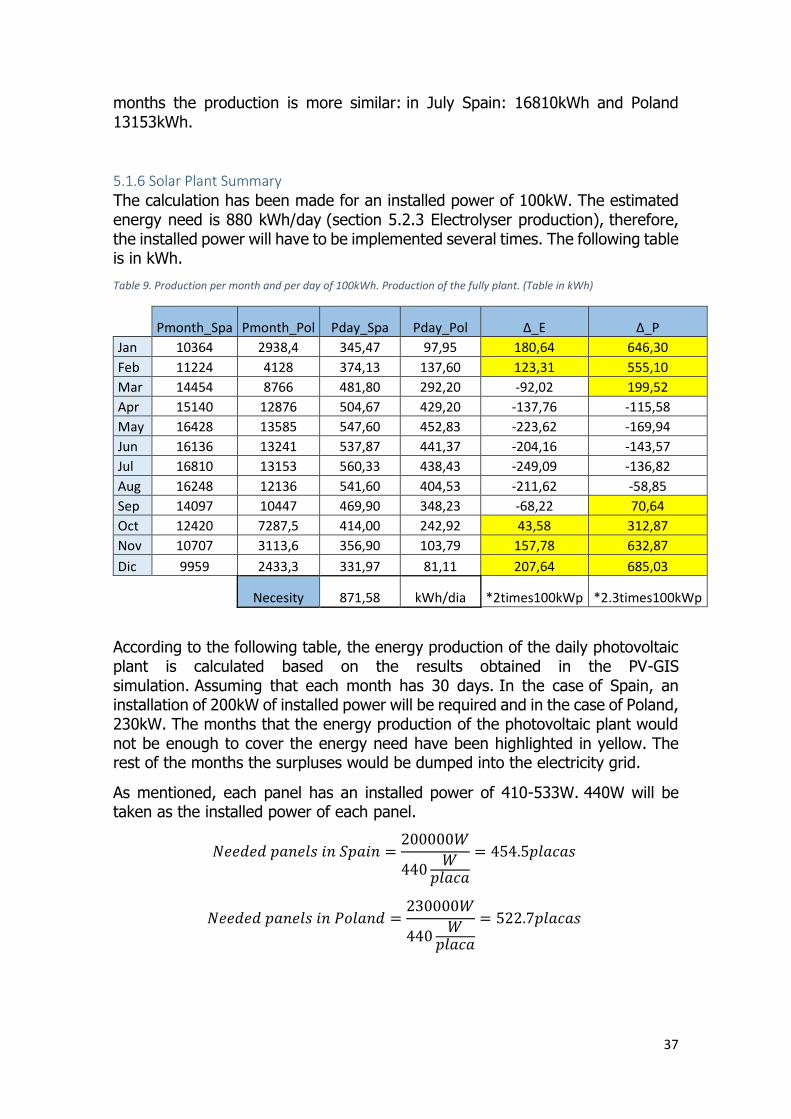
The calculation has been made for an installed power of 100kW. The estimated energy need is 880 kWh/day (section 5.2.3 Electrolyser production), therefore, the installed power will have to be implemented several times. The following table is in kWh.
Table 9. Production per month and per day of 100kWh. Production of the fully plant. (Table in kWh)
Pmonth_Spa Pmonth_Pol Pday_Spa Pday_Pol Δ_E Δ_P
Jan 10364 2938,4 345,47 97,95 180,64 646,30
Feb 11224 4128 374,13 137,60 123,31 555,10
Mar 14454 8766 481,80 292,20 -92,02 199,52
Apr 15140 12876 504,67 429,20 -137,76 -115,58
May 16428 13585 547,60 452,83 -223,62 -169,94
Jun 16136 13241 537,87 441,37 -204,16 -143,57
Jul 16810 13153 560,33 438,43 -249,09 -136,82
Aug 16248 12136 541,60 404,53 -211,62 -58,85
Sep 14097 10447 469,90 348,23 -68,22 70,64
Oct 12420 7287,5 414,00 242,92 43,58 312,87
Nov 10707 3113,6 356,90 103,79 157,78 632,87
Dic 9959 2433,3 331,97 81,11 207,64 685,03
Necesity 871,58 kWh/dia *2times100kWp *2.3times100kWp
According to the following table, the energy production of the daily photovoltaic plant is calculated based on the results obtained in the PV-GIS simulation. Assuming that each month has 30 days. In the case of Spain, an installation of 200kW of installed power will be required and in the case of Poland, 230kW. The months that the energy production of the photovoltaic plant would not be enough to cover the energy need have been highlighted in yellow. The rest of the months the surpluses would be dumped into the electricity grid.
As mentioned, each panel has an installed power of 410-533W. 440W will be taken as the installed power of each panel.
𝑁𝑒𝑒𝑑𝑒𝑑 𝑝𝑎𝑛𝑒𝑙𝑠 𝑖𝑛 𝑆𝑝𝑎𝑖𝑛 =200000𝑊
440𝑊
𝑝𝑙𝑎𝑐𝑎
= 454.5𝑝𝑙𝑎𝑐𝑎𝑠
𝑁𝑒𝑒𝑑𝑒𝑑 𝑝𝑎𝑛𝑒𝑙𝑠 𝑖𝑛 𝑃𝑜𝑙𝑎𝑛𝑑 =230000𝑊
440𝑊
𝑝𝑙𝑎𝑐𝑎
= 522.7𝑝𝑙𝑎𝑐𝑎𝑠

38
Each panel is 1,048m and 2,132m in size, requiring an extra half meter on each side.
𝑁𝑒𝑒𝑑𝑒𝑑 𝑎𝑟𝑒𝑎 𝑆𝑝𝑎𝑖𝑛 = ((1.048 + 1) ∗ (2.132 + 1)) ∗ 456 = 2924𝑚2
𝑁𝑒𝑒𝑑𝑒𝑑 𝑎𝑟𝑒𝑎 𝑃𝑜𝑙𝑎𝑛𝑑 = ((1.048 + 1) ∗ (2.132 + 1)) ∗ 523 = 3355𝑚2
In summary, the production of the photoelectric plant will be variable and will vary according to the previous table, the energy produced will serve to feed the electrolyser and produce hydrogen. The space requirements are those stated in the previous equations.
The average daily power of the plant each month will be as follows:
Table 10. Production of solar plant
Daily_Spa (kWh) Daily_Pol (kWh)
Jan 690.93 225.28
Feb 748.27 316.48
Sea 963.60 672.06
Apr 1009.33 987.16
may 1095.20 1,041.52
Jun 1075.73 1015.14
Jul 1,120.67 1008.40
Aug 1083.20 930.43
Sep 939.80 800.94
Oct 828.00 558.71
Nov 713.80 238.71
Dec 663.93 186.55
5.2 Design of the electrolyser
5.2.1 Introduction
The electrolysis of water is the decomposition of water (H2O) into oxygen (O2) and hydrogen (H2) gases by means of electric current. It has been described in previous sections.
The electrolysis of water, however, is not applied at industrial levels due to the low efficiency of hydrogen generators. A 100% efficient theoretical electrolyser would consume 32,966 kWh/kgH2, this value takes into account that the potential to overcome in the electrolyser is exactly the electrochemical potential of water E = 1.23V. However, in electrolysers we work with overpotential to offset losses.
In 2014 the efficiency ranges of electrolyzers are: 43-67% for alkalis and 40-67% for PEM, it is estimated that PEM type electrolyzers have a range of improvement with a shorter time frame and in 2030 they could have an efficiency of 62-74%.
The part that exceeds 1.23V is considered overpotential or overvoltage. The voltage at which the electrolyzers of this project have been designed is 3.153V. This implies an overvoltage of 3,153-1.23 = 1,923 V.

39
As already mentioned, the proton-conducting membrane must be Nafion®. This membrane works well because H+ jumps from SO3- to SO3 over the entire surface of the material. The conductivity of the membrane improves with increasing temperature, however it must be hydrated at all times, which limits the temperature below the boiling point of water. The Nafion® membrane would resist at a temperature of 125ºC.
Illustration 31. Nafion® structure
5.2.2 Selected Electrolyzer
An industrial electrolyser will be required for the plant. Taking into account the energy need 9kg of H2/day is needed. The selected electrolyser is the product code: 570254 from the brand: Proton onsite. The production of 20 Nm3/h will be selected.
Illustration 32. Selected electrolyser

40
Table 11. Electrolyser selected datasheet. Proton onsite 570254
Technical details Electrolyser
Nominal Production Rate
Nm3/h 0ºC 1bar 10 20 30
kg/24h 21,6 43 65
Power consumption by System 87,32 kWh/kg 84,5 kWh/kg 81,69 kWh/kg
Purity (%) 99,9998 99,9998 99,9998
O2 content <1ppm v <1ppm v <1ppm v
H2O content <2 ppm v <2 ppm v <2 ppm v
Dimensions
Electrolyser enclosure (m) 2,5 x 1,2 x2 2,5 x 1,2 x2 2,5 x 1,2 x2
Power supply enclosure(m) 17 x 1 x 2 17 x 1 x 2 17 x 1 x 2
Ambient temperature(ºC) 5-40ºC 5-40ºC 5-40ºC
Delivery pressure (bar) 30 30 30
Electrolyte PEM-Caustic Free PEM-Caustic Free PEM-Caustic Free
The C10 Hydrogen Generation System produces 10 Nm³/hr by utilizing Proton Exchange Membrane (PEM) cell stacks to produce ultra-high purity hydrogen for various applications like hydrogenation and energy storage. These generators achieve extreme purity and composition certainty with minimal maintenance.
Extra features include:
- Auto fill water level control
- Water monitoring system including purity monitor
- Automatic production control
- On board DI water system
- Factory Matched Cooler / Chiller
- Dew Point Meter
- Outdoor Operation Package
- Dedicated Data-logging computer
- Automatic H2 leak detection system
5.2.3 Production of the electrolyser
The selected electrolyzer produces 20 Nm3 /h taking into account the density of hydrogen at room temperature 0.71 g/L the system produces 1.42 kg/h. Since it is fed from a solar plant we can only count the hours of sunshine 8-10 h/day. Therefore, we will have a daily production of 11.36-14.2 kg of H2.
The electrolyser consumption is 84.5 kWh/kg, which means a total daily consumption of 959.92-1199.9 kWh

41
Illustration 33. Calculations of energy production per mol of hydrogen 100% efficiency
Illustration 34. Real. Electrolyser consumption

42
5 .2.4 Electrolyser Summary
Taking into account the previous section, summary of the solar plant, which determined the energy production of the daily solar plant, we evaluated the production of hydrogen according to the energy dosed to the electrolyser.
Table 12. Production of electrolyser Spain-Poland
Spa_kWh Pol_kWh Spa_kgH2 Pol_kgH2
Jan 690.93 225.28 8.18 2.67
Feb 748.27 316.48 8.86 3.75
Sea 963.60 672.06 11.40 7.95
Apr 1009.33 987.16 11.94 11.68
may 1095.20 1,041.52 12.96 12.33
Jun 1075.73 1015.14 12.73 12.01
Jul 1,120.67 1008.40 13.26 11.93
Aug 1083.20 930.43 12.82 11.01
Sep 939.80 800.94 11.12 9.48
Oct 828.00 558.71 9.80 6.61
Nov 713.80 238.71 8.45 2.82
Dec 663.93 186.55 7.86 2.21
In this way, if a 100km route were considered. According consumption of 9 kg/100km production exceeds in most months in Spain while in Poland although it also exceeds during the summer months, production is much lower during the winter months.
5 .3 Buses
5 .3.1 Background
Europe
The European Union approves a grant of 11 million of euros to the consortium of companies Nouryon and Gasunie an additional 5 million of euros invested by Waddenfonds, a Netherland fond. For the construction of a 20 MW green hydrogen electrolyser to be operated by the same consortium. With various partners involved, it is planned to produce 3,000 tons of green hydrogen annually.
Nouryon President Knut Schwalenberg said: “This project will be a springboard for the circular economy. With the support of the EU and the region and backed by an experienced technology provider and customer agreements, we are ready to move to the next phase of implementation of Europe's first large-scale hydrogen plant in support of a more sustainable future. ».
It is just one example of the support of the European Union

43
Pau (France)
On September 17, 2019, the first fleet of hydrogen buses was inaugurated in the city of Pau.
Under the name of “Fébus project” and almost as a pilot test for the imminent incorporation of hydrogen in Europe. The city of Pau has recently created the first fleet of hydrogen buses that also run through the city center.
The project includes 8 hydrogen refueling points. 8 buses of 18m in length and an electrolyser that will produce between 174-268 kg of hydrogen per day.
Regarding the Van Hool Exqui.City FC, the name of the hydrogen buses. Equipped with a 24 kWh traction battery and an 85 kW hydrogen fuel cell.
Keolis is the responsible company, in addition to this project Keolis is involved in a multitude of projects throughout Europe related to transport and renewable energy.
Note that buses are slated to run on green hydrogen from a solar plant near the bus station, however for the time being hydrogen is produced by burning fossil fuels.
Illustration 35. Febus Project city of Pau
FlixBus
The large transport company reaches an agreement with Freudenberg Sealing Technologies, based in Germany. To develop the first long-haul hydrogen buses.
André Schwämmlein, founder and CEO of FlixMobility (FlixBus), stated: "The modern FlixBus fleet is already extremely environmentally friendly and traveling

44
by long-distance bus saves around 80% of emissions compared to a car trip However, we are always looking for ways to make travel even more sustainable.”
Japan
The case of Japan is very particular. The Asian nation has spent years promoting hydrogen technology and it seems that from 2020 they were going to boom. Aiming to build the largest hydrogen distribution network in Japan. However, Japan's intention to boost hydrogen is almost a necessity. Japan is an island with few sources of hydrocarbons, being today the fourth largest importer of hydrocarbons. They are incredibly dependent on these imports, adding to the obvious rejection of nuclear energy due to the serious incident in Fukushima on March 11, 2011, Japan's need to find an alternative energy source is a priority for them. As if that were not enough, Japan uses two frequencies for electric current, the east uses 50 Hz and the west 60 Hz.
However, all of these disadvantages cause the government regardless of who is in power to work in the direction of energy development towards hydrogen.
In this context, Toyota, Nissan, Honda and eight other Japanese companies appear to sign an ambitious project for the incorporation of hydrogen energy in Japan. Signing as of 02/25/2017. Japan intended to have 100 buses operated by Toyota powered by fuel cells and incorporate 160 hydrogen stations across the country. In addition, Panasonic plans to install fuel cells as generators in all homes in the Olympic Village.
On the other hand, the Japanese company Kawasaki heavy industries also officially presented the Suiso Frontier boat on 12/12/2019. The ship is built for the transport of liquefied H2 from Australia-Japan. Australia has signed an agreement to provide a monthly supply of hydrogen to Japan. Hydrogen generated from the burning of lignite, carbon with 5.2% Hydrogen. In this way Japan begins to incorporate hydrogen technologies, cars and hydrogen stations long before building solar plants to produce green Hydrogen without having to go through the phase of obtaining Hydrogen from fossil fuels.
Illustration 36. Japan-Australia agreement to supply Hydrogen
The ship will transport the H2 at -253ºC and will be operational by the end of 2020.

45
Another Toshiba-led consortium opened the world's largest green hydrogen production facility on 02/10/2020 in Fukushima. The 20 MW solar plant powers a 10 MW electrolyser capable of producing up to 1200Nm3 per hour.
5 .3.2 Selected bus
Many are the automobile companies that are betting on the fuel cell for the future throughout this decade, it is planned that a large number of 5-seater models will be launched on the market. The same brands are also betting on larger cars like buses.
In the case of the Japanese brand Toyota, it has launched the Toyota Mirai 5-seater model, which has already been discussed in the introduction to the thesis. For large-scale transport, Toyota has presented the Toyota Sora Fuel Cell Bus, on the occasion of the Japanese Olympics and through the consortium signed by the Japanese multinational automobile companies, Toyota wants to incorporate 100 public transport line buses. This is the fuel cell powered bus that has been selected for the project.
The Sora bus system is the same that was originally designed for the Mirai, with 9 kW of power and 235 kWh of capacity. The fuel cell can be used as an external power source designed for disaster situations. The bus incorporates all kinds of cameras to support driving and also includes the acceleration control function that minimizes the jerkiness of the shocks of traditional buses. A hydride-nickel battery is attached to temporarily store the energy produced by the battery.
Illustration 37. Toyota Sora

46
Table 13. Toyota Sora Datasheet
Lenght (m) 10.5x2.5x3.3
Capacity 79
Fule Cell Toyota FC stack (Solid polymer electrolyte)
(kW) 2x114
H2 capacity (L) 600
Pressure (bar) 700
Consumption (khH2 / 100km) 9
Electric engine Synchronous CA
Max power (kW) 2x113
Max torque 2x335
5 .3.3 Bus Summary
Regarding the general project, the energy production of the solar plant and subsequent hydrogen production are finally compared with the capacity of the buses to operate with these productions.
Taking into account that the consumption of the electrolyzer is 84.5 kWh/kgH2
and the consumption of the buses 9 kg/100km. The following table lists the productions and daily mobility capacity of buses.
Table 14. Summary of production and travel capacity Spain-Poland
Spa_kWh Pol_kWh Spa_kgH2 Pol_kgH2 Bus_Spa (km) Bus_Pol (km)
Jan 690.93 225.28 8.18 2.67 90.85 29.62
Feb 748.27 316.48 8.86 3.75 98.39 41.61
Sea 963.60 672.06 11.40 7.95 126.71 88.37
Apr 1009.33 987.16 11.94 11.68 132.72 129.80
may 1095.20 1,041.52 12.96 12.33 144.01 136.95
Jun 1075.73 1015.14 12.73 12.01 141.45 133.48
Jul 1,120.67 1008.40 13.26 11.93 147.36 132.60
Aug 1083.20 930.43 12.82 11.01 142.43 122.34
Sep 939.80 800.94 11.12 9.48 123.58 105.32
Oct 828.00 558.71 9.80 6.61 108.88 73.47
Nov 713.80 238.71 8.45 2.82 93.86 31.39
Dec 663.93 186.55 7.86 2.21 87.30 24.53
Therefore, the number of km available per day for each month of the year is the one stated in the Bus_Spa and Bus_Pol column. Obviously a route with a safety margin will be designed.

47
5.4 Route design
5.4.1 route mileage
The routes of the buses have been the limiting dimension throughout the work and having selected diferent measures for the solar plant and the electrolyser in Spain and Poland. The following table therefore lists the total daily kilometers capable of being performed by the bus fleet.
Table 15. Travel capacity Spain-Poland
Bus_Spa
(km) Bus_Pol
(km)
Jan 90.85 29.62
Feb 98.39 41.61
Sea 126.71 88.37
Apr 132.72 129.80
may 144.01 136.95
Jun 141.45 133.48
Jul 147.36 132.60
Aug 142.43 122.34
Sep 123.58 105.32
Oct 108.88 73.47
Nov 93.86 31.39
Dec 87.30 24.53
5.4.2 Route in Valencia
The designed route is an example route that would depend on the location of the solar plant since it is the largest size requirement. In any other possible route designed it would be the same for the amount of mileage indicated.
The designed route is 5.8 km and covers the university areas of the city of Valencia, an expanding area and close to the beach.

48
Illustration 38. Valencian route
Relating the maximum possible km to perform, depending on the production of hydrogen. With the number of kilometers per lap, we obtain the number of daily laps that can be performed for each month of the year.
Table 16. Laps in valencian route
Bus_Spa(km) Laps
Jan 90,85 16
Feb 98,39 17
Mar 126,71 22
Apr 132,72 23
May 144,01 25
Jun 141,45 24
Jul 147,36 25
Aug 142,43 25
Sep 123,58 21
Oct 108,88 19
Nov 93,86 16
Dic 87,30 15
1 Route(km) 5,8
In Valencia a 5.8 km route is made. A maximum of 25 laps per day can be performed in the months of July and August, but only 15 laps per day can be performed during the month of December.

49
5.4.3 Gdansk route
The route in Poland is also an example route
In Gdansk the route very close to the city center has been carried out, which will contribute to the reduction of polluting emissions. In addition, it is known that one kilometer west of the route shown below is the LOTOS station that plans to build a hydrogen station, which could be useful in cases of need. The route is made up of 3.33 km.
Illustration 39. Gdansk route

50
Relating the total daily kilometers achievable with the number of kilometers of a lap, the daily laps are obtained. Listed in the table below.
Table 17. Laps Gdansk route
Bus_Pol (km) Routes
Jan 29.62 9
Feb 41.61 12
Sea 88.37 27
pr 129.80 39
may 136.95 41
Jun 133.48 40
Jul 132.60 40
Aug 122.34 37
Sep 105.32 32
Oct 73.47 22
Nov 31.39 9
Dec 24.53 7
1 Route (km) 3.33
In Gdansk, on a 3.33 km route, a maximum of 41 laps can be performed during the month of May and a minimum of 7 during the month of December.
5.4.4 Route summary
According to Google Maps, the estimated routes have a 15-minute car journey in the case of Spain, and 13 in the case of Poland. We assume that in public service this time triples 45 and 39 respectively. Therefore, maintaining the following two conditions:
Same service for 12h (8AM-8PM). Maximum wait time of 20 min.
Due to the frequency condition on the Spanish route, there must be a minimum of 3 buses always running simultaneously, on the Polish route 2. The number of laps to satisfy this service in one day would be:
Spain:
1
45𝑚𝑖𝑛𝑙𝑎𝑝
∗ 12ℎ ∗ 60𝑚𝑖𝑛
ℎ= 16 𝑙𝑎𝑝
Poland:
1
39𝑚𝑖𝑛𝑙𝑎𝑝
∗ 12ℎ ∗ 60𝑚𝑖𝑛
ℎ= 18.46 𝑙𝑎𝑝

51
The following table shows how many times the energy need exceeds the production. Marked in yellow when the need is not met:
Table 18. Aceptable laps
Spin_Spa Spin_Pol
Jan 16 9
Feb 17 12
Mar 22 27
Apr 23 39
May 25 41
Jun 24 40
Jul 25 40
Aug 25 37
Sep 21 32
Oct 19 22
Nov 16 9
Dic 15 7
So in the case of Spain, the energy need would only be breached in December. In the case of Poland in almost all winter months, but it would also have a very large energy surplus in summer.
The solutions have already been discussed during the thesis, but expanding these solutions.
Use hydrocarbons to produce hydrogen and supply energy deficiencies. Redesign routes to increase service in months when there is leave. Minimize services in the months that the energy need is not reached.
6. Conclusions
6.1 Spain-Poland comparison
Regarding the installation of hydrogen production plants in the selected locations, there are many highlights.
Spain and Poland are two of the European countries with the fewest hydrogen stations, and where this European development towards hydrogen technologies is least evident. Despite the climatic differences in both locations, it is feasible and beneficial to install these hydrogen technologies.
The comparison during the work has been carried out for a solar plant that exceeded by 0.3 times the installed base power in the Spanish solar plant. For a base power of 100 kWh equal in both plants, the production of hydrogen would be as follows:

52
Table 19. Comparation 100kWh Spain-Poland
Pday_Spa Pday_Pol Spa_kgH2 Pol_kgH2
Jan 345.47 97.95 4.09 1.16
Feb 374.13 137.60 4.43 1.63
Sea 481.80 292.20 5.70 3.46
Apr 504.67 429.20 5.97 5.08
may 547.60 452.83 6.48 5.36
Jun 537.87 441.37 6.37 5.22
Jul 560.33 438.43 6.63 5.19
Aug 541.60 404.53 6.41 4.79
Sep 469.90 348.23 5.56 4.12
Oct 414.00 242.92 4.90 2.87
Nov 356.90 103.79 4.22 1.23
Dec 331.97 81.11 3.93 0.96
As can be seen from the table, although there is an obvious difference, it becomes less evident during the summer months.
6.2 Conclusions
6.2.1 Cost reduction
In the first place, it is concluded that, in view of the research carried out and as a crucial part of the present thesis. Hydrogen is an expanding technology that many countries are highly interested in incorporating, especially to achieve energy independence from the countries that supply them. "Hydrogen Europe" in Europe, "Hydrogen council" in Japan. From these powers, research into hydrogen technologies is promoted.
In wich case one of the crucial points is the reduction of hydrogen costs. For this, "Hydrogen council" publishes in 2020 the following review. In which he studies the reduction of hydrogen costs. The paper independently studies the cost reduction of the parties involved in the production and distribution of hydrogen.
Hydrogen production
Hydrogen distribution
Equipment CapEx (CapEx, are funds used by a company to acquire, upgrade, and maintain physical assets such as property).
Other operating expenses

53
Illustration 40. Annex10 Hydrogen council report cost reduction provided
Similarly, the study emphasizes the great scope for improvement of hydrogen technologies.
6.2.2 Research
Among all the research plans in the improvement of hydrogen technology, the most notable is the investigation of the catalyst, currently platinum is used. The high cost of this makes hydrogen technology more expensive.
On the other hand, the current transportation system focuses on single-family transportation, which makes transportation more expensive. Hydrogen works more efficiently in transport of large dimensions and in constant movement. Therefore, on the way to green cities, 100% powered by renewable energy, one of the tasks of each nation's policies is to promote a public transport system to the detriment of single-family cars.
One of the great advantages of fuel cell against electric batteries is the load quickly. It can take an average of five minutes for a deposit to fully charge. A time similar to gasoline, whereas now industrialized electric cars can take hours.

54
6.2.3 Conclusion
By way of final conclusion, hydrogen technology is novel and environmentally friendly. It is the perfect candidate to supply all fossil fuels, especially in the field of transport, possibly excluding aircraft.
The technology is already present, so much so that governments are strongly committed to this technology. However, drawing a roadmap to hydrogen technologies is insufficient, it will not be the first roadmap that disappears over time. Governments, countries and society in general must become increasingly aware of the importance of drawing up a plan that makes our energy supply sustainable.
Fuel cells are just a tool and it is up to us to make it happen.
7. Bibliography
ANNEX I - Hydrogen calculations
ANNEX II - Solar simulation in Gdansk
ANNEX III - Solar simulation in Valencia
ANNEX IV - Solar energy study- Solar energy Institute (Spain)
APPENDIX V - Solar panel. Canadian bihiku
ANNEX VI - Standard consumption of hydrogen buses
ANNEX VII - Opening hydrogen buses in Pau
ANNEX VIII - Excel data
ANNEX IX - Hydrogen Europe roadmap
APPENDIX X- Hydrogen council report
ANNEX XI - Hydrogen safety sheet
- On the Gas Voltaic Battery (1839) WR Grove
- Polymer Electrolyte Membrane Fuel Cells ( 2011 ) , Juan Antonio Asensio, Juan Peña, Domingo Pérez-Coll, Juan Carlos RuizMorales, David Marrero-Lopez, Pedro Nuñez, Belén Ballesteros, Jesús C anales-Vazquez, Salvador Borrós and Pedro Gómez-Romero .
- Electrocatalysts for the generation of hydrogen, oxygen and synthesis gas ( 2016 ) , Foteini M. Sapountzi , Jose M. Gracia b, CJ (Kees-Jan) Weststrate a, Hans OA Fredriksson a, JW (Hans) Niemantsverdriet .
- A technical and environmental comparison between hydrogen and some fossil fuels ( 2014 ) , - Giovanni Nicoletti , Natale Arcuri, Gerardo Nicoletti, Roberto Bruno .
- Infrastructure investment for a transition to hydrogen automobiles ( 2009 ) , Jonatha n Köhler , Martin Wie tschel, Lorraine Whitmarsh , D ogan Keles, Wolfgang Schade.

55
- Expo Zaragoza ( 2008 ) , "HIDROGENERA EXPO" FILE NO .: DC-S-555/07 .
- Automotive hydrogen fueling stations: An international review ( 2015 ) , Jasem Alazemia , John A ndrewsa.
- Report an ual (2015) - Union Spanish Forovoltaica (UNEF)
https://www.motorpasionmoto.com/tecnologia/la-moto-de-hidrogeno-esta-aun-mas-cerca-de-ser-real-se-ha-filtrado-una-segunda-patente-de-honda
https://www.abc.es/motor/novedades/abci-apuesta-coche-hidrogeno-cero-emisiones-201909101412_noticia.html
https://www.hydrogenics.com/about-the-company/who-we-are/
https://en.investing.com/equities/hydrogenics-corp-company-profile
https://www.coches.net/nuevo-hyundai-nex
https://www.energy.gov/eere/fuelcells/hydrogen-fuel-basics
http://www.aeh2.org/
https://www.mdpi.com/2076-3417/9/20/4461/htm
https://www.upv.es/titlaciones/MUGC/info/820105normalc.html
http://www.aficionadosalamecanica.net/motores-hidrogeno.htm
https://www.pv-magazine.es/2019/08/07/el-papel-del-hidrogeno-en-la-carrera-espacial-y-en-la-transicion-energetica/
https://www.hydrogen-pro.com/copy-of-products
https://es.slideshare.net/betsaberuffner/reacciones-redox-en-agua
https://www.fuelcellstore.com/hydrogen-equipment/hydrogen-production-electrolyzers
https://www.hibridosyelectricos.com/articulo/actualidad/toyota-sora-100-autobuses-hidrogeno-juegos-olimpicos-tokio/20180403103045018542.html
https://www.auto-data.net/en/bmw-i3-18.8-kwh-170hp-range-extender-19683
https://www.motorpasion.com/coches-hibridos-alternativos/este-mapa-que-explica-que-japon-alemania-coche-hidrogeno-realidad-viable
https://www.comsol.com/blogs/pem-fuel-cell-modeling-examples/
https://movilidadelectrica.com/autobuses-de-hidrogeno-francia/
https://elperiodicodelaenergia.com/la-ue-respalda-el-esquema-holandes-de-hidrogeno-verde/
https://www.hosteltur.com/132674_flixbus-planea-los-primeros-autobuses-de-hidrogeno-de-largo-radio-en-europa.html
https://www.autopista.es/noticias-motor/articulo/hidrogeneras-japon-honda-nissan-toyota
https://elperiodicodelaenergia.com/un-consorcio-japones-pone-en-marcha-la-planta-de-hidrogeno-verde-mas-grande-del-mundo-en-fukushima/
http://www.lotos.pl/en/1031/p,695,n.4815/lotos_group/press_centre/news/another_lotos_project_with_eu_funding

56
https://h2tools.org/bestpractices/hydrogen-compared-other-fuels
https://hydrogeneurope.eu/
https://h2-map.eu/