FTSE MONTHLY REPORT - July 2017 FTSE BURSA MALAYSIA · PDF fileHengyuan Refining Company had...
38
FTSE BURSA MALAYSIA INDEX SERIES INTRODUCTION FTSE BURSA MALAYSIA INDEX SERIES COMMENTARY Source: FTSE Russell 1 of 38 Hengyuan Refining Company had the strongest performance in the FTSE Bursa Malaysia EMAS Index, up 48.3 per cent, with Genting Malaysia being the best performing FTSE Bursa Malaysia KLCI constituent, up 9.09 per cent. FTSE Bursa Malaysia KLCI 1760.03 -3.64 -0.21% ▼ The FTSE Bursa Malaysia KLCI ended the month in negative territory in July down 0.21 per cent, underperforming the FTSE ASEAN 40 Index by 1.89 per cent. India was the best performing Asian market this month with the FTSE India Index seeing a rise of 7.18 per cent in July. The second best performing Asian market was China, with the FTSE China 50 Index, up 5.75 per cent. Pakistan was the worst performer, with the FTSE Pakistan Index falling 0.95 per cent. The FTSE All-World Index was up 2.32 per cent. Within the size segments of the Malaysian market, Large Cap companies had the best performance with the FTSE Bursa Malaysia KLCI down 0.21 per cent, followed by Mid Cap companies seeing a decrease of 0.68 per cent in July. Fledgling companies were the worst performers. The FTSE Bursa Malaysia EMAS Index had a performance of -0.37 per cent. Technology Hardware & Equipment was the best performing sector in the FTSE Bursa Malaysia EMAS Index, up 10.94 per cent, followed by Automobiles & Parts companies, up 5.29 per cent. The Aerospace & Defense, and Leisure Goods sectors had the worst performance in July, down 5.76 and 5.16 per cent respectively. FTSE MONTHLY REPORT - July 2017 FTSE BURSA MALAYSIA INDEX SERIES Data as at: 31 July 2017 TABLE OF CONTENTS Introduction & Index Series Overview FTSE Bursa Malaysia KLCI FTSE Bursa Malaysia EMAS Index FTSE Bursa Malaysia Mid 70 Index FTSE Bursa Malaysia Top 100 Index FTSE Bursa Malaysia Small Cap Index FTSE Bursa Malaysia Fledgling Index FTSE Bursa Malaysia EMAS Shariah Index FTSE Bursa Malaysia Small Cap Shariah Index FTSE Bursa Malaysia Hijrah Shariah Index FTSE4Good Bursa Malaysia Index FTSE Bursa Malaysia Palm Oil Plantation Index FTSE Bursa Malaysia ACE Index FTSE Bursa Malaysia Asian Palm Oil Plantation Index - USD FTSE Bursa Malaysia MidS Cap Index FTSE Bursa Malaysia MidS Cap Shariah Index 1 5 9 13 15 17 19 21 23 25 27 29 31 33 35 37 FEATURES Objective Indices in the FTSE Bursa Malaysia Index Series are designed for the creation of index tracking funds, derivatives, Exchange Traded Funds (ETFs), and as performance benchmarks. Coverage The FTSE Bursa Malaysia Index Series includes ICB industry, supersector and sector indices and indices representing large cap, mid cap, small cap, fledgling and ACE constituents. Transparency Freely available index rules are overseen by an independent committee of leading market professionals. Design The indices have been designed for both domestic and international investors who want to see global standards applied to the selection and maintenance of companies. Investability Stocks are free-float weighted to ensure that only the investable opportunity set is included within the indices. FTSE Group has partnered with Bursa Malaysia to create the definitive family of indices for the Malaysian market - the FTSE Bursa Malaysia Index Series. The FTSE Bursa Malaysia Index Series is designed to represent the performance of companies, providing investors with a comprehensive and complementary set of indices, which measure the performance of the major size and industry segments of the Malaysian and regional market. All Malaysian companies listed on Bursa Malaysia's Main Market and ACE Market are eligible for inclusion, subject to passing the FTSE international standards of liquidity and investability. The series divides the market into size segments (Large cap, Mid cap, Small cap and Fledgling), and includes Shariah-compliant indices, as well as themed indices representing the palm oil plantation sector. 1-Month MYR Performance (%) Source: FTSE Russell - price return data in MYR, as at 31 July 2017 Source: FTSE Russell - price return data in MYR, as at 31 July 2017 FTSE BURSA MALAYSIA KLCI Bloomberg Reuters <.FTFBMKLCI> Factset FBMKLCI.LOC-FTX BBG000MCZT51 Telekurs TK549389 2.32 1.68 -0.23 1.78 2.16 -0.20 4.39 -2.0 - 2.0 4.0 6.0 STI FTSE Indonesia Index FTSE SET Large Cap Index FTSE Philippines Index FTSE Vietnam Index FTSE ASEAN 40 Index FTSE All-World Index 1-Month Performance of Selected FTSE Indices 0.30 -2.45 -1.05 -1.93 -0.82 -1.84 -0.37 -0.97 -0.32 -0.68 -0.21 -1.06 -1.84 -3.0 -2.0 -1.0 - 1.0 1-Month MYR Performance (%) FTSE Bursa Malaysia KLCI FTSE Bursa Malaysia Mid 70 Index FTSE Bursa Malaysia Top 100 Index FTSE Bursa Malaysia Small Cap Index FTSE Bursa Malaysia EMAS Index FTSE Bursa Malaysia Fledgling Index FTSE Bursa Malaysia EMAS Shariah Index FTSE Bursa Malaysia Hijrah Shariah Index FTSE Bursa Malaysia Palm Oil Plantation Index FTSE Bursa Malaysia Asian Palm Oil Plantation Index - USD 1-Month Performance of the FTSE Bursa Malaysia Index Series FTSE Bursa Malaysia Small Cap Shariah Index FTSE Bursa Malaysia MidS Cap Shariah Index FTSE Bursa Malaysia MidS Cap Index
Transcript of FTSE MONTHLY REPORT - July 2017 FTSE BURSA MALAYSIA · PDF fileHengyuan Refining Company had...

FTSE BURSA MALAYSIA INDEX SERIES INTRODUCTION
FTSE BURSA MALAYSIA INDEX SERIES COMMENTARY
Source: FTSE Russell 1 of 38
Hengyuan Refining Company had the strongest performance in the FTSE Bursa Malaysia EMAS Index, up 48.3 percent, with Genting Malaysia being the best performing FTSE Bursa Malaysia KLCI constituent, up 9.09 per cent.
FTSE Bursa Malaysia KLCI 1760.03 -3.64 -0.21% ▼
The FTSE Bursa Malaysia KLCI ended the month in negative territory in July down 0.21 per cent, underperformingthe FTSE ASEAN 40 Index by 1.89 per cent.
India was the best performing Asianmarket this month with the FTSE IndiaIndex seeing a rise of 7.18 per cent inJuly. The second best performingAsian market was China, with the FTSEChina 50 Index, up 5.75 per cent.Pakistan was the worst performer, withthe FTSE Pakistan Index falling 0.95per cent. The FTSE All-World Indexwas up 2.32 per cent.
Within the size segments of the Malaysian market, Large Cap companies had the best performance with the FTSEBursa Malaysia KLCI down 0.21 per cent, followed by Mid Cap companies seeing a decrease of 0.68 per cent in July.Fledgling companies were the worst performers. The FTSE Bursa Malaysia EMAS Index had a performance of -0.37per cent.
Technology Hardware & Equipment wasthe best performing sector in the FTSEBursa Malaysia EMAS Index, up 10.94per cent, followed by Automobiles &Parts companies, up 5.29 per cent. TheAerospace & Defense, and LeisureGoods sectors had the worstperformance in July, down 5.76 and5.16 per cent respectively.
FTSE MONTHLY REPORT - July 2017
FTSE BURSA MALAYSIA INDEX SERIES Data as at: 31 July 2017TABLE OF CONTENTS Introduction & Index Series Overview
FTSE Bursa Malaysia KLCI
FTSE Bursa Malaysia EMAS Index
FTSE Bursa Malaysia Mid 70 Index
FTSE Bursa Malaysia Top 100 Index
FTSE Bursa Malaysia Small Cap Index
FTSE Bursa Malaysia Fledgling Index
FTSE Bursa Malaysia EMAS Shariah Index
FTSE Bursa Malaysia Small Cap Shariah Index
FTSE Bursa Malaysia Hijrah Shariah Index
FTSE4Good Bursa Malaysia Index
FTSE Bursa Malaysia Palm Oil Plantation Index
FTSE Bursa Malaysia ACE Index
FTSE Bursa Malaysia Asian Palm Oil Plantation
Index - USD
FTSE Bursa Malaysia MidS Cap Index
FTSE Bursa Malaysia MidS Cap Shariah Index
1
5
9
13
15
17
19
21
23
25
27
29
31
33
35
37
FEATURES
Objective
Indices in the FTSE Bursa Malaysia Index
Series are designed for the creation of
index tracking funds, derivatives,
Exchange Traded Funds (ETFs), and as
performance benchmarks.
Coverage
The FTSE Bursa Malaysia Index Series
includes ICB industry, supersector and
sector indices and indices representing
large cap, mid cap, small cap, fledgling
and ACE constituents.
Transparency
Freely available index rules are overseen
by an independent committee of leading
market professionals.
Design
The indices have been designed for both
domestic and international investors who
want to see global standards applied to
the selection and maintenance of
companies.
Investability
Stocks are free-float weighted to ensure
that only the investable opportunity set is
included within the indices.
FTSE Group has partnered with Bursa Malaysia to create the definitive family of indices for the Malaysian market - the
FTSE Bursa Malaysia Index Series. The FTSE Bursa Malaysia Index Series is designed to represent the performance of
companies, providing investors with a comprehensive and complementary set of indices, which measure the
performance of the major size and industry segments of the Malaysian and regional market. All Malaysian companies
listed on Bursa Malaysia's Main Market and ACE Market are eligible for inclusion, subject to passing the FTSE
international standards of liquidity and investability.
The series divides the market into size segments (Large cap, Mid cap, Small cap and Fledgling), and includes
Shariah-compliant indices, as well as themed indices representing the palm oil plantation sector.
1-Month MYR Performance (%)
Source: FTSE Russell - price return data in MYR, as at 31 July 2017
Source: FTSE Russell - price return data in MYR, as at 31 July 2017 FTSE BURSA MALAYSIA KLCI
Bloomberg
Reuters <.FTFBMKLCI>
Factset FBMKLCI.LOC-FTX
BBG000MCZT51
Telekurs TK549389
2.32 1.68
-0.23 1.78
2.16 -0.20
4.39
-2.0 - 2.0 4.0 6.0
STI FTSE Indonesia Index
FTSE SET Large Cap Index FTSE Philippines Index
FTSE Vietnam Index FTSE ASEAN 40 Index FTSE All-World Index
1-Month Performance of Selected FTSE Indices
0.30 -2.45
-1.05 -1.93
-0.82 -1.84
-0.37 -0.97
-0.32 -0.68
-0.21 -1.06
-1.84
-3.0 -2.0 -1.0 - 1.0
1-Month MYR Performance (%)
FTSE Bursa Malaysia KLCI
FTSE Bursa Malaysia Mid 70 Index
FTSE Bursa Malaysia Top 100 Index
FTSE Bursa Malaysia Small Cap Index
FTSE Bursa Malaysia EMAS Index
FTSE Bursa Malaysia Fledgling Index
FTSE Bursa Malaysia EMAS Shariah Index
FTSE Bursa Malaysia Hijrah Shariah Index
FTSE Bursa Malaysia Palm Oil Plantation Index
FTSE Bursa Malaysia Asian Palm Oil Plantation Index - USD
1-Month Performance of the FTSE Bursa Malaysia Index Series
FTSE Bursa Malaysia Small Cap Shariah Index
FTSE Bursa Malaysia MidS Cap Shariah Index
FTSE Bursa Malaysia MidS Cap Index
FTSE BURSA MALAYSIA INDEX SERIES
Source: FTSE Russell 2 of 38
Data as at: 31 July 2017FTSE Bursa Malaysia Index Series
SAC
scre
enin
g
Hij
rah
Shar
iah
EMA
S Sh
aria
h /
Smal
l Cap
Sha
riah
/ M
idS
Cap
Sha
riah
Pal
m O
il P
lant
atio
n
Top 98% of Asia Pacific ex
Japan, Australia &
New Zealand Universe
Main Market
98%
Large Cap (KLCI)
Mid Cap (Mid 70)
Small Cap
Fledgling
EMA
S
Indu
stry
Ind
ices
Top
100
Asi
an P
alm
Oil
Pla
ntat
ion
(MY
R &
USD
)
Screen on Palm Oil Related Activities
AC
E
SAC
scre
enin
g &
Ya
saar
scr
eeni
ng
The following indices are included in the FTSE Bursa Malaysia Index Series:
FTSE Bursa Malaysia KLCI This index comprises the largest 30 companies by full market capitalisation that meet stated eligibility requirements.
FTSE Bursa Malaysia Mid 70 Index This index comprises the next 70 companies by full market capitalisation that meet stated eligibility requirements.
FTSE Bursa Malaysia Top 100 Index This index comprises the constituents of the FTSE Bursa Malaysia KLCI and the FTSE Bursa Malaysia Mid 70 Index.
FTSE Bursa Malaysia Small Cap Index This index comprises those eligible companies within the top 98% of the Main Market by full market capitalisation and meet stated eligibility requirements, but are not constituents of the FTSE Bursa Malaysia Top 100 Index.
FTSE Bursa Malaysia EMAS Index This index comprises the constituents of the FTSE Bursa Malaysia Top 100 Index and the FTSE Bursa Malaysia Small Cap Index.
FTSE Bursa Malaysia EMAS Industry Indices The indices comprises the constituents of the FTSE Bursa Malaysia EMAS Index categorised into 10 Industry, 19 Supersector and 39 Sector Indices. These industries, supersectors and sectors are defined in the Industry Classification Benchmark (ICB).
FTSE Bursa Malaysia Fledgling Index This index comprises the Main Market companies which meet stated eligibility requirements, but are not in the top 98% by full market capitalisation and are not constituents of the FTSE Bursa Malaysia EMAS Index.
FTSE Bursa Malaysia EMAS Index / FTSE Bursa Malaysia Small Cap Shariah Index / FTSE Bursa Malaysia MidS Cap Shariah Index These indices comprise the constituents of the FTSE Bursa Malaysia EMAS Index / FTSE Bursa Malaysia Small Cap Index / FTSE Bursa Malaysia MidS Cap Index that are Shariah compliant according to the Securities Commission’s Shariah Advisory Council (SAC) screening methodology.
FTSE Bursa Malaysia Hijrah Shariah Index This index comprises the largest 30 companies by full market capitalisation of the FTSE Bursa Malaysia EMAS Index that are in compliance with Yasaar and the Securities Commission’s SAC screening methodology.
FTSE Bursa Malaysia Palm Oil Plantation Index This index comprises the constituents of the FTSE Bursa Malaysia EMAS Index that derive substantial revenue from palm oil activities that meet the stated eligibility requirements.
FTSE Bursa Malaysia Asian Palm Oil Plantation Index (MYR & USD) This index comprises the companies from the universes of developed, advanced emerging and secondary emerging countries as classified by FTSE in the Asia Pacific region excluding Japan, Australia and New Zealand that derive substantial revenue from palm oil activities. Constituents are required to meet the eligibility requirements.
FTSE Bursa Malaysia ACE Index This index comprises all the companies listed on the ACE Market. Constituents are required to meet the eligibility requirements.
FTSE Bursa Malaysia MidS Cap Index This index comprises those eligible companies with full market capitalisation between 200 million and 2 billion MYR and meet stated eligibility requirements.
INDUSTRY CLASSIFICATION BENCHMARK (ICB) The indices are calculated in accordance with the Industry Classification Benchmark (ICB), the global standard for industry sector analysis The ICB contains four classification levels: Industries (x10), Supersectors (x19), Sectors (x41) and Subsectors (x114) Global presence - ICB is adopted by stock exchanges representing over 65% of the world’s market capitalisation
INFORMATION
Index Universe Bursa Malaysia Main Market & ACE Market
Index Launch FTSE Bursa Malaysia Index Series - 26 June 2006
FTSE Bursa Malaysia EMAS Shariah Index - 22 January 2007 FTSE Bursa Malaysia Hijrah Shariah Index - 21 May 2007 FTSE Bursa Malaysia Palm Oil Plantation Index - 18 May 2009 FTSE Bursa Malaysia Asian Palm Oil Plantation Index (MYR & USD) - 18 May 2009
FTSE Bursa Malaysia ACE Index - 10 September 2007
Base Date FTSE Bursa Malaysia KLCI
- 1 January 1977 Other FTSE Bursa Malaysia Indices - 31 March 2006
Base Value FTSE Bursa Malaysia KLCI - 100
Other FTSE Bursa Malaysia Indices - 6000
Index Calculation Real-time and end-of-day indices available. FTSE Bursa Malaysia EMAS Industry Indices - end-of-day only Real-time indices are calculated at the following intervals: FTSE Bursa Malaysia KLCI - every 15 seconds
FTSE Bursa Malaysia EMAS Index - every 60 seconds
End-of-Day Distribution Via FTP and email
Currency MYR, EUR, GBP, USD, JPY
Review Dates Semi-annually in June and December
Index Rules Available at www.ftse.com/products/indices/bursa-malaysia
Vendor Codes See page 4 or contact [email protected]
Historical Data Available from January 1995
Mid
S C
ap

INDEX METHODOLOGY OVERVIEW
Source: FTSE Russell 3 of 38
FTSE Bursa Malaysia Index Series Data as at: 31 July 2017
Eligible Securities
All classes of the ordinary shares in issue are eligible for inclusion in the FTSE Bursa Malaysia Index Series, subject to conforming to all other rules of eligibility, free float and liquidity.
Index Review
The FTSE Bursa Malaysia Index Series is reviewed on a semi-annual basis in June and December using data on the Monday four weeks prior to the review effective date. The semi-annual review will be implemented after the close of business on the third Friday in June and December.
New Issues
If a new issue is so large (i.e. its full market capitalisation amounts to 2% or more of the full capitalisation of the FTSE Bursa Malaysia EMAS Index, before the application of individual constituent investability weightings) that the effectiveness of the index as a market indicator would be significantly and adversely affected by its omission, the new issue will be included as a constituent of the FTSE Bursa Malaysia KLCI and the remaining FTSE Bursa Malaysia Indices that it qualifies for after the close of business on the fifth day of official trading. In all cases, advance notification confirming the timing of the inclusion of the new constituent will be given accordingly. Constituent Selection Inclusion Screens
A company will be inserted at the periodic review if it rises above the position stated below for the relevant index when the eligible Main Market securities for each FTSE Bursa Malaysia Index are ranked by full market capitalisation, i.e. before the adjustment of free float:
FTSE Bursa Malaysia KLCI - Risen to 25th or above FTSE Bursa Malaysia Mid 70 Index - Risen to 85th or above FTSE Bursa Malaysia Hijrah Shariah Index - Risen to 25th or above
A company will be deleted at the periodic review if it falls below the position stated below for the relevant index when the eligible Main Market securities for each FTSE Bursa Malaysia Index are ranked by full market capitalisation, i.e. before the adjustment of free float:
FTSE Bursa Malaysia KLCI - Fallen to 36th or below FTSE Bursa Malaysia Mid 70 Index - Fallen to 116th or below FTSE Bursa Malaysia Hijrah Shariah Index - Fallen to 36th or below
For the FTSE Bursa Malaysia MidS Cap Index and the FTSE Bursa Malaysia MidS Cap Index, a company will be deleted at the periodict review if its full market capitaliszation has fallen to MYR 180 million or below or has risen to more than MYR 2.2 billion or above.
Liquidity Screen
The semi-annual liquidity screen applies to all indices in the FTSE Bursa Malaysia Index Series (except for the FTSE Bursa Malaysia Fledgling Index and the FTSE Bursa Malaysia ACE Index). Each security will be tested for liquidity by calculation of its median daily trading per month. The median trade is calculated by ranking each daily trade total and selecting the middle ranking day. Daily totals with zero trades are also included in the ranking; therefore a security that fails to trade for more than half of the days in a month will have a zero median trade. ● Non-constituents which do not turnover at least 0.05% of their shares in issue (after the application of any investability
weightings) based on their median daily trade per month for at least ten of the twelve months prior to the semi-annual review, will not be eligible for inclusion in the Index.
● An existing constituent which does not turnover at least 0.04% of its shares in issue (after the application of any investability weightings) based on its median daily trade per month for at least eight of the twelve months prior to the semi-annual review will be removed.
● New issues which do not have a twelve month trading record must have a minimum 20 days trading record when reviewed. They must turnover at least 0.05% of their shares in issue (after the application of any investability weightings) based on their median daily trade per month in each month since their listing.
Free float
The FTSE Bursa Malaysia Index Series constituents are adjusted for free float and weighted according to how much share capital is available for public investment. This achieves the most accurate and neutral market representation possible: meaning that only shares you can own are included in the index. FTSE has chosen to apply free float restrictions in weighted bands. This process accurately reflects the investability of a company, without subjecting the investor to frequent rebalancing transactions associated with a more precise free float methodology.
Capping
The FTSE Bursa Malaysia Palm Oil Plantation Index is capped at 10% and the FTSE Bursa Malaysia Asian Palm Oil Plantation Index is capped at 18% on a quarterly basis. The capping process is applied using prices adjusted for corporate actions as at the close of business on the second Friday in March, June, September and December. The capping is implemented after close of business on the third Friday in March, June, September and December based on the constituents, shares in issue and free float on the next trading day following the third Friday of the review month. Following capping, the weight of each constituent in the Index moves freely in line with price movements.
FTSE Bursa Malaysia Advisory Committee
The FTSE Bursa Malaysia Advisory Committee governs the ongoing management of these indices to ensure they continue to meet the needs of index users. The committee is made up of senior investment professionals and finance industry experts acting independently to advise on the creation of new indices, any enhancements to the methodology and to ensure that the index series evolves with any changes in the market environment.
Further details of the index methodology can be found on www.ftse.com/products/indices/bursa-malaysia.
The following publications are available by contacting your local FTSE Client Services team or [email protected].
GROUND RULES FOR THE
FTSE BURSA MALAYSIA INDEX SERIES

COMMENTARY IN JULY
VENDOR CODES
Index NameFTSE Bursa Malaysia KLCIFTSE Bursa Malaysia Mid 70 IndexFTSE Bursa Malaysia Top 100 IndexFTSE Bursa Malaysia Small Cap IndexFTSE Bursa Malaysia EMAS IndexFTSE Bursa Malaysia Fledgling IndexFTSE Bursa Malaysia EMAS Shariah IndexFTSE Bursa Malaysia Small Cap Shariah IndexFTSE Bursa Malaysia Hijrah Shariah IndexFTSE4Good Bursa Malaysia IndexFTSE Bursa Malaysia Palm Oil Plantation IndexFTSE Bursa Malaysia Asian Palm Oil Index - USD
FTSE Bursa Malaysia MidS Cap Index
FTSE Bursa Malaysia MidS Cap Shariah Index
Source: FTSE Russell 4 of 38
Global markets were in the positive territory in July, with the FTSE All-World Index up 2.32 per cent. Year-to-date global markets have continued on a positive path, up 7.92 percent.
Latin America was the best performing region in July finishing the month up 7.68 per cent. North America wasthe worst performing region, up on the month 1.73 per cent. Asian markets saw positive performance with theFTSE Asia Pacific Index up 1.68 per cent.
Within Asia India was the best performing market in July, with the FTSE India Index up 7.18 per cent. TheFTSE Bursa Malaysia KLCI had a drop of 3.64 index points on the month, seeing a negative performance of0.21 per cent.
The Travel & Leisure sector within the FTSE Bursa Malaysia KLCI had the best performance up 5.75 per cent,with Fixed Line Telecommunications sector showing the worst performance down 4.36 per cent. The bestperforming FTSE Bursa Malaysia KLCI constituent was Genting Malaysia showing a positive return of 9.09 percent in July.
In July, within the size segments of the FTSE Bursa Malaysia EMAS Index, FTSE Bursa Malaysia KLCIcompanies were the best performers in the FTSE Bursa Malaysia Index Series, with FTSE Bursa MalaysiaFledgling Index companies showing the worst performance, down 1.84 per cent on the month. The FTSEBursa Malaysia EMAS Index had a performance of -0.37 per cent in July, with Hengyuan Refining Company thebest performing constituent, up 48.30 per cent.
Year to date the FTSE Bursa Malaysia ACE Index has the highest volatility within the FTSE Bursa Malaysia Index Series at 17.23 per cent. The FTSE4Good Bursa Malaysia Index has the lowest volatility with 5.78 per cent. Thiscompares to a volatility of 14.94 and 7.62 per cent respectively for 2016. The FTSE Bursa Malaysia EMAS Indexhad a volatility of 6.01 per cent, lower than 2016's 7.99 per cent.
As at the end of July, the FTSE Bursa Malaysia KLCI accounts for 69.75 per cent of the FTSE Bursa MalaysiaEMAS Index, with the 169 constituents of the FTSE Bursa Malaysia Small Cap Index accounting for 7.26 percent. The top ten constituents of the FTSE Bursa Malaysia KLCI account for 65.25 per cent of the index,compared to 17.02 per cent of the FTSE Bursa Malaysia Small Cap Index and 45.92 per cent of the FTSE BursaMalaysia EMAS Index.
Technology Hardware & Equipment was the best performing sector in the FTSE Bursa Malaysia EMAS Index up10.94 per cent in July, with Automobiles & Parts being the second best performer up 5.29 per cent. Aerospace& Defense was the worst performing sector followed by Leisure Goods down 5.76 per cent and 5.16 per cent,respectively.
With an index weighting of 36.01 per cent and 8 constituents, Financials is the largest industry in the FTSEBursa Malaysia KLCI, up 1.58 per cent in weighting compared to the previous month. This compares to aweight of 23.55 per cent in the FTSE Bursa Malaysia Mid 70 Index and 31.57 per cent in the FTSE BursaMalaysia EMAS Index.
F4GBMFBMPM .FTFBMPM
.FTFBMSCAP
2612387FBM100.LOC-FTX
-FBMPM.LOC-FTX
FTSE BLOOMBERG REUTERS FACTSETTK549389
.FTFBM70FBM100
BBG000MCZT51BBG000QWC8J9
FBMFLGFBMS
FBMEMAS.LOC-FTXFBMFLG.LOC-FTXBBG000QWCB02
.FTFBM100FBM70.LOC-FTX
FBMSCAP.LOC-FTX.FTFBMEMAS
BBG000XVT556 CH10126354
.FTFBMFLG
FBMHS BBG000W9WHW6
.FTFBMKLCI FBMKLCI.LOC-FTX
FBMSCAPFBMEMAS
FBM70BBG000QWC8F3BBG000QWC9R8BBG000QWC970
TELEKURSFBMKLCI
.FTFBMS
.FTFBMHS-
FTSE Bursa Malaysia Index Series Data as at: 31 July 2017
FBMHS.LOC-FTX-
2612389TK2612393
FBMS.LOC-FTX
2612396
-
2612398
3071195
2874372BBG000W2D9W0FBMSCAPS - - - -
FBMAPU BBG000XVT4X8 .FTFBMAPU FBMAPU.LOC-FTX TK10126340
FBMMSCAP .FTFBMMSCAP
FBMMSCS .FTFBMMSCS

INDEX OVERVIEW
FTSE BURSA MALAYSIA KLCI FIVE-YEAR PERFORMANCE (MYR PRICE RETURN) PERFORMANCE HIGHLIGHTS
● FTSE Bursa Malaysia KLCI ● FTSE Bursa Malaysia EMAS Index
FTSE BURSA MALAYSIA HISTORICAL PERFORMANCE TABLE (MYR PRICE RETURN)
FTSE Bursa Malaysia KLCI
FTSE Bursa Malaysia EMAS Index
PERFORMANCE OF THE KLCI AND SELECTED FTSE ASIA PACIFIC COUNTRY INDICES IN JULY (MYR PRICE RETURN)
FTSE BURSA MALAYSIA KLCI HISTORICAL REVIEW TURNOVER
Source: FTSE Russell 5 of 38
The FTSE Bursa Malaysia KLCI ended themonth in negative territory in July down0.21 per cent, although outperforming theFTSE Bursa Malaysia EMAS Index by 0.16per cent.
Year to date the FTSE Bursa Malaysia KLCIperformance is up by 7.21 per cent, with avolatility of 6.04 per cent, lower than 2016’svolatility of 8.62 per cent.
Travel & Leisure had the best sectorperformance in the FTSE Bursa MalaysiaKLCI in July, up 5.75 per cent.
2014(%)
-3.90 -2.02
15,167
FTSE New Zealand Index
-0.37
14
-0.20
15 FTSE Vietnam Index -0.23 16 FTSE Pakistan Index 611 2.16 17
30 528
Data as at: 31 July 2017
-0.21
Net Market Cap (MYRbn)
293
5,056
7.18 158
1.53 6.46
The FTSE Bursa Malaysia KLCI comprises the largest companies by full market capitalisation in the FTSE Bursa Malaysia EMAS Index. The index is a free float adjustedmarket-capitalisation weighted index representing the performance of the largest Malaysian blue chip companies, which pass the size, free float, and liquidity screens.The index represents approximately 60 per cent of the Bursa Malaysia Main Market and as at the end of July there were 30 constituents in the index.
3.55
FTSE Bursa Malaysia KLCI
-0.45
1.99
FTSE Bursa Malaysia KLCI
Net Market Cap (MYRm)
AFTER REVIEW
10 FTSE Philippines Index 26 11 FTSE Japan Index
FTSE Indonesia Index
Number of Cons
BEFORE REVIEW
2,357 3.42 22
30
-
Net Market Cap (MYRm)
2.86
4.62
4.99
531,328
2,318 50 493
5.75
12
2013(%)
7.21 5.29
14
-0.95
9.61
30
Number of Cons
3,186
9.47
-5.95 7.87
12.33 -1.38
YTD(%)
-3.00
1Y(%)
12.38
Number of Cons
Net Market Cap (MYRbn)
1M Perf (%)
-0.21
-4.07
2 FTSE China 50 Index
6.91
5Y(%pa)
3Y(%)
9
Index Name
FTSE India Index 132
Div Yield(%)
7 FTSE Korea Index 127
4 FTSE ASFA Australia 200 Index 200
Number of Adds Number of Dels
6 FTSE Hong Kong Index 456 2,831 3.48
30
Review Month
30 481,183
2-Way Turnover (%)
1
December 2016
June 2017
1
0
1
0
CUMULATIVE PERFORMANCE ANNUALISED PERFORMANCE
3.01
1.78 1.65 0.82
1M Perf (%)
-5.66
3M(%)
91
2016(%)
2015(%)
-6.13 -2.26 -2.77
3 Straits Times Index (STI) 30 904 4.39
13
1M(%)
3Y(%pa)
6M(%)
2.91 5
-0.62
5Y(%)
8.35
Rank Index Name Rank
2,153
FTSE TWSE Taiwan 50 Index
50 -
30
Index Name
5 FTSE China A50 Index 50
10.54
Number of Cons
2.35
8 FTSE SET Large Cap Index 30
484,967
537,204
Total
Note: The majority of index changes occurs at the index reviews in June and December. Review changes to the index may include constituent additions/deletions, shares in issue and free float changes, and changes due to corporate events.
0
20
40
60
80
100
120
140
Inde
x R
ebas
ed (
31 J
ul 2
012=
100)

FIVE-YEAR HISTORICAL INDUSTRY BREAKDOWN (%)* INDUSTRY BREAKDOWN
● Basic Materials
● Consumer Goods
● Consumer Services
● Financials
● Health Care
● Industrials
● Oil & Gas
● Technology
● Telecommunications
● Utilities
* The historical industry breakdown before July 2009 is based on the FTSE Bursa Malaysia Large 30 Index instead of FTSE Bursa Malaysia KLCI
RELATIVE PERFORMANCE AGAINST FTSE BURSA MALAYSIA KLCI (MYR PRICE RETURN)
1 MONTH 1 YEAR
FTSE BURSA MALAYSIA KLCI HISTORICAL VOLATILITY (MYR PRICE RETURN)
● FTSE Bursa Malaysia KLCI
● FTSE Bursa Malaysia EMAS Index
Index volatility is calculated on a rolling 180 days basis.
Source: FTSE Russell 6 of 38
FTSE Bursa Malaysia KLCI Data as at: 31 July 2017
2 (4.84%) 4
(7.95%)
3 (8.25%)
8 (34.31%) 1
(3.11%)
4 (11.14%)
1 (1.31%)
4 (12.48%)
3 (14.91%)
Key:
8 (36.01%)
Number of Constituents Index Weight
0
20
40
60
80
100
0.05
-2.54
-1.00
0.07
2.93
-0.06
5.61
0.19
-1.63
-4.0 -2.0 - 2.0 4.0 6.0 8.0
Relative Performance (%)
Basic Materials
Consumer Goods
Consumer Services
Financials
Health Care
Industrials
Oil & Gas
Technology
Telecommunication
Utilities FTSE
Bur
sa M
alay
sia
KLCI
Ind
ustr
y In
dice
s
-14.17
-17.94
-3.14
5.74
-17.86
8.76
13.52
-4.59
0.31
-20.0 -10.0 - 10.0 20.0
Relative Performance (%)
Basic Materials
Consumer Goods
Consumer Services
Financials
Health Care
Industrials
Oil & Gas
Technology
Telecommunication
Utilities FTSE
Bur
sa M
alay
sia
KLCI
Ind
ustr
y In
dice
s
0
2
4
6
8
10
12
14
Vola
tility
(%
)

FTSE BURSA MALAYSIA KLCI HISTORICAL VOLATILITY TABLE (MYR PRICE RETURN)
FTSE Bursa Malaysia KLCIFTSE Bursa Malaysia EMAS Index
* Based on annualised daily total log returns. ** Based on annualised weekly total log returns. *** Based on annualised monthly total log returns.
FTSE BURSA MALAYSIA KLCI HISTORICAL SHARPE RATIO (MYR PRICE RETURN)
FTSE Bursa Malaysia KLCIFTSE Bursa Malaysia EMAS Index
* Based on annualised daily total log returns. ** Based on annualised weekly total log returns. *** Based on annualised monthly total log returns.Note: Malaysia 3-Month interbank offered rate is used as the risk free rate.
FTSE BURSA MALAYSIA KLCI HISTORICAL CORRELATION AGAINST FTSE BURSA MALAYSIA EMAS INDEX (MYR PRICE RETURN)
FTSE Bursa Malaysia KLCI
* Based on annualised daily total log returns. ** Based on annualised weekly total log returns. *** Based on annualised monthly total log returns.
FTSE BURSA MALAYSIA KLCI TOP 5 AND BOTTOM 5 SECTOR PERFORMERS
FTSE BURSA MALAYSIA KLCI 1-YEAR TOP PERFORMING SECTOR - TRAVEL & LEISURE
PROFILE
● FTSE Bursa Malaysia KLCI - Travel & Leisure● FTSE Bursa Malaysia EMAS Travel & Leisure Index ● FTSE Bursa Malaysia KLCI
Source: FTSE Russell 7 of 38
Number of Constituents:
56.21%
10.11 -2.51
0530 Oil & Gas Producers
1
6,921 1.31 -1.33
8.38
Real Estate Investment & Services
1
Dividend Yield: 1.02%
-4.36
-0.68 -0.48 -0.12
2014* 2015*-0.59 -0.65
0.9778 0.9648 0.9682
-1.04
11.29
-1.01
9.46
5Y (%)***0.9805
1.17
38,363
2013 (%)*
9
7.26 5.75 1.02
-0.24 2016*
1.98 0.60
6.01 6.34 10.65
5Y (%)*** 2013 (%)*
2.61
1M Perf (%)
8.29 7.99
2015 (%)*
3780 1.34
FTSE Bursa Malaysia KLCI Data as at: 31 July 2017
8.62 3Y (%)**
2016 (%)*
0.51
-0.53
ICB Code ICB Sector Net Market Cap (MYRm) Index Weight (%) 1Y Perf (%) Div Yield (%)
0.9803 2014 (%)*
2.58
Media 5,221
4.93
0.9665
Index Name YTD* 1Y* 3Y** 5Y*** 2013*
Index Name
6.04
6,195
5750
8.45 10.77 8.26
YTD (%)*
2016 (%)*
4.84
3.03
3.38
1 0.99
12,475
1-Year Price Return:
6570 53,413
1350 Chemicals 25,552
2
1.06
0.66
2 2.99
28.11%
-10.01
1.98
Tobacco 1
-9.79
-11.64
28.11
3
3.85
Travel & Leisure
3.11
2350
3.07
4.84
8630
2.08
Genting
-
-6.88
0.29
-2.25
Largest Constituent in Sector:
2.36
Mobile Telecommunications
4.13
-10.61
3,461
Construction & Materials 10,995 2.16
Weight in FTSE Bursa Malaysia KLCI:7.26%
6530
-1.95
Index Name YTD (%)* 1Y (%)* 2014 (%)* 2015 (%)*
1
4530
Number of Cons
7.62 9.06
Weight in Sector:
Fixed Line Telecommunications
1
5550
1Y (%)*0.9837 0.9756
Health Care Equipment & Services
-0.46 0.99
3Y (%)**
16,440
6.21
1
0.89 0.85
10.54
TOP
BOTT
OM
60
70
80
90
100
110
120
130
140
Inde
x R
ebas
ed (
29 J
ul 2
016=
100)
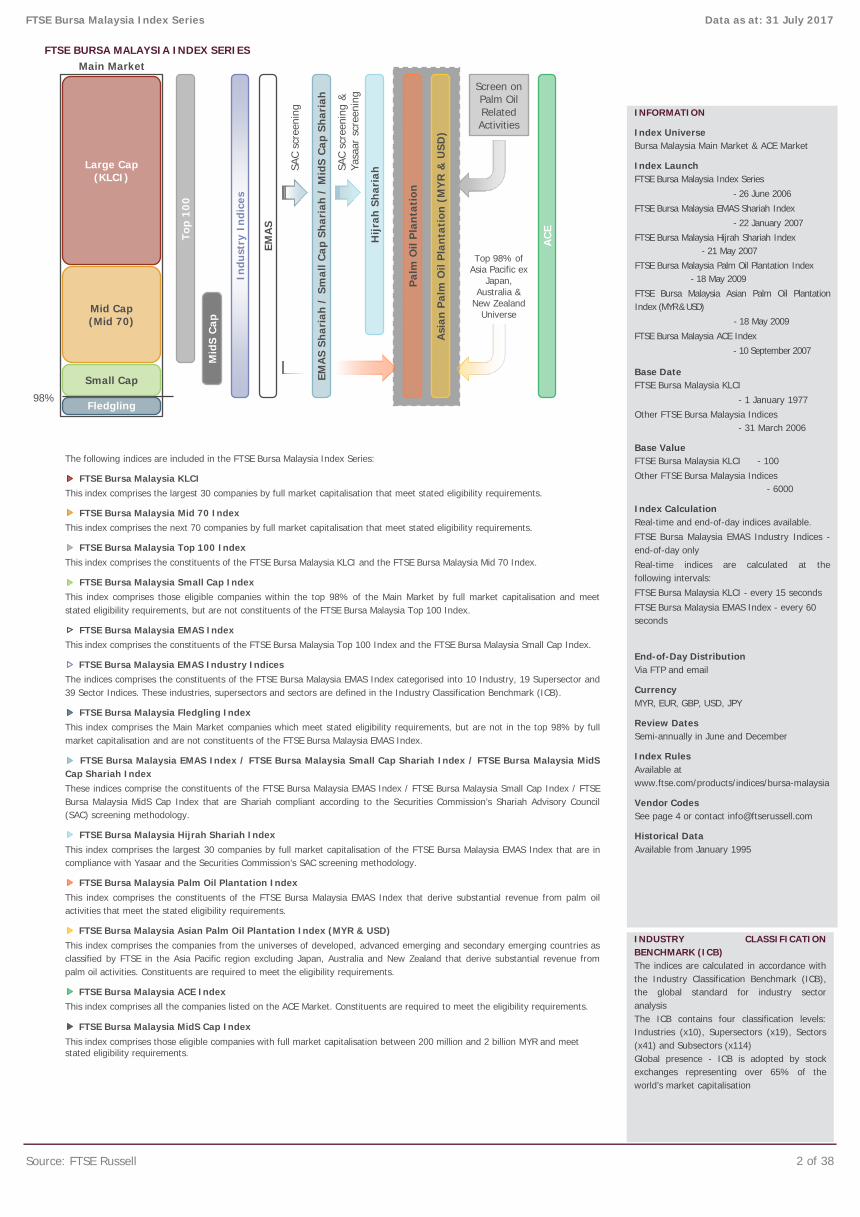
FTSE BURSA MALAYSIA KLCI TOP 10 CONSTITUENTS
FTSE BURSA MALAYSIA KLCI TOP 5 AND BOTTOM 5 PERFORMERS
FTSE BURSA MALAYSIA KLCI TOP PERFORMER IN JULY - GENTING MALAYSIA PROFILE
Source: FTSE Russell - price return data in MYR, as at 31 July 2017
Source: FTSE Russell 8 of 38
CIMB Group Holdings Banks 41,707
0.66
16,797
10.08
Alternative Electricity 57,422 10.87
20,978
3
Banks
6888
53,232
-0.14
3.18
-2.11
-4.14
12,467 2.36 -4.36
6,785 1.29
Telekom Malaysia Fixed Line Telecommunications
Genting Malaysia
3.97
5225 IHH Healthcare Health Care Providers 16,430 3.11 2.61
Local Code:4715
-0.53
-0.20
Net Market Cap (MYRm) Index Weight (%)Local Code
3.29
6.30
-0.93
5347
11.8262,419Public Bank
Tenaga Nasional
1295
4863
8
7 20,991 3.97
-0.46
Genting Gambling
5 4197 Sime Darby
4
21,566
1023
2
6399 Astro Malaysia Holdings Broadcasting & Entertainment 5,218 0.99
1155 Malayan Banking Banks
4715 Genting Malaysia Gambling 16,788 3.18
Gambling
1.98
3182 Genting Gambling 21,553 4.08 3.29
9.09
7.90
33,291Diversified Industrials
Weight in FTSE Bursa Malaysia KLCI:3.18%
Dividend Yield
Axiata Group Mobile Telecommunications
4.08
Real Estate Holding & Development 3,459
2.47
-4.11Multiutilities
Digi.com
ICB Subsector:Gambling
1.53%
6888
Mobile Telecommunications
Axiata Group Mobile Telecommunications
10 4715
Local Code Constituent Name ICB Subsector 1M Perf (%)
Totals 344,625 65.25
9 6947
3,939
4677 YTL Corp
-4.00
FTSE Bursa Malaysia KLCI Data as at: 31 July 2017
Westports Holdings
6947
5246 0.75
17,552 3.33
ICB Subsector
1
9.09
3.72
6
5235SS KLCC PROP & KLCC REITS - STAPLED SC -2.25
3182
3.33 -4.00
5183 PETRONAS Chemicals Group Commodity Chemicals 19,638
Transportation Services
Mobile Telecommunications 17,562
Net Market Cap (MYRm)
Constituent NameRank 1M Perf (%)
Index Weight (%)
Digi.com
-
-4.14
TOP
BOTT
OM
FTSE Bursa Malaysia EMAS Travel & Leisure Index
Genting Malaysia
FTSE Bursa Malaysia KLCI ▼ 0.21%
▲ 3.95%
▲ 9.09%
-2.0 - 2.0 4.0 6.0 8.0 10.0
1-Month Price Return (%)
Genting Malaysia is a member company of the Genting Group. It provides leisure and
hospitality business covering theme parks, gaming, hotels, seaside resorts and entertainment
in Malaysia. There was a strong increase in EBITDA, net profit and revenue in 2016 compared
with 2015. It was the best performing company of the FTSE Bursa Malaysia KLCI in July, with
its share price rising by 9.09% m-m.

INDEX OVERVIEW
FTSE BURSA MALAYSIA EMAS INDEX FIVE-YEAR PERFORMANCE (MYR PRICE RETURN) PERFORMANCE HIGHLIGHTS
● FTSE Bursa Malaysia KLCI ● FTSE Bursa Malaysia Mid 70 Index● FTSE Bursa Malaysia EMAS Index ● FTSE Bursa Malaysia Small Cap Index● FTSE Bursa Malaysia Fledgling Index ● FTSE Bursa Malaysia MidS Cap Index● FTSE Bursa Malaysia MidS Cap Shariah Index
FTSE BURSA MALAYSIA EMAS INDEX HISTORICAL PERFORMANCE TABLE (MYR PRICE RETURN)
FTSE Bursa Malaysia KLCI
FTSE Bursa Malaysia Mid 70 Index
FTSE Bursa Malaysia Top 100 Index
FTSE Bursa Malaysia Small Cap Index
FTSE Bursa Malaysia EMAS Index
FTSE Bursa Malaysia Fledgling Index
FTSE Bursa Malaysia EMAS Shariah Index
FTSE Bursa Malaysia Hijrah Shariah Index
FTSE Bursa Malaysia Palm Oil Index
FTSE Bursa Malaysia ACE Index
FTSE Bursa Malaysia MidS Cap Index
FTSE Bursa Malaysia MidS Cap Shariah Index
FIVE-YEAR HISTORICAL INDUSTRY BREAKDOWN (%) INDUSTRY BREAKDOWN (%)
● Basic Materials
● Consumer Goods
● Consumer Services
● Financials
● Health Care
● Industrials
● Oil & Gas
● Technology
● Telecommunications
● Utilities
Source: FTSE Russell 9 of 38
-5.80 -6.85 -1.51 -0.48 -14.41 -11.10 -5.06 -2.33 10.11 -8.06 -0.41 0.21 1.52
0.58 4.64 32.17 36.62 20.51 -7.28 47.77 -2.49 8.12 34.68 -0.39 13.02 -25.18 0.87
-1.05 -2.00 2.28 3.64 1.90 -4.71 14.92 -1.60 2.82 13.01 1.01 -0.94 -6.31 2.58
-2.45
-0.62 6.91 9.47 8.35 -4.07 12.33 -1.38 2.35 12.38 -6.13 -2.26 -2.77 2.86
105.07
-0.82 -1.96 4.01 5.85 4.25 -4.98 12.76 -1.69 2.43 13.29 -4.17 2.35 -6.14 2.54
3M(%)
14.98 -7.88
-3.90
1.35 3.93 10.78
6M(%)
YTD(%)
Within the size segments of the FTSE BursaMalaysia EMAS Index, Large Capcompanies had the best performance inJuly with the FTSE Bursa Malaysia KLCIdown 0.21 per cent, followed by FTSEBursa Malaysia Top 100 Index companiesseeing a decrease of 0.32 per cent.
Small Cap companies were the worstperformers within the size segments of theFTSE Bursa EMAS Index down 0.97 percent.
The FTSE Bursa Malaysia EMAS Index hada performance of -0.37 per cent.
-0.76
1M(%)
3Y(%)
5Y(%)
CUMULATIVE PERFORMANCE ANNUALISED PERFORMANCE2013(%)
FTSE Bursa Malaysia EMAS Index Data as at: 31 July 2017
0.54
6.95 36.71
10.95 -1.22 2.10 11.39 -6.17 -2.89 -2.45 2.90
-0.21
The FTSE Bursa Malaysia EMAS Index comprises the constituents in the FTSE Bursa Malaysia KLCI, the FTSE Bursa Malaysia Mid 70 Index, and the FTSE Bursa Malaysia Small Cap Index.The index is a free float adjusted market-capitalisation weighted index representing the performance of approximately 98 per cent of the Bursa Malaysia Main Market which pass the size,free float, and liquidity screens. As at the end of July there were 269 constituents in the index.
14.85
-5.66
Index Name
13.36
1Y(%)
3Y(%pa)
5Y(%pa)
2015(%)
8.99
-6.07
2014(%)
4.11 21.28
-4.20 6.04 -7.71 2.37
2016(%)
Div Yield(%)
-0.45 5.29 7.21 6.46 10.54
21.48 22.64 20.07
-5.95 7.87 -2.02 1.53 -3.00 3.01
8.08 -3.61
-3.93 6.62 37.73 -8.84 9.63 -7.91 2.49
11.07 6.29 15.45 36.33 18.18 -4.54
-0.32 -0.52 6.60
-0.68
-1.06 -2.59 10.43 15.67
2.56 -0.73
-0.97 -2.19 11.97 17.39 12.67 -9.40 -3.24 39.91
13.05 -10.70 37.49 -3.70 6.57 35.25
-1.84 -1.20 16.68 2.08
-0.37
-5.94 2.41 4.80
-3.83 10.61 15.08 12.35 -11.33 37.79 -1.84
0
20
40
60
80
100 4.86
8.56
7.98
31.57
4.37
16.03
3.97
1.39
9.21
12.07
0
50
100
150
200
250
Inde
x R
ebas
ed (
31 J
ul 2
012=
100)

RELATIVE PERFORMANCE AGAINST FTSE BURSA MALAYSIA EMAS INDEX (MYR PRICE RETURN)
1 MONTH 1 YEAR
FTSE BURSA MALAYSIA INDEX SERIES PORTFOLIO CHARACTERISTICS
Number of Constituents
Full Market Cap (MYRm)
% FTSE Bursa Malaysia EMAS Index
Net Market Cap (MYRm)
Dividend Yield (%)
Constituent Sizes (Net Market Cap MYRm)
Average
Largest
Smallest
Median
Weight of Largest Constituent (%)
Top 10 Holdings (% Index Market Cap)
Source: FTSE Russell 10 of 38
FTSE Bursa Malaysia EMAS Index Data as at: 31 July 2017
December 2016
June 2017
Totals
Review Turnover -
17
FTSE Bursa Malaysia Fledgling
Index
2
FTSE Bursa Malaysia Top
100 Index
100
11
FTSE Bursa Malaysia EMAS
Index
269
1,516,197
100
4
6
10
750,013
3
366
43,328
3
17
41
58
22,037
2
60
421
5
44
2
3
6
1,406,110
93
296
1,086
0
259
5
10
62,383
3,459
11,990
12
FTSE Bursa Malaysia Small
Cap Index
169
110,087
7
18
30
48
50,083
2
FTSE Bursa Malaysia Mid
70 Index
70
348,547
23
24
10
FTSE Bursa Malaysia KLCI
30
1,057,562
70
5
17,594
19
FTSE Bursa Malaysia MidS
Cap Index
177
125,748
8
27
38
65
56,792
2
321
1,086
0
266
2
16
FTSE Bursa Malaysia MidS Cap Shariah
Index
146
97,203
6
36
39
76
43,794
2
300
1,086
0
262
2
23
48
68,885
2
6,889
33,272
131
1,916
10
100
FTSE Bursa Malaysia
Hijrah Shariah Index
30
673,653
44
5
8
14
322,069
3
10,736
57,389
1,818
6,754
18
68
FTSE Bursa Malaysia Palm Oil Plantation
Index
10
138,352
9
26
2,788
62,383
0
415
8
4665
9
699,931
3
6,999
62,383
290
2,875
9
49
34
172,107
3
2,459
11,427
290
1,861
7
38
527,824
3
-1.48 -0.69
0.67 -0.68
-1.47 -0.60
-0.32 0.16
-2.0 -1.5 -1.0 -0.5 - 0.5 1.0
Relative Performance (%)
Large (KLCI) Mid 70
Small Cap Fledgling
Hijrah Shariah Asian Palm Oil
FTSE
Bur
sa M
alay
sia
Indi
ces
8.31
-0.32
-0.28
-2.42
3.77
1.43
0.25
-0.26
-0.43
-1.31
-5.0 - 5.0 10.0
Relative Performance (%)
Basic Materials
Consumer Goods
Consumer Services
Financials
Health Care
Industrials
Oil & Gas
Technology
Telecommunication
Utilities
FTSE
Bur
sa M
alay
sia
EMAS
Ind
ustr
y In
dice
s
48.58
6.92
-14.81
-16.93
5.26
-3.87
-3.25
9.02
5.60
-2.50
-40.0 -20.0 - 20.0 40.0 60.0
Relative Performance (%)
Basic Materials
Consumer Goods
Consumer Services
Financials
Health Care
Industrials
Oil & Gas
Technology
Telecommunication
Utilities
FTSE
Bur
sa M
alay
sia
EMAS
Ind
ustr
y In
dice
s
3.99 4.70
-2.71 -6.46
14.29 4.32 5.00
-1.89
-10.0 -5.0 - 5.0 10.0 15.0 20.0
Relative Performance (%)
Large (KLCI) Mid
Small Fledgling
Hijrah Shariah Asian Palm Oil
FTSE
Bur
sa M
alay
sia
Indi
ces
MidS MidS Shariah
MidS MidS Shariah

FTSE BURSA MALAYSIA INDEX SERIES HISTORICAL VOLATILITY (MYR PRICE RETURN)
● FTSE Bursa Malaysia KLCI
● FTSE Bursa Malaysia Mid 70 Index
● FTSE Bursa Malaysia Small Cap Index
● FTSE Bursa Malaysia EMAS Index
● FTSE Bursa Malaysia Fledgling Index
● FTSE Bursa Malaysia MidS Cap Index
● FTSE Bursa Malaysia MidS Cap Shariah Index
FTSE BURSA MALAYSIA INDEX SERIES HISTORICAL VOLATILITY TABLE (MYR PRICE RETURN)
FTSE Bursa Malaysia KLCI
FTSE Bursa Malaysia Mid 70 Index
FTSE Bursa Malaysia Top 100 Index
FTSE Bursa Malaysia Small Cap Index
FTSE Bursa Malaysia EMAS Index
FTSE Bursa Malaysia Fledgling Index
FTSE Bursa Malaysia EMAS Shariah Index
FTSE Bursa Malaysia Hijrah Shariah Index
FTSE Bursa Malaysia Palm Oil Plantation Index
FTSE Bursa Malaysia ACE Index
FTSE Bursa Malaysia MidS Cap Index
FTSE Bursa Malaysia MidS Cap Shariah Index
* Based on annualised daily total log returns. ** Based on annualised weekly total log returns. *** Based on annualised monthly total log returns.
FTSE BURSA MALAYSIA INDEX SERIES HISTORICAL SHARPE RATIO (MYR PRICE RETURN)
FTSE Bursa Malaysia KLCI
FTSE Bursa Malaysia Mid 70 Index
FTSE Bursa Malaysia Top 100 Index
FTSE Bursa Malaysia Small Cap Index
FTSE Bursa Malaysia EMAS Index
FTSE Bursa Malaysia Fledgling Index
FTSE Bursa Malaysia EMAS Shariah Index
FTSE Bursa Malaysia Hijrah Shariah Index
FTSE Bursa Malaysia Palm Oil Plantation Index
FTSE Bursa Malaysia ACE Index
FTSE Bursa Malaysia MidS Cap Index
FTSE Bursa Malaysia MidS Cap Shariah Index* Based on annualised daily total log returns. ** Based on annualised weekly total log returns. *** Based on annualised monthly total log returns.
* Note: Malaysia 3-Month interbank offered rate is used as the risk free rate.
FTSE BURSA MALAYSIA INDEX SERIES HISTORICAL CORRELATION AGAINST FTSE BURSA MALAYSIA EMAS INDEX (MYR PRICE RETURN)
FTSE Bursa Malaysia KLCI
FTSE Bursa Malaysia Mid 70 Index
FTSE Bursa Malaysia Small Cap Index
FTSE Bursa Malaysia Fledgling Index
FTSE Bursa Malaysia EMAS Shariah Index
FTSE Bursa Malaysia Palm Oil Index
FTSE Bursa Malaysia MidS Cap Index
FTSE Bursa Malaysia MidS Cap Shariah Index
* Based on annualised daily total log returns. ** Based on annualised weekly total log returns. *** Based on annualised monthly total log returns.
Source: FTSE Russell 11 of 38
2015(%)*
2016(%)*
9.30
8.62
8.48
10.77 8.09
8.38
0.59 1.17 -0.88
-0.23
-0.48 -0.06
11.13
7.99
15.46 17.41
8.24
10.77
FTSE Bursa Malaysia EMAS Index Data as at: 31 July 2017
-0.16 0.91 -1.09 -0.52 -0.63
2015(%)*
2016(%)*
Index Name YTD*2014(%)*
0.9295 0.9747 0.9677
6.07 6.26 10.83 8.69 9.29 9.07
10.10 9.98 13.54 12.16 10.61 13.03 12.72
1Y* 3Y** 5Y***
11.04 7.72
8.16
6.21
-0.47 0.69 -0.84 -0.19
13.55
2.33
2015(%)*
2016(%)*
2.44 0.84
5.81
2013(%)*
17.05
1.98 0.60 -0.53 -0.24 0.85 -1.01
-0.19
-0.24 0.19 1.53 -0.13 0.40
2.29 0.18 0.77
2014(%)*
14.94
-1.16
9.00 9.58 9.55 10.86 7.71
1.27 -0.20 0.05 1.02 -1.12
-0.47
2.58 0.89 -0.48 -0.12 0.99 -1.04 -0.46
3.11 1.01
1.07 -0.17
0.7691 0.6924
-0.03
-0.26 -0.30 -0.65
0.8032 0.8008 0.7970 0.8141
0.9805
5Y(%)***
11.29 6.04 6.34
5.95
17.23 15.98 25.32 23.15 17.99 22.96
7.92 7.92 11.24 10.90 11.46 9.54
6.01 10.54 8.29 9.46 8.45
Index NameYTD(%)*
1Y(%)*
7.62 9.06 8.26 10.65
2013(%)*
2014(%)*
Index NameYTD(%)*
1Y(%)*
3Y(%)**
5Y(%)***
2013(%)*
-0.33 -1.18 1.01 -0.10
1.68 0.28 1.06 -0.71 -0.47 -0.10
3.11 1.24 -0.49 0.19 1.83 -0.59 0.14 -0.95
-2.11
-0.68
3.93
6.04 6.27
0.9778
0.8370 0.8316 0.9114 0.9000 0.9181 0.8884 0.8693
0.9648 0.9682 0.9803 0.9665 0.9837 0.9756
0.8199
0.7693 0.7101
0.5418
0.9588
0.5277 0.7637 0.7448 0.7068 0.7485 0.7539 0.6983
0.9608 0.9180 0.9708 0.9667
0.6820 0.6596 0.7897 0.8181 0.8139 0.8120 0.7553 0.6823
8.01 7.88 15.04 16.29 15.26 14.95 13.90 9.21
8.33 8.25 16.17 17.11 15.84 15.57 15.07 10.06
7.84 13.82 14.42 12.31 13.61 12.02
15.20 14.37
10.41 7.96 9.28 8.18
8.49
24.14
11.26
-0.40
3.28 1.16 -0.45 0.19 1.70 -0.45 0.22 -1.14
-0.65 -0.59
3.00
3Y(%)**
2.89 1.11 -0.47 0.18 1.88 -0.76 0.43 -1.08
0.7058 0.6852 0.7981 0.8200 0.8170 0.8195 0.7656 0.7097
0.6011 0.7257 0.6662 0.6103 0.6843 0.7874
0.6742 0.6686
0
5
10
15
20
25
Vola
tility
(%
)

FTSE BURSA MALAYSIA EMAS INDEX TOP 5 AND BOTTOM 5 SECTOR PERFORMERS
FTSE BURSA MALAYSIA EMAS INDEX TOP 10 CONSTITUENTS
FTSE BURSA MALAYSIA EMAS INDEX TOP 5 AND BOTTOM 5 PERFORMERS
Source: FTSE Russell 12 of 38
FTSE Bursa Malaysia EMAS Index Data as at: 31 July 2017
Pharmaceuticals & Biotechnology 2 328 0.04 4.42
Technology Hardware & Equipment 7 8,497
Net Market Cap (MYRm) Index Weight (%) 1M Perf (%) 1Y Perf (%) Div Yield (%)
1.00 3.65
5750 Travel & Leisure 9 49,607 6.61 3.95 20.07
ICB Code ICB Sector Number of Cons
9570
3350 Automobiles & Parts 8.08 5.70
14.87 1.98
4,592 0.61 5.29
1.13 10.94 63.39 2.69
2
1.58
4570
1 1295 Public Bank Banks 62,419
-0.14
5.56
8.32 -0.20
Constituent Name ICB Subsector
Tenaga Nasional
-0.93
2 5347
Rank Local Code Net Market Cap (MYRm) Index Weight (%)
3 1155
1.97
Banks 53,232 7.09
9.17 0.00
Alternative Electricity
8 5183 PETRONAS Chemicals Group Commodity Chemicals 19,638 2.62
4 1023 CIMB Group Holdings Banks 41,707
-0.53
3.29
7 6888 Axiata Group Mobile Telecommunications 20,991 2.80 -4.14
6 3182
7.65
5 4197 Sime Darby Diversified Industrials 33,291 4.44
Local Code Constituent Name ICB Subsector 1M Perf (%)
Genting Malaysia
Totals 344,625 45.92
Gambling 16,797 2.24
Net Market Cap (MYRm) Index Weight (%)
9 6947 Digi.com Mobile Telecommunications 17,562
9.09
2.34 -4.00
10
Oil Equipment & Services 66 0.01
2.82
77.90
9530
Leisure Goods 1
1750 Industrial Metals & Mining 9
Heavy Construction 603 0.08
7,508
2710 Aerospace & Defense
-21.52
5078 Marine & General Business Support Services 101 0.01 -20.92
5102 Guan Chong
Hengyuan Refining Company
2
4715
Genting
0.04
1M Perf (%)
0.97
-0.78
6530
0.09 23.63
5243 UMW Oil & Gas Oil Equipment & Services 407 0.05 -31.82
Software & Computer Services
Exploration & Production 519 0.07 48.30
0166 Inari Amertron Semiconductors 3,457 0.46
7 1,955 0.26 -3.42 33.82
-
Fixed Line Telecommunications
0.02 -21.90
5115 Alam Maritim Resources
2.05 -3.65 -1.69
8530 Nonlife Insurance 3 1,767 0.24 -4.24
172 0.02 -5.16
21.33
128 Frontken Industrial Machinery 351
Petron Malaysia Refining & Marketing Exploration & Production 656
-
57,422
-2.11
21,566 2.87
-0.46
Gambling
Malayan Banking
0.05 22.95
3042
1.63
-28.95
1 310
1589
-5.76
Iskandar Waterfront City
3740
2.87
Food Products 259 0.03 40.35
4324
5062 Hua Yang Real Estate Holding & Development 164
15,419
TOP
BOTT
OM
TO
P BO
TTO
M

INDEX OVERVIEW
FTSE BURSA MALAYSIA MID 70 INDEX FIVE-YEAR PERFORMANCE (MYR PRICE RETURN) PERFORMANCE HIGHLIGHTS
● FTSE Bursa Malaysia Mid 70 Index ● FTSE Bursa Malaysia EMAS Index
FTSE BURSA MALAYSIA MID 70 INDEX HISTORICAL PERFORMANCE TABLE (MYR PRICE RETURN)
FTSE Bursa Malaysia Mid 70 Index
FTSE Bursa Malaysia EMAS Index
FTSE BURSA MALAYSIA MID 70 INDEX HISTORICAL REVIEW TURNOVER
FIVE-YEAR HISTORICAL INDUSTRY BREAKDOWN (%) INDUSTRY BREAKDOWN (%)
● Basic Materials
● Consumer Goods
● Consumer Services
● Financials
● Health Care
● Industrials
● Oil & Gas
● Technology
● Telecommunications
● Utilities
Source: FTSE Russell 13 of 38
Index Name
Review Month Number of Adds Number of Dels Net Market Cap (MYRm)
AFTER REVIEW
21.28 1.35 -0.73 10.78 14.85 13.36 4.11
8.35
3.93
23.88
Div Yield(%)2.56
5Y(%)
-4.07
33.51
70
-0.37 -0.62 6.91
Net Market Cap (MYRm) Number of Cons 2-Way Turnover (%)
9.64
Number of Cons
9.47
FTSE Bursa Malaysia Mid 70 Index Data as at: 31 July 2017
154,814 70 148,4265 5 70
-0.76
3Y(%pa)
5Y(%pa)
2013(%)
2014(%)
2016(%)
CUMULATIVE PERFORMANCE ANNUALISED PERFORMANCE1M(%)
3M(%)
6M(%)
YTD(%)
1Y(%)
3Y(%)
14.98 -7.88
Total
2.86
December 2016
2015(%)
FTSE Bursa Malaysia Mid 70 Index ended themonth in negative territory in July down 0.68per cent, underperforming the FTSE BursaMalaysia EMAS Index by 0.31 per cent.
Year to date the FTSE Bursa Malaysia Mid 70Index performance is up by 14.85 per cent,with a volatility of 7.92 per cent, lower than2016’s volatility of 8.48 per cent.
Oil & Gas Producers had the best sectorperformance in the FTSE Bursa Malaysia Mid70 Index in July, up 23.63 per cent.
June 2017
0.54 -0.68
12.38 -6.13 -2.26 -2.77
6
12.33 -1.38 2.35
174,350
BEFORE REVIEW
6 70 172,689
The FTSE Bursa Malaysia Mid 70 Index comprises the next 70 after the FTSE Bursa Malaysia KLCI companies by full market capitalisation in the FTSE Bursa MalaysiaEMAS Index. The index is a free float adjusted market-capitalisation weighted index representing the performance of the middle largest Malaysian companies, whichpass the size, free float, and liquidity screens. The index represents approximately 15 per cent of the Bursa Malaysia Main Market and as at the end of July it has 70constituents in the index.
0
20
40
60
80
100 4.13
8.92
7.56
23.55
8.66
24.72
11.30
3.82 1.71
5.63
Note: The majority of index changes occurs at the index reviews in June and December. Review changes to the index may include constituent additions/deletions, shares in issue and free float changes, and changes due to corporate events.
0
20
40
60
80
100
120
140
Inde
x R
ebas
ed (3
1 Ju
l 20
12=1
00)

FTSE BURSA MALAYSIA MID 70 INDEX TOP 5 AND BOTTOM 5 SECTOR PERFORMERS
FTSE BURSA MALAYSIA MID 70 INDEX TOP 10 CONSTITUENTS
FTSE BURSA MALAYSIA MID 70 INDEX TOP 5 AND BOTTOM 5 PERFORMERS
Source: FTSE Russell 14 of 38
Heavy Construction1651 Malaysian Resources
391 0.23
2.96
Alliance Financial Group 2.08
5210
0166
0.75 -11.59
Delivery Services 1,096 0.64 8.00
1,299
-
Oil Equipment & Services 2,370
2.22
6 18,850
2.90
Dialog Group Oil Equipment & Services 8,596 4.99 0.52
1M Perf (%)
-3.64
54.93 2.46
1,441 0.84
6.80
2.44
Technology Hardware & Equipment
5.36
Div Yield (%)
6.34 91.37
FTSE Bursa Malaysia Mid 70 Index Data as at: 31 July 2017
-8.67
3042
Totals 38.11
21.33
7153 Kossan Rubber Medical Supplies
2,531 1.47 9.18
2,270 1.32 11.46
4.50
-3.14
5168 Hartalega Holdings Medical Supplies 5,101
AirAsia Airlines 7,345
8869 Press Metal Aluminium Holdings Aluminum 4,999 2.90
1.38 -7.89
Inari Amertron Semiconductors 3,457
6.34
Petron Malaysia Refining & Marketing Exploration & Production 656
Local Code Constituent Name
2.01
23.63
1M Perf (%)
4,735 2.75
9679 WCT Holdings
290 0.17 -8.70
101 TMC Life Sciences Health Care Providers
Bumi Armada
5211 Sunway
5186 Malaysia Marine and Heavy Engineering Holdings Oil Equipment & Services
78 GD Express Carrier
2 7277
5 5218 Sapura Energy Oil Equipment & Services 6,594 3.83
6 -4.20
7
4.26 -0.62
3 5014 Malaysia Airports Transportation Services 7,754
Heavy Construction 1,911 1.11 -7.77
2488
ICB Subsector
Real Estate Holding & Development
0.38
Banks 4,319 2.51
-0.17
9 138 My EG Services Business Support Services
Top Glove Corp Medical Supplies8 7113
10
4,750 2.76
Net Market Cap (MYRm) Index Weight (%)
65,626
-1.37
3570 Food Producers 2 6,861
Constituent Name ICB Subsector
Gamuda
-5.06
3760 Personal Goods 1 1,356 0.79 6.25 41.72
Heavy Construction 11,433 6.64
86.74 1.18
2350 Construction & Materials
5398
7530 Electricity
5.70
Net Market Cap (MYRm)
2.14
1.78
2.67
1750 Industrial Metals & Mining 1 4,999
0530 Oil & Gas Producers 1 656 23.63
3350 Automobiles & Parts 2 4,592
0.38
9570
1Y Perf (%)ICB Code ICB Sector Number of Cons Net Market Cap (MYRm) Index Weight (%) 1M Perf (%)
7570 Gas, Water & Multiutilities 3 7,078 4.11 -2.87 2.81
-
3 6,579 3.82 13.82
2750 Industrial Engineering 1
Rank
2.67 5.29 8.08
3.98
1
1 2,612 1.52 -2.83 -36.02
4 5099
Local Code
10.95 -3.95 6.48
-3.69 -1.34 0.79
Index Weight (%)
TOP
BOTT
OM
TO
P BO
TTO
M

INDEX OVERVIEW
FTSE BURSA MALAYSIA TOP 100 INDEX FIVE-YEAR PERFORMANCE (MYR PRICE RETURN) PERFORMANCE HIGHLIGHTS
● FTSE Bursa Malaysia Top 100 Index ● FTSE Bursa Malaysia EMAS Index
FTSE BURSA MALAYSIA TOP 100 INDEX HISTORICAL PERFORMANCE TABLE (MYR PRICE RETURN)
FTSE Bursa Malaysia Top 100 IndexFTSE Bursa Malaysia EMAS Index
FTSE BURSA MALAYSIA TOP 100 INDEX HISTORICAL REVIEW TURNOVER
FIVE-YEAR HISTORICAL INDUSTRY BREAKDOWN (%) INDUSTRY BREAKDOWN (%)
● Basic Materials
● Consumer Goods
● Consumer Services
● Financials
● Health Care
● Industrials
● Oil & Gas
● Technology
● Telecommunications
● Utilities
Source: FTSE Russell 15 of 38
FTSE Bursa Malaysia Top 100 Index Data as at: 31 July 2017
Total
BEFORE REVIEW
3.20
-4.07 12.33 -1.38 2.35 -0.37 11.39 -6.17 -2.89 -2.45 2.90 12.38 -6.13 -2.26 -2.77 2.86
100 635,996 100 633,393
2013(%)
2014(%)
2015(%)
2016(%)
Div Yield(%)
-0.32 -0.52 6.60 8.99 8.08 -3.61 10.95 -1.22 -0.62 6.91 9.47 8.35
Number of Cons Net Market Cap (MYRm) Number of Cons
9.05
June 2017 6 6 100 704,018 100 711,554 5.86
The FTSE Bursa Malaysia Top 100 Index comprises the constituents of the FTSE Bursa Malaysia KLCI and the FTSE Bursa Malaysia Mid 70 Index. The index is a freefloat adjusted market-capitalisation weighted index representing the performance of the top-capitalised companies, which pass the size, free float, and liquidityscreens. As at the end of July there were 100 constituents in the index.
FTSE Bursa Malaysia Top 100 Index endedthe month in negative territory in July down0.32 per cent, outperforming the FTSE BursaMalaysia EMAS Index by 0.05 per cent.
Year to date the FTSE Bursa Malaysia Top100 Index performance is up by 8.99 percent, with a volatility of 6.04 per cent, lowerthan 2016’s volatility of 8.09 per cent.
Technology Hardware & Equipment had thebest sector performance in the FTSE BursaMalaysia Top 100 Index in July, up 13.82 percent.
CUMULATIVE PERFORMANCE ANNUALISED PERFORMANCE1M(%)
3M(%)
6M(%)
YTD(%)
1Y(%)
3Y(%)
5Y(%)
3Y(%pa)
5Y(%pa)
2.10
2-Way Turnover (%)
December 2016 4 4
Index Name
Review Month Number of Adds Number of Dels Net Market Cap (MYRm)
AFTER REVIEW
0
20
40
60
80
100 4.66 8.19
8.08
32.95
4.48
14.48
3.77
0.94
9.83
12.63
Note: The majority of index changes occurs at the index reviews in June and December. Review changes to the index may include constituent additions/deletions, shares in issue and free float changes, and changes due to corporate events.
0
20
40
60
80
100
120
140
Inde
x Re
base
d (3
1 Ju
l 20
12=
100)
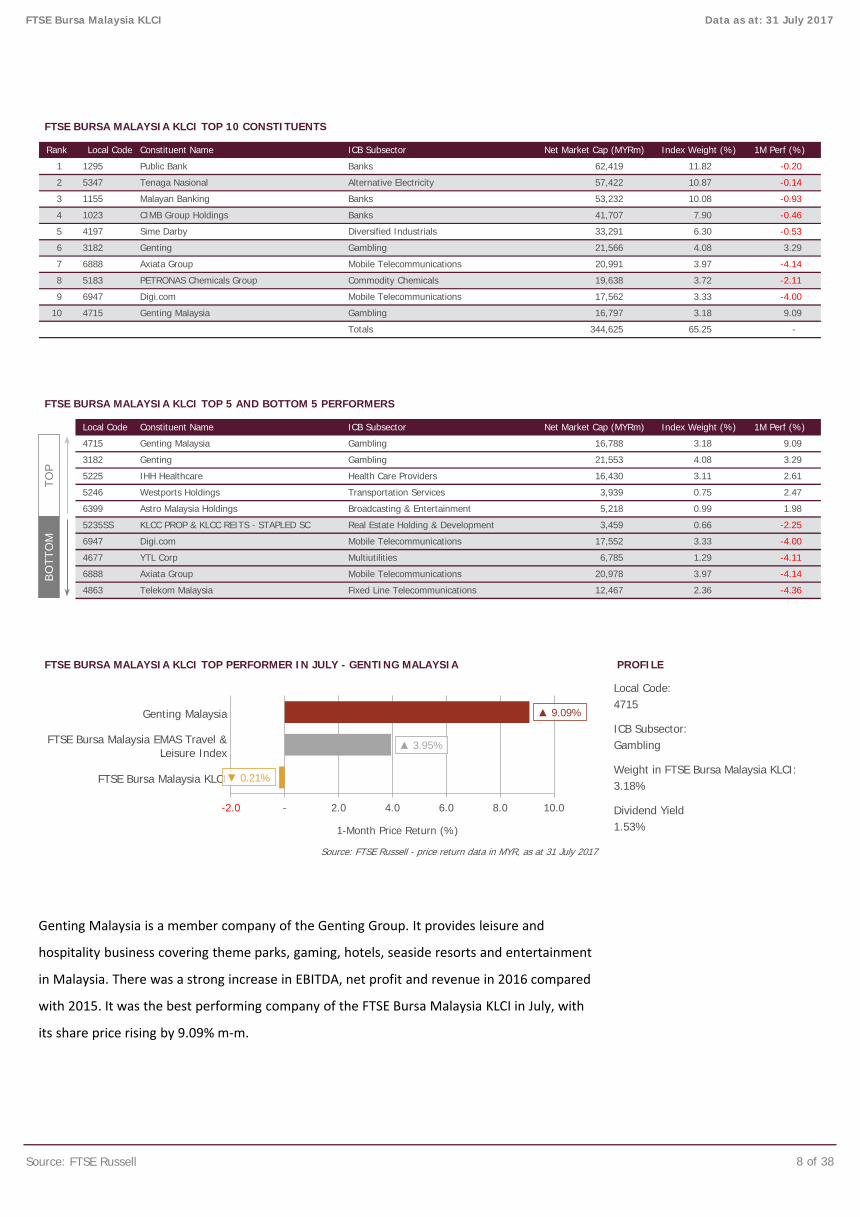
FTSE BURSA MALAYSIA TOP 100 INDEX TOP 5 AND BOTTOM 5 SECTOR PERFORMERS
FTSE BURSA MALAYSIA TOP 100 INDEX TOP 10 CONSTITUENTS
FTSE BURSA MALAYSIA TOP 100 INDEX TOP 5 AND BOTTOM 5 PERFORMERS
Source: FTSE Russell 16 of 38
10 4715 Genting Malaysia
0.06
2,531
9 6947 Digi.com
5210 Bumi Armada Oil Equipment & Services 2,370 0.34 -7.89
101 TMC Life Sciences Health Care Providers
8
53,232 7.60 -0.93
4 1023 CIMB Group Holdings Banks
1651 Malaysian Resources Heavy Construction 1,299 0.19 -11.59
391
5183 PETRONAS Chemicals Group Commodity Chemicals 19,638 2.80 -2.11
-4.00
2.40
1,911 0.27 -7.77
3042 Petron Malaysia Refining & Marketing Exploration & Production 656 0.09 23.63
0166 Inari Amertron Semiconductors 3,457 0.49 21.33
7153 Kossan Rubber Medical Supplies 2,270 0.32 11.46
7
-0.53
8770 Financial Services 3 6,914 0.99 -2.76 34.70 2.98
6530 Fixed Line Telecommunications 2
6888 Axiata Group Mobile Telecommunications 20,991 3.00 -4.14
41,707 5.96 -0.46
Net Market Cap (MYRm) Index Weight (%)
5 4197 Sime Darby Diversified Industrials 33,291 4.75
6 3182 Genting Gambling 21,566 3.08 3.29
Rank Constituent Name ICB Subsector 1M Perf (%)
1 1295 Public Bank Banks 62,419 8.91 -0.20
2 5347 Tenaga Nasional Alternative Electricity 57,422 8.20 -0.14
Local Code
3 1155 Malayan Banking Banks
15,419 2.20 -3.65 -1.69 2.87
2750 Industrial Engineering 1 1,441 0.21 -5.06 86.74 1.18
4.05 20.95 1.61
6570 Mobile Telecommunications 3 53,413 7.63 -2.51 -10.61 3.07
5370 General Retailers 2 2,281 0.33 -2.69 -10.71 4.60
5750 Travel & Leisure 5 48,352 6.90
3760 Personal Goods 1 1,356 0.19 6.25 41.72 2.67
3350 Automobiles & Parts 2 4,592 0.66 5.29 8.08 5.70
1750 Industrial Metals & Mining 1 4,999 0.71 6.34 91.37 1.78
1Y Perf (%) Div Yield (%)
9570 Technology Hardware & Equipment 3 6,579 0.94 13.82 54.93 2.46
9.18
FTSE Bursa Malaysia Top 100 Index Data as at: 31 July 2017
ICB Code ICB Sector Number of Cons Net Market Cap (MYRm) Index Weight (%)
-8.70
Sunway Real Estate Holding & Development
9.09
16,788 2.40 9.09
-8.67
5186 Malaysia Marine and Heavy Engineering Holdings Oil Equipment & Services 290 0.04
Gambling 16,797
9679
Totals 344,625 49.21 -
4715
5211
Local Code Constituent Name ICB Subsector 1M Perf (%)
WCT Holdings Heavy Construction
1M Perf (%)
Mobile Telecommunications 17,562 2.51
0.36
Genting Malaysia Gambling
Net Market Cap (MYRm) Index Weight (%)
TOP
BOTT
OM
TO
P BO
TTO
M
INDEX OVERVIEW
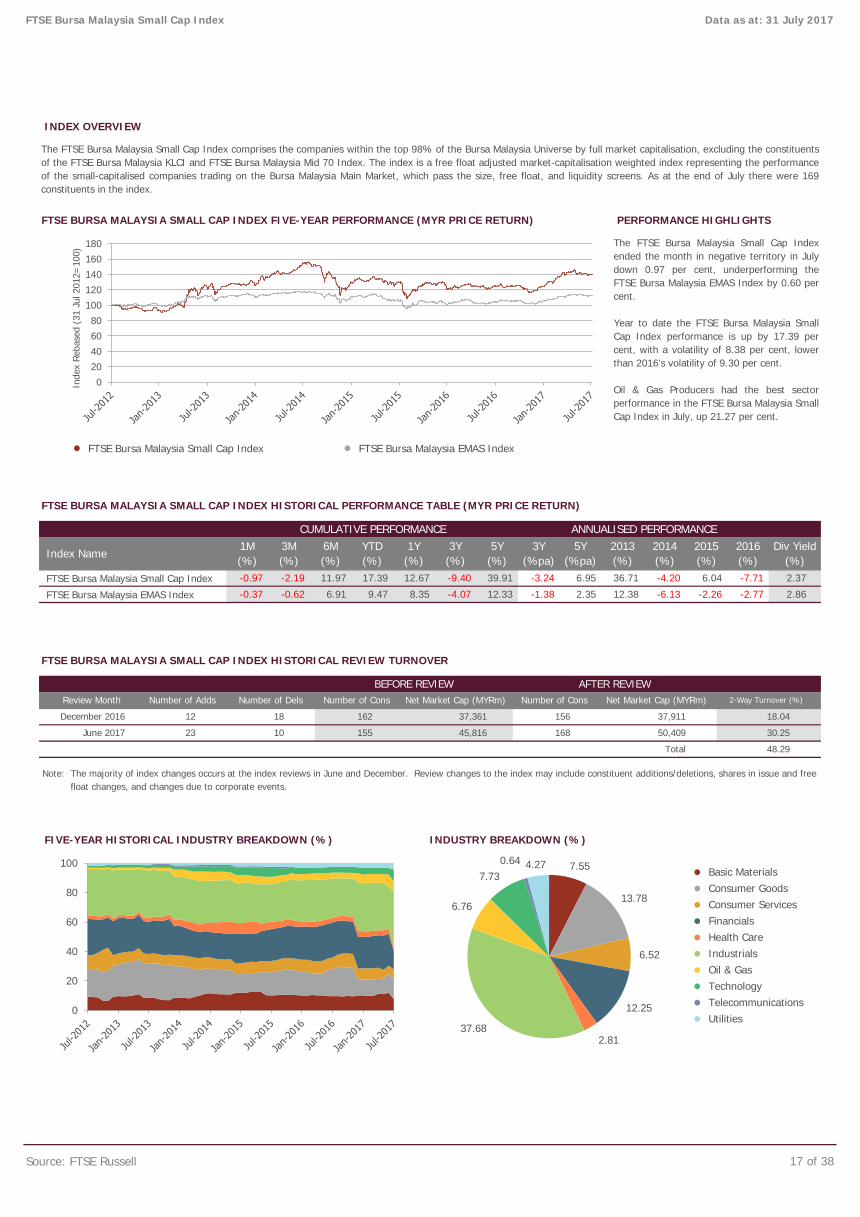
FTSE BURSA MALAYSIA SMALL CAP INDEX FIVE-YEAR PERFORMANCE (MYR PRICE RETURN) PERFORMANCE HIGHLIGHTS
● FTSE Bursa Malaysia Small Cap Index ● FTSE Bursa Malaysia EMAS Index
FTSE BURSA MALAYSIA SMALL CAP INDEX HISTORICAL PERFORMANCE TABLE (MYR PRICE RETURN)
FTSE Bursa Malaysia Small Cap Index
FTSE Bursa Malaysia EMAS Index
FTSE BURSA MALAYSIA SMALL CAP INDEX HISTORICAL REVIEW TURNOVER
FIVE-YEAR HISTORICAL INDUSTRY BREAKDOWN (%) INDUSTRY BREAKDOWN (%)
● Basic Materials
● Consumer Goods
● Consumer Services
● Financials
● Health Care
● Industrials
● Oil & Gas
● Technology
● Telecommunications
● Utilities
Source: FTSE Russell 17 of 38
6.95 6.04
Div Yield(%)
1Y(%)
3Y(%)
5Y(%)
3Y(%pa)
Index Name5Y
(%pa)2014(%)
2015(%)
2016(%)
2013(%)
The FTSE Bursa Malaysia Small Cap Indexended the month in negative territory in Julydown 0.97 per cent, underperforming theFTSE Bursa Malaysia EMAS Index by 0.60 percent.
Year to date the FTSE Bursa Malaysia SmallCap Index performance is up by 17.39 percent, with a volatility of 8.38 per cent, lowerthan 2016’s volatility of 9.30 per cent.
Oil & Gas Producers had the best sectorperformance in the FTSE Bursa Malaysia Small Cap Index in July, up 21.27 per cent.
Data as at: 31 July 2017
The FTSE Bursa Malaysia Small Cap Index comprises the companies within the top 98% of the Bursa Malaysia Universe by full market capitalisation, excluding the constituentsof the FTSE Bursa Malaysia KLCI and FTSE Bursa Malaysia Mid 70 Index. The index is a free float adjusted market-capitalisation weighted index representing the performanceof the small-capitalised companies trading on the Bursa Malaysia Main Market, which pass the size, free float, and liquidity screens. As at the end of July there were 169constituents in the index.
FTSE Bursa Malaysia Small Cap Index
CUMULATIVE PERFORMANCE ANNUALISED PERFORMANCE
36.71 -4.20 -7.71 2.37 39.91
1M(%)
3M(%)
6M(%)
YTD(%)
-3.24
-2.26
11.97 17.39 12.67 -9.40 -0.97 -2.19
-2.77
10 155 45,816 168
Net Market Cap (MYRm) Number of Cons
2.86
48.29
June 2017 23
Number of Cons
6.91 9.47 8.35
BEFORE REVIEW2-Way Turnover (%)
December 2016 12 18 162 37,361
Total
-0.37 -0.62 -4.07 12.33 -1.38 2.35 12.38 -6.13
Review Month Number of Adds Number of Dels Net Market Cap (MYRm)
AFTER REVIEW
50,409 30.25
156 37,911 18.04
0
20
40
60
80
100 7.55
13.78
6.52
12.25
2.81 37.68
6.76
7.73 0.64 4.27
Note: The majority of index changes occurs at the index reviews in June and December. Review changes to the index may include constituent additions/deletions, shares in issue and free float changes, and changes due to corporate events.
020406080
100120140160180
Inde
x R
ebas
ed (
31 J
ul 2
012=
100)

FTSE BURSA MALAYSIA SMALL CAP INDEX TOP 5 AND BOTTOM 5 SECTOR PERFORMERS
FTSE BURSA MALAYSIA SMALL CAP INDEX TOP 10 CONSTITUENTS
FTSE BURSA MALAYSIA SMALL CAP INDEX TOP 5 AND BOTTOM 5 PERFORMERS
Source: FTSE Russell 18 of 38
7.25 5.54
FTSE Bursa Malaysia Small Cap Index
0.00
-6.30
37.86 2.00
Div Yield (%)
0530 Oil & Gas Producers 2 934 1.86 134.11 0.00
ICB Code ICB Sector
2750 Industrial Engineering 9 3,631
2.42
0570
3.745330 Food & Drug Retailers 1
7570
Number of Cons Net Market Cap (MYRm) Index Weight (%) 1M Perf (%)
21.27
914 1.82 4.65
Nonlife Insurance 2 440 0.88 -10.00
6570 Mobile Telecommunications 1 320 0.64 -6.77 7.83
-
0.67
2.01
3204
8530
1,018 2.03
1M Perf (%)
Oil Equipment, Services & Distribution 11 2,453 4.90 -11.18 -33.25
4.41
1,577
0.65 4.42 14.87 1.98
3.15 4.24 11.80 3.582730
2.94
George Kent (Malaysia) Industrial Machinery 4.37
Gas, Water & Multiutilities 5 1,166 2.33 -5.45
1.94 -2.54
5 7668
2.53
6 4383 Jaya Tiasa Holdings Forestry 814
Rank Constituent Name ICB Subsector
2
Hai-O Enterprise Food Retailers & Wholesalers 914 1.82
1.62 -5.08
1 7022 Globetronics Technology Semiconductors 1,086 2.17 1.15
3 5703 Muhibbah Engine Heavy Construction 1,009
9 5204 Prestariang Software 650 1.30
Mitrajaya Holdings Heavy Construction 608 1.21
-8.65
4 3069 Mega First Conventional Electricity 974
-2.92
Supermax Corp Medical Supplies 799 1.59
4.65
-3.52
8 5201 Oldtown Soft Drinks 656 1.31 -4.51
7 7106
Totals 8,527 17.02 -
10 9571
Local Code Constituent Name ICB Subsector 1M Perf (%)
4324 Hengyuan Refining Company Exploration & Production 519 1.04 48.30
Net Market Cap (MYRm) Index Weight (%)
5062 Hua Yang Real Estate Holding & Development 164 0.33 -21.90
5115
5102 Guan Chong Food Products 259 0.52 40.35
128 Frontken Industrial Machinery 351 0.70 22.95
5095 HeveaBoard Building Materials & Fixtures 359 0.72 18.44
-31.82
7160 Pentamaster Industrial Machinery 563 1.12 17.02
5078 Marine & General Business Support Services 101 0.20 -20.92
1589 Iskandar Waterfront City Heavy Construction 603 1.20 -21.52
Alam Maritim Resources Oil Equipment & Services 66 0.13 -28.95
5243 UMW Oil & Gas Oil Equipment & Services 407 0.81
Electronic & Electrical Equipment 7
-2.43
2710 Aerospace & Defense 1 310 0.62 -5.76 9.17
4570 Pharmaceuticals & Biotechnology 2 328
1Y Perf (%)
Data as at: 31 July 2017
Local Code Net Market Cap (MYRm) Index Weight (%)
TOP
BOTT
OM
TO
P BO
TTO
M

INDEX OVERVIEW
FTSE BURSA MALAYSIA FLEDGLING INDEX FIVE-YEAR PERFORMANCE (MYR PRICE RETURN) PERFORMANCE HIGHLIGHTS
● FTSE Bursa Malaysia Fledgling Index ● FTSE Bursa Malaysia EMAS Index
FTSE BURSA MALAYSIA FLEDGLING INDEX HISTORICAL PERFORMANCE TABLE (MYR PRICE RETURN)
FTSE Bursa Malaysia Fledgling Index
FTSE Bursa Malaysia EMAS Index
FTSE BURSA MALAYSIA FLEDGLING INDEX HISTORICAL REVIEW TURNOVER
FIVE-YEAR HISTORICAL INDUSTRY BREAKDOWN (%) INDUSTRY BREAKDOWN (%)
● Basic Materials
● Consumer Goods
● Consumer Services
● Financials
● Health Care
● Industrials
● Oil & Gas
● Technology
● Telecommunications
● Utilities
Source: FTSE Russell 19 of 38
The FTSE Bursa Malaysia Fledgling Index comprises the constituents listed on the Bursa Malaysia Main Market that are not constituents of the FTSE BursaMalaysia EMAS Index. The index is a free float adjusted market-capitalisation weighted index representing the performance of companies ranked below thetop 98% of the Bursa Malaysia Universe. As at the end of July there were 366 constituents in the index.
FTSE Bursa Malaysia Fledgling Index
2.86
6.29 15.45 36.33 11.07 18.18 -1.84 -1.20 16.68
5Y(%)
3Y(%pa)
5Y(%pa)
2013(%)
2014(%)
ANNUALISED PERFORMANCE
Index Name1M(%)
3M(%)
6M(%)
YTD(%)
1Y(%)
Div Yield(%)
20.07
Data as at: 31 July 2017
2015(%)
2016(%)
The FTSE Bursa Malaysia Fledgling Indexended the month in negative territory in Julydown 1.84 per cent, underperforming theFTSE Bursa Malaysia EMAS Index by 1.47 percent.
Year to date the FTSE Bursa MalaysiaFledgling Index performance is up by 21.48per cent, with a volatility of 8.49 per cent,higher than 2016’s volatility of 8.24 per cent.
Technology Hardware & Equipment had thebest sector performance in the FTSE BursaMalaysia Fledgling Index in July, up 14.51 percent.
3Y(%)
-4.54 2.08
15 12 379 20,002 382 20,408
Review Month Number of Adds Number of Dels Net Market Cap (MYRm)
21.48 22.64 105.07
-0.37 -0.62 6.91 9.47 8.35 -4.07 12.33 -1.38 2.35 12.38 -6.13 -2.26 -2.77
CUMULATIVE PERFORMANCE
Total 57.75
June 2017 7 20 379 27,697 366 22,609 40.73
BEFORE REVIEWNumber of Cons Net Market Cap (MYRm) Number of Cons
17.03
2-Way Turnover (%)
December 2016
AFTER REVIEW
0
20
40
60
80
100
Note: The majority of index changes occurs at the index reviews in June and December. Review changes to the index may include constituent additions/deletions, shares in issue and free float changes, and changes due to corporate events.
0
50
100
150
200
250
Inde
x R
ebas
ed (
31 J
ul 2
012=
100)
12.42
24.97
4.23
14.63 1.54
37.09
1.24 3.54 0.15
0.18
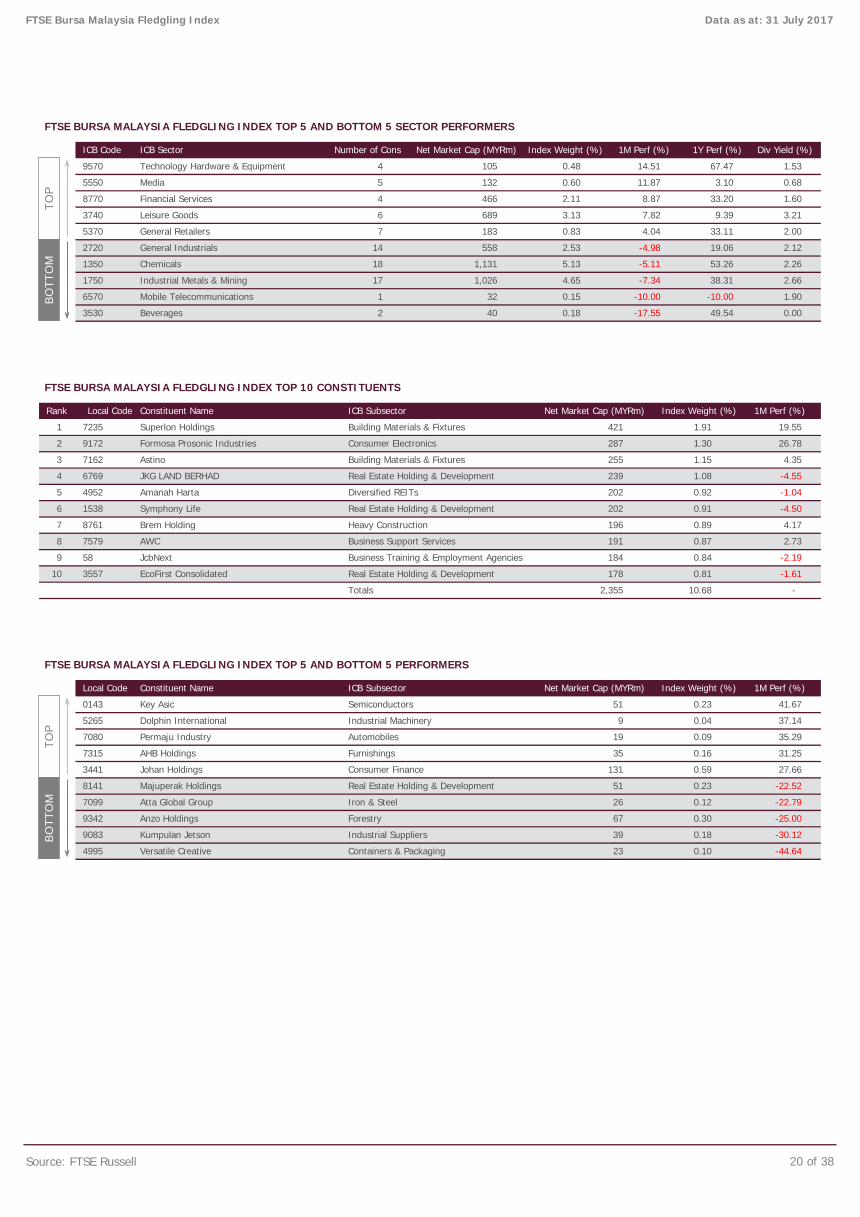
FTSE BURSA MALAYSIA FLEDGLING INDEX TOP 5 AND BOTTOM 5 SECTOR PERFORMERS
FTSE BURSA MALAYSIA FLEDGLING INDEX TOP 10 CONSTITUENTS
FTSE BURSA MALAYSIA FLEDGLING INDEX TOP 5 AND BOTTOM 5 PERFORMERS
Source: FTSE Russell 20 of 38
7080 Permaju Industry Automobiles 19 0.09 35.29
14 558 2.53 -4.98
Chemicals
10.68
0.91 -4.50
18 1,131 5.13 -5.11 53.26 2.26
0.00
Formosa Prosonic Industries 1.30 26.78
-1.61
-
191 0.87 2.73
4.04
6570
2720 General Industrials
5370
Div Yield (%)
9570
FTSE Bursa Malaysia Fledgling Index Data as at: 31 July 2017
33.11
11.87 5
Technology Hardware & Equipment 4 105 0.48 14.51 67.47
132 0.60
33.20
5550 Media
1Y Perf (%)
3.10 0.68
8770 Financial Services 4 466 2.11 8.87
1.53
1.60
ICB Code ICB Sector Number of Cons Net Market Cap (MYRm) Index Weight (%) 1M Perf (%)
9.39 3.21
2.00
38.31 2.66
3740 Leisure Goods 6 689 3.13 7.82
Amanah Harta Diversified REITs 202
1.91 19.55
Constituent Name ICB Subsector
2.12
3530
1350
1750 Industrial Metals & Mining 17 1,026 4.65 -7.34
19.06
General Retailers 7 183 0.83
1 7235 Superlon Holdings Building Materials & Fixtures 421
1M Perf (%)
Beverages 2 40 0.18 -17.55 49.54
-10.00 1.90
Rank Local Code Net Market Cap (MYRm) Index Weight (%)
Mobile Telecommunications 1 32 0.15 -10.00
3 7162 Astino Building Materials & Fixtures 255 1.15
9172
0.84
4.17
8 7579 AWC Business Support Services
4952
9 58 JcbNext Business Training & Employment Agencies 184
4.35
-2.19
4 6769 JKG LAND BERHAD Real Estate Holding & Development 239 1.08 -4.55
5
2 Consumer Electronics 287
7 8761 Brem Holding Heavy Construction 196 0.89
0.92 -1.04
6 1538 Symphony Life Real Estate Holding & Development 202
10 3557 EcoFirst Consolidated Real Estate Holding & Development 178 0.81
Totals 2,355
Local Code Net Market Cap (MYRm)
0143 Key Asic Semiconductors 51 0.23 41.67
5265 Dolphin International Industrial Machinery 9 0.04 37.14
Constituent Name ICB Subsector 1M Perf (%)
7315 AHB Holdings Furnishings 35 0.16 31.25
3441 Johan Holdings Consumer Finance 131 0.59 27.66
8141 Majuperak Holdings Real Estate Holding & Development 51 0.23 -22.52
9342 Anzo Holdings Forestry 67 0.30 -25.00
9083 Kumpulan Jetson Industrial Suppliers 39 0.18
4995 Versatile Creative Containers & Packaging 23 0.10 -44.64
-22.79
-30.12
0.127099 Atta Global Group Iron & Steel 26
Index Weight (%)
TOP
BOTT
OM
TO
P BO
TTO
M

INDEX OVERVIEW
FTSE BURSA MALAYSIA EMAS SHARIAH INDEX FIVE-YEAR PERFORMANCE (MYR PRICE RETURN) PERFORMANCE HIGHLIGHTS
● FTSE Bursa Malaysia EMAS Shariah Index ● FTSE Bursa Malaysia EMAS Index
FTSE BURSA MALAYSIA EMAS SHARIAH INDEX HISTORICAL PERFORMANCE TABLE (MYR PRICE RETURN)
FTSE Bursa Malaysia EMAS Shariah Index
FTSE Bursa Malaysia EMAS Index
FTSE BURSA MALAYSIA EMAS SHARIAH INDEX HISTORICAL REVIEW TURNOVER
Source: FTSE Russell 21 of 38
451,145
Data as at: 31 July 2017
BEFORE REVIEW
2.86 -0.37 -2.26
Div Yield(%)
3M(%)
2.43 13.29 -6.14
This index comprises the constituents of the FTSE Bursa Malaysia EMAS Shariah Index that are Shariah compliant according to the Securities Commission'sSAC screening methodology. As at the end of July there were 209 constituents in the index.
FTSE Bursa Malaysia EMAS Shariah Index
5.85 4.25 -4.98 12.76 -1.69 -4.17
The FTSE Bursa Malaysia EMAS ShariahIndex ended the month in negativeterritory in July down 0.82 per cent,underperforming the FTSE BursaMalaysia EMAS Index by 0.45 per cent.
Year to date the FTSE Bursa MalaysiaEMAS Shariah Index performance is upby 5.85 per cent, with a volatility of 5.81per cent, lower than 2016’s volatility of7.71 per cent.
2.35
1M(%)
6M(%)
Number of Cons
8.51
5.65
2-Way Turnover (%)Number of Cons Net Market Cap (MYRm)
197
-0.62 6.91 9.47 8.35 -4.07 12.33 -1.38 2.35 12.38 -6.13
CUMULATIVE PERFORMANCE ANNUALISED PERFORMANCE
-0.82
408,689
-2.77
YTD(%)
2013(%)
2014(%)
2015(%)
2016(%)
4.01 -1.96
Total 14.16
June 2017
1Y(%)
3Y(%)
2.54
December 2016 15 24 206
23 10 195 443,791 208
411,103
5Y(%)
3Y(%pa)
5Y(%pa)
Index Name
Net Market Cap (MYRm) Number of DelsNumber of AddsReview Month
AFTER REVIEW
Note: The majority of index changes occurs at the index reviews in June and December. Review changes to the index may include constituent additions/deletions, shares in issue and free float changes, and changes due to corporate events.
0
20
40
60
80
100
120
140
Inde
x R
ebas
ed (
31 J
ul 2
012=
100)
The general criteria of the Securities Commission's SAC screening methodology stipulate that the SAC Shariah compliant companies must not be involved in any of the following core activities:
a) Financial services based on riba (interest) b) Gambling
c) Manufacture or sale of non-halal products or related products d) Conventional insurance
e) Entertainment activities that are non-permissible according to Shariah f) Manufacture or sale of tobacco based products or related products
g) Stockbroking or share trading in Shariah non-compliant securities h) Other activities deemed non-permissible according to Shariah
This list is not exhaustive and is provided as a basic guidance to the board principles involved.
Constituent changes to the FTSE Bursa Malaysia EMAS Shariah Index following the screening processes are implemented after the close of business following the third Friday in June and December.

FIVE-YEAR HISTORICAL INDUSTRY BREAKDOWN (%) INDUSTRY BREAKDOWN (%)
● Basic Materials
● Consumer Goods
● Consumer Services
● Financials
● Health Care
● Industrials
● Oil & Gas
● Technology
● Telecommunications
● Utilities
FTSE BURSA MALAYSIA EMAS SHARIAH INDEX TOP 10 CONSTITUENTS
FTSE BURSA MALAYSIA EMAS SHARIAH INDEX TOP 5 AND BOTTOM 5 PERFORMERS
Source: FTSE Russell 22 of 38
FTSE Bursa Malaysia EMAS Shariah Index Data as at: 31 July 2017
Axiata Group Mobile Telecommunications 20,991
4197
-0.14
2 Sime Darby Diversified Industrials 33,291 7.53 -0.53
1
-4.14
21.333,457 0.78
0.08 18.44
1.08
4 5183 PETRONAS Chemicals Group Commodity Chemicals 19,638 4.44
10 2.82
0.45
8
4863 Telekom Malaysia Fixed Line Telecommunications 12,475
6012
1M Perf (%)Rank
7 3.36
3.28
6 5225
Maxis Mobile Telecommunications
9 6033 PETRONAS Gas Gas Distribution
Totals 222,064 50.21
3.72
4.75
0166
Heavy Construction
ICB Subsector 1M Perf (%)
3042 Petron Malaysia Refining & Marketing Exploration & Production 656 0.15 23.63
128 Frontken Industrial Machinery 351 0.08 22.95
Local Code Net Market Cap (MYRm) Index Weight (%)Constituent Name
5078
1.80
17,562 -4.00
14,522
12.985347
-2.11
5 Digi.com Mobile Telecommunications
2.61
3.97
6888
IHH Healthcare Health Care Providers 16,440
1961 IOI Farming, Fishing & Plantations 14,863
Constituent Name ICB Subsector
6947
3
-20.92
7160 Pentamaster
5243 UMW Oil & Gas Oil Equipment & Services 407 0.09 -31.82
1589 Iskandar Waterfront City
Hua Yang Real Estate Holding & Development 164
0.14
0.02
5062
17.020.13
603
Business Support Services 101
Inari Amertron Semiconductors
0.04 -21.90
5115 Alam Maritim Resources Oil Equipment & Services 66 0.01 -28.95
5095 HeveaBoard Building Materials & Fixtures 359
Net Market Cap (MYRm) Index Weight (%)
Tenaga Nasional Alternative Electricity 57,422
-21.52
Industrial Machinery 563
-
14,861 3.36
-4.36
Local Code
Marine & General
0
20
40
60
80
100 6.60
12.75
0.58
6.03
7.32
24.72 6.08
2.29
15.64
18.00
TOP
BOTT
OM

INDEX OVERVIEW
FTSE BURSA MALAYSIA SMALL CAP SHARIAH INDEX FIVE-YEAR PERFORMANCE (MYR PRICE RETURN) PERFORMANCE HIGHLIGHTS
● FTSE Bursa Malaysia Small Cap Shariah Index ● FTSE Bursa Malaysia Small Cap Index
FTSE BURSA MALAYSIA SMALL CAP SHARIAH INDEX HISTORICAL PERFORMANCE TABLE (MYR PRICE RETURN)
FTSE Bursa Malaysia Small Cap Shariah Index
FTSE Bursa Malaysia Small Cap Index
FTSE BURSA MALAYSIA SMALL CAP SHARIAH INDEX HISTORICAL REVIEW TURNOVER
Source: FTSE Russell 23 of 38
31,166
41,333
Total
12 21
22 9
December 2016
June 2017 129 36,623 142 35.94
60.86
BEFORE REVIEW AFTER REVIEWReview Month Number of Adds Number of Dels Number of Cons Net Market Cap (MYRm) Number of Cons Net Market Cap (MYRm) 2-Way Turnover (%)
140 31,911 131 24.92
-1.93 -3.65 10.77 15.66 9.64 -10.88 40.07 -3.77 6.97 39.71 -5.29 9.51 -9.42 2.44
-0.97 -2.19 11.97 17.39 12.67 -9.40 39.91 -3.24 6.95 36.71 -4.20 6.04 -7.71 2.37
FTSE Bursa Malaysia Small Cap Shariah Index Data as at: 31 July 2017
This index comprises the constituents of the FTSE Bursa Malaysia Small Cap Shariah Index that are Shariah compliant according to the SecuritiesCommission's SAC screening methodology. As at the end of July there were 143 constituents in the index.
The FTSE Bursa Malaysia Small CapShariah Index ended the month innegative territory in July down 1.93 percent, underperforming the FTSE BursaMalaysia Small Cap Index by 0.96 percent.
Year to date the FTSE Bursa MalaysiaSmall Cap Shariah Index performance isup by 15.66 per cent, with a volatility of8.36 per cent, lower than 2016’svolatility of 9.66 per cent.
CUMULATIVE PERFORMANCE ANNUALISED PERFORMANCE
Index Name1M(%)
3M(%)
6M(%)
YTD(%)
1Y(%)
3Y(%)
5Y(%)
3Y(%pa)
5Y(%pa)
2013(%)
2014(%)
2015(%)
2016(%)
Div Yield(%)
Note: The majority of index changes occurs at the index reviews in June and December. Review changes to the index may include constituent additions/deletions, shares in issue and free float changes, and changes due to corporate events.
The FTSE Bursa Malaysia Small Cap Shariah Index comprises of all the small cap companies within the FTSE Bursa Malaysia EMAS Shariah Index.
This index is designed to provide investors with a precise benchmark for Shariah compliant investment in Malaysian small cap companies.
The FTSE Bursa Malaysia Small Cap Shariah Index was developed in response to the needs of market practitioners who noted the lack of a benchmark to track the performance of Shariah compliant small cap companies. Constituents are selected from the universe of the FTSE Bursa Malaysia Small Cap Index according to the Malaysian Securities Commission’s Shariah Advisory Council (SAC) screening methodology.
The index is based on FTSE’s award winning methodology which includes free float adjustment and liquidity screens and is managed in accordance with a clear and transparent set of index rules governed by an independent index committee. It can be used as the basis of ETFs, derivatives and other index-linked products and performance benchmark.
020406080
100120140160180
Inde
x R
ebas
ed (
31 J
ul 2
012=
100)

FIVE-YEAR HISTORICAL INDUSTRY BREAKDOWN (%) INDUSTRY BREAKDOWN (%)
● Basic Materials
● Consumer Goods
● Consumer Services
● Financials
● Health Care
● Industrials
● Oil & Gas
● Technology
● Telecommunications
● Utilities
FTSE BURSA MALAYSIA SMALL CAP SHARIAH INDEX TOP 10 CONSTITUENTS
FTSE BURSA MALAYSIA SMALL CAP SHARIAH INDEX TOP 5 AND BOTTOM 5 PERFORMERS
Source: FTSE Russell 24 of 38
5115 Alam Maritim Resources Oil Equipment & Services 66 0.16 -28.95
5243 UMW Oil & Gas Oil Equipment & Services 407 1.00 -31.82
5078 Marine & General Business Support Services 101 0.25 -20.92
1589 Iskandar Waterfront City Heavy Construction 603 1.48 -21.52
5062 Hua Yang Real Estate Holding & Development 164 0.40 -21.90
7160 Pentamaster Industrial Machinery 563 1.39 17.02
7161 Kerjaya Prospek Group Heavy Construction 488 1.20 13.80
5125 Pantech Group Holdings Iron & Steel 230 0.57 13.79
Local Code Constituent Name ICB Subsector Net Market Cap (MYRm) Index Weight (%) 1M Perf (%)
128 Frontken Industrial Machinery 351 0.86 22.95
5095 HeveaBoard Building Materials & Fixtures 359 0.88 18.44
9 5038 KSL Holdings Real Estate Holding & Development 582 1.43 0.00
10 7160 Pentamaster Industrial Machinery 563 1.39 17.02
Totals 7,689 18.91 -
6 5204 Prestariang Software 650 1.60 -8.65
7 9571 Mitrajaya Holdings Heavy Construction 608 1.49 -2.92
8 1589 Iskandar Waterfront City Heavy Construction 603 1.48 -21.52
3 3069 Mega First Conventional Electricity 974 2.40 -2.54
4 4383 Jaya Tiasa Holdings Forestry 814 2.00 -5.08
5 7106 Supermax Corp Medical Supplies 799 1.96 -3.52
Rank Local Code Constituent Name ICB Subsector Net Market Cap (MYRm) Index Weight (%) 1M Perf (%)
1 7022 Globetronics Technology Semiconductors 1,086 2.67 1.15
2 5703 Muhibbah Engine Heavy Construction 1,009 2.48 2.94
FTSE Bursa Malaysia Small Cap Shariah Index Data as at: 31 July 2017
TOP
BOTT
OM
0
20
40
60
80
100 7.56
12.82
3.24
9.84
3.47
41.27
7.05
8.70 0.79 5.26

INDEX OVERVIEW
FTSE BURSA MALAYSIA HIJRAH SHARIAH INDEX FIVE-YEAR PERFORMANCE (MYR PRICE RETURN) PERFORMANCE HIGHLIGHTS
● FTSE Bursa Malaysia Hijrah Shariah Index ● FTSE Bursa Malaysia EMAS Index
FTSE BURSA MALAYSIA HIJRAH SHARIAH INDEX HISTORICAL PERFORMANCE TABLE (MYR PRICE RETURN)
FTSE Bursa Malaysia Hijrah Shariah Index
FTSE Bursa Malaysia EMAS Index
FTSE BURSA MALAYSIA HIJRAH SHARIAH INDEX HISTORICAL REVIEW TURNOVER
Source: FTSE Russell 25 of 38
Data as at: 31 July 2017FTSE Bursa Malaysia Hijrah Shariah Index
-6.31 2.58
Total 13.86
December 2016 3 3 30 305,370 30 305,369 5.43
June 2017 2 2 30 326,277 30 330,673 8.43
14.92 3.64 1.90 -4.71 -2.00 2.28 -0.94 2.82 13.01 1.01
Review Month Number of Adds Number of Dels Net Market Cap (MYRm)
-0.37 -0.62 6.91 9.47 8.35 -4.07 12.33 -1.38 2.35 12.38 -6.13 -2.26 -2.77
2-Way Turnover (%)
AFTER REVIEWBEFORE REVIEWNumber of Cons Net Market Cap (MYRm) Number of Cons
2.86
-1.05
5Y(%)
3Y(%pa)
5Y(%pa)
2013(%)
2014(%)
2015(%)
2016(%)
Div Yield(%)
Index Name
CUMULATIVE PERFORMANCE ANNUALISED PERFORMANCE1M(%)
The FTSE Bursa Malaysia Hijrah ShariahIndex ended the month in negativeterritory in July down 1.05 per cent,underperforming the FTSE BursaMalaysia EMAS Index by 0.68 per cent.
Year to date the FTSE Bursa MalaysiaHijrah Index performance is up by 3.64per cent, with a volatility of 6.07 percent, lower than 2016’s volatility of 7.72per cent.
3M(%)
6M(%)
YTD(%)
-1.60
1Y(%)
3Y(%)
This index comprises the largest 30 companies by full market capitalisation of the FTSE Bursa Malaysia EMAS Index that are in compliance with Yasaar and the Securities Commission's SAC screening methodology. As at the end of July there were 30 constituents in the index.
The FTSE Bursa Malaysia Hijrah Shariah Index has been designed to be used as a basis of Shariah-compliant investment products that meet the screening requirements of international Islamic investors. Companies in the index are screened by the Malaysian Securities Commission's Shariah Advisory Council (SAC) and the leading global Shariah consultancy, Yasaar Ltd, against a clear set of guiding principles.
After companies have been screened by their business sector activity, the remaining companies are further examined on their finances to ensure that those companies are Shariah compliant. Only those companies that pass the following financial ratios will be considered Shariah complaint:
a) Debt is less than 33.333 per cent of total assets
b) Cash and Interest bearing items are less than 33.333 per cent total assets
c) Accounts receivable and cash are less than 50 per cent of total assets
d) Total interest and non compliant activities income should not exceed 5 per cent of total revenue
Appropriate purification of dividends at 5 per cent. This ratio calculates the recommended purification amount to be paid by the investor.
Note: The majority of index changes occurs at the index reviews in June and December. Review changes to the index may include constituent additions/deletions, shares in issue and free float changes, and changes due to corporate events.
0
20
40
60
80
100
120
140
Inde
x R
ebas
ed (
31 J
ul 2
012=
100)
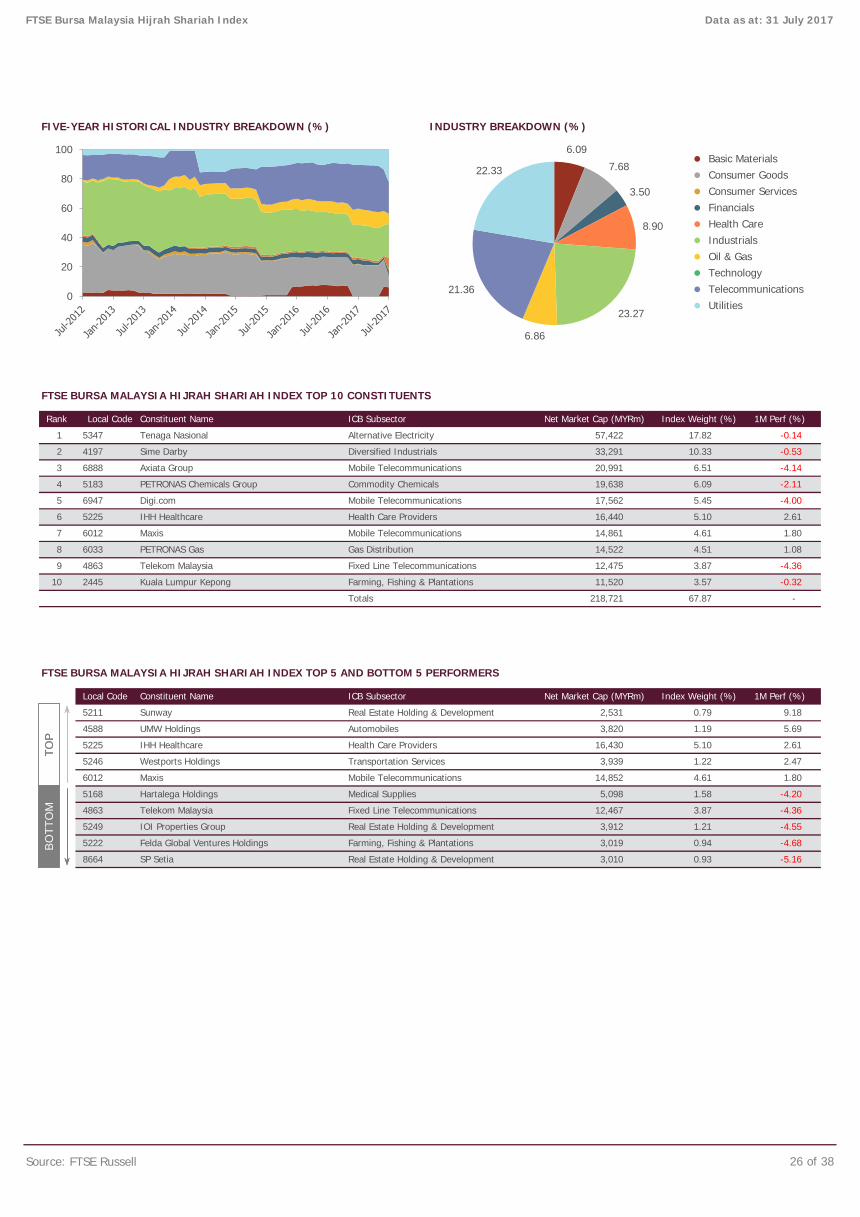
FIVE-YEAR HISTORICAL INDUSTRY BREAKDOWN (%) INDUSTRY BREAKDOWN (%)
● Basic Materials
● Consumer Goods
● Consumer Services
● Financials
● Health Care
● Industrials
● Oil & Gas
● Technology
● Telecommunications
● Utilities
FTSE BURSA MALAYSIA HIJRAH SHARIAH INDEX TOP 10 CONSTITUENTS
FTSE BURSA MALAYSIA HIJRAH SHARIAH INDEX TOP 5 AND BOTTOM 5 PERFORMERS
Source: FTSE Russell 26 of 38
FTSE Bursa Malaysia Hijrah Shariah Index Data as at: 31 July 2017
4197
Local Code Net Market Cap (MYRm) Index Weight (%)
PETRONAS Chemicals Group
Rank Constituent Name ICB Subsector 1M Perf (%)
1 5347 Tenaga Nasional Alternative Electricity 57,422 17.82 -0.14
Sime Darby Diversified Industrials 33,291 10.33 -0.53
3 6888 Axiata Group Mobile Telecommunications 20,991 6.51 -4.14
3.57 -0.32
Commodity Chemicals 19,638 6.09 -2.11
5 6947 Digi.com Mobile Telecommunications 17,562 5.45 -4.00
6 Health Care Providers
5183
2
Felda Global Ventures Holdings Farming, Fishing & Plantations 3,019
Real Estate Holding & Development 3,010
3,820 1.19
5225 IHH Healthcare
10 2445 Kuala Lumpur Kepong Farming, Fishing & Plantations 11,520
16,440 5.10
-4.68
8664
Net Market Cap (MYRm) Index Weight (%)
Totals 218,721 67.87 -
Local Code Constituent Name ICB Subsector 1M Perf (%)
0.93
Mobile Telecommunications 14,852
IOI Properties Group Real Estate Holding & Development 3,912
Fixed Line Telecommunications 12,475 3.87 -4.36
4588 UMW Holdings Automobiles
4.61
5246 Westports Holdings
-5.16
1.58
SP Setia
0.94
Real Estate Holding & Development
Medical Supplies 5,098
Maxis
Fixed Line Telecommunications 12,467 3.87 -4.36
5211 Sunway
4
3,939 1.22 2.47
6012
6033 PETRONAS Gas Gas Distribution 14,522 4.51 1.08
9 4863 Telekom Malaysia
2.61
7 6012 Maxis Mobile Telecommunications 14,861 4.61 1.80
8
Transportation Services
5222
5168 Hartalega Holdings
5225 IHH Healthcare
5.69
-4.20
1.80
2,531 0.79 9.18
Health Care Providers 16,430 5.10 2.61
4863 Telekom Malaysia
1.21 -4.555249
6.09
7.68
3.50
8.90
23.27
6.86
21.36
22.33
0
20
40
60
80
100
TOP
BOTT
OM
TO
P BO
TTO
M

INDEX OVERVIEW
FTSE4GOOD BURSA MALAYSIA INDEX ONE-YEAR PERFORMANCE (MYR PRICE RETURN) PERFORMANCE HIGHLIGHTS
● FTSE4Good Bursa Malaysia Index ● FTSE Bursa Malaysia EMAS Index
FTSE4GOOD BURSA MALAYSIA INDEX HISTORICAL PERFORMANCE TABLE (MYR PRICE RETURN)
FTSE4Good Bursa Malaysia Index
FTSE Bursa Malaysia EMAS Index
FTSE4GOOD BURSA MALAYSIA INDEX HISTORICAL REVIEW TURNOVER
Source: FTSE Russell 27 of 38
June 2017 3 2 42 441,071 43 466,479 11.08
Total 18.46
BEFORE REVIEW AFTER REVIEWReview Month Number of Adds Number of Dels Number of Cons Net Market Cap (MYRm) Number of Cons Net Market Cap (MYRm) 2-Way Turnover (%)
December 2016 6 2 38 384,204 42 396,884 7.38
-0.89 0.30 6.30 8.22 7.33 -4.51 - -1.53 - - -3.38 -3.42 -4.06 3.21
-0.37 -0.62 6.91 9.47 8.35 -4.07 12.33 -1.38 2.35 12.38 -6.13 -2.26 -2.77 2.86
FTSE4Good Bursa Malaysia Index Data as at: 31 July 2017
This index comprises the constituents of the Malaysian companies with leading corporate responsibility practices according to the FTSE4Good BursaMalaysia Index. As at the end of July there were 43 constituents in the index.
The FTSE4Good Bursa Malaysia Indexended the month in negative territory inJuly down 0.89 per cent,underperforming the FTSE BursaMalaysia EMAS Index by 0.52 per cent.
Year to date the FTSE4Good BursaMalaysia Index performance is up by8.22 per cent, with a volatility of 5.78per cent, lower than 2016’s volatility of7.62 per cent.
CUMULATIVE PERFORMANCE ANNUALISED PERFORMANCE
Index Name1M(%)
3M(%)
6M(%)
YTD(%)
1Y(%)
3Y(%)
5Y(%)
3Y(%pa)
5Y(%pa)
2013(%)
2014(%)
2015(%)
2016(%)
Div Yield(%)
Note: The majority of index changes occurs at the index reviews in June and December. Review changes to the index may include constituent additions/deletions, shares in issue and free float changes, and changes due to corporate events.
0
20
40
60
80
100
120
Inde
x R
ebas
ed (
29 J
ul 2
016=
100)
Note: The majority of index changes occurs at the index reviews in June and December. Review changes to the index may include constituent additions/deletions, shares in issue and free float changes, and changes due to corporate events.
Note: The majority of index changes occurs at the index reviews in June and December. Review changes to the index may include constituent additions/deletions, shares in issue and free float changes, and changes due to corporate events.
Note: The majority of index changes occurs at the index reviews in June and December. Review changes to the index may include constituent additions/deletions, shares in issue and free float changes, and changes due to corporate events.
The FTSE4Good Bursa Malaysia Index is designed to measure the performance of companies demonstrating strong Environmental, Social and Governance (ESG) practices. Constituents of the FTSE Bursa Malaysia EMAS Index that pass the eligibility criteria detailed in the FTSE4Good Index Inclusion Rules qualify as constituent members of the index.
The FTSE4Good Index Inclusion Rules can be accessed using the following link:
http://www.ftse.com/products/indices/FTSE4Good
Screening highlights: a) Eligible constituents must be a member of the top 200 Malaysian stocks in the FTSE Bursa Malaysia EMAS Index at the semi-annual review. b) Companies which manufacture the following products are excluded from the FTSE4Good Bursa Malaysia Index:
1. Tobacco 2. Weapons systems 3. Components for controversial weapons; cluster munitions, anti-personnel mines, depleted uranium, chemical/biological weapons and nuclear weapons

ONE-YEAR HISTORICAL INDUSTRY BREAKDOWN (%) INDUSTRY BREAKDOWN (%)
● Basic Materials
● Consumer Goods
● Consumer Services
● Financials
● Health Care
● Industrials
● Oil & Gas
● Technology
● Telecommunications
● Utilities
FTSE4GOOD BURSA MALAYSIA INDEX TOP 10 CONSTITUENTS
FTSE4GOOD BURSA MALAYSIA INDEX TOP 5 AND BOTTOM 5 PERFORMERS
Source: FTSE Russell 28 of 38
5186 Malaysia Marine and Heavy Engineering Holdings Oil Equipment & Services 290 0.06 -8.70
1651 Malaysian Resources Heavy Construction 1,299 0.28 -11.59
5210 Bumi Armada Oil Equipment & Services 2,370 0.52 -7.89
8567 Salcon Water 264 0.06 -8.04
5204 Prestariang Software 649 0.14 -8.65
78 GD Express Carrier Delivery Services 1,096 0.24 8.00
5005 Unisem Semiconductors 1,904 0.42 7.26
5139 AEON Credit Service Consumer Finance 1,108 0.24 6.58
Local Code Constituent Name ICB Subsector Net Market Cap (MYRm) Index Weight (%) 1M Perf (%)
4324 Hengyuan Refining Company Exploration & Production 519 0.11 48.30
5211 Sunway Real Estate Holding & Development 2,531 0.55 9.18
9 6012 Maxis Mobile Telecommunications 14,861 3.25 1.80
10 6033 PETRONAS Gas Gas Distribution 14,522 3.18 1.08
Totals 335,645 73.39 -
6 6888 Axiata Group Mobile Telecommunications 20,991 4.59 -4.14
7 5183 PETRONAS Chemicals Group Commodity Chemicals 19,638 4.29 -2.11
8 6947 Digi.com Mobile Telecommunications 17,562 3.84 -4.00
3 1155 Malayan Banking Banks 53,232 11.64 -0.93
4 1023 CIMB Group Holdings Banks 41,707 9.12 -0.46
5 4197 Sime Darby Diversified Industrials 33,291 7.28 -0.53
FTSE4Good Bursa Malaysia Index Data as at: 31 July 2017
Rank Local Code Constituent Name ICB Subsector Net Market Cap (MYRm) Index Weight (%) 1M Perf (%)
1 1295 Public Bank Banks 62,419 13.65 -0.20
2 5347 Tenaga Nasional Alternative Electricity 57,422 12.56 -0.14
TOP
BOTT
OM
0
20
40
60
80
100 4.29 2.59 1.14
40.42
2.68
14.42
2.21 0.56
14.41
17.27

INDEX OVERVIEW
FTSE BURSA MALAYSIA PALM OIL PLANTATION INDEX FIVE-YEAR PERFORMANCE (MYR PRICE RETURN) PERFORMANCE HIGHLIGHTS
● FTSE Bursa Malaysia Palm Oil Plantation Index ● FTSE Bursa Malaysia EMAS Index
FTSE BURSA MALAYSIA PALM OIL PLANTATION INDEX HISTORICAL PERFORMANCE TABLE (MYR PRICE RETURN)
FTSE Bursa Malaysia Palm Oil Plantation Index
FTSE Bursa Malaysia EMAS Index
FTSE BURSA MALAYSIA PALM OIL PLANTATION INDEX HISTORICAL REVIEW TURNOVER
Source: FTSE Russell 29 of 38
64,917 25.55
-5.06 -2.33
62,749 9
Total
5Y(%)
Net Market Cap (MYRm) Number of Dels
AFTER REVIEW
2013(%)
2014(%)
Index Name
-0.48
1 1 9
48.35
-6.13 -2.26
2-Way Turnover (%)
3Y(%pa)
5Y(%pa)
-2.77 2.86
Net Market Cap (MYRm)
0
Review Month Number of Adds
10.11 -8.06
December 2016
Number of Cons
9 72,333 10
0.21
Number of Cons
BEFORE REVIEW
-0.37 -0.62 6.91 9.47 8.35 -4.07 12.33 -1.38 2.35 12.38
June 2017 1 70,567 22.81
-14.41 -11.10 -0.41
1Y(%)
3Y(%)
This index comprises the constituents of the FTSE Bursa Malaysia EMAS Index that derive substantial revenue from palm oil activities. As at the end of Julythere were 10 constituents in the index.
FTSE Bursa Malaysia Palm Oil PlantationIndex ended the month in negativeterritory in July down 2.45 per cent,underperforming the FTSE BursaMalaysia EMAS Index by 2.08 per cent.
Year to date the FTSE Bursa MalaysiaPalm Oil Plantation Index performance isdown by 1.51 per cent, with a volatilityof 10.10 per cent, lower than 2016’svolatility of 12.72 per cent.
CUMULATIVE PERFORMANCE ANNUALISED PERFORMANCE1M(%)
3M(%)
6M(%)
YTD(%)
2016(%)
Div Yield(%)
-2.45 -5.80 -6.85 -1.51
Data as at: 31 July 2017
2015(%)
1.52
FTSE Bursa Malaysia Palm Oil Plantation Index
The FTSE Bursa Malaysia Palm Oil Plantation Index has been designed to provide easy access to investors who wish to participate in Malaysia’s burgeoning palm oil industry. This benchmark index comprises palm oil related companies from the underlying FTSE Bursa Malaysia EMAS Index and aims to capture the performance of companies that earn a substantial proportion of their revenue from palm oil activities. Palm oil activities include production, ownership or operation of palm oil and palm oil plantations.
Screening Highlights:
• Eligible constituents must be a member of the FTSE Bursa Malaysia EMAS Index at the semiannual review.
• To be included in the index a company is required to have greater than 30% of total revenue from palm oil related activities.
• Existing constituents will no longer be eligible if total revenue from palm oil related activities falls below 20%.
Note: The majority of index changes occurs at the index reviews in June and December. Review changes to the index may include constituent additions/deletions, shares in issue and free float changes, and changes due to corporate events.
0
20
40
60
80
100
120
140
Inde
x R
ebas
ed (
31 J
ul 2
012=
100)

FIVE-YEAR HISTORICAL INDUSTRY BREAKDOWN (%) INDUSTRY BREAKDOWN (%)
● Basic Materials
● Consumer Goods
● Consumer Services
● Financials
● Health Care
● Industrials
● Oil & Gas
● Technology
● Telecommunications
● Utilities
FTSE BURSA MALAYSIA PALM OIL PLANTATION INDEX TOP 10 CONSTITUENTS
FTSE BURSA MALAYSIA PALM OIL PLANTATION INDEX TOP 5 AND BOTTOM 5 PERFORMERS
Source: FTSE Russell 30 of 38
1961
Constituent Name ICB Subsector 1M Perf (%)Local Code
10.33 -
Net Market Cap (MYRm) Index Weight (%)
IOI Farming, Fishing & Plantations 14,855
5012 Ta Ann Holdings Forestry 794 10.29 -1.13
10.05 -0.53
Farming, Fishing & Plantations 11,520 10.20 -0.32
10.20 -0.32
10.05
10.33 0.00
2445 Kuala Lumpur Kepong Farming, Fishing & Plantations 11,513
1996 Kretam Holdings Farming, Fishing & Plantations 299 10.02 -2.70
Forestry 814 9.60 -5.08
10
1996 Kretam Holdings Farming, Fishing & Plantations 299
Forestry
Totals 68,926 100.00 -
33,272
0.45
8 2054 Tdm Farming, Fishing & Plantations 352 9.60 -7.44
9
9.60 -7.44
2291 Genting Plantations Farming, Fishing & Plantations 3,838 9.84 -2.90
5222 Felda Global Ventures Holdings Farming, Fishing & Plantations 3,019 10.02 -4.68
4383 Jaya Tiasa Holdings
9318 Fitters Diversified Electronic Equipment 131
-2.70
Farming, Fishing & Plantations 3522054 Tdm
4197 Sime Darby Diversified Industrials
10.02
813 9.60 -5.08
9318 Fitters Diversified Electronic Equipment 131
7 5012 Ta Ann Holdings Forestry 794 10.29 -1.13
5 5222 Felda Global Ventures Holdings Farming, Fishing & Plantations
3,841 9.84 -2.90
10.051
0.45
3 2445 Kuala Lumpur Kepong
4197 Sime Darby Diversified Industrials -0.53
2 1961 IOI Farming, Fishing & Plantations 14,863 10.05
33,291
Data as at: 31 July 2017
Constituent Name ICB Subsector 1M Perf (%)
3,021 10.02 -4.68
6 4383 Jaya Tiasa Holdings
4 2291 Genting Plantations Farming, Fishing & Plantations
Rank Local Code Net Market Cap (MYRm) Index Weight (%)
FTSE Bursa Malaysia Palm Oil Plantation Index
TOP
BOTT
OM
TO
P BO
TTO
M
TOP
BOTT
OM
0
20
40
60
80
10019.90
59.72
20.39
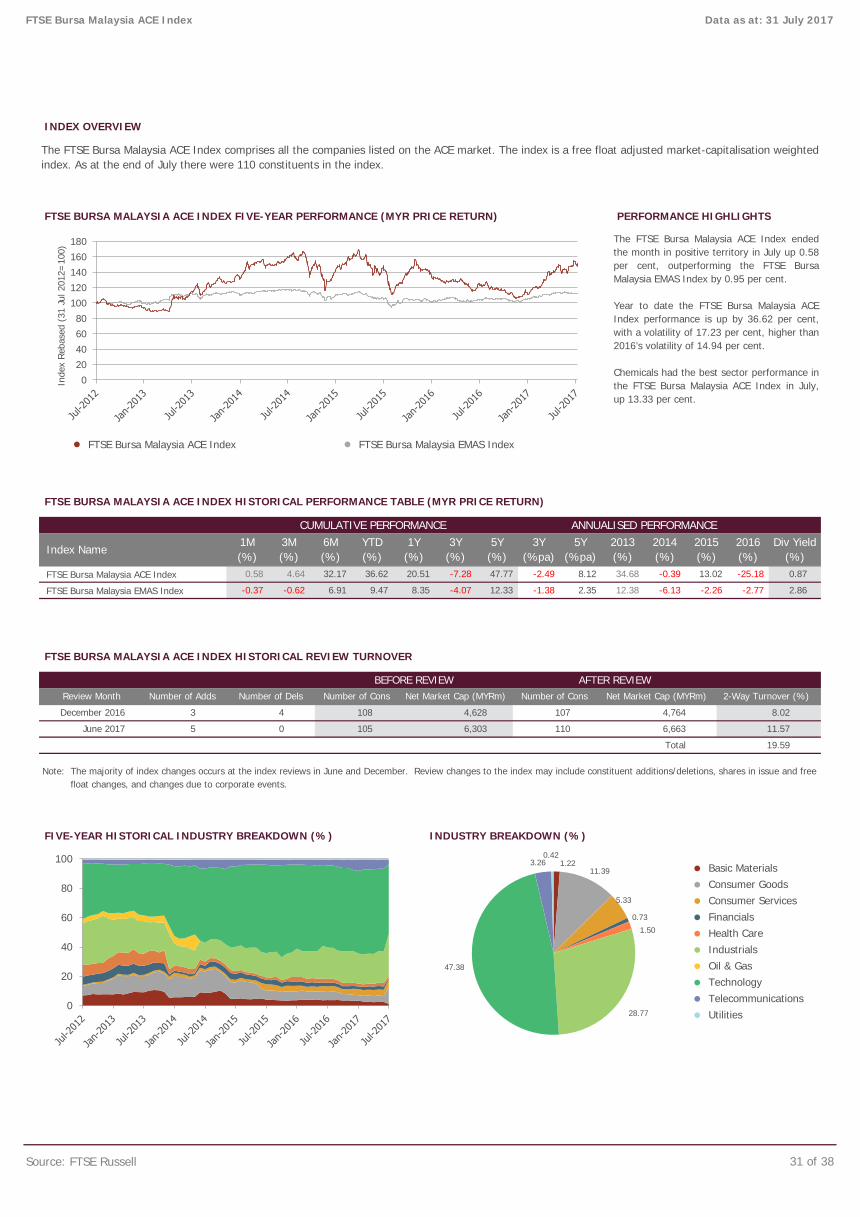
INDEX OVERVIEW
FTSE BURSA MALAYSIA ACE INDEX FIVE-YEAR PERFORMANCE (MYR PRICE RETURN) PERFORMANCE HIGHLIGHTS
● FTSE Bursa Malaysia ACE Index ● FTSE Bursa Malaysia EMAS Index
FTSE BURSA MALAYSIA ACE INDEX HISTORICAL PERFORMANCE TABLE (MYR PRICE RETURN)
FTSE Bursa Malaysia ACE Index
FTSE Bursa Malaysia EMAS Index
FTSE BURSA MALAYSIA ACE INDEX HISTORICAL REVIEW TURNOVER
FIVE-YEAR HISTORICAL INDUSTRY BREAKDOWN (%) INDUSTRY BREAKDOWN (%)
● Basic Materials
● Consumer Goods
● Consumer Services
● Financials
● Health Care
● Industrials
● Oil & Gas
● Technology
● Telecommunications
● Utilities
Source: FTSE Russell 31 of 38
June 2017 5 0 105 6,303 110 6,663 11.57
Total 19.59
BEFORE REVIEW AFTER REVIEWReview Month Number of Adds Number of Dels Number of Cons Net Market Cap (MYRm) Number of Cons Net Market Cap (MYRm) 2-Way Turnover (%)
December 2016 3 4 108 4,628 107 4,764 8.02
-25.18 0.87
-0.37 -0.62 6.91 9.47 8.35 -4.07 12.33 -1.38 2.35 12.38 -6.13 -2.26 -2.77 2.86
FTSE Bursa Malaysia ACE Index
The FTSE Bursa Malaysia ACE Index endedthe month in positive territory in July up 0.58per cent, outperforming the FTSE BursaMalaysia EMAS Index by 0.95 per cent.
Year to date the FTSE Bursa Malaysia ACEIndex performance is up by 36.62 per cent,with a volatility of 17.23 per cent, higher than2016’s volatility of 14.94 per cent.
Chemicals had the best sector performance inthe FTSE Bursa Malaysia ACE Index in July,up 13.33 per cent.
CUMULATIVE PERFORMANCE ANNUALISED PERFORMANCE
Index Name1M(%)
3M(%)
6M(%)
YTD(%)
1Y(%)
3Y(%)
5Y(%)
3Y(%pa)
5Y(%pa)
2013(%)
2014(%)
2015(%)
2016(%)
Div Yield(%)
0.58 4.64 32.17 36.62 20.51 -7.28 47.77 -2.49 8.12 34.68 -0.39 13.02
The FTSE Bursa Malaysia ACE Index comprises all the companies listed on the ACE market. The index is a free float adjusted market-capitalisation weightedindex. As at the end of July there were 110 constituents in the index.
Data as at: 31 July 2017
1.22 11.39
5.33
0.73
1.50
28.77
47.38
3.26 0.42
0
20
40
60
80
100
Note: The majority of index changes occurs at the index reviews in June and December. Review changes to the index may include constituent additions/deletions, shares in issue and free float changes, and changes due to corporate events.
020406080
100120140160180
Inde
x R
ebas
ed (
31 J
ul 2
012=
100)

FTSE BURSA MALAYSIA ACE INDEX TOP 5 AND BOTTOM 5 SECTOR PERFORMERS
FTSE BURSA MALAYSIA ACE INDEX TOP 10 CONSTITUENTS
FTSE BURSA MALAYSIA ACE INDEX TOP 5 AND BOTTOM 5 PERFORMERS
Source: FTSE Russell 32 of 38
Rank Local Code Constituent Name ICB Subsector Net Market Cap (MYRm) Index Weight (%) 1M Perf (%)
0018 567 8.17
Local Code Constituent Name ICB Subsector Net Market Cap (MYRm) Index Weight (%) 1M Perf (%)
6530 Fixed Line Telecommunications 1 75 1.08 -14.71 16.34 2.99
5330 Food & Drug Retailers 1 179 2.58 4.76
17 0.24
9
8 Matang Food Retailers & Wholesalers
10
2.86 -7.27
7 0186 Perak Transit Transportation Services
0181 Aemulus Holdings Electronic Equipment
3760 Personal Goods 2 122 1.76 -6.54 46.95 0.85
3720 Household Goods & Home Construction 1 27 0.39 -13.46 -36.62 1.48
- 0.00
2770 Industrial Transportation 3 239 3.44 -4.10 17.10 4.04
8770 Financial Services 1 51 0.73 -4.86 69.14 2.92
4570 Pharmaceuticals & Biotechnology 2 63 0.91 10.55 41.59 1.18
9570 Technology Hardware & Equipment 8 453 6.54 6.44 190.00 0.29
ICB Code ICB Sector Number of Cons Net Market Cap (MYRm) Index Weight (%) 1M Perf (%) 1Y Perf (%) Div Yield (%)
1350 Chemicals 3 84 1.22 13.33 42.40 0.72
5370 General Retailers 1 34 0.49 11.48 23.64 2.94
FTSE Bursa Malaysia ACE Index
2 0069 Vivocom Intl Holdings Software 16.67
3 0098 Borneo Aqua Harvest Farming, Fishing & Plantations 354 5.11 4.64
447 6.44
Accsoft Technology Computer Services -17.07
Totals 2,723 39.27
0038 Plastrade Technology Commodity Chemicals 32 0.47
0092 mTouche Technology Software 55.88
35.19
23 0.33 46.67
0181 Aemulus Holdings
0169 SMTrack Electronic Equipment 10 0.14 -25.00
0036 Key Alliance Group Telecommunications Equipment
-20.69
Kronologi Asia Computer Services 102 1.48
0068
42.48
0086 YGL Covergence Software
46 0.67
Asdion Software 7 0.09 -30.77
33 0.48 -25.00
0133 Sanichi Technology Industrial Machinery 38 0.55 -21.43
-
0102 ConnectCounty Holdings Electrical Components & Equipment
0176
Electronic Equipment 147 2.13 43.00
43.00
Data as at: 31 July 2017
0023 IFCA MSC Computer Services
148 2.13
126 1.82 11.59
0127 JHM Consolidation Semiconductors 261 3.77 11.85
0116
0189 179 2.58
1
5
6 FOCUS DYNAMICS GROUP
4 0010 Iris Corp
4.76
181 2.62 -3.17
Computer Services 263 3.79 -2.86
Electrical Components & Equipment 198
TOP
BOTT
OM
TO
P BO
TTO
M
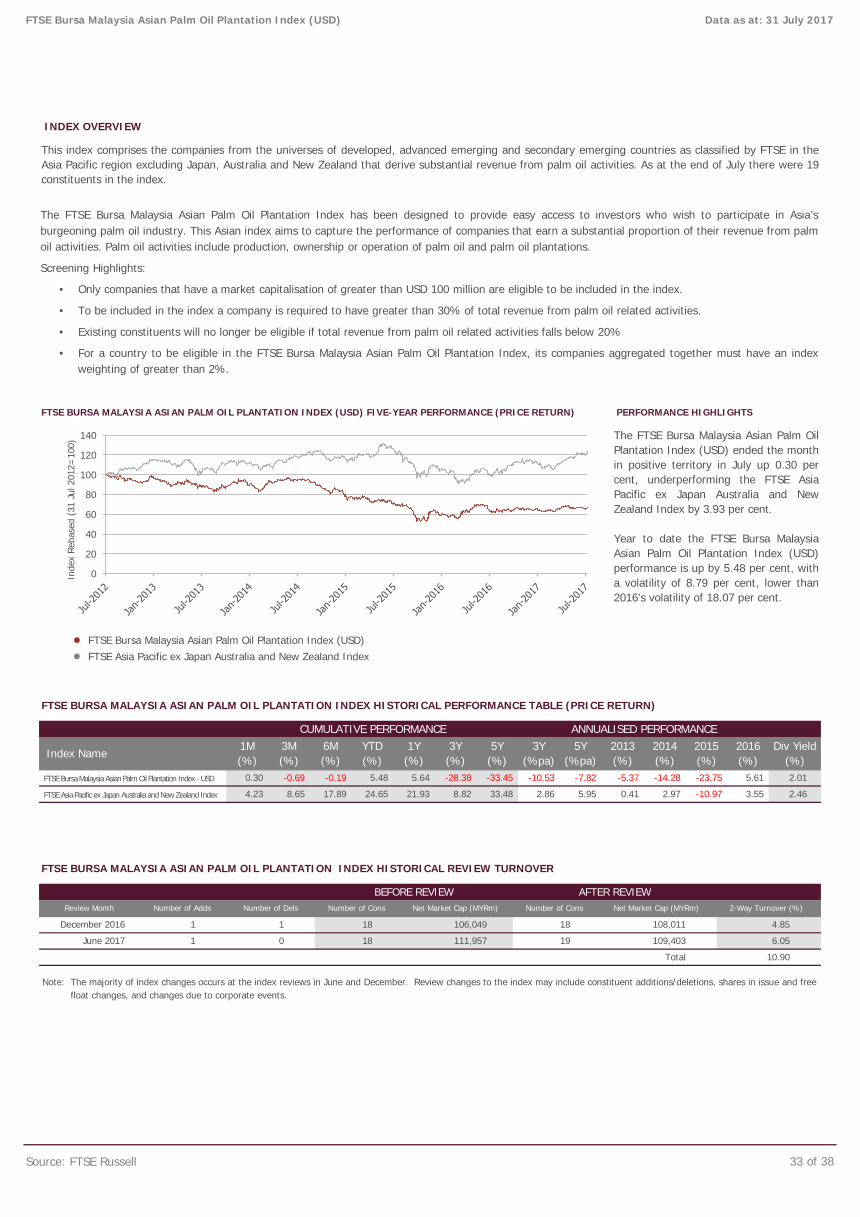
INDEX OVERVIEW
FTSE BURSA MALAYSIA ASIAN PALM OIL PLANTATION INDEX (USD) FIVE-YEAR PERFORMANCE (PRICE RETURN) PERFORMANCE HIGHLIGHTS
● FTSE Bursa Malaysia Asian Palm Oil Plantation Index (USD)● FTSE Asia Pacific ex Japan Australia and New Zealand Index
FTSE BURSA MALAYSIA ASIAN PALM OIL PLANTATION INDEX HISTORICAL PERFORMANCE TABLE (PRICE RETURN)
FTSE BURSA MALAYSIA ASIAN PALM OIL PLANTATION INDEX HISTORICAL REVIEW TURNOVER
Source: FTSE Russell 33 of 38
June 2017 1 0 18 111,957 19 109,403 6.05
Total 10.90
BEFORE REVIEW AFTER REVIEWReview Month Number of Adds Number of Dels Number of Cons Net Market Cap (MYRm) Number of Cons Net Market Cap (MYRm) 2-Way Turnover (%)
December 2016 1 1 18 106,049 18 108,011 4.85
-28.38 -33.45 -10.53 -7.82 -5.37 -14.28 -23.75 5.61 2.01
4.23 8.65 17.89 24.65 21.93 8.82 33.48 2.86 5.95 0.41 2.97 -10.97 3.55 2.46
0.30 -0.69 -0.19 5.48 5.64
FTSE Bursa Malaysia Asian Palm Oil Plantation Index (USD) Data as at: 31 July 2017
This index comprises the companies from the universes of developed, advanced emerging and secondary emerging countries as classified by FTSE in theAsia Pacific region excluding Japan, Australia and New Zealand that derive substantial revenue from palm oil activities. As at the end of July there were 19constituents in the index.
The FTSE Bursa Malaysia Asian Palm OilPlantation Index (USD) ended the monthin positive territory in July up 0.30 percent, underperforming the FTSE AsiaPacific ex Japan Australia and NewZealand Index by 3.93 per cent.
Year to date the FTSE Bursa MalaysiaAsian Palm Oil Plantation Index (USD)performance is up by 5.48 per cent, witha volatility of 8.79 per cent, lower than2016’s volatility of 18.07 per cent.
CUMULATIVE PERFORMANCE ANNUALISED PERFORMANCE
Index Name1M(%)
3M(%)
6M(%)
YTD(%)
1Y(%)
3Y(%)
5Y(%)
3Y(%pa)
5Y(%pa)
2013(%)
2014(%)
2015(%)
2016(%)
Div Yield(%)
0
20
40
60
80
100
120
140
Inde
x R
ebas
ed (
31 J
ul 2
012=
100)
The FTSE Bursa Malaysia Asian Palm Oil Plantation Index has been designed to provide easy access to investors who wish to participate in Asia’s burgeoning palm oil industry. This Asian index aims to capture the performance of companies that earn a substantial proportion of their revenue from palm oil activities. Palm oil activities include production, ownership or operation of palm oil and palm oil plantations.
Screening Highlights:
• Only companies that have a market capitalisation of greater than USD 100 million are eligible to be included in the index.
• To be included in the index a company is required to have greater than 30% of total revenue from palm oil related activities.
• Existing constituents will no longer be eligible if total revenue from palm oil related activities falls below 20%
• For a country to be eligible in the FTSE Bursa Malaysia Asian Palm Oil Plantation Index, its companies aggregated together must have an index weighting of greater than 2%.
Note: The majority of index changes occurs at the index reviews in June and December. Review changes to the index may include constituent additions/deletions, shares in issue and free float changes, and changes due to corporate events.
FTSE Bursa Malaysia Asian Palm Oil Plantation Index - USD
FTSE Asia Pacific ex Japan Australia and New Zealand Index

FIVE-YEAR HISTORICAL INDUSTRY BREAKDOWN (%) INDUSTRY BREAKDOWN (%)
● Basic Materials
● Consumer Goods
● Consumer Services
● Financials
● Health Care
● Industrials
● Oil & Gas
● Technology
● Telecommunications
● Utilities
FTSE BURSA MALAYSIA ASIAN PALM OIL PLANTATION INDEX (USD) TOP 10 CONSTITUENTS
FTSE BURSA MALAYSIA ASIAN PALM OIL PLANTATION INDEX (USD) TOP 5 AND BOTTOM 5 PERFORMERS
Source: FTSE Russell 34 of 38
0.85
518
352
835
717BH3WHX3 -12.11
B5L2Q45 -6.54
6904021 -7.44
B58PM83 -9.95
0.62
0.42
1.00
6535670 3.74
B2927P4 3.42
6825531 -5.08
1,252 1.49
3,037 3.62
813 0.97
Farming, Fishing & Plantations
Constituent Name CountryICB Subsector
Golden Agri-Resources
Indofood Agri Resources
Wilmar International Limited
Perusahaan Perkebunan London Sumatra Indonesia
First Resources Ltd.
Jaya Tiasa Holdings
Salim Ivomas Pratama
Tdm
Eagle High Plantations
Sawit Sumbermas Sarana
Farming, Fishing & Plantations
Food Products
Food Products
Farming, Fishing & Plantations
Farming, Fishing & Plantations
Forestry
Indonesia
Malaysia
Indonesia
Farming, Fishing & Plantations
Singapore
Singapore
Singapore
Indonesia
Singapore
Malaysia
Indonesia
Food Products
Farming, Fishing & Plantations
8 B8L1DR5 Felda Global Ventures Holdings Farming, Fishing & Plantations Malaysia 3,019 3.60 -4.68
9 6092498 Astra Agro Lestari Farming, Fishing & Plantations Indonesia 1,848 2.20 0.97
10 6535670 Perusahaan Perkebunan London Sumatra Indonesia Farming, Fishing & Plantations Indonesia 1,252 1.49 3.74
5 6164472 Golden Agri-Resources Farming, Fishing & Plantations Singapore 7,934 9.45 10.39
6 6057680 Genting Plantations Farming, Fishing & Plantations Malaysia 3,838 4.57 -2.90
7 B2927P4 First Resources Ltd. Farming, Fishing & Plantations Singapore 3,037 3.62 3.42
B1Y3WG1 IOI Farming, Fishing & Plantations Malaysia 14,855 17.70 0.45
4 6497446 Kuala Lumpur Kepong Farming, Fishing & Plantations Malaysia 11,513 13.72 -0.32
Singapore 20,436 17.89
9.45
641 0.76
15,016 17.89
6164472 10.39
B1QNF48 8.08
B17KC69 4.49
7,934
FTSE Bursa Malaysia Asian Palm Oil Plantation Index (USD) Data as at: 31 July 2017
Net Market Cap (USDm) Index Weight (%) 1M Perf (%)
B29TTR1 -0.531
Rank SEDOL Constituent Name
Sime Darby
CountryICB Subsector
Diversified Industrials Malaysia
SEDOL Net Market Cap (USDm) Index Weight (%) 1M Perf (%)
101,005 - 92.08
2 B17KC69 Wilmar International Limited Food Products
33,272 17.84
Totals
4.49
3
1.91
80.25
17.84
0
20
40
60
80
100
TOP
BOTT
OM
TO
P BO
TTO
M
TOP
BOTT
OM
TO
P BO
TTO
M

INDEX OVERVIEW
FTSE BURSA MALAYSIA MIDS CAP INDEX FIVE-YEAR PERFORMANCE (MYR PRICE RETURN) PERFORMANCE HIGHLIGHTS
● FTSE Bursa Malaysia MidS Cap Index ● FTSE Bursa Malaysia EMAS Index
FTSE BURSA MALAYSIA MIDS CAP INDEX HISTORICAL PERFORMANCE TABLE (MYR PRICE RETURN)
FTSE Bursa Malaysia MidS Cap Index
FTSE Bursa Malaysia EMAS Index
FTSE BURSA MALAYSIA MIDS CAP INDEX HISTORICAL REVIEW TURNOVER
Source: FTSE Russell 35 of 38
Total 65.29
-0.37 -0.62 6.91 9.47 8.35 -4.07 12.33 -1.38 2.35 12.38 -6.13 -2.26 -2.77 2.86
BEFORE REVIEW AFTER REVIEW
Review Month Number of Adds Number of Dels Net Market Cap (MYRm) Number of Cons Net Market Cap (MYRm) Number of Cons 2-Way Turnover (%)
December 2016 13 19 175 56,353 169 53,068 27.46
June 2017 22 15 169 63,079 176 57,299 37.83
FTSE Bursa Malaysia MidS Cap Index
The FTSE Bursa Malaysia MidS Cap Index comprises the Bursa Malaysia KLCI companies with full market capitalisation between 200 million and 2 billion MYR in theFTSE Bursa Malaysia EMAS Index. The index is a free float adjusted market-capitalisation weighted index representing the performance of the mid and smallMalaysian companies, which pass the size, free float, and liquidity screens.
FTSE Bursa Malaysia MidS Cap Index endedthe month in negative territory in July down1.06 per cent, underperforming the FTSEBursa Malaysia EMAS Index by 0.69 per cent.
Year to date the FTSE Bursa Malaysia MidSCap Index performance is up by 15.67 percent, with a volatility of 8.01 per cent, lowerthan 2016’s volatility of 9.21 per cent.
CUMULATIVE PERFORMANCE ANNUALISED PERFORMANCE
Index Name1M(%)
3M(%)
6M(%)
YTD(%)
1Y(%)
3Y(%)
5Y(%)
3Y(%pa)
5Y(%pa)
2013(%)
-1.06 -2.59 10.43 15.67 13.05 -10.70 37.49 -3.70 6.57 35.25 -6.07 4.80 -5.94 2.41
2014(%)
2015(%)
2016(%)
Div Yield(%)
Data as at: 31 July 2017
Note: The majority of index changes occurs at the index reviews in June and December. Review changes to the index may include constituent additions/deletions, shares in issue and free float changes, and changes due to corporate events.
020406080
100120140160180
Inde
x R
ebas
ed (3
1 Ju
l 201
2=10
0)
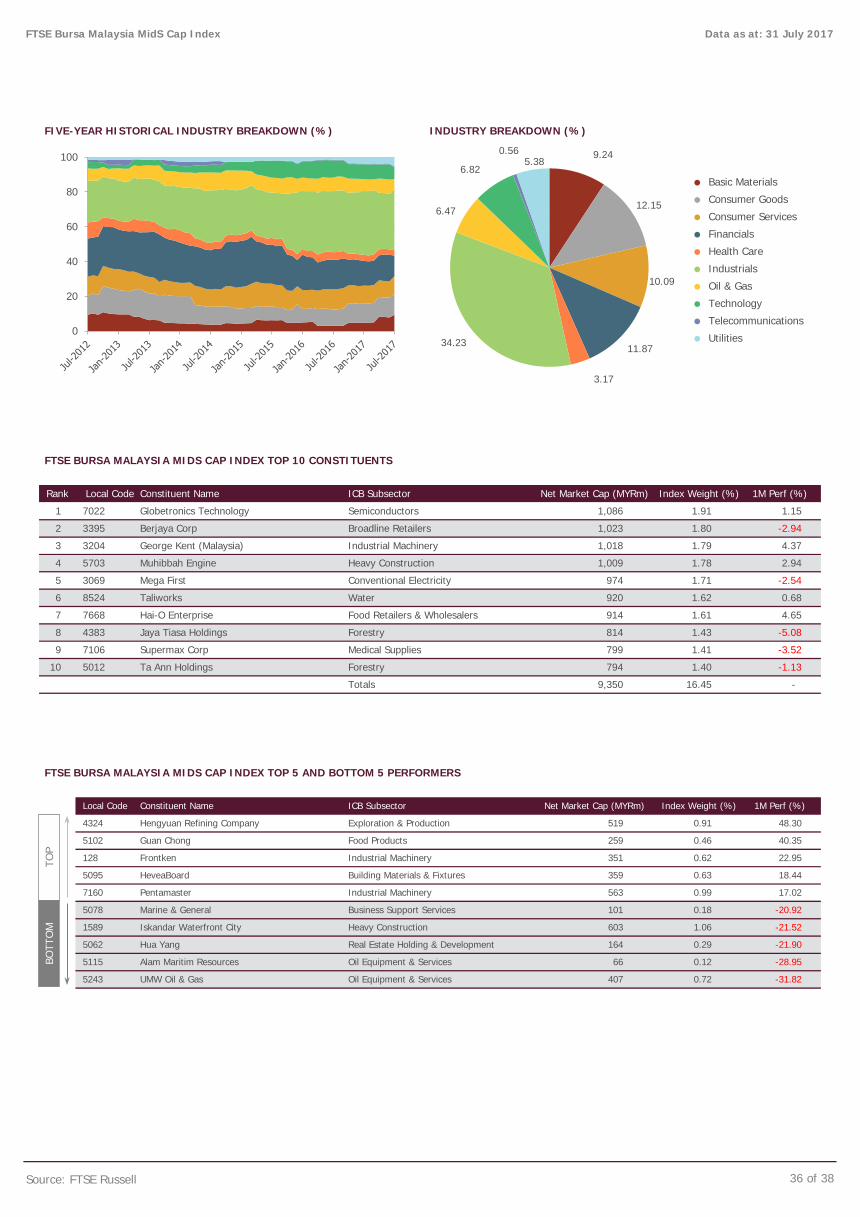
FIVE-YEAR HISTORICAL INDUSTRY BREAKDOWN (%) INDUSTRY BREAKDOWN (%)
● Basic Materials
● Consumer Goods
● Consumer Services
● Financials
● Health Care
● Industrials
● Oil & Gas
● Technology
● Telecommunications
● Utilities
FTSE BURSA MALAYSIA MIDS CAP INDEX TOP 10 CONSTITUENTS
FTSE BURSA MALAYSIA MIDS CAP INDEX TOP 5 AND BOTTOM 5 PERFORMERS
Source: FTSE Russell 36 of 38
5243 UMW Oil & Gas Oil Equipment & Services 407 0.72 -31.82
1589 Iskandar Waterfront City Heavy Construction 603 1.06 -21.52
5062 Hua Yang Real Estate Holding & Development 164 0.29 -21.90
5115 Alam Maritim Resources Oil Equipment & Services 66 0.12 -28.95
5095 HeveaBoard Building Materials & Fixtures 359 0.63 18.44
7160 Pentamaster Industrial Machinery 563 0.99 17.02
5078 Marine & General Business Support Services 101 0.18 -20.92
4324 Hengyuan Refining Company Exploration & Production 519 0.91 48.30
5102 Guan Chong Food Products 259 0.46 40.35
128 Frontken Industrial Machinery 351 0.62 22.95
10 5012 Ta Ann Holdings Forestry 794 1.40 -1.13
Totals 9,350 16.45 -
Local Code Constituent Name ICB Subsector Net Market Cap (MYRm) Index Weight (%) 1M Perf (%)
7 7668 Hai-O Enterprise Food Retailers & Wholesalers 914 1.61 4.65
8 4383 Jaya Tiasa Holdings Forestry 814 1.43 -5.08
9 7106 Supermax Corp Medical Supplies 799 1.41 -3.52
4 5703 Muhibbah Engine Heavy Construction 1,009 1.78 2.94
5 3069 Mega First Conventional Electricity 974 1.71 -2.54
6 8524 Taliworks Water 920 1.62 0.68
1 7022 Globetronics Technology Semiconductors 1,086 1.91 1.15
2 3395 Berjaya Corp Broadline Retailers 1,023 1.80 -2.94
3 3204 George Kent (Malaysia) Industrial Machinery 1,018 1.79 4.37
FTSE Bursa Malaysia MidS Cap Index Data as at: 31 July 2017
Rank Local Code Constituent Name ICB Subsector Net Market Cap (MYRm) Index Weight (%) 1M Perf (%)
TOP
BOTT
OM
0
20
40
60
80
100 9.24
12.15
10.09
11.87
3.17
34.23
6.47
6.82
0.56 5.38
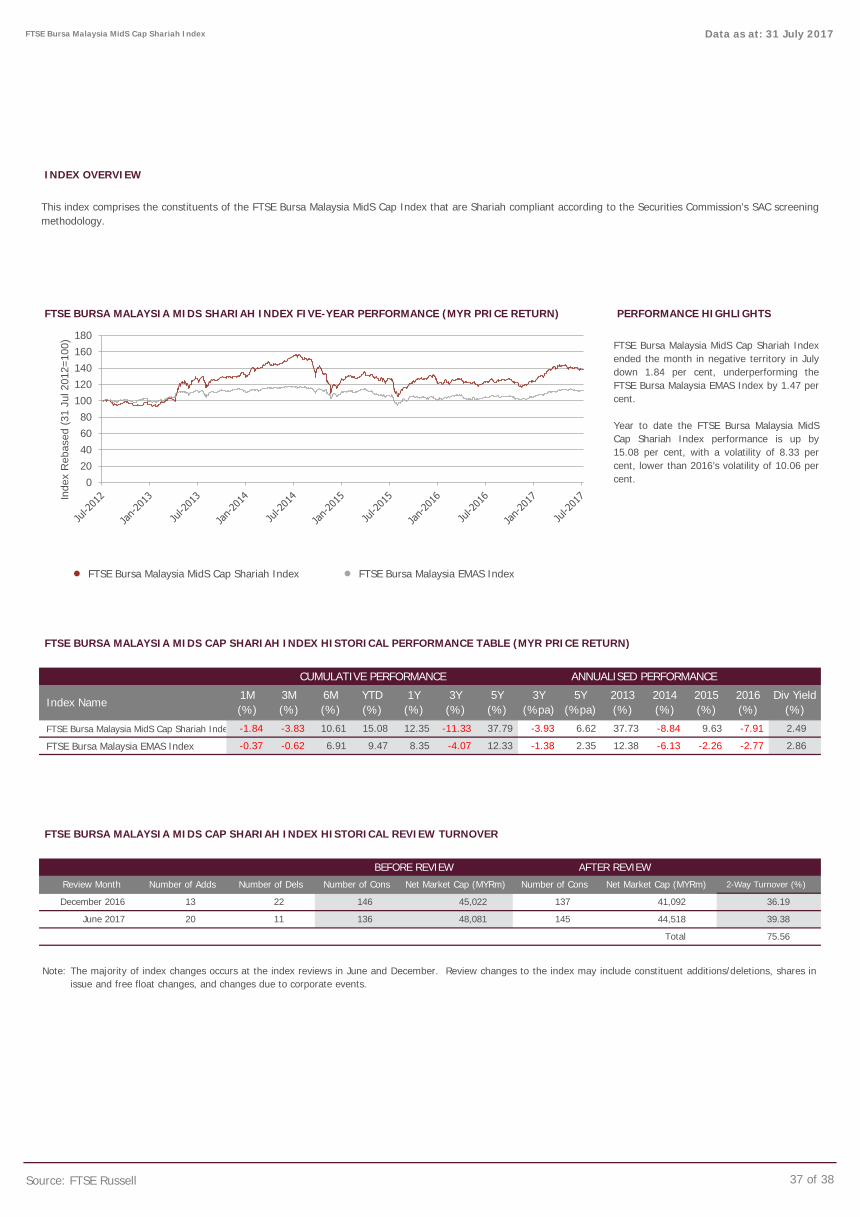
INDEX OVERVIEW
FTSE BURSA MALAYSIA MIDS SHARIAH INDEX FIVE-YEAR PERFORMANCE (MYR PRICE RETURN) PERFORMANCE HIGHLIGHTS
● FTSE Bursa Malaysia MidS Cap Shariah Index ● FTSE Bursa Malaysia EMAS Index
FTSE BURSA MALAYSIA MIDS CAP SHARIAH INDEX HISTORICAL PERFORMANCE TABLE (MYR PRICE RETURN)
FTSE Bursa Malaysia MidS Cap Shariah Inde
FTSE Bursa Malaysia EMAS Index
FTSE BURSA MALAYSIA MIDS CAP SHARIAH INDEX HISTORICAL REVIEW TURNOVER
Source: FTSE Russell 37 of 38
FTSE Bursa Malaysia MidS Cap Shariah Index Data as at: 31 July 2017
This index comprises the constituents of the FTSE Bursa Malaysia MidS Cap Index that are Shariah compliant according to the Securities Commission's SAC screeningmethodology.
FTSE Bursa Malaysia MidS Cap Shariah Indexended the month in negative territory in Julydown 1.84 per cent, underperforming theFTSE Bursa Malaysia EMAS Index by 1.47 percent.
Year to date the FTSE Bursa Malaysia MidSCap Shariah Index performance is up by15.08 per cent, with a volatility of 8.33 percent, lower than 2016’s volatility of 10.06 percent.
CUMULATIVE PERFORMANCE ANNUALISED PERFORMANCE
Index Name1M(%)
3M(%)
6M(%)
YTD(%)
1Y(%)
3Y(%)
5Y(%)
3Y(%pa)
5Y(%pa)
2013(%)
2014(%)
2015(%)
2016(%)
Div Yield(%)
-1.84 -3.83 10.61 15.08 12.35 -11.33 37.79 -3.93 6.62 37.73 -8.84 9.63 -7.91 2.49
-0.37 -0.62 6.91 9.47 8.35 -4.07 12.33 -1.38 2.35 12.38 -6.13 -2.26 -2.77 2.86
BEFORE REVIEW AFTER REVIEW
Review Month Number of Adds Number of Dels Number of Cons Net Market Cap (MYRm) Number of Cons Net Market Cap (MYRm) 2-Way Turnover (%)
December 2016 13 22 146 45,022 137 41,092 36.19
June 2017 20 11 136 48,081 145 44,518 39.38
Total 75.56
Note: The majority of index changes occurs at the index reviews in June and December. Review changes to the index may include constituent additions/deletions, shares in issue and free float changes, and changes due to corporate events.
020406080
100120140160180
Inde
x R
ebas
ed (3
1 Ju
l 201
2=10
0)

FIVE-YEAR HISTORICAL INDUSTRY BREAKDOWN (%) INDUSTRY BREAKDOWN (%)
● Basic Materials
● Consumer Goods
● Consumer Services
● Financials
● Health Care
● Industrials
● Oil & Gas
● Technology
● Telecommunications
● Utilities
FTSE BURSA MALAYSIA MIDS CAP SHARIAH INDEX TOP 10 CONSTITUENTS
FTSE BURSA MALAYSIA MIDS CAP SHARIAH INDEX TOP 5 AND BOTTOM 5 PERFORMERS
Source: FTSE Russell 38 of 38
FTSE Bursa Malaysia MidS Cap Shariah Index Data as at: 31 July 2017
Rank Local Code Constituent Name ICB Subsector Net Market Cap (MYRm) Index Weight (%) 1M Perf (%)
1 7022 Globetronics Technology Semiconductors 1,086 2.48 1.15
2 5703 Muhibbah Engine Heavy Construction 1,009 2.30 2.94
3 3069 Mega First Conventional Electricity 974 2.22 -2.54
4 8524 Taliworks Water 920 2.10 0.68
5 4383 Jaya Tiasa Holdings Forestry 814 1.86 -5.08
6 7106 Supermax Corp Medical Supplies 799 1.82 -3.52
7 5012 Ta Ann Holdings Forestry 794 1.81 -1.13
8 7155 SKP Resources Specialty Chemicals 673 1.54 5.34
9 5204 Prestariang Software 650 1.48 -8.65
10 5216 Datasonic Group Electronic Equipment 632 1.44 -5.65
Totals 8,351 19.06 -
Local Code Constituent Name ICB Subsector Net Market Cap (MYRm) Index Weight (%) 1M Perf (%)
128 Frontken Industrial Machinery 351 0.62 22.95
5095 HeveaBoard Building Materials & Fixtures 359 0.63 18.44
7160 Pentamaster Industrial Machinery 563 0.99 17.02
7161 Kerjaya Prospek Group Heavy Construction 488 0.86 13.80
5125 Pantech Group Holdings Iron & Steel 230 0.41 13.79
5115 Alam Maritim Resources Oil Equipment & Services 66 0.12 -28.95
5243 UMW Oil & Gas Oil Equipment & Services 407 0.72 -31.82
5078 Marine & General Business Support Services 101 0.18 -20.92
1589 Iskandar Waterfront City Heavy Construction 603 1.06 -21.52
5062 Hua Yang Real Estate Holding & Development 164 0.29 -21.90
© 2016 London Stock Exchange Group companies.
All rights reserved.“FTSE®” is a trade mark of the London Stock Exchange Plc Group companies and is used by FTSE International Limited (“FTSE”) under licence. Bursa Malaysia is a trade mark of Bursa Malaysia (“Partner”). All rights in and to the FTSE Bursa Malaysia KLCI (“Index”) vest in FTSE and/or its relevant Partner(s). TheIndustry Classification Benchmark (“ICB”) is owned by FTSE.
All information is provided for information purposes only. Every effort is made to ensure that all information given in this publication is accurate, but no responsibility orliability can be accepted by FTSE, any Partner or their licensors for any errors or for any loss from use of this publication. Neither FTSE, Partner nor any of theirlicensors makes any claim, prediction, warranty or representation whatsoever, expressly or impliedly, either as to the results to be obtained from the use of the name ofthe Index set out above or the fitness or suitability of the Index for any particular purpose to which it might be put.
No part of this information may be reproduced, stored in a retrieval system or transmitted in any form or by any means, electronic, mechanical, photocopying, recordingor otherwise, without prior written permission of FTSE. Distribution of FTSE data and the use of FTSE indices to create financial products requires a licence with FTSEand/or its licensors. FTSE does not accept any liability to any person for any loss or damage arising out of any error or omission in the ICB.
TOP
BOTT
OM
Data definitions available from ftserussell.com For further information visit ftserussell.com, email [email protected] or call your local FTSE Russell offices: Sydney +61 (0)2 8823 3521 Beijing +86 10 5833 2202 Dubai +971 4 401 9578 Hong Kong +852 2164 3333 London +44 (0)20 7866 1810 Milan +39 02 3604 6953 New York +1 866 551 0617 Paris +33 (0)1 53 76 82 89 Rio de Janeiro +55 21 3736 3726 San Francisco +1 866 551 0617 Seattle +1 866 551 0617 Shanghai +86 21 6058 9131 Tokyo +81 (3) 3581 2764 Toronto +1 866 551 0617
0
20
40
60
80
100 10.36
11.90
3.01
8.92
3.22
39.60
7.21
8.07
0.73 6.98