FTSE Implied Volatility Index Series · FTSE Russell | FTSE Implied Volatility Index Series, v1.6,...
15
Ground Rules ftserussell.com June 2018 FTSE Implied Volatility Index Series v1.6 The FTSE Implied Volatility Index Series is not, and is not intended to be, used in the European Union and accordingly, the European benchmark regulation* does not apply to the FTSE Implied Volatility Index Series. Consequently, supervised entities within the European Union are not permitted to use the FTSE Implied Volatility Index Series as a benchmark as set out in article 3(1)(7) of the European benchmark regulation. For the avoidance of doubt, neither FTSE International Limited nor any other member of the London Stock Exchange Group plc group of companies, is the benchmark administrator (as defined in article 3(1)(6) of the European benchmark regulation) of the FTSE Implied Volatility Index Series. *Regulation (EU) 2016/1011 of the European Parliament and of the Council of 8 June 2016 on indices used as benchmarks in financial instruments and financial contracts or to measure the performance of investment funds,
Transcript of FTSE Implied Volatility Index Series · FTSE Russell | FTSE Implied Volatility Index Series, v1.6,...
Ground Rules
ftserussell.com June 2018
FTSE Implied Volatility Index Series v1.6
The FTSE Implied Volatility Index Series is not, and is not intended to be, used in the European Union and
accordingly, the European benchmark regulation* does not apply to the FTSE Implied Volatility Index Series.
Consequently, supervised entities within the European Union are not permitted to use the FTSE Implied
Volatility Index Series as a benchmark as set out in article 3(1)(7) of the European benchmark regulation.
For the avoidance of doubt, neither FTSE International Limited nor any other member of the London Stock
Exchange Group plc group of companies, is the benchmark administrator (as defined in article 3(1)(6) of the
European benchmark regulation) of the FTSE Implied Volatility Index Series.
*Regulation (EU) 2016/1011 of the European Parliament and of the Council of 8 June 2016 on indices used
as benchmarks in financial instruments and financial contracts or to measure the performance of investment
funds,
FTSE Russell | FTSE Implied Volatility Index Series, v1.6, June 2018 2 of 15
Contents
1.0 Introduction ......................................................................... 3
2.0 Management Responsibilities ............................................ 4
3.0 FTSE Russell Index Policies .............................................. 5
4.0 Eligible Securities ............................................................... 6
5.0 Calculation Methodology ................................................... 7
6.0 Step-by-Step Calculation Guide ........................................ 9
Appendix A: Further Information .............................................. 15
FTSE Russell | FTSE Implied Volatility Index Series, v1.6, June 2018 3 of 15
Section 1
Introduction
1.0 Introduction
1.1 This document sets out the Ground Rules for the construction and management of the FTSE Implied
Volatility Index (FTSE IVI) Series. Copies of the Ground Rules are available from FTSE Russell on
www.ftserussell.com.
1.2 The FTSE IVI is a volatility index, which measures the interpolated 30, 60, 90, 180 and 360 day
implied volatility of an underlying equity index using the index option prices.
1.3 The index is comprised of out-of-the-money put and call options from two expirations which span the
period of interest. The price of each option reflects the market’s expectation of future volatility.
1.4 The FTSE Implied Volatility Index Series are calculated on an end-of-day basis.
1.5 FTSE Russell
FTSE Russell is a trading name of FTSE International Limited, Frank Russell Company, FTSE
Global Debt Capital Markets Limited (and its subsidiaries FTSE Global Debt Capital Markets Inc.
and MTSNext Limited), Mergent, Inc., FTSE Fixed Income LLC and The Yield Book Inc.
1.6 FTSE Russell hereby notifies users of the index series that it is possible that circumstances,
including external events beyond the control of FTSE Russell, may necessitate changes to, or the
cessation, of the index series and therefore, any financial contracts or other financial instruments
that reference the index series or investment funds which use the index series to measure their
performance should be able to withstand, or otherwise address the possibility of changes to, or
cessation of, the index series.
1.7 Index users who choose to follow this index series or to buy products that claim to follow this index
series should assess the merits of the index’s rules-based methodology and take independent
investment advice before investing their own or client funds. No liability whether as a result of
negligence or otherwise is accepted by FTSE Russell for any losses, damages, claims and
expenses suffered by any person as a result of:
• any reliance on these Ground Rules, and/or
• any errors or inaccuracies in these Ground Rules, and/or
• any non-application or misapplication of the policies or procedures described in these
Ground Rules, and/or
• any errors or inaccuracies in the compilation of the Index or any constituent data.
FTSE Russell | FTSE Implied Volatility Index Series, v1.6, June 2018 4 of 15
Section 2
Management Responsibilities
2.0 Management Responsibilities
2.1 FTSE International Limited (FTSE)
2.1.1 FTSE is responsible for the operation and maintenance of the FTSE Implied Volatility Index Series.
2.2 Status of these Ground Rules
2.2.1 These Ground Rules set out the methodology and provide information about the publication of the
FTSE Implied Volatility Index Series.
2.3 Amendments to these Ground Rules
2.3.1 These Ground Rules shall be subject to regular review (at least once a year) by FTSE Russell to
ensure that they continue to meet the current and future requirements of investors and other index
users. The review process will include consultation on any proposed changes with the relevant
FTSE Russell external advisory committees and the FTSE Russell Product Governance Board.
2.3.2 As provided for in the Statement of Principles for FTSE Russell Equity Indexes, where FTSE Russell
determines that the Ground Rules are silent or do not specifically and unambiguously apply to the
subject matter of any decision, any decision shall be based as far as practical on the Statement of
Principles. After making any such determination, FTSE Russell shall advise the market of its
decision at the earliest opportunity. Any such treatment will not be considered as an exception or
change to the Ground Rules, or to set a precedent for future action, but FTSE Russell will consider
whether the Ground Rules should subsequently be updated to provide greater clarity.
FTSE Russell | FTSE Implied Volatility Index Series, v1.6, June 2018 5 of 15
Section 3
FTSE Russell Index Policies
3.0 FTSE Russell Index Policies
These Ground Rules should be read in conjunction with the following policy documents which can be
accessed using the links below:
3.1 Statement of Principles for FTSE Russell Equity Indexes (the Statement of Principles)
3.1.1 Indexes need to keep abreast of changing markets and the Ground Rules cannot anticipate every
eventuality. Where the Rules do not fully cover a specific event or development, FTSE Russell will
determine the appropriate treatment by reference to the Statement of Principles which summarise
the ethos underlying FTSE Russell’s approach to index construction. The Statement of Principles is
reviewed annually and any changes proposed by FTSE Russellare presented to the FTSE Russell
Policy Advisory Board for discussion before approval by the FTSE Russell Product Governance
Board.
The Statement of Principles can be accessed using the following link:
Statement_of_Principles.pdf
3.2 Queries and Complaints
Benchmark_Determination_Complaints_Handling_Policy.pdf
3.3 Policy for Benchmark Methodology Changes
3.3.1 Details of FTSE Russell’s policy for making benchmark methodology changes can be accessed
using the following link:
Policy_for_Benchmark_Methodology_Changes.pdf
FTSE Russell | FTSE Implied Volatility Index Series, v1.6, June 2018 6 of 15
Section 4
Eligible Securities
4.0 Eligible Securities
4.1 The FTSE Implied Volatility Index Series is a set of volatility Indexes that are derived from the out-of-
the money put and call index options from the following Indexes.
Underlying
Index
FTSE Implied Volatility Index Type Currency Exchange
FTSE 100 Index FTSE 100 Implied Volatility Index Volatility GBP ICE Europe
FTSE MIB Index FTSE MIB Implied Volatility Index Volatility EUR Borsa Italiana
4.2 The FTSE Implied Volatility Index uses the daily settlement prices published by the relevant
exchange.
FTSE Russell | FTSE Implied Volatility Index Series, v1.6, June 2018 7 of 15
Section 5
Calculation Methodology
5.0 Calculation Methodology
5.1 Overview
5.1.1 The FTSE IVI is a volatility index, which measures the interpolated N-day implied volatility of an
underlying stock index, such as the FTSE 100 or FTSE MIB. The implied volatility index is comprised
of the out-of-the-money (OTM) put and call options and the price of each option reflects the market’s
expectation of future volatility. Like conventional indexes, FTSE IVI employs rules for selecting
component options and formulae to calculate index values.
5.1.2 The general formula used in the FTSE IVI calculation is:
σ2=2
T(1+log
F
K*
-F
K*
+erT ∫K*
0
P(K)
K2dK+erT ∫
∞
K*
C(K)
K2dK)
(1)
5.1.3 Where σ×100 is the FTSE IVI, P(K) and C(K) are the put and call prices at strike K, F is the forward
index level, K∗ is the strike immediately below F and r is the risk free interest rate to expiration T. The
above equation can be simplified as:
σ2=2
T(1+log
F
K*
-F
K*
+erT ∫∞
0
Q(K)
K2dK)
(2)
5.1.4 Where Q(K) represents the midpoint of the bid-ask spread of an option, which is a call if K>K*, a put
if K<K*, and the average of the put and a call if K=K*.
5.1.5 Under the FTSE IVI methodology the integral in Equation (2) used to estimate σ2 is calculated using
a generalisation of Simpson's Rule, where the interval between strikes need not be equal.
5.2 Unequal Interval Simpson's Rule
5.2.1 Simpson’s Rule is an established method of numerical integration. However, when the interval
between estimation points (i.e. strikes) is not equal, a more general version of Simpson’s Rule is
required.

FTSE Russell | FTSE Implied Volatility Index Series, v1.6, June 2018 8 of 15
5.2.2 Suppose there is a function f(K) whose values are known at K0, K0+δK1, K0+δK1+δK2 and there is
no requirement that δK1=δK2. The integral of f(K) in the interval [K0,K0+δK1+δK2] can be found with
the Unequal-Interval Simpson’s Rule:
SI(K0,δK1,δK2)= ∫K0+δK1+δK2
K0
f(K)dK≈δK1+δK2
6δK1δK2
((2δK1-δK2)δK2⋅f(K0)
+(δK1+δK2)2⋅f(K0+δK1)
+(2δK2+δK1)δK1⋅f(K0+δK1+δK2))
(3)
5.2.3 In order to apply this to the integral in Equation (2), the option data is partitioned into contiguous
groups of three strikes.
5.3 End-Point Linear Fit
5.3.1 If there is an even number of strikes in the integral of (2) then the data for that integral cannot be
partitioned into contiguous sets consisting of three points. In this situation the data is partitioned into
contiguous sets of three points and a final overlapping set of two points. The set of two points are
integrated using linear interpolation in the normal way for trapezoidal integration:
LI(K1,K2)= ∫K2
K1
f(K)dK≈(K2-K1)f(K2)+f(K1)
2 (4)
5.4 General Integration Scheme
5.4.1 The general integration scheme employed consists of the Unequal-Interval Simpson’s Rule or a
mixture of the Unequal-Interval Simpson’s Rule and the End-Point Linear Fit. Under this scheme
integration of a set of data with n strikes requires:
Int n-1
2 applications of Unequal-Interval Simpson’s Rule (Equation (3)) and
1-Mod(n, 2) linear interpolations at the end-points (Equation (4)).
5.4.2 Whilst the linear interpolation can be calculated at either end of the data series, the FTSE IVI
methodology calculates any linear interpolation component using the lowest two strikes available.
FTSE Russell | FTSE Implied Volatility Index Series, v1.6, June 2018 9 of 15
Section 6
Step by Step Calculation Guide
6.0 Step-by-Step Calculation Guide
6.1 FTSE IVI is comprised of near-term and next-term put and call options. Typically these correspond
to the first and second contract months of the underlying future when estimating the 30-day implied
volatility, but may be any consecutive months depending on the N-day volatility to be calculated.
6.2 In order to minimize any pricing anomalies that can occur close to expiration a cut-off of one week (7
days) to expiration is used. That is, when there is less than one week to expiration of the near-term
options FTSE IVI rolls to the second and third contract months.
6.3 For example, suppose FTSE IVI is being calculated for the FTSE MIB index. These index options
expire on the third Friday of the month. Consequently, the second Friday in September FTSE IVI
would be calculated using options expiring in September and October. However, on the following
Monday, the near-term options would move from September to October and the next-term options
from October to November.
6.4 The following calculation example uses FTSE MIB option prices. Options on the FTSE MIB expire at
09:05 on the third Friday of the month and there are 13 days to expiration on the near-term and 41
on the next-term. The prices used reflect those at the close of trading at 17:40.
6.5 Step 1 – Time to Expiration and Interest Rates Used in the FTSE IVI Calculation
6.5.1 The FTSE IVI calculation requires the time to expiry for each term and interest rate information.
6.5.2 The time to expiration is calculated using the number of seconds between the calculation time and
the expiration time. For the purposes of the FTSE IVI calculation the precision of the time calculation
is in seconds and there are 365 days in a year.
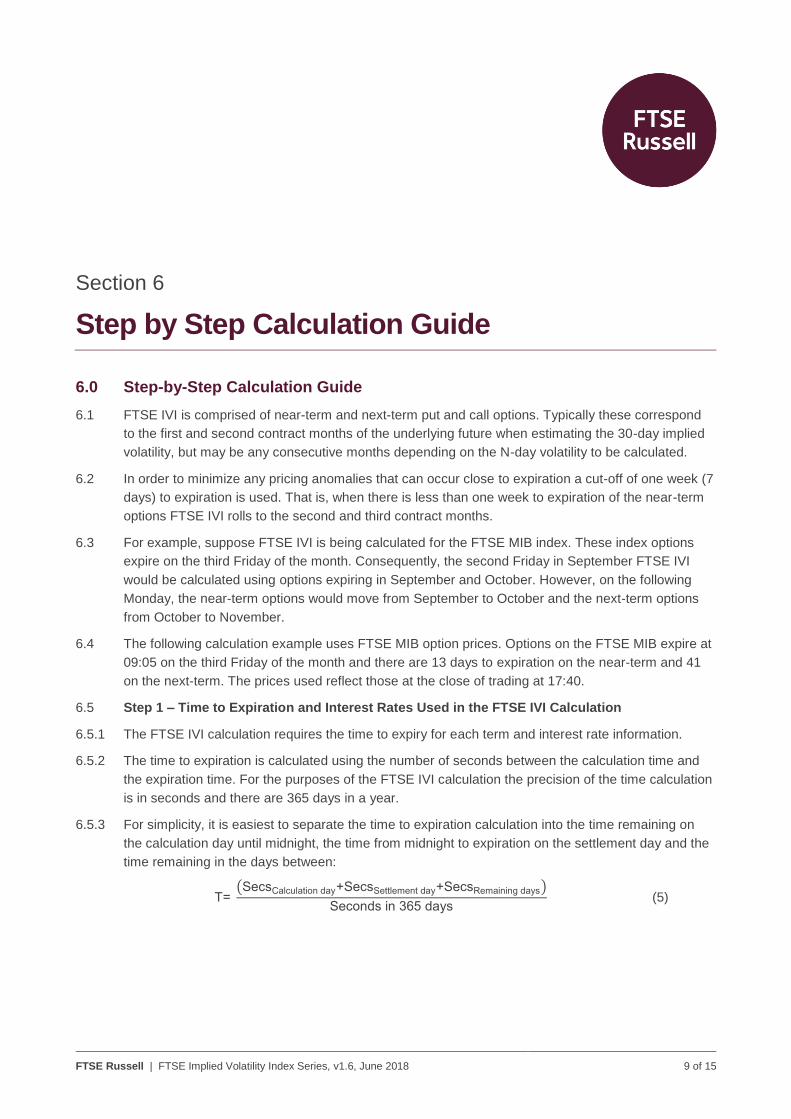
6.5.3 For simplicity, it is easiest to separate the time to expiration calculation into the time remaining on
the calculation day until midnight, the time from midnight to expiration on the settlement day and the
time remaining in the days between:
T= (SecsCalculation day+SecsSettlement day+SecsRemaining days)
Seconds in 365 days (5)
FTSE Russell | FTSE Implied Volatility Index Series, v1.6, June 2018 10 of 15
6.5.4 In the current example there are 6 hours 20 minutes from the calculation time to midnight, 9 hours 5
minutes from midnight to expiration and 13 days between calculation and settlement in the near-term
and 41 days in the next-term. Hence, the time to expiration for the near-term and next-term is:
Tnear=22800+32700+1123200
31536000=0.037376
Tnext=22800+32700+3542400
31536000=0.114089
6.5.5 The interest rates used are the OIS term rates, quoted on the calculation date, which mature closest
to the expiration date of the relevant options. The calculation uses 1 week, 2 week, 1 month, 2
month, 3 month, 6 month, 9 month and 12 month OIS terms. If two term rates are equally close to
the expiration date then the nearest OIS term rate is used.
6.5.6 In the example, the near-term options expire in 13 days and the OIS term maturing closest to this is
the 2 week rate. Similarly, for the next-term, the options expire in 41 days and the OIS term maturing
closest to this is the 1 month rate. No OIS settlement day conventions or rate curve interpolation are
considered.
6.5.7 The interest rates for this example are:
rnear=0.375%
rnext=0.374%
6.6 Step 2 – Select the Options to be Used in the FTSE IVI Calculation
6.6.1 Options used in the FTSE IVI calculation are those which are the out-of-the-money and have non-
zero bid and ask prices (or zero mid-quote prices in the case where there is no bid or ask price
information).
6.6.2 Note that the number of options used in the calculation is not fixed and will change as the underlying
level and hence volatility changes.
6.6.3 For each contract month (i.e. both the near-term and next-term):
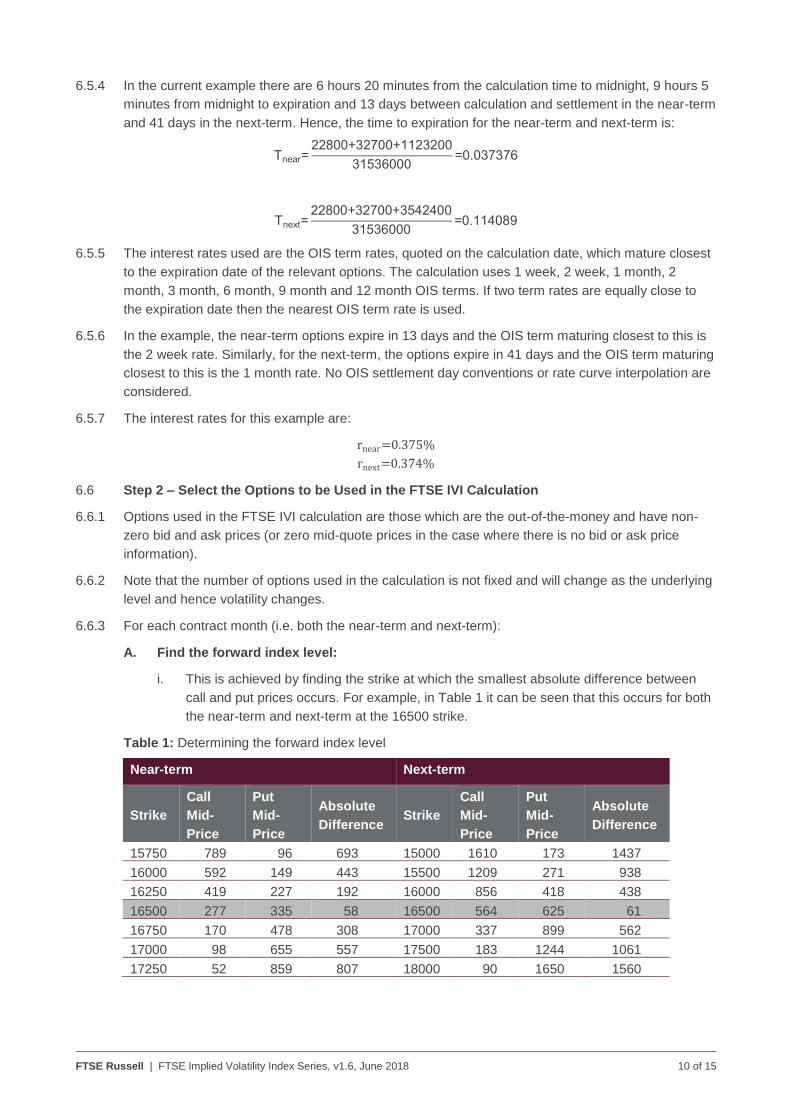
A. Find the forward index level:
i. This is achieved by finding the strike at which the smallest absolute difference between
call and put prices occurs. For example, in Table 1 it can be seen that this occurs for both
the near-term and next-term at the 16500 strike.
Table 1: Determining the forward index level
Near-term Next-term
Strike
Call
Mid-
Price
Put
Mid-
Price
Absolute
Difference Strike
Call
Mid-
Price
Put
Mid-
Price
Absolute
Difference
15750 789 96 693 15000 1610 173 1437
16000 592 149 443 15500 1209 271 938
16250 419 227 192 16000 856 418 438
16500 277 335 58 16500 564 625 61
16750 170 478 308 17000 337 899 562
17000 98 655 557 17500 183 1244 1061
17250 52 859 807 18000 90 1650 1560
FTSE Russell | FTSE Implied Volatility Index Series, v1.6, June 2018 11 of 15
ii. The forward price can be found using the formula:
F=Strike+erT|Call price-Put price| (6)
iii. The forward index prices for the near-term and next-term, Fnear and Fnext are:
Fnear=16500+e0.00375×0.037376|227-335|=16558
Fnext=16500+e0.00374×0.114089|564-625|=16561
B. Determine the at-the-money (ATM) strike price:
i. This is the first strike K*, immediately below (or equal to) the index forward price.
Continuing with the example the ATM strikes for the near-term and next-term are
K*, near=16500 and K*,next=16500 respectively.
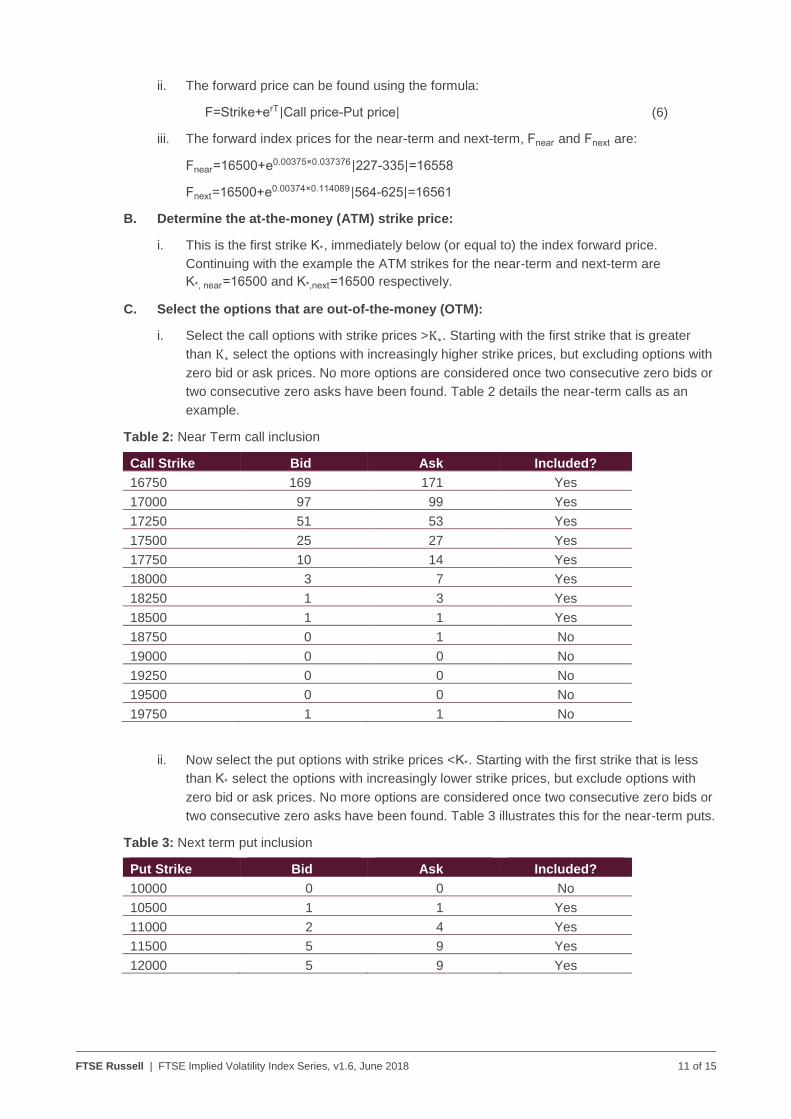
C. Select the options that are out-of-the-money (OTM):
i. Select the call options with strike prices >K∗. Starting with the first strike that is greater
than K∗ select the options with increasingly higher strike prices, but excluding options with
zero bid or ask prices. No more options are considered once two consecutive zero bids or
two consecutive zero asks have been found. Table 2 details the near-term calls as an
example.
Table 2: Near Term call inclusion
Call Strike Bid Ask Included?
16750 169 171 Yes
17000 97 99 Yes
17250 51 53 Yes
17500 25 27 Yes
17750 10 14 Yes
18000 3 7 Yes
18250 1 3 Yes
18500 1 1 Yes
18750 0 1 No
19000 0 0 No
19250 0 0 No
19500 0 0 No
19750 1 1 No
ii. Now select the put options with strike prices <K*. Starting with the first strike that is less
than K* select the options with increasingly lower strike prices, but exclude options with
zero bid or ask prices. No more options are considered once two consecutive zero bids or
two consecutive zero asks have been found. Table 3 illustrates this for the near-term puts.
Table 3: Next term put inclusion
Put Strike Bid Ask Included?
10000 0 0 No
10500 1 1 Yes
11000 2 4 Yes
11500 5 9 Yes
12000 5 9 Yes
FTSE Russell | FTSE Implied Volatility Index Series, v1.6, June 2018 12 of 15
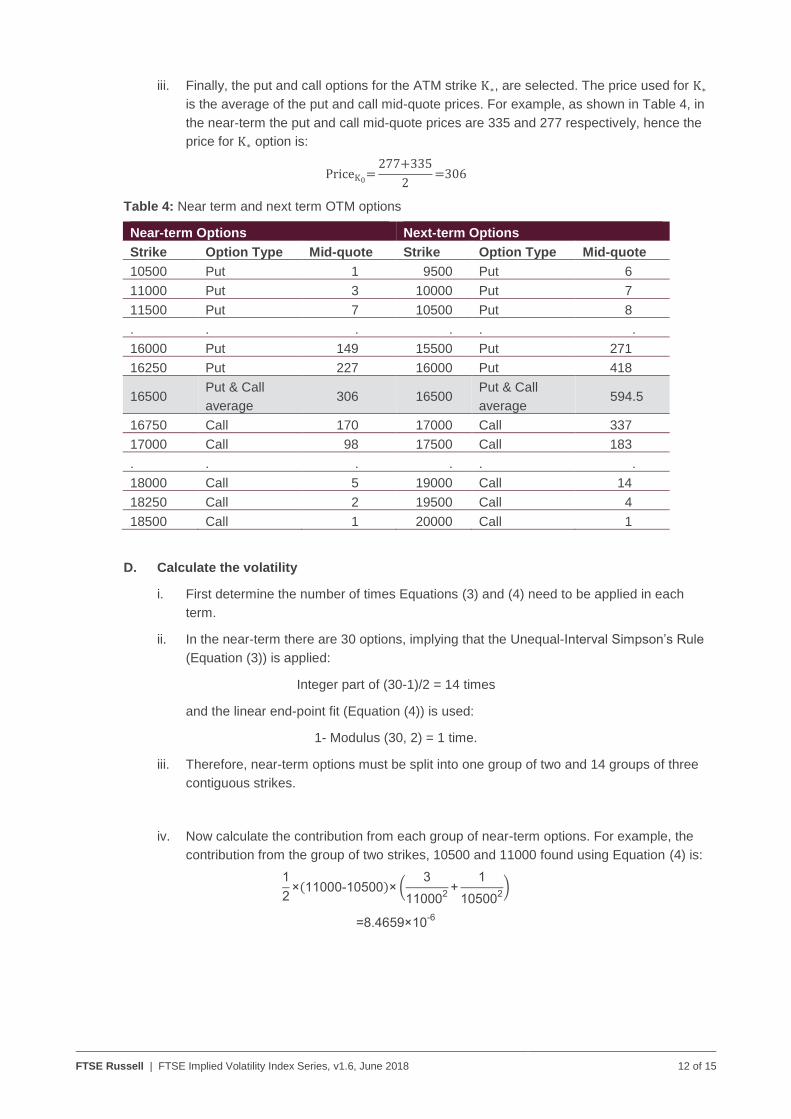
iii. Finally, the put and call options for the ATM strike K∗, are selected. The price used for K∗
is the average of the put and call mid-quote prices. For example, as shown in Table 4, in
the near-term the put and call mid-quote prices are 335 and 277 respectively, hence the
price for K∗ option is:
PriceK0=
277+335
2=306
Table 4: Near term and next term OTM options
Near-term Options Next-term Options
Strike Option Type Mid-quote Strike Option Type Mid-quote
10500 Put 1 9500 Put 6
11000 Put 3 10000 Put 7
11500 Put 7 10500 Put 8
. . . . . .
16000 Put 149 15500 Put 271
16250 Put 227 16000 Put 418
16500 Put & Call
average 306 16500
Put & Call
average 594.5
16750 Call 170 17000 Call 337
17000 Call 98 17500 Call 183
. . . . . .
18000 Call 5 19000 Call 14
18250 Call 2 19500 Call 4
18500 Call 1 20000 Call 1
D. Calculate the volatility
i. First determine the number of times Equations (3) and (4) need to be applied in each
term.
ii. In the near-term there are 30 options, implying that the Unequal-Interval Simpson’s Rule
(Equation (3)) is applied:
Integer part of (30-1)/2 = 14 times
and the linear end-point fit (Equation (4)) is used:
1- Modulus (30, 2) = 1 time.
iii. Therefore, near-term options must be split into one group of two and 14 groups of three
contiguous strikes.
iv. Now calculate the contribution from each group of near-term options. For example, the
contribution from the group of two strikes, 10500 and 11000 found using Equation (4) is:
1
2×(11000-10500)× (
3
110002
+1
105002
)
=8.4659×10⁻⁶
FTSE Russell | FTSE Implied Volatility Index Series, v1.6, June 2018 13 of 15
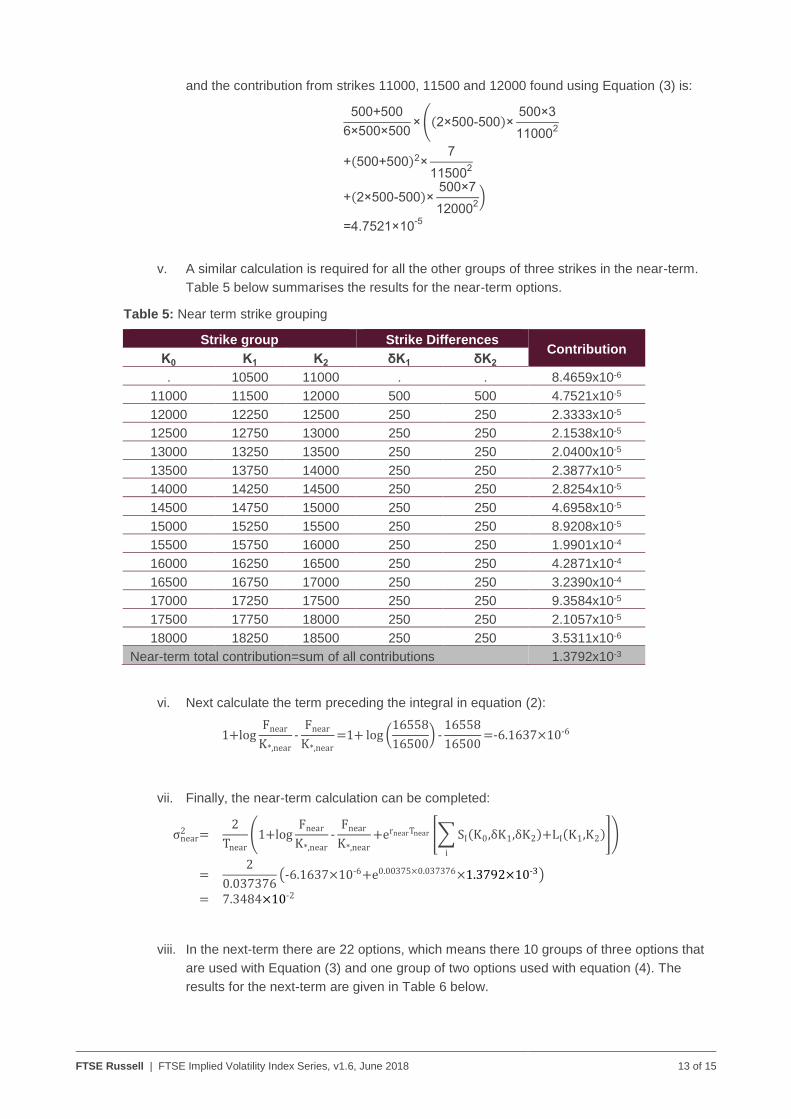
and the contribution from strikes 11000, 11500 and 12000 found using Equation (3) is:
500+500
6×500×500× ((2×500-500)×
500×3
110002
+(500+500)2×7
115002
+(2×500-500)×500×7
120002
)
=4.7521×10⁻⁵
v. A similar calculation is required for all the other groups of three strikes in the near-term.
Table 5 below summarises the results for the near-term options.
Table 5: Near term strike grouping
Strike group Strike Differences Contribution
K0 K1 K2 δK1 δK2
. 10500 11000 . . 8.4659x10⁻⁶
11000 11500 12000 500 500 4.7521x10⁻⁵
12000 12250 12500 250 250 2.3333x10⁻⁵
12500 12750 13000 250 250 2.1538x10⁻⁵
13000 13250 13500 250 250 2.0400x10⁻⁵
13500 13750 14000 250 250 2.3877x10⁻⁵
14000 14250 14500 250 250 2.8254x10⁻⁵
14500 14750 15000 250 250 4.6958x10⁻⁵
15000 15250 15500 250 250 8.9208x10⁻⁵
15500 15750 16000 250 250 1.9901x10⁻⁴
16000 16250 16500 250 250 4.2871x10⁻⁴
16500 16750 17000 250 250 3.2390x10⁻⁴
17000 17250 17500 250 250 9.3584x10⁻⁵
17500 17750 18000 250 250 2.1057x10⁻⁵
18000 18250 18500 250 250 3.5311x10⁻⁶
Near-term total contribution=sum of all contributions 1.3792x10⁻³
vi. Next calculate the term preceding the integral in equation (2):
1+logFnear
K*,near
-Fnear
K*,near
=1+ log (16558
16500) -
16558
16500=-6.1637×10⁻⁶
vii. Finally, the near-term calculation can be completed:
σnear2 =
2
Tnear
(1+logFnear
K*,near
-Fnear
K*,near
+ernearTnear [∑ SI(K0,δK1,δK2)+LI(K1,K2)
i
])
=2
0.037376(-6.1637×10⁻⁶+e0.00375×0.037376×1.3792×10-3)
= 7.3484×10⁻²
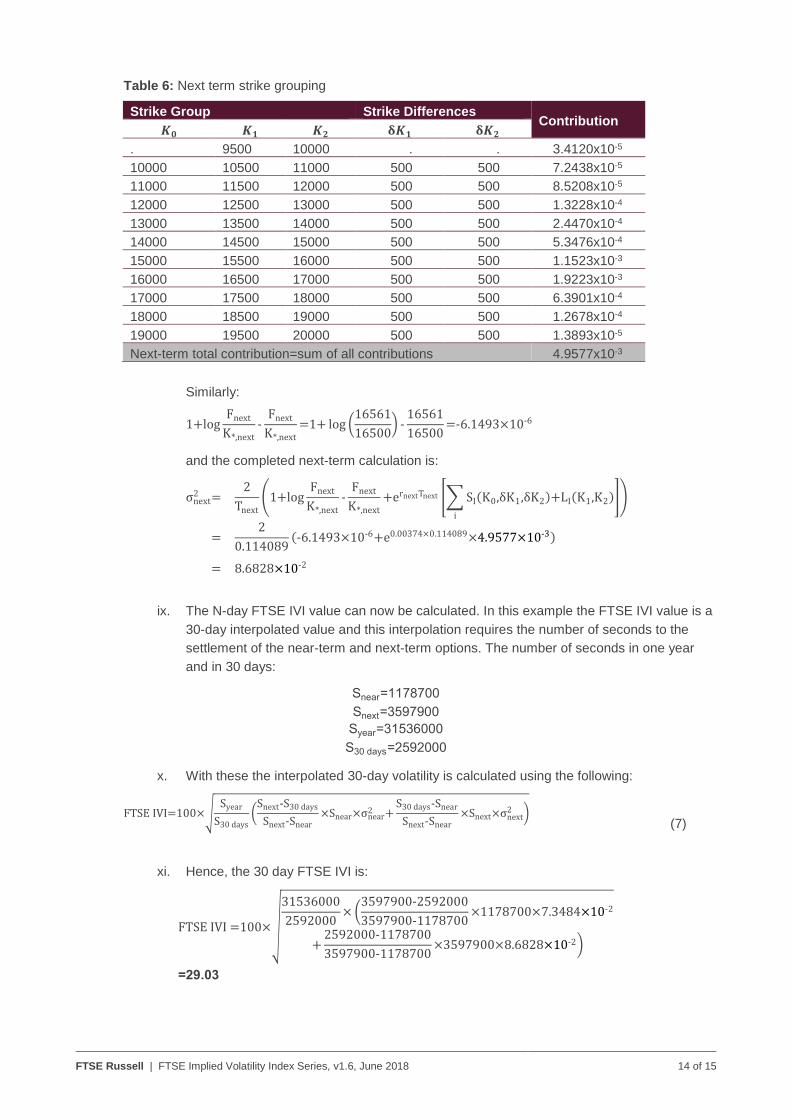
viii. In the next-term there are 22 options, which means there 10 groups of three options that
are used with Equation (3) and one group of two options used with equation (4). The
results for the next-term are given in Table 6 below.
FTSE Russell | FTSE Implied Volatility Index Series, v1.6, June 2018 14 of 15
Table 6: Next term strike grouping
Strike Group Strike Differences Contribution
𝑲𝟎 𝑲𝟏 𝑲𝟐 𝛅𝑲𝟏 𝛅𝑲𝟐
. 9500 10000 . . 3.4120x10⁻⁵
10000 10500 11000 500 500 7.2438x10⁻⁵
11000 11500 12000 500 500 8.5208x10⁻⁵
12000 12500 13000 500 500 1.3228x10⁻⁴
13000 13500 14000 500 500 2.4470x10⁻⁴
14000 14500 15000 500 500 5.3476x10⁻⁴
15000 15500 16000 500 500 1.1523x10⁻³
16000 16500 17000 500 500 1.9223x10⁻³
17000 17500 18000 500 500 6.3901x10⁻⁴
18000 18500 19000 500 500 1.2678x10⁻⁴
19000 19500 20000 500 500 1.3893x10⁻⁵
Next-term total contribution=sum of all contributions 4.9577x10⁻³
Similarly:
1+logFnext
K*,next
-Fnext
K*,next
=1+ log (16561
16500) -
16561
16500=-6.1493×10⁻⁶
and the completed next-term calculation is:
σnext2 =
2
Tnext
(1+logFnext
K*,next
-Fnext
K*,next
+ernextTnext [∑ SI(K0,δK1,δK2)+LI(K1,K2)
i
])
=2
0.114089(-6.1493×10⁻⁶+e0.00374×0.114089×4.9577×10-3)
= 8.6828×10⁻²
ix. The N-day FTSE IVI value can now be calculated. In this example the FTSE IVI value is a
30-day interpolated value and this interpolation requires the number of seconds to the
settlement of the near-term and next-term options. The number of seconds in one year
and in 30 days:
Snear=1178700
Snext=3597900
Syear=31536000
S30 days=2592000
x. With these the interpolated 30-day volatility is calculated using the following:
FTSE IVI=100×√Syear
S30 days(
Snext-S30 days
Snext-Snear×Snear×σnear
2 +S30 days-Snear
Snext-Snear×Snext×σnext
2 )
(7)
xi. Hence, the 30 day FTSE IVI is:
FTSE IVI =100×√
31536000
2592000× (
3597900-2592000
3597900-1178700×1178700×7.3484×10-2
+2592000-1178700
3597900-1178700×3597900×8.6828×10-2)
=29.03
FTSE Russell | FTSE Implied Volatility Index Series, v1.6, June 2018 15 of 15
Appendix A: Further Information
A Glossary of Terms used in FTSE Russell’s Ground Rule documents can be found using the following link:
Glossary.pdf
Further information on the FTSE Implied Volatility Index Series is available from FTSE Russell.
For contact details please visit the FTSE Russell website or contact FTSE Russell client services at
Website: www.ftserussell.com
© 2018 London Stock Exchange Group plc and its applicable group undertakings (the “LSE Group”). The LSE Group includes (1) FTSE International Limited (“FTSE”), (2) Frank Russell Company (“Russell”), (3) FTSE Global Debt Capital Markets Inc. and FTSE Global Debt Capital Markets Limited (together, “FTSE Canada”), (4) MTSNext Limited (“MTSNext”), (5) Mergent, Inc. (“Mergent”), (6) FTSE Fixed Income LLC (“FTSE FI”) and (7) The Yield Book Inc (“YB All rights reserved. The FTSE Implied Volatility Index Series is calculated by or on behalf of FTSE International Limited or its affiliate, agent or partner. FTSE International Limited is authorised and regulated by the Financial Conduct Authority as a benchmark administrator. FTSE Russell® is a trading name of FTSE, Russell, FTSE Canada, MTSNext, Mergent, FTSE FI and YB. “FTSE®”, “Russell®”, “FTSE Russell®” “MTS®”, “FTSE4Good®”, “ICB®”, “Mergent®”, “WorldBIG®”, “USBIG®”, “EuroBIG®”, “AusBIG®”, “The Yield Book®” and all other trademarks and service marks used herein (whether registered or unregistered) are trade marks and/or service marks owned or licensed by the applicable member of the LSE Group or their respective licensors and are owned, or used under licence, by FTSE, Russell, MTSNext, TSE Canada, Mergent, FTSE FI or YB. All information is provided for information purposes only. Every effort is made to ensure that all information given in this publication is accurate, but no responsibility or liability can be accepted by any member of the LSE Group nor their respective directors, officers, employees, partners or licensors for any errors or for any loss from use of this publication or any of the information or data contained herein. No member of the LSE Group nor their respective directors, officers, employees, partners or licensors make any claim, prediction, warranty or representation whatsoever, expressly or impliedly, either as to the results to be obtained from the use of the FTSE Implied Volatility Index Series or the fitness or suitability of the Index Series for any particular purpose to which it might be put. No member of the LSE Group nor their respective directors, officers, employees, partners or licensors provide investment advice and nothing in this document should be taken as constituting financial or investment advice. No member of the LSE Group nor their respective directors, officers, employees, partners or licensors make any representation regarding the advisability of investing in any asset. A decision to invest in any such asset should not be made in reliance on any information herein. Indexes cannot be invested in directly. Inclusion of an asset in an index is not a recommendation to buy, sell or hold that asset. The general information contained in this publication should not be acted upon without obtaining specific legal, tax, and investment advice from a licensed professional. No part of this information may be reproduced, stored in a retrieval system or transmitted in any form or by any means, electronic, mechanical, photocopying, recording or otherwise, without prior written permission of the applicable member of the LSE Group. Use and distribution of the LSE Group index data and the use of their data to create financial products require a licence with FTSE, Russell, FTSE Canada, MTSNext, Mergent, FTSE FI, YB and/or their respective licensors.