FTIR Imaging The Benefits of Fine Spatial Detail - … · FTIR Imaging: The Benefits of Fine...
40
July 20, 2017 1 Agilent Confidential FTIR Imaging: The Benefits of Fine Spatial Detail Louis G. Tisinger, Ph.D. FTIR Application Engineer Agilent Technologies
-
Upload
nguyenhuong -
Category
Documents
-
view
218 -
download
0
Transcript of FTIR Imaging The Benefits of Fine Spatial Detail - … · FTIR Imaging: The Benefits of Fine...
July 20, 2017
1
Agilent Confidential
FTIR Imaging: The Benefits of Fine Spatial Detail
Louis G. Tisinger, Ph.D.
FTIR Application Engineer
Agilent Technologies
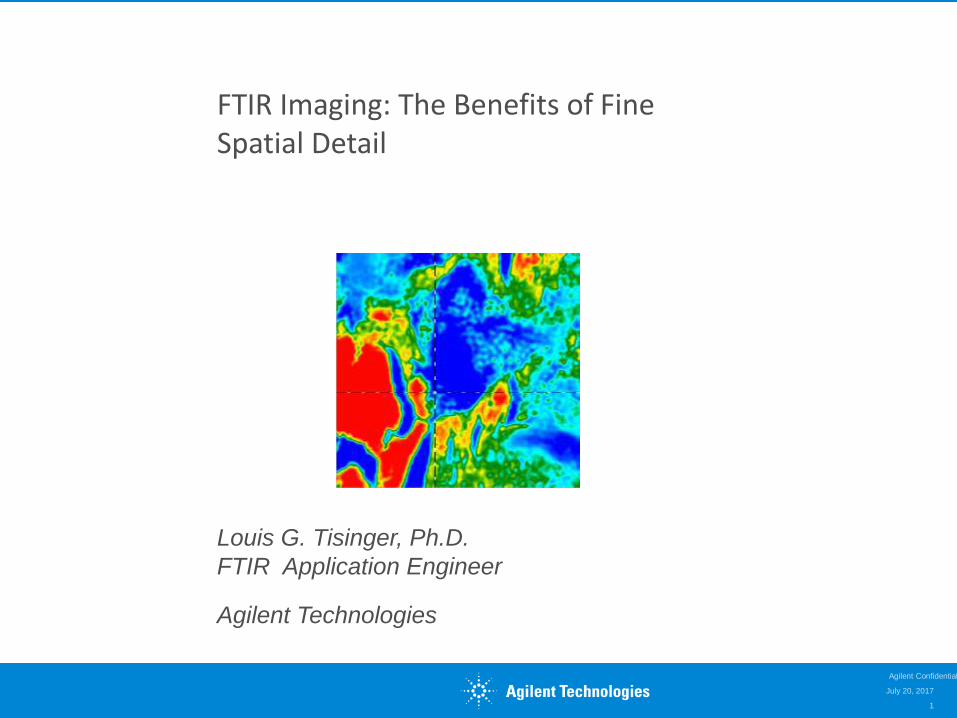
Outline
1. Background and history
2. Spatial Resolution
3. Typical Applications
1. Laminate
2. Defect
3. Biological
4. Pharma
July 20, 2017
2
3800 3600 3400 3200 3000 2800 2600 2400 2200 2000 1800 1600 1400 1200 1000 800
0.7
0.6
0.5
0.4
0.3
0.2
0.1
0.0
Wavenumber
Ab
so
rba
nce
1. Background and History
July 20, 2017
3
Agilent Confidential
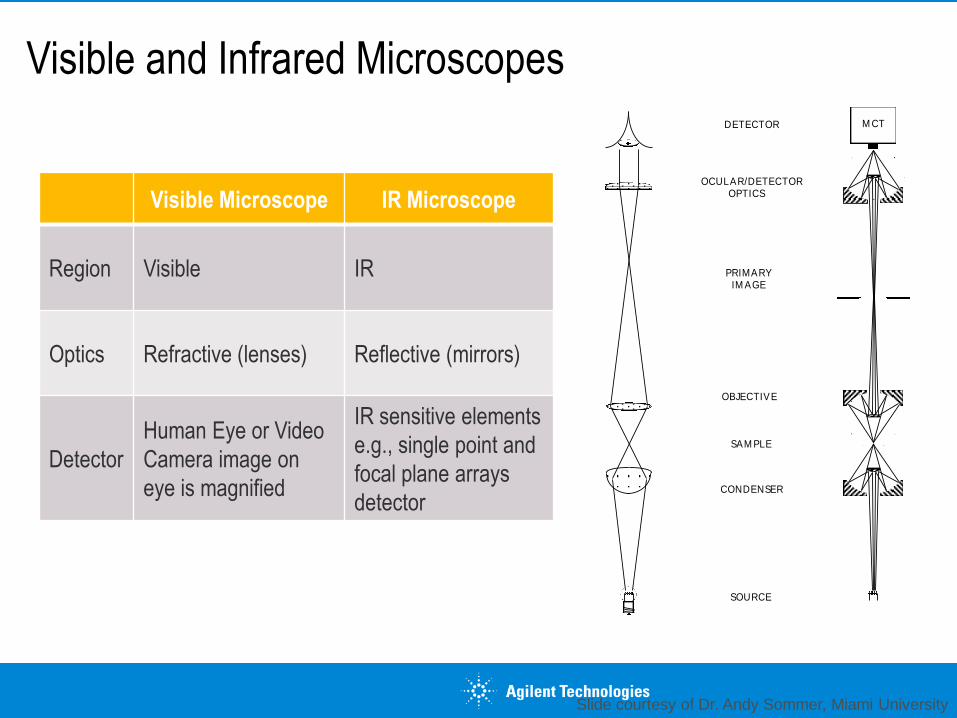
Visible and Infrared Microscopes
M CT
SOURCE
CONDENSER
OBJECTIVE
PRIMARY IM AGE
OCULAR/DETECTOR OPTICS
DETECTOR
SAM PLE
Visible Microscope IR Microscope
Region Visible IR
Optics Refractive (lenses) Reflective (mirrors)
Detector
Human Eye or Video
Camera image on
eye is magnified
IR sensitive elements
e.g., single point and
focal plane arrays
detector
Slide courtesy of Dr. Andy Sommer, Miami University
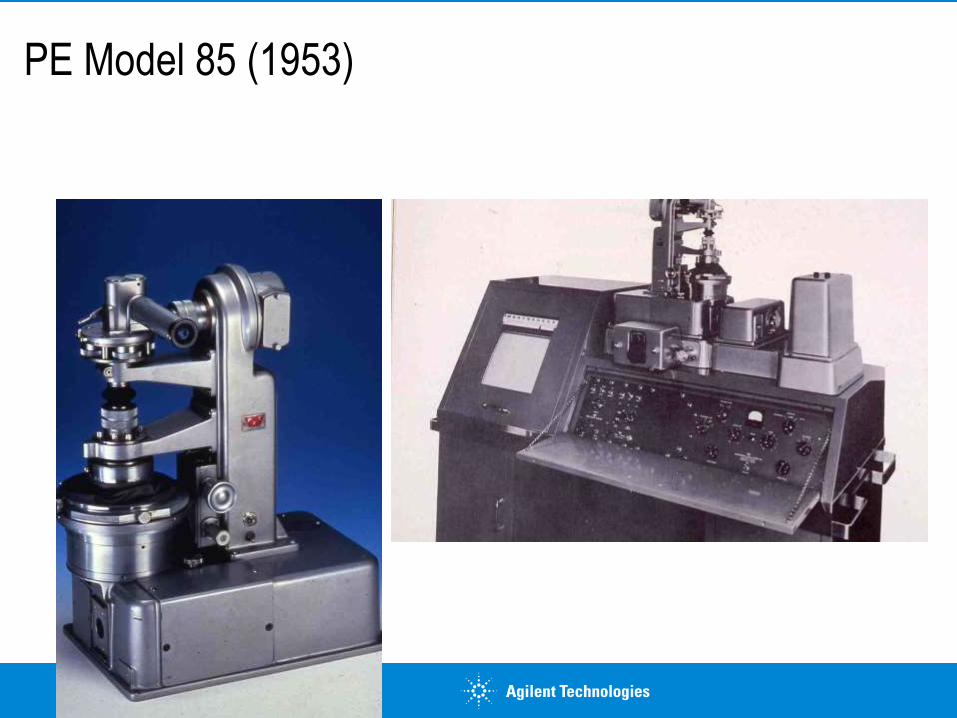
PE Model 85 (1953)
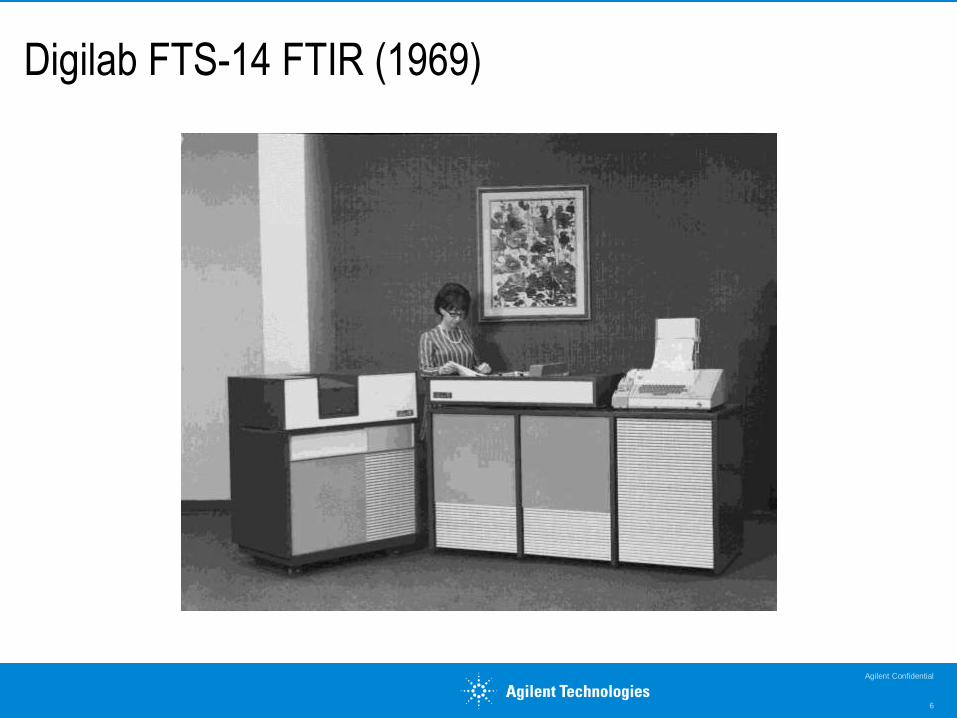
Digilab FTS-14 FTIR (1969)
Agilent Confidential
6
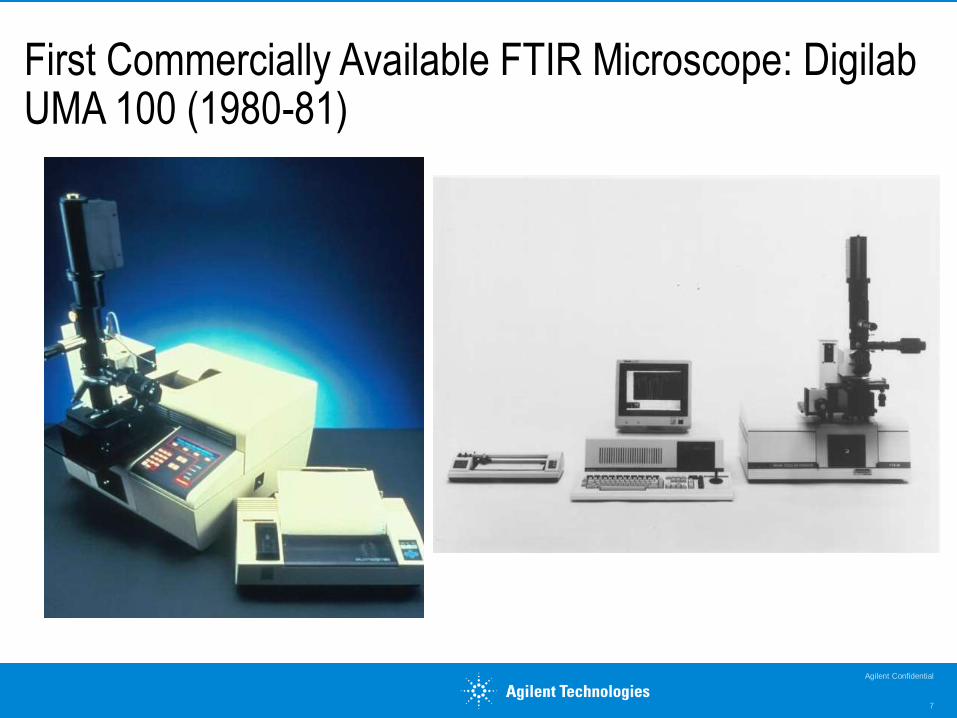
First Commercially Available FTIR Microscope: Digilab UMA 100 (1980-81)
Agilent Confidential
7
8
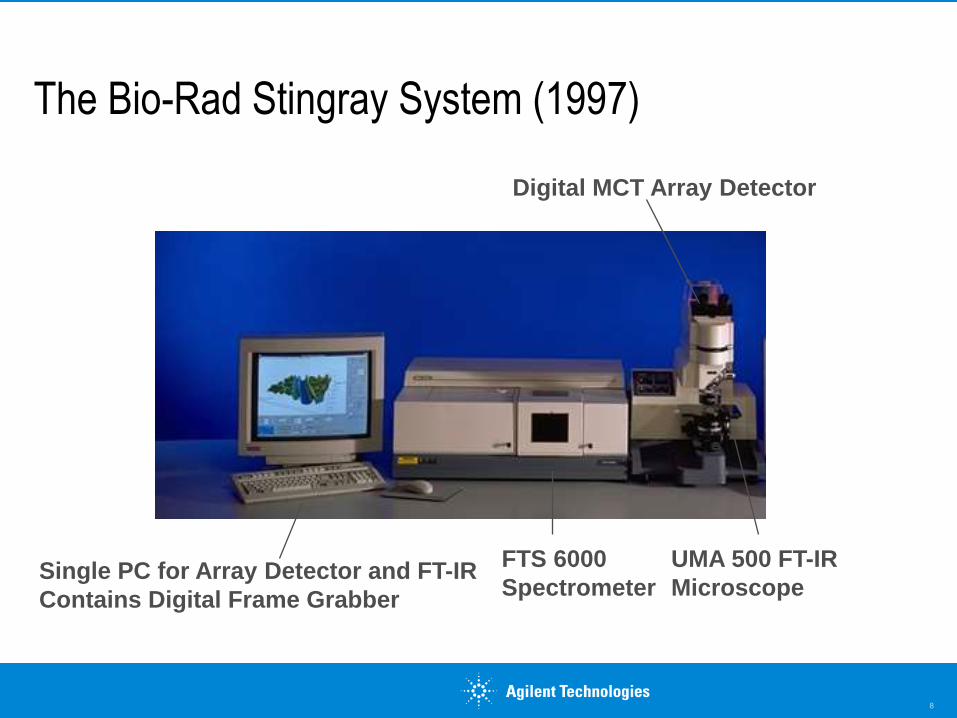
The Bio-Rad Stingray System (1997)
Digital MCT Array Detector
Single PC for Array Detector and FT-IR
Contains Digital Frame Grabber
FTS 6000
Spectrometer
UMA 500 FT-IR
Microscope
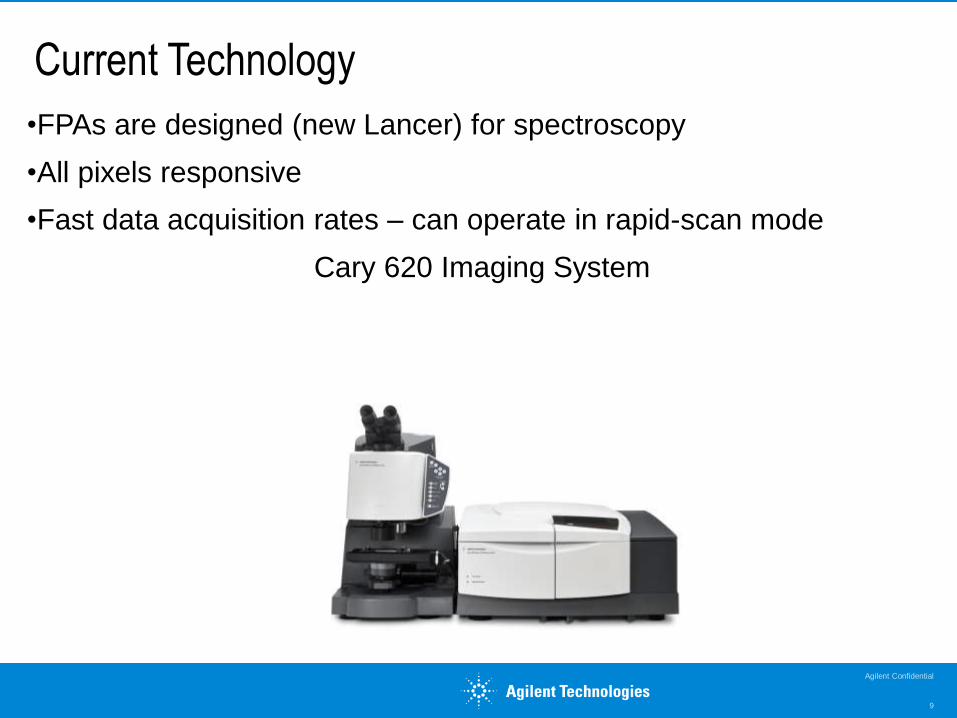
Current Technology
•FPAs are designed (new Lancer) for spectroscopy
•All pixels responsive
•Fast data acquisition rates – can operate in rapid-scan mode
Cary 620 Imaging System
Agilent Confidential
9
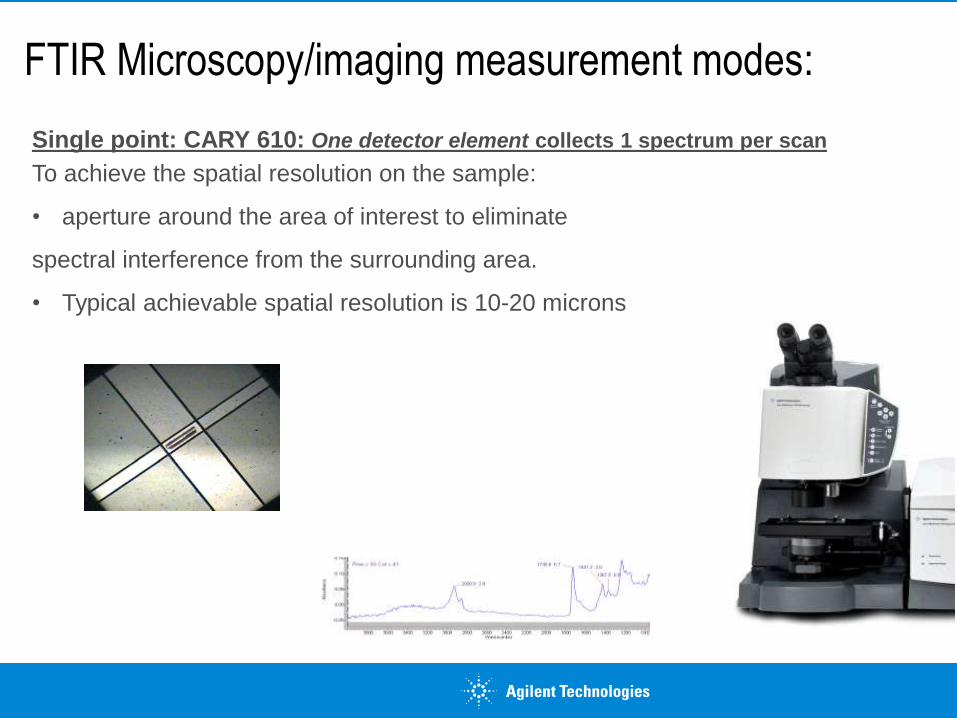
FTIR Microscopy/imaging measurement modes:
Single point: CARY 610: One detector element collects 1 spectrum per scan
To achieve the spatial resolution on the sample:
• aperture around the area of interest to eliminate
spectral interference from the surrounding area.
• Typical achievable spatial resolution is 10-20 microns
Single-point Measurements Microscope Measurement Modes:
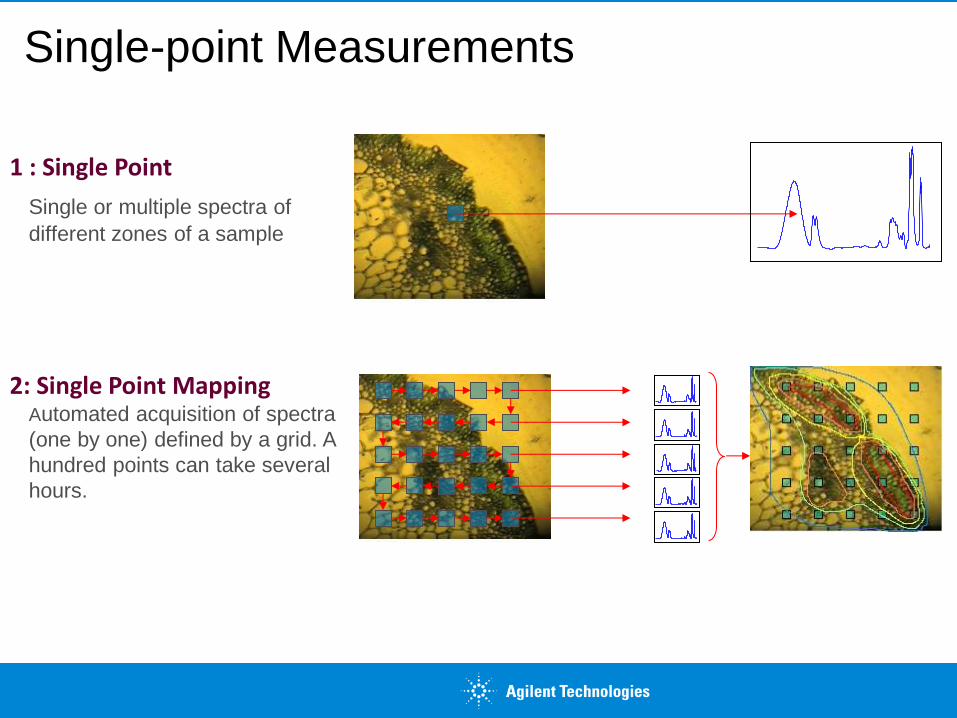
1 : Single Point
Single or multiple spectra of
different zones of a sample
2: Single Point Mapping Automated acquisition of spectra
(one by one) defined by a grid. A
hundred points can take several
hours.
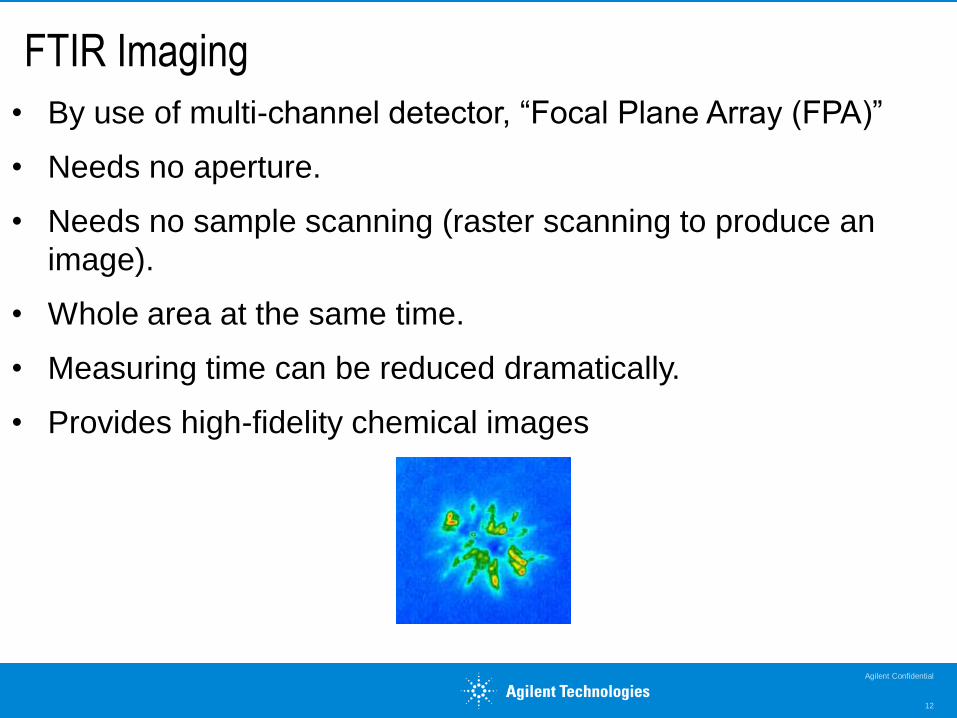
FTIR Imaging
• By use of multi-channel detector, “Focal Plane Array (FPA)”
• Needs no aperture.
• Needs no sample scanning (raster scanning to produce an
image).
• Whole area at the same time.
• Measuring time can be reduced dramatically.
• Provides high-fidelity chemical images
12
Agilent Confidential
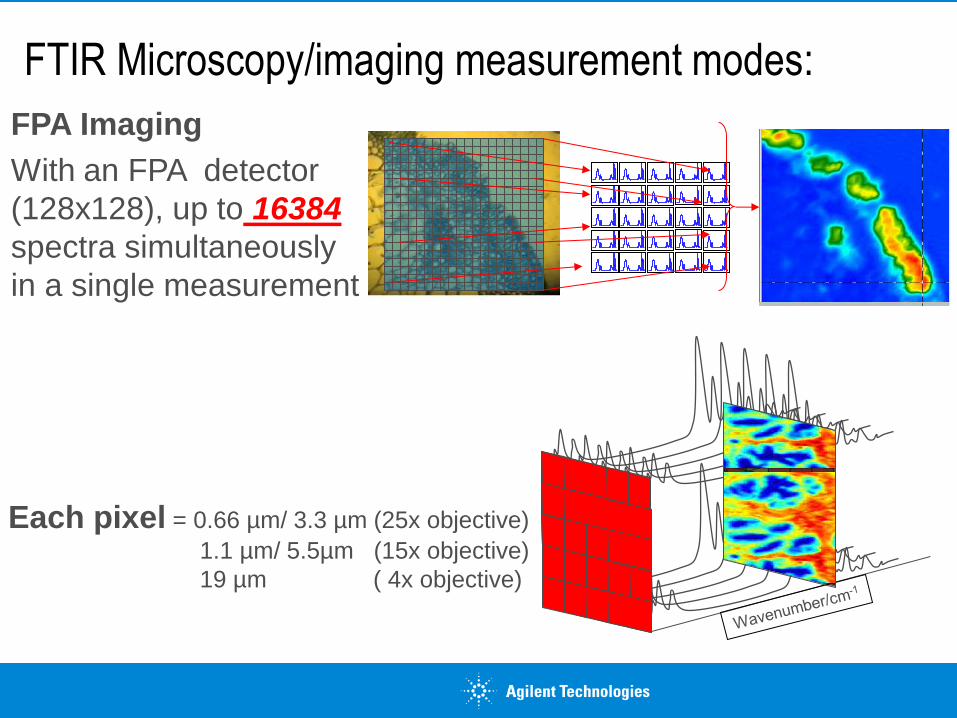
FPA Imaging
With an FPA detector
(128x128), up to 16384
spectra simultaneously
in a single measurement
FTIR Microscopy/imaging measurement modes:
Each pixel = 0.66 µm/ 3.3 µm (25x objective)
1.1 µm/ 5.5µm (15x objective)
19 µm ( 4x objective)
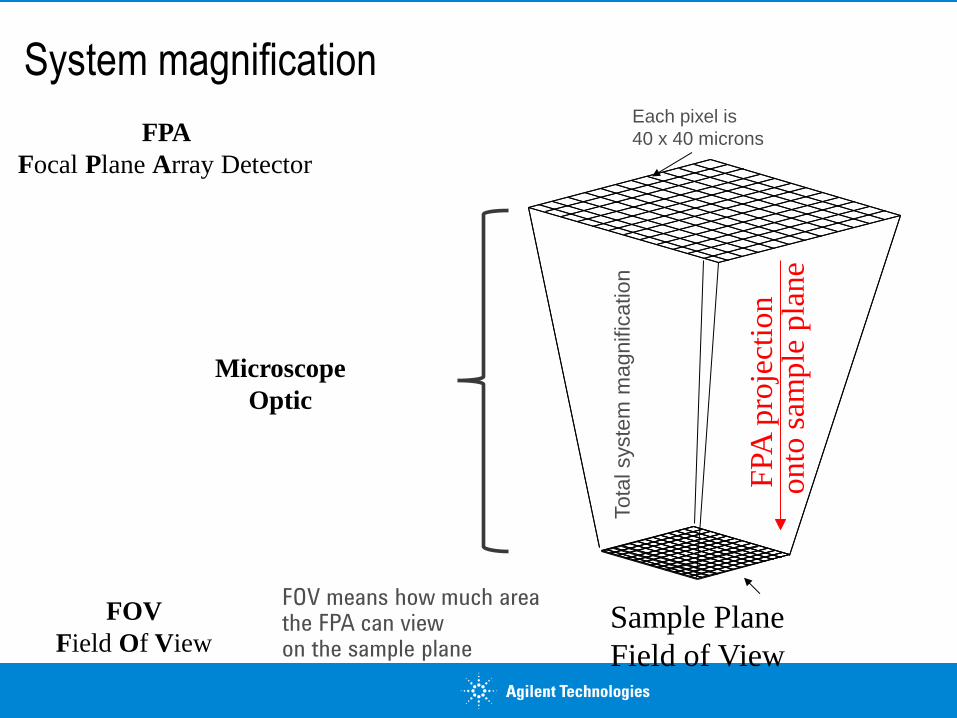
System magnification Each pixel is
40 x 40 microns
FPA
pro
ject
ion
onto
sam
ple
pla
ne
FPA
Focal Plane Array Detector
Sample Plane
Field of View
Tota
l syste
m m
agnific
ation
FOV
Field Of View
Microscope
Optic
FOV means how much area the FPA can view on the sample plane
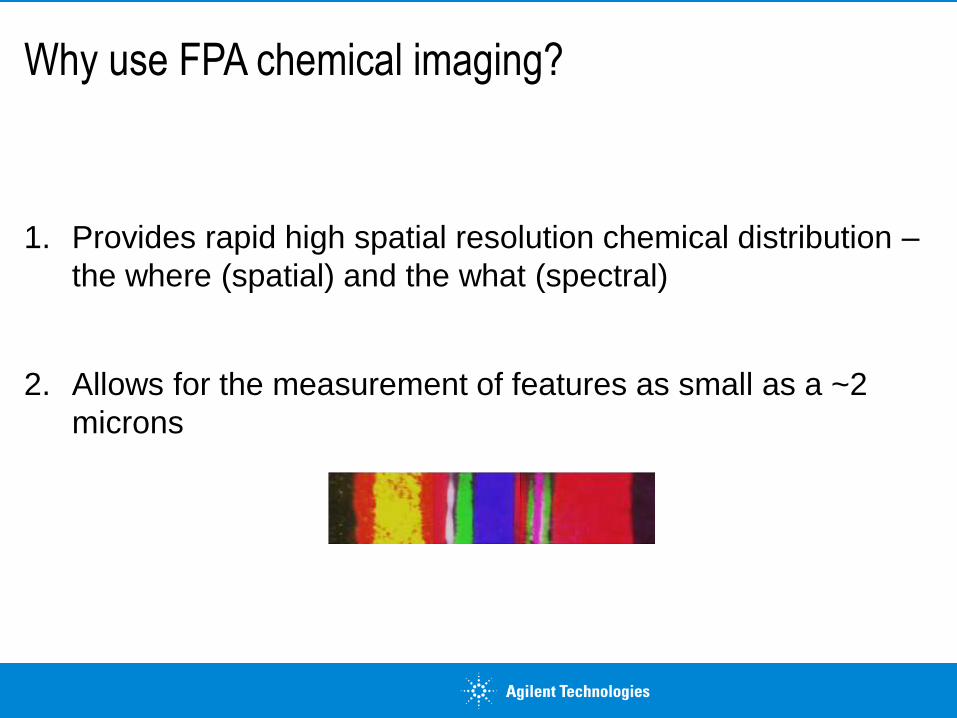
Why use FPA chemical imaging?
1. Provides rapid high spatial resolution chemical distribution –
the where (spatial) and the what (spectral)
2. Allows for the measurement of features as small as a ~2
microns
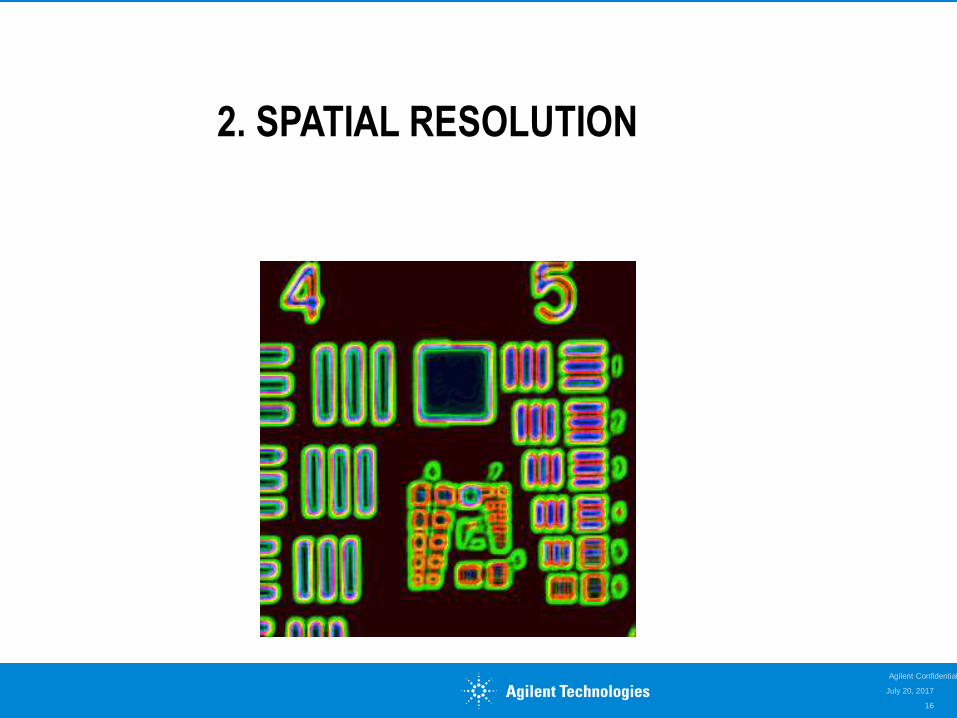
2. SPATIAL RESOLUTION
July 20, 2017
16
Agilent Confidential
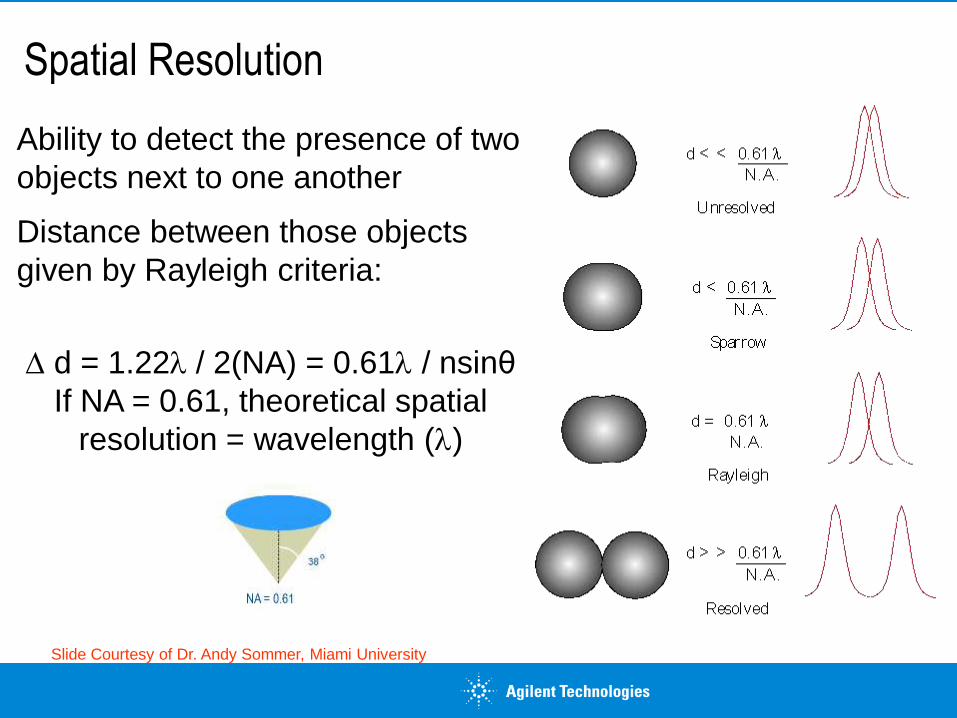
Spatial Resolution
Ability to detect the presence of two
objects next to one another
Distance between those objects
given by Rayleigh criteria:
d = 1.22l / 2(NA) = 0.61l / nsinθ
If NA = 0.61, theoretical spatial
resolution = wavelength (l)
Slide Courtesy of Dr. Andy Sommer, Miami University
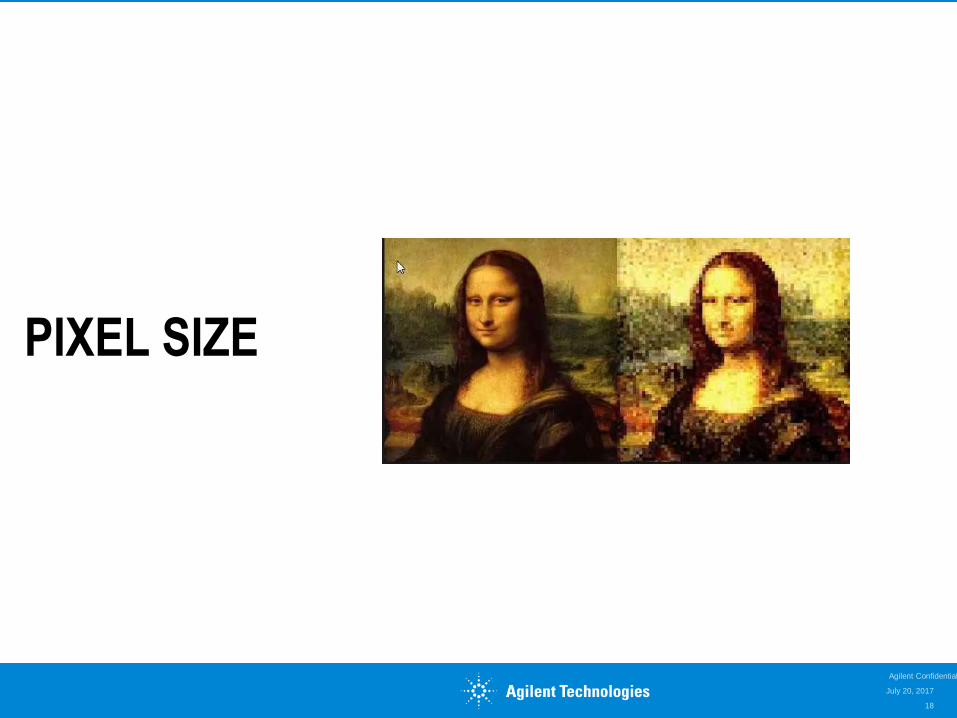
PIXEL SIZE
July 20, 2017
18
Agilent Confidential
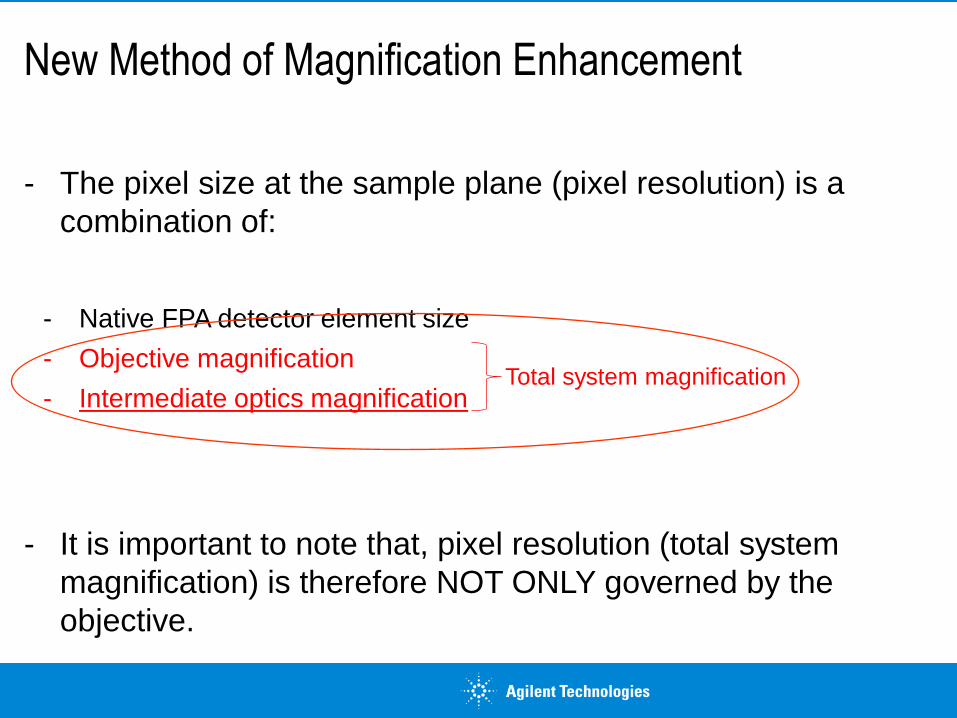
New Method of Magnification Enhancement
- The pixel size at the sample plane (pixel resolution) is a
combination of:
- Native FPA detector element size
- Objective magnification
- Intermediate optics magnification
- It is important to note that, pixel resolution (total system
magnification) is therefore NOT ONLY governed by the
objective.
Total system magnification
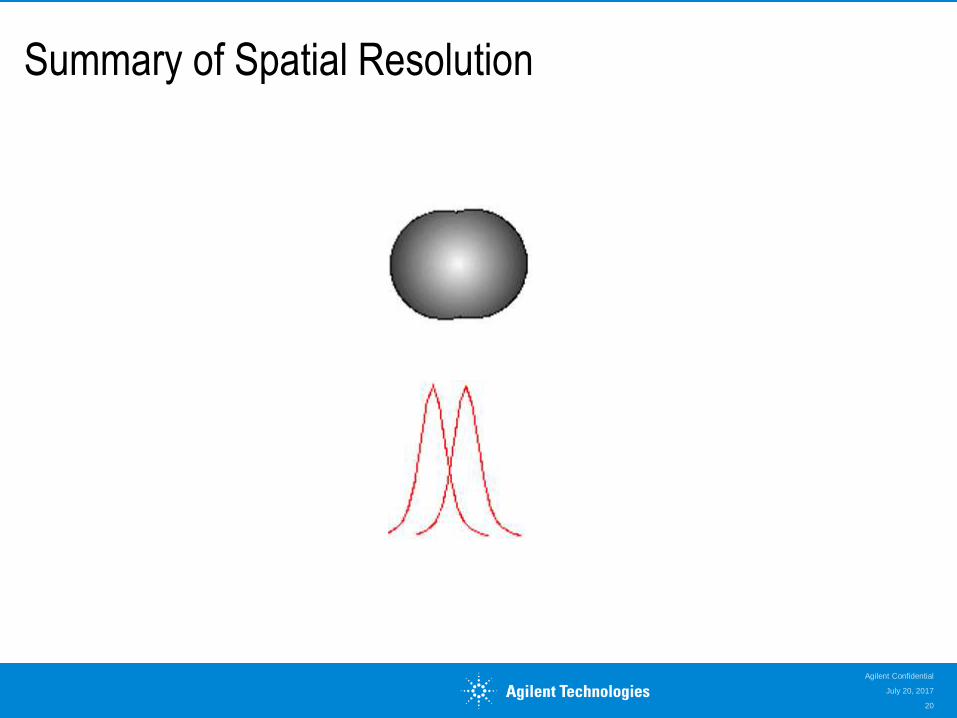
Summary of Spatial Resolution
July 20, 2017
Agilent Confidential
20
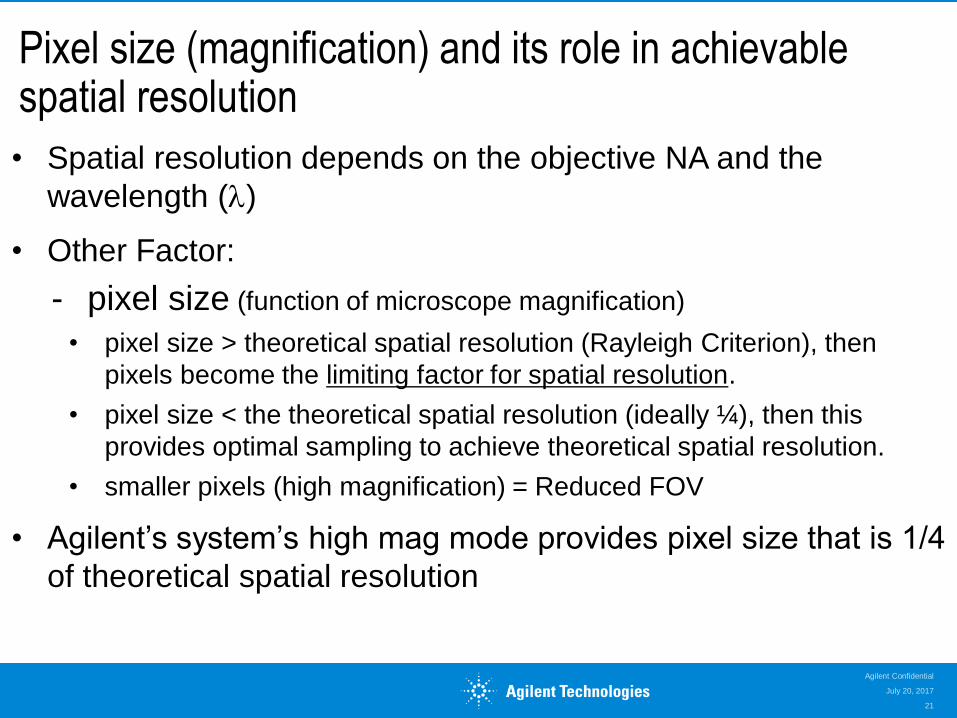
Pixel size (magnification) and its role in achievable spatial resolution
• Spatial resolution depends on the objective NA and the
wavelength (l)
• Other Factor:
- pixel size (function of microscope magnification)
• pixel size > theoretical spatial resolution (Rayleigh Criterion), then
pixels become the limiting factor for spatial resolution.
• pixel size < the theoretical spatial resolution (ideally ¼), then this
provides optimal sampling to achieve theoretical spatial resolution.
• smaller pixels (high magnification) = Reduced FOV
• Agilent’s system’s high mag mode provides pixel size that is 1/4
of theoretical spatial resolution
July 20, 2017
Agilent Confidential
21
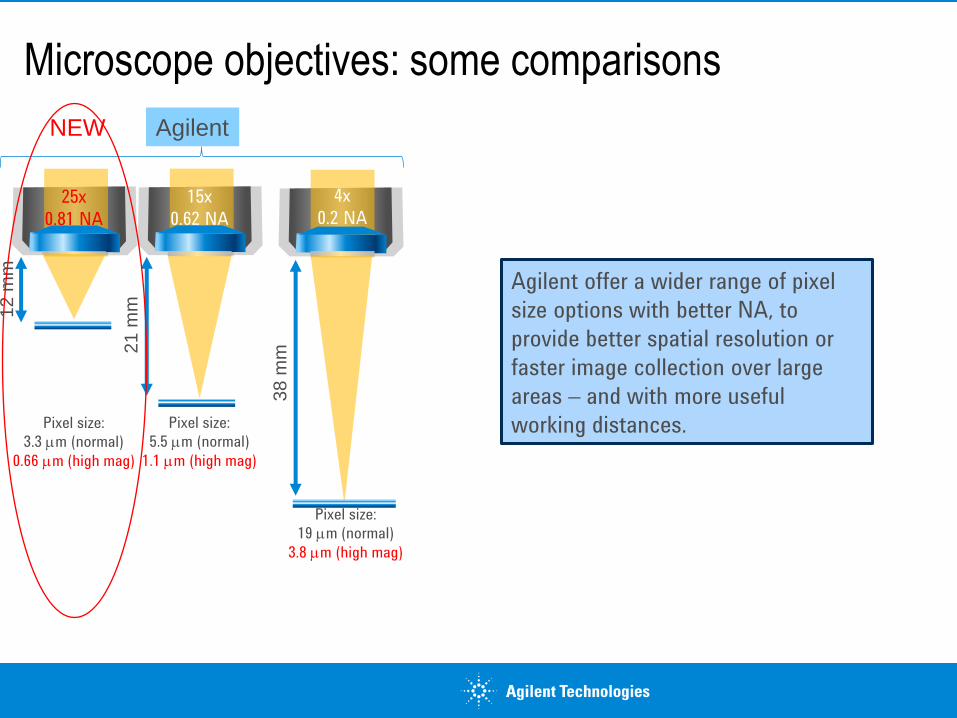
Microscope objectives: some comparisons
Pixel size:
19 mm (normal)
3.8 mm (high mag)
38 m
m
4x
0.2 NA
Agilent
Agilent offer a wider range of pixel
size options with better NA, to
provide better spatial resolution or
faster image collection over large
areas – and with more useful
working distances. Pixel size:
3.3 mm (normal)
0.66 mm (high mag)
12 m
m
25x
0.81 NA
21 m
m
Pixel size:
5.5 mm (normal)
1.1 mm (high mag)
15x
0.62 NA
NEW
3. APPLICATIONS
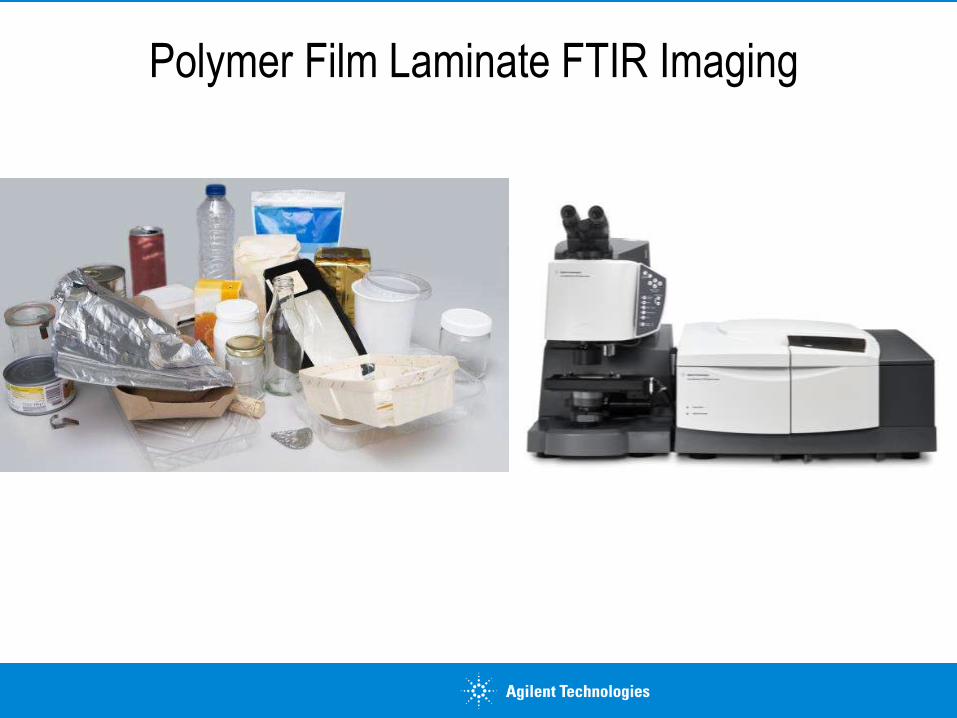
Polymer Film Laminate FTIR Imaging
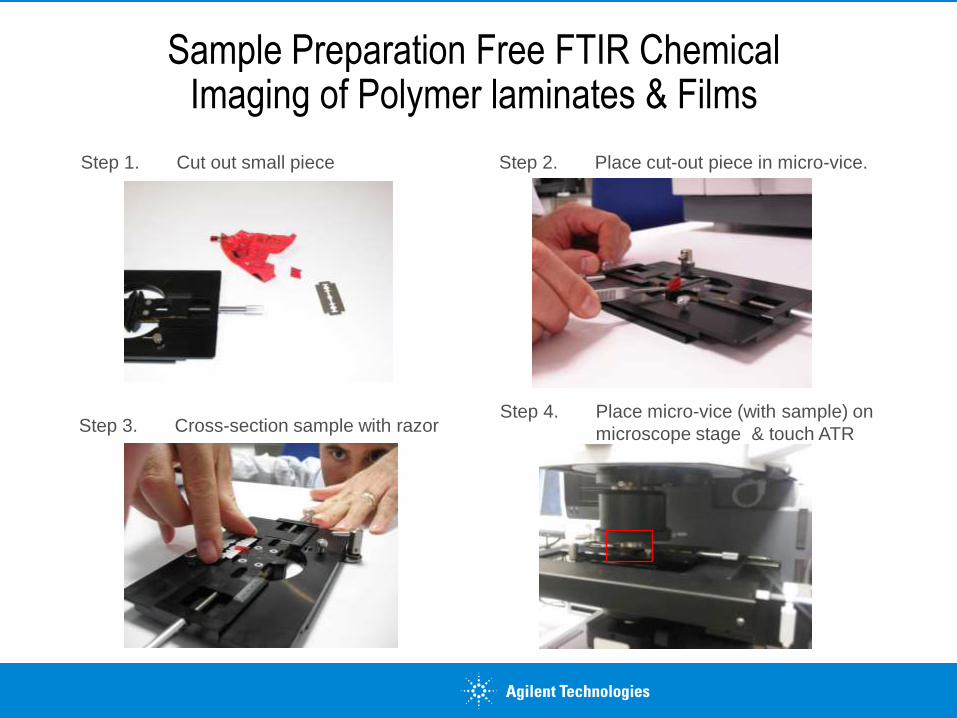
Sample Preparation Free FTIR Chemical Imaging of Polymer laminates & Films
Step 1. Cut out small piece Step 2. Place cut-out piece in micro-vice.
Step 3. Cross-section sample with razor Step 4. Place micro-vice (with sample) on
microscope stage & touch ATR
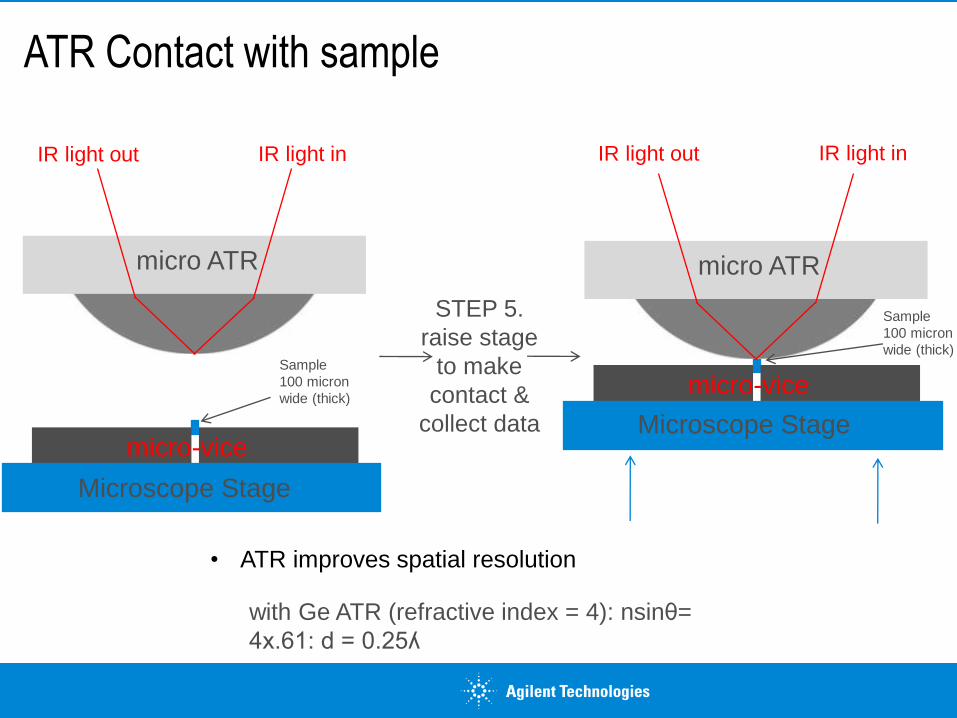
ATR Contact with sample
STEP 5.
raise stage
to make
contact &
collect data
micro ATR
Microscope Stage
micro-vice
Sample
100 micron
wide (thick)
IR light in IR light out
micro ATR
micro-vice
Microscope Stage
Sample
100 micron
wide (thick)
IR light in IR light out
with Ge ATR (refractive index = 4): nsinθ=
4x.61: d = 0.25ʎ
• ATR improves spatial resolution
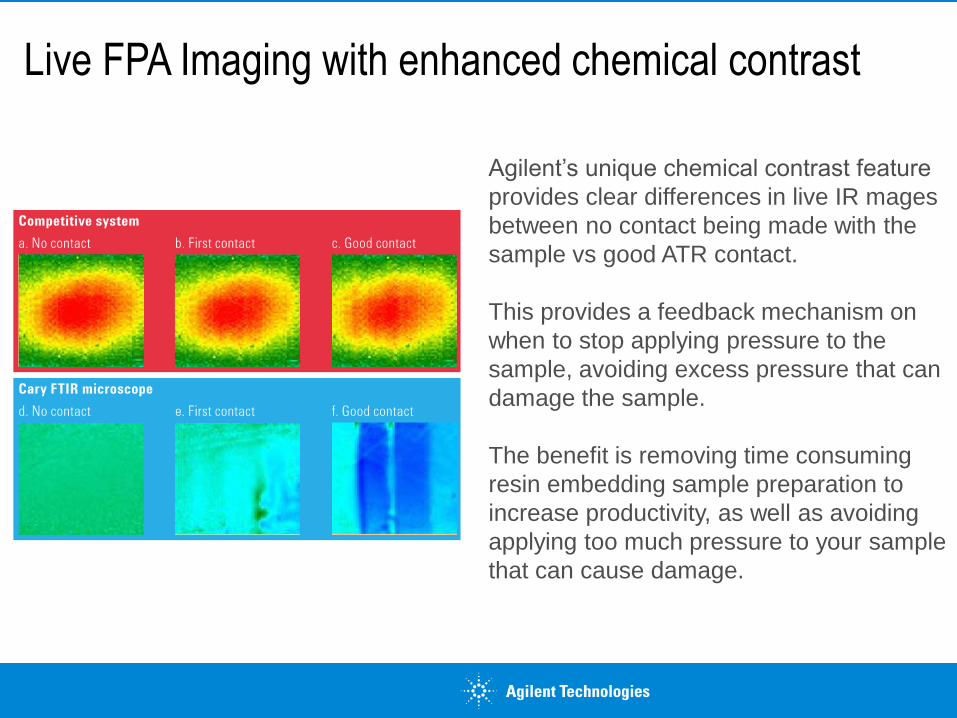
Agilent’s unique chemical contrast feature
provides clear differences in live IR mages
between no contact being made with the
sample vs good ATR contact.
This provides a feedback mechanism on
when to stop applying pressure to the
sample, avoiding excess pressure that can
damage the sample.
The benefit is removing time consuming
resin embedding sample preparation to
increase productivity, as well as avoiding
applying too much pressure to your sample
that can cause damage.
Live FPA Imaging with enhanced chemical contrast
28
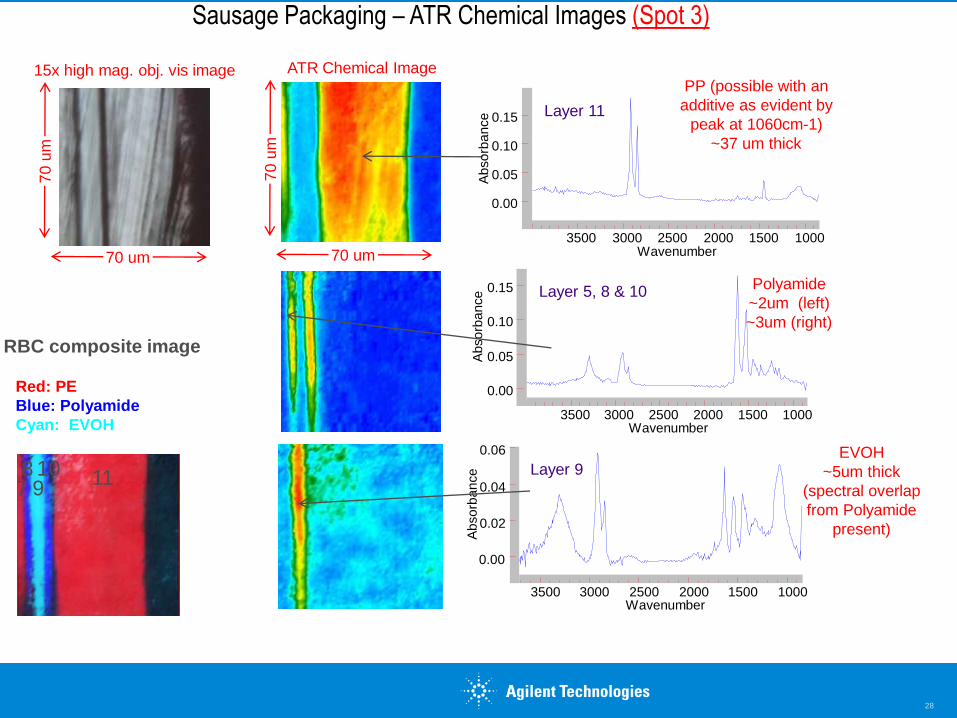
15x high mag. obj. vis image
70 u
m
70 um 70 u
m
70 um
ATR Chemical Image PP (possible with an
additive as evident by
peak at 1060cm-1)
~37 um thick
RBC composite image
Red: PE
Blue: Polyamide
Cyan: EVOH
Sausage Packaging – ATR Chemical Images (Spot 3)
Layer 5, 8 & 10
3500 3000 2500 2000 1500 1000
0.15
0.10
0.05
0.00
Wavenumber
Abso
rba
nce
Polyamide
~2um (left)
~3um (right)
Layer 9
3500 3000 2500 2000 1500 1000
0.06
0.04
0.02
0.00
Wavenumber
Ab
so
rba
nce
EVOH
~5um thick
(spectral overlap
from Polyamide
present)
Layer 11
3500 3000 2500 2000 1500 1000
0.15
0.10
0.05
0.00
Wavenumber
Ab
so
rba
nce
7 8 9 10 11
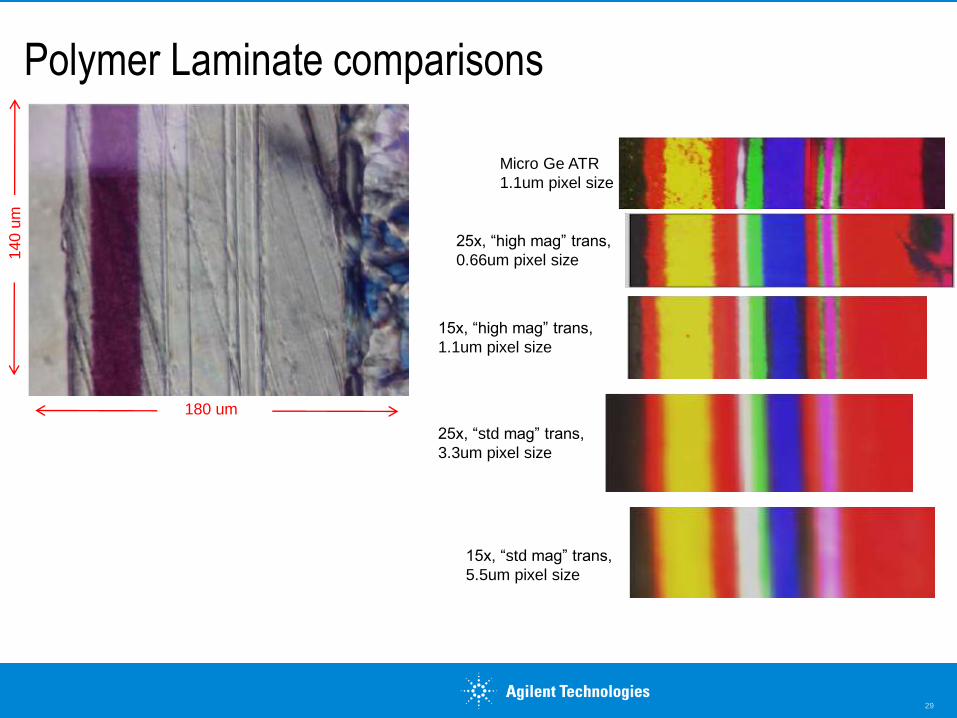
Polymer Laminate comparisons
29
Micro Ge ATR
1.1um pixel size
25x, “high mag” trans,
0.66um pixel size
25x, “std mag” trans,
3.3um pixel size
15x, “high mag” trans,
1.1um pixel size
15x, “std mag” trans,
5.5um pixel size
140 u
m
180 um
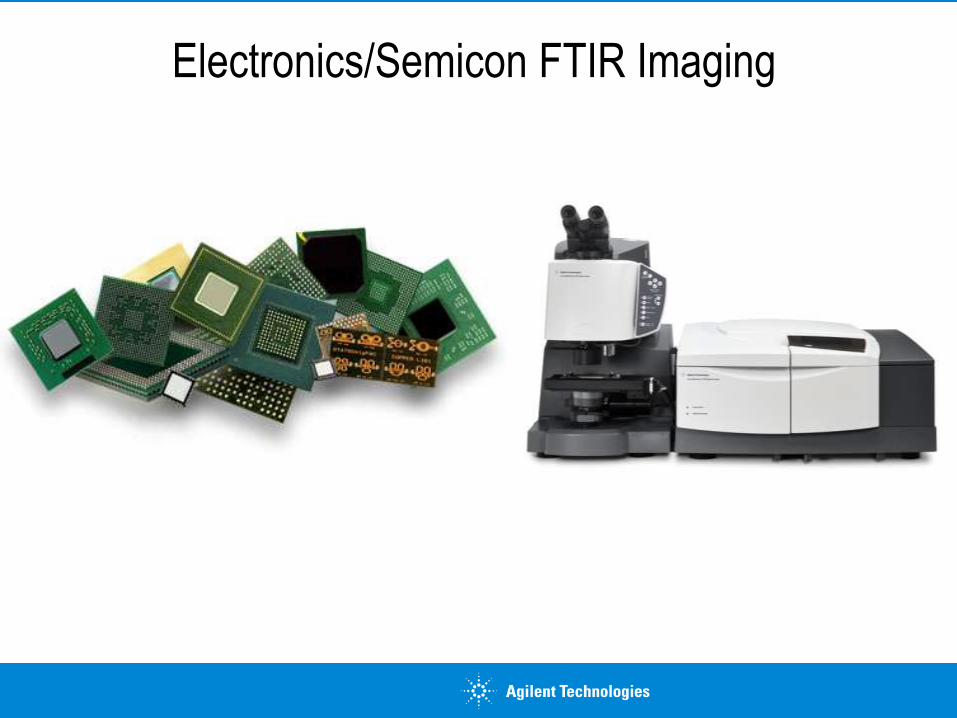
Electronics/Semicon FTIR Imaging
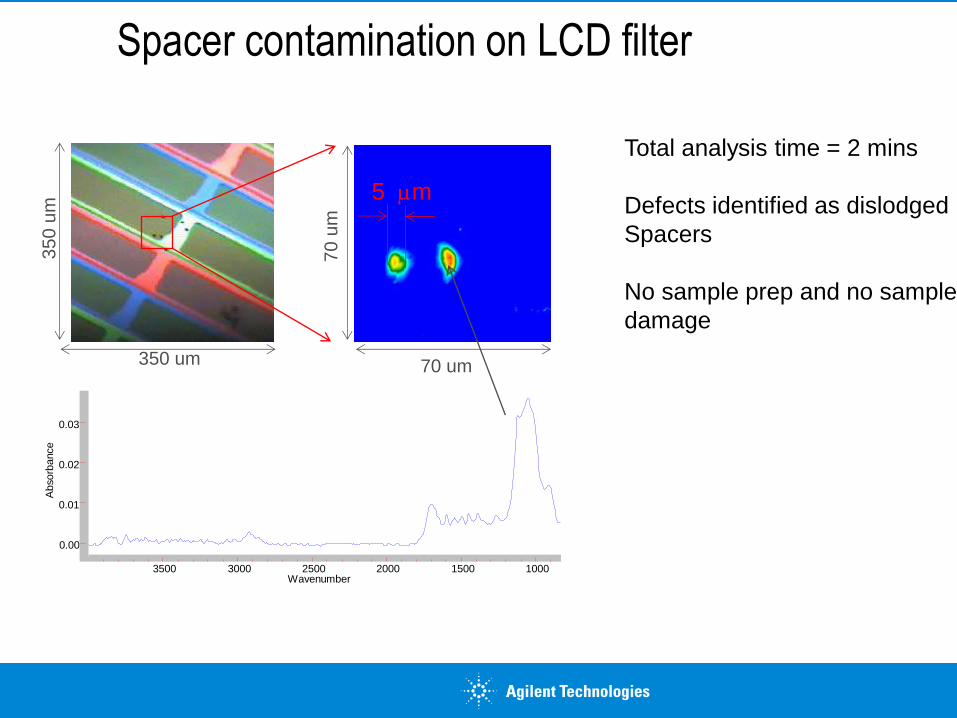
Spacer contamination on LCD filter
3500 3000 2500 2000 1500 1000
0.03
0.02
0.01
0.00
Wavenumber
Absorb
ance
350
um
350 um
70 u
m
70 um
5 mm
Total analysis time = 2 mins
Defects identified as dislodged
Spacers
No sample prep and no sample
damage
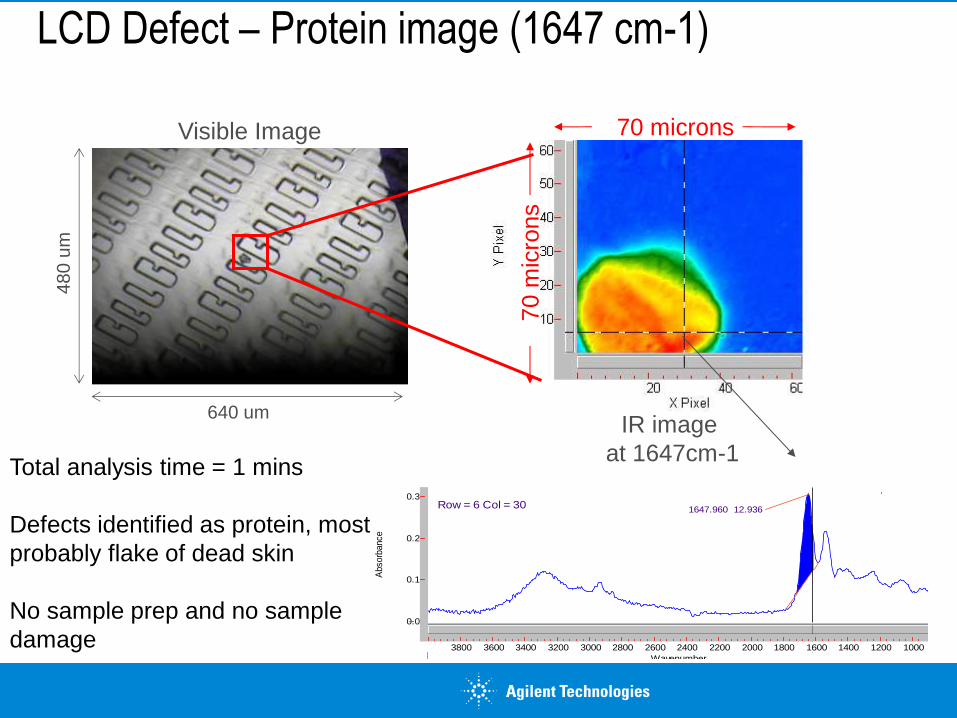
1647.960 12.936Row = 6 Col = 30
3800 3600 3400 3200 3000 2800 2600 2400 2200 2000 1800 1600 1400 1200 1000
0.3
0.2
0.1
0.0
Wavenumber
Absorb
ance
LCD Defect – Protein image (1647 cm-1)
70 microns
70 m
icro
ns
Visible Image
IR image
at 1647cm-1 Total analysis time = 1 mins
Defects identified as protein, most
probably flake of dead skin
No sample prep and no sample
damage
480
um
640 um
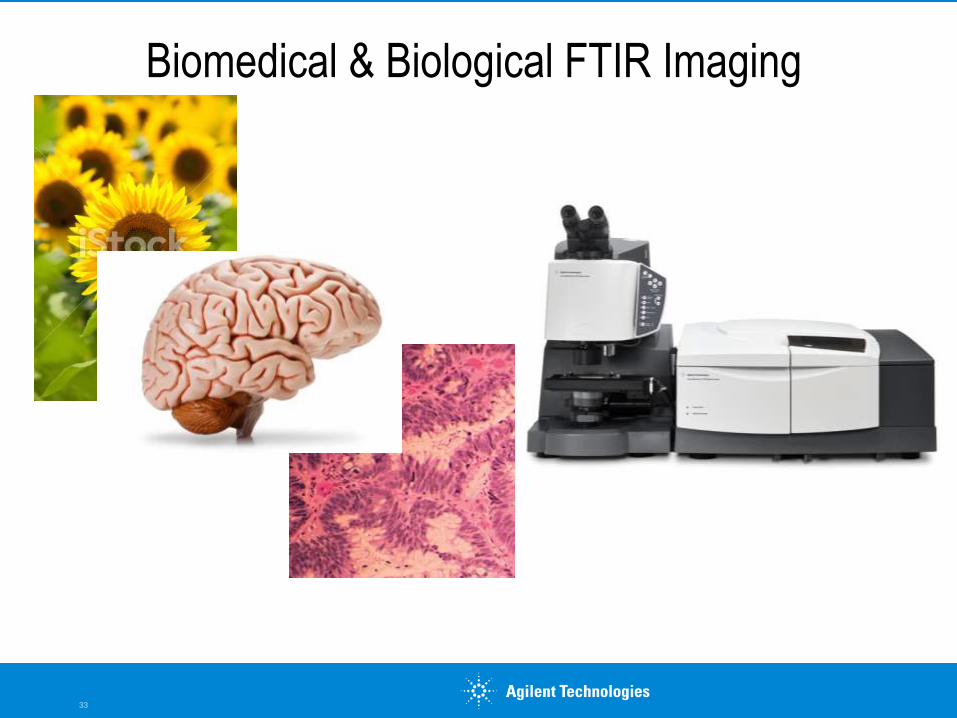
Biomedical & Biological FTIR Imaging
33
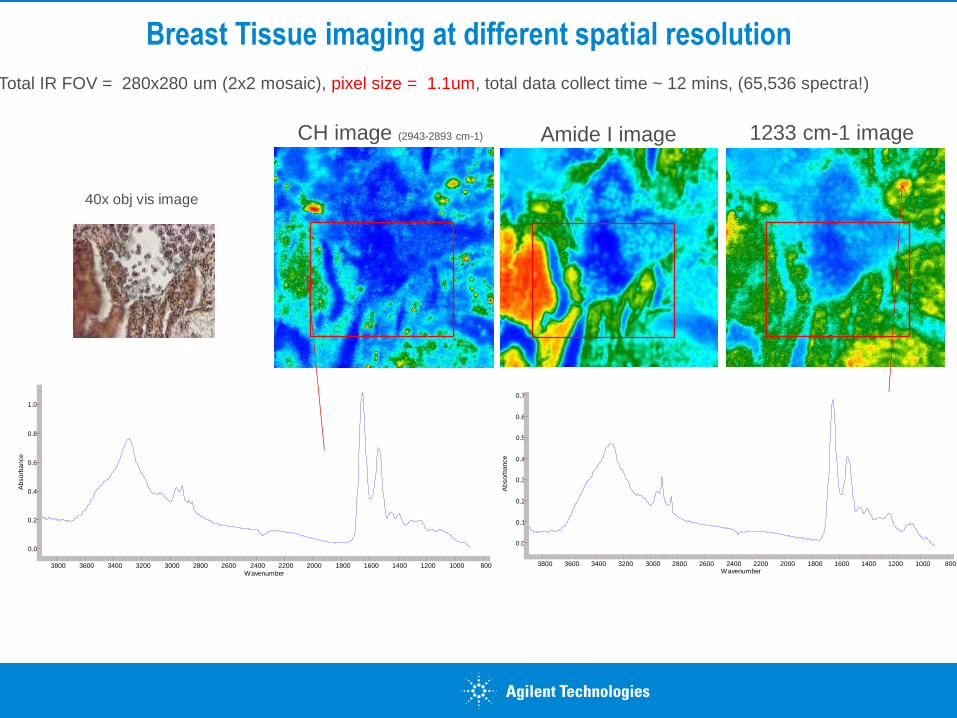
Breast Tissue imaging at different spatial resolution
Total IR FOV = 280x280 um (2x2 mosaic), pixel size = 1.1um, total data collect time ~ 12 mins, (65,536 spectra!)
Amide I image 1233 cm-1 image
40x obj vis image
CH image (2943-2893 cm-1)
3800 3600 3400 3200 3000 2800 2600 2400 2200 2000 1800 1600 1400 1200 1000 800
1.0
0.8
0.6
0.4
0.2
0.0
Wavenumber
Ab
so
rba
nce
3800 3600 3400 3200 3000 2800 2600 2400 2200 2000 1800 1600 1400 1200 1000 800
0.7
0.6
0.5
0.4
0.3
0.2
0.1
0.0
Wavenumber
Ab
so
rba
nce
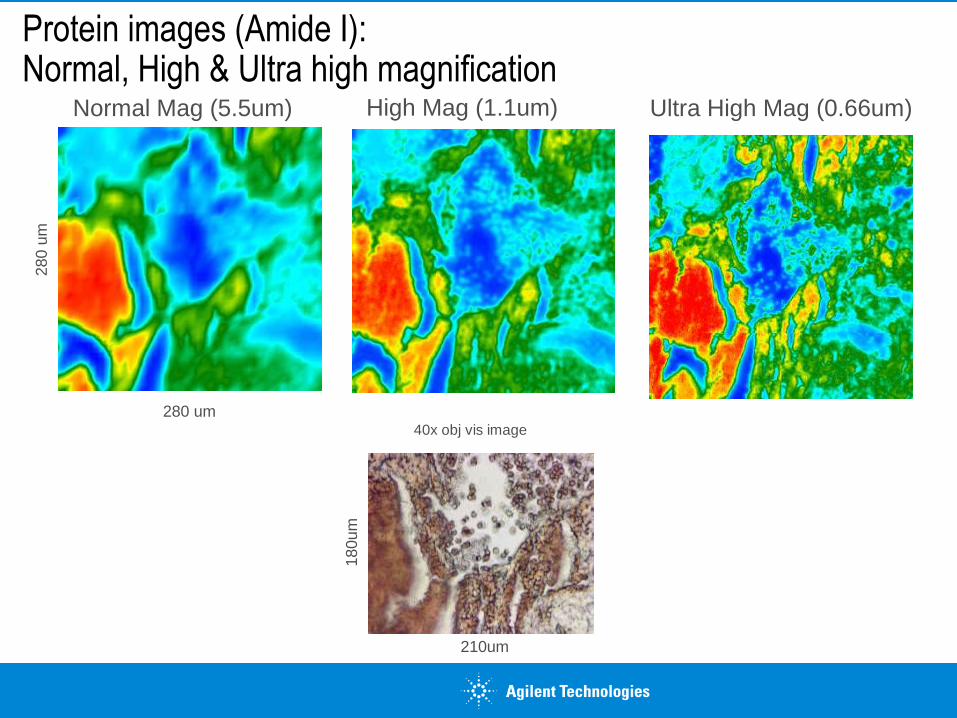
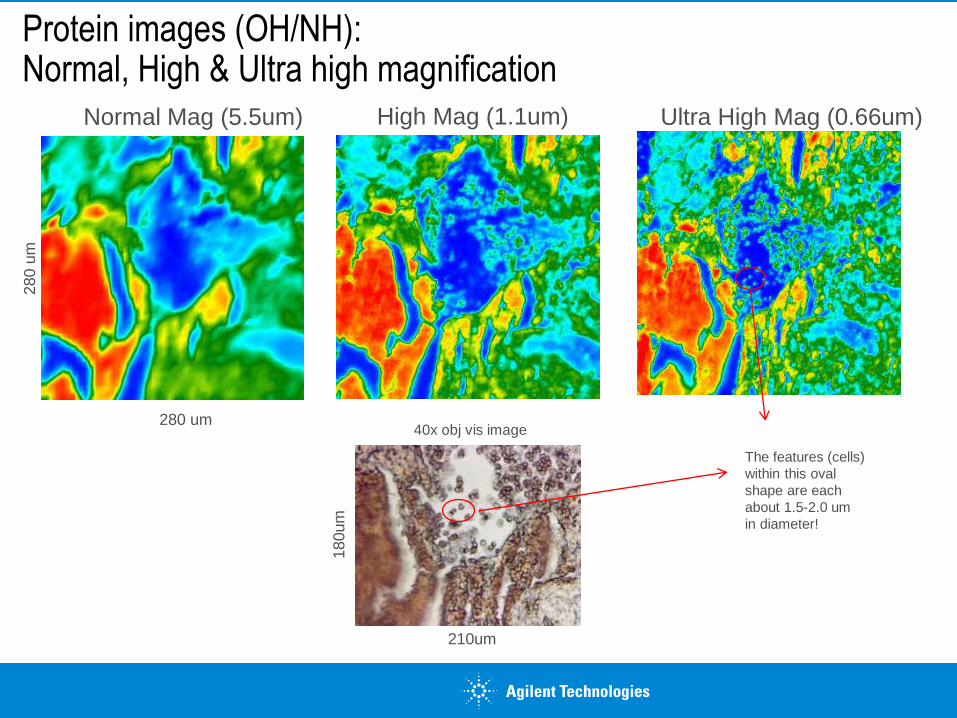
Protein images (Amide I): Normal, High & Ultra high magnification
280 u
m
280 um
Normal Mag (5.5um) High Mag (1.1um) Ultra High Mag (0.66um)
180um
210um
40x obj vis image
180um
210um
280 u
m
280 um
Normal Mag (5.5um) High Mag (1.1um)
The features (cells)
within this oval
shape are each
about 1.5-2.0 um
in diameter!
Ultra High Mag (0.66um)
Protein images (OH/NH): Normal, High & Ultra high magnification
40x obj vis image
Pharmaceutical FTIR Imaging
37
Row = 51 Col = 28
3500 3000 2500 2000 1500 1000
0.3
0.2
0.1
0.0
Wavenumber
Absorb
ance
Row = 43 Col = 59
3500 3000 2500 2000 1500 1000
0.3
0.2
0.1
0.0
Wavenumber
Absorb
ance
Row = 12 Col = 10
3500 3000 2500 2000 1500 1000
0.4
0.3
0.2
0.1
0.0
Wavenumber
Absorb
ance
Row = 29 Col = 19
3500 3000 2500 2000 1500 1000
0.20
0.15
0.10
0.05
Wavenumber
Absorb
ance
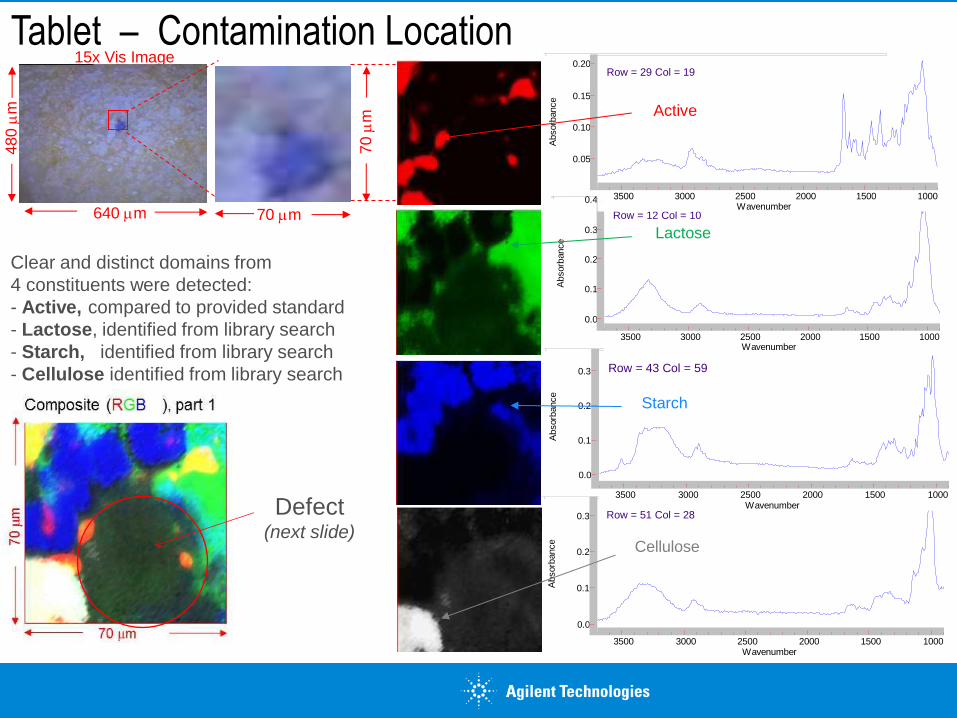
Tablet – Contamination Location 15x Vis Image
480 m
m
640 mm
70 m
m
70 mm
Clear and distinct domains from
4 constituents were detected:
- Active, compared to provided standard
- Lactose, identified from library search
- Starch, identified from library search
- Cellulose identified from library search
Active
Lactose
Starch
Cellulose
Defect (next slide)
Row = 10 Col = 26
3500 3000 2500 2000 1500 1000
0.20
0.15
0.10
0.05
Wavenumber
Absorb
ance
Row = 30 Col = 28
3500 3000 2500 2000 1500 1000
0.15
0.10
0.05
Wavenumber
Absorb
ance
15x Vis Image
480 m
m
640 mm
70 m
m
70 mm
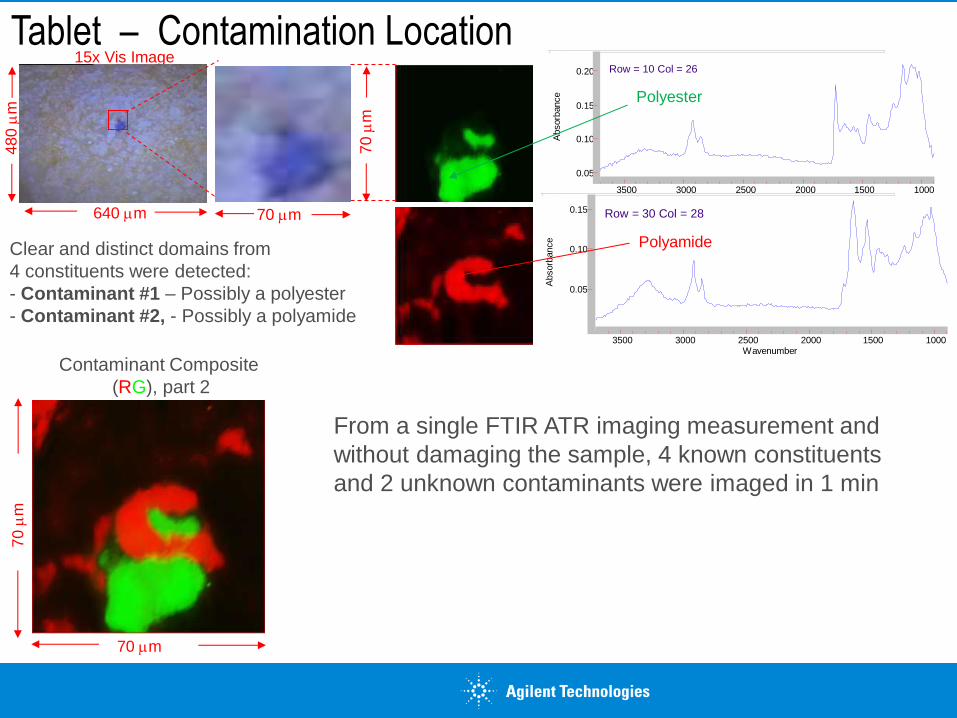
Clear and distinct domains from
4 constituents were detected:
- Contaminant #1 – Possibly a polyester
- Contaminant #2, - Possibly a polyamide
Tablet – Contamination Location 70 m
m
70 mm
Contaminant Composite
(RG), part 2
Polyamide
Polyester
From a single FTIR ATR imaging measurement and
without damaging the sample, 4 known constituents
and 2 unknown contaminants were imaged in 1 min
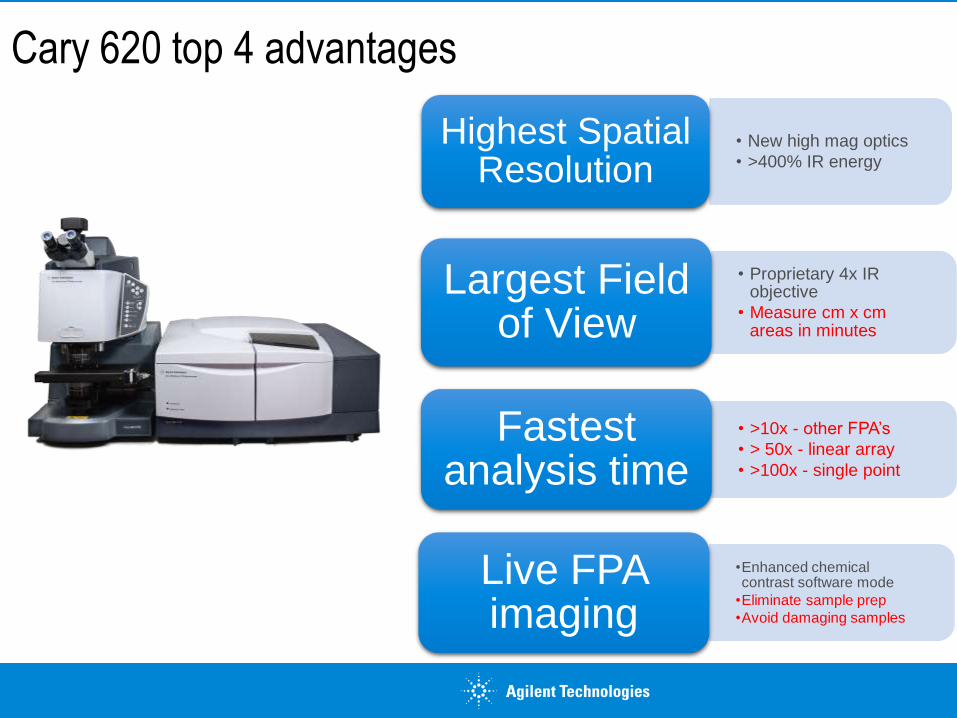
Cary 620 top 4 advantages
• New high mag optics
• >400% IR energy
Highest Spatial Resolution
• Proprietary 4x IR objective
• Measure cm x cm areas in minutes
Largest Field of View
• >10x - other FPA’s
• > 50x - linear array
• >100x - single point
Fastest analysis time
•Enhanced chemical contrast software mode
•Eliminate sample prep
•Avoid damaging samples
Live FPA imaging