ftf^iß/) ^--cAIM . JSl339f m Cotton Testing Service
27
ftf^iß/) // '»^•'A United States iilAJÜ) Department of ^-"-cA IM . JSl339f m ^^^ Agriculture Agricultural Marketing Service Agriculture Handbook Number 594 f J. Cotton Testing Service Tests Available, Equipment and Techniques, and Basis for Interpreting Results X T \ 1 r ^^ f '^ M: c/> -^.. -^ r- ' MT r^ M-..:,. -« 'c^^-'" M ^ r^ --•.OP' ^ Í- cO nC-T^ .^F *• - 'C -'' ^r OR. ;»- V ^ . P^r. 03 5.--
Transcript of ftf^iß/) ^--cAIM . JSl339f m Cotton Testing Service

ftf^iß/) //■'»^•'A United States iilAJÜ) Department of
^-"-cA IM . JSl339f
m ^^^ Agriculture
Agricultural Marketing Service
Agriculture Handbook Number 594
f J.
Cotton Testing Service Tests Available, Equipment and Techniques, and Basis for Interpreting Results
X
T
\ 1
r
^^ f '^ M: c/> -^.. -^ r- '
MT r^ M-..:,. -« 'c^^-'"
M ^ r^ --•.OP'
^ Í- cO nC-T^
.^F *• - ■'C -''
^r OR. ;»- V
^ . P^r. 03 5.--
Contents
Page Introduction 3 Selection of samples 3 Fiber tests and their evaluation 4
Cotton classification 4 Color 4 Nonlint content 8 High Volume Instrument trash 8 Array fiber length 9 Fibrograph fiber length 10 High Volume Instrument fiber length 10 Fiber strength 11 Micronaire fiber fineness and maturity 13 Causticaire fiber fineness and maturity 13 Nep content 14 Sugar content 14
Yarn processing tests 15 Manufacturing waste 15 Yarn strength 15 Yarn elongation 17 Yarn appearance 17 Uster nep and evenness 18 Spinning potential 18 Additional yarn 19
Chemical finishing tests 20 Other services 20 Appendix 21
Cotton Testing Service
Tests Available, Equipment and Techniques, and Basis for Interpreting Results
Prepared by:
U.S. Department of Agriculture Agricultural Marketing Service Cotton Division Washington, D.C. 20250
This publication supersedes Consumer and Marketing Service Publication No. 82 with the same title, issued May 1970.
Note: Mention of trade names in this publication is solely to provide specific information. It does not imply ap- proval nor constitute endorsement of products by the U.S. Department of Agriculture to the exclusion of others which may be suitable.
Washington, D.C.
March 1982

Introduction Selection of Samples
This publication describes the various cotton fiber and manufacturing tests offered to the cotton industry by the Cotton Division, Agricultural Marketing Service, U.S. Department of Agriculture. These tests are designed for use by cotton breeders, researchers, merchants, textile manufacturers, and others in the cotton industry vi/ho may require the service. They are provided to the public on a fee basis under authority of the Cotton Service Testing Amendment to the Cotton Statistics and Estimates Act of 1927 (7 U.S.C. 473d).
For detailed information about the services available and the current schedule of fees, write to:
The Clemson Cotton Laboratory Cotton Division, AMS, USDA Box 67 Clemson, SC 29631
Fiber and processing tests are based on very small test samples. It is therefore extremely important that the samples submitted be selected with care so as to be as representative as possible. Advice on the selection and preparation of test samples can be obtained from the Clemson Laboratory.
Most fiber tests can be made using as little as 8 grams {Vi oz) of cotton, although some tests require more than 100 grams (4 oz). The sample used for official classifica- tion should be at least 175 grams (6 oz) in size.
For spinning tests, at least 3 kilograms (7 lbs) are usually needed for carded tests and up to 5 kilograms (11 lbs) for combed tests.
A very small amount of cotton is needed for test speci- mens on most fiber test instruments. It is essential that these test specimens be as representative as possible. In order to assure this, the technician takes portions of cot- ton at random from different parts of the sample pro- vided and processes them through a fiber blender (fig. 1). The blender gently mixes the individual fibers into a practically homogeneous mass. This procedure helps assure that test specimens taken from the blended sam- ple will be fully representative.
Figure 1. - Laboratory blender.
Fiber Tests and and Their Evaiuation
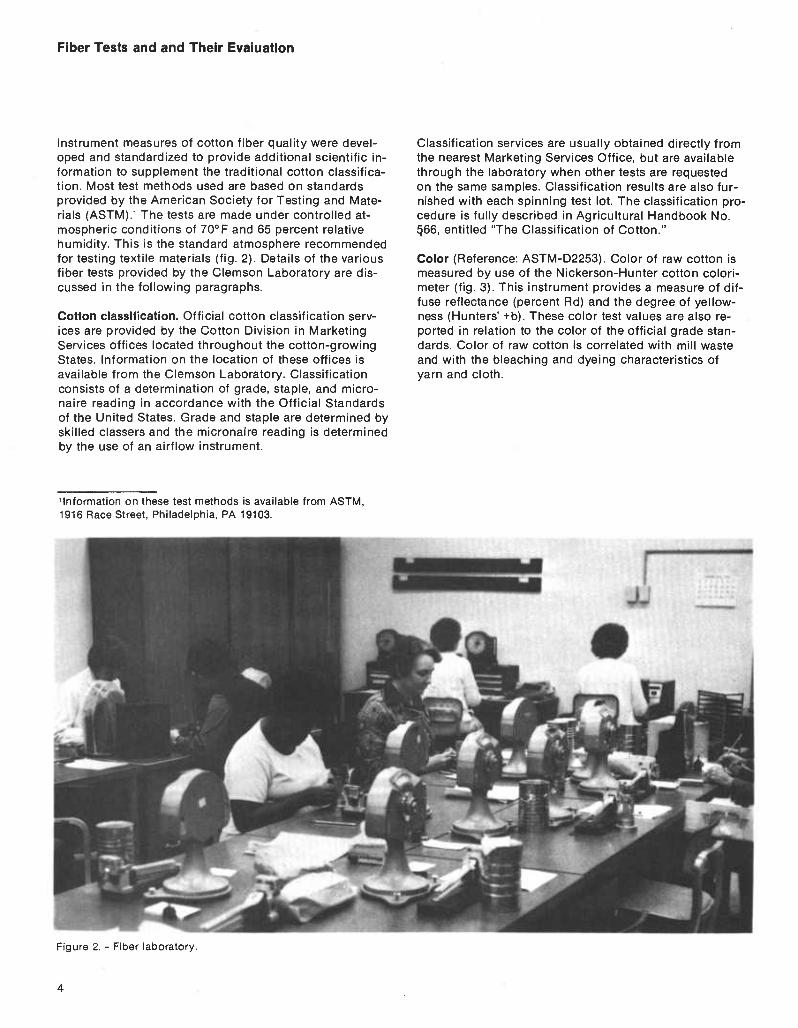
Instrument measures of cotton fiber quality were devel- oped and standardized to provide additional scientific in- formation to supplement the traditional cotton classifica- tion. Most test methods used are based on standards provided by the American Society for Testing and Mate- rials (ASTM)J The tests are made under controlled at- mospheric conditions of 70° F and 65 percent relative humidity. This is the standard atmosphere recommended for testing textile materials (fig. 2). Details of the various fiber tests provided by the Clemson Laboratory are dis- cussed in the following paragraphs.
Cotton classification. Official cotton classification serv- ices are provided by the Cotton Division in Marketing Services offices located throughout the cotton-growing States. Information on the location of these offices is available from the Clemson Laboratory. Classification consists of a determination of grade, staple, and micro- naire reading in accordance with the Official Standards of the United States. Grade and staple are determined by skilled classers and the micronaire reading is determined by the use of an airflow instrument.
Classification services are usually obtained directly from the nearest Marketing Services Office, but are available through the laboratory when other tests are requested on the same samples. Classification results are also fur- nished with each spinning test lot. The classification pro- cedure is fully described in Agricultural Handbook No. 566, entitled "The Classification of Cotton."
Coior (Reference: ASTM-D2253). Color of raw cotton is measured by use of the Nickerson-Hunter cotton colori- meter (fig. 3). This instrument provides a measure of dif- fuse reflectance (percent Rd) and the degree of yellow- ness (Hunters' +b). These color test values are also re- ported in relation to the color of the official grade stan- dards. Color of raw cotton is correlated with mill waste and with the bleaching and dyeing characteristics of yarn and cloth.
'Information on these test methods is available from ASTM, 1916 Race Street, Philadelphia, PA 19103.
Figure 2. - Fiber laboratory.

Special studies and practical experience have indicated the following reproducibility of these tests:
Color test Significant difference
Reflectance (Percent Rd) Yellowness (+b units)
0.6 0.3
Standard calibration tiles and color-check sample boxes for use in adjusting color instruments are also available from the Clemson Laboratory.
Figure 3. - Nickerson-Hunter cotton colorimeter.
Bright high-grade cottons have high reflectance (Rd) values while dark cottons have low values. Increasing +b readings indicate an increasing degree of yellowness. Color values for specific samples may be compared with the color of the official grade standards by plotting the coordinates on a special diagram (fig. 4), or they may be expressed in terms of the codes designed especially for cotton as shown on the diagram. The grade color dia- gram shown in figure 5 is used for American Pima cotton.
Color tests require a sample weighing about 50 grams that is sufficient to cover a surface of 100 by 150 mm (4 by 6 inches) and thick enough to be opaque.

Color Meter Block Diagram
4 S • 7 • ff
j ) o Ort "*°* ' *•** Revised H-o-oO COTTON DIVISION
ff 10 11 12 IS 14 lg le \¡ |iiM|'iiii|im|ii'ifiiii|iiinMii|iiii¡ lililí
^ \
COLOR DIAGRAM for
NICKER90N-HUNTER COTTON COLORIMETER ' (Spinlab Modal)
UNIVBMAL tTAMDAVM rCNI ORAOS
or AISmCAM UFI.AMD COTTON
in Effect 1963
40 ^iii\^ii^\im\^^iiinii\nïi\nl\\îiii\iiiiiinili^nliiÈilii,iliin MUNTR»*t ^bt INCffCAtlNa DEQUCC OF YCLLOWNESS FOt 10 VU
Figure 4. - Color diagram for American upland cotton.

FORM CN-84 (2-15-68)
10 i I M I 111111 N 1111 n I M 111111 [-|
80
USDA-C&MS COTTON DIVISION
X O
70
Ü z <
oc
60
< o
50
11 12 13 14 15 16 17 18 111111 M I i I M 111 M 11 m [ I M I n i I 1 [ i m
COLOR DIAGRAM for
NICKERSON-HUNTER COTTON COLORIMETER (Spinlab Model)
Based on
STANDARDS for
Ame/ixcan P^cma Cotton
Effective August 1,1957
4011 I M I i 1 I I I M I 11 M i I I I N I 1 11 M l.i I I I I I i t I I i 1 i I I I N I 1 i I 1 I I M M I I n I I 1 I i I HUNTER'S +b J INCREASING I DEGREE OF YELLOWNESS FOR 10 YR »
Figure 5. - Color diagram for American Pima cotton.
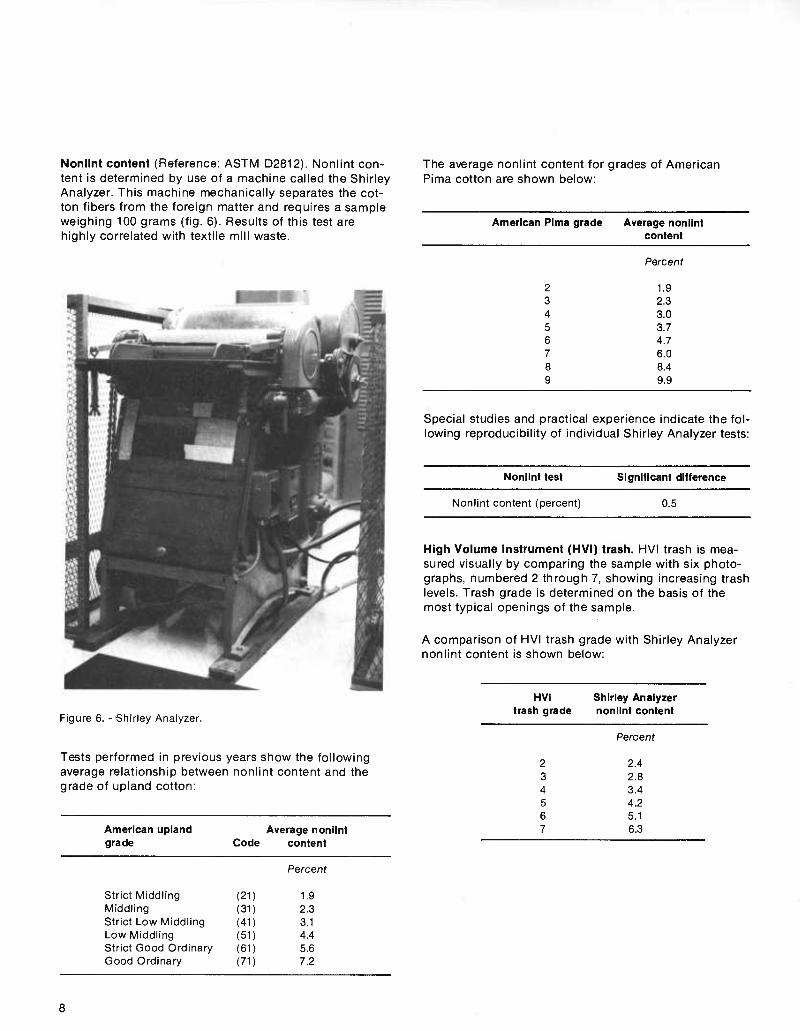
Nonlint content (Reference: ASTM D2812). Nonlint con- tent is determined by use of a machine called the Shirley Analyzer. This machine mechanically separates the cot- ton fibers from the foreign matter and requires a sample weighing 100 grams (fig. 6). Results of this test are highly correlated with textile mill waste.
The average nonlint content for grades of American Pima cotton are shown below:
American PIma grade Average nonlint content
Percent
2 3 4 5 6 7 8 9
1.9 2.3 3.0 3.7 4.7 6.0 8.4 9.9
Special studies and practical experience indicate the fol- lowing reproducibility of individual Shirley Analyzer tests:
Nonlint test Significant difference
Nonlint content (percent) 0.5
High Volume Instrument (HVI) trash. HVI trash is mea- sured visually by comparing the sample with six photo- graphs, numbered 2 through 7, showing increasing trash levels. Trash grade is determined on the basis of the most typical openings of the sample.
A comparison of HVI trash grade with Shirley Analyzer nonlint content is shown below:
Figure 6. -Shirley Analyzer.
Tests performed in previous years show the following average relationship between nonlint content and the grade of upland cotton:
American upland Average nonlint grade Code content
Percent
Strict Middling (21) 1.9 Middling (31) 2.3 Strict Low Middling (41) 3.1 Low Middling (51) 4.4 Strict Good Ordinary (61) 5.6 Good Ordinary (71) 7.2
HVI Shirley Analyzer trash grade nonlint content
Percent
2 2.4 3 2.8 4 3.4 5 4.2 6 5.1 7 6.3
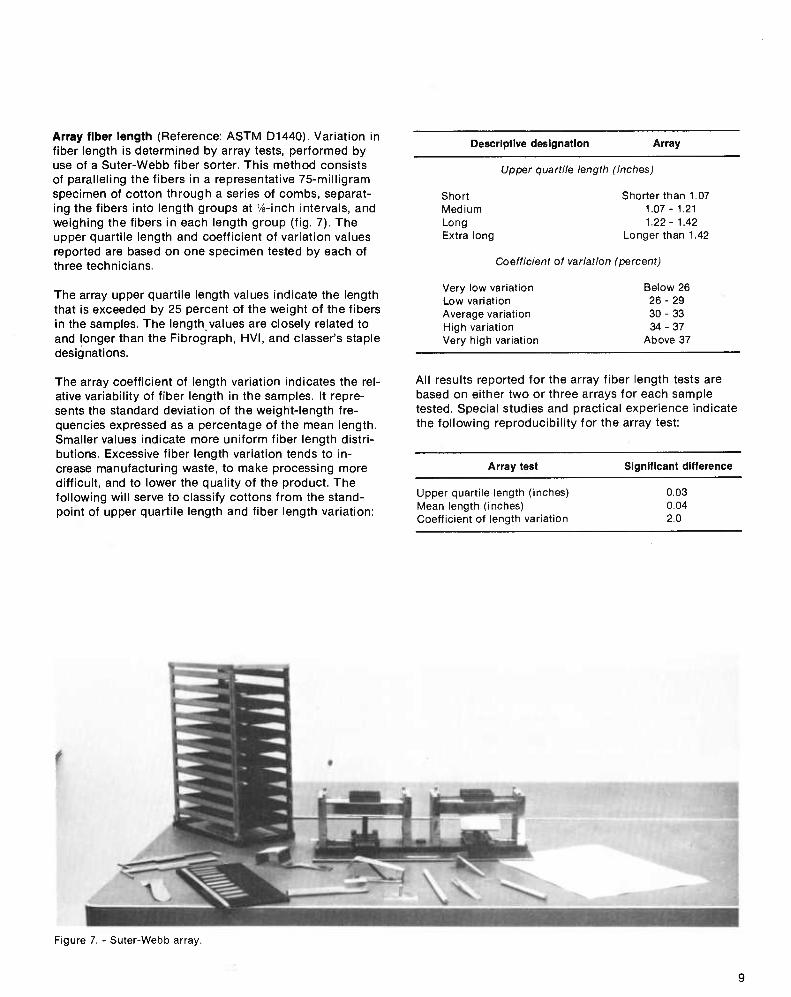
Array fiber length (Reference: ASTM D1440). Variation in fiber length is deternnined by array tests, performed by use of a Suter-Webb fiber sorter. This method consists of paralleling the fibers in a representative 75-milligram specimen of cotton through a series of combs, separat- ing the fibers Into length groups at Ys-inch intervals, and weighing the fibers in each length group (fig. 7). The upper quartile length and coefficient of variation values reported are based on one specimen tested by each of three technicians.
The array upper quartile length values indicate the length that is exceeded by 25 percent of the weight of the fibers In the samples. The length values are closely related to and longer than the Fibrograph, HVI, and classer's staple designations.
The array coefficient of length variation indicates the rel- ative variability of fiber length in the samples. It repre- sents the standard deviation of the weight-length fre- quencies expressed as a percentage of the mean length. Smaller values indicate more uniform fiber length distri- butions. Excessive fiber length variation tends to in- crease manufacturing waste, to make processing more difficult, and to lower the quality of the product. The following will serve to classify cottons from the stand- point of upper quartile length and fiber length variation:
Descriptive designation Array
Upper quartile length (inches)
Short Shorter than 1.07 Medium 1.07 -1.21 Long 1.22 -1.42 Extra long Longer than 1.42
Coefficient of variation (percent)
Very low variation Below 26 Low variation 26- 29 Average variation 30- 33 High variation 34- 37 Very high variation Above 37
All results reported for the array fiber length tests are based on either two or three arrays for each sample tested. Special studies and practical experience indicate the following reproducibility for the array test:
Array test Significant difference
Upper quartile length (inches) Mean length (inches) Coefficient of length variation
0.03 0.04 2.0
f
Figure 7. - Suter-Webb array.
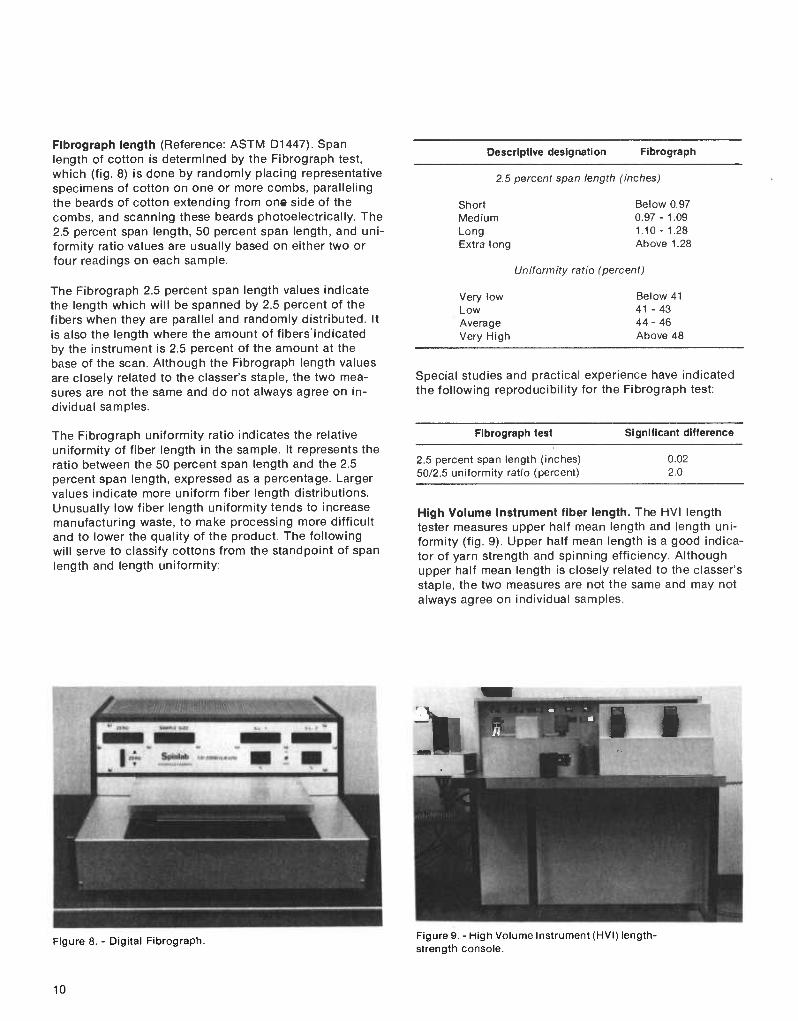
Fibrograph length (Reference: ASTM D1447). Span length of cotton is determined by tine Fibrograph test, which (fig. 8) is done by randomly placing representative specimens of cotton on one or more combs, paralleling the beards of cotton extending from one side of the combs, and scanning these beards photoelectrically. The 2.5 percent span length, 50 percent span length, and uni- formity ratio values are usually based on either two or four readings on each sample.
The Fibrograph 2.5 percent span length values indicate the length which will be spanned by 2.5 percent of the fibers when they are parallel and randomly distributed. It is also the length where the amount of fibersindicated by the instrument is 2.5 percent of the amount at the base of the scan. Although the Fibrograph length values are closely related to the classer's staple, the two mea- sures are not the same and do not always agree on in- dividual samples.
The Fibrograph uniformity ratio indicates the relative uniformity of fiber length in the sample. It represents the ratio between the 50 percent span length and the 2.5 percent span length, expressed as a percentage. Larger values indicate more uniform fiber length distributions. Unusually low fiber length uniformity tends to increase manufacturing waste, to make processing more difficult and to lower the quality of the product. The following will serve to classify cottons from the standpoint of span length and length uniformity:
Descriptive designation Fibrograph
2.5 percent span length (inches)
Short Medium Long Extra long
Below 0.97 0.97- 1.09 1.10- 1.28 Above 1.28
Uniformity ratio (percent)
Very low/ Low Average Very High
Below 41 41 - 43 44-46 Above 48
Special studies and practical experience have indicated the following reproducibility for the Fibrograph test:
Fibrograpli test Significant difference
2.5 percent span length (inches) 50/2.5 uniformity ratio (percent)
0.02 2.0
High Volume Instrument fiber length. The HVI length tester measures upper half mean length and length uni- formity (fig. 9). Upper half mean length is a good indica- tor of yarn strength and spinning efficiency. Although upper half mean length is closely related to the classer's staple, the two measures are not the same and may not always agree on individual samples.
X 'WEM
Figure 8. - Digital Fibrograph. Figure 9. - High Volume Instrument (HVI) length- strength console.
10
A comparison of the HVI length values and the staple standards is shown below:
HVI upper Staple HVI upper Staple half mean half mean
Inches "32nds" Inches "32nds"
0.76 & shorter 24 1.03- 1.06 34 .77 - .81 26 1.07- 1.10 35 .82 - .85 28 1.11 - 1.14 36 .86 - .88 29 1.15- 1.18 37 .89- .92 30 1.19- 1.22 38 .93 - .96 31 1.23- 1.25 39 .97 - .99 32 1.26- 1.28 40
1.00- 1.02 33 1.29 & longer 41
Length uniformity Is a measure of the degree of uniform- ity of fibers in a sample. It is expressed as an index of the mean/upper-half-mean length ratio. Fiber uniformity is related to spinning efficiency, yarn uniformity, and yarn strength.
The terms listed below are helpful in explaining the results:
Descriptive designation HVI length uniformity
Very high High Average Low Very low
Above 85 83 - 85 80-82 77 - 79 Below 77
Special studies and practical experience have indicated the following reproducibility for the HVI length and length uniformity test results:'
HVI test Significant difference
Upper half mean length (inches) Length uniformity index (percent)
o.oa 2.0
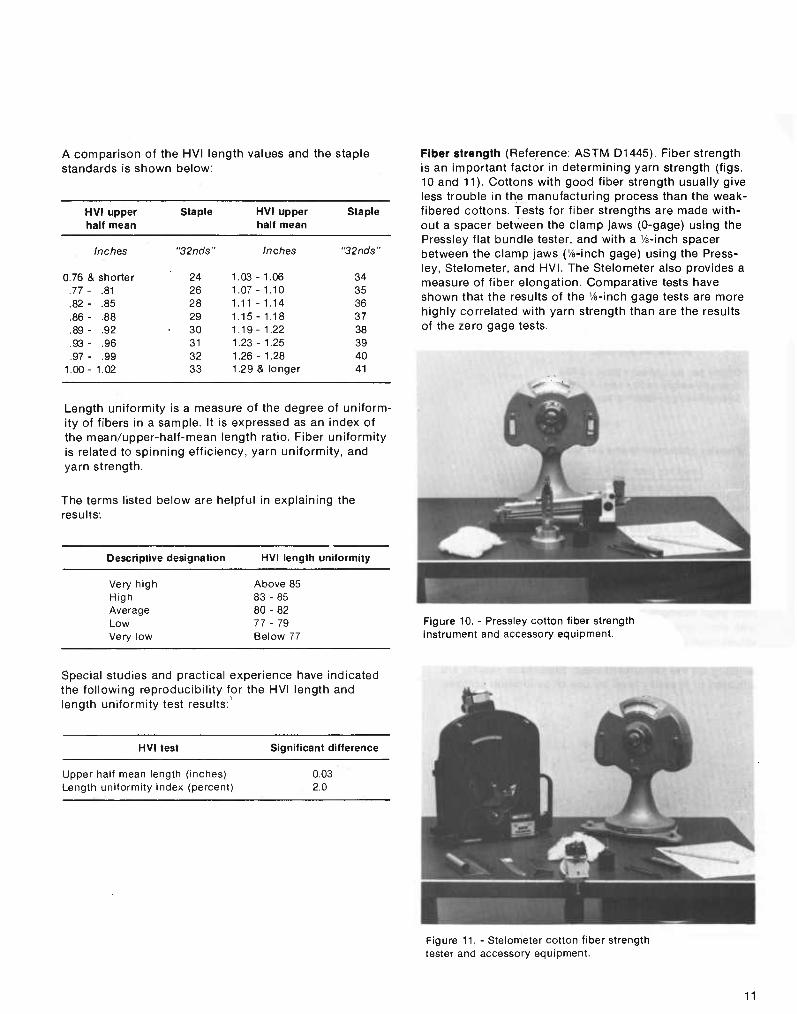
Fiber strength (Reference: ASTM D1445). Fiber strength is an important factor in determining yarn strength (figs. 10 and 11). Cottons with good fiber strength usually give less trouble in the manufacturing process than the weak- fibered cottons. Tests for fiber strengths are made with- out a spacer between the clamp jaws (0-gage) using the Pressley flat bundle tester, and with a Va-inch spacer between the clamp jaws ('/s-inch gage) using the Press- ley, Stelometer, and HVI. The Stelometer also provides a measure of fiber elongation, Comparative tests have shown that the results of the Ve-inch gage tests are more highly correlated with yarn strength than are the results of the zero gage tests.
Figure 10. - Pressley cotton fiber strength instrument and accessory equipment.
Figure 11. - Stelometer cotton fiber strength tester and accessory equipment.
11

The results for the Pressley zero gage test are reported in terms of thousand pounds per square inch, as calcu- lated by the use of formula 1. These results may be con- verted to other methods of expressing fiber strength by use of formulas 2, 3, and 4.
Formulas
0-gage
1. Thousand pounds per square inch (Mpsi) =
breaking load (lb) x 10.81
bundle weight (mg)
2. Grams per tax (g/tex) = Mspi x 0.496 3. Strength-weight-ratio = Mpsi -^ 10.81 4. Strength-weight-ratio = g/tex ^ 5.36
Vs-inch gage
5. Pressley instrument-grams per tex (g/tex) =
breaking load (lb) x 6.80
bundle weight (mg)
6. Stelometer instrument-grams per tex (g/tex) =
breaking load (kg) xi5
bundle weight (mg)
A tex unit is equal to the weight in grams of 1,000 meters of the material. There is a correlation between the Vs- inch gage strength test results and fiber length. Cotton with short lengths tends to have lower average strength values than long staple cottons. Results for Vs-inch gage tests are calculated by the use of formula 5 or 6, de- pending on the instrument used. Stelometer results are adjusted to Pressley level by use of calibration cottons.
The following terms may be applied to fiber strength:
Staple length group Pressley Pressley HVI and descriptive zero gage Vs-inch gage Vs-inch gage
designation strength strength strength
Mpsi g/tex g/tex
Short staple (staple 31 and shorter) Very low 74- 78 17-18 18-19 Low 79- 83 19-20 20-21 Average 84- 88 21-22 22-23 High 89- 93 23-24 24-25 Very high 94- 98 25-26 26-27
Medium staple (staples 32-35) Very low 70- 76 Low 77- 83 Average 84- 90 High 91- 97 Very high 98-104
Long staple (staples 36-40) Very low 71 - 77 Low 78- 84 Average 85- 91 High 92- 98 Very high 99-105
16-18 19-21 22-24 25-27 28-30
18-20 21 -23 24-26 27-29 30-32
17-19 20-22 23-25 26-28 29-31
18-20 21-23 24-26 27-29 30-32
Extra long staple (staples 41 and longer) Very low , 93-96 27-29 Low 97-100 30-32 Average 101-104 33-35 High 105-108 36-38 Very high 109-112 39-41
Fiber elongation results can be obtained in connection with Vs-inch gage fiber strength tests by using a Stelome- ter instrument (fig. 11). The following designations for fiber elongation will aid in the comparison between cottons:
Descriptive designation Fiber elongation (percent)
Very low Low Average High Very high
4.9 & below 5.0-5.8 5.9-6.7 6.8-7.6 7.7 & above
12

All results reported for fiber strength tests are based on two, four, or six determinations on each sample. Special studies and practical experience have indicated the fol- lowing reproducibility for these tests:
Fiber strength and elongation tests Significant difference
Pressley zero gage strength - Mpsi Pressley and Stelometer ys-inch gage
strength - g/tex HVI ys-inch strength - g/tex Stelometer elongation - percent
3.0
1.0 2.0 2.0
Micronaire fiber fineness and maturity (Reference: ASTM D1448). Fiber fineness and maturity, in combination, are determined by the micronaire test. This test measures the resistance of a plug of cotton to air flow (fig. 12). A representative standard weight of cotton fibers is placed in the instrument specimen holder and compressed to a fixed volume. Air at a controlled pressure is forced through the specimen and the amount of flow is indi- cated by a direct reading scale. Readings obtained are relative measures of either the weight per unit length, or the cross-sectional size of the fibers. Because the instru- ment measures may differ from the actual weight per inch, depending upon the fiber characteristics of the sample, the results are reported in terms of "micronaire reading" instead of micrograms per inch. These readings are taken from the curvilinear scale adopted in 1950 and now in international use. Fiber fineness contributes to yarn strength, particularly when fine numbers are spun, but it also tends to increase neppiness and to require a reduced rate of processing.
Fiber maturity, also an important factor affecting the ap- pearance of yarns and fabrics, is a desirable characteris- tic from the standpoint of low picker and card waste. Im- mature fibers are susceptible to the formation of neps, and contribute to lower yarn-appearance grades. The desirable micronaire reading, therefore, depends on the specific end product or use of the cotton.
Several instruments, including the Fibronaire, Micronaire, llC-Shirley fineness/maturity tester, and Port-Ar, may be used for these tests. All instruments now use the same scale and report the results as "micronaire reading." This reading is now a part of the official standards for cotton classification.
Causticaire fiber fineness and maturity (Reference: ASTM D2480). The maturity index and linear density of loose cotton fibers are determined by measuring the resistance of a plug of cotton fibers to airflow, before and after treating the fibers with a solution of sodium hydroxide (NaOH). The causticaire treatment swells the fibers causing them to become cylindrical. The ratio between the measurements on the untreated specimen and the treated specimen provides a relative measure of maturity. This maturity value reflects the degree of cell- wall development throughout the entire length of the fibers. The fineness, or weight per inch, is calculated from a combination of the measurement of the treated specimen and the maturity index of the specimen tested. These causticaire fineness values approximate very closely the actual weight per inch of the fiber for all species of cotton and for all ranges of maturity. These test results are calculated from the two air-flow readings by applying formula 1 for maturity and formula 2 for fineness:
Formulai. Ml = UT/Tx100 Formula 2. F = 0.00541 + (0.00075 x T^) - (0.02000 x Ml)
Where: Ml = Causticaire maturity index in percent UT= Causticaire reading on untreated
specimen T = Causticaire reading on treated specimen F = Causticaire fineness in micrograms per
inch
Figure 12. - Fibronaire instrument.
13

Causticaire fineness results for American upland cottons are closely approximated by micronaire readings and the same general descriptive terms may be applied to both values. For causticaire maturity, the following will aid in the comparison between cottons:
Descriptive designation Causticaire maturity index
Very low Low Average High Very high
Below 72 72-75 76-79 80-83
Above 83
All results for fineness and maturity tests are based on either one or two determinations per sample. Special studies and practical experience have indicated the fol- lowing reproducibility for the fineness and maturity test:
Figure 13. - Raw cotton nep test machine.
Fineness and maturity test Significant difference
Air-flow micronaire reading Causticaire micrograms per inch Causticaire maturity index (percent)
0.2 0.2 2.0
Nep content. A nep is one or more fibers occurring in a tangled and unorganized mass. Cotton neps are created by the fibers becoming tangled during the harvesting, ginning, and processing operations. Cottons differ in their susceptibility to the formation of neps because of varietal and environmental factors. The occurrence of neps in appreciable numbers is undesirable. They may be a source of trouble in manufacturing and finishing, and detract from appearance in yarn and fabric.
Sugar content (potassium ferricyanide testing method). This test determines the sugar content as based on a quantitative analysis of reducing substances (sugars) on cotton fibers. High sugar content in cotton can be caused by fiber immaturity, insect secretions, or excessive amounts of natural sugars in mature cotton. Cottons with sugar contents higher than 0.3 percent may cause textile processing problems.
For this test a 3-gram sample is mechanically blended. This blended sample is then processed into a thin web using special equipment developed for this purpose (fig. 13). The neps in ten 4- by 9-inch specimens of the web are counted by each of two technicians to provide the number of neps per 360 square inches of web. The re- sults are then converted to the number of neps per 100 square Inches of web.
This test is used in research to study the effects of cot- ton ginning and cleaning equipment. The reproducibility of the nep test is shown below:
Nep test Significant difference
Neps per 100 square inches of web
3.0
14
Yarn Processing Tests
Small-scale spinning tests are performed to provide indi- cations of the processing behavior of cotton. The per- centage of picker and card waste is related to mill turn- out. Low percentages of waste indicate high mill turnout. Yarn strength, yarn appearance, yarn neps, color of bleached cotton, and color of dyed cotton as measured in these tests are related to similar quality measures of the mill product. The spinning potential test provides a measure of spinning end-breakage, and is directly related to spinning behavior in the mill. High spinning potential (SPY) yarn numbers indicate low end-breakage or good spinning in the mill.
Manufacturing waste reported for a sample of cotton is important because excessive waste increases the cost of cotton products. The percentage of waste extracted by the picking and carding processes in performing a spin- ning test provides a measure of manufacturing waste. The rate at which the cotton is carded affects the picker and card waste values, because the more thorough card- ing action obtained when the carding rate is decreased extracts a larger quantity of waste. The longer staple cottons are generally carded at a lower rate than the shorter staple cottons in order to obtain optimum yarn quality. Tests performed in recent years show the follow- ing average relationship of picker and card waste to grade:
Average picker and Grade card waste
American upland Code Percent
Strict Middling (21) 5.2 Middling (31) 5.5 Strict Low Middling (41) 6.0 Low Middling (51) 6.9 Strict Good Ordinary (61) 7.7 Good Ordinary (71) 8.8
Average picker and Grade card waste
American Pi m a Percent
2 6.4 3 6.7 4 7.4 5 8.0 6 8.9 7 10.1 8 12.3 9 12.9
Special studies and practical experience have indicated the following reproducibility for the picker and card waste test:
Test Significant difference
Picker and card waste (percent) 1.0
The percentage of waste removed by the comber is re- ported in addition to the picker and card waste for cot- tons processed into combed yarn. The shorter staple cottons are processed through the comber with a closer setting than for the larger staple cottons because smaller comber waste percentages are usually extracted from this cotton in commercial practice.
Yarn strength (Reference: ASTM D1578). This is perhaps the most important and reliable measure of yarn quality (fig. 14). Yarn strength not only determines the range of the usefulness of a given cotton, but is also an indication of spinning and weaving performance. The yarn strength test is performed on 120 yard skeins (80 turns on a 1.5 yard reel). Results are based on the average of 25 skeins for each yarn number. Yarn strength is reported in terms of skein strength since studies have shown that such strength values are more closely related to fabric strength, as well as to fiber properties, than is single strand yarn strength. Skein strength data for the two numbers spun are reported for each test lot. Length, strength, and fineness influence yarn strength more than other fiber properties.
15

Figure 14. - Skein strength tester.
16

The following terms may be of help in determining the relative level of yarn strength:
Kind of yarn, staple length group,
and description
Carded yams Short staple group:
Low Average High
Medium staple group: Low Average High
Long staple group: Low Average High
Combed yarns Long staple group:
Low Average High
Extra long staple group: Low Average High
Yarn skein strength In pounds for the
specified yarn numbers
8s 22s 262-282 82- 90 283-303 91- 99 304-324 100-108
22s 50s 88-100 26- 32
101-113 33- 39 114-120 40- 46
22s 50s 89-105 26- 34
106-122 35- 43 123-139 44- 52
22s 50s 110-126 35- 43 127-143 44- 52 144-160 53- 61
50s 80s 61- 63 31- 33 64- 66 34- 36 67- 69 37- 39
Special studies and practical experience have indicated the following reproducibility for the yarn skein strength test:
Kind of yarn, staple length group,
and description
Yarn elongation in percent for the
specified yarn numbers
Carded yarns Short staple group:
Low Average High
Medium staple group: Low Average High
Long staple group: Low Average High
Combed yarns Long staple group:
Low Average High
Extra long staple group: Low Average High
8s 22s 6.3-6.9 5.2-5.8 7.0-7.6 5.9-6.5 7.7-8.3 6.6-7.2
22s 50s 5.0-5.6 3.4-4.0 5.7-6.3 4.1 -4.7 6.4-7.0 4.8-5.4
22s 50s 4.7-5.3 3.4-4.0 5.4-6.0 4.1-4.7 6.1-6.7 4.8-5.4
22s 50s 5.6-6.0 4.2-4.6 6.1-6.5 4.7-5.1 6.6-7.0 5.2-5.6
50s 80s 5.2-5.4 4.3-4.5 5.5-5.7 4.6-4.8 5.8-6.0 4.9-5.1
Yarn appearance (Reference: ASTM D2255). Yarn appearance refers to the relative evenness, smoothness, and freedom from foreign material of the yarn as evaluated by a visual comparison of the yarn with the latest standards by the American Society for Testing and Materials. Yarn specimens, wound on black boards, are compared with photographs of specimens representing the appearance grades (fig. 15).
Test Significant difference
Strength of 8s yarn Strength of 22s yarn Strength of 50s yarn Strength of 80s yarn Average of 2 yarn numbers
8 pounds 4 pounds 2 pounds
1 pound 80 break factor
Yarn elongation. Results are obtained in connection with yarn skein strength tests. Elongation in the yarn is highly correlated with fiber elongation. Yarns with high elonga- tion give less end-breakage in weaving than yarns with low elongation. The following terms may be of some help in evaluating the relative levels of yarn elongation:
Figure 15. - ASTM yarn appearance standards.
17
The appearance of a woven or knitted fabric depends to a large extent on the smoothness, cleanliness, and general appearance of the yarns from which it is manufactured. Since appearance is very important in many types of cotton products, high yarn appearance grades are desirable. The following terms may be of help in comparing yarn appearance test results:
Kind of yarn, staple length group,
and description
Yarn appearance index for the
specified yarn numbers
Carded yarns Short staple group:
Low 8s
109-117 22s
91-101 Average High
118-126 127-135
102-112 113-123
Medium staple group: Low
22s 76- 88
50s 58- 68
Average High
89-101 102-114
69- 79 80- 90
Long staple group: Low
22s 77- 91
50s 60- 70
Average High
92-106 107-121
71- 81 82- 92
Combed yarn Long staple group:
Low 22s
93-105 50s
77- 87 Average High
106-118 119-131
88- 98 99-109
Extra long staple group: Low
50s 100-106
80s 97-105
Average High
107-113 114-120
106-114 115-123
Note: Index of 130 = A Grade, 120 = B+, 110 = B, 100 = C+, 90 = C, 80 = D+, 70=D, and 60= below D.
Special studies and practical experience have indicated the following approximate reproducibility for the spinning test for yarn appearance:
Yarn appearance test Significant difference
Each yarn number Average of 2 yarn numbers
V2 grade or 10 index points VA grade or 5 index points
Uster nep and evenness. The Uster Evenness Tester, Model B, with Imperfection indicator is used for counting neps and both thick and thin places in slivers, rovings, and yarns (fig. 16). The material to be tested is drawn through a set of condenser plates at a constant speed. The resulting variations in capacity cause variations in the frequency of the condenser plates, which is transformed into voltage variations. These voltage variations activate the counter for neps, and thick and thin places, for a preset amount of time. Results are re- ported in terms of neps per thousand yards of yarn.
Spinning potential. The spinning potential yarn number indicates the finest yarn number that can be spun from a cotton sample, without any end-breakage, when using specific processing procedures. In performing these tests, new travelers, draft gears, and twist gears are installed for the selected yarn number and the yarn is spun for a 15-minute trial period. The yarn number selected is considered acceptable if there is an end- breakage involving 5 to 15 of the 96 spindles employed during the trial run. If end-breakage occurs on less than 5 or more than 15 of the 96 spindles during the trial period, a different yarn number is selected to be spun for another 15-minute trial period until the acceptable end- breakage rate is obtained. The acceptable trial period also is used as a warmup period, followed by a 1-hour test period. The spinning potential yarn number is calculated from the deviation of the actual yarn number spun from the desired yarn number, and the number of spindles with end-breakages during the 1-hour test run. The following terms may be of help in evaluating the spinning potential yarn numbers reported:
Descriptive Short staple Medium staple Long staple designation group group group
Low Average High
31-39 40-48 49-57
43-53 54-64 65-75
49-63 64-78 79-93
18
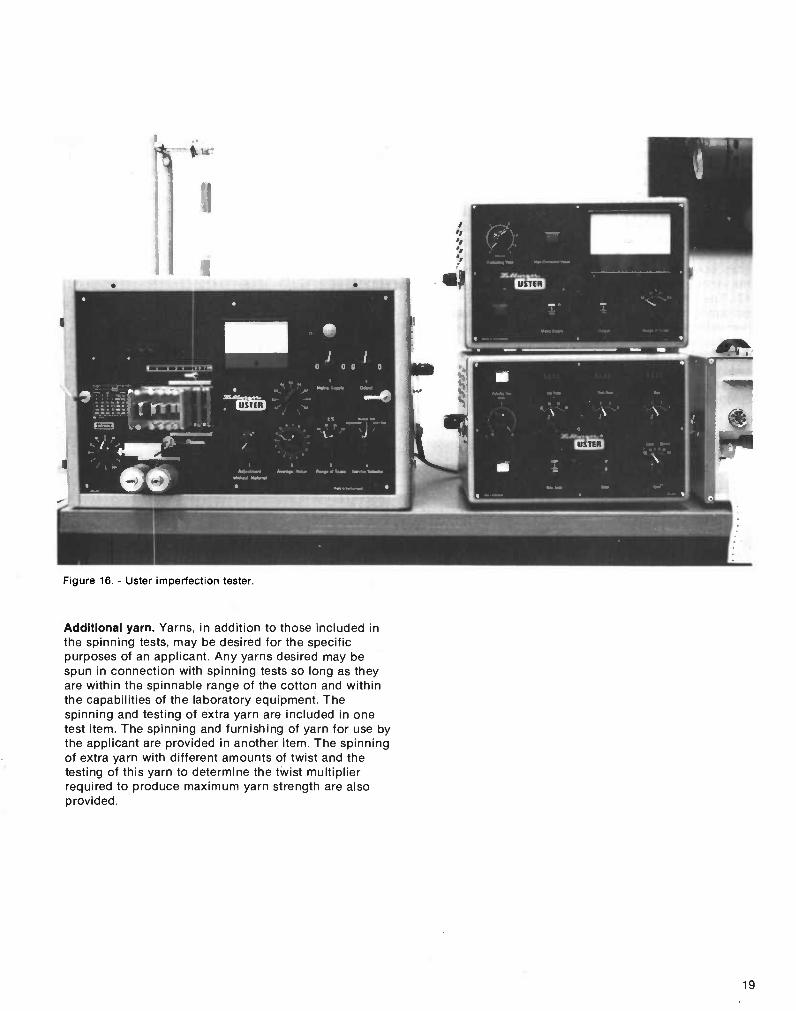
Figure 16. - Uster imperfection tester.
Additional yarn. Yarns, In addition to those included in the spinning tests, may be desired for the specific purposes of an applicant. Any yarns desired may be spun in connection with spinning tests so long as they are within the spinnable range of the cotton and within the capabilities of the laboratory equipment. The spinning and testing of extra yarn are included In one test Item. The spinning and furnishing of yarn for use by the applicant are provided in another item. The spinning of extra yarn with different amounts of twist and the testing of this yarn to determine the twist multiplier required to produce maximum yarn strength are also provided.
19

Chemical Finishing Tests
Information on bleaching and dyeing characteristics of different varieties and growths of raw cotton is useful to textile manufacturers. This information helps the manufacturer avoid problems that may result from blending various varieties and growths of cotton with different dyeing properties. Data on chemical finishing properties may thus be used as a basis for selecting cottons of similar bleaching and dyeing properties. Small-scale finishing tests are made on well blended 3- gram samples. The Ahiba Texomat dyer is used to make the various finishing tests on the cotton samples (fig. 17). The cotton sample Is scoured in a solution containing water, sodium hydroxide, sodium silicate, and two wetting agents. After the sample has been scoured, it is then bleached in a solution of water, sodium hydroxide, sodium silicate, hydrogen peroxide, and a sequestering agent. After bleaching, the sample is dyed in a solution of water, direct blue dye, and sodium chloride.
Color measurements are made on unfinished, bleached, and dyed cotton samples. The samples are measured on a Hunterlab colorimeter. Model 25M-3 (fig. 18). The color values are reported In terms of reflectance (Rd), yellowness (+b), and blueness (-b). The Rd value gives percentages of diffuse reflectance from 0 to 100. The b+ value provides a measure of yellowness and the -b value provides a measure of blueness. The brightness or reflectance of the cotton samples increases as the percentage reflectance scale (Rd) increases. Similarly, the degree of either yellowness (+b) or blueness (-b) increases as the scale numbers increase.
Figure 17. - Ahiba Texomat dyer.
Figure 18. - Hunterlab colorimeter.
Other Services
Special tests are available to clients for product quality evaluation. These tests include cotton fabric analysis, cotton fabric strength tests, and analysis of yarn twist and direction. Other special tests and services may be performed to the extent that available facilities will permit.
Samples and data not normally furnished may be important to the applicant in making special studies. Several test items provide for furnishing special samples and test data. The lab may furnish the applicant with Identified samples taken at any stage of processing or testing for use in further study or evaluation. Copies of test data work sheets, with detailed data and calculations, may also be furnished. Additional copies of test reports, or certified relisting of test results for selected samples from previous tests, are available upon request to the lab.
20
Appendix
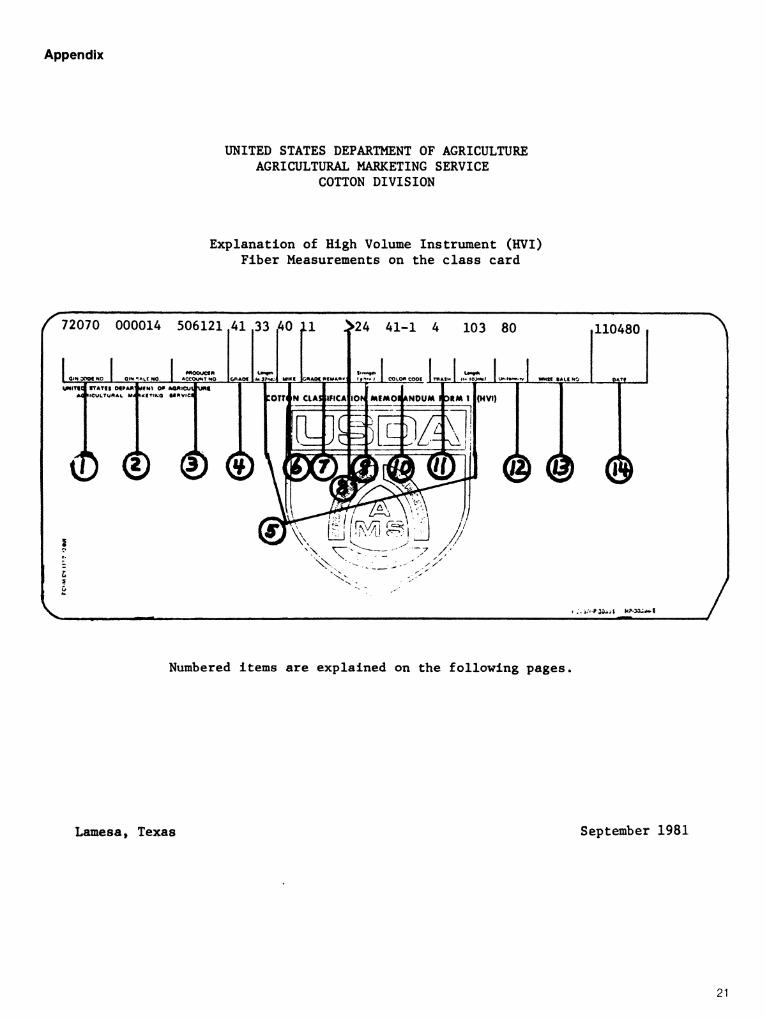
UNITED STATES DEPARTMENT OF AGRICULTURE AGRICULTURAL MARKETING SERVICE
COTTON DIVISION
Explanation of High Volume Instrument (HVI) Fiber Measurements on the class card
/^72070 000014 506121 41 33 AO 11>24 41-1 4103 80
otNaoocwo \ oiNTAtc
tTATft OVAM' MfNl O» AOMlCUJ A^lCVLTuMAi, táá «KCTIKO MAVlCfl
(b é
t<y)f*>it I u»'.»»w....v I »»Htt tk\.l
(HVI)
110480
@ @ @
>->y'-Piû-ji H?-3a^^l
Numbered items are explained on the following pages.
Lamesa» Texas September 1981
21
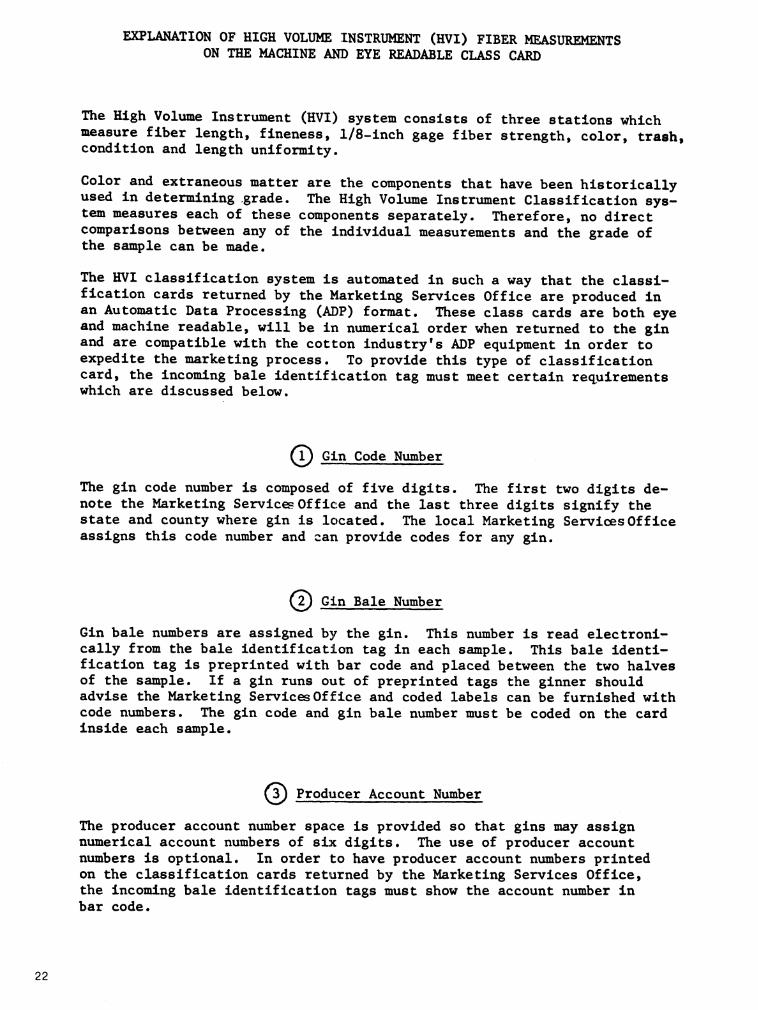
EXPLANATION OF HIGH VOLUME INSTRUMENT (HVI) FIBER MEASUREMENTS ON THE MACHINE AND EYE READABLE CLASS CARD
The High Volume Instrument (HVI) system consists of three stations which measure fiber length, fineness, 1/8-lnch gage fiber strength, color, trash, condition and length uniformity•
Color and extraneous matter are the components that have been historically used In determining grade. The High Volume Instrument Classification sys- tem measures each of these components separately. Therefore, no direct comparisons between any of the Individual measurements and the grade of the sample can be made.
The HVI classification system Is automated In such a way that the classi- fication cards returned by the Marketing Services Office are produced In an Automatic Data Processing (ADP) format. These class cards are both eye and machine readable, will be In numerical order when returned to the gin and are compatible with the cotton Industry's ADP equipment In order to expedite the marketing process. To provide this type of classification card, the Incoming bale Identification tag must meet certain requirements which are discussed below.
® Gin Code Number The gin code number Is composed of five digits. The first two digits de- note the Marketing Service? Offlee and the last three digits signify the state and county where gin Is located. The local Marketing Services Offlee assigns this code number and can provide codes for any gin.
© Gin Bale Number Gin bale numbers are assigned by the gin. This number is read electroni- cally from the bale identification tag in each sample. This bale identi- fication tag is preprinted with bar code and placed between the two halves of the sample. If a gin runs out of preprinted tags the ginner should advise the Marketing Services Office and coded labels can be furnished with code numbers. The gin code and gin bale number must be coded on the card Inside each sample.
® Producer Account Number The producer account number space is provided so that gins may assign numerical account numbers of six digits. The use of producer account numbers is optional. In order to have producer account numbers printed on the classification cards returned by the Marketing Services Office, the incoming bale identification tags must show the account number in bar code.
22
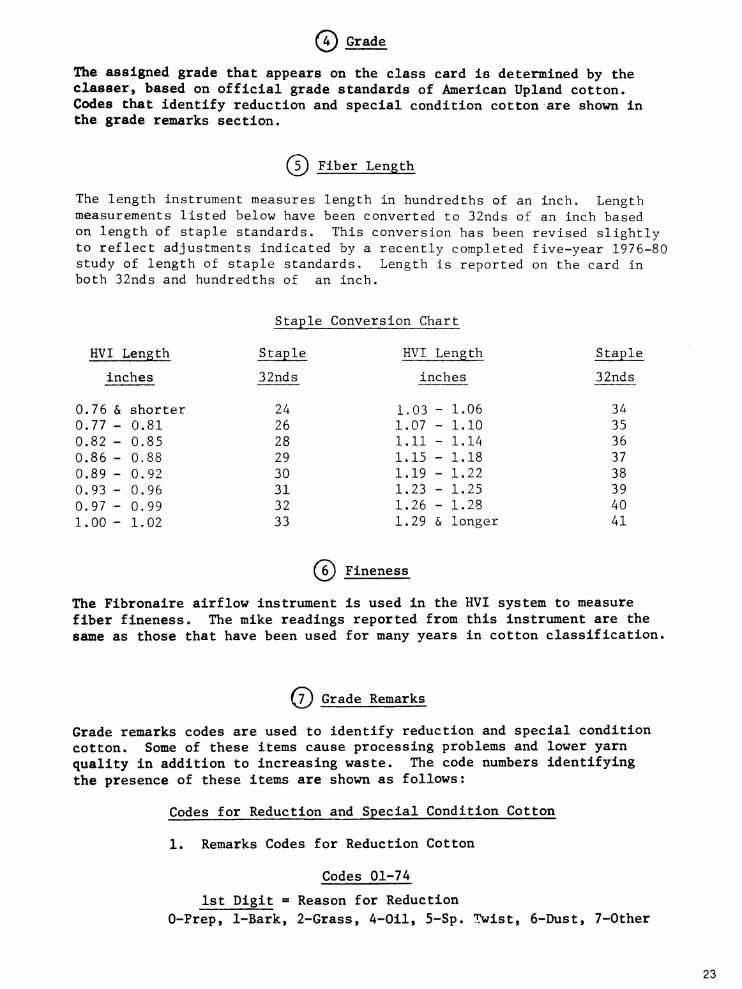
Ç) Grade
The assigned grade that appears on the class card is determined by the classer, based on official grade standards of American Upland cotton. Codes that identify reduction and special condition cotton are shown in the grade remarks section.
(5) Fiber Length
The length instrument measures length in hundredths of an inch. Length measurements listed below have been converted to 32nds of an inch based on length of staple standards. This conversion has been revised slightly to reflect adjustments indicated by a recently completed five-year 1976-80 study of length of staple standards. Length is reported on the card in both 32nds and hundredths of an inch.
HVI Length
inches
Staple Conversion Chart
Staple
3 2nd s
HVI Length
inches
Staple
32nds
0.76 & shorter 24 0.77 - 0.81 26 0.82 - 0.85 28 0.86 - 0.88 29 0.89 - 0.92 30 0.93 - 0.96 31 0.97 - 0.99 32 1.00 - 1.02 33
©
1.03 - 1.06 1.07 - 1.10 1.11 - 1.14 1.15 - 1.18 1.19 - 1.22 1.23 - 1.25 1.26 - 1.28 1.29 & longer
Fineness
34 35 36 37 38 39 40 41
The Fibronaire airflow instrument is used in the HVI system to measure fiber fineness. The mike readings reported from this instrument are the same as those that have been used for many years in cotton classification.
(y) Grade Remarks
Grade remarks codes are used to identify reduction and special condition cotton. Some of these items cause processing problems and lower yarn quality in addition to increasing waste. The code numbers identifying the presence of these items are shown as follows:
Codes for Reduction and Special Condition Cotton
1. Remarks Codes for Reduction Cotton
Codes 01-74
1st Digit = Reason for Reduction 0-Prep, 1-Bark, 2-Grass, 4-Oil, 5-Sp. Twist, 6-Dust, 7-Other
23

2nd Digit « Number grades reduced (1,2,3) and when the 2nd digit is 3 for Prep it will be a Gin Cut. Below Grade Cotton - When the Ext Matter is one or more steps BG the 2nd digit will be 4.
2. Remarks Codes for Special Condition Cotton
Codes 75-92
75 - Other side 2 grades higher 78 - Both outsides 2 grades higher 80 - Appearance of repacked 81 - Repacked 82 - Appearance of waterpacked 83 - Weather damage plate 84 - Old crop cotton 85 - Av. rule used for cotton 86 - Appearance of fire damaged 87 - Mixed packed - other side more than 2 grades higher 88 - Mixed packed - both outsides more than 2 grades higher 91 - Upland cotton ginned on roller gin 92 - American Pim<'i cotton ginned on saw gin
3. Grade Codes for Special Condition Cotton
96 - Mixture of Upland and American Pima 97 - Fire damaged 98 - Water packed
© Limits Exceeded - When the arrowhead ( >►) appears before any of the HVI measurements on the class card, it indicates that the measurements for the factor have exceeded the control limits. When these limits are exceeded, a flag is dropped on the sample and the results are not printed. The sample designated is rerun through the line, and the remeasured results are printed. If the remeasure- ments remain outside the control limits, an arrowhead is printed beside the values which are out, indicating a two-sided bale.
The following number of observations will be made on each side of each sam- ple measured.
Fiber Measurement No. Observation
Each Side for Sample Total
Micronaire Length Uniformity Strength Color Trash
1 4 4 4 4 2
24

(E) Strength
The fiber strength measurement is made with a 1/8-inch gage spacing between the clamp jaws. Results are reported in terms of grams per tex. A tex unit is equal to the weight in grams of 1,000 meters of fiber. Therefore, the strength reported is the force in grams required to break a bundle of fibers one tex unit in size.
The following table shows some general comparisons of HVI 1/8-inch gage strength measurements (grams per tex) to Pressley zero gage measurements (1,000 pounds per square inch (Mpsi)). A medium staple sample of cotton with a HVI 1/8-inch gage strength reading of 23 grams per tex would be about 85 Mpsi on the Pressley zero gage strength instrument.
Fiber Strength Table
Staple length group : HVI 1/8" gage : Pressley zero and descriptive : strength : gage £ itrength designation (grams per tex) : (thousand psi)
Short staple: (Staple 31 and shorter)
Very Low 18 - 19 74 - 78 Low 20 - 21 79 - 83 Average 22 - 23 84 - 88 High 24 - 25 89 - 93 Very High 26 - 27 94 - 98
Medium staple : (Staples 32-35)
Very Low 17 - 19 70 - 76 Low 20 - 22 77 - 83 Average 23 - 25 84 - 90 High 26 - 28 91 - 97 Very High 29 - 31 98 -104
Long staple: (Staples 36-40)
Very Low 18 - 20 71 - 77 Low 21 - 23 78 - 84 Average 24 - 26 85 - 91 High 27 - 29 92 - 98 Very High 30 - 32 99 -105
@ Color
The color measurement is composed of four measures: Grayness indicates how light or dark the sample is and Yellowness indicates how much yellow color is in the sample. The Nickerson-Hunter cotton colorimeter color diagram on the following page is based on current official standards for American Upland cotton and shows how these measurements are coded and how they re- late to the color of the grade standards. Each grade is subdivided into quadrants to denote color differences within a grade for more precise measurement.
25

USDA > AMS COTTON DIVISION
40
»GRAYS: Color 3 grâdts b«lo^ f «Mf. LT. GRAYS: Color 2 gridtt bf1< ñí* loaf.
"'i,.>l»»..l>r>l'i'»liiiiliinl,tiililiiiiliiiiilnnliiiihiilliiii MUNICH't -l^bl IMCtCASINO oiantt Of YCLUowNCts ro« lovt
26

Qj) Trash Grade
The trash grade is an estimate of waste content. The measurement is made by a visual comparison of the sample with six photographs, numbered 2 through 7, showing increasing trash levels. Grade 8 is used to identify samples having more trash than shown on photograph number 7.
A comparison of the different trash grades with actual nonlint content is shown below. Also shown, for comparison, is the average nonlint content of the grades of cotton. The tables show how these measurements are re- lated to cotton classed against the grade standards.
Average Nonlint Content by Trash Grades
Average Nonlint Content of the White Grades of Cotton
HVI Trash Nonlint Grade Content
(Pet.) Grade Code Nonlint Content
(Pet.)
2 2.4 SM (21) 1.9 3 2.8 Mid (31) 2.3 4 3.4 SLM (41) 3.1 5 4.2 LM (51) 4.3 6 5.1 SGO (61) 5.6 7 6.3 GO (71) 7.2 8 No Data
@ Length Uniformity
Length uniformity is a measure of the degree of uniformity of fibers in a sample. The descriptive terms listed below may be helpful in explaining the measurement results.
Descriptive Designation
HVI Length Uniformity
Very high Above 85
High 83 - 85
Average 80 - 82
Low 77 - 79
Very low Below 77
Û3) Warehouse Bale Number
This space will not be used by the Marketing Services Office. It is provided so that warehouse bale numbers can be added to the class card in a uniform manner.
A) Date
This is the date bale was classed in the Marketing Services Office.
I^U.S. GOVERNMENT PRINTING OFFICE: 1982-360-932:AMS-1069 27