FSUTMS TRANSIT MODELING WORKSHOP - … · FSUTMS Transit Modeling Workshop ... standard in GIS...
294
FSUTMS TRANSIT MODELING WORKSHOP Presented by Florida Department of Transportation Systems Planning Office 605 Suwannee Street, MS 19 Tallahassee, Florida 32399-0450 Conducted by AECOM Consult 2800 Corporate Exchange Drive, Suite 300 Columbus, Ohio 43231 In cooperation with Cambridge Systematics, Inc. 2457 Care Drive, Suite 101 Tallahassee, Florida 32308 Conducted at Homewood Suites 8745 International Drive Orlando, FL 32819 June 4 – 7, 2007
-
Upload
nguyenminh -
Category
Documents
-
view
218 -
download
1
Transcript of FSUTMS TRANSIT MODELING WORKSHOP - … · FSUTMS Transit Modeling Workshop ... standard in GIS...
FSUTMS TRANSITMODELING WORKSHOP
Presented byFlorida Department of TransportationSystems Planning Office605 Suwannee Street, MS 19Tallahassee, Florida 32399-0450
Conducted byAECOM Consult 2800 Corporate Exchange Drive, Suite 300 Columbus, Ohio 43231
In cooperation with Cambridge Systematics, Inc.2457 Care Drive, Suite 101 Tallahassee, Florida 32308
Conducted atHomewood Suites8745 International DriveOrlando, FL 32819
June 4 – 7, 2007

FSUTMS Transit Modeling Workshop – Preface Page 1
PREFACE
This three-day training course called the “FSUTMS Transit Modeling Workshop” is designed as a beginning- to intermediate-level workshop for professionals with highway modeling experience but little experience in transit. The course will cover in detail transit modeling within FSUTMS-Cube, including transit network coding, micro-coding fixed guideway stations, creating transit input files, transit access and path-building, Public Transport (PT) module scripting, mode choice, transit assignment, interpreting and displaying transit ridership results, and User Benefits. To aid transportation professionals in Florida, the Florida Department of Transportation Systems Planning Office has developed or will be developing additional workshops teaching FSUTMS powered by Cube Voyager. The workshops will present the transportation planning modeling methods currently accepted in Florida:
1) FSUTMS Executive Summary Modeling Seminar 2) FSUTMS Model Calibration Workshop 3) FSUTMS Comprehensive Modeling Workshop
4) Advanced FSUTMS-Cube & Scripting Workshop 5) Introduction to ArcGIS Using FSUTMS/Cube (to be developed) Note: Others may be added as requested by the users in Florida.
The FSUTMS Executive Summary Modeling Seminar provides an overview of the transportation planning process, travel demand forecasting methodologies, and FSUTMS modules and data requirements under Cube Voyager. Participants will learn how to review and interpret the output results. This workshop is designed for managers and non-modelers. The FSUTMS Model Calibration Workshop provides the participants technical details on the FSUTMS process and is designed for transportation professionals who have a basic understanding of the travel demand forecasting process. The workshop will contain lectures on travel survey techniques, how to create FSUTMS input files from origin and destination survey data, how to create and interpret trip tables, the usage of friction factors and K-factors, calibration/validation techniques, criteria, procedures, and accepted standards in Florida. The FSUTMS Comprehensive Modeling Workshop will provide an overview of the transportation planning process, travel demand forecasting methodologies, and FSUTMS modules and data requirements. Participants will learn to install and execute FSUTMS powered by Cube, use the menu systems, interpret and create standard output results, and create and edit networks through a series of hands-on computer exercises. Previous Geographic Information System (GIS) experience is helpful for this workshop, but not required. The Advanced FSUTMS-Cube & Scripting Workshop is designed for the FSUTMS/Tranplan modeler transitioning to FSUTMS/Cube-Voyager, as well as who requires an overview on interpreting and creating Cube scripts under the Florida standards. The first part of the workshop covers procedures done differently in FSUTMS/Cube-Voyager and the second part of the workshop covers Cube scripting language elements, resources, and data

FSUTMS Transit Modeling Workshop – Preface Page 2
manipulation. A guest modeler with extensive Cube script writing experience is invited to help teach this workshop. It is recommended that the FSUTMS Comprehensive Modeling Workshop serve as a prerequisite to this workshop or extensive experience in FSUTMS/Tranplan. The Introduction to ArcGIS Using FSUTMS/Cube will teach the fully integrated ArcGIS graphical interface of Cube 5, scheduled for release in 2007. This new version of Cube combines the usefulness of Cube/Viper's transportation model display tools with the world standard in GIS software, ArcGIS. It is recommended that the FSUTMS Comprehensive Modeling Workshop serve as a prerequisite to this workshop. This workshop will be developed after the release of Cube 5.0, which will have ArcGIS embedded within the program.
Florida Department of Transportation Systems Planning Office

FSUTMS Transit Modeling Workshop – Acknowledgments Page 3
ACKNOWLEDGMENTS
This three-day training course called "FSUTMS Transit Modeling Workshop" is sponsored by the Florida Department of Transportation, Systems Planning Office, 605 Suwannee Street MS19, Tallahassee, Florida 32399-0450 under a special FSUTMS Training Contract with Cambridge Systematics, Inc., Tallahassee, Florida. We would like to recognize and thank the following individuals who made this workshop possible:
• Mr. Terry Corkery, FDOT Project Manager, Systems Planning Office • Mr. Yongqiang Wu, Transportation Modeler Manager, Systems Planning
Office Special thanks to Mr. Warren Merrell, Jr. Manager, FDOT Systems Planning Office and Mrs. Huiwei Shen, Manager, FDOT Systems Modeling Section, for their continued support for transportation modeling training in Florida. We would also like to acknowledge Citilabs for providing the Cube Voyager Software.
Cambridge Systematics & AECOM Consult
June 2007

FSUTMS Transit Modeling Workshop – Acknowledgments Page 4

FSUTMS Transit Modeling Workshop – Table of Contents Page 5
TABLE OF CONTENTS
FSUTMS TRANSIT MODELING WORKSHOP
Preface
Acknowledgements Table of Contents Agenda Evaluation Form List of Attendees Glossary Lesson Workshop Introduction
1 Toto, I don’t think we are using Tranplan anymore!
(Transit Model Overview)
2 PT 109
3 Let’s Hack the Net! (Transit Network)
4 You mean transit impacts the highway network? 5 Getting involved with PT (More about PT)
6 Get me outta this zone! (Transit Access)
7 PT, show me the way (Transit Path-Building) 8 Give me my share (Mode Choice)
9 Put me on the bus that takes me to grandma’s home
(Transit Assignment) 10 Sorry, it’s not perfect; to err is human
(Limitations of the Model) 11 To UB or not to UB! (User Benefits) 12 Final Summary Exercise

FSUTMS Transit Modeling Workshop – Table of Contents Page 6

FSUTMS Transit Modeling Workshop – Agenda Page 7
AGENDA
FSUTMS TRANSIT MODELING WORKSHOPJune 4-7, 2007
Homewood Suites 8745 International Drive Orlando, Florida 32819
Day 1: Monday, June 4, 2007 – 1:00 p.m. Lesson Description Workshop Introductions
1 Toto, I don’t think we are using Tranplan anymore!
(Transit Model Overview)
2 PT 109 Game 2.1: Tic-Tac-Toe Computer Workshop: Understanding PT - Exercise 2.1 – Create a System Data File - Exercise 2.2 – Create a PT Fares File - Exercise 2.3 – Create a Factors File
Summary of Day 1 (End 5:00 p.m.) Day 2: Tuesday, June 5, 2007 - 8:30 a.m. Lesson Description
3 Let’s hack the net ! (Transit Network) Game 3.1: Who Wants to be a Millionaire? Computer Workshop: Transit Networks - Exercise 3.1 – Coding a transit network 4 You mean transit impacts the highway network? Game 4.1: Hollywood Squares Computer Workshop: Impacts on the Highway Network - Exercise 4.1 – Micro-coding fixed guideway stations 5 Getting involved with PT (More about PT)
Summary of Day 2 (End 5:00 p.m.)

FSUTMS Transit Modeling Workshop - Agenda Page 8
Day 3: Wednesday, June 6, 2007 - 8:30 a.m. Lesson Description
6 Get me outta this zone! (Transit Access) Game 6.1: Tic-Tac-Toe Computer Workshop: Transit Access - Exercise 6.1 – Updating Percent Walk - Exercise 6.2 – Generate Walk Connectors
7 PT, show me the way (Transit Path-Building) Game 7.1: Hollywood Squares Computer Workshop: Transit Path-Building - Exercise 7.1 – PT Module Scripting - Exercise 7.2 – Run and Debug Model - Exercise 7.3 – Review Transit Skim
8 Give me my share (Mode Choice) Game 8.1: Family Feud Computer Workshop: Mode Choice - Exercise 8.1 – Review Mode Summary
Summary of Day 3 (End 5:00 p.m.)
Day 4: Thursday, June 7, 2007 - 8:00 a.m. Lesson Description
9 Put me on the bus that takes me to grandma’s home (Transit Assignment) Computer Workshop: Transit Assignment - Exercise 9.1 – Review Transit Assignment Reports - Exercise 9.2 – Map Transit Boardings - Optional Exercise 9.3 – Map Transit Desire Lines
10 Sorry, it’s not perfect; to err is human
(Limitations of the Model) Game 10.1: The Price is Right 11 To UB or not to UB! (User Benefits)
12 Final Summary Exercise - Exercise 12.1 – Comprehensive Summary
Course Summary - Evaluations Adjourn (End 12:00 p.m.)
FSUTMS Transit Modeling Workshop – Participant’s Evaluation Page 9
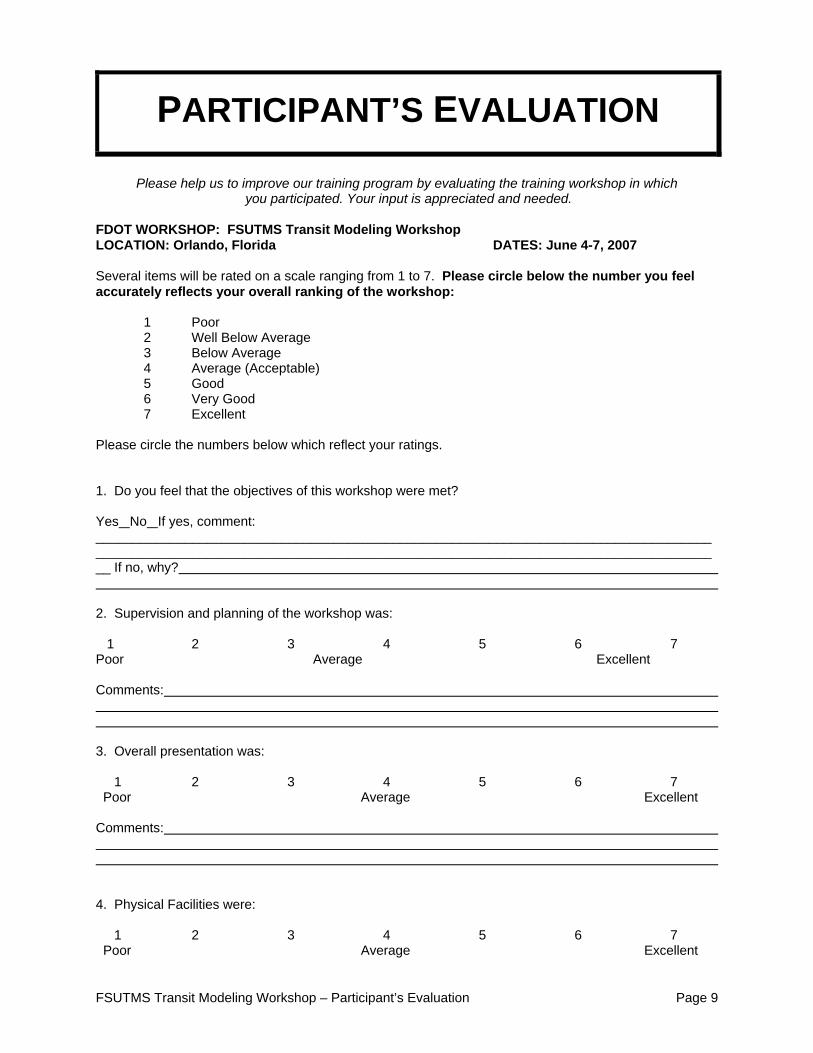
PARTICIPANT’S EVALUATION
Please help us to improve our training program by evaluating the training workshop in which
you participated. Your input is appreciated and needed. FDOT WORKSHOP: FSUTMS Transit Modeling Workshop LOCATION: Orlando, Florida DATES: June 4-7, 2007 Several items will be rated on a scale ranging from 1 to 7. Please circle below the number you feel accurately reflects your overall ranking of the workshop: 1 Poor 2 Well Below Average 3 Below Average 4 Average (Acceptable) 5 Good 6 Very Good 7 Excellent Please circle the numbers below which reflect your ratings. 1. Do you feel that the objectives of this workshop were met? Yes No If yes, comment: ________________________________________________________________________________________________________________________________________________________________________ If no, why? 2. Supervision and planning of the workshop was: 1 2 3 4 5 6 7 Poor Average Excellent Comments: 3. Overall presentation was: 1 2 3 4 5 6 7 Poor Average Excellent Comments: 4. Physical Facilities were: 1 2 3 4 5 6 7 Poor Average Excellent

FSUTMS Transit Modeling Workshop – Participant’s Evaluation Page 10
Comments: 5. Was the material generally presented at the correct level for this group? Yes No ___ Comments: 6. The workshop visual materials were: 1 2 3 4 5 6 7 Poor Average Excellent Comments: 7. Do you prefer the more interactive approach to the exercises or detailed step-by-step exercises? ____________________________________________________________________________________________________________________________________________________________________________________________________________________________________________________________ 8. Overall value of the workshop to you. Please state in your own words. 9. Suggestions for improvement. 10. Which workshops have you attended (check all that apply)? Executive Summary ___ Comprehensive Modeling ___ Model Calibration __ Transit Modeling __ Advanced FSUTMS-Cube & Scripting ___ 11. Are there any other topics you would like to see covered in future workshops? __________________ ________________________________________________________________________________________________________________________________________________________________________ 12. What is your job title? 13. Employed by? MPO ___ District ___ Government __ University __ Consultant __ Additional comments regarding this training, other desired training, etc, are welcome. Send comments to Cambridge Systematics, 2457 Care Drive, Suite 101, Tallahassee, Florida 32308 or fax to (850) 219-6389. Thank you for taking the time to share your opinions and ideas.

FSUTMS Transit Modeling Workshop – Glossary of Terms Page 15
GLOSSARY OF TERMS
Alightings The number of persons getting off a transit vehicle. Area Type Network link code representing the type of land use in the area. Attraction The pull or attracting power of a zone. For non-home based trips, attractions in a zone can be considered synonymous with trip destinations in that zone. Auto Occupancy Rate Average number of persons per vehicle. Boardings The number of persons getting on a transit vehicle. Calibration The procedure used to adjust travel models to simulate trip making characteristics of households in the model study area using large sample travel diary surveys. Capacity The maximum number of vehicles that can pass over a given section of a lane or roadway in one direction (or in both directions for a two-lane or three-lane highway). It is the maximum rate of flow that has a reasonable expectation of occurring. The terms “capacity” and “possible capacity” are synonymous. In the absence of a time modifier, capacity is an hourly volume. In expressing capacity, it is essential to state the prevailing roadway and traffic conditions under which the capacity is applicable. The capacity would not normally be exceeded without changing one or more of the conditions that prevail. Cordon Line An imaginary line enclosing a study area, along which external interviews are conducted. Cube Voyager The software engine used to run and call FSUTMS models. Demand Used in an economic sense and based on the theory and methodology of consumer demand, a schedule of the quantities of travel consumed at various levels of price or levels of service offered by the transportation system. Demand is not a fixed amount of travel, but a function of level of service. Nearly all urban travel forecasting methods are based on the concepts of travel demand and transportation facility supply interacting in a transportation network as the market to produce an equilibrium flow pattern.

FSUTMS Transit Modeling Workshop – Glossary of Terms Page 16
Destination Location to which trips are made, variously identified as a zone of specified area (in aggregate travel forecasting) or a location with a specified “attraction power,” measured by things such as employees (for work trips) or square feet of sales area (for shopping trips). Desire Line Lines on a map representing the number of trips between zones. The thicker the line, the larger the number of trips. EE Trips External-External trips represent trips that have both trip ends outside the model study area. Facility Type A network link code representing the type of service a roadway provides, such as principal arterial, minor arterial, collector, etc. The facility type does not always match the functional classification, as the facility type is used for modeling purposes only to simulate actual conditions. Florida Standard Urban Transportation Model Structure (FSUTMS) The name of Florida Department of Transportation’s travel model structure. FSUTMS is based on TRANPLAN as distributed by The Urban Analysis Group. Forecasting The process of determining the future values of land use, socioeconomic, and trip making variables within the study area. Friction Factors (F-Factors, FF) Represents the effect that various levels of travel time will have on travel between zones. Gravity Model A mathematical model of trip distribution based on the premise that trips produced in any given area will distribute themselves in accordance with the accessibility of other areas and the opportunities they offer. Highway-Only Model A model that only includes a roadway network thereby excluding transit. Home-Based Trip A trip with one end at the residence. HOV Trips High Occupancy Vehicle trips, or carpool trips, represent the number of trips with usually two or more persons in the vehicle, including the driver. Impedance More general than Friction Factors, impedance shows the effect that various levels of time and cost will have on travel between zones. Impedance can include various types of time (walking, waiting, riding, etc.) and cost (fares, operating costs, tolls, parking costs, etc.). Other factors, such
FSUTMS Transit Modeling Workshop – Glossary of Terms Page 17
as comfort, convenience, personal safety, etc., may also be included. IE Trips Internal-External trips represent trips that have one end inside the model study area and one end outside the model study area. II Trips Internal-Internal trips represent trips that have both ends inside the model study area. Intrazonal Trip A trip with both its origin and destination in the same zone. Level of Service Multidimensional characteristics of the transportation service provided that are usually identified specifically by the location of the origin and destination of trip and that are divided into those that are quantifiable (travel time, travel cost, number of transfers) and those that are difficult to quantify (comfort, mode image). Link In traffic assignment, a section of the highway network defined by a node at each end. A link may be one-way or two-way. Mode Choice Mode choice models calculate which trips will use the highway network and which will use the transit network. The model predicts how the trips will be divided among variable modes of travel. Mode of Travel Means of travel such as auto driver, vehicle passenger, mass transit passenger, walking or bicycle. Nested Logit Model Analytical form for demand modeling that is suited to modeling of multiple travel choice situations with nesting of different modes. Network Set of nodes and connecting links that represent transportation facilities in an area. Normally associated with links are distances, levels of service, capacities, and volume requirements. Node A point where two links join in a network, usually representing a decision point for route choice but sometimes indicating only a change in some important link attribute. Occupancy Model Converts person trips to vehicle trips using auto occupancy factors. Origin The location of the beginning of a trip or the zone in which a trip begins.

FSUTMS Transit Modeling Workshop – Glossary of Terms Page 18
Peak Period That period during which the maximum amount of travel occurs. This may be one or more hours. Generally, there is a morning peak and an afternoon peak and traffic assignments may be made for each period. Productions The number of home-based trip ends in the zone of residence. For all non-home based trips, productions are synonymous with origins. RMSE Root Mean Square Error is a measure of total error defined as the square root of the sum of the variance and the square of the bias. It assumes that larger forecast errors are of greater importance than smaller ones; hence they are given a more than proportionate penalty. Screenline An imaginary line, usually along a physical barrier such as a river or railroad tracks, splitting the study area into parts. Traffic counts and possibly interviews are conducted along this line, and the crossings are compared to those calculated from the home interview data as a check of survey accuracy. Crossing may also be compared with model estimates as part of calibration. Select Link Analysis Determines the number of trips coming from each link or TAZ for a specific link. Select Zone Analysis Determines the number of trips coming from or going to each TAZ in the model for a specific TAZ or node. Socioeconomic Data Demographic data, such as household, population, and employment characteristics, that are input into the model to determine the impact on trip making patterns. SOV Trips Single Occupancy Vehicle trips, or drive alone trips, represent the number of trips with only one person in the vehicle, including the driver. Special Generators Concentrations of activities of such size or unusual nature to warrant special consideration in trip generation analysis. Study Area Boundary The area that is expected to take on urban characteristics in the next 20 to 30 years (by the end of the planning period). TAZ Traffic Analysis Zone - a small geographic area that serves as the primary unit of analysis in a travel forecasting model. Traffic Count

FSUTMS Transit Modeling Workshop – Glossary of Terms Page 19
The observed number of trips collected at a specific location. Used to assist with model validation. Transportation Model A mathematical description of a transportation system’s characteristics including traffic volumes, land use, roadway type and population. After a mathematical relationship is established, the model is used to predict traffic volumes based on anticipated changes in the other characteristics. Trip Assignment The process of determining route or routes of travel and allocating the zone-to-zone trips to these routes. Trip Distribution The process by which the movement of trips between zones is estimated. The data for each distribution may be measured or be estimated by a growth factor process, or by synthetic model. Trip End Either a trip origin or a trip destination. Trip Generation A general term describing the analysis and application of the relationships which exist among the tripmakers, the urban area, and trip making. It relates to the number of trip ends in any part of the urban area. Trip Purpose The reason for making a trip, normally one of several possible purposes. Each trip may have a purpose at each end; (e.g., home to work) or may be classified by the purpose at the non-home end (e.g. home to shop). Trip Table A table showing trips between zones -- either directionally or total two-way. The trips may be separated by mode, by purpose, by time period, by vehicle type, or other classification. Trip Rate The average number of trips per household for specific trip purposes. In Florida, trip rates are usually applied by household size and auto availability within each zone by trip purpose. Validation The procedure used to adjust models to simulate new base year traffic counts. VHT Vehicle hours of travel. VMT Vehicle mile of travel. Volume-to-Capacity Ratio The ratio of the number of trips simulated in the model divided by the capacity of the link. A volume-to-capacity ratio of 1.0 represents 100 percent of the capacity.

FSUTMS Transit Modeling Workshop – Glossary of Terms Page 20
Volume-to-Count Ratio The ratio of the number of trips simulated in the model divided by the observed traffic count on the link. A volume-to-count ratio of 1.0 represents an exact match between the simulated volumes and the observed counts.

Florida Department of Transportation Intro -1
FSU
TMS
Tran
sit M
odel
ing
Wor
ksho
p -2
007
FSUTMS TRANSIT MODELINGWORKSHOP
Florida Department of TransportationSystems Planning Office
June 4-7, 2007
2
Instructors
David “Dave” SchmittConsulting Manager, AECOM Consult2800 Corporate Exchange Drive Suite 300Columbus, OH 43231(614) 901-6026Email: [email protected] “Ashu” Kumar Consultant, AECOM Consult2800 Corporate Exchange Drive Suite 300Columbus, OH 43231(614) 901-6026Email: [email protected]

Florida Department of Transportation Intro -2
FSU
TMS
Tran
sit M
odel
ing
Wor
ksho
p -2
007
3
Instructor/Support Yongqiang WuTransportation Modeling ManagerFDOT, Systems Planning Office 605 Suwannee St., MS 19 Tallahassee, FL 32399 (850) 414-4931 Email: [email protected] Harris Travel Demand ForecasterCambridge Systematics2457 Care Drive, Suite 101Tallahassee, FL 32308 (850) 219-6388 Email: [email protected]
4
Agenda
Day 1 (June 4, 2007)Transit Model Overview & PT basics
Day 2 (June 5, 2007)Networks, Part 1Networks, Part 2PT Scripting
Florida Department of Transportation Intro -3
FSU
TMS
Tran
sit M
odel
ing
Wor
ksho
p -2
007
5
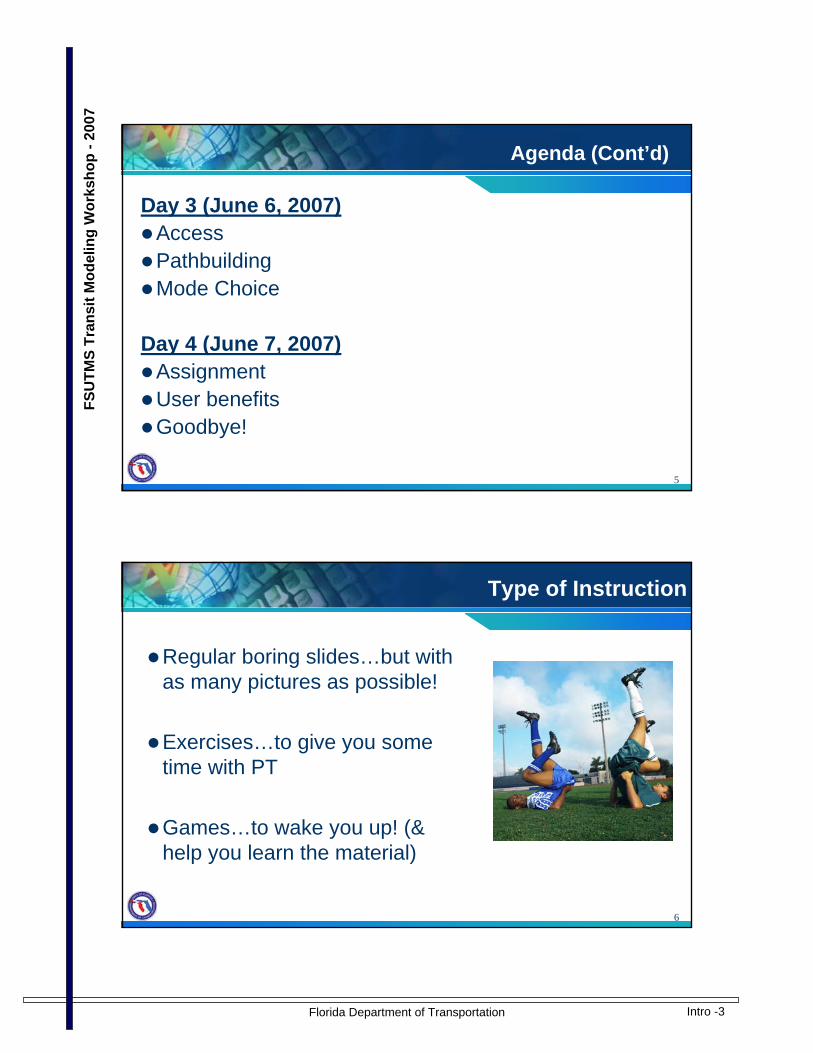
Agenda (Cont’d)
Day 3 (June 6, 2007)AccessPathbuildingMode Choice
Day 4 (June 7, 2007)AssignmentUser benefitsGoodbye!
6
Type of Instruction
Regular boring slides…but with as many pictures as possible!
Exercises…to give you some time with PT
Games…to wake you up! (& help you learn the material)
Florida Department of Transportation Intro -4
FSU
TMS
Tran
sit M
odel
ing
Wor
ksho
p -2
007
7
Workshop Objectives
Provide experienced Florida modelers with an understanding of the differences in transit modeling between FSUTMS-TRANPLAN and FSUTMS Cube.Provide a deeper understanding of transit modeling.
Day 1
Day 2
Day 3
Day 4
8

Florida Department of Transportation Intro -5
FSU
TMS
Tran
sit M
odel
ing
Wor
ksho
p -2
007
9
Participant’s Workbook
Workbook– 12 Lessons
PowerPoint SlidesCharts and Figures
– 11 Computer Exercises– Glossary of Terms– Evaluation Form– Registered Attendees
Contact List6 Interactive Games
10
Participant’s Data CD
Olympus Data Files for Computer ExercisesWorkbookFSUTMS User’s Library
Florida Department of Transportation Intro -6
FSU
TMS
Tran
sit M
odel
ing
Wor
ksho
p -2
007
11
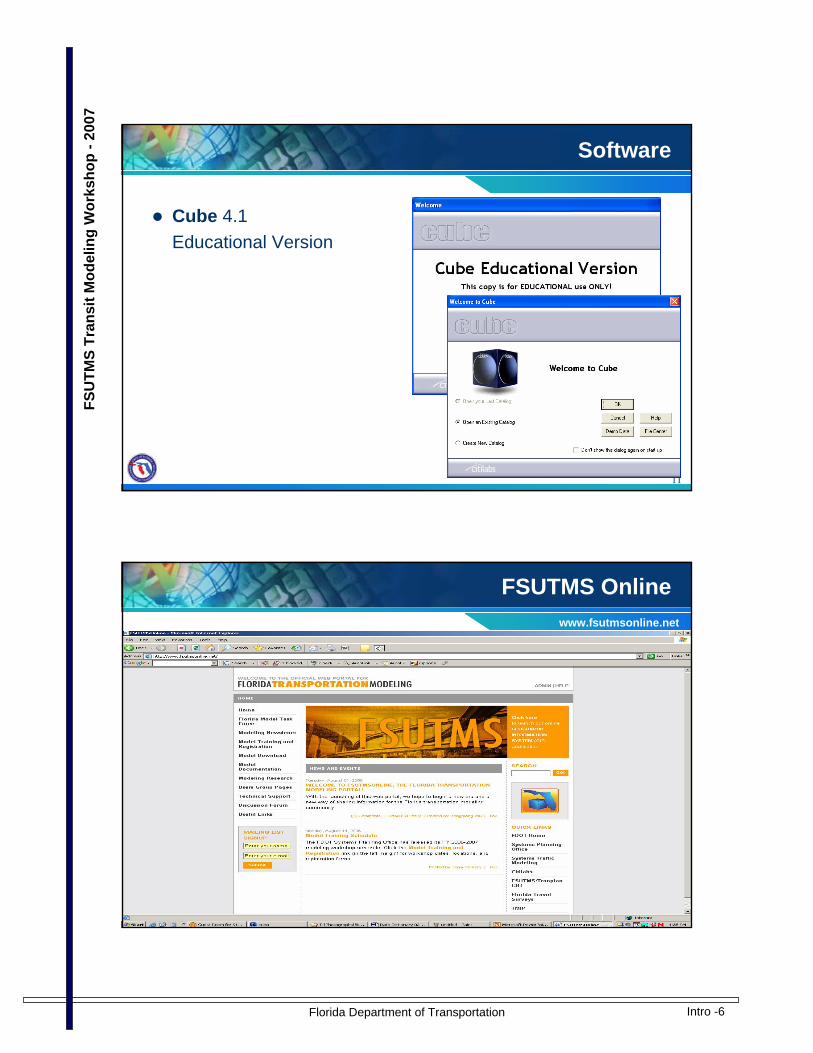
Software
Cube 4.1Educational Version
12
FSUTMS Onlinewww.fsutmsonline.net

Florida Department of Transportation Intro -7
FSU
TMS
Tran
sit M
odel
ing
Wor
ksho
p -2
007
13
Documentation
FSUTMS Online (www.fsutmsonline.net)– FSUTMS Powered by Cube Voyager Data Dictionary, FDOT,
December 2005– FSUTMS New Standards and Enhancements: A User Oriented
Approach, FDOT, January 2006– FSUTMS-Cube Framework Phase 1: Default Model
Parameters, FDOT, October 2006– FSUTMS-Cube Transit Model – Application Framework, FDOT,
May 2007– FSUTMS-Cube Transit Model - Theoretical Framework, FDOT,
May 2007
14
FDOT District Modeling Coordinators
District 1 – Jim Baxter (863) 519-2562District 2 – Milton Locklear (904) 360-5686District 3 – Linda Little (850) 415-9217District 4 – Min-Tang Li (954) 777-4652District 5 – Jon Weiss (407) 482-7881District 6 – Phil Steinmiller (305) 470-5825District 7 – Danny Lamb (813) 975-6437Turnpike Enterprise – Bill Olsen (407) 532-3999 x3808

Florida Department of Transportation Intro -8
FSU
TMS
Tran
sit M
odel
ing
Wor
ksho
p -2
007
15
● FHWA Mining Data for Transportation Planning● FSUTMS Executive Summary● FSUTMS Comprehensive Modeling ● FSUTMS Model Calibration● Advanced FSUTMS-Cube & Scripting● FSUTMS Transit Modeling● Other Potential Topics
- Developments of Regional Impact (DRI) Modeling- Introduction to ArcGIS using FSUTMS-Cube (5.0)
FY 2007/2008
Potential Workshops for Upcoming Fiscal Year
16
Last Day
Certificates
CDs
Contact Information / P.E. Number
Course Evaluations

Florida Department of Transportation Intro -9
FSU
TMS
Tran
sit M
odel
ing
Wor
ksho
p -2
007
17
Logistics
Daily Schedule– Monday
1:00 to 5:00– Tuesday-Wednesday
8:30 to 5:00– Thursday
8:30 to 12:00
– Lunch/BreaksFacilities– RestroomsSecurity– Laptops– Personal Belongings
18
Please Introduce Yourself
NameOrganizationBackground– Familiarity with transit modeling– Familiarity with VoyagerWhy are you here?What am I looking to get out of this course? Smile, don’t wince!

Florida Department of Transportation Intro -10
FSU
TMS
Tran
sit M
odel
ing
Wor
ksho
p -2
007
19
Notes
20
Notes

Florida Department of Transportation FSU 1 -1
FSU
TMS
Tran
sit M
odel
ing
Wor
ksho
p -2
007
1
Toto, I don’t think we’re using Tranplananymore!
(Transit model overview)
Lesson 1
2
Lesson Goals
In this lesson we will cover:Transit modeling basicsHighlight differences between transit models in FSUTMS-Voyager and FSUTMS-Tranplan
Florida Department of Transportation FSU 1 -2
FSU
TMS
Tran
sit M
odel
ing
Wor
ksho
p -2
007
3
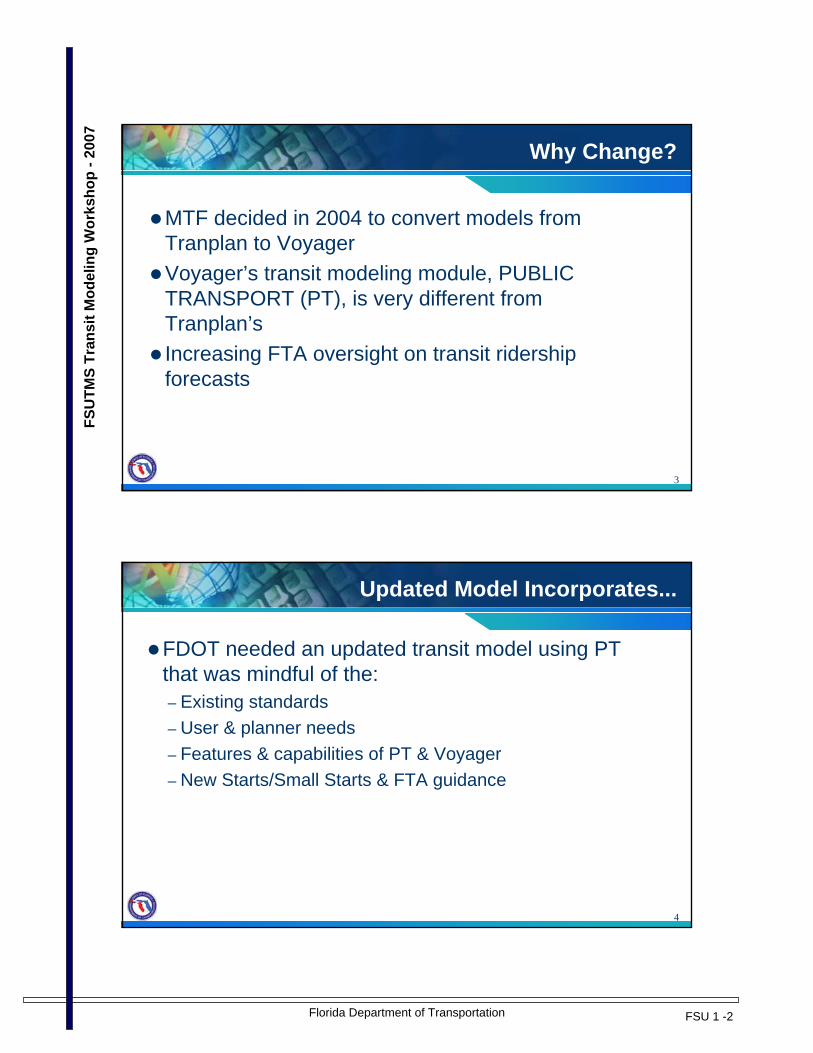
Why Change?
MTF decided in 2004 to convert models from Tranplan to VoyagerVoyager’s transit modeling module, PUBLIC TRANSPORT (PT), is very different from Tranplan’sIncreasing FTA oversight on transit ridershipforecasts
4
Updated Model Incorporates...
FDOT needed an updated transit model using PT that was mindful of the:– Existing standards– User & planner needs– Features & capabilities of PT & Voyager– New Starts/Small Starts & FTA guidance

Florida Department of Transportation FSU 1 -3
FSU
TMS
Tran
sit M
odel
ing
Wor
ksho
p -2
007
5
Transit Model
Consists of many elements/steps, including:– Percent of zonal area within walking distance to transit– Walk, auto & sidewalk connections to transit– Transit line coding, fare definition, speed relationships– Path-building– Mode choice modeling– Assignment– ReportingEach element has to be consistent with the others to produce viable results
6
Model Process…
Then & Now
Florida Department of Transportation FSU 1 -4
FSU
TMS
Tran
sit M
odel
ing
Wor
ksho
p -2
007
7
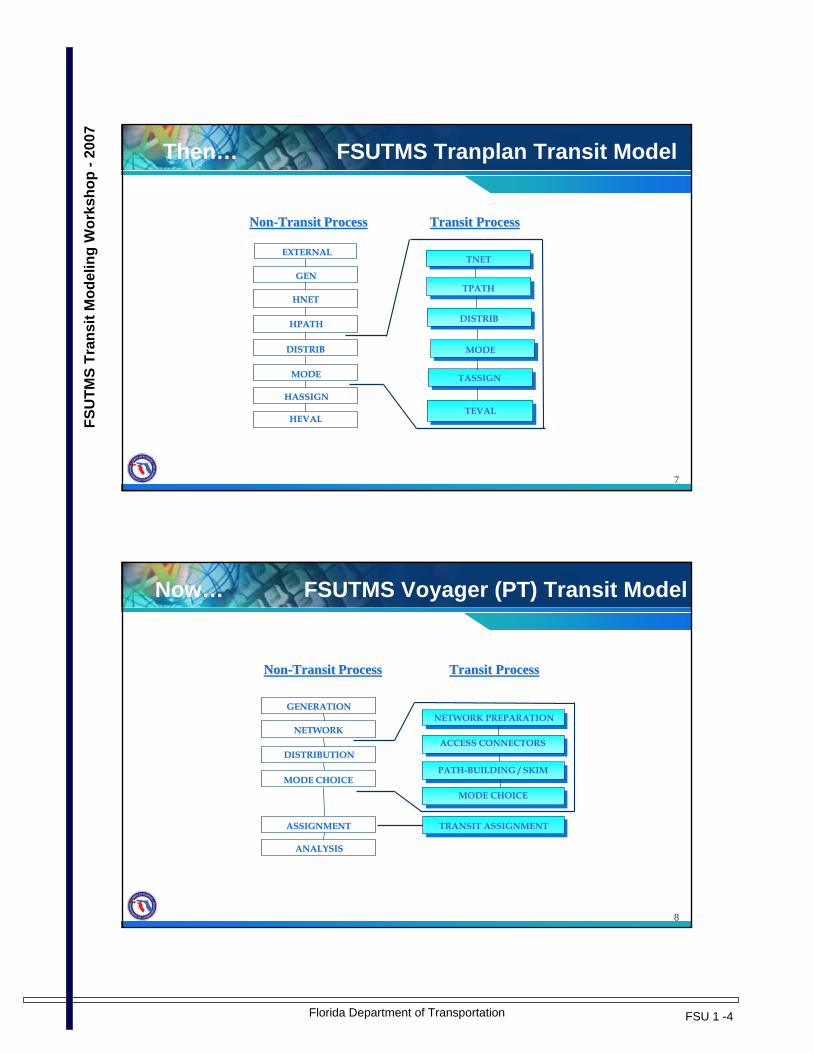
Then… FSUTMS Tranplan Transit Model
NonNon--TransitTransit ProcessProcess
TASSIGNTASSIGN
TNETTNET
TPATHTPATH
MODEMODE
TEVALTEVAL
Transit ProcessTransit Process
EXTERNALEXTERNAL
GENGEN
HNETHNET
HPATHHPATH
DISTRIBDISTRIB
MODEMODE
HASSIGNHASSIGN
HEVALHEVAL
DISTRIBDISTRIB
8
Now… FSUTMS Voyager (PT) Transit Model
NonNon--TransitTransit ProcessProcess
TRANSIT ASSIGNMENTTRANSIT ASSIGNMENT
NETWORK PREPARATIONNETWORK PREPARATION
ACCESS CONNECTORSACCESS CONNECTORS
PATHPATH--BUILDING / SKIMBUILDING / SKIM
Transit ProcessTransit Process
GENERATIONGENERATION
NETWORKNETWORK
DISTRIBUTIONDISTRIBUTION
MODE CHOICEMODE CHOICE
ASSIGNMENTASSIGNMENT
ANALYSISANALYSIS
MODE CHOICEMODE CHOICE

Florida Department of Transportation FSU 1 -5
FSU
TMS
Tran
sit M
odel
ing
Wor
ksho
p -2
007
9
Tranplan vs. PT Model
No major changes to the overall model process– Still using single-path path builder & “favored mode”
mode choice model– Most of the changes due to the software change
Olympus PT model looks like…
10

Florida Department of Transportation FSU 1 -6
FSU
TMS
Tran
sit M
odel
ing
Wor
ksho
p -2
007
11
Now… PT Transit Model
3 modules:– TRANSIT – network preparation, path/skim
Combines old TNET, TPATH– MODE CHOICE – mode choice setup & execution
Reflects old MODE– ASSIGNMENT – assignment, reporting
Combines old TASSIGN, TEVAL
12
Transit Model Structure…
Then & Now
Florida Department of Transportation FSU 1 -7
FSU
TMS
Tran
sit M
odel
ing
Wor
ksho
p -2
007
13
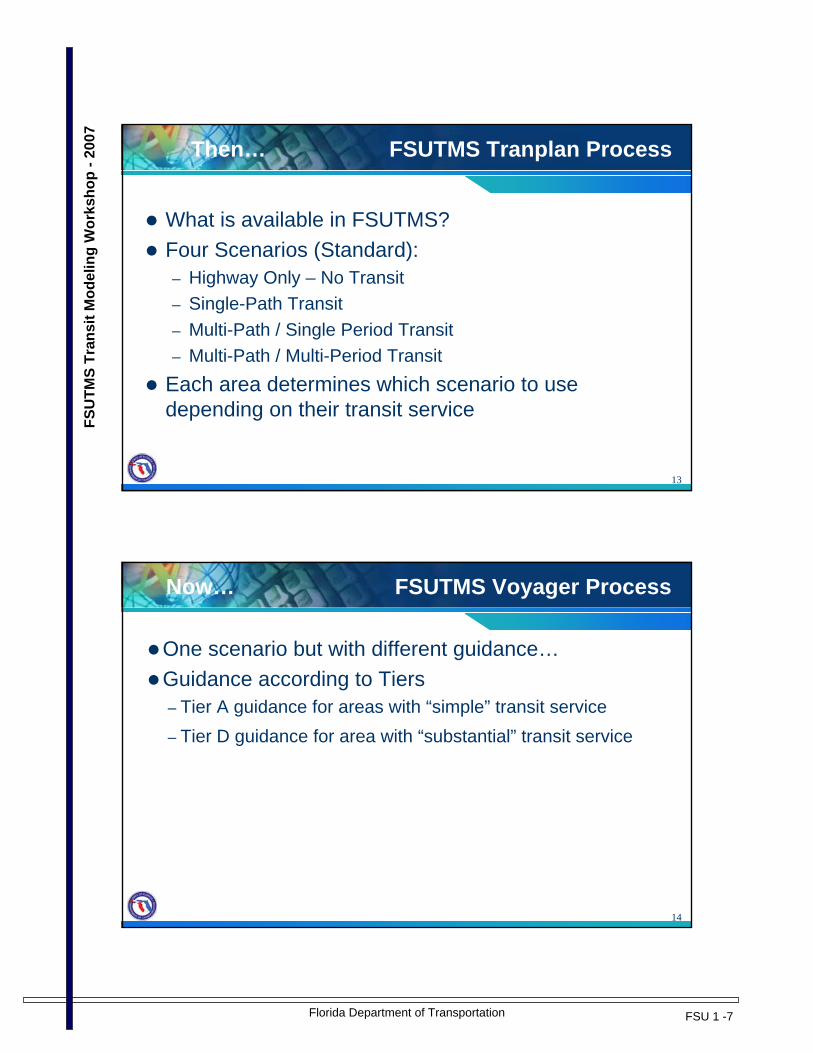
Then… FSUTMS Tranplan Process
What is available in FSUTMS?Four Scenarios (Standard):– Highway Only – No Transit– Single-Path Transit– Multi-Path / Single Period Transit– Multi-Path / Multi-Period Transit
Each area determines which scenario to use depending on their transit service
14
Now… FSUTMS Voyager Process
One scenario but with different guidance…Guidance according to Tiers– Tier A guidance for areas with “simple” transit service– Tier D guidance for area with “substantial” transit service

Florida Department of Transportation FSU 1 -8
FSU
TMS
Tran
sit M
odel
ing
Wor
ksho
p -2
007
15
Guidelines – Tiers
Detailed boarding & transfer rate information; Recent on-board survey for all modes
System-wide boardings & transfer rates; Recent on-board survey
System-wide boardings & transfer rates;May have recent on-board survey
System-wide boardings & transfer rates
Data AvailabilityPolk County,
SunTranLocal service only;No park-and-ridesA
Southeast Florida
Many different types of service;Extensive park-and-ride system;Potential major fixed-guideway system
D
Jacksonville, Orlando, Tampa
C
Votran, Spacecoast
Local & express service;Some park-and-rides
B
ExamplesTransit ServiceTier
16
Summary of Changes
Guidelines!Calibration/ Validation
New assignment procedure & reporting programTASSIGN
New coefficients; New mode choice structure for some areas; New percent walk guidelinesMODE
New access procedures & programs; Reduced number of paths in some areasTPATH
Advanced line coding features; New mode definitions; New system data files with reduced emphasis on ASCII files; New auto-bus speed relationships
TNET
Review trip distribution for validation; Examine highway speeds from first assignmentDISTRIB
Coding transit network elements in transportation networkHNETChange(s)Module

Florida Department of Transportation FSU 1 -9
FSU
TMS
Tran
sit M
odel
ing
Wor
ksho
p -2
007
17
Transit Network Process…
Then & Now
18
Then… Tranplan Transit Network Process
Build Highway Network -NETWORK
Transit DataCollection
Transit Coding
Transit NetworkBuilding - TNET
Debugging
Calibration

Florida Department of Transportation FSU 1 -10
FSU
TMS
Tran
sit M
odel
ing
Wor
ksho
p -2
007
19
Now … PT Transit Network Process
Build Highway Network - HNET
Transit DataCollection
Transit Coding
Transit NetworkBuilding - TNET
Debugging
Calibration
No major differences in the transit network process under FSUTMS-Voyager; just different coding, variables, and files
20
Data Collection…
Then & Now

Florida Department of Transportation FSU 1 -11
FSU
TMS
Tran
sit M
odel
ing
Wor
ksho
p -2
007
21
Then… Data Collection (Tranplan)
Transit RoutesOperating DataOn-board SurveysPassenger LoadingZonal AccessPark and Ride Lots
22
Now..
No major difference in data collection in FSUTMS-Voyager!

Florida Department of Transportation FSU 1 -12
FSU
TMS
Tran
sit M
odel
ing
Wor
ksho
p -2
007
23
Transit Network Coding…
Then & Now
24
Transit Network Coding
New system data & fare filesMaintain all transit lines in single fileTake advantage of advanced coding featuresCode these elements in highway network– Transit-only links– Micro-code fixed-guideway stations– PNR/Station dataUse new mode definitions
Now… (PT)

Florida Department of Transportation FSU 1 -13
FSU
TMS
Tran
sit M
odel
ing
Wor
ksho
p -2
007
25
Transit Network Coding (Cont’d)
1215
12751270
1220
4010
128011311129
1141
1138
Q TRAN&ROUTE M = 4 , LINE = 4, ID = “MILITARY RUN”, ONEWAY = F,
H = 5.0, C=1, N = -1141, -1138, -1280, 1131, -1129, -1275, -1270, -1220, -4010,
-1215,&END
Then… (Tranplan)
26
Transit Network Coding (Cont’d)
1215
12751270
1220
4010
1280113111291138
Q TRANLINE MODE = 4 , NAME=“MILRUN”, LONGNAME = “MILITARY RUN”,
ONEWAY=F, HEADWAY[1]=5.0, HEADWAY[2]=5.0, OPERATOR=1,N = 1141, 1138, 1280, -1131, 1129, 1275, 1270, 1220,
4010, 1215
Now… (PT)

Florida Department of Transportation FSU 1 -14
FSU
TMS
Tran
sit M
odel
ing
Wor
ksho
p -2
007
27
Transit Network Coding (Cont’d)
…LINE MODE=7, NAME="M7L1MI", ONEWAY=F,
LONGNAME="STAGE 1: OKEECHOBEE -> DADELAND SOUTH", USERA1="1",XYSPEED=30, USERA2="5", USERA3="1", USERA4="5", HEADWAY[1]=6,HEADWAY[2]=12, HEADWAY[3]=6, OPERATOR=8, N=30001, 30002, 30003,30004, 30005, 30006, 30007, 30008, 30009, 30010, 30011, 30012,30013, 30014, 30015, 30016, 30017, 30018, 30019, 30020, 30021
LINE MODE=9, NAME="M9L1MI", ONEWAY=T, LONGNAME="DPM: CW INNER LOOP",USERA1="222", XYSPEED=15, USERA2="8", USERA3="222", USERA4="5",HEADWAY[1]=1.5, HEADWAY[2]=1.5, HEADWAY[3]=1.5, OPERATOR=9,N=30700, 30701, 30702, -30703, 30772, 30704, -30705, 30706,-30707, 30708, -30709, -30710, 30711, 30700
LINE MODE=9, NAME="M9L2MI", ONEWAY=T, LONGNAME="DPM: OMNI LOOP",USERA1="223", XYSPEED=15, USERA2="8", USERA3="223", USERA4="5",HEADWAY[1]=3, HEADWAY[2]=3.5, HEADWAY[3]=3, OPERATOR=9,N=30720, 30721, -30722, -30723, 30724, 30770, 30725, -30703,30702, 30701, 30700, -30712, 30726, -30709, 30708, -30707,30706, -30705, 30704, 30772, -30727, 30728, 30771, 30729,-30730, -30731, 30732, 30720
…LINE MODE=8, NAME="M8L1S6", ONEWAY=F,
LONGNAME="TRI-RAIL MANGONIA-MIA", XYSPEED=35, USERA2="8",USERA3="1", USERA4="6", HEADWAY[1]=60, HEADWAY[2]=60,HEADWAY[3]=60, OPERATOR=10, N=30500, 30501, -30502, 30503,30504, 30505, 30506, -30507, -30508, 30509, 30510, 30511,30512, 30513, 30514, 30515, -30516, -30517, 30518, 30519,30520, 30521, 30522
TROUTE_yya.LINTransit Route File
28
Transit Network Coding (Cont’d)
; PT System Data File; 2000 SERPM6 - 12/2006 - DRS
; Mode InformationMODE NUMBER=1 NAME="Walk Access" LONGNAME="Walk Access Connectors"MODE NUMBER=2 NAME="Auto Access" LONGNAME="Auto Access Connectors"MODE NUMBER=3 NAME="Transfer" LONGNAME="Transfer Connectors"MODE NUMBER=4 NAME="PB&Brow LB" LONGNAME="Palm Beach & Broward Local Bus"MODE NUMBER=5 NAME="Metrobus LB" LONGNAME="Miami-Dade Local Bus"MODE NUMBER=6 NAME="Express Bus" LONGNAME="Express Buses"MODE NUMBER=7 NAME="Metrorail" LONGNAME="METRORAIL STG 1"MODE NUMBER=8 NAME="Tri-RaiL" LONGNAME="TRI-RAIL"MODE NUMBER=9 NAME="Metromover" LONGNAME="Miami-Dade MetroMover"MODE NUMBER=10 NAME="New Mode" LONGNAME="New Mode"MODE NUMBER=11 NAME="Proj Mode" LONGNAME="Project Mode"MODE NUMBER=12 NAME="Shuttle Bus" LONGNAME="Shuttle Buses to Tri-Rail"MODE NUMBER=13 NAME="Ltd Stop Bus" LONGNAME="Limited Stop Buses"
; Operator Information - used in FARESYSTEMOPERATOR NUMBER=1 NAME="PB LB" LONGNAME="Palm Beach Local Buses"OPERATOR NUMBER=2 NAME="TR Shuttle" LONGNAME="Tri-Rail Shuttle Buses"OPERATOR NUMBER=3 NAME="Broward LB" LONGNAME="Broward Local Buses"OPERATOR NUMBER=4 NAME="Metrobus" LONGNAME="Miami Metrobus"OPERATOR NUMBER=5 NAME="Brow Exp" LONGNAME="Broward Express Bus"OPERATOR NUMBER=6 NAME="Miami Exp" LONGNAME="Miami Express Buses"OPERATOR NUMBER=7 NAME="New Mode" LONGNAME="Reserved for New Mode"OPERATOR NUMBER=8 NAME="MetroRail" LONGNAME="METRORAIL"OPERATOR NUMBER=9 NAME="MetroMover" LONGNAME="Miami-Dade METROMOVER"OPERATOR NUMBER=10 NAME="Tri-Rail" LONGNAME="TRI-RAIL"
SYSTEM.PTSSystem Data File
Florida Department of Transportation FSU 1 -15
FSU
TMS
Tran
sit M
odel
ing
Wor
ksho
p -2
007
29
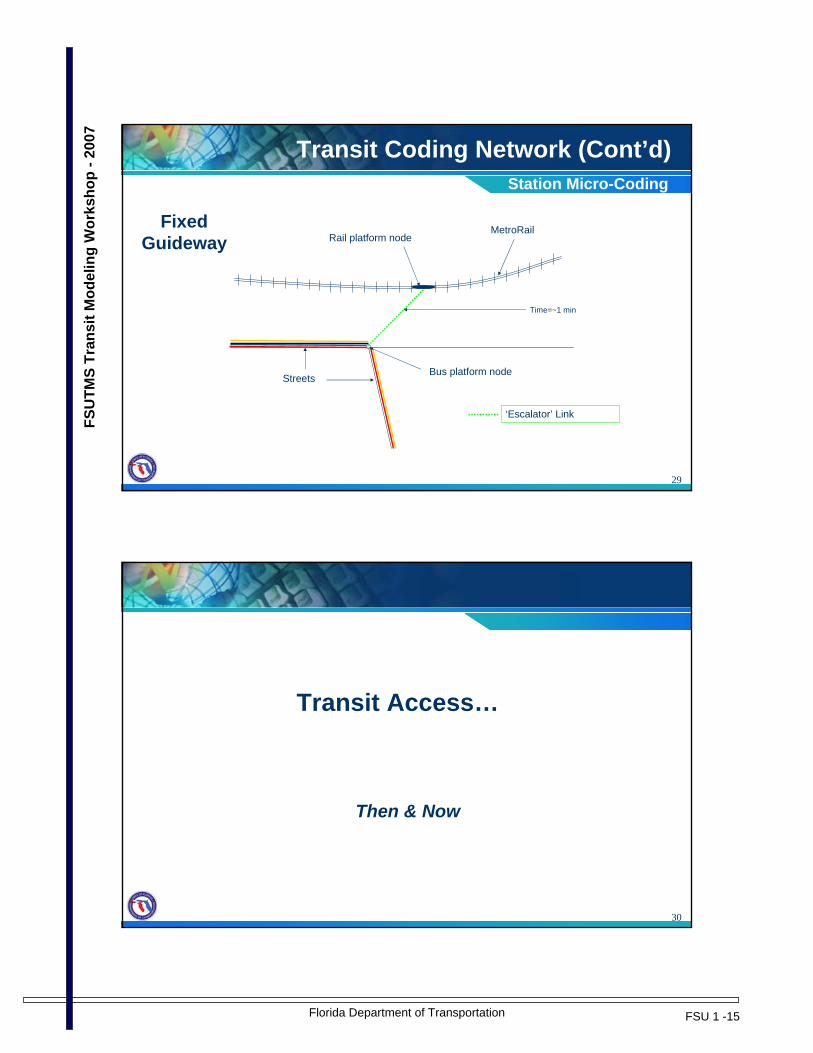
Transit Coding Network (Cont’d)
StreetsBus platform node
Rail platform nodeMetroRail
‘Escalator’ Link
Time=~1 min
Station Micro-Coding
Fixed Guideway
30
Transit Access…
Then & Now

Florida Department of Transportation FSU 1 -16
FSU
TMS
Tran
sit M
odel
ing
Wor
ksho
p -2
007
31
Transit Access (Cont’d)
Percent walk file created is revised using REWALK program before going into mode choice
Percent walk file created is used by the mode choice model
Compute percent walk in GIS, CUBE
Compute percent walks using PCWALK, GIS
Use single ½ mile “can/cannot walk” buffer
Short-& long-walk distances
Voyager PTTranplan
Zonal
32
Transit Access (Cont’d)
Use REWALK program to coordinate percent walks & connectors
Created using GENERATE statement in PT
Created using WALKCON or GENWALK
2 types of connectors: zone-stop, zone-station
One set of connectors
Voyager PTTranplan
Walk
Florida Department of Transportation FSU 1 -17
FSU
TMS
Tran
sit M
odel
ing
Wor
ksho
p -2
007
33
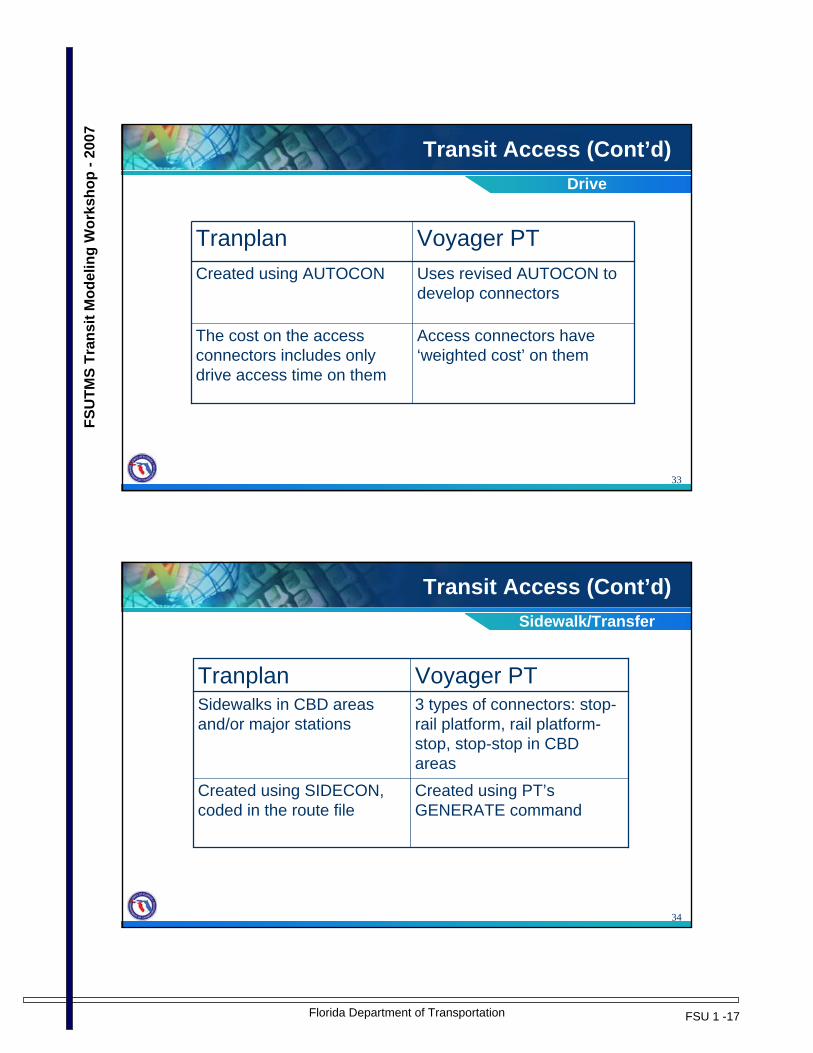
Transit Access (Cont’d)
Access connectors have ‘weighted cost’ on them
The cost on the access connectors includes only drive access time on them
Uses revised AUTOCON to develop connectors
Created using AUTOCON
Voyager PTTranplan
Drive
34
Transit Access (Cont’d)
Created using PT’sGENERATE command
Created using SIDECON, coded in the route file
3 types of connectors: stop-rail platform, rail platform-stop, stop-stop in CBD areas
Sidewalks in CBD areas and/or major stations
Voyager PTTranplan
Sidewalk/Transfer

Florida Department of Transportation FSU 1 -18
FSU
TMS
Tran
sit M
odel
ing
Wor
ksho
p -2
007
35
Path-Building, Mode Choice and Assignment
Then & Now
36
Path-Building/Mode Choice
Ability to produce summit input binary files within the software
Summit input binary files produced by the mode choice program
Uses software for path-building;Uses software / program for mode choice
Used software for path-building;Used program for mode choice
Identical process, but different: (1) number of paths, (2) nested logitmodel, (3) path weights & utility coefficients
Number of paths & mode choice structure based on model structure
Voyager PTTranplanThen and Now

Florida Department of Transportation FSU 1 -19
FSU
TMS
Tran
sit M
odel
ing
Wor
ksho
p -2
007
37
Assignments
New program for combining assigned paths and reporting
Used software to combine assigned paths and reporting
No major differencesAssign transit person trip tables to corresponding paths
Voyager PTTranplan
Then and Now
38
Advanced PT Features
We will not cover some advanced features, including:– Capabilities of multi-path path builder (not used in
Florida)– Select link features (covered in other workshops)– Crowding model (balances loaded demand against
bus capacity; not used in Florida)
Feel free to try them out on your own!
Florida Department of Transportation FSU 1 -20
FSU
TMS
Tran
sit M
odel
ing
Wor
ksho
p -2
007
39
Summary
In this lesson, we covered:Transit modeling basicsDifferences between FSUTMS Tranplan and FSUTMS Voyager
40
Notes

Florida Department of Transportation FSU 2 -1
FSU
TMS
Tran
sit M
odel
ing
Wor
ksho
p -2
007
1
PT109
Lesson 2
2
Lesson Goals
In this lesson we will cover:Input files for PT module– System data file– Fares file– Factors file

Florida Department of Transportation FSU 2 -2
FSU
TMS
Tran
sit M
odel
ing
Wor
ksho
p -2
007
3
Input Files to PT Module
Major input files– Transit system file– Fare file– Factors file (up to 10)– Network– Transit line (up to 7)– NT leg (up to 32)– Route file– Demand matrix
4
Scripting Basics
General Syntax: COMMAND keyword=valueThe COMMAND always stands alone and is followed by white space (1 or more)
The KEYWORD is always followed by ‘=‘
To continue line must finish in an operator:
+ - / * , = | &; for line comment, /*…*/ for block comment
Cube Voyager Scripts

Florida Department of Transportation FSU 2 -3
FSU
TMS
Tran
sit M
odel
ing
Wor
ksho
p -2
007
5
Example Script (Calculating Passenger Car Equivalents (PCE)):
RUN PGM=NETWORK
FILEI NETI=MY2000.ALT.NETFILEO NETO=TOTVOL.ALT.NET
COMP TOTVOL = V1_1 * 1 + ; Passenger VehiclesV2_1 * 1.2 + ; Small TrucksV3_1 * 2.5 ; Big Trucks
ENDRUN
General Rules
COMMAND KEYWORDVALUE
COMMENT
OPERATOR: LINE CONTINUES
NO OPERATOR: LINE ENDS
6
System Data File
System Data File“SYSTEM.PTS”
in parameters folder
Florida Department of Transportation FSU 2 -4
FSU
TMS
Tran
sit M
odel
ing
Wor
ksho
p -2
007
7
System Data File (Cont’d)
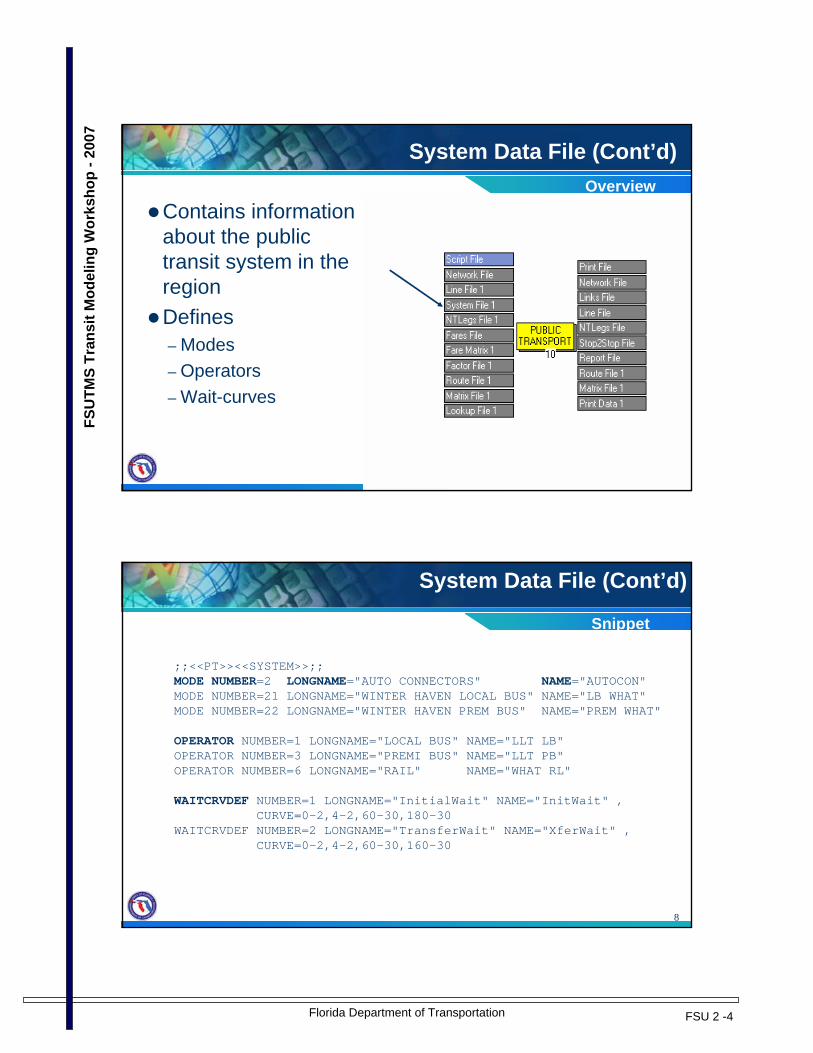
Contains information about the public transit system in the regionDefines– Modes– Operators – Wait-curves
Overview
8
System Data File (Cont’d)
;;<<PT>><<SYSTEM>>;;MODE NUMBER=2 LONGNAME="AUTO CONNECTORS" NAME="AUTOCON"MODE NUMBER=21 LONGNAME="WINTER HAVEN LOCAL BUS" NAME="LB WHAT"MODE NUMBER=22 LONGNAME="WINTER HAVEN PREM BUS" NAME="PREM WHAT"
OPERATOR NUMBER=1 LONGNAME="LOCAL BUS" NAME="LLT LB"OPERATOR NUMBER=3 LONGNAME="PREMI BUS" NAME="LLT PB"OPERATOR NUMBER=6 LONGNAME="RAIL" NAME="WHAT RL"
WAITCRVDEF NUMBER=1 LONGNAME="InitialWait" NAME="InitWait" ,CURVE=0-2,4-2,60-30,180-30
WAITCRVDEF NUMBER=2 LONGNAME="TransferWait" NAME="XferWait" ,CURVE=0-2,4-2,60-30,160-30
Snippet
Florida Department of Transportation FSU 2 -5
FSU
TMS
Tran
sit M
odel
ing
Wor
ksho
p -2
007
9
System Data File (Cont’d)
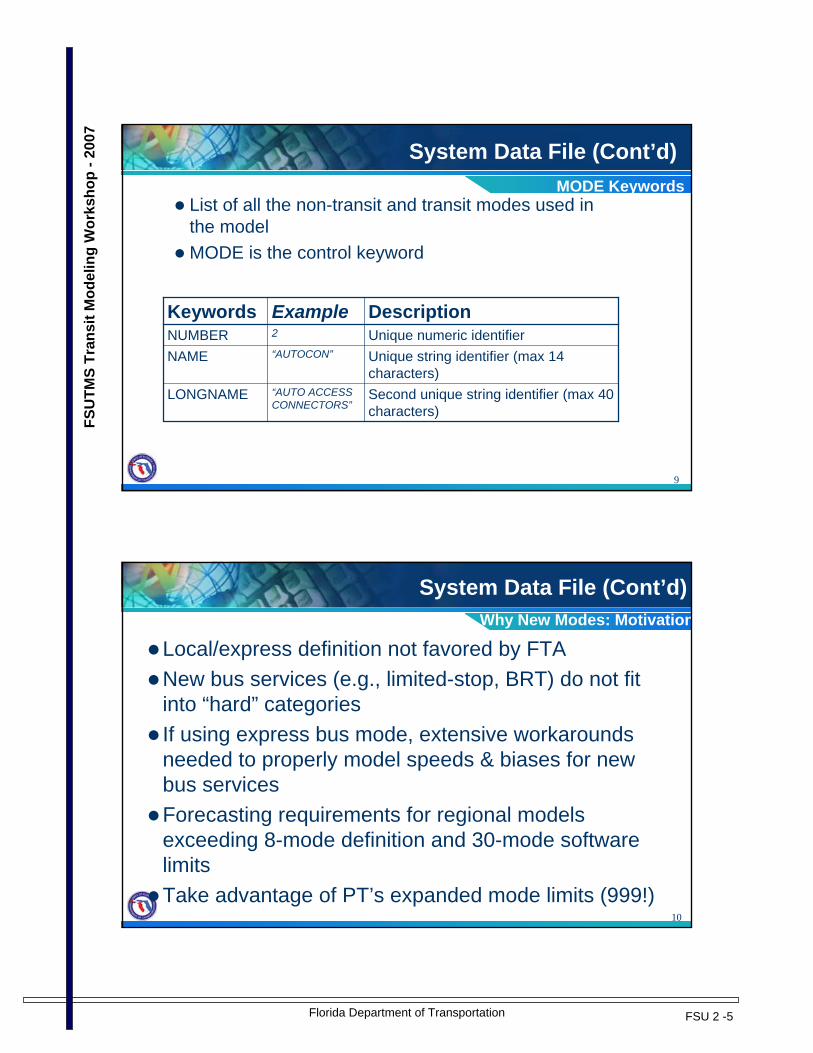
List of all the non-transit and transit modes used in the modelMODE is the control keyword
LONGNAME
NAMENUMBERKeywords
Second unique string identifier (max 40 characters)
“AUTO ACCESS CONNECTORS”
Unique string identifier (max 14 characters)
“AUTOCON”Unique numeric identifier 2
DescriptionExample
MODE Keywords
10
System Data File (Cont’d)
Local/express definition not favored by FTANew bus services (e.g., limited-stop, BRT) do not fit into “hard” categoriesIf using express bus mode, extensive workarounds needed to properly model speeds & biases for new bus services Forecasting requirements for regional models exceeding 8-mode definition and 30-mode software limitsTake advantage of PT’s expanded mode limits (999!)
Why New Modes: Motivation

Florida Department of Transportation FSU 2 -6
FSU
TMS
Tran
sit M
odel
ing
Wor
ksho
p -2
007
11
System Data File (Cont’d)
--
XFERCON
STATCON
--
ALLWALKCON
AUTOCON
WALKCON
NAME
--
TRANSFER CONNECTORS
STATION CONNECTORS
--
ALL WALK CONNECTORS
AUTO ACCESS CONNECTOR
WALK ACCESS CONNECTOR
LONGNAME
Auto access2
Other access connectors (for future uses)3, 5-10
13-20
12
11
4
1
Number
Other non-centroid connectors (for future uses)
Transfer connectors (“sidewalks”)
Fixed-guideway platform to street connectors
All walk access
Walk access/egress (centroid-to-stop & vice-versa)
Mode
Modal DefinitionsNon-Transit Modes
12
System Data File (Cont’d)
As needed41-47, 51-57, etc.
Same as 21-27, but for different operator (i.e., county)31-3727262524232221Number
Heavy rail transit (e.g., Metrorail)Commuter rail (e.g., TriRail)
Project mode (for planning studies)Other mode
Circulator (e.g., Metromover, Streetcar, Trolley)Bus rapid transit/premium busLocal & express busMode
Modal DefinitionsTransit Modes
Florida Department of Transportation FSU 2 -7
FSU
TMS
Tran
sit M
odel
ing
Wor
ksho
p -2
007
13
System Data File (Cont’d)
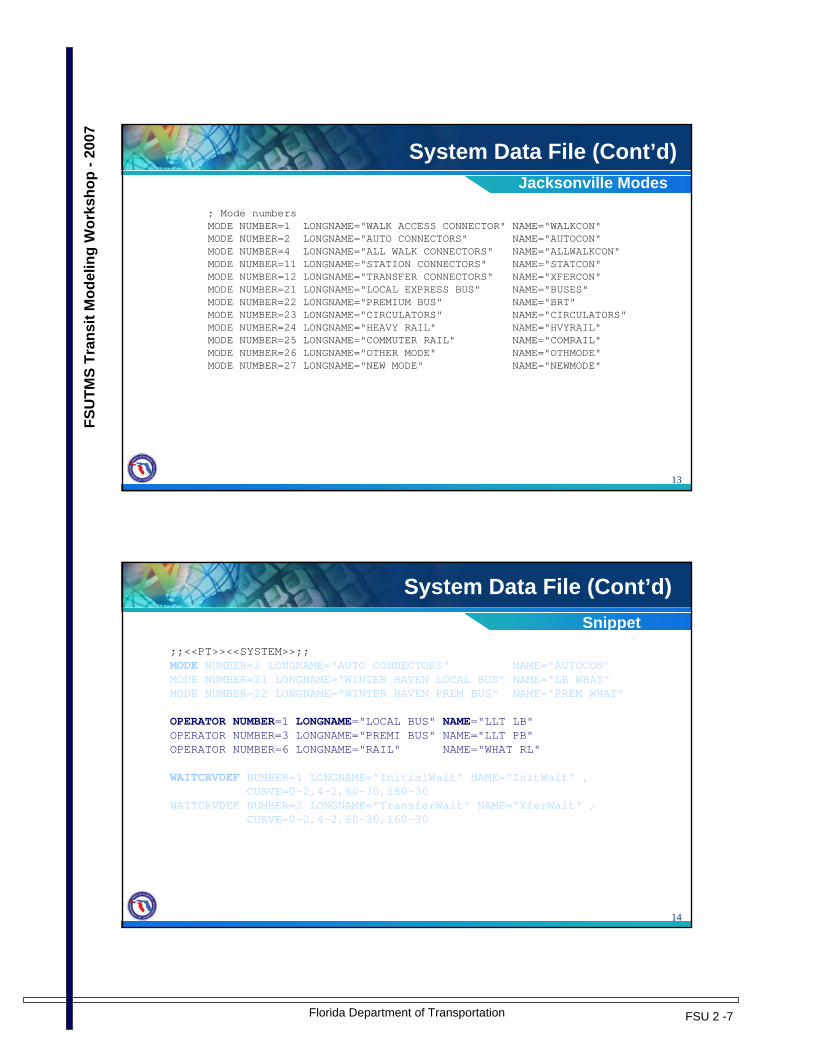
; Mode numbersMODE NUMBER=1 LONGNAME="WALK ACCESS CONNECTOR" NAME="WALKCON"MODE NUMBER=2 LONGNAME="AUTO CONNECTORS" NAME="AUTOCON"MODE NUMBER=4 LONGNAME="ALL WALK CONNECTORS" NAME="ALLWALKCON"MODE NUMBER=11 LONGNAME="STATION CONNECTORS" NAME="STATCON"MODE NUMBER=12 LONGNAME="TRANSFER CONNECTORS" NAME="XFERCON"MODE NUMBER=21 LONGNAME="LOCAL EXPRESS BUS" NAME="BUSES"MODE NUMBER=22 LONGNAME="PREMIUM BUS" NAME="BRT"MODE NUMBER=23 LONGNAME="CIRCULATORS" NAME="CIRCULATORS"MODE NUMBER=24 LONGNAME="HEAVY RAIL" NAME="HVYRAIL"MODE NUMBER=25 LONGNAME="COMMUTER RAIL" NAME="COMRAIL"MODE NUMBER=26 LONGNAME="OTHER MODE" NAME="OTHMODE"MODE NUMBER=27 LONGNAME="NEW MODE" NAME="NEWMODE"
Jacksonville Modes
14
System Data File (Cont’d)
;;<<PT>><<SYSTEM>>;;MODE NUMBER=2 LONGNAME="AUTO CONNECTORS" NAME="AUTOCON"MODE NUMBER=21 LONGNAME="WINTER HAVEN LOCAL BUS" NAME="LB WHAT"MODE NUMBER=22 LONGNAME="WINTER HAVEN PREM BUS" NAME="PREM WHAT"
OPERATOR NUMBER=1 LONGNAME="LOCAL BUS" NAME="LLT LB"OPERATOR NUMBER=3 LONGNAME="PREMI BUS" NAME="LLT PB"OPERATOR NUMBER=6 LONGNAME="RAIL" NAME="WHAT RL"
WAITCRVDEF NUMBER=1 LONGNAME="InitialWait" NAME="InitWait" ,CURVE=0-2,4-2,60-30,180-30
WAITCRVDEF NUMBER=2 LONGNAME="TransferWait" NAME="XferWait" ,CURVE=0-2,4-2,60-30,160-30
Snippet

Florida Department of Transportation FSU 2 -8
FSU
TMS
Tran
sit M
odel
ing
Wor
ksho
p -2
007
15
System Data File (Cont’d)
LONGNAMENAMENUMBER
Keywords
Second unique string identifier (40 characters)“JTA local bus”
Unique string identifier (14 characters)“JTALB”
Unique numeric identifier of the operator6
DescriptionExample
Should be defined by fare policy– Purpose similar to ‘Company’ in the Tranplan
models– A limit of 999 on OPERATOR numbersAssigned to every transit lines
OPERATOR Keywords
16
System Data File (Cont’d)
; Operator numbersOPERATOR NUMBER=1 LONGNAME="JTA LOCAL BUSES" NAME="JTALB"OPERATOR NUMBER=2 LONGNAME="JTA EXPRESS BUSES" NAME="JTAEB"OPERATOR NUMBER=3 LONGNAME="JTA PREMIUM BUSES" NAME="JTAPB"OPERATOR NUMBER=4 LONGNAME="JTA HEAVY RAIL" NAME="JTAHR"OPERATOR NUMBER=5 LONGNAME="JTA COMMUTER RAIL" NAME="JTACR"OPERATOR NUMBER=6 LONGNAME="JTA TROLLEY" NAME="JTATRL"OPERATOR NUMBER=7 LONGNAME="JTA SKYWAY" NAME="JTASKY"
• OPERATOR defined for the Skyway
LINE NAME="ASE-1", MODE=23, LONGNAME="ASE FCCJ-TERMINAL",HEADWAY[1]=5, HEADWAY[2]=5, OPERATOR=7, USERA1="TROLLEY",USERA3="Bus 901", USERA2="M5L002", ONEWAY=F, CIRCULAR=F,N=80001, 80002, 80003, 80004, 80005
Example OperatorsJacksonville:
Florida Department of Transportation FSU 2 -9
FSU
TMS
Tran
sit M
odel
ing
Wor
ksho
p -2
007
17
;;<<PT>><<SYSTEM>>;;MODE NUMBER=2 LONGNAME="AUTO CONNECTORS" NAME="AUTOCON"MODE NUMBER=21 LONGNAME="WINTER HAVEN LOCAL BUS" NAME="LB WHAT"MODE NUMBER=22 LONGNAME="WINTER HAVEN PREM BUS" NAME="PREM WHAT"
OPERATOR NUMBER=1 LONGNAME="LOCAL BUS" NAME="LLT LB"OPERATOR NUMBER=3 LONGNAME="PREMI BUS" NAME="LLT PB"OPERATOR NUMBER=6 LONGNAME="RAIL" NAME="WHAT RL"
WAITCRVDEF NUMBER=1 LONGNAME="InitialWait" NAME="InitWait" ,CURVE=0-2,4-2,60-30,180-30
WAITCRVDEF NUMBER=2 LONGNAME="TransferWait" NAME="XferWait" ,CURVE=0-2,4-2,60-30,160-30
System Data File (Cont’d)Snippet
18
System Data File (Cont’d)
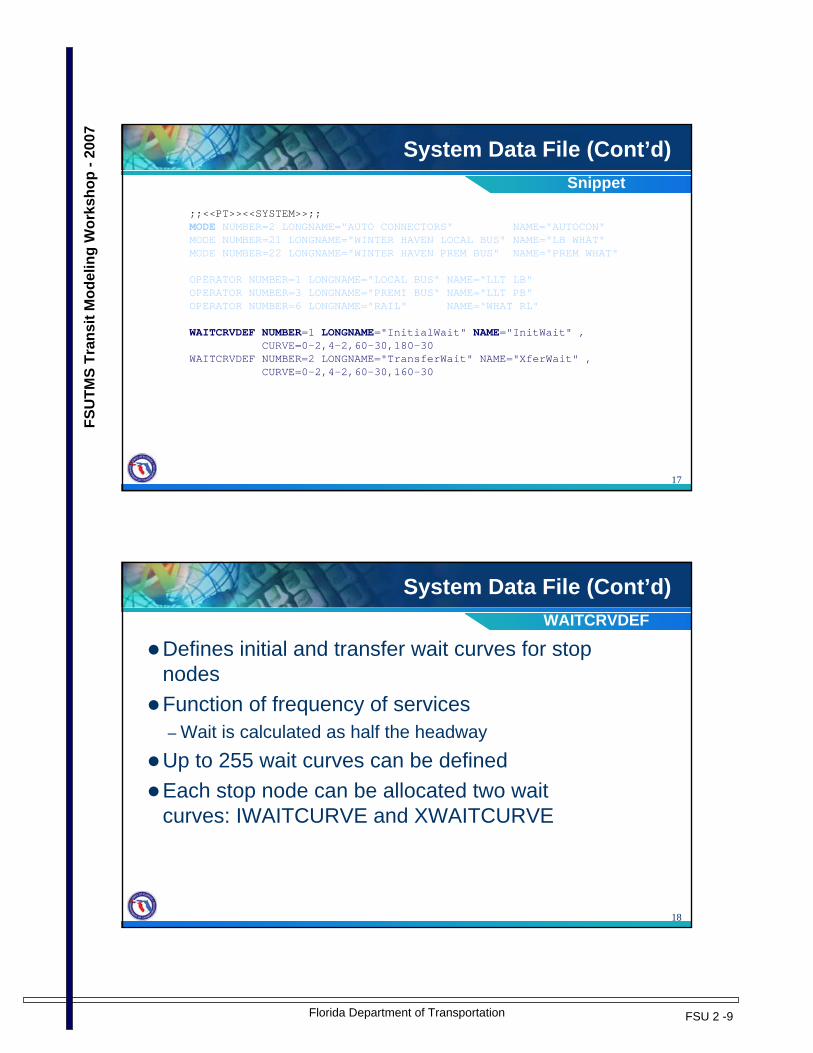
Defines initial and transfer wait curves for stop nodesFunction of frequency of services– Wait is calculated as half the headwayUp to 255 wait curves can be definedEach stop node can be allocated two wait curves: IWAITCURVE and XWAITCURVE
WAITCRVDEF
Florida Department of Transportation FSU 2 -10
FSU
TMS
Tran
sit M
odel
ing
Wor
ksho
p -2
007
19
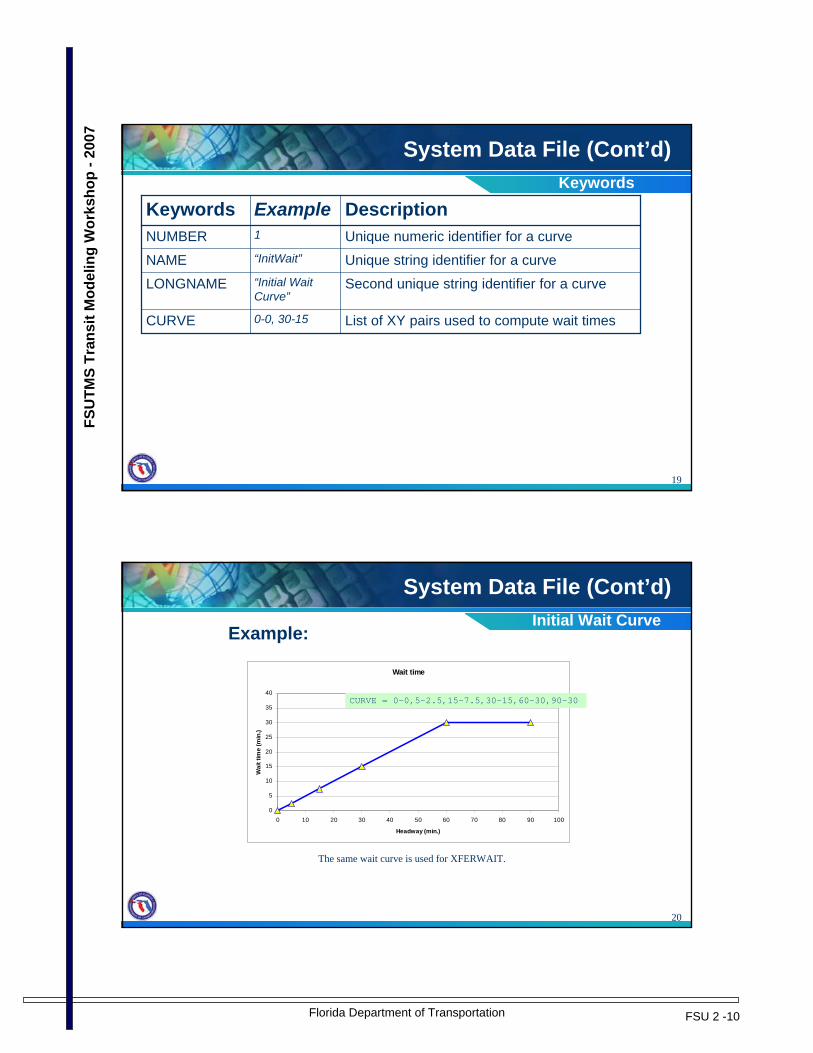
System Data File (Cont’d)
0-0, 30-15
“Initial Wait Curve”
“InitWait”
1
Example
CURVE
LONGNAME
NAME
NUMBER
Keywords
List of XY pairs used to compute wait times
Second unique string identifier for a curve
Unique string identifier for a curve
Unique numeric identifier for a curve
DescriptionKeywords
20
System Data File (Cont’d)
Wait time
0
5
10
15
20
25
30
35
40
0 10 20 30 40 50 60 70 80 90 100
Headway (min.)
Wai
t tim
e (m
in.)
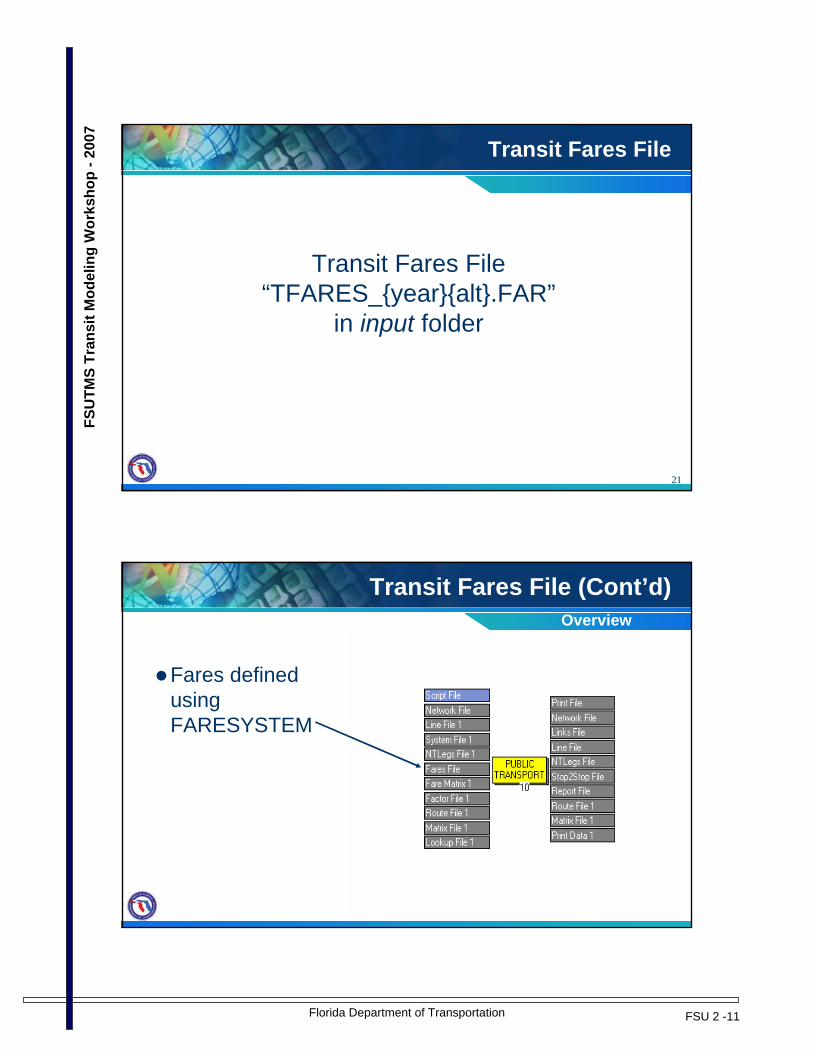
CURVE = 0-0,5-2.5,15-7.5,30-15,60-30,90-30
Initial Wait CurveExample:
The same wait curve is used for XFERWAIT.
Florida Department of Transportation FSU 2 -11
FSU
TMS
Tran
sit M
odel
ing
Wor
ksho
p -2
007
21
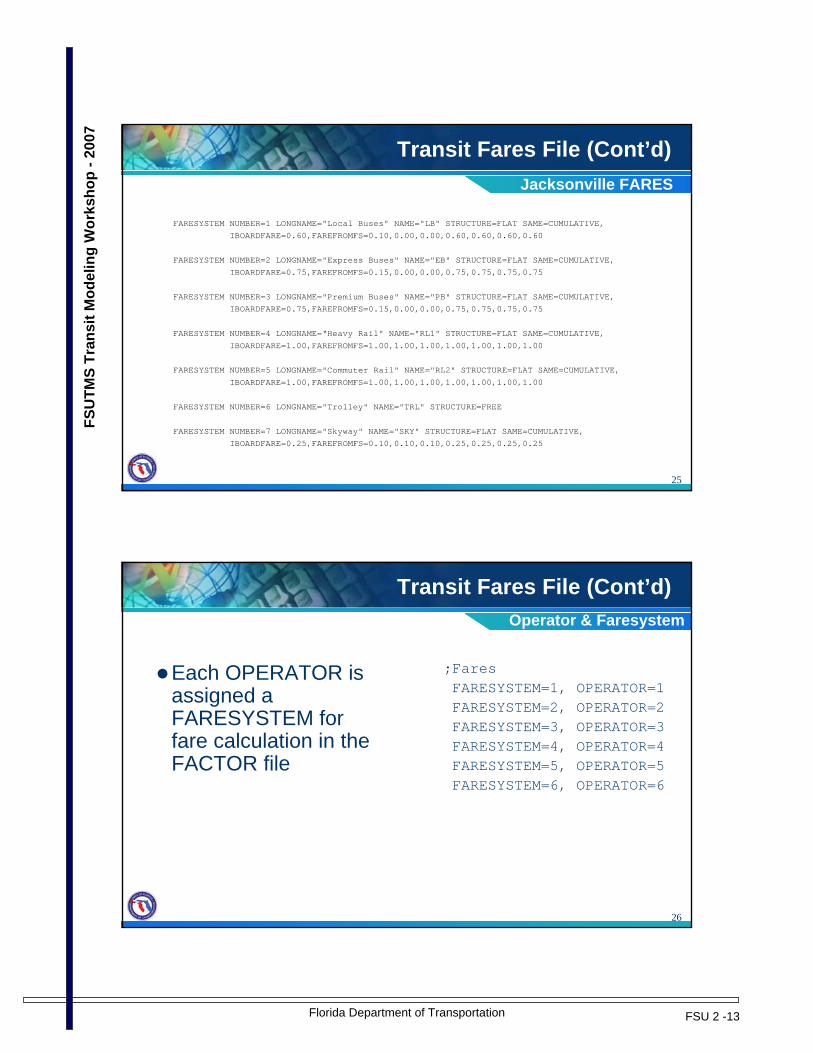
Transit Fares File
Transit Fares File“TFARES_{year}{alt}.FAR”
in input folder
22
Transit Fares File (Cont’d)
Fares defined using FARESYSTEM
Overview

Florida Department of Transportation FSU 2 -12
FSU
TMS
Tran
sit M
odel
ing
Wor
ksho
p -2
007
23
Transit Fares File (Cont’d)
None14-character descriptionNAME
n/a (free); None (flat & zone-based fares)
Transfer fare (in dollars) when transferring from other FARESYSTEMs
FAREFROMFS
n/a (free); None (flat & zone-based fares)
Initial boarding fare (in dollars)IBOARDFARE
n/a (free); “CUMULATIVE” (flat and zone-based)
Determine how the fare is produced for consecutive legs using the same fare system
SAME
“FREE” (free), “FLAT” (flat), “ACCUMULATE” (zone-based)
Type of fare systemSTRUCTURENone40-character descriptionLONGNAME
NoneFare System numberNUMBERValueDescriptionKeywords
FARESYSTEM Settings
24
Transit Fares File (Cont’d)
Three major structures to be used in Florida– Flat
Journey length is irrelevant (e.g. Most bus systems in Florida)
– Free Systems giving free rides (e.g. LYMMO service in Orlando, Jacksonville trolley)
– Zone-based Only when FAREZONES is specified (e.g. Tri-rail)
Structure
Florida Department of Transportation FSU 2 -13
FSU
TMS
Tran
sit M
odel
ing
Wor
ksho
p -2
007
25
Transit Fares File (Cont’d)
FARESYSTEM NUMBER=1 LONGNAME="Local Buses" NAME="LB" STRUCTURE=FLAT SAME=CUMULATIVE,IBOARDFARE=0.60,FAREFROMFS=0.10,0.00,0.00,0.60,0.60,0.60,0.60
FARESYSTEM NUMBER=2 LONGNAME="Express Buses" NAME="EB" STRUCTURE=FLAT SAME=CUMULATIVE,
IBOARDFARE=0.75,FAREFROMFS=0.15,0.00,0.00,0.75,0.75,0.75,0.75
FARESYSTEM NUMBER=3 LONGNAME="Premium Buses" NAME="PB" STRUCTURE=FLAT SAME=CUMULATIVE,IBOARDFARE=0.75,FAREFROMFS=0.15,0.00,0.00,0.75,0.75,0.75,0.75
FARESYSTEM NUMBER=4 LONGNAME=“Heavy Rail" NAME="RL1" STRUCTURE=FLAT SAME=CUMULATIVE,IBOARDFARE=1.00,FAREFROMFS=1.00,1.00,1.00,1.00,1.00,1.00,1.00
FARESYSTEM NUMBER=5 LONGNAME="Commuter Rail" NAME="RL2" STRUCTURE=FLAT SAME=CUMULATIVE,
IBOARDFARE=1.00,FAREFROMFS=1.00,1.00,1.00,1.00,1.00,1.00,1.00
FARESYSTEM NUMBER=6 LONGNAME="Trolley" NAME="TRL" STRUCTURE=FREE
FARESYSTEM NUMBER=7 LONGNAME="Skyway" NAME="SKY" STRUCTURE=FLAT SAME=CUMULATIVE,IBOARDFARE=0.25,FAREFROMFS=0.10,0.10,0.10,0.25,0.25,0.25,0.25
Jacksonville FARES
26
Transit Fares File (Cont’d)
Each OPERATOR is assigned a FARESYSTEM for fare calculation in the FACTOR file
;Fares FARESYSTEM=1, OPERATOR=1FARESYSTEM=2, OPERATOR=2FARESYSTEM=3, OPERATOR=3FARESYSTEM=4, OPERATOR=4FARESYSTEM=5, OPERATOR=5FARESYSTEM=6, OPERATOR=6
Operator & Faresystem

Florida Department of Transportation FSU 2 -14
FSU
TMS
Tran
sit M
odel
ing
Wor
ksho
p -2
007
27
Factors File
Factors File{Access}{Mode}.FAC (e.g. WalkBus.FAC)
in output folder
28
Factors File (Cont’d)
One file for each pathDefines path-building parameters
Overview
Florida Department of Transportation FSU 2 -15
FSU
TMS
Tran
sit M
odel
ing
Wor
ksho
p -2
007
29
Factors File (Cont’d)
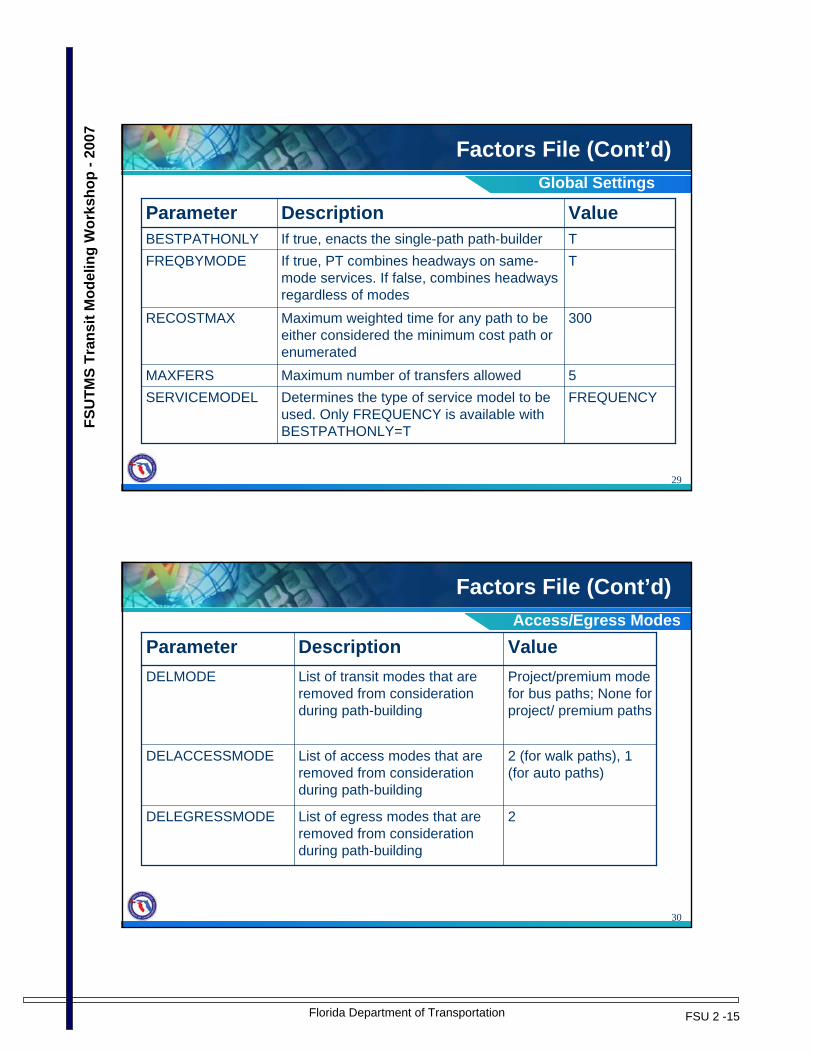
FREQUENCYDetermines the type of service model to be used. Only FREQUENCY is available with BESTPATHONLY=T
SERVICEMODEL5Maximum number of transfers allowedMAXFERS
300Maximum weighted time for any path to be either considered the minimum cost path or enumerated
RECOSTMAX
TIf true, PT combines headways on same-mode services. If false, combines headways regardless of modes
FREQBYMODETIf true, enacts the single-path path-builderBESTPATHONLY
ValueDescriptionParameterGlobal Settings
30
Factors File (Cont’d)
2List of egress modes that are removed from consideration during path-building
DELEGRESSMODE
2 (for walk paths), 1 (for auto paths)
List of access modes that are removed from consideration during path-building
DELACCESSMODE
Project/premium mode for bus paths; None for project/ premium paths
List of transit modes that are removed from consideration during path-building
DELMODE
ValueDescriptionParameterAccess/Egress Modes

Florida Department of Transportation FSU 2 -16
FSU
TMS
Tran
sit M
odel
ing
Wor
ksho
p -2
007
31
Factors File (Cont’d)
2.00 for all nodesNode-specific wait time weighting factorWAITFACTOR
1 (all other non-centroid nodes)
The curve number (defined in System Data File) to be used for the transfer wait time at specified nodes
XWAITCURVE
1 (all other non-centroid nodes)
The curve number (defined in System Data File) to be used for the initial wait time at specified nodes
IWAITCURVE
n/aFARESYSTEM number that will apply to the OPERATOR
FARESYSTEM
ValueDescriptionParameterFare/Wait Times
32
Factors File (Cont’d)
Factors applied using RUNFACTOR[#]– ‘#’ refers to the MODE number
25, 35 etc..
21-24,26,27 etc..21, 4, 11, 12
Modes
0.80Commuter rail
1.00All transit modes (except commuter rail)1.00Drive access modes2.00Walk access modes
ValueDescription
RUNFACTORS

Florida Department of Transportation FSU 2 -17
FSU
TMS
Tran
sit M
odel
ing
Wor
ksho
p -2
007
33
Factors File (Cont’d)
1.00 (all transit modes to all transit modes)
Transit mode to transit mode transfer weighting factor for transfer penalty
XFERFACTOR
5.00 (all transit modes to all transit modes)
Transit mode to transit mode constant added to XFERPEN
XFERCONST
0.00 (all transit modes to all transit modes)
Transit mode to transit mode transfer penalty in minutes
XFERPEN
2.00 Penalty applied to boarding of a transit mode (in minutes)
BRDPEN (all transit modes)
ValueDescriptionParameter
Other keywords are not used in the FACTOR file
Boarding/Transfer
34
Factors File (Cont’d)
Continued on next slide…
Jacksonville Example

Florida Department of Transportation FSU 2 -18
FSU
TMS
Tran
sit M
odel
ing
Wor
ksho
p -2
007
35
Factors File (Cont’d)Example (Cont’d)
Continued from previous slide.
36
Another way of developing FACTOR files

Florida Department of Transportation FSU 2 -19
FSU
TMS
Tran
sit M
odel
ing
Wor
ksho
p -2
007
37
Game
Game 2.1Tic-Tac-Toe
38
Computer Exercises
Understanding PT
Lesson 2

Florida Department of Transportation FSU 2 -20
FSU
TMS
Tran
sit M
odel
ing
Wor
ksho
p -2
007
39
Lesson 2 Exercises
In this exercise you will complete the following:2.1 – Create a System Data File2.2 – Create a PT Fares File2.3 – Create a Factors File
40
Begin Exercises
If you have any problems or questions - please contact one of the instructors
Florida Department of Transportation FSU 2 -21
FSU
TMS
Tran
sit M
odel
ing
Wor
ksho
p -2
007
41
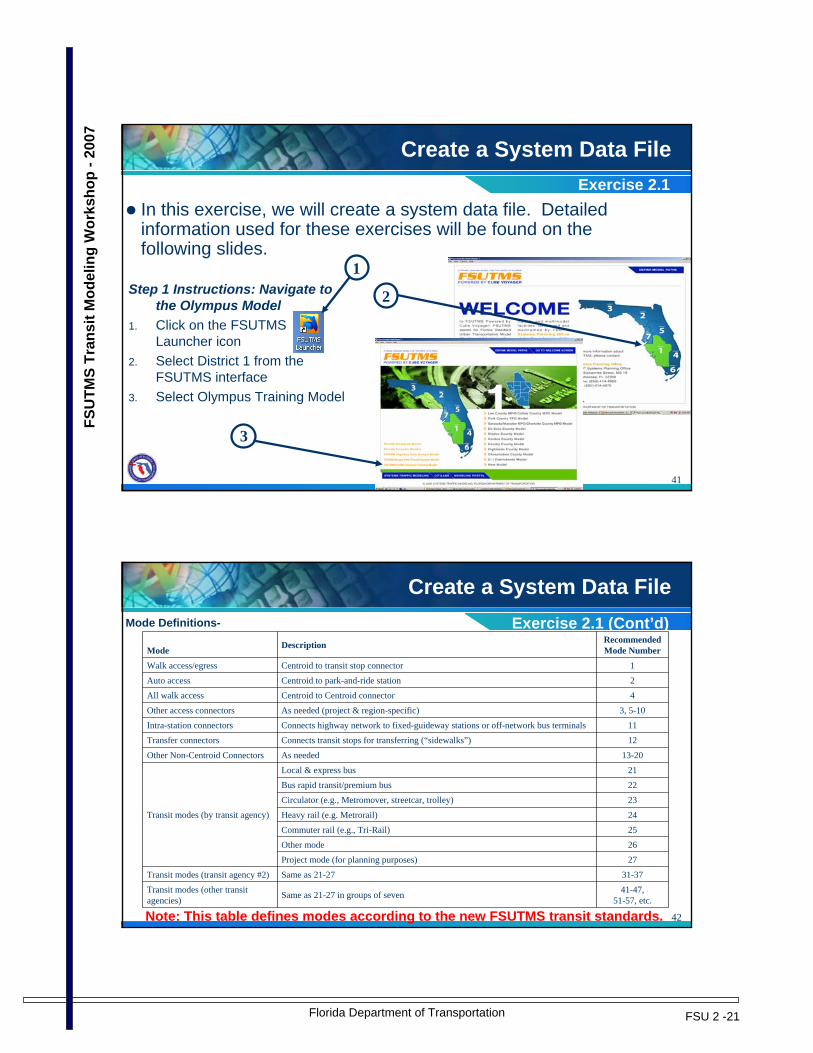
Create a System Data FileExercise 2.1
In this exercise, we will create a system data file. Detailed information used for these exercises will be found on the following slides.
Step 1 Instructions: Navigate to the Olympus Model
1. Click on the FSUTMS Launcher icon
2. Select District 1 from the FSUTMS interface
3. Select Olympus Training Model
2
3
1
42
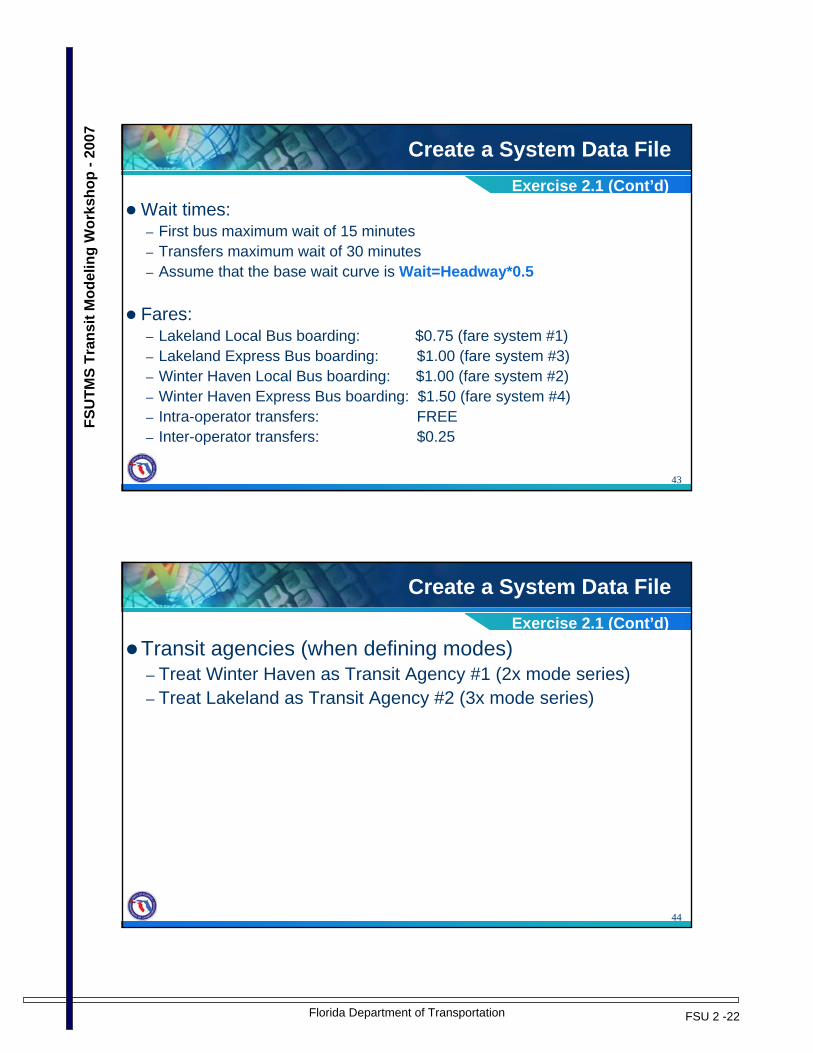
Create a System Data FileExercise 2.1 (Cont’d)
Note: This table defines modes according to the new FSUTMS transit standards.
Mode Definitions-
4Centroid to Centroid connectorAll walk access
41-47, 51-57, etc.Same as 21-27 in groups of sevenTransit modes (other transit
agencies)
31-37Same as 21-27Transit modes (transit agency #2)
27Project mode (for planning purposes)26Other mode25Commuter rail (e.g., Tri-Rail)24Heavy rail (e.g. Metrorail)
23Circulator (e.g., Metromover, streetcar, trolley)22Bus rapid transit/premium bus21Local & express bus
Transit modes (by transit agency)
13-20As neededOther Non-Centroid Connectors
12Connects transit stops for transferring (“sidewalks”)Transfer connectors11Connects highway network to fixed-guideway stations or off-network bus terminalsIntra-station connectors
3, 5-10As needed (project & region-specific)Other access connectors
2Centroid to park-and-ride station Auto access
1Centroid to transit stop connectorWalk access/egress
Recommended Mode NumberDescriptionMode
Florida Department of Transportation FSU 2 -22
FSU
TMS
Tran
sit M
odel
ing
Wor
ksho
p -2
007
43
Create a System Data File
Wait times:– First bus maximum wait of 15 minutes– Transfers maximum wait of 30 minutes– Assume that the base wait curve is Wait=Headway*0.5
Fares:– Lakeland Local Bus boarding: $0.75 (fare system #1)– Lakeland Express Bus boarding: $1.00 (fare system #3)– Winter Haven Local Bus boarding: $1.00 (fare system #2)– Winter Haven Express Bus boarding: $1.50 (fare system #4)– Intra-operator transfers: FREE– Inter-operator transfers: $0.25
Exercise 2.1 (Cont’d)
44
Create a System Data File
Transit agencies (when defining modes)– Treat Winter Haven as Transit Agency #1 (2x mode series)– Treat Lakeland as Transit Agency #2 (3x mode series)
Exercise 2.1 (Cont’d)
Florida Department of Transportation FSU 2 -23
FSU
TMS
Tran
sit M
odel
ing
Wor
ksho
p -2
007
45
Create a System Data File
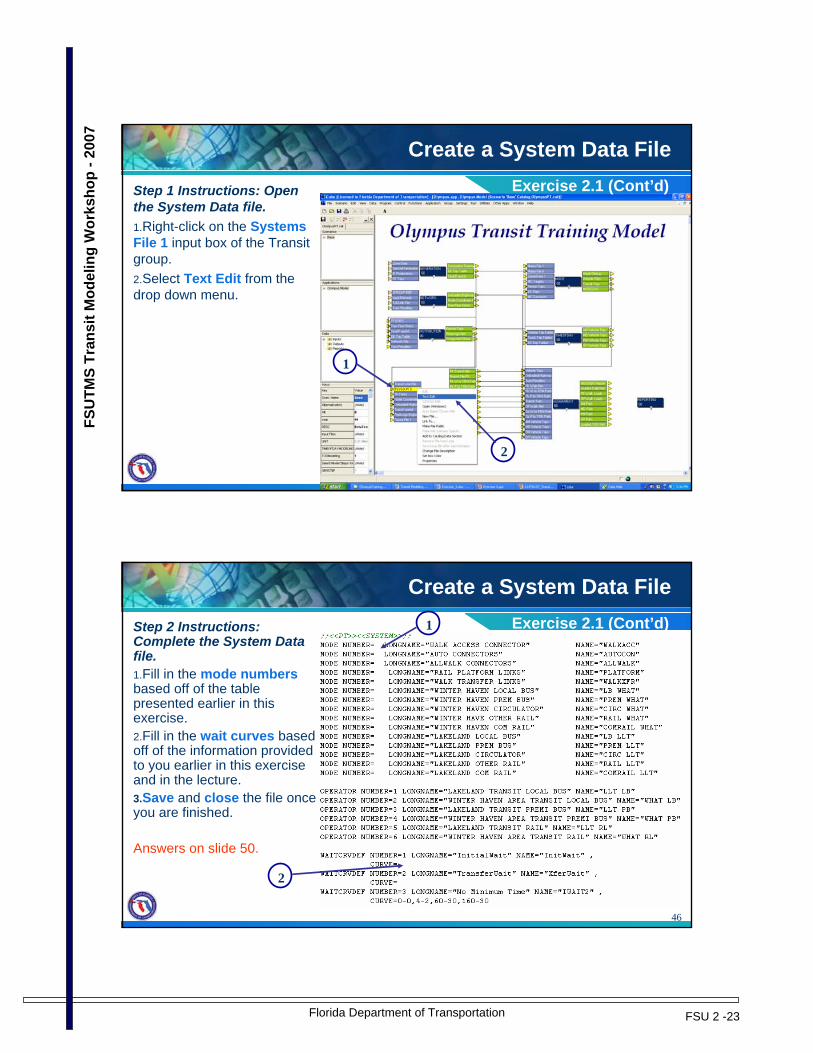
Step 1 Instructions: Open the System Data file.1.Right-click on the Systems File 1 input box of the Transit group.2.Select Text Edit from the drop down menu.
2
1
Exercise 2.1 (Cont’d)
46
Create a System Data FileStep 2 Instructions: Complete the System Data file.1.Fill in the mode numbersbased off of the table presented earlier in this exercise.2.Fill in the wait curves based off of the information provided to you earlier in this exercise and in the lecture.3.Save and close the file once you are finished.
Answers on slide 50.
2
1 Exercise 2.1 (Cont’d)

Florida Department of Transportation FSU 2 -24
FSU
TMS
Tran
sit M
odel
ing
Wor
ksho
p -2
007
47
Create a PT Fares File
Step 1 Instructions: Open the Fares file.1.Double-click on the PK Faresinput box of the Transit group.
1
Exercise 2.2
48
Create a PT Fares File
Step 2 Instructions: Complete the Fares file.1.Using the fare information provided on slide 41 code the correct fare data. Note: IBOARDFARE is the initial boarding fare. FAREFROMFS is the transfer fare between or within the same operator to the other numbered fare systems. Assume six different operators by mode, as specified on slide 41.2.Save and close the file once you are finished.
1
Exercise 2.2 (Cont’d)
Answers on slide 51.

Florida Department of Transportation FSU 2 -25
FSU
TMS
Tran
sit M
odel
ing
Wor
ksho
p -2
007
49
Create a PT Factors File
Step 1 Instructions: Open the Factors File file.1.Double-click on the Factor A to TRN input box of the Transit group. This is FACTOR file for auto access transit trips.2.Using Windows Explorer, go to the C:\FSUTMS\general\Olympus\doc folder and open the Florida_Transit_ Model_-_Application_ Framework.pdf file.
1
Exercise 2.3
50
Create a PT Factors File
Step 2 Instructions: Complete the Factors file.1.Using the fare information provided in the Florida_Transit_Model_-_Application_Framework.pdffile and explanations provided in the lecture slides, fill in the missing values in the factors file..2.Save and close the file once you are finished.
Exercise 2.3 (Cont’d)
Answers on slide 52-54.
1
2

Florida Department of Transportation FSU 2 -26
FSU
TMS
Tran
sit M
odel
ing
Wor
ksho
p -2
007
51
Create a PT Factors File
Bonus Exercises:1. How will you incorporate that fact that the waiting pattern at the transit center
is different from stops in rest of the region? For example, at the transit center people wait no more than 10 minutes.
2. Develop a wait curve assuming that instead of the wait square root of headway.
3. Fill in the blanks questions:– Keeping in mind the recent FDOT recommendations for folder
structure, SYSTEM.PTS file is in a folder named ___________________.
– RUNFACTOR for PNR and KNR connectors used in the FACTORS file is __________________.
Bonus Exercise
52
Create a System Data File-Answer KeyExercise 2.1 (Answer)
12411122122232425
32333435
31
0-2,4-2,60-30,180-30
0-2,4-2,60-30,180-30

Florida Department of Transportation FSU 2 -27
FSU
TMS
Tran
sit M
odel
ing
Wor
ksho
p -2
007
53
Create a PT Fares File-Answer KeyExercise 2.2 (Answer)
0.75,
1.00,
1.00,
0.00,0.25,0.00,0.25,0.00,0.25
0.25,0.00,0.25,0.00,0.25,0.00
0.25,0.00,0.25,0.00,0.25,0.00
0.00,0.25,0.00,0.25,0.00,0.25
1.50,
54
Create a PT Factors File-Answer Key
Answers:BESTPATHONLY=TMAXFERS=5SERVICEMODEL=FREQUENCYRECOSTMAX=300.0FREQBYMODE=TDELACCESSMODE=1DELEGRESSMODE=2
Exercise 2.3 (Answer)

Florida Department of Transportation FSU 2 -28
FSU
TMS
Tran
sit M
odel
ing
Wor
ksho
p -2
007
55
Create a PT Factors File-Answer Key ContinuedAnswers:RUNFACTOR[1]=2.00RUNFACTOR[2]=1.00RUNFACTOR[11]=1.00RUNFACTOR[12]=1.00RUNFACTOR[21]=1.00RUNFACTOR[22]=1.00RUNFACTOR[23]=1.00RUNFACTOR[24]=1.00RUNFACTOR[25]=0.80RUNFACTOR[31]=1.00RUNFACTOR[32]=1.00RUNFACTOR[33]=1.00RUNFACTOR[34]=1.00RUNFACTOR[35]=0.80
Exercise 2.3 (Answer)
56
Create a PT Factors File-Answer Key Continued
Answers:BRDPEN[21]=2.00BRDPEN[22]=2.00BRDPEN[23]=2.00BRDPEN[24]=2.00BRDPEN[25]=2.00BRDPEN[31]=2.00BRDPEN[32]=2.00BRDPEN[33]=2.00BRDPEN[34]=2.00BRDPEN[35]=2.00
Exercise 2.3 (Answer)

Florida Department of Transportation FSU 2 -29
FSU
TMS
Tran
sit M
odel
ing
Wor
ksho
p -2
007
57Lesson 1 – Workshop Introduction
End of Lesson 2Close all files and return to the Desktop and Stop.
58
Summary
In this lesson, we covered:System Data FileFares FileFactors File

Florida Department of Transportation FSU 3 -1
FS
UT
MS
Tra
nsit
Mod
elin
g W
orks
hop
-20
07
1
Let’s Hack the Net!(Transit Network)
Lesson 3
2
Lesson Goals
In this lesson we will cover :
�Overview of Transit Coding�Editing Transit Lines�Transit Speeds

Florida Department of Transportation FSU 3 -2
FS
UT
MS
Tra
nsit
Mod
elin
g W
orks
hop
-20
07
3
What is Transit Coding?
Modeling of a real transit system – Winter Haven
4
Transit Coding in PT
�Structure similar to INET– No line numbers or reference lines!– Stops “positive”; non-stops “negative”
�Coding of non-transit modes no longer workable�Multiple headways per line → single file�Flexible in-line coding
– layovers, access/ egress-only stops, circulator coding– Allows double stops – Complex routings…

Florida Department of Transportation FSU 3 -3
FS
UT
MS
Tra
nsit
Mod
elin
g W
orks
hop
-20
07
5
Line Attributes
�Up to seven line files can be input– Only one is used for Florida– File is named TROUTE_{year}{alt}.LIN– Placed in input folder
�A transit route in PT is identified by its NAME– Mode number and line number in Tranplan
�File Header – ;;<<PT>><<LINE>>;;
�LINE – control keyword for a route
6
Line Attributes (Cont’d)
List of nodes the line traverses80001, 80002N
Operator of the line / Used for fare calculation7OPERATOR
Factor for link travel time calculation1.00TIMEFAC
Whether the line is circular / Same first and last nodes / No boarding and transfer penalty and waiting time applied at this node
FCIRCULAR
Frequency of service / Specified in minutes / Up to 5 periods / HDWAYPERIOD
5HEADWAY[#]
Specifies if the LINE traverses in one directionFONEWAY
Mode number23MODE
Second Unique string identifier (40 characters)“SKYWAY Kings Ave”
LONGNAME
Unique string identifier (14 characters)“ASE-1”NAME
DescriptionExampleKeyword

Florida Department of Transportation FSU 3 -4
FS
UT
MS
Tra
nsit
Mod
elin
g W
orks
hop
-20
07
7
Snippet (LINE)
;;<<PT>><<LINE>>;;LINE NAME="AR-1 WB", LONGNAME="University Park WB", HEADWAY[1]=25,
HEADWAY[2]=45, MODE=21, ONEWAY=T, OPERATOR=1, USERA3="Bus 301",USERA2="M4L041", USERA1="LOCAL", CIRCULAR=F, N=46996, 46999,46995, -47266, -47416, -47550, 47628, 47663, -47758 , -47818,-47913, -48007, -48111, 48244, -48477, -48530, -486 86, 49070,-49157, -49288, -49451, -49508, -49555, -49628, 496 51, 49657,-49659, 49665, 49664, -49660, -49669, -49683, -4969 0, -49689,…………………..-74373, -74359, -42001, -42169, -74360, -74362, -42 202, -42243,-42285, -42338, -42394, 42461, -42497, 42492, -4213 6, 42014,-41641, -41443, 41018, 40670, -40531, -40495, -4042 9, -39768,-39515, 39303, 39115, 38863, -38752, 38635, -38546, 38422,-38405, -38394, -38296, -38210, -38069, 37873, -377 86, 37650,-37515, 37401, -37303, 37203, -37122, 37031, -36932 , -36844,-36868, -36892, -36906, -36918, -36926, -36933, -36 947, 36964,-36988, 36995, 37034, 37063, -37096, -37134, -37209 , -37311,-37405, -37519, -37658, -37784, -37872, 38041
LINE NAME="ASE-2", MODE=23, LONGNAME="ASE Kings Ave Station",HEADWAY[1]=5, HEADWAY[2]=5, OPERATOR=7, USERA1="TRO LLEY",USERA3="Bus 902", USERA2="M5L001", ONEWAY=F, CIRCUL AR=F,N=80001, 80002, 80003, 80006, 80007, 80008
8
Coding Complex Routes
Florida Department of Transportation FSU 3 -5
FS
UT
MS
Tra
nsit
Mod
elin
g W
orks
hop
-20
07
9
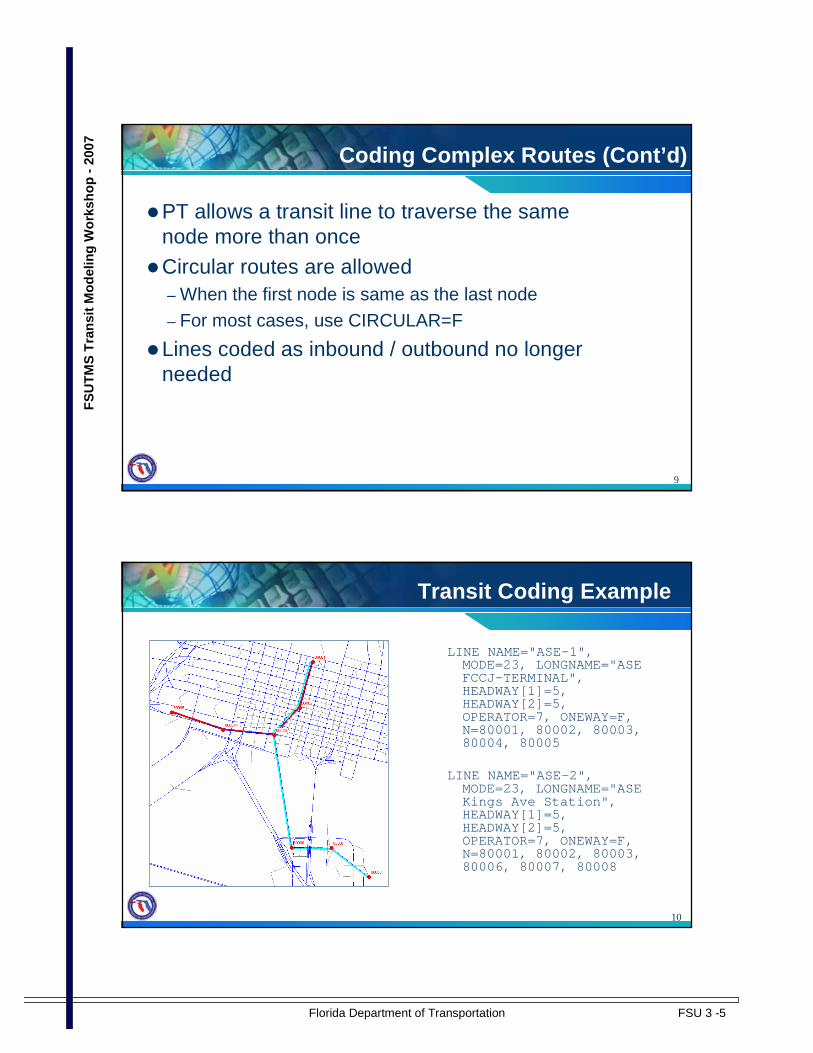
Coding Complex Routes (Cont’d)
�PT allows a transit line to traverse the same node more than once
�Circular routes are allowed– When the first node is same as the last node– For most cases, use CIRCULAR=F
�Lines coded as inbound / outbound no longer needed
10
Transit Coding Example
LINE NAME="ASE-1", MODE=23, LONGNAME="ASE FCCJ-TERMINAL", HEADWAY[1]=5, HEADWAY[2]=5, OPERATOR=7, ONEWAY=F, N=80001, 80002, 80003, 80004, 80005
LINE NAME="ASE-2", MODE=23, LONGNAME="ASE Kings Ave Station", HEADWAY[1]=5, HEADWAY[2]=5, OPERATOR=7, ONEWAY=F, N=80001, 80002, 80003, 80006, 80007, 80008
Florida Department of Transportation FSU 3 -6
FS
UT
MS
Tra
nsit
Mod
elin
g W
orks
hop
-20
07
11
Transit Coding Norms
�Make sure that there are stops at the centroidconnectors and major intersections
�Buses should not stop– On the freeway– On interchange ramp and bridges– On ramp terminals
12
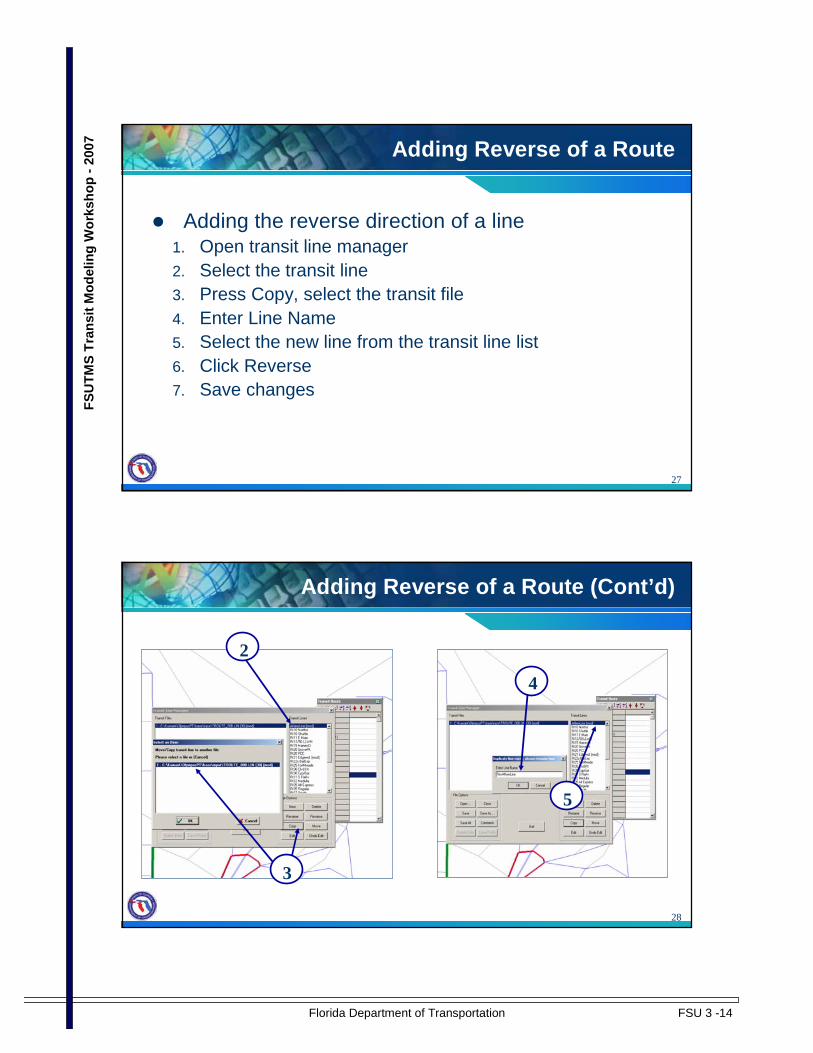
Editing Transit Lines

Florida Department of Transportation FSU 3 -7
FS
UT
MS
Tra
nsit
Mod
elin
g W
orks
hop
-20
07
13
Topics
� In this lesson we will cover :– Opening transit line file in CUBE– Transit line control functions– Modifying an existing transit line
• Using CUBE editor• Using ASCII editor
– Adding a new route– Extending a route– Adding reverse of a route– Modifying routes when highway network is changed
14
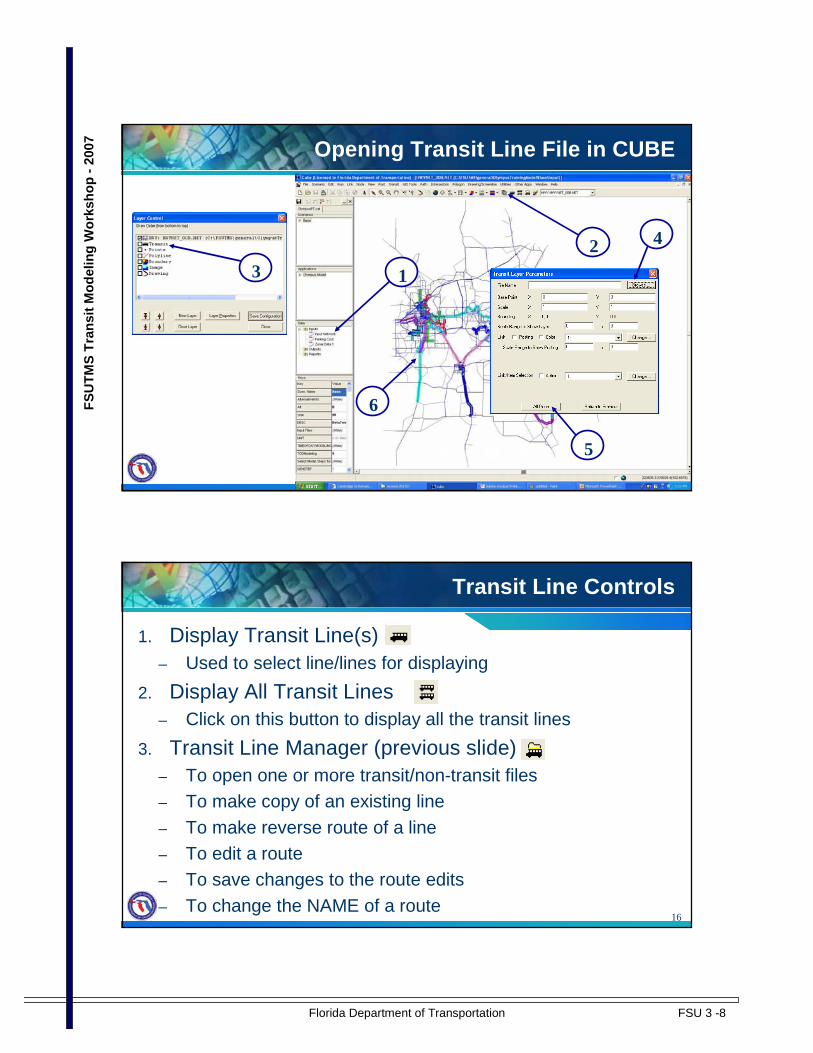
Opening Transit Line File in CUBE
1. Open the Highway Network in Voyager2. Click on layer control3. Double-click on Transit (see figure on next slide)4. A dialog box opens, browse the transit line file
(*.LIN)5. Click ‘All Done’6. All the routes in the line file are displayed
Florida Department of Transportation FSU 3 -8
FS
UT
MS
Tra
nsit
Mod
elin
g W
orks
hop
-20
07
15
Opening Transit Line File in CUBE
1
23
4
5
6
16
Transit Line Controls
1. Display Transit Line(s)– Used to select line/lines for displaying
2. Display All Transit Lines– Click on this button to display all the transit lines
3. Transit Line Manager (previous slide)– To open one or more transit/non-transit files– To make copy of an existing line– To make reverse route of a line– To edit a route– To save changes to the route edits– To change the NAME of a route

Florida Department of Transportation FSU 3 -9
FS
UT
MS
Tra
nsit
Mod
elin
g W
orks
hop
-20
07
17
Transit Line Controls
2
31
18
Modifying an Existing Transit Line
1. Make sure that the top layer is transit layer2. Click on a route to edit3. Double-click on the node where you want to start
editing– The color of the line changes
4. Click on all the stop nodes on the route– Remaining nodes are non-stop transit nodes
5. Click on Esc when the last node is reached and save changes
6. Close Voyager, click on yes when asked whether you want to save changes to the transit line file(s)

Florida Department of Transportation FSU 3 -10
FS
UT
MS
Tra
nsit
Mod
elin
g W
orks
hop
-20
07
19
Modifying an Existing Transit Line
2
3
1
20
Modifying an Existing Transit Line
4
56

Florida Department of Transportation FSU 3 -11
FS
UT
MS
Tra
nsit
Mod
elin
g W
orks
hop
-20
07
21
Modifying an Existing Line with Text Editor
�The line file can also be modified by opening it using a text editor– Desired when minor changes are required– The comments can be saved wherever desired
�CUBE-Voyager moves all the comment lines at the beginning of the file
22
Adding a New Route
A. Open Transit Line Manager1. Click New and enter a unique Line Name2. Click Edit and then press the Route Edit button on the
Transit Route dialog box3. Click on the starting node4. Select subsequent stop nodes5. Exit Route Edit mode with the Esc key6. Choose ‘Insert Row’ to add other line attributes, such as
frequency, mode, one-way etc., to construct a valid transit line record

Florida Department of Transportation FSU 3 -12
FS
UT
MS
Tra
nsit
Mod
elin
g W
orks
hop
-20
07
23
Adding a New Route (Cont’d)
1
A
2
24
Adding a New Route (Cont’d)
3
4
5
6

Florida Department of Transportation FSU 3 -13
FS
UT
MS
Tra
nsit
Mod
elin
g W
orks
hop
-20
07
25
Extending a Route
� Extend the end-point of a route1. Double-click on the end node and start clicking on the
stop nodes to extend2. Click on Esc when done and save changes
� Extend the start-point of a route3. Insert a row with field ‘N’ and enter the starting node
number 4. Double-click on the above starting node and enter the
subsequent stop nodes to reach the first node
26
Extending a Route (Cont’d)
Extending end-point Extending start-point
21
3
4
Florida Department of Transportation FSU 3 -14
FS
UT
MS
Tra
nsit
Mod
elin
g W
orks
hop
-20
07
27
Adding Reverse of a Route
� Adding the reverse direction of a line1. Open transit line manager2. Select the transit line3. Press Copy, select the transit file 4. Enter Line Name5. Select the new line from the transit line list6. Click Reverse7. Save changes
28
Adding Reverse of a Route (Cont’d)
3
2
5
4

Florida Department of Transportation FSU 3 -15
FS
UT
MS
Tra
nsit
Mod
elin
g W
orks
hop
-20
07
29
Adding Reverse of a Route (Cont’d)
7
6
30
Modifying a Line When the Highway Network is Change d
�A link is split without the transit network open– Open transit line file on the modified highway network– If you know a particular link has been split, edit each
transit line along the link one-by-one by adding the new node between the previous existing two nodes
– To make sure that the changes in the transit line file are proper, run a PT module step
– Open the print file to see the error(s)

Florida Department of Transportation FSU 3 -16
FS
UT
MS
Tra
nsit
Mod
elin
g W
orks
hop
-20
07
31
Modifying a Line When the Highway Network is Change d (Cont’d)
� A link is split along with the transit network open1. With both the highway network and transit line file open,
make sure that the highway network is the active layer2. Click the link you wish to split3. Right-click and select Split from the menu4. Click OK in the Split Link dialogue box5. Your cursor will turn into a cross-hairs that you will click
on the link at the point where you would like the link to be split. When prompted to Add New Middle Node , click Yes.
6. Select the new node number and click OK7. Select whether you would like to add a stop or non-stop
node to the transit network and click OK
32
Modifying a Line When the Highway Network is Change d (Cont’d)
2
1
3

Florida Department of Transportation FSU 3 -17
FS
UT
MS
Tra
nsit
Mod
elin
g W
orks
hop
-20
07
33
Modifying a Line When the Highway Network is Change d (Cont’d)
4
5
6
7
34
Modifying a Line When the Highway Network is Change d (Cont’d)
�An interchange is changed– Zoom onto the interchange – Between the two nodes which haven’t changed, realign
the routes by clicking nodes along the route– Make sure the buses do not stop on the interchange
�Major changes in the highway network– If the changes do not have a major impact on the transit
network�Run a PT module�Go through the print file to see the errors and modify the
transit network accordingly– May consider starting from scratch

Florida Department of Transportation FSU 3 -18
FS
UT
MS
Tra
nsit
Mod
elin
g W
orks
hop
-20
07
35
Transit Speeds
�How are transit speeds calculated in PT?�Transit speed calibration
36
Transit Speeds (Cont’d)
�Flexible transit speed in PT– Allows expanded mode definitions & unique auto-transit
speed relationships for each mode– MxxTIMEAM, MxxTIMEMD fields added to transportation
network for each mode– Link time can be refined by line with LINE controls
�Mixed-flow traffic– Function of auto speeds– Use relationship based on facility type/ area type/ mode
�Exclusive right-of-way– Fixed speeds– Transit times are hard-coded on the links
Mixed-Flow Streets

Florida Department of Transportation FSU 3 -19
FS
UT
MS
Tra
nsit
Mod
elin
g W
orks
hop
-20
07
37
Transit Speeds (Cont’d)PT
38
Transit Speeds (Cont’d)
Auto-Transit speed relationship (Curve # 7)
02468
101214161820
0 10 20 30 40 50 60
Auto Speed (in mph)
Tra
nsit
Spe
ed (
in m
ph)
Auto Transit SpeedCurve Example:

Florida Department of Transportation FSU 3 -20
FS
UT
MS
Tra
nsit
Mod
elin
g W
orks
hop
-20
07
39
Transit Speeds (Cont’d)
�Transit speed data recently collected in Jacksonville and Tampa
�TRANSPD.DBF in parameters folder uses Jacksonville bus speed data
40
Transit Speeds (Cont’d)
�Speeds on fixed-guideways and bus-only lanes– No congestion – Time and distance taken directly from the highway
network– More details in next lesson…
Exclusive ROW Lanes

Florida Department of Transportation FSU 3 -21
FS
UT
MS
Tra
nsit
Mod
elin
g W
orks
hop
-20
07
41
Transit Speeds Component of the Transit Model
42
Transit Speeds (Cont’d)
�Compare the model transit travel times against the observed times– Observed times generally obtained from public time table– PT print file contains the travel time by route
� If the system contains extensive transit service, categorize the routes by mode and geography
�Following statistics should be looked at– Relative difference– Absolute difference– RMSE
Calibration

Florida Department of Transportation FSU 3 -22
FS
UT
MS
Tra
nsit
Mod
elin
g W
orks
hop
-20
07
43
Transit Speeds (Cont’d)
CFRPM - Summary of AM travel time calibrationMar 09, 2006
Agency Group <45 min >=45 min Combined
LYNX NE -0.54 2.58 0.46LYNX SE 1.72 -1.63 0.19LYNX SW -1.90 -1.59 -1.70LYNX NW -0.70 -0.09 -0.30 -0.41SUNTRAN Ocala 2.34 2.34VOTRAN West VolusiaVOTRAN East Volusia -4.35 -4.35SCAT Titusville 1.81
Melbourne 5.94 4.56
Agency Group <45 min >=45 min CombinedLYNX NE 16.65 12.64 15.35LYNX SE 10.35 8.85 9.66LYNX SW 25.89 12.30 17.10LYNX NW 15.26 14.59 14.82 14.56SUNTRAN Ocala 8.43 8.43VOTRAN West VolusiaVOTRAN East Volusia 22.71 22.71SCAT Titusville 17.48
Melbourne 33.91 28.43
Agency Group <45 min >=45 min CombinedLYNX NE 5.25 9.55 6.94LYNX SE 4.99 6.61 5.79LYNX SW 9.22 9.83 9.62LYNX NW 8.04 10.15 9.47 8.22SUNTRAN Ocala 3.27 3.27VOTRAN West VolusiaVOTRAN East Volusia 8.67 8.67SCAT Titusville 4.81
Melbourne 9.69 8.39
Average difference
Average absolute % difference
RMSE
CalibrationExample:
44
Game
Game 3.1
Who Wants to be a Millionaire?

Florida Department of Transportation FSU 3 -23
FS
UT
MS
Tra
nsit
Mod
elin
g W
orks
hop
-20
07
45
Computer Exercises
Transit Networks
Lesson 3
46
Lesson 3 Exercises
In this exercise you will complete the following:3.1 – Coding a transit network
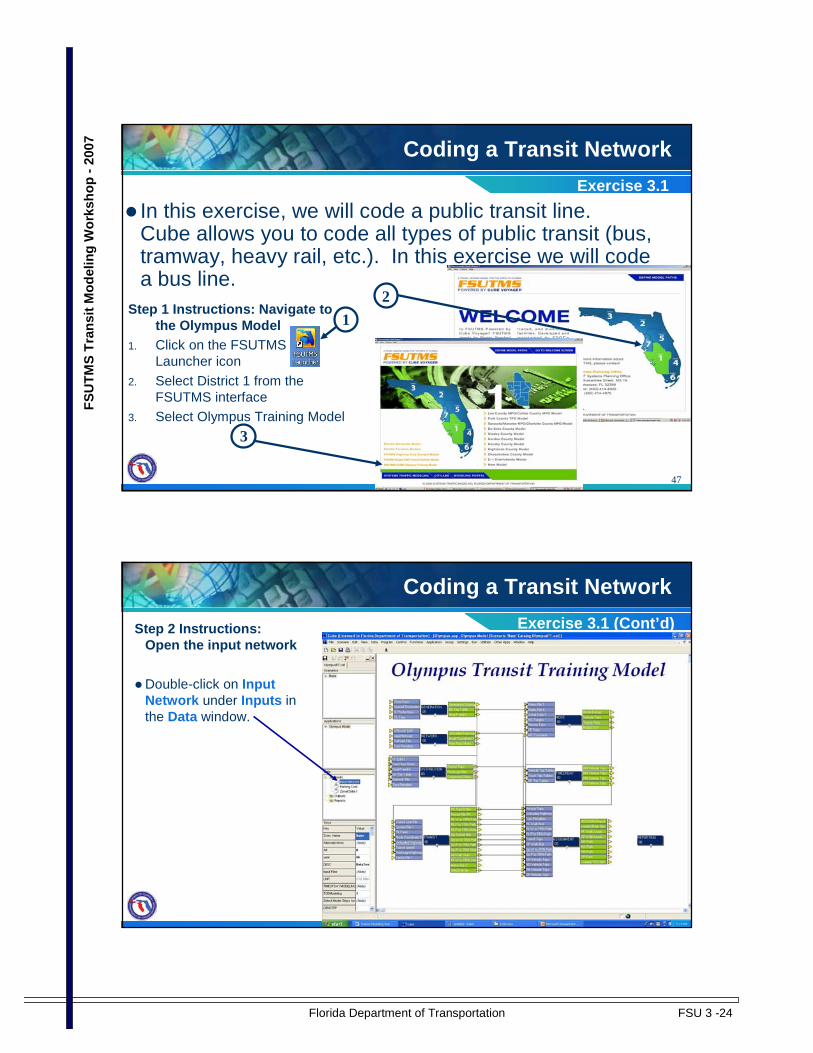
Florida Department of Transportation FSU 3 -24
FS
UT
MS
Tra
nsit
Mod
elin
g W
orks
hop
-20
07
47
Coding a Transit Network
Exercise 3.1
� In this exercise, we will code a public transit line. Cube allows you to code all types of public transit (bus, tramway, heavy rail, etc.). In this exercise we will code a bus line.
Step 1 Instructions: Navigate to the Olympus Model
1. Click on the FSUTMS Launcher icon
2. Select District 1 from the FSUTMS interface
3. Select Olympus Training Model
2
3
1
48
Coding a Transit Network
Step 2 Instructions: Open the input network
� Double-click on Input Network under Inputs in the Data window.
Exercise 3.1 (Cont’d)

Florida Department of Transportation FSU 3 -25
FS
UT
MS
Tra
nsit
Mod
elin
g W
orks
hop
-20
07
49
Coding a Transit Network
1
Step 3 Instructions: Open transit line file.
1.Click the Layer Control icon at the top of the screen.
2.Double-click Transit . 3.Click on the Browse button
in the Transit Layer Parameters dialogue box.
4.Navigate to C:\FSUTMS\general\OlympusTrainingModel\base\input and open TROUTE_00B.LIN .
5.Click All Done in the Transit Layer Parameters dialogue box.
2
4
3
Exercise 3.1 (Cont’d)
50
Coding a Transit Network
Step 4 Instructions: Make the transit network layer active.
1.Pull down the layer menu and select TRN:TROUTE_00B.lin to make the public transit line layer the active layer.
2.Click the Clear Postingsicon at the top of the screen.
3.Click the Transit Line Manager icon at the top of the screen.
12
3
Exercise 3.1 (Cont’d)

Florida Department of Transportation FSU 3 -26
FS
UT
MS
Tra
nsit
Mod
elin
g W
orks
hop
-20
07
51
Coding a Transit Network
Step 5 Instructions: Add a new bus line.
1.Click New on the Line Options .
2.A dialog box opens and prompts you for the name of the line. Type in Rt52 N FlaAv .
3.Click OK. We now have created a transit line.
4.With the Rt52 N FlaAve highlighted under Transit Lines , click on Edit . The transit line coding dialog opens.
5.Go to the C:\FSUTMS\general\OlympusTrainingModel\doc folder and open the 52NFlaAve.pdf file. Use this file to reference the alignment of Route 52 .
13
4
2
Exercise 3.1 (Cont’d)
52
Coding a Transit Network
Exercise 3.1 (Cont’d)

Florida Department of Transportation FSU 3 -27
FS
UT
MS
Tra
nsit
Mod
elin
g W
orks
hop
-20
07
53
Step 6 Instructions: Zoom to intersection.1. Click on the Route Edit button on the Transit Route dialog box. If you move the cursor over the map, you should now have a cross-hair. We are now ready to trace the line and locate the stops.
2. Click on the View Center of Nodes icon .3. Enter 2849.
4. Click OK. 5. Set Window Width to 2000.
6. Click OK. The view is zoomed to the intersection.
Coding a Transit Network
2
3
4
5
1
6
Exercise 3.1 (Cont’d)
54
Coding a Transit Network
Step 7 Instructions: Add a new bus line.1.Select the Post menu and select All Nodes . This posts the node numbers on to the screen. Click OK.2. Move the cross-hair cursor and click on node 2849. The node should flash.
3. Click on node 2799. The route of the line is found via the minimum path. You now have coded a transit line starting at node 2849, traveling to node 2799, with stops located at these two nodes.
2
3
1
Exercise 3.1 (Cont’d)

Florida Department of Transportation FSU 3 -28
FS
UT
MS
Tra
nsit
Mod
elin
g W
orks
hop
-20
07
55
Coding a Transit Network
Step 7 Instructions: Add a new bus line (Cont’d)4. Continue coding the line by clicking on node 2777 and2745.
5. Using the route schedule that you opened earlier in this exercise and the screenshot on the following page, please continue to code the rest of route 52.
Note: Left clicking on a node will path the route to that node and create a stop. Alt-left clicking on a node will path the route to that node without creating a stop.
4
Exercise 3.1 (Cont’d)
56
Coding a Transit NetworkExercise 4.1.1

Florida Department of Transportation FSU 3 -29
FS
UT
MS
Tra
nsit
Mod
elin
g W
orks
hop
-20
07
57
Coding a Transit Network
Step 8 Instructions: Complete Edits.�When you are finished, press the Esc key on your keyboard to drop out of edit mode.
�Click on the green check mark in order to accept your edits.
Exercise 3.1 (Cont’d)
58
Coding a Transit Network
Step 9 Instructions: Code in mode.
� Scroll to the top of the node list and click on the first node number.
1.Click the Insert Row icon at the top of the Transit Route window.
2.Select MODE from the variable list.
3.Click OK.4.Type in a “31” next to
Mode .
1
23
4
Exercise 3.1 (Cont’d)

Florida Department of Transportation FSU 3 -30
FS
UT
MS
Tra
nsit
Mod
elin
g W
orks
hop
-20
07
59
Coding a Transit Network
Step 10 Instructions: Code in headway.1. Click on the Insert Rowicon . This opens a dialog box with a list of variables that may be added to the line.2. Scroll and click on HEADWAY[1] .
3. Select OK. Headway for modeling period 1 is added to the line.4. Click on HEADWAY[2] .
5. Select OK. 6. Click on Cancel to close the dialog box.
1
2
3
4
5
6
Exercise 3.1 (Cont’d)
60
Coding a Transit Network
Step 10 Instructions: Code in headway (cont.).1.In the HEADWAY[2] box, type 30.2. In the HEADWAY[1] box, type 30.3. Click on the Green Check Mark and close the dialog. 4. Click on the Insert Rowicon . Add the following variables: LONGNAME , ONEWAY, TIMEFAC, CIRCULAR , and OPERATOR.
1
2
3Exercise 3.1 (Cont’d)

Florida Department of Transportation FSU 3 -31
FS
UT
MS
Tra
nsit
Mod
elin
g W
orks
hop
-20
07
61
Coding a Transit Network
Step 11 Instructions: Finish coding line.1. In the LONGNAME box, type Rt52 N FlaAv .2. In the ONEWAY, TIMEFAC, CIRCULAR, and OPERATORboxes, type 1.
3. Click on the Green Check Mark and close the dialog.
2
1
3Exercise 3.1 (Cont’d)
62
Coding a Transit Network
Step 12 Instructions: Saving the transit edits.1. Select the Transit Line Manager Icon .2. Select Save All to save edits. 3. Click on Exit .
32
1
Exercise 3.1 (Cont’d)

Florida Department of Transportation FSU 3 -32
FS
UT
MS
Tra
nsit
Mod
elin
g W
orks
hop
-20
07
63
Coding a Transit Network
Step 13 Instructions: Close out network.�Click on the X on the inside window to close the network.�If prompted whether or not to save transit line file changes, select Yes.
�When prompted whether or not to save project file, select No.�This will return you to the Olympus Application detailed flow chart.
Exercise 3.1 (Cont’d)
64
End of Lesson 3Close all files and return to the Desktop and Stop.

Florida Department of Transportation FSU 3 -33
FS
UT
MS
Tra
nsit
Mod
elin
g W
orks
hop
-20
07
65
Summary
In this lesson, we covered:
●Editing transit lines
●Transit speeds
66
Notes

Florida Department of Transportation FSU 3 -34
FS
UT
MS
Tra
nsit
Mod
elin
g W
orks
hop
-20
07
67
Notes
68
Notes

Florida Department of Transportation FSU 4 -1
FSU
TMS
Tran
sit M
odel
ing
Wor
ksho
p -2
007
1
You mean transit impacts the highway network?(Impacts on Highway Network)
Lesson 4
2
Lesson Goals
In this lesson we will cover:Transit-only linksMicro-codingStation data information

Florida Department of Transportation FSU 4 -2
FSU
TMS
Tran
sit M
odel
ing
Wor
ksho
p -2
007
3
Highway Network Modifications
Three elements should be represented in a highway network:– Transit-only links
• Similar to existing practice, just coding on a highway network
• Coded with Facility Type 69 with special fields– Micro-coding stations
• Separate rail and bus platforms– Station data
• Park-ride and fixed-guideway station information
4
Transit-Only Links
Bus traveling on streets not represented in the highway network– To get the bus route alignment right– To correctly represent the bus travel times
Exclusive transit right-of-way– Transit guideway– Bus only lanes– Fixed-guideway e.g. Tri-Rail

Florida Department of Transportation FSU 4 -3
FSU
TMS
Tran
sit M
odel
ing
Wor
ksho
p -2
007
5
Transit-Only Links (Cont’d)
Station-to-station connector links– Distance and time are coded– These links do not see congestion– Coded as Facility Type 69– TFGMODE is also coded for fixed-guidewaysMake sure to exclude Facility Types 59 and 69 during highway assignment/skimming
Highway Network
6
Transit-Only Links (Cont’d)
Mandatory fields in the highway network
Mode“TFGMODESpeed (mph)“TFGSPEEDTime (minutes)“TFGTIMEDistance (miles)Fixed-guidewayTFGDISTSpeed (mph)“TBSSPEEDTime (minutes)“TBSTIMEDistance (miles)Bus/mixed-flowTBSDIST
DescriptionModesField
Fields

Florida Department of Transportation FSU 4 -4
FSU
TMS
Tran
sit M
odel
ing
Wor
ksho
p -2
007
7
Deerfield Beach Tri-Rail Station Location
Deerfield Tri-rail station
8
Deerfield Beach- Express Routes Near Tri-Rail

Florida Department of Transportation FSU 4 -5
FSU
TMS
Tran
sit M
odel
ing
Wor
ksho
p -2
007
9
Deerfield Tri-rail stationDeerfield Tri-rail station
0TFGMODE
0TFGSPEED
0TFGTIME
0TFGDIST
15TBSSPEED
N/ATBSTIME
0.95TBSDIST
ValueField
0TFGMODE
0TFGSPEED
0TFGTIME
0TFGDIST
15TBSSPEED
N/ATBSTIME
0.95TBSDIST
ValueField
Express Routes Transit Only Links
10
Deerfield Tri-rail StationDeerfield Tri-rail Station
Coding Express Routes on Transit Network

Florida Department of Transportation FSU 4 -6
FSU
TMS
Tran
sit M
odel
ing
Wor
ksho
p -2
007
11
Deerfield Beach Tri-Rail station
Pompano Beach Tri-Rail station
Deerfield Beach Tri-Rail station
Pompano Beach Tri-Rail station
Pompano Beach Station
1224TFGMODE
36TFGSPEED
N/ATFGTIME
3.04TFGDIST
0TBSSPEED
N/ATBSTIME
0TBSDIST
ValueField
24TFGMODE
36TFGSPEED
N/ATFGTIME
3.04TFGDIST
0TBSSPEED
N/ATBSTIME
0TBSDIST
ValueField
Coding Rail Links on Transit Network

Florida Department of Transportation FSU 4 -7
FSU
TMS
Tran
sit M
odel
ing
Wor
ksho
p -2
007
13
Micro-Coding Stations
When to micro-codeMicro-coding linksMicro-coding nodes
14
Micro-Coding Stations (Cont’d)
Recommended by the Federal Transit Administration (FTA) in 2006 for Florida modelsWhy?– All known path characteristics represented in the network
and not in the bias constants– Accurately represents choices for the riders at a stop (logical
headway combinations)
Overview

Florida Department of Transportation FSU 4 -8
FSU
TMS
Tran
sit M
odel
ing
Wor
ksho
p -2
007
15
Micro-Coding Stations (Cont’d)
Platforms not simultaneously accessible– Fixed-guideway stations (Tri-Rail stations)– Elevated stations (Metro mover, skyway)Almost always on exclusive right-of-way modes– Transit guideway links– Bus-only lanes – Elevated busway (e.g. Miami busway)
When to Micro-Code?
16
Micro-Coding Stations (Cont’d)
StreetsBus platform node
Rail platform nodeRail track
Escalator Link
Time=~1 min
Fixed-Guideway

Florida Department of Transportation FSU 4 -9
FSU
TMS
Tran
sit M
odel
ing
Wor
ksho
p -2
007
17
Micro-Coding Stations (Cont’d)
Street node-to-platform connector– Facility Type 59– Default WALKTIME on these links is set as 1 minute– Will vary depending on individual stations
Escalator Links
18
Micro-Coding Stations (Cont’d)Fixed-Guideway Station
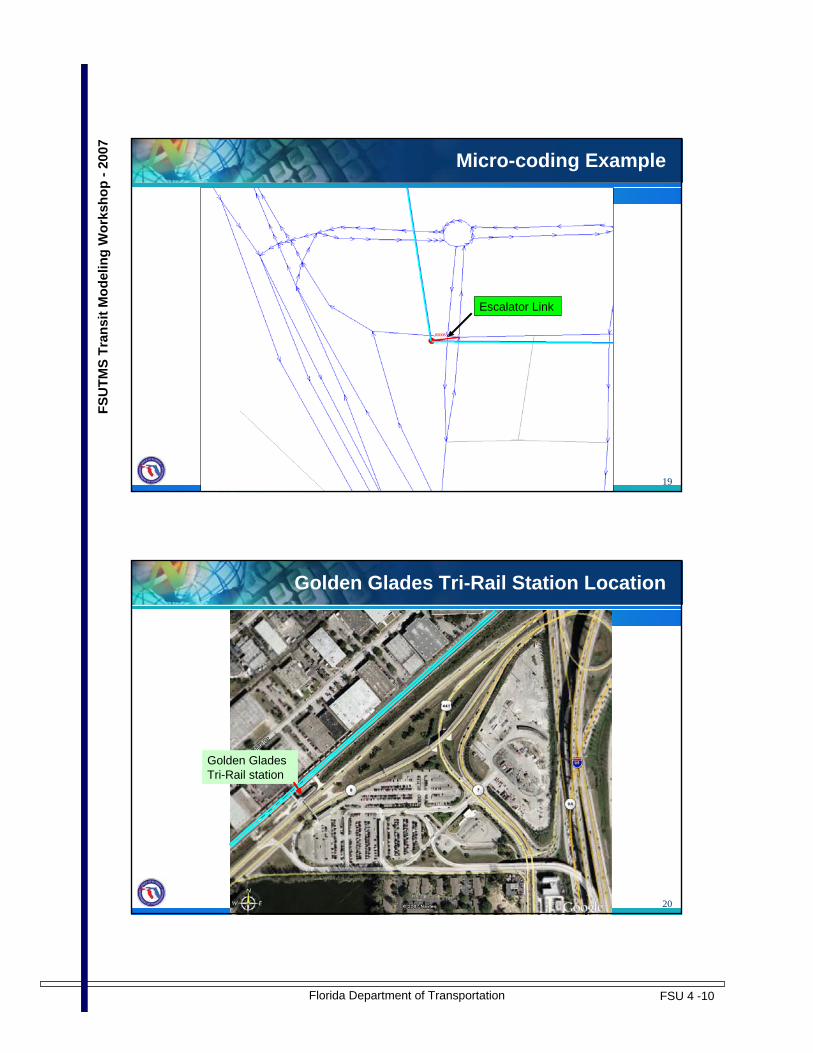
Florida Department of Transportation FSU 4 -10
FSU
TMS
Tran
sit M
odel
ing
Wor
ksho
p -2
007
19
Escalator Link
Micro-coding Example
20
Golden Glades Tri-Rail stationGolden Glades Tri-Rail station
Golden Glades Tri-Rail Station Location

Florida Department of Transportation FSU 4 -11
FSU
TMS
Tran
sit M
odel
ing
Wor
ksho
p -2
007
21
Micro-coding Example
22
Micro-Coding Stations (Cont’d)
Hollywood Tri-Rail
Example

Florida Department of Transportation FSU 4 -12
FSU
TMS
Tran
sit M
odel
ing
Wor
ksho
p -2
007
23
Micro-Coding Stations (Cont’d)
Hollywood Tri-Rail
Example
24
Micro-Coding Stations (Cont’d)
Metrorail/Tri-Rail Transfer
Example

Florida Department of Transportation FSU 4 -13
FSU
TMS
Tran
sit M
odel
ing
Wor
ksho
p -2
007
25
Micro-Coding Stations (Cont’d)Metrorail/Tri-Rail Transfer Station
26
Micro-Coding Stations (Cont’d)
Metrorail
Tri-R
ail
MetroBuses
Bus stop at street level
Tri-Rail platform
Metrorail Platform
Escalator to Metrorail platform
Escalator to Tri-Rail platform
Connection from Metrorail platform to Tri-Rail platform
Metrorail
Tri-R
ail
MetroBuses
Bus stop at street level
Tri-Rail platform
Metrorail Platform
Escalator to Metrorail platform
Escalator to Tri-Rail platform
Connection from Metrorail platform to Tri-Rail platform
Metrorail/Tri-Rail Transfer Station Example
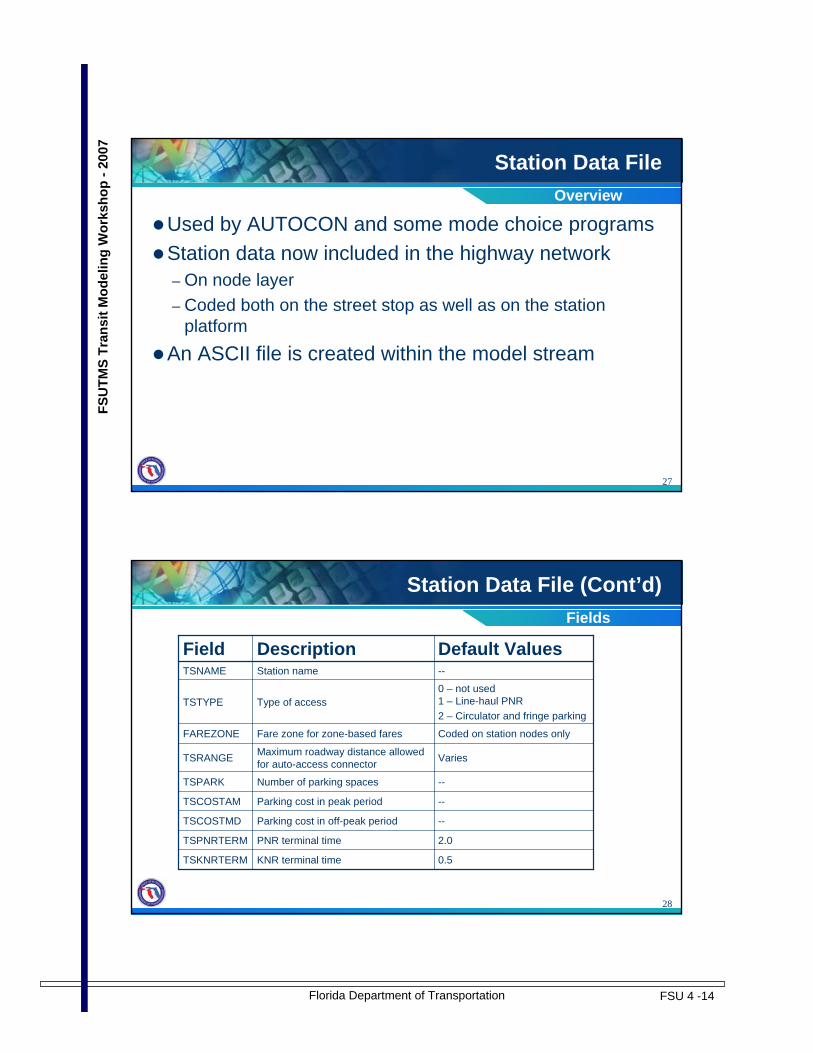
Florida Department of Transportation FSU 4 -14
FSU
TMS
Tran
sit M
odel
ing
Wor
ksho
p -2
007
27
Station Data File
Used by AUTOCON and some mode choice programsStation data now included in the highway network – On node layer – Coded both on the street stop as well as on the station
platformAn ASCII file is created within the model stream
Overview
28
Station Data File (Cont’d)
0.5KNR terminal timeTSKNRTERM
2.0PNR terminal timeTSPNRTERM
--Parking cost in off-peak periodTSCOSTMD
--Parking cost in peak periodTSCOSTAM
--Number of parking spacesTSPARK
VariesMaximum roadway distance allowed for auto-access connectorTSRANGE
Coded on station nodes onlyFare zone for zone-based faresFAREZONE
0 – not used1 – Line-haul PNR2 – Circulator and fringe parking
Type of accessTSTYPE
--Station nameTSNAME
Default ValuesDescriptionField
Fields

Florida Department of Transportation FSU 4 -15
FSU
TMS
Tran
sit M
odel
ing
Wor
ksho
p -2
007
29
Station Data File (Cont’d)Example
30
Game
Game 4.1Hollywood Squares

Florida Department of Transportation FSU 4 -16
FSU
TMS
Tran
sit M
odel
ing
Wor
ksho
p -2
007
31
Computer Exercises
Impacts on the Highway Network
Lesson 4
32
Lesson 4 Exercises
In this exercise you will complete the following:4.1 – Micro-coding fixed-guideway stations

Florida Department of Transportation FSU 4 -17
FSU
TMS
Tran
sit M
odel
ing
Wor
ksho
p -2
007
33
Micro-codingExercise 4.1
In this exercise, we will code a Fixed Guideway and use micro-coding for our stations.
Step 1 Instructions: Navigate to the Olympus Model
1. Click on the FSUTMS Launcher icon
2. Select District 1 from the FSUTMS interface
3. Select Olympus Training Model
2
3
1
34
Micro-coding
Step 2 Instructions: Open the input network
Double-click on Input Network under Inputs in the Data window.
Exercise 4.1 (Cont’d)
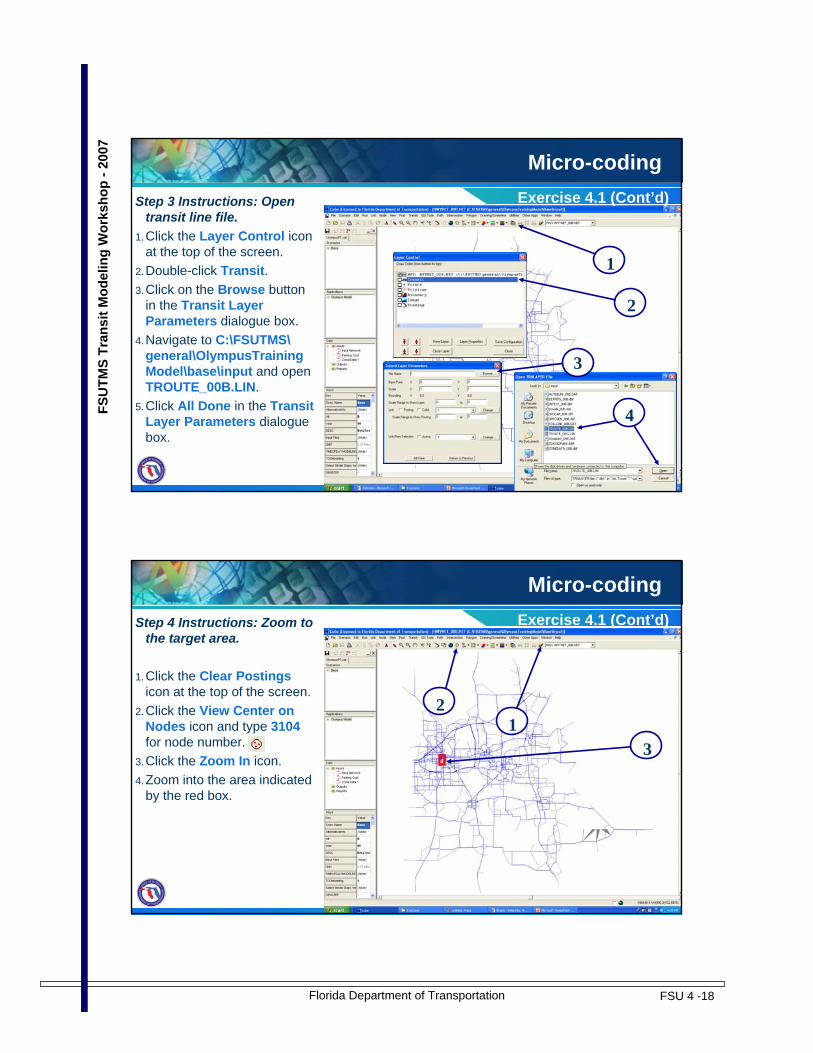
Florida Department of Transportation FSU 4 -18
FSU
TMS
Tran
sit M
odel
ing
Wor
ksho
p -2
007
35
Micro-coding
1
Step 3 Instructions: Open transit line file.
1.Click the Layer Control icon at the top of the screen.
2.Double-click Transit. 3.Click on the Browse button
in the Transit Layer Parameters dialogue box.
4.Navigate to C:\FSUTMS\general\OlympusTrainingModel\base\input and open TROUTE_00B.LIN.
5.Click All Done in the Transit Layer Parameters dialogue box.
2
4
3
Exercise 4.1 (Cont’d)
36
Micro-codingStep 4 Instructions: Zoom to
the target area.
1.Click the Clear Postingsicon at the top of the screen.
2.Click the View Center on Nodes icon and type 3104 for node number.
3.Click the Zoom In icon.4.Zoom into the area indicated
by the red box.
31
2
Exercise 4.1 (Cont’d)

Florida Department of Transportation FSU 4 -19
FSU
TMS
Tran
sit M
odel
ing
Wor
ksho
p -2
007
37
Micro-codingStep 5 Instructions: Add Rail
platform nodes.1.Select Add from the Node
menu at the top of the screen.
2.Move the cross-hairs to the spot indicated by the red dot and click.
3.Type 7000 for New Node Number.
4.Click OK.
1
3
4
2
Exercise 4.1 (Cont’d)
38
Micro-codingStep 5 Instructions: Add Rail
platform nodes (cont’d).1.Working from south to north,
continue to add nodes 7001, 7002, and 7003 at the locations indicated by the red spots.
1
Exercise 4.1 (Cont’d)

Florida Department of Transportation FSU 4 -20
FSU
TMS
Tran
sit M
odel
ing
Wor
ksho
p -2
007
39
Micro-codingStep 5 Instructions: Add Rail
platform nodes (cont’d).1.Select the Post menu from
the top of the screen and click All Nodes...
2.Click OK.
1
Exercise 4.1 (Cont’d)
2
40
Step 6 Instructions: Add rail links.1. Select Add Two-Way from the Link menu at the top of the screen.2. Add link 7000-7001.3. Add link 7001-7002. 4. Add link 7002-7003. 5. Edit each link to include the corresponding values.
Micro-coding
2
3
41
Distance= 49FTYPE= 69TFGTIME= 0.7TFGMODE= 24
5Distance= 47FTYPE= 69TFGTIME= 0.8TFGMODE= 24
Distance= 25FTYPE= 69TFGTIME= 0.4TFGMODE= 24
Exercise 4.1 (Cont’d)

Florida Department of Transportation FSU 4 -21
FSU
TMS
Tran
sit M
odel
ing
Wor
ksho
p -2
007
41
Micro-codingStep 7 Instructions: Add rail transfer links.1. Zoom in to node 7000. 2. Select Add Two-Way from the Link menu at the top of the screen. 3. Add link 7000-3195. Edit the link to contain the following values: DISTANCE= 4, FTYPE= 59.4. Add transfer links for 7001-3104, 7002-2976, and 7003-2849. DISTANCE= 4, FTYPE= 59 for each transfer link.5. Post node numbers.
13
2
Exercise 4.1 (Cont’d)
42
Micro-codingStep 8 Instructions: Code in station data.1. Click on node 7000. 2. Code in the values that appear on the screen shot and click the green check mark when finished.3. Repeat this process for nodes 7001, 7002, 7003, 3195, 3104, 2976, and 2849.
Note: For nodes 7001, 7002, 3104, and 2976 use a value of 5 for TSRANGE.
1
2
Exercise 4.1 (Cont’d)

Florida Department of Transportation FSU 4 -22
FSU
TMS
Tran
sit M
odel
ing
Wor
ksho
p -2
007
43
Micro-codingStep 9 Instructions: Add a rail line.1. Zoom out so that you can see the new fixed guidewaycorridor.2. Make the transit layer active.3. Using the techniques you learned in Lesson 3, create a new transit line going from node 7000 in the south to node 7003 in the north with stops at nodes 7001 and 7002. Call the new line FG NB.
2
3
Exercise 4.1 (Cont’d)
44
Step 9 Instructions: Add a rail line (cont’d).
4. OPERATOR= 55. TIMEFAC= 16. ONEWAY= 17. LONGNAME= Fixed
Guideway NB8. MODE= 249. HEADWAY[2]= 1010. HEADWAY[1]= 5
Micro-codingExercise 4.1 (Cont’d)
4
5
6
7
8
9
10

Florida Department of Transportation FSU 4 -23
FSU
TMS
Tran
sit M
odel
ing
Wor
ksho
p -2
007
45
Micro-codingStep 10 Instructions: Add
reverse line.1.After you have created the
new line, open the Transit Line Manager by clicking on the icon.
2.Make sure that the FG NBline is highlighted.
3.Click Copy.4.Click OK.5.Name the new line FG SB
and click OK.6.Make sure that the FG SB
line is highlighted and click Reverse.
7.Click Save All.8.Click Exit.
12
3
4
5
6
7
8
Exercise 4.1 (Cont’d)
46
Micro-codingStep 11 Instructions: Save and close.1. Save the highway network.2. Close the highway network.
12
Exercise 4.1 (Cont’d)

Florida Department of Transportation FSU 4 -24
FSU
TMS
Tran
sit M
odel
ing
Wor
ksho
p -2
007
47
End of Lesson 4Close all files and return to the Desktop and Stop.
48
Summary
In this lesson we covered:●Transit-only links●Micro-Coding●Station data
Florida Department of Transportation FSU 5 -1
FSU
TMS
Tran
ist M
odel
ing
Wor
ksho
p-2
007
1
Getting Involved with PT
(More About PT)
Lesson 5
2
Lesson Goals
In this lesson we will cover:Olympus 101– Quick tour– External programsPT 209– Phases– Parameters– Userclasses– Input Files– Output Files

Florida Department of Transportation FSU 5 -2
FSU
TMS
Tran
ist M
odel
ing
Wor
ksho
p-2
007
3
Olympus Model Quick Tour
4
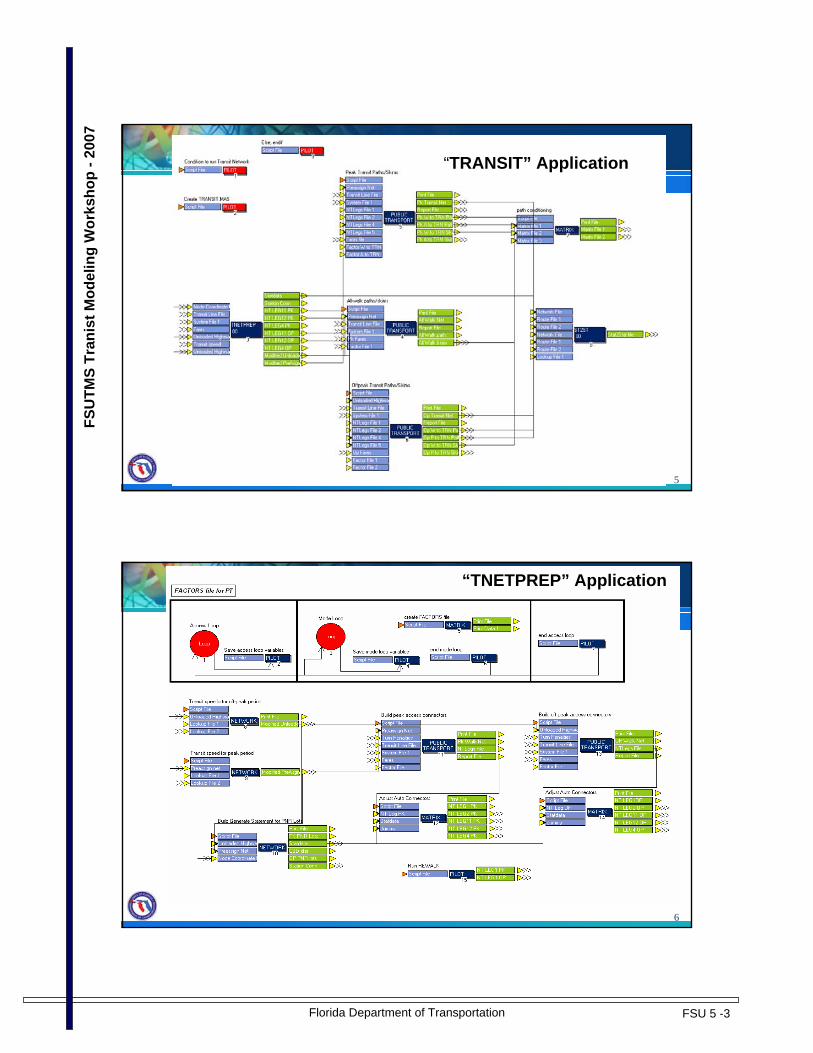
Florida Department of Transportation FSU 5 -3
FSU
TMS
Tran
ist M
odel
ing
Wor
ksho
p-2
007
5
“TRANSIT” Application
6
“TNETPREP” Application
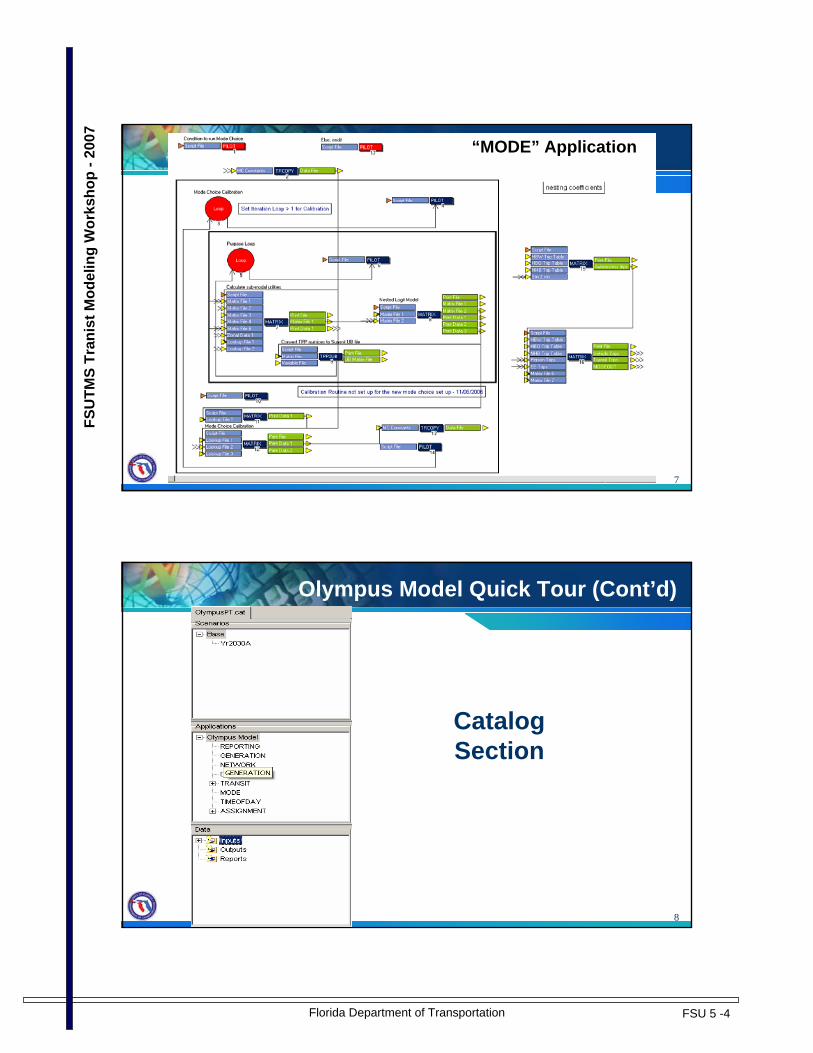
Florida Department of Transportation FSU 5 -4
FSU
TMS
Tran
ist M
odel
ing
Wor
ksho
p-2
007
7
“MODE” Application
8
Olympus Model Quick Tour (Cont’d)
Catalog Section

Florida Department of Transportation FSU 5 -5
FSU
TMS
Tran
ist M
odel
ing
Wor
ksho
p-2
007
9
Olympus Model Quick Tour (Cont’d)
Catalog Keys
10
Olympus Model
External Programs in Olympus Model

Florida Department of Transportation FSU 5 -6
FSU
TMS
Tran
ist M
odel
ing
Wor
ksho
p-2
007
11
Olympus External Programs
REWALK – Coordination of percent walk and walk connectorsAUTOCON – Generates auto access connectorsTAREPORT– Assignment reporting programSome areas may have the mode choice model in FORTRANAll external programs are in ‘applications’ folder
12
“TRANSIT” Application

Florida Department of Transportation FSU 5 -7
FSU
TMS
Tran
ist M
odel
ing
Wor
ksho
p-2
007
13
REWALK and AUTOCON read in a control file named ‘TRANSIT.MAS’– File is created within the model stream– ‘applications’ folder
Format of the TRANSIT.MAS file
Parameters read in by the programs
A291-29
Value of the parametersA8030-119
DescriptionFormatColumns
Olympus External ProgramsTRANSIT.MAS
14
Olympus External Programs (Cont’d)
; Rewalk program filesDESCRIPTION BetaTestFLEGINAM C:\fsutms\OlympusPT\Base\output\NTLEG1PK_TEM.NTLFLEGINMD C:\fsutms\OlympusPT\Base\output\NTLEG1OP_TEM.NTLFLEGOUTAM C:\fsutms\OlympusPT\Base\output\NTLEG1PK_B00.NTLFLEGOUTMD C:\fsutms\OlympusPT\Base\output\NTLEG1OP_B00.NTLFPCWALKIN C:\fsutms\OlympusPT\Base\input\PCWALK_00B.DATFPCWALKOUT C:\fsutms\OlympusPT\Base\output\PCWALK_B00.DAT; Rewalk parametersWALKSPD 2.5AVGWALK 0.5MINPCW 15ZONESA 653
TRANSIT.MAS

Florida Department of Transportation FSU 5 -8
FSU
TMS
Tran
ist M
odel
ing
Wor
ksho
p-2
007
15
; AutoCon-Related Files; InputStatDataFile C:\fsutms\OlympusPT\Base\output\STATDATA_B00.DATXtraAutoFileAM C:\fsutms\OlympusPT\Base\input\XTRAAUTO_00B.DATXtraAutoFileMD C:\fsutms\OlympusPT\Base\input\XTRAAUTO_00B.DATAutoDelFileAM C:\fsutms\OlympusPT\Base\input\AUTDELPK_00B.DATAUTODELFILEMD C:\fsutms\OlympusPT\Base\input\AUTDELOP_00B.DATNodesFile C:\fsutms\OlympusPT\Base\output\XY_B00.DATTransitLineFile C:\fsutms\OlympusPT\Base\input\TROUTE_00B.LINRHSKIMS C:\fsutms\OlympusPT\Base\output\RHSKIMTT.B00FHSKIMS C:\fsutms\OlympusPT\Base\output\FHSKIMTT.B00
Olympus External Programs (Cont’d)TRANSIT.MAS
16
; OutputAUTOCONRPT C:\fsutms\OlympusPT\Base\output\AUTOCON.OUTAUTOAM C:\fsutms\OlympusPT\Base\output\NTLEG2PK_B00.NTLAUTOMD C:\fsutms\OlympusPT\Base\output\NTLEG2OP_B00.NTLAUTODATAM C:\fsutms\OlympusPT\Base\output\NTLDA2PK_B00.NTLAUTODATMD C:\fsutms\OlympusPT\Base\output\NTLDA2OP_B00.NTLACONLISTAM C:\fsutms\OlympusPT\Base\output\NTLEG2PK_B00.PRNACONLISTMD C:\fsutms\OlympusPT\Base\output\NTLEG2OP_B00.PRN
Olympus External Programs (Cont’d)TRANSIT.MAS

Florida Department of Transportation FSU 5 -9
FSU
TMS
Tran
ist M
odel
ing
Wor
ksho
p-2
007
17
; AutoCon ParametersZONESI 630CBDZONE 143TERM 2.00DEF 2.00NOPT 1BACK 1BACKD 4.0BACKPC 0.30UNITS 1609.04240MAXMODE 37MODENUM (not used) 21 22 23 24 25 26 27 28 29 30 31 32 33 34 35 36 37PREMIUMFLAG 0 1 0 1 1 1 1 0 0 0 0 1 0 1 1 1 1MODEPRIORITY 7 5 7 2 1 4 3 10 10 10 7 5 7 2 1 4 3
Olympus External Programs (Cont’d)TRANSIT.MAS
18
Olympus External Programs (Cont’d)TRANSIT.MAS
VOTAM 6.00VOTMD 3.00OVTRATIOAM 2.00OVTRATIOMD 2.00AATRATIOAM 1.50AATRATIOMD 1.50AUTOCCPNR 1.2AUTOCCKNR 1.2AOC 9.5InflTransitFare 1InflAOC 1InflParkingCost 1

Florida Department of Transportation FSU 5 -10
FSU
TMS
Tran
ist M
odel
ing
Wor
ksho
p-2
007
19
PT209
20
PT “Package”
Incorporates the following Tranplan functions:– INET / INETREP– WALKCON / SIDECON– Build Transit Network– Build Transit Paths– Transit Selected Summation– Build Fare Matrix– Load Station To Station– Load Transit Network
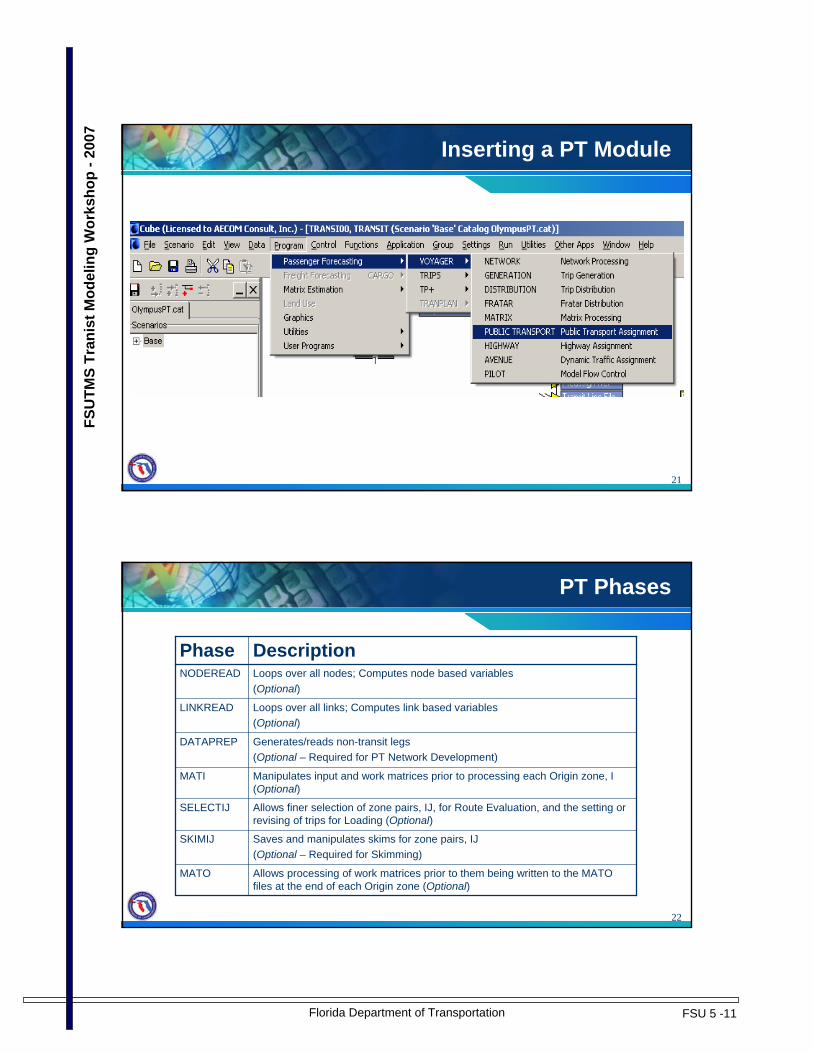
Florida Department of Transportation FSU 5 -11
FSU
TMS
Tran
ist M
odel
ing
Wor
ksho
p-2
007
21
Inserting a PT Module
22
PT Phases
Allows processing of work matrices prior to them being written to the MATO files at the end of each Origin zone (Optional)
MATO
Saves and manipulates skims for zone pairs, IJ (Optional – Required for Skimming)
SKIMIJ
Allows finer selection of zone pairs, IJ, for Route Evaluation, and the setting or revising of trips for Loading (Optional)
SELECTIJ
Manipulates input and work matrices prior to processing each Origin zone, I (Optional)
MATI
Generates/reads non-transit legs (Optional – Required for PT Network Development)
DATAPREP
Loops over all links; Computes link based variables (Optional)
LINKREAD
Loops over all nodes; Computes node based variables (Optional)
NODEREAD
DescriptionPhase

Florida Department of Transportation FSU 5 -12
FSU
TMS
Tran
ist M
odel
ing
Wor
ksho
p-2
007
23
PT Script
; Do not change filenames or add or remove FILEI/FILEO statements using an editor. Use Cube/Application Manager.
RUN PGM=PUBLIC TRANSPORT PRNFILE="{SCENARIO_DIR}\output\04PTR00A.PRN" MSG='Peak Transit Paths/Skims'
; Output filesFILEO MATO[2] = "{SCENARIO_DIR}\output\TSKIMPK2_{Alt}{year}.MAT",MO=1-15,DEC=15*D,NAME=WALKTIME,AutoTIME,SidewalkTime,BUSTIME,PBUSTIME,CIRCTIME, RAILTIME, COMRLTIME,OTHTIME,PRJTIME,XFER,IWAIT,XWAIT,FARE,TOTTIME
FILEO MATO[1] = "{SCENARIO_DIR}\output\TSKIMPK1_TEM.MAT",MO=1-15, DEC=15*D,NAME=WALKTIME,AutoTIME,SidewalkTIME,BUSTIME,PBUSTIME,CIRCTIME, RAILTIME,COMRLTIME,OTHTIME,PRJTIME,XFER,IWAIT,XWAIT,FARE,TOTTIME
FILEO ROUTEO[2] = "{SCENARIO_DIR}\output\TPATHPK2_{Alt}{year}.RTE",REPORTI=1377, REPORTJ=136, TRACEI=137, TRACEJ=136, I={SelOrigin}, J={SelDest}FILEO ROUTEO[1] = "{SCENARIO_DIR}\output\TPATHPK1_{Alt}{year}.RTE",REPORTI={SelOrigin}, REPORTJ={SelDest}, TRACEI=137, TRACEJ=136, I={SelOrigin}, J={SelDest}
FILEO REPORTO = "{SCENARIO_DIR}\output\04PTR00B.PRN"FILEO NETO = "{SCENARIO_DIR}\output\TransitPK.NET"
Example
24
PT Script (Cont’d)
; Input filesFILEI FACTORI[2] = "{SCENARIO_DIR}\output\AutoTransit.FAC"FILEI FACTORI[1] = "{SCENARIO_DIR}\output\WalkTransit.FAC"FILEI NTLEGI[5] = "{SCENARIO_DIR}\output\NTLEG12PK_{year}{alt}.NTL"FILEI NTLEGI[4] = "{SCENARIO_DIR}\output\NTLEG11PK_{year}{alt}.NTL"FILEI NTLEGI[1] = "{SCENARIO_DIR}\output\NTLEG1PK_{alt}{year}.NTL"FILEI NTLEGI[2] = "{SCENARIO_DIR}\output\NTLEG2PK_{alt}{year}.NTL"FILEI NETI = "{SCENARIO_DIR}\output\PREASGN_TMP.NET"FILEI FAREI = "{SCENARIO_DIR}\input\TFARES_{year}{Alt}.FAR"FILEI SYSTEMI = "{CATALOG_DIR}\parameters\TSYSD.PTS"FILEI LINEI[1] = "{SCENARIO_DIR}\input\TROUTE_{year}{alt}.LIN"
Example

Florida Department of Transportation FSU 5 -13
FSU
TMS
Tran
ist M
odel
ing
Wor
ksho
p-2
007
25
PT Script (Cont’d)
; OVERALL PARAMETERS OF RUNPARAMETERS USERCLASSES=1-2,FARE=N, MAPSCALE=5280, HDWAYPERIOD=1,NOROUTEERRS=999999, NOROUTEMSGS=999999, TRANTIME=LW.TRANTIME,TRANTIME[21]=LI.M21TIMEPK,TRANTIME[22]=LI.M22TIMEPK,TRANTIME[23]=LI.M23TIMEPK,TRANTIME[24]=LI.M24TIMEPK,TRANTIME[25]=LI.M25TIMEPK,TRANTIME[31]=LI.M31TIMEPK,TRANTIME[32]=LI.M32TIMEPK,TRANTIME[33]=LI.M33TIMEPK,TRANTIME[34]=LI.M34TIMEPK,TRANTIME[35]=LI.M35TIMEPK
Example
26
PT Script (Cont’d)
REPORT LINES=TREREPORT LINES=T,TRNLEGS3=T
PROCESS PHASE=LINKREADLW.TRANTIME=LI.M21TIMEPKLW.WALKTIME=LI.WALKTIMELW.WALKDISTANCE=LI.DISTANCELW.DISTANCE=LI.DISTANCEENDPROCESS
Example

Florida Department of Transportation FSU 5 -14
FSU
TMS
Tran
ist M
odel
ing
Wor
ksho
p-2
007
27
PT Script (Cont’d)
PROCESS PHASE=DATAPREP; Generate walk-access linksGENERATE READNTLEGI=1; Generate station-access linksREAD, FILE = "{SCENARIO_DIR}\OUTPUT\STATCON_TMP.DAT"; Generate auto-access linksGENERATE READNTLEGI=2if ({isMicroCode} <> 0); Generate fixed-guideway to bus linksGENERATE READNTLEGI=4endif; Generate CBD transfer linksGENERATE READNTLEGI=5ENDPROCESS
Example
28
PT Script (Cont’d)PROCESS PHASE=SKIMIJMW[1]=TIMEA(0,1) ; Walk timeMW[2]=TIMEA(0,2) ; Auto timeMW[3]=TIMEA(0,11)+TIMEA(0,12) ; Sidewalk timeMW[4]=TIMEA(0,21)+TIMEA(0,31) ; Local bus timeMW[5]=TIMEA(0,22)+TIMEA(0,32) ; Premium bus timeMW[6]=TIMEA(0,23)+TIMEA(0,33) ; Circulator timeMW[7]=TIMEA(0,24)+TIMEA(0,34) ; Light/Heavy Rail timeMW[8]=TIMEA(0,25)+TIMEA(0,35) ; Commuter Rail timeMW[9]=TIMEA(0,26)+TIMEA(0,36) ; Other mode timeMW[10]=TIMEA(0,27)+TIMEA(0,37) ; Project mode timeIF (BRDINGS(0,TMODES) > 0)MW[11]=BRDINGS(0,TMODES)-1 ; Number of transfersELSEMW[11]=0ENDIFMW[12]=IWAITA(0) ; Initial wait timeMW[13]=XWAITA(0) ; Transfer wait timeMW[14]=FAREA(0)*100 ; Fare matrixMW[15]=TIMEA(0,ALLMODES) ; Time on all modes
ENDPROCESSENDRUN
Example

Florida Department of Transportation FSU 5 -15
FSU
TMS
Tran
ist M
odel
ing
Wor
ksho
p-2
007
29
PT Parameters
●USERCLASS●FARE●MAPSCALE●HDWAYPERIOD●NOROUTEERRS●NOROUTEMSGS●TRANTIME
30
PARAMETER Keywords
Specifies how the transit time for a specific mode is computed
Specifies how the base transit time for links is computed
The number of warning messages allowed for zone pairs that have trips but no valid routes
The number of error messages allowed for zone pairs that have trips but no valid routes
Defines which headway period to use; refers to the HEADWAY field in LINE file
If true, use fare in path-building;If false, do not use fare in path-building
List of UserClasses to be used (see next slide)
Description
LI.MxxTIMEyyTRANTIME[mode]
LW.TRANTIMETRANTIME
999999NOROUTEMSGS
999999NOROUTEERRS
1 (peak)2 (off-peak)
N
1
Default Value
HDWAYPERIOD
FARE
USERCLASS
Name

Florida Department of Transportation FSU 5 -16
FSU
TMS
Tran
ist M
odel
ing
Wor
ksho
p-2
007
31
PT Userclasses
Allows market stratification– e.g. walk-transit, auto-transit In Florida, userclass is used as a transit path– Access mode (walk, drive) for Tier A cities– Access mode and submode (walk-bus, walk-project
etc.) for Tier B/C/D cities
32
Userclasses in Olympus
•Demand matrix and factors are provided for each userclass•Network, system information, non-transit legs and line data are common to all userclasses
Factor files –
Walk to transit
Auto to transit
Route filesSkim files

Florida Department of Transportation FSU 5 -17
FSU
TMS
Tran
ist M
odel
ing
Wor
ksho
p-2
007
33
34
PT 209 (Cont’d)
Input files &Output files

Florida Department of Transportation FSU 5 -18
FSU
TMS
Tran
ist M
odel
ing
Wor
ksho
p-2
007
35
PT Input/Output Files
PT module can be used to: – Develop access connectors– Do path-building– Do transit assignmentInput and output files required by the module depends on what is PT used for.
Overview
36
PT Input Files
Access Connectors
Transit Path-Building
Transit Assignment
Network file
Transit line
System data
Fares
Factors*
Demand Matrix*
NT legs
PT Process – Input files (Access Connectors)
Access Connectors
User Generated NT Leg
* Indicates files will be different for each user class/path.

Florida Department of Transportation FSU 5 -19
FSU
TMS
Tran
ist M
odel
ing
Wor
ksho
p-2
007
37
PT Input Files (Cont’d)
Access Connectors
Transit Path-Building
Transit Assignment
Network file
Transit line
System data
Fares
Factors*
User Generated NT Leg
Demand Matrix*
NT legs
PT Network file
Route file*
PT Process – Input files (Path-Building)
Path-Building
* Indicates files will be different for each user class/path.
38
PT Input Files (Cont’d)
Access Connectors
Transit Path-Building
Transit Assignment
Network file
Transit line
System data
Fares
Factors*
Demand Matrix*
PT Network file
Route file*
PT Process – Input files (Assignment)
Assignment
User Generated NT Leg
* Indicates files will be different for each user class/path.

Florida Department of Transportation FSU 5 -20
FSU
TMS
Tran
ist M
odel
ing
Wor
ksho
p-2
007
39
PT Output Files
Major Output Files– Print file– Network file– Links file– Line file– NT leg file– Stop2Stop file– Report file– Route file– Matrix file
40
PT Output Files (Cont’d)
Access Connectors
Transit Path-Building
Transit Assignment
Network file
Transit line
System data
Fares
Factors*
NT Leg
Route file
Demand Mat*
NT leg
PT Network file
Route file*
PT Process –
Output files Skim file*
Report file
Link file
Report file
Network file
PT Process
* Indicates files will be different for each user class/path.

Florida Department of Transportation FSU 5 -21
FSU
TMS
Tran
ist M
odel
ing
Wor
ksho
p-2
007
41
PT Output Files (Cont’d)
Lists any errors during the PT moduleChecks for warnings and messagesReports transit lines with distance and time– Used for checking transit speeds
REPORT LINES UserClass=1Name Mode Op Stp Cr Distance Time------------------------------------------------Rt10 Shuttle 31 1 33 - 4.18 7.46 Rt 10 ShuttleRt11 E Main 31 1 50 C 14.99 26.53 Rt 11 E Main CombeeRdRt20 GrovePk 31 1 67 C 16.48 27.94 Rt 20 Grove Pk Crys LkRt21 Edgewd 31 1 68 C 17.15 29.00 Rt 21 EdgewoodRt30 Clvd Ht 31 1 76 C 16.92 30.54 Rt 30 Cleveland Hts
Print File
42
PT Output Files (Cont’d)
Output non-transit leg file– Can be opened in ASCII editor
NT LEG=14-3116 MODE=1 COST=13.20 DIST=0.55 ONEWAY=T XN=3120NT LEG=14-3120 MODE=1 COST=5.04 DIST=0.21 ONEWAY=TNT LEG=14-3172 MODE=1 COST=1.92 DIST=0.08 ONEWAY=T
NT LEG file

Florida Department of Transportation FSU 5 -22
FSU
TMS
Tran
ist M
odel
ing
Wor
ksho
p-2
007
43
PT Output Files (Cont’d)
Output network file containing:– Basic highway network features– System data input– Line data– Factor data– Non-transit legs– Loadings
Network File
44
PT Output Files (Cont’d)
Stop-to-stop analyses are saved– DBF format containing:
I, J, FROMNODE, TONODE, MODEIt gives the access station (and hence zone) for each IJ pair
STOP2STOP File

Florida Department of Transportation FSU 5 -23
FSU
TMS
Tran
ist M
odel
ing
Wor
ksho
p-2
007
45
PT Output Files (Cont’d)
Output enumerated file– For each user class– Up to 10 files are allowed– Used for loading purposes– Used for tracing paths
ROUTEO File
46
PT Output Files (Cont’d)
Reports from enumeration and evaluation steps are written– ASCII format– Outputs factors used for
different userclasses– Node to node time and
distance– Reports path trace
Report File
REnum Route(s) from Origin 133 to Destination 98133 -> 31513151 -> 3679 -> 3679 lines Rt31 S FlaAv3679 -> 3552 -> 98 lines Rt32 Medulla
REval Route(s) from Origin 133 to Destination 98133 -> 31513151 -> 3679 -> 3679 lines Rt31 S FlaAv3679 -> 3552 -> 98 lines Rt32 MedullaCost= 104.90 Probability=1.0000

Florida Department of Transportation FSU 5 -24
FSU
TMS
Tran
ist M
odel
ing
Wor
ksho
p-2
007
47
Summary
In this lesson we covered:Olympus Quick TourOlympus External ProgramsPT Phases, Parameters, and UserclassesPT Input/Output Files
48
Notes
Florida Depart ment of Transportation F S U 6 -1
FS
UT
MS
Tra
nsi
t M
od
elin
g W
ork
sho
p -
2007
1
Get me outta this zone!(Transit Access)
Lesson 6
2
Lesson Goals
In this lesson we will cover:Overview of transit accessPercent walksWalk connectorsSidewalk/transfer connectorsAuto connectorsWhen are zones too big?

Florida Depart ment of Transportation F S U 6 -2
FS
UT
MS
Tra
nsi
t M
od
elin
g W
ork
sho
p -
2007
3
Overview…
4
Transit Access
The ability to connect zones with the transit network is called “transit access”How?– Connectors from centroids to transit stops– Estimates of transit accessibility for each zonePerforms a similar function to centroid connectors in highway networks, except that the transportation mode is spatial, temporal & directional
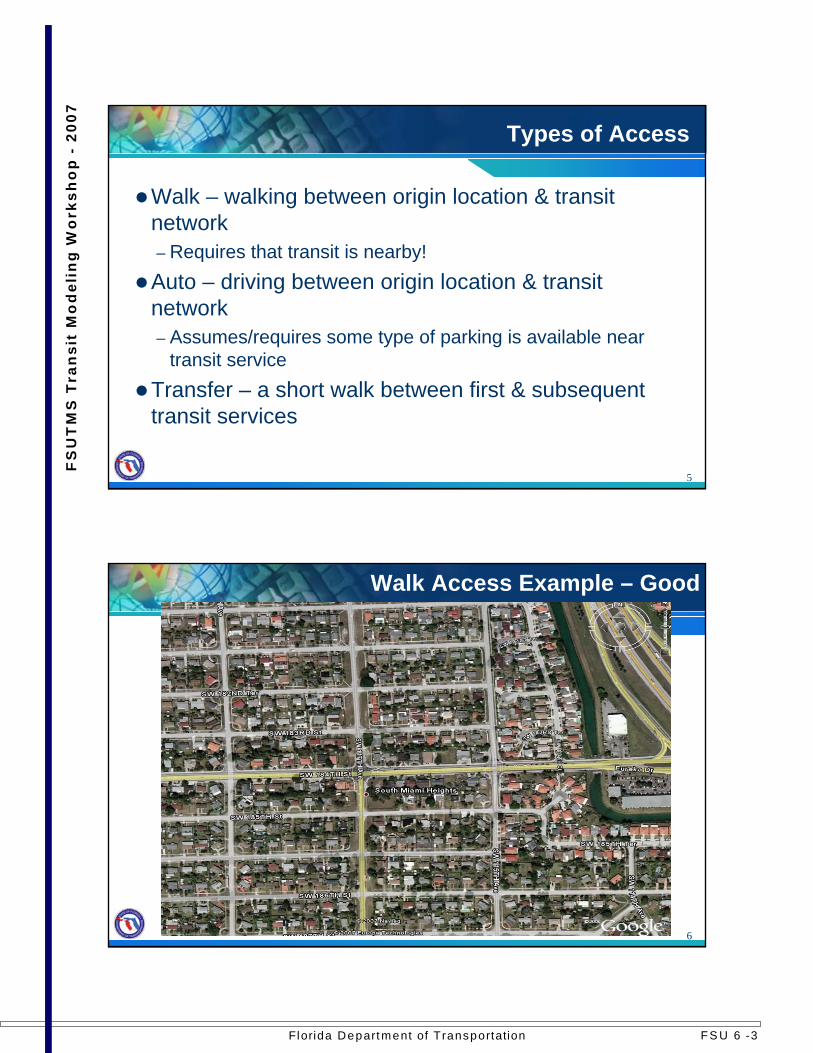
Florida Depart ment of Transportation F S U 6 -3
FS
UT
MS
Tra
nsi
t M
od
elin
g W
ork
sho
p -
2007
5
Types of Access
Walk – walking between origin location & transit network– Requires that transit is nearby!Auto – driving between origin location & transit network– Assumes/requires some type of parking is available near
transit serviceTransfer – a short walk between first & subsequent transit services
6
Walk Access Example – Good

Florida Depart ment of Transportation F S U 6 -4
FS
UT
MS
Tra
nsi
t M
od
elin
g W
ork
sho
p -
2007
7
Walk Access Example –Miami Avenue Metromover Station
8
Walk Access Example – Not Good

Florida Depart ment of Transportation F S U 6 -5
FS
UT
MS
Tra
nsi
t M
od
elin
g W
ork
sho
p -
2007
9
Auto Access Example - Mangonia Park Tri-Rail Station
10
Transfer Example – Metrorail Tri-Rail Transfer Station

Florida Depart ment of Transportation F S U 6 -6
FS
UT
MS
Tra
nsi
t M
od
elin
g W
ork
sho
p -
2007
11
Transfer Example –Golden Glades Tri-Rail Station(zoomed out)
12
Percent Walk…

Florida Depart ment of Transportation F S U 6 -7
FS
UT
MS
Tra
nsi
t M
od
elin
g W
ork
sho
p -
2007
13
Percent Walk
“Percent walks” estimate how much area of a zone is accessible to transit by walking– Assumptions
Ubiquitous access throughout zone Uniform spatial distribution of productions/attractionsNo environmental/topological barriers that impede walking
– Percent walks are necessary to avoid over-estimating trips
Definition
14
Percent Walk (Cont’d)
1129
503
Zone 503 (3+ mi2)
2000 Population – 7,700 2025 Population – 25,000
2000 Employment – 2,600 2025 Employment – 3,300
Zone 1129 (3+ mi2)
2000 Population – 13,900 2025 Population – 18,700
2000 Employment – 2,100 2025 Employment – 2,300
Large Zones

Florida Depart ment of Transportation F S U 6 -8
FS
UT
MS
Tra
nsi
t M
od
elin
g W
ork
sho
p -
2007
15
1129
503
16
Compute proportion of zonal area within walking distance to transitPurpose– Avoid over-estimating transit trips in large (>1-2 mi2) zones
while minimizing required number of paths/skims
Percent Walk (Cont’d)Zonal Access
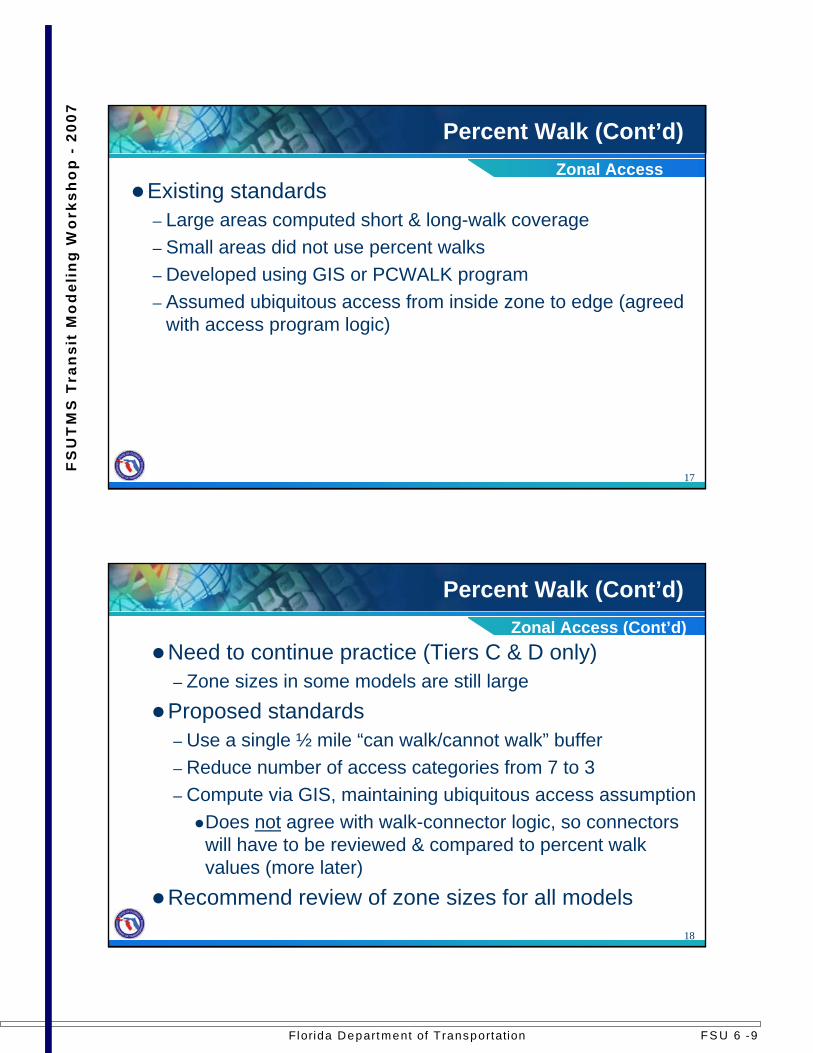
Florida Depart ment of Transportation F S U 6 -9
FS
UT
MS
Tra
nsi
t M
od
elin
g W
ork
sho
p -
2007
17
Existing standards– Large areas computed short & long-walk coverage– Small areas did not use percent walks– Developed using GIS or PCWALK program– Assumed ubiquitous access from inside zone to edge (agreed
with access program logic)
Percent Walk (Cont’d)Zonal Access
18
Percent Walk (Cont’d)
Need to continue practice (Tiers C & D only)– Zone sizes in some models are still largeProposed standards– Use a single ½ mile “can walk/cannot walk” buffer– Reduce number of access categories from 7 to 3– Compute via GIS, maintaining ubiquitous access assumption
Does not agree with walk-connector logic, so connectors will have to be reviewed & compared to percent walk values (more later)
Recommend review of zone sizes for all models
Zonal Access (Cont’d)

Florida Depart ment of Transportation F S U 6 -10
FS
UT
MS
Tra
nsi
t M
od
elin
g W
ork
sho
p -
2007
19
Example –0.5 Mile Percent Walk Buffers
Jacksonville Beach
Atlantic Beach
20
Percent Walk (Cont’d)
Attraction walk percentagefor the off-peak period
I624-295
Production walk percentagefor the off-peak period
I618-234
Attraction walk percentagefor the peak period
I612-173
Production walk percentagefor the peak period
I66-112
Zone numberI51-51
DescriptionFormatColumnsField
Records should be sorted by zone number!
PCWALK File Format

Florida Depart ment of Transportation F S U 6 -11
FS
UT
MS
Tra
nsi
t M
od
elin
g W
ork
sho
p -
2007
21
Percent Walk (Cont’d)
Use stops for buses, stops/stations for premium servicesExclude water area from calculationDouble attraction percentageReview them
Basic GIS Steps
22
Percent Walk ReviewNERPM
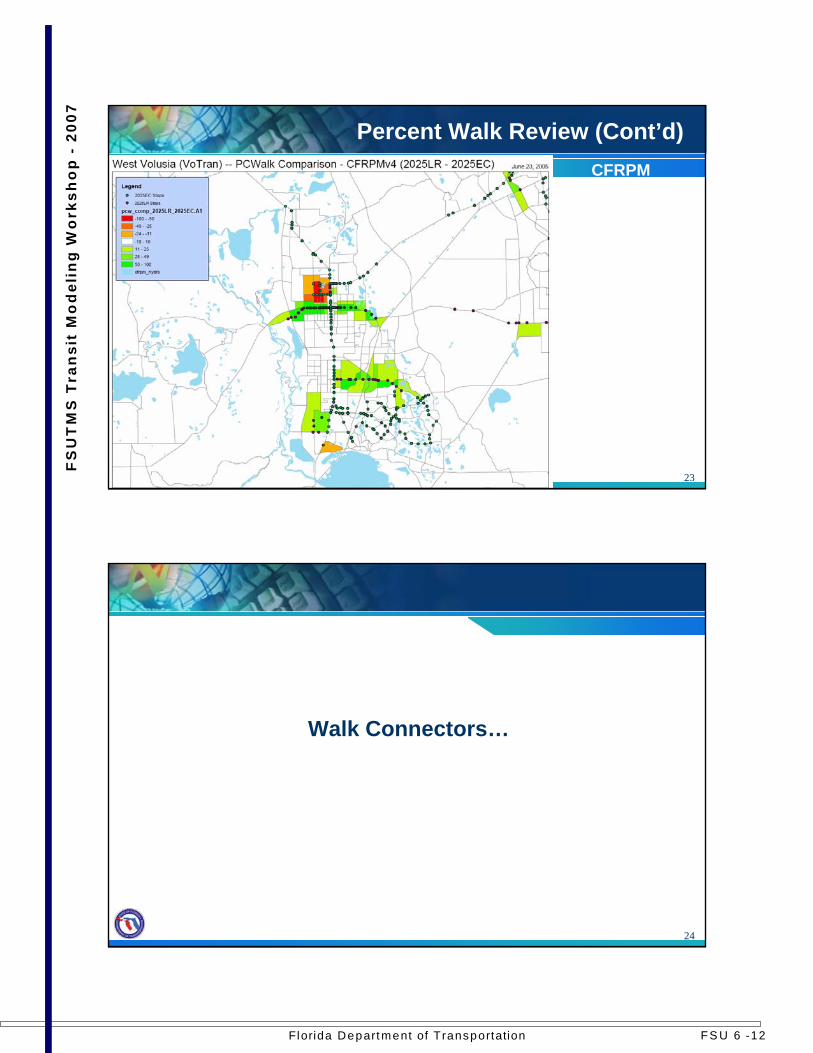
Florida Depart ment of Transportation F S U 6 -12
FS
UT
MS
Tra
nsi
t M
od
elin
g W
ork
sho
p -
2007
23
Percent Walk Review (Cont’d)CFRPM
24
Walk Connectors…

Florida Depart ment of Transportation F S U 6 -13
FS
UT
MS
Tra
nsi
t M
od
elin
g W
ork
sho
p -
2007
25
Walk Access
Relies heavily on percent walk calculations & classificationsIf percent walk is non-zero and no links from above, program “swept” surrounding nodesProblems:– Percent walks not very good
Often computed across canals and other barriersAlthough barriers were available in logic, they were seldom used “Sweeps” included many questionable connectors
FSUTMS-Tranplan Method
26
Percent Walk Continued
31
32
33
51
88
91
99
100
851
1127
1145
1146
1161
1162
1165
15091510
543
5856
5884
590459125928
5936
5948
595259685972
5976
59886004
60206028
60606080 60846088 6092 6096 6104
6198
1014410146
10148
10150
1015210154
10764
10766
10768
10770
10772
10774
10776
1121011212
11214
11216
11218
11220
11974
1197611982
11984
12106
12107
12108
12193
Zone 32:
~65% walk
Only access from zone well-represented by single centroid connector, requiring very long walk to node 6084
Walk Access
Inconsistency Example

Florida Depart ment of Transportation F S U 6 -14
FS
UT
MS
Tra
nsi
t M
od
elin
g W
ork
sho
p -
2007
27
•Extensive transit service to east of zone separated from zone by railroad with no crossings
28
Walk Access
Connector Data– Walk connectors now from PT’s GENERATE (see slide 39)– Adjust percent walks globally until better approach can be
found– Retain CODW directly on the connectors to minimize impact on
modal choice modelModifying the connector data– Special-purpose program/script to adjust connectors and/or
percent walks– Connector adjustments on slide 32Two types: centroid-to-stop; station-to-centroid
New Approach

Florida Depart ment of Transportation F S U 6 -15
FS
UT
MS
Tra
nsi
t M
od
elin
g W
ork
sho
p -
2007
29
Walk Access (Cont’d)
Standard walk connectors< 0.6 milesCentroid-to-stop
< 1.5 miles
Maximum Length
Length set artificially high to avoid disconnects between alternatives
Station-to-centroid
Description/RationaleType
Connector Types
30
Walk Access (Cont’d)
External program that coordinates percent walk and walk connectorsReads TRANSIT.MAS file for file names and parameters
REWALK

Florida Depart ment of Transportation F S U 6 -16
FS
UT
MS
Tra
nsi
t M
od
elin
g W
ork
sho
p -
2007
31
Walk Access (Cont’d)
Total number of zonesZONESA
Minimum percent walk for a zone for generating a connectorMINPCW
Buffer distance used to generate percent walksAVGWALK
Average walking speed (2.5 mph)WALKSPD
Modified PCWALK fileFPCWALKOUT
Input PCWALK fileFPCWALKIN
Modified walk access file (off-peak period)FLEGOUTMD
Modified walk access file (peak period)FLEGOUTAM
Walk access file generated by PT (off-peak period)FLEGINMD
Walk access file generated by PT (peak period)FLEGINAM
String describing the alternative scenarioDESCRIPTION
File DescriptionFile/ParameterTRANSIT.MAS
32
Walk Access (Cont’d)
Reset percent walk to 0%No
Delete all access connectors (transit likely not really that accessible at all)Reset percent walk to 0%
Yesx ≤ ~20%
Reset percent walk to 0%No
Reset length of centroid portion to ½ mileYes~20% ≤ x ≤ 100%
Reset percent walk to 0%No
No modification to access connectorsYes100%
Action/NotesTransit stop @ centroid connector?
Percent walk
Centroid-to-stop Connector Modifications
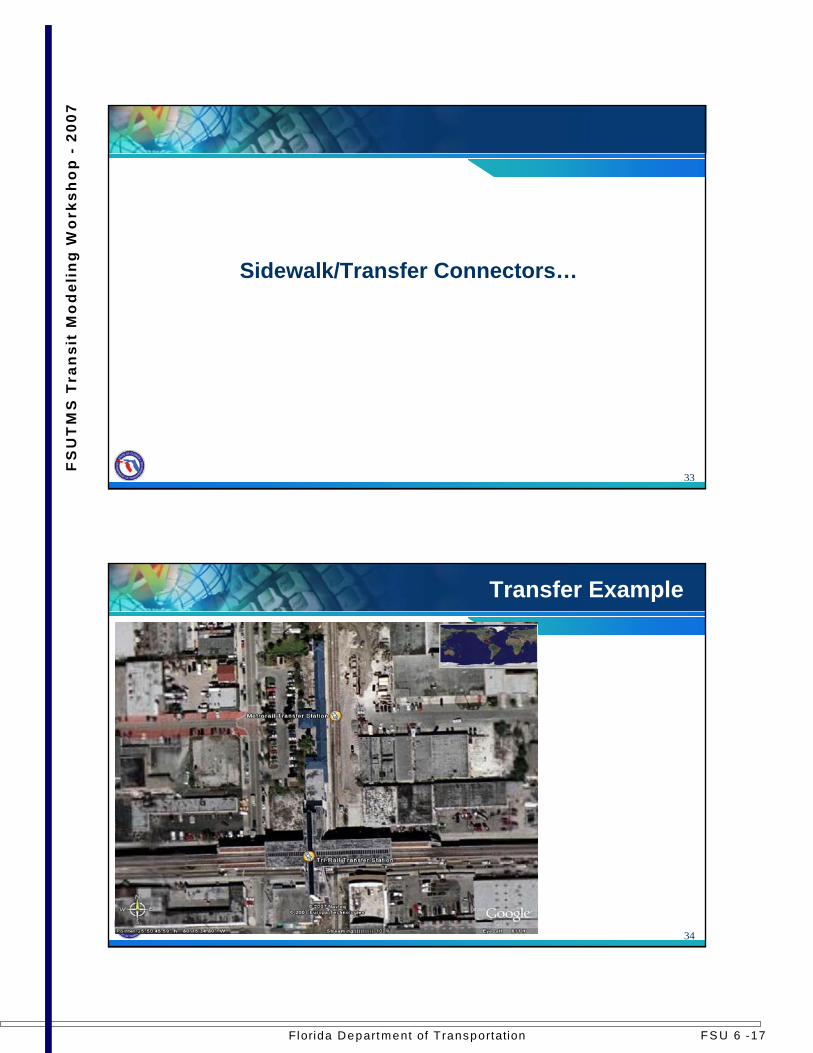
Florida Depart ment of Transportation F S U 6 -17
FS
UT
MS
Tra
nsi
t M
od
elin
g W
ork
sho
p -
2007
33
Sidewalk/Transfer Connectors…
34
Transfer Example

Florida Depart ment of Transportation F S U 6 -18
FS
UT
MS
Tra
nsi
t M
od
elin
g W
ork
sho
p -
2007
35
Sidewalk/Transfer Connectors
Allows “street-walking” to transfer between different transit lines– SIDECON produces sidewalk links around transit stations– Sidewalks coded as INET routes to reflect walkable areas
(e.g., CBDs)Both SIDECON & sidewalks are link-based and not readily-compatible with PT
Existing Method
36
Sidewalk/Transfer Connectors (Cont’d)
Needed for station micro-coding< 0.6 milesBus stop-to-fixed-guideway platforms(Escalator links)
< 0.6 miles
< 0.6 miles
Maximum Length
Replaces need for INET sidewalksBus stop-to-bus stop in CBD areas(CBD Sidewalks)
Allow for movements between fixed-guideway platforms & buses “down the street”
Fixed-guideway platforms to nearby bus stops (Station-to-nearby stops)
Description/RationaleType
All three can be generated using PT’s GENERATE keyword
New Method

Florida Depart ment of Transportation F S U 6 -19
FS
UT
MS
Tra
nsi
t M
od
elin
g W
ork
sho
p -
2007
37
Sidewalk/Transfer Connectors (Cont’d)
If True, PT will echo all legs in report fileIf False, PT will not echo legs in report file
LIST
Defines nodes that will be considered as “beginning” and “ending” nodesFROMNODE/ TONODE
INCLUDE - Defines links that should only be used in generating non-transit legs; all links not listed are excludedEXCLUDE - Defines links that should not be used in generating non-transit legs; all links not listed are included
Skimmed variable/equation
Direction of the generated non-transit legs1 – from→to node2 – to→from node3 – both directions
Variable/equation that determines minimum path
Description
INCLUDELINK/ EXCLUDELINK
EXTRACTCOST
DIRECTION
COST
NameGENERATE Keywords
38
Sidewalk/Transfer Connectors (Cont’d)
Determines whether to use one-way links in the network in one direction or in both
If true, use only A→B directionIf false, use both directions
ONEWAY
Mode for non-transit legs
Minimum value of COST
Maximum number of non-transit legs per mode
Maximum value of COST
Description
NTLEGMODE
MINCOST
MAXNTLEGS
MAXCOST
Name
GENERATE Keywords

Florida Depart ment of Transportation F S U 6 -20
FS
UT
MS
Tra
nsi
t M
od
elin
g W
ork
sho
p -
2007
39
(ZONESA+1) –99999
(ZONESA+1) –99999CBD Nodes1 – ZONESA (ZONESA+1) –
99999TONODE
StationsStationsCBD NodesStations1 – ZONESAFROMNODE
Freeways--FreewaysFreewaysFreewaysEXCLUDELINK
--59------INCLUDELINK
Time (using 2.5 mph walking speed)EXTRACTCOST
----------MINCOST
0.60.60.61.50.6MAXCOST
DistanceDistanceDistanceDistanceDistanceCOST
Station-nearby stops
Escalator links
CBD sidewalks
Station-centroidCentroid-stop
TransferWalkKeyword
Sidewalk/Transfer Connectors (Cont’d)GENERATE Default Values
ZONESA is the highest node number
40
Sidewalk/Transfer Connectors (Cont’d)
FalseLIST
FalseONEWAY
3DIRECTION
9999999999MAXNTLEGS
11111211NTLEGMODE
Station-nearby stops
Escalator links
CBD sidewalks
Station-centroidCentroid-stop
TransferWalkKeyword
GENERATE Default Values
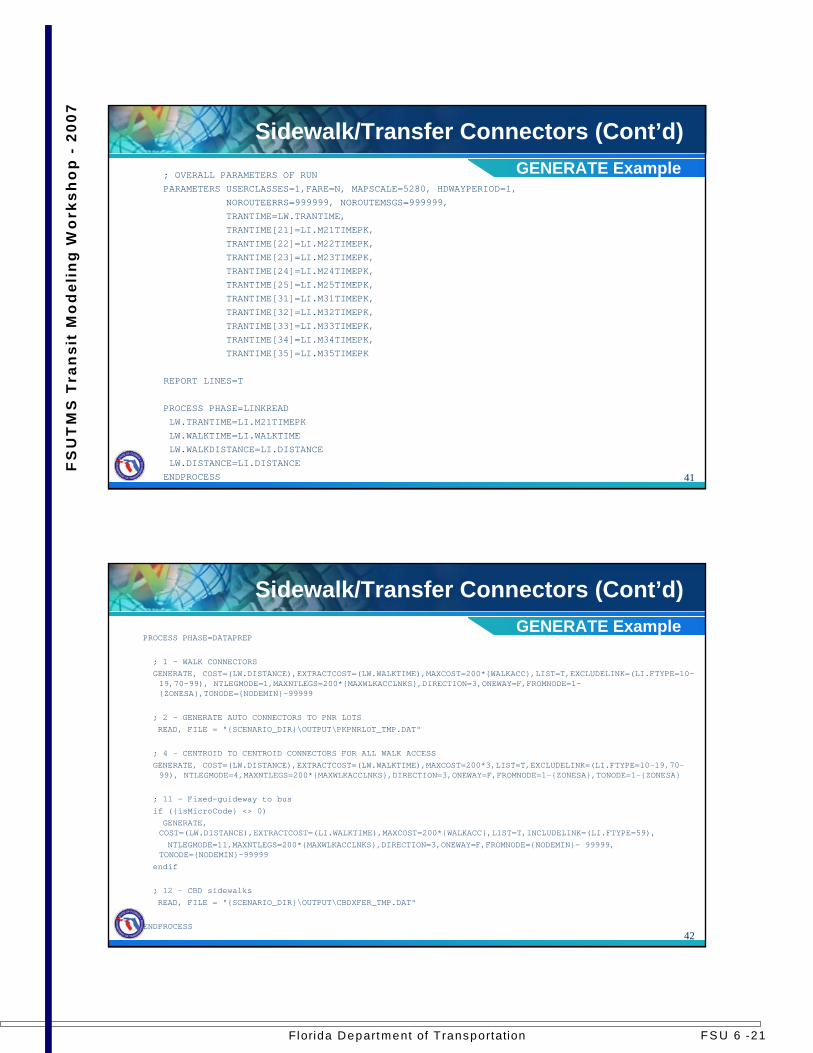
Florida Depart ment of Transportation F S U 6 -21
FS
UT
MS
Tra
nsi
t M
od
elin
g W
ork
sho
p -
2007
41
Sidewalk/Transfer Connectors (Cont’d); OVERALL PARAMETERS OF RUN
PARAMETERS USERCLASSES=1,FARE=N, MAPSCALE=5280, HDWAYPERIOD=1,
NOROUTEERRS=999999, NOROUTEMSGS=999999,
TRANTIME=LW.TRANTIME,
TRANTIME[21]=LI.M21TIMEPK,
TRANTIME[22]=LI.M22TIMEPK,
TRANTIME[23]=LI.M23TIMEPK,
TRANTIME[24]=LI.M24TIMEPK,
TRANTIME[25]=LI.M25TIMEPK,
TRANTIME[31]=LI.M31TIMEPK,
TRANTIME[32]=LI.M32TIMEPK,
TRANTIME[33]=LI.M33TIMEPK,
TRANTIME[34]=LI.M34TIMEPK,
TRANTIME[35]=LI.M35TIMEPK
REPORT LINES=T
PROCESS PHASE=LINKREAD
LW.TRANTIME=LI.M21TIMEPK
LW.WALKTIME=LI.WALKTIME
LW.WALKDISTANCE=LI.DISTANCE
LW.DISTANCE=LI.DISTANCE
ENDPROCESS
GENERATE Example
42
Sidewalk/Transfer Connectors (Cont’d)
PROCESS PHASE=DATAPREP
; 1 - WALK CONNECTORSGENERATE, COST=(LW.DISTANCE),EXTRACTCOST=(LW.WALKTIME),MAXCOST=200*{WALKACC},LIST=T,EXCLUDELINK=(LI.FTYPE=10-19,70-99), NTLEGMODE=1,MAXNTLEGS=200*{MAXWLKACCLNKS},DIRECTION=3,ONEWAY=F,FROMNODE=1-{ZONESA},TONODE={NODEMIN}-99999
; 2 - GENERATE AUTO CONNECTORS TO PNR LOTSREAD, FILE = "{SCENARIO_DIR}\OUTPUT\PKPNRLOT_TMP.DAT"
; 4 - CENTROID TO CENTROID CONNECTORS FOR ALL WALK ACCESSGENERATE, COST=(LW.DISTANCE),EXTRACTCOST=(LW.WALKTIME),MAXCOST=200*3,LIST=T,EXCLUDELINK=(LI.FTYPE=10-19,70-99), NTLEGMODE=4,MAXNTLEGS=200*{MAXWLKACCLNKS},DIRECTION=3,ONEWAY=F,FROMNODE=1-{ZONESA},TONODE=1-{ZONESA}
; 11 - Fixed-guideway to busif ({isMicroCode} <> 0)GENERATE, COST=(LW.DISTANCE),EXTRACTCOST=(LI.WALKTIME),MAXCOST=200*{WALKACC},LIST=T,INCLUDELINK=(LI.FTYPE=59),NTLEGMODE=11,MAXNTLEGS=200*{MAXWLKACCLNKS},DIRECTION=3,ONEWAY=F,FROMNODE={NODEMIN}- 99999,
TONODE={NODEMIN}-99999endif
; 12 - CBD sidewalksREAD, FILE = "{SCENARIO_DIR}\OUTPUT\CBDXFER_TMP.DAT"
ENDPROCESS
GENERATE Example

Florida Depart ment of Transportation F S U 6 -22
FS
UT
MS
Tra
nsi
t M
od
elin
g W
ork
sho
p -
2007
43
Auto Connectors…
44
Auto Access Example –Fort Lauderdale Tri-Rail Station

Florida Depart ment of Transportation F S U 6 -23
FS
UT
MS
Tra
nsi
t M
od
elin
g W
ork
sho
p -
2007
45
Auto Access Connectors
Existing method– Used AUTOCON logic to create auto-transit connectors
between centroids and park-and-ridesAvoided backtracking and excessive drive timeHad problem of disconnecting some zones between alternatives; slightly impacting user benefits
New approach– Maintain using AUTOCON program– Adding function to exaggerate time on connectors beyond
rangeModifications to connectors needed (see next slide)
46
Auto Access Connectors (Cont’d)
Output files are in Cube’s PT formatEmbeded station costs to auto-transit connectors– Driving time 1.5x– Terminal time 2.0x– Station parking cost $6/hr (peak), $3/hr (off-peak)– Auto operating cost $6/hr (peak), $3/hr (off-peak)Auto access connectors passed to mode choice as in-vehicle travel time (IVTT) since already weightedSeparate connectors needed to bus and rail platforms– Why? PT does not allow consecutive non-transit legs
New Method

Florida Depart ment of Transportation F S U 6 -24
FS
UT
MS
Tra
nsi
t M
od
elin
g W
ork
sho
p -
2007
47
Auto Access Connectors (Cont’d)
PT’s GENERATE generates circular catchment areas
AUTOCON’s logic applies backtracking logic
Comparison
48
Auto Acess Connectors (Cont’d)
Command-line argument ‘AM’ builds connectors for peak period; ‘MD’ for off-peak periodReads TRANSIT.MAS file for file names and parameters
AUTOCON

Florida Depart ment of Transportation F S U 6 -25
FS
UT
MS
Tra
nsi
t M
od
elin
g W
ork
sho
p -
2007
49
Auto Access Connectors (Cont’d)
Transit line fileTRANSITLINEFILE
Nodes/coordinate fileNODESFILE
Off-peak period highway skims (Tranplan)FHSKIMS
Peak period highway skims (Tranplan)RHSKIMS
Zonal deletion files (off-peak period)AUTODELFILEMD
Zonal deletion files (peak period)AUTODELFILEAM
Manual connector over-ride (off-peak period)XTRAAUTOFILEMD
Manual connector over-ride (peak period)XTRAAUTOFILEAM
Station data fileSTATDATAFILE
File DescriptionFileInput Files
50
Drive access connectors with drive-access time (off-peak period)AUTODATMDDrive access connectors with drive-access time (peak period)AUTODATAMReports that break down the cost on connectorsACONLISTMDReports that break down the cost on connectorsACONLISTAMDrive access connectors with total cost (off-peak period)AUTOMDDrive access connectors with total cost (peak period)AUTOAMStandard AUTOCON report fileAUTOCONRPT
File DescriptionName
Output Files
Auto Access Connectors (Cont’d)

Florida Depart ment of Transportation F S U 6 -26
FS
UT
MS
Tra
nsi
t M
od
elin
g W
ork
sho
p -
2007
51
Auto Access Connectors (Cont’d)
Mode priority for building connectorsDesignates if the mode is premium or notMaximum mode number used in the modelCoordinate units per mile
Amount of backtracking required as compared to the distance to the CBDMaximum distance connector is able to backtrackFlag whether to find alternative connector (1, if yes)Assumed terminal time (in minutes) at the home endString describing alternative scenarioZone that represent core of CBD areaTotal number of internal zonesTotal number of zones
Description
MODEPRIORITYPREMIUMFLAGMAXMODEUNITS
0.3BACKPC4BACKD1NOPT2TERM
DESCRIPTIONCBDZONEZONESIZONESA
Value ParameterParameters
52
Auto Access Connectors (Cont’d)
Inflation factor for parking costInflation factor for auto operating costInflation factor for transit fareAuto operating cost (cents per mile)Auto occupancy for kiss-ride tripsAuto occupancy for park-ride tripsRatio of drive-access time to transit IVT time coefficients (off-peak)Ratio of drive-access time to transit IVT time coefficients (peak)Ratio of OVT time to transit IVT time coefficients (off-peak period)Ratio of OVT time to transit IVT time coefficients (peak period)Value of time ($/hr) (off-peak period)Value of time ($/hr) (peak period)
Description
1.0INFLPARKINGCOST1.0INFLAOC1.0INFLTRANSITFARE9.5AOC1.2AUTOCCKNR1.2AUTOCCPNR1.5AATRATIOMD1.5AATRATIOAM2.0OVTRATIOMD2.0OVTRATIOAM3.0VOTMD6.0VOTAM
ValueParameter
Parameters

Florida Depart ment of Transportation F S U 6 -27
FS
UT
MS
Tra
nsi
t M
od
elin
g W
ork
sho
p -
2007
53
Auto Access Connectors (Cont’d)
Parking lot nameA2456-7911Active flagI353-5510Kiss-ride terminal timeF6.147-529Park-ride terminal timeF6.141-468Off-peak period parking cost (in cents)I635-407Peak period parking cost (in cents)I629-346Parking spacesI623-285Service area (in miles)F6.117-224Nearest zone to the parking lotI611-163Station nodeI65-102Station numberI41-41DescriptionFormatColumnsField
This file is created within the model stream.
Input File FormatStation Data File
54
Auto Access Connectors (Cont’d)
Total cost of over-ride linkF10.215-244
Station node numberI69-143
Origin node numberI63-82
If blank, add the link, if a dash (‘-’) remove the link
A111DescriptionFormatColumnsField
Input File Format XTARAUTOFILEAM & XTRAAUTOFILEMD Files
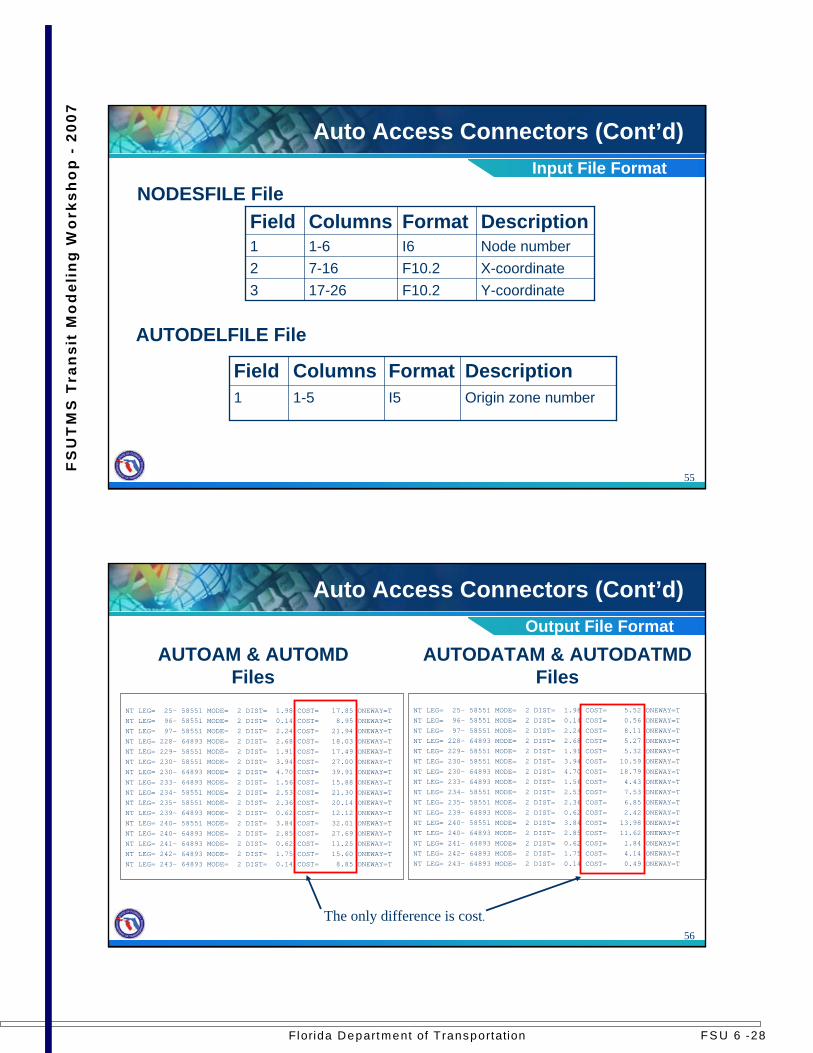
Florida Depart ment of Transportation F S U 6 -28
FS
UT
MS
Tra
nsi
t M
od
elin
g W
ork
sho
p -
2007
55
Auto Access Connectors (Cont’d)
NODESFILE File
Y-coordinateF10.217-263X-coordinateF10.27-162Node numberI61-61DescriptionFormatColumnsField
AUTODELFILE File
Origin zone number I51-51
DescriptionFormatColumnsField
Input File Format
56
Auto Access Connectors (Cont’d)
NT LEG= 25- 58551 MODE= 2 DIST= 1.98 COST= 17.85 ONEWAY=TNT LEG= 96- 58551 MODE= 2 DIST= 0.14 COST= 8.95 ONEWAY=TNT LEG= 97- 58551 MODE= 2 DIST= 2.24 COST= 21.94 ONEWAY=TNT LEG= 228- 64893 MODE= 2 DIST= 2.68 COST= 18.03 ONEWAY=T
NT LEG= 229- 58551 MODE= 2 DIST= 1.91 COST= 17.49 ONEWAY=TNT LEG= 230- 58551 MODE= 2 DIST= 3.94 COST= 27.00 ONEWAY=TNT LEG= 230- 64893 MODE= 2 DIST= 4.70 COST= 39.91 ONEWAY=T
NT LEG= 233- 64893 MODE= 2 DIST= 1.56 COST= 15.88 ONEWAY=TNT LEG= 234- 58551 MODE= 2 DIST= 2.53 COST= 21.30 ONEWAY=TNT LEG= 235- 58551 MODE= 2 DIST= 2.36 COST= 20.14 ONEWAY=TNT LEG= 239- 64893 MODE= 2 DIST= 0.62 COST= 12.12 ONEWAY=T
NT LEG= 240- 58551 MODE= 2 DIST= 3.84 COST= 32.01 ONEWAY=TNT LEG= 240- 64893 MODE= 2 DIST= 2.85 COST= 27.69 ONEWAY=TNT LEG= 241- 64893 MODE= 2 DIST= 0.62 COST= 11.25 ONEWAY=T
NT LEG= 242- 64893 MODE= 2 DIST= 1.75 COST= 15.60 ONEWAY=TNT LEG= 243- 64893 MODE= 2 DIST= 0.14 COST= 8.85 ONEWAY=T
NT LEG= 25- 58551 MODE= 2 DIST= 1.98 COST= 5.52 ONEWAY=TNT LEG= 96- 58551 MODE= 2 DIST= 0.14 COST= 0.56 ONEWAY=T
NT LEG= 97- 58551 MODE= 2 DIST= 2.24 COST= 8.11 ONEWAY=TNT LEG= 228- 64893 MODE= 2 DIST= 2.68 COST= 5.27 ONEWAY=TNT LEG= 229- 58551 MODE= 2 DIST= 1.91 COST= 5.32 ONEWAY=TNT LEG= 230- 58551 MODE= 2 DIST= 3.94 COST= 10.59 ONEWAY=T
NT LEG= 230- 64893 MODE= 2 DIST= 4.70 COST= 18.79 ONEWAY=TNT LEG= 233- 64893 MODE= 2 DIST= 1.56 COST= 4.43 ONEWAY=TNT LEG= 234- 58551 MODE= 2 DIST= 2.53 COST= 7.53 ONEWAY=T
NT LEG= 235- 58551 MODE= 2 DIST= 2.36 COST= 6.85 ONEWAY=TNT LEG= 239- 64893 MODE= 2 DIST= 0.62 COST= 2.42 ONEWAY=TNT LEG= 240- 58551 MODE= 2 DIST= 3.84 COST= 13.98 ONEWAY=TNT LEG= 240- 64893 MODE= 2 DIST= 2.85 COST= 11.62 ONEWAY=T
NT LEG= 241- 64893 MODE= 2 DIST= 0.62 COST= 1.84 ONEWAY=TNT LEG= 242- 64893 MODE= 2 DIST= 1.75 COST= 4.14 ONEWAY=TNT LEG= 243- 64893 MODE= 2 DIST= 0.14 COST= 0.49 ONEWAY=T
The only difference is cost.
Output File Format
AUTOAM & AUTOMD Files
AUTODATAM & AUTODATMD Files

Florida Depart ment of Transportation F S U 6 -29
FS
UT
MS
Tra
nsi
t M
od
elin
g W
ork
sho
p -
2007
57
ACONLISTAM & ACONLISTAM filesACONLISTAM & ACONLISTAM files
DRIVEDRIVE--ACCESS LEG COMPONENT BREAKDOWNACCESS LEG COMPONENT BREAKDOWN
STATION DATA DRIVESTATION DATA DRIVE--ACCESS TIME AUTO OPERATING COST WGTD PACCESS TIME AUTO OPERATING COST WGTD PARK & ACCESS TIME TOTALARK & ACCESS TIME TOTAL
I NODE RNG DIST IDAT ODAT WODAT TDAT AATR I NODE RNG DIST IDAT ODAT WODAT TDAT AATR WGTD AOCR AOC INFL VOT AO WGTD WPARK WACT WTWGTD AOCR AOC INFL VOT AO WGTD WPARK WACT WTERM SUBT WGTDERM SUBT WGTD
------ -------- ------ ------+ + -------- -------- ---------- -------- -------- ------+ + -------- -------- -------- ------ ------ ------+ + ---------- -------- ---------- ------+ + --------++
25 58551 0.05 1.98 5.52 0.00 25 58551 0.05 1.98 5.52 0.00 0.000.00 5.52 1.50 8.28 9.50 18.81 1.00 0.10 1.20 1.57 5.52 1.50 8.28 9.50 18.81 1.00 0.10 1.20 1.57 0.00 4.00 0.00 4.00 4.004.00 8.00 17.858.00 17.85
96 58551 0.05 0.14 0.56 0.00 96 58551 0.05 0.14 0.56 0.00 0.000.00 0.56 1.50 0.84 9.50 1.33 1.00 0.10 1.20 0.11 0.56 1.50 0.84 9.50 1.33 1.00 0.10 1.20 0.11 0.00 4.00 0.00 4.00 4.004.00 8.00 8.958.00 8.95
97 58551 0.05 2.24 8.11 0.00 97 58551 0.05 2.24 8.11 0.00 0.000.00 8.11 1.50 12.16 9.50 21.28 1.00 0.10 1.20 1.77 8.11 1.50 12.16 9.50 21.28 1.00 0.10 1.20 1.77 0.00 4.00 0.00 4.00 4.004.00 8.00 21.948.00 21.94
228 64893 0.05 2.68 5.27 0.00 228 64893 0.05 2.68 5.27 0.00 0.000.00 5.27 1.50 7.90 9.50 25.46 1.00 0.10 1.20 2.12 5.27 1.50 7.90 9.50 25.46 1.00 0.10 1.20 2.12 0.00 4.00 0.00 4.00 4.004.00 8.00 18.038.00 18.03
229 58551 0.05 1.91 5.32 0.00 229 58551 0.05 1.91 5.32 0.00 0.000.00 5.32 1.50 7.98 9.50 18.15 1.00 0.10 1.20 1.51 5.32 1.50 7.98 9.50 18.15 1.00 0.10 1.20 1.51 0.00 4.00 0.00 4.00 4.004.00 8.00 17.498.00 17.49
230 58551 0.05 3.94 10.59 0.00 230 58551 0.05 3.94 10.59 0.00 0.000.00 10.59 1.50 15.89 9.50 37.43 1.00 0.10 1.20 3.12 10.59 1.50 15.89 9.50 37.43 1.00 0.10 1.20 3.12 0.00 4.00 0.00 4.00 4.004.00 8.00 27.008.00 27.00
230 64893 0.05 4.70 18.79 0.00 230 64893 0.05 4.70 18.79 0.00 0.000.00 18.79 1.50 28.19 9.50 44.65 1.00 0.10 1.20 3.72 18.79 1.50 28.19 9.50 44.65 1.00 0.10 1.20 3.72 0.00 4.00 0.00 4.00 4.004.00 8.00 39.918.00 39.91
233 64893 0.05 1.56 4.43 0.00 233 64893 0.05 1.56 4.43 0.00 0.000.00 4.43 1.50 6.64 9.50 14.82 1.00 0.10 1.20 1.23 4.43 1.50 6.64 9.50 14.82 1.00 0.10 1.20 1.23 0.00 4.00 0.00 4.00 4.004.00 8.00 15.888.00 15.88
234 58551 0.05 2.53 7.53 0.00 234 58551 0.05 2.53 7.53 0.00 0.000.00 7.53 1.50 11.30 9.50 24.03 1.00 0.10 1.20 2.00 7.53 1.50 11.30 9.50 24.03 1.00 0.10 1.20 2.00 0.00 4.00 0.00 4.00 4.004.00 8.00 21.308.00 21.30
235 58551 0.05 2.36 6.85 0.00 235 58551 0.05 2.36 6.85 0.00 0.000.00 6.85 1.50 10.27 9.50 22.42 1.00 0.10 1.20 1.87 6.85 1.50 10.27 9.50 22.42 1.00 0.10 1.20 1.87 0.00 4.00 0.00 4.00 4.004.00 8.00 20.148.00 20.14
239 64893 0.05 0.62 2.42 0.00 239 64893 0.05 0.62 2.42 0.00 0.000.00 2.42 1.50 3.63 9.50 5.89 1.00 0.10 1.20 0.49 2.42 1.50 3.63 9.50 5.89 1.00 0.10 1.20 0.49 0.00 4.00 0.00 4.00 4.004.00 8.00 12.128.00 12.12
240 58551 0.05 3.84 13.98 0.00 240 58551 0.05 3.84 13.98 0.00 0.000.00 13.98 1.50 20.97 9.50 36.48 1.00 0.10 1.20 3.04 13.98 1.50 20.97 9.50 36.48 1.00 0.10 1.20 3.04 0.00 4.00 0.00 4.00 4.004.00 8.00 32.018.00 32.01
240 64893 0.05 2.85 11.62 0.00 240 64893 0.05 2.85 11.62 0.00 0.000.00 11.62 1.50 17.43 9.50 27.08 1.00 0.10 1.20 2.26 11.62 1.50 17.43 9.50 27.08 1.00 0.10 1.20 2.26 0.00 4.00 0.00 4.00 4.004.00 8.00 27.698.00 27.69
241 64893 0.05 0.62 1.84 0.00 241 64893 0.05 0.62 1.84 0.00 0.000.00 1.84 1.50 2.76 9.50 5.89 1.00 0.10 1.20 0.49 1.84 1.50 2.76 9.50 5.89 1.00 0.10 1.20 0.49 0.00 4.00 0.00 4.00 4.004.00 8.00 11.258.00 11.25
242 64893 0.05 1.75 4.14 0.00 242 64893 0.05 1.75 4.14 0.00 0.000.00 4.14 1.50 6.21 9.50 16.63 1.00 0.10 1.20 1.39 4.14 1.50 6.21 9.50 16.63 1.00 0.10 1.20 1.39 0.00 4.00 0.00 4.00 4.004.00 8.00 15.608.00 15.60
243 64893 0.05 0.14 0.49 0.00 243 64893 0.05 0.14 0.49 0.00 0.000.00 0.49 1.50 0.74 9.50 1.33 1.00 0.10 1.20 0.11 0.49 1.50 0.74 9.50 1.33 1.00 0.10 1.20 0.11 0.00 4.00 0.00 4.00 4.004.00 8.00 8.858.00 8.85
Definitions on the next slide …
Auto Access Connectors (Cont’d)Output File Format
58
Auto Access Connectors (Cont’d)
21
20
19
18
17
16
15
14
13
12
11
10
9
8
7
6
5
4
3
2
1
Column
Total cost on the auto connectorWGTD
Subtotal of parking cost, access time and terminal timeSUBT
Weighted terminal time at the parking station-endWTERM
Weighted access time at the home-endWACT
Weighted parking costWPARK
Weighted auto occupancy costWGTD
Auto occupancy factor AO
Value of timeVOT
Inflation rateINFL
Auto occupancy costAOC
Auto occupancy rateAOCR
Total weighted auto access timeWGTD
Auto access travel time factorAATR
Total driving timeTDAT
Weighted out of range driving timeWODAT
Driving time outside the service rangeODAT
Driving time within the service rangeIDAT
Length of the generated auto connectorDIST
Service area (in miles) of the park-ride lotRNG
Node number of the park-ride lotNODE
Zone numberI
DescriptionHeadingACONLIST File

Florida Depart ment of Transportation F S U 6 -30
FS
UT
MS
Tra
nsi
t M
od
elin
g W
ork
sho
p -
2007
59
Auto Access Connectors (Cont’d)Example
60
When are zones too big?

Florida Depart ment of Transportation F S U 6 -31
FS
UT
MS
Tra
nsi
t M
od
elin
g W
ork
sho
p -
2007
61
Why are large zones a problem?
Increases aggregation error with virtually all model elements– Land Use: large amount of activity in expansive zones– Highway modeling: unrealistic (“overburdened”)
assignment– Zonal access, Mode Choice
Centroid connectorsIncorrect or over-estimation of accessibility
– Path-Builders/Assignment MethodsAbility to access highway & transit networks
Loses forecasting accuracy
62
Tips for Zone Size Checking
Activity/size check (see next slides)Multiple study objectives fall within a single zone (multiple stations in a zone)Centroid connectors that cross over streets or other zonesLarge growth in model “edges” (i.e., population growth in rural or far out suburbs)

Florida Depart ment of Transportation F S U 6 -32
FS
UT
MS
Tra
nsi
t M
od
elin
g W
ork
sho
p -
2007
63
Methodology
One record per zone:– Zonal area– Base year activity– Future year activity
Develop cumulative plot of the 3 fields“Activity” is defined as:
Activity = Population + 2*Employment
64
Zone Size - Orlando (OUATS)
OUATS - Cumulative frequency plots - All Zones (Activity)
0
10
20
30
40
50
60
70
80
90
100
0.00 0.25 0.50 0.75 1.00 1.25 1.50 1.75 2.00 2.25 2.50 2.75 3.00
Zonal Area (in sq mi)
Perc
entil
e
NUMBER OF ZONES ACTIVITY_2000 ACTIVITY_2025

Florida Depart ment of Transportation F S U 6 -33
FS
UT
MS
Tra
nsi
t M
od
elin
g W
ork
sho
p -
2007
65
Zone Size - Southeast Florida (SERPM)
SERPM6 - Cumulative Frequency Plots (Activity)
0
10
20
30
40
50
60
70
80
90
100
0.00 0.25 0.50 0.75 1.00 1.25 1.50 1.75 2.00 2.25 2.50 2.75 3.00
Zonal Area (in sq mi)
Perc
entil
e
NUMBER OF ZONES ACTIVITY_2000 ACTIVITY_2030
66
Zone Size - Jacksonville (JUATS)
JUATS - Cumulative Percentile Plots (Activity)
0
10
20
30
40
50
60
70
80
90
100
0 0.25 0.5 0.75 1 1.25 1.5 1.75 2 2.25 2.5 2.75 3
Area of zone (in sq mi)
Perc
entil
e
Zones Acitivity_98 Acitivity_25
Florida Depart ment of Transportation F S U 6 -34
FS
UT
MS
Tra
nsi
t M
od
elin
g W
ork
sho
p -
2007
67
Game
Game 6.1Tic-Tac-Toe
68
Computer Exercises
Transit Access
Lesson 6

Florida Depart ment of Transportation F S U 6 -35
FS
UT
MS
Tra
nsi
t M
od
elin
g W
ork
sho
p -
2007
69
Lesson 6 Exercises
In this exercise you will complete the following:6.1 – Updating Percent Walk6.2 – Generate Walk Connectors
70
Updating Percent WalkExercise 6.1
In this exercise, we will update the percent walk file.
Step 1 Instructions: Navigate to the Olympus Model
1. Click on the FSUTMS Launcher icon
2. Select District 1 from the FSUTMS interface
3. Select Olympus Training Model
2
3
1

Florida Depart ment of Transportation F S U 6 -36
FS
UT
MS
Tra
nsi
t M
od
elin
g W
ork
sho
p -
2007
71
Updating Percent Walk
Step 2 Instructions: Open the percent walk file.
Navigate to C:\FSUTMS\general\OlympusTrainingModel\base\input.Open the file, pcwalk00b.dat in a text editor.
Exercise 6.1 (Cont’d)
72
Updating Percent Walk
Step 2 Instructions: Open the percent walk file (cont’d).
Note: Column 1 is the TAZ number. Columns 2 and 4 are the percentages of each TAZ within a half mile of a transit stop. These represent the productions for peak and off-peak, respectively. Columns 3 and 5 are double the values of columns 2 and 4, respectively. These represent the attractions for peak and off-peak, respectively. Each percent walk column (2, 3, 4, and 5) has an upper limit of 100.
1 2 3 4 5
Exercise 6.1 (Cont’d)

Florida Depart ment of Transportation F S U 6 -37
FS
UT
MS
Tra
nsi
t M
od
elin
g W
ork
sho
p -
2007
73
Updating Percent WalkStep 3 Instructions: Edit
percent walk file.
Using the screenshot on this slide, calculate the percent walk for each zone displayed.Estimate the percentages by sight alone.The grey circles represent half mile radius coveragesover each zone.The darker, thicker lines represent TAZ boundaries.Save your edits when you are finished and close the percent walk file.
Exercise 6.1 (Cont’d)
74
Generate Walk ConnectorsStep 1 Instructions: Open
the peak access script.
1.Click the TNETPREPapplication in the Applications window. You may need to expand the Olympus and Transitapplications to see it.
2.Double-click the script file for Public Transport 11 Build peak access connectors.
1 2
Exercise 6.2

Florida Depart ment of Transportation F S U 6 -38
FS
UT
MS
Tra
nsi
t M
od
elin
g W
ork
sho
p -
2007
75
Generate Walk ConnectorsStep 2 Instructions: Edit
script.In the space indicated by the box in the screenshot, beneath the comment that reads ; 1 – WALK CONNECTORS, please type the lines of script that appear on the next slide.
Exercise 6.2 (Cont’d)
76
Generate Walk Connectors
GENERATE, COST=(LW.DISTANCE),EXTRACTCOST=(LW.WALKTIME),MAXCOST=200*{WALKACC},LIST=T,EXCLUDELINK=(LI.FTYPE=10-19,70-99),NTLEGMODE=1,MAXNTLEGS=200*{MAXWLKACCLNKS},DIRECTION=3,ONEWAY=F,FROMNODE=1-{ZONESA},TONODE={NODEMIN}-99999
Exercise 6.2 (Cont’d)
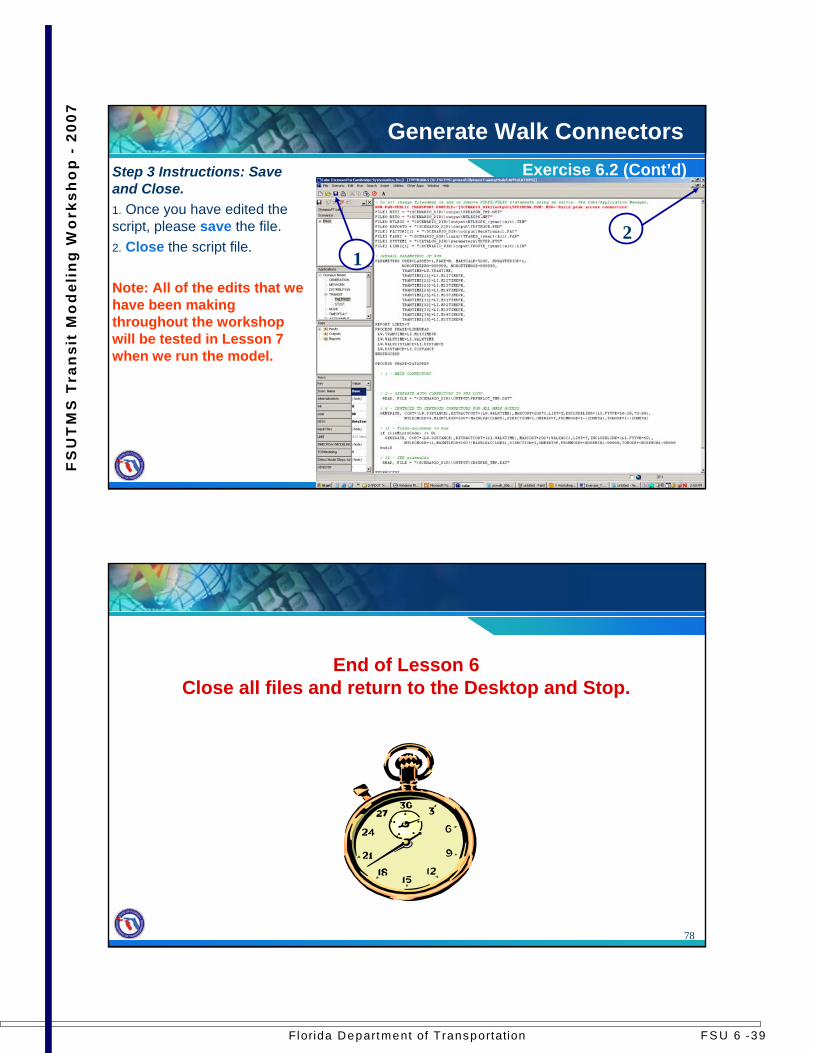
Florida Depart ment of Transportation F S U 6 -39
FS
UT
MS
Tra
nsi
t M
od
elin
g W
ork
sho
p -
2007
77
Step 3 Instructions: Save and Close.1. Once you have edited the script, please save the file.2. Close the script file.
Note: All of the edits that we have been making throughout the workshop will be tested in Lesson 7 when we run the model.
Generate Walk Connectors
21
Exercise 6.2 (Cont’d)
78
End of Lesson 6Close all files and return to the Desktop and Stop.

Florida Depart ment of Transportation F S U 6 -40
FS
UT
MS
Tra
nsi
t M
od
elin
g W
ork
sho
p -
2007
79
Summary
In this lesson we covered:Overview of transit accessPercent walksWalk connectorsSidewalk/transfer connectorsAuto connectorsWhen are zones too big?
80
Notes

Florida Department of Transportation FSU 7 -1
FSU
TMS
Tran
sit
Mod
elin
g W
orks
hop
-200
7
1
PT, show me the way(Transit Path-Building)
Lesson 7
2
Lesson Goals
In this lesson we will cover:Transit path-building– Determines the best transit option for going from an origin
to a destination (IJ pair)Transit skims– Characteristics of the transit pathPath conditioning– Removing paths from consideration

Florida Department of Transportation FSU 7 -2
FSU
TMS
Tran
sit
Mod
elin
g W
orks
hop
-200
7
3
Background
So far, we have learned: – How to represent the characteristics of transit service in
the regionTransit networkTransit speedsFare structure, modes, operators, waits, etc.
– How to access a transit stop from a zone– How to egress from a transit stop to go to a destination
zoneOur next goal is to find our transit paths
4
Transit Path-Building
Determines best transit option for each IJ pair– Based on cost of boarding
transit and transferringNumber of paths– Controlled by the mode
choice structureExample– ‘Walk-transit’ & ‘drive-
transit’ – 2 userclasses per period– Peak and off-peak periods
Transit
Walk Access Drive Access
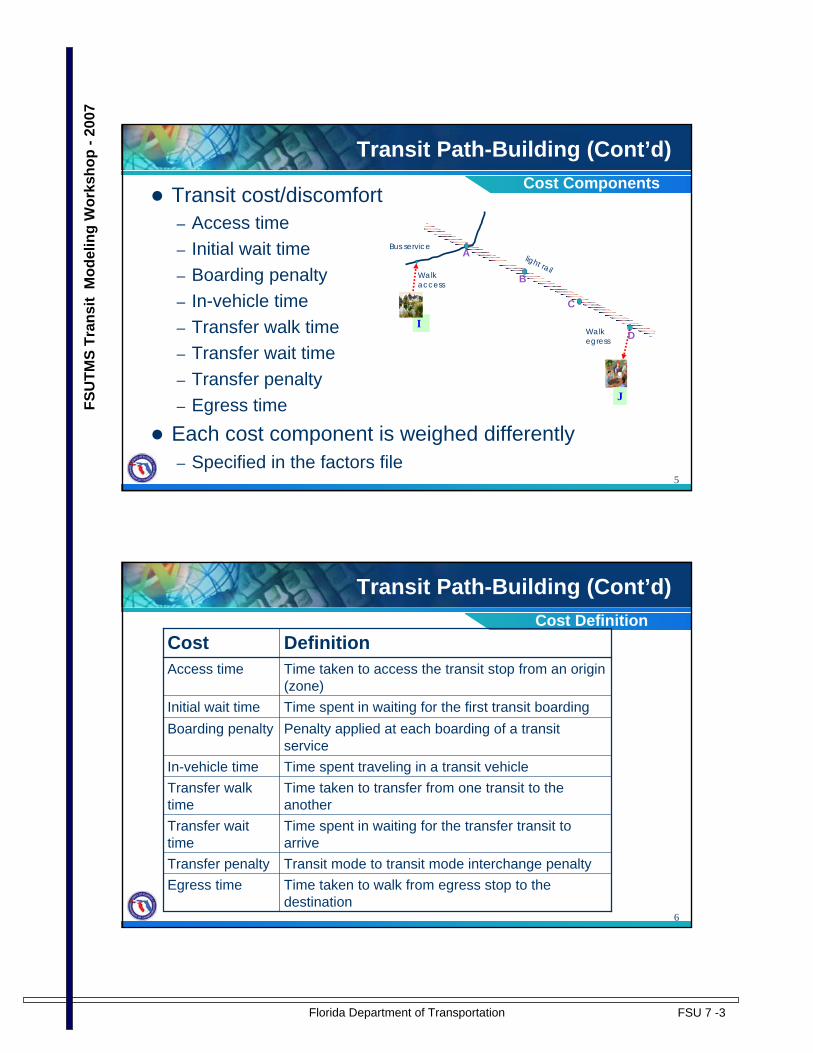
Florida Department of Transportation FSU 7 -3
FSU
TMS
Tran
sit
Mod
elin
g W
orks
hop
-200
7
5
Transit Path-Building (Cont’d)
Transit cost/discomfort– Access time– Initial wait time– Boarding penalty– In-vehicle time– Transfer walk time– Transfer wait time– Transfer penalty– Egress timeEach cost component is weighed differently– Specified in the factors file
I
light rail
A
B
C
D
Bus service
Walk access
Walk egress
J
Cost Components
6
Transit Path-Building (Cont’d)
Time taken to walk from egress stop to the destination
Egress timeTransit mode to transit mode interchange penaltyTransfer penalty
Time spent in waiting for the transfer transit to arrive
Transfer wait time
Time taken to transfer from one transit to the another
Transfer walk time
Time spent traveling in a transit vehicleIn-vehicle time
Penalty applied at each boarding of a transit service
Boarding penaltyTime spent in waiting for the first transit boardingInitial wait time
Time taken to access the transit stop from an origin (zone)
Access time
DefinitionCostCost Definition

Florida Department of Transportation FSU 7 -4
FSU
TMS
Tran
sit
Mod
elin
g W
orks
hop
-200
7
7
Transit Path-Building (Cont’d)
RUNFACTORS– Factors to convert the cost
to in-vehicle time minutes
0.80Commuter rail
1.00All transit modes (except commuter rail)
1.00Drive access modes
2.00Walk access modes
ValueMode
;RunfactorsRUNFACTOR[1] = 2.00RUNFACTOR[2] = 1.00RUNFACTOR[4] = 9.99RUNFACTOR[11] = 2.00RUNFACTOR[12] = 2.00RUNFACTOR[21] = 1.00RUNFACTOR[22] = 1.00RUNFACTOR[23] = 1.00RUNFACTOR[24] = 1.00RUNFACTOR[25] = 0.80RUNFACTOR[31] = 1.00RUNFACTOR[32] = 1.00RUNFACTOR[33] = 1.00RUNFACTOR[34] = 1.00RUNFACTOR[35] = 0.80
Factors (Runfactors)
8
Transit Path-Building (Cont’d)
FREQUENCYDetermines the type of service model to be used. Only FREQUENCY is available with BESTPATHONLY=T at this time
SERVICEMODEL
5Upper limit on the number of transfers allowedMAXFERS
300Maximum weighted time for any path to be either considered the minimum cost path or enumerated
RECOSTMAX
TIf true, PT will combine headways on same-mode services. If false, PT will combine headways across modes
FREQBYMODE
TIf true, enacts the single-path path-builderBESTPATHONLY
ValueDescriptionParameterFactors (Global Settings)

Florida Department of Transportation FSU 7 -5
FSU
TMS
Tran
sit
Mod
elin
g W
orks
hop
-200
7
9
Transit Path-Building (Cont’d)
2 (for all paths)List of egress modes that are removed from consideration for minimum cost path or route enumeration
DELEGRESSMODE
2 (for walk path), 1 (for auto path)
List of access modes that are removed from consideration for minimum cost path or route enumeration
DELACCESSMODE
Project/prem mode for bus paths; None for project/prem paths
List of transit modes that are removed from consideration for minimum cost path or route enumeration
DELMODE
ValueDescriptionParameterFactors (Modes)
10
Transit Path-Building (Cont’d)
TSKIMpp2_{year}{alt}.MATTSKIMpp1_{year}{alt}.MATSkim File
TPATHpp2_{year}{alt}.RTETPATHpp1_{year}{alt}.RTEPath File
12DELACCESSMODE
21USERCLASS
AutoTransit.FACWalkTransit.FACFactors file
AutoWalkAccess Mode
Drive-TransitWalk-TransitWalk & Drive Transit Paths
pp represents period – ‘PK’ for peak period and ‘OP’ for off-peak period

Florida Department of Transportation FSU 7 -6
FSU
TMS
Tran
sit
Mod
elin
g W
orks
hop
-200
7
11
Transit Path-Building (Cont’d)
PARAMETERS– USERCLASSES– HDWAYPERIOD– FARE
ROUTEO– Output transit path file– For each user class
Elements
12

Florida Department of Transportation FSU 7 -7
FSU
TMS
Tran
sit
Mod
elin
g W
orks
hop
-200
7
13
ROUTEO Controls
14
Transit Path-Building (Cont’d)
TRACEI=67, TRACEJ=1-00
REPORTI=67, REPORTJ=54
I=1-100, J=45
Example
Reports the path in tabular formatTRACEI, TRACEO
List of origin and destination zones selected for tracing
REPORTI, REPORTJ
List of origin and destination zones for which path is build
I,J
DescriptionControl
ROUTEO Keywords

Florida Department of Transportation FSU 7 -8
FSU
TMS
Tran
sit
Mod
elin
g W
orks
hop
-200
7
15
Transit Path-Building (Cont’d)
REPORT
REnum Route(s) from Origin 133 to Destination 98
133 -> 31513151 -> 3679 -> 3679 lines Rt31 S FlaAv3679 -> 3552 -> 98 lines Rt32 Medulla
REval Route(s) from Origin 133 to Destination 98
133 -> 31513151 -> 3679 -> 3679 lines Rt31 S FlaAv3679 -> 3552 -> 98 lines Rt32 MedullaCost= 104.90 Probability=1.0000
REPORTI and REPORTJ
16
Transit Path-Building (Cont’d)
133 -> 3151 3151 -> 3679 -> 3679 lines Rt31 S FlaAv
Walk-Access Connector

Florida Department of Transportation FSU 7 -9
FSU
TMS
Tran
sit
Mod
elin
g W
orks
hop
-200
7
17
Transit Path-Building (Cont’d)
3679 -> 3552 -> 98 lines Rt32 Medulla
Walk-Egress Connector
18
Transit Path-Building (Cont’d)
TRACE
REval Route(s) from Origin 133 to Destination 98N: 133 Mode WaitA TimeA Actual B/XPen Percvd Dist Total Lines(weight)-> 3151 1 - 1.44 1.44 - 2.88 0.06 0.06-> 3679 31 15.00 11.12 27.56 2.00 46.00 6.47 6.53 Rt31 S
FlaAv(1.000)-> 3679 - - 0.00 27.56 - 46.00 0.00 6.53-> 3552 31 15.00 5.10 47.66 7.00 88.10 3.12 9.65 Rt32
Medulla(1.000)-> 98 1 - 8.40 56.06 - 104.90 0.35 10.00Mode TimeA Dist IWaitA XWaitA31 16.22 9.59 15.00 15.001 9.84 0.41
Fare= 0.50
TRACEI and TRACEJ
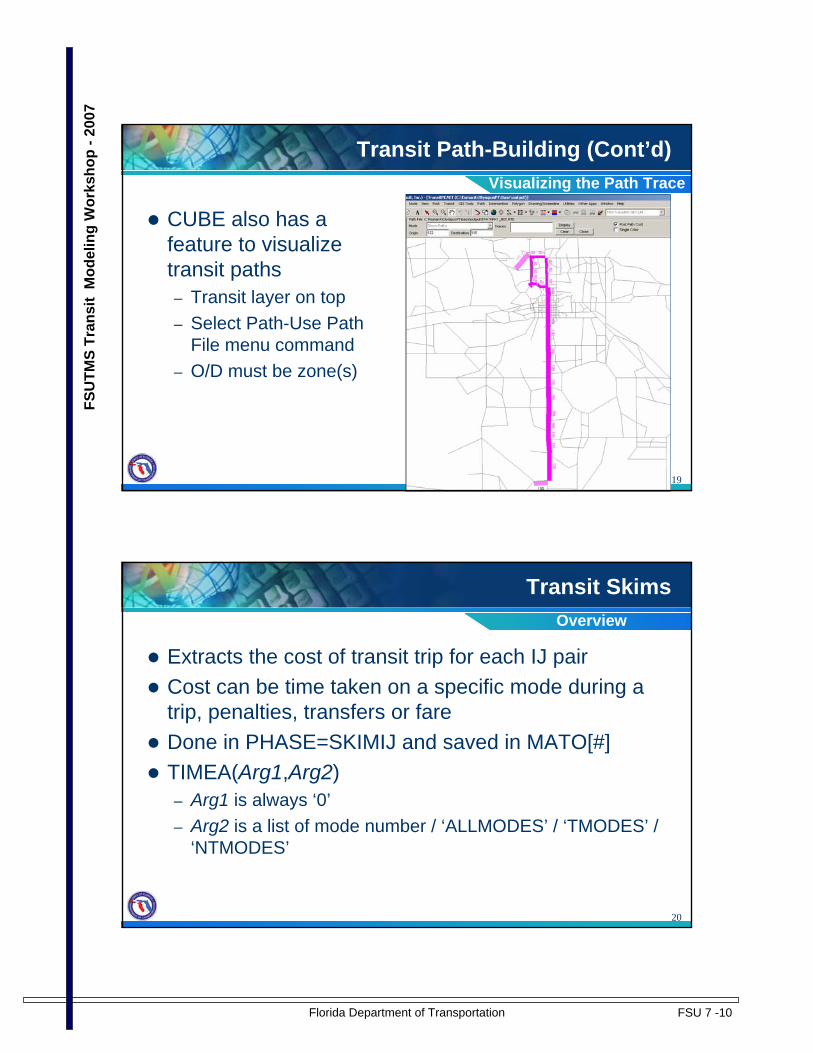
Florida Department of Transportation FSU 7 -10
FSU
TMS
Tran
sit
Mod
elin
g W
orks
hop
-200
7
19
Transit Path-Building (Cont’d)
CUBE also has a feature to visualize transit paths– Transit layer on top– Select Path-Use Path
File menu command– O/D must be zone(s)
Visualizing the Path Trace
20
Transit Skims
Extracts the cost of transit trip for each IJ pairCost can be time taken on a specific mode during a trip, penalties, transfers or fareDone in PHASE=SKIMIJ and saved in MATO[#]TIMEA(Arg1,Arg2)– Arg1 is always ‘0’– Arg2 is a list of mode number / ‘ALLMODES’ / ‘TMODES’ /
‘NTMODES’
Overview

Florida Department of Transportation FSU 7 -11
FSU
TMS
Tran
sit
Mod
elin
g W
orks
hop
-200
7
21
Transit Skims (Cont’d)
DistanceDIST
Actual transfer wait timeXWAITA
Actual initial wait timesIWAITA
Actual transfer penaltyXFERPENA
Boarding penaltyBRDPEN
Number of boardingsBRDINGS
Actual fares in monetary unitsFAREA
Actual travel timeTIMEA
DescriptionSkimsTypes of Skims
22
Transit Skims (Cont’d)Phase SKIMIJ - Olympus
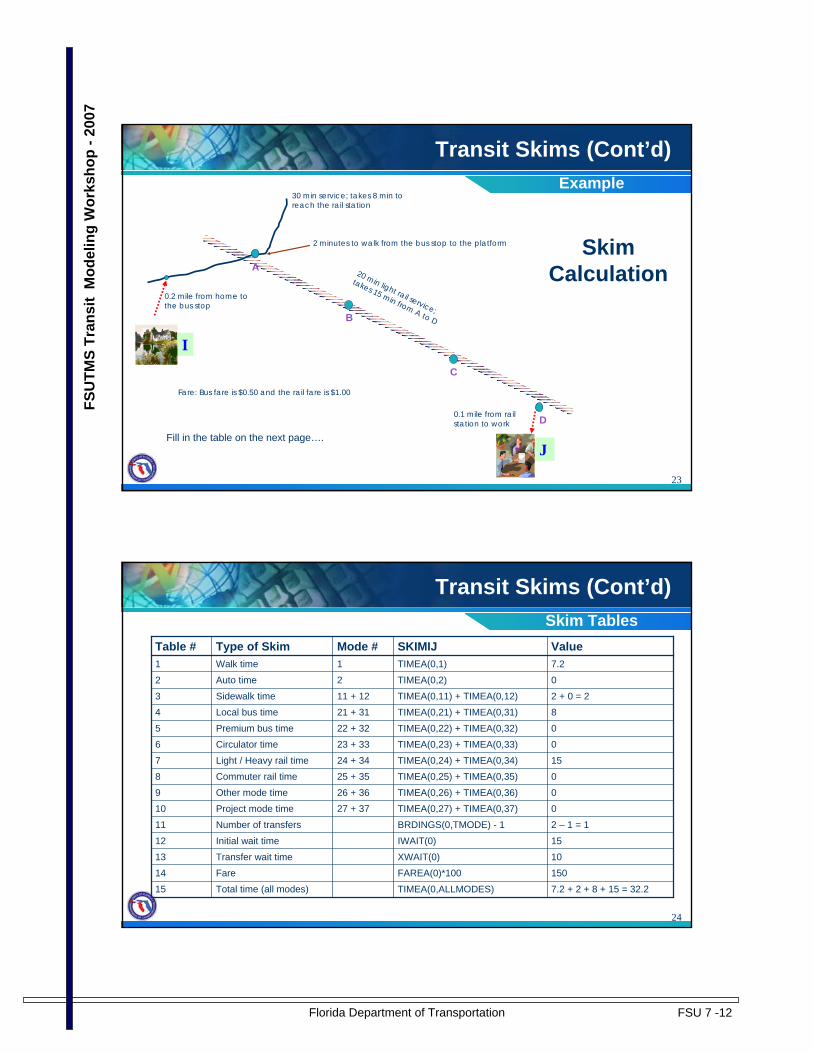
Florida Department of Transportation FSU 7 -12
FSU
TMS
Tran
sit
Mod
elin
g W
orks
hop
-200
7
23
Transit Skims (Cont’d)
I
20 min light rail service;
takes 15 min from A to D
A
B
C
D
30 min service; takes 8 min to reach the rail station
0.2 mile from home to the bus stop
0.1 mile from rail station to work
Fare: Bus fare is $0.50 and the rail fare is $1.00
Fill in the table on the next page….
2 minutes to walk from the bus stop to the platform
J
Example
Skim Calculation
24
Transit Skims (Cont’d)
TIMEA(0,ALLMODES)FAREA(0)*100
XWAIT(0)IWAIT(0)
BRDINGS(0,TMODE) - 1TIMEA(0,27) + TIMEA(0,37)TIMEA(0,26) + TIMEA(0,36)
TIMEA(0,25) + TIMEA(0,35)TIMEA(0,24) + TIMEA(0,34)
TIMEA(0,23) + TIMEA(0,33)TIMEA(0,22) + TIMEA(0,32)
TIMEA(0,21) + TIMEA(0,31)TIMEA(0,11) + TIMEA(0,12)
TIMEA(0,2)
TIMEA(0,1)
SKIMIJ
27 + 3726 + 36
25 + 3524 + 34
23 + 3322 + 32
21 + 3111 + 12
2
1
Mode #
1514
1312
11109
87
65
43
2
1
Table #
7.2 + 2 + 8 + 15 = 32.2Total time (all modes)150Fare
10Transfer wait time15Initial wait time
2 – 1 = 1Number of transfers0Project mode time0Other mode time
0Commuter rail time15Light / Heavy rail time
0Circulator time0Premium bus time
8Local bus time2 + 0 = 2Sidewalk time
0Auto time
7.2Walk time
ValueType of Skim
Skim Tables

Florida Department of Transportation FSU 7 -13
FSU
TMS
Tran
sit
Mod
elin
g W
orks
hop
-200
7
25
Path Conditioning
Path conditioning means removing the illogical paths from consideration for the mode choice modelCompare transit path with all-walk path
Overview
26
Path Conditioning (Cont’d)
Why?– PT will find a transit path even when walking is better– Maintain consistency with Tranplan/TRNBUILD– Better representation of transit ridershipZone-to-zone walk connectors → mode 4– Path using GENERATE statement– Mode 4 time (all-walk time) is skimmed
Overview (Cont’d)

Florida Department of Transportation FSU 7 -14
FSU
TMS
Tran
sit
Mod
elin
g W
orks
hop
-200
7
27
Path Conditioning (Cont’d)
1-{ZONESA}TONODE1-{ZONESA}FROMNODEFONEWAY3DIRECTION200*{MAXWLKACCLNKS}MAXNTLEGS4NTLEGMODE(LI.FTYPE = 10-19, 70-99)EXCLUDELINK200*3MAXCOSTLW.WALKTIMEEXTRACTCOST
LW.DISTANCECOST
ValueParameterGENERATE SetupMode 4
28
Path Conditioning (Cont’d)
GENERATE, COST=(LW.DISTANCE),EXTRACTCOST=(LW.WALKTIME), MAXCOST=200*3, LIST=T,EXCLUDELINK=(LI.FTYPE=10-19,70-99), NTLEGMODE=4, MAXNTLEGS=200*{MAXWLKACCLNKS}, DIRECTION=3, ONEWAY=F, FROMNODE=1-{ZONESA},TONODE=1-{ZONESA}
All-Walk Skim

Florida Department of Transportation FSU 7 -15
FSU
TMS
Tran
sit
Mod
elin
g W
orks
hop
-200
7
29
Path-Conditioning (Cont’d)
137
136
137
136
Example
30
REval Route(s) from Origin 137 to Destination 136N: 137 Mode WaitA TimeA Actual B/XPen Percvd Dist Total Lines(weight)-> 2849 1 - 3.84 3.84 - 7.68 0.16 0.16-> 2909 31 6.00 0.17 10.01 2.00 21.85 0.08 0.24 Rt10 Shuttle(0.200) Rt30 Clvd Ht(0.200) Rt31 S FlaAv(0.400) Rt40 Aria/Be(0.200)-> 136 1 - 1.68 11.69 - 25.21 0.07 0.31Fare= 0.50

Florida Department of Transportation FSU 7 -16
FSU
TMS
Tran
sit
Mod
elin
g W
orks
hop
-200
7
31
Walk distance = 0.15 miles– Perceived time = 7.2
minutes– Walking is better than
waiting for a bus!
Path Conditioning (Cont’d)
32
Templates for Path-Building…
Two default path-building templates available on www.fsutmsonline.NET for Tier A and Tier B/C cities– Both include factors files and Voyager script
module

Florida Department of Transportation FSU 7 -17
FSU
TMS
Tran
sit
Mod
elin
g W
orks
hop
-200
7
33
Computer Exercises
Transit Path-Building
Lesson 7
34
Lesson 7 Exercises
In this exercise you will complete the following:7.1 – PT Module Scripting7.2 – Run and Debug Model7.3 – Review Transit Skim

Florida Department of Transportation FSU 7 -18
FSU
TMS
Tran
sit
Mod
elin
g W
orks
hop
-200
7
35
PT Module ScriptingExercise 7.1
Step 1 Instructions: Navigate to the Olympus Model
1. Click on the FSUTMS Launcher icon
2. Select District 1 from the FSUTMS interface
3. Select Olympus Training Model
2
3
1
36
PT Module ScriptingExercise 7.1 (Cont’d)Step 2 Instructions: Open
Peak Access Script.1. Double-click on the
TNETPREP application in the Applications window. You may need to expand the Olympus and Transitapplications.
2. Double-click the script file for the Public TransportStep 11.
1 2

Florida Department of Transportation FSU 7 -19
FSU
TMS
Tran
sit
Mod
elin
g W
orks
hop
-200
7
37
PT Module ScriptingExercise 7.1 (Cont’d)Step 3 Instructions:
Establish Network Parameters.
1. Go to line 13.2. Add the lines of script that
appear on the next slide.
Note: These lines will define the parameters for the peak transit network.
38
PT Module Scripting
PARAMETERS USERCLASSES=1,FARE=N, HDWAYPERIOD=1,NOROUTEERRS=999999, NOROUTEMSGS=999999, TRANTIME=LW.TRANTIME,TRANTIME[21]=LI.M21TIMEPK,TRANTIME[22]=LI.M22TIMEPK,TRANTIME[23]=LI.M23TIMEPK,TRANTIME[24]=LI.M24TIMEPK,TRANTIME[25]=LI.M25TIMEPK,TRANTIME[31]=LI.M31TIMEPK,TRANTIME[32]=LI.M32TIMEPK,TRANTIME[33]=LI.M33TIMEPK,TRANTIME[34]=LI.M34TIMEPK,TRANTIME[35]=LI.M35TIMEPK
Exercise 7.1 (Cont’d)

Florida Department of Transportation FSU 7 -20
FSU
TMS
Tran
sit
Mod
elin
g W
orks
hop
-200
7
39
PT Module ScriptingExercise 7.1 (Cont’d)Step 4 Instructions: Save.
1. Save file.2. Close file.
.1
2
40
Run and Debug Model
Step 1 Instructions: CubeDouble Click on Base in the Scenario Manager.This action will display the Scenario Base dialog box that allows the user to execute the entire run by clicking on “Run” (see next slide).Click on the Run button (the model may take a few minutes to run).Once the model has completed the run successfully, click on the OKbutton.
Note: If the model crashes, attempt to debug and rerun the model. If initial attempts to debug the model are unsuccessful, do not be alarmed. A pregenerated skim file has been provided for this exercise. Do not spend too much time debugging the model since debugging is a central feature of the exercise for Lesson 13.
Exercise 7.2

Florida Department of Transportation FSU 7 -21
FSU
TMS
Tran
sit
Mod
elin
g W
orks
hop
-200
7
41
Click on “Run”
Double Click on “Base”
42
Review Transit Skim
Step 1 Instructions: Open Transit Skim file
1.Click the Open File icon. 2.Navigate to the C:\FSUTMS\general\OlympusTrainingModel\archivesfolder. Double-click the TSKIMPK1_B00.MAT file.
1
2
Exercise 7.3

Florida Department of Transportation FSU 7 -22
FSU
TMS
Tran
sit
Mod
elin
g W
orks
hop
-200
7
43
Step 2 Instructions: Questions
What is the walk time for trip interchange 14-5? _______What is the initial wait time for trip interchange 105-39? ________What is the fare for trip interchange 22-5? _______What is the total number of transfers to get from zone 76 to zone 306? _________How long does it take to travel from zone 539 to zone 437 by bus? ________
Review Transit Skim
Special Note: See next slide for answers
Exercise 7.3 (Cont’d)
44
Step 2 Instructions: Questions Answers
What is the walk time for trip interchange 14-5? 61.68 minutesWhat is the initial wait time for trip interchange 105-39? 5.00 minutesWhat is the fare for trip interchange 22-5? 50 centsWhat is the total number of transfers to get from zone 76 to zone 306? 3 transfersHow long does it take to travel from zone 539 to zone 437 by bus? 42.25 minutes
Review Transit Skim
Exercise 7.3 (Cont’d)

Florida Department of Transportation FSU 7 -23
FSU
TMS
Tran
sit
Mod
elin
g W
orks
hop
-200
7
45
End of Lesson 7Close all files and return to the Desktop and Stop.
46
Summary
In this lesson we covered:Transit path-buildingTransit skimsPath conditioning

Florida Department of Transportation FSU 7 -24
FSU
TMS
Tran
sit
Mod
elin
g W
orks
hop
-200
7
47
Notes
48
Notes
Florida Department of Transportation FSU 7 -25
FSU
TMS
Tran
sit
Mod
elin
g W
orks
hop
-200
7
49
Notes
50
Notes
Florida Department of Transportation FSU 8 -1
FS
UT
MS
Tra
nsit
Mod
elin
g W
orks
hop
-20
07
1
Give Me My Share
(Mode Choice)
Lesson 8
2
Lesson Goals
In this lesson we will cover:�Nesting Structures�Using XCHOICE�Calibration process

Florida Department of Transportation FSU 8 -2
FS
UT
MS
Tra
nsit
Mod
elin
g W
orks
hop
-20
07
3
Overview of Mode Choice
4
Mode Choice
I
A D
1 min walk to station A
$2 parking at work
J
20 min drive to work
18 min on rail to go from A to D
Two plausible options of going from I to J:
1.Drive for 20 minutes and pay $2 for parking
2.Ride the rail for 18 minutes ($1 fare) and walk for 1 minute each at home-end and work-end
Mode Choice estimates the percentage of people who will drive towork and people who will take the rail based on the “disutility” of the two options
1 min walk to work

Florida Department of Transportation FSU 8 -3
FS
UT
MS
Tra
nsit
Mod
elin
g W
orks
hop
-20
07
5
Mode Choice (Cont’d)
�Mode choice models estimate modal shares based on the “disutility” of a specific mode:
...43210
+∗+∗+∗+∗+= tParkingCosFareTimeOutVehicleimeInVehicleTi
U βββββ
where:
β0 – bias constant (for unexplained variables)β1, β2, β3, β4 – variable coefficients
In VehicleTime, OutVehicleTime, Fare, ParkingCost – travel variables
Utility Expression
6
Mode Choice (Cont’d)
� Individual utilities are calculated for each:– Purpose (HBW, HBNW, NHB)– Market segment (0-car, 1-car, 2+-car households)– Access category (no transit, can walk, must drive)– Submode (drive alone, shared ride, walk-transit, drive-
transit, etc.)– IJ pair (each interchange)
�The Olympus mode choice model calculates 3*1*1*6 utilities for each IJ pair
Utility Calculation
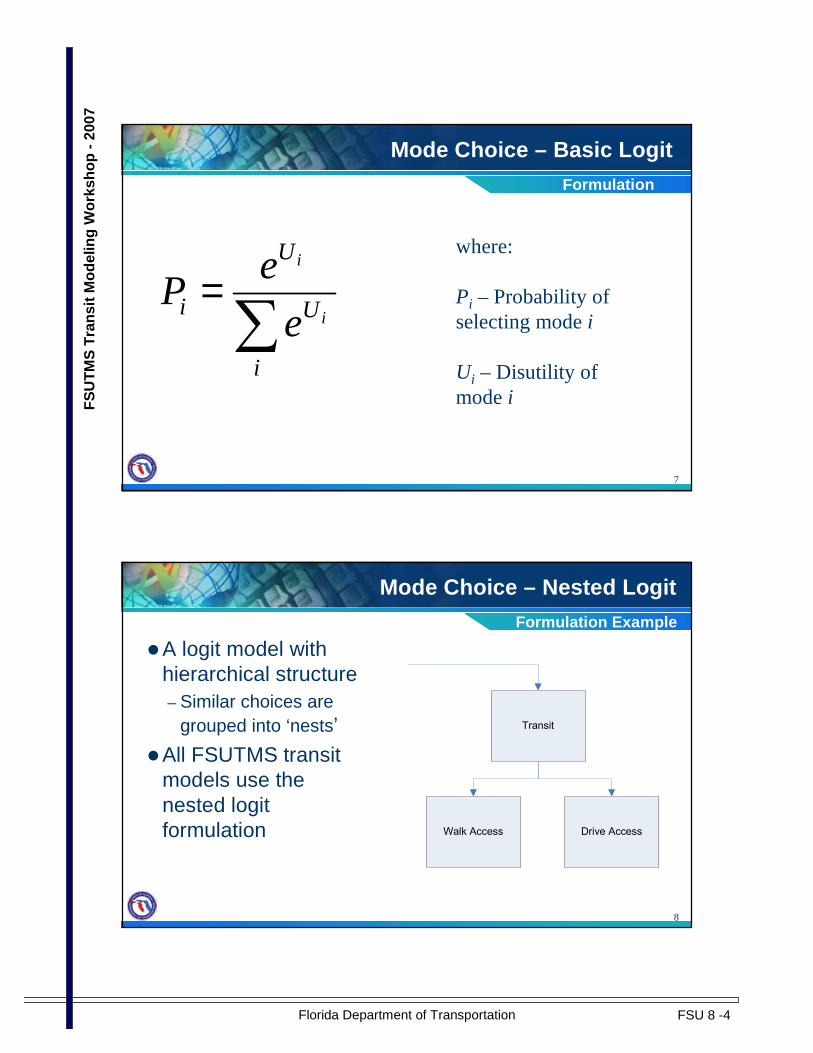
Florida Department of Transportation FSU 8 -4
FS
UT
MS
Tra
nsit
Mod
elin
g W
orks
hop
-20
07
7
Mode Choice – Basic Logit
∑=
i
U
U
i i
i
e
eP
where:
Pi – Probability of selecting mode i
Ui – Disutility of mode i
Formulation
8
Mode Choice – Nested Logit
Transit
Walk Access Drive Access
�A logit model with hierarchical structure– Similar choices are
grouped into ‘nests’
�All FSUTMS transit models use the nested logit formulation
Formulation Example

Florida Department of Transportation FSU 8 -5
FS
UT
MS
Tra
nsit
Mod
elin
g W
orks
hop
-20
07
9
Mode Choice – Nested Logit (Cont’d)
�Nested logit model provides a more realistic modeling relationship among possible modes
� It reduces possible violations of the Independence of Irrelevant Alternatives (IIA) property
�Desirable when the modes are not independent from one another
Advantages
10
Mode Choice – Nested Logit (Cont’d)
( )trandrivetranwalk UUtransit eeLogsum −− += ln
( )sharedridedrivealone UUauto eeLogsum += ln
)*()*(
)*(
autoautotransittransit
transittransit
LogsumLogsum
Logsum
transit ee
eP ββ
β
+=
Upper Level ComputationsLogsum:

Florida Department of Transportation FSU 8 -6
FS
UT
MS
Tra
nsit
Mod
elin
g W
orks
hop
-20
07
11
Nesting Structures for Florida Models …
12
Detailed boarding & transfer rate information;Recent on-board survey for all modes
System-wide boardings & transfer rates; Recent on-board survey
System-wide boardings & transfer rates;May have recent on-board survey
System-wide boardings & transfer rates
Data Availability
Polk County, SunTran
Local service only;no park-and-ridesA
Southeast Florida
Many different types of service;extensive park-and-ride system;potential major fixed-guideway system
D
Jacksonville, Orlando, TampaC
Votran, SpacecoastLocal & express service;some park-and-rides
B
ExamplesTransit ServiceTier
Nesting Structures
Guidelines - Tiers

Florida Department of Transportation FSU 8 -7
FS
UT
MS
Tra
nsit
Mod
elin
g W
orks
hop
-20
07
13
�Auto nesting same as existing, larger area models
Nesting Structures (Cont’d)
Tier A Areas
14
Nesting Structures (Cont’d)
�Tier A Areas– Local service only– No park-and-rides– Limited data available
�Build “walk-transit” & “drive-transit” paths per period
�Paths include all modes
Tier A Areas

Florida Department of Transportation FSU 8 -8
FS
UT
MS
Tra
nsit
Mod
elin
g W
orks
hop
-20
07
15
Nesting Structures (Cont’d)
Tier B/C Areas�Local & express service�At least some park-and-
rides�At least system-wide
boardings, but on-board survey likely
�May be planning for New/Small Starts project in near future
Tier B/C Areas
Build 4 paths per period�Walk-bus�Walk-project/premium�Auto-bus�Auto-project/premium
16
Nesting Structures (Cont’d)Tier B/C Areas

Florida Department of Transportation FSU 8 -9
FS
UT
MS
Tra
nsit
Mod
elin
g W
orks
hop
-20
07
17
Nesting Structures (Cont’d)
SERPM (Tier D Areas)�Many types of service�Extensive park-and-ride
system�Detailed boarding & rider
data available�Can be planning for
New/Small Starts project in near future
Tier D Areas
Build 8 paths per period� Walk-bus� Walk-project/premium� Walk-MetroRail� Walk-TriRail� Auto-bus� Auto-project/premium� Auto-MetroRail� Auto-TriRail
18
Nesting Structures (Cont’d)
Tier D Areas

Florida Department of Transportation FSU 8 -10
FS
UT
MS
Tra
nsit
Mod
elin
g W
orks
hop
-20
07
19
Utility Coefficients…
20
Mode Choice Utility Coefficients
-0.0050-0.0025-0.0025CentsFare, parking cost, AOC
-0.1250-0.0625-0.1250--Number of Transfers
-0.0375-0.01875-0.0375MinDrive-access time
-0.0500-0.0250-0.0500MinOVT (walk- & wait-time)
-0.0200-0.0100-0.0200MinIVTT for CR
-0.0250-0.0125-0.0250MinIVTT
NHBHBOHBWUnitsVariable
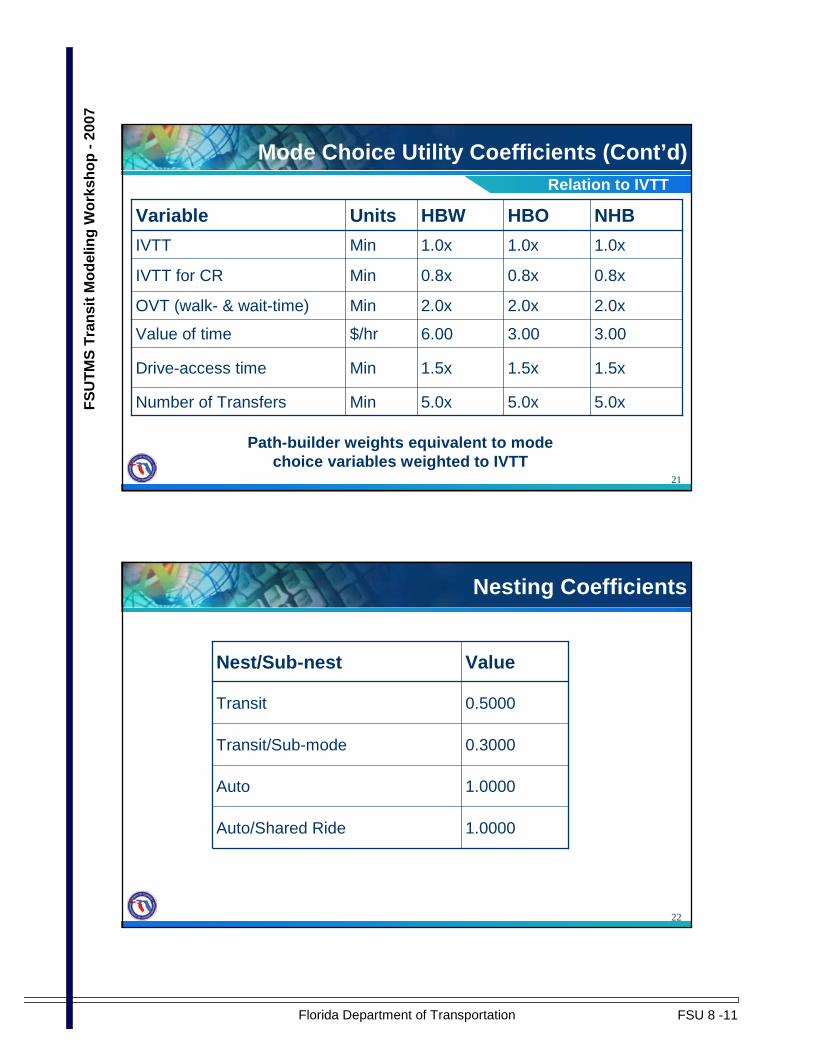
Florida Department of Transportation FSU 8 -11
FS
UT
MS
Tra
nsit
Mod
elin
g W
orks
hop
-20
07
21
Mode Choice Utility Coefficients (Cont’d)
3.003.006.00$/hrValue of time
5.0x5.0x5.0xMinNumber of Transfers
1.5x1.5x1.5xMinDrive-access time
2.0x2.0x2.0xMinOVT (walk- & wait-time)
0.8x0.8x0.8xMinIVTT for CR
1.0x1.0x1.0xMinIVTT
NHBHBOHBWUnitsVariable
Path-builder weights equivalent to mode choice variables weighted to IVTT
Relation to IVTT
22
Nesting Coefficients
0.3000Transit/Sub-mode
1.0000Auto/Shared Ride
1.0000Auto
0.5000Transit
ValueNest/Sub-nest

Florida Department of Transportation FSU 8 -12
FS
UT
MS
Tra
nsit
Mod
elin
g W
orks
hop
-20
07
23
Using XCHOICE…
24
XCHOICE
�Smaller areas will script their mode choice models using the XCHOICE control statement in MATRIX
�XCHOICE performs nesting calculations and estimates shares based on submodal utilities
�Larger areas will want to use specially-written programs for running time purposes
�Olympus uses XCHOICE

Florida Department of Transportation FSU 8 -13
FS
UT
MS
Tra
nsit
Mod
elin
g W
orks
hop
-20
07
25
Utility calculation for each submodes
26
XCHOICE (Cont’d)
� Input files– Highway skims (free-flow and congested skims)– Transit skims– Person trip table (by purpose)– Constants and coefficients files– Land-use data (ZDATA file)– Percent walk file– Station data information– Station to station matrix
Input Files

Florida Department of Transportation FSU 8 -14
FS
UT
MS
Tra
nsit
Mod
elin
g W
orks
hop
-20
07
27
XCHOICE (Cont’d)
JLOOP
; DRIVE ALONE ELEMENTS OF UTILITY ARE:
MW[101]=(MW[11] - ({Inflation}*MW[14]*{CTOLL}*60))*C IVTT ; In-vehicle time
MW[102]=({Inflation}*MW[14]*{CTOLL}*60)*CIVTT ; Toll
MW[103]=MW[13]*COVT ; Terminal time
MW[104]=(0.5 * 100 * ZI.1.@PRK@[J] + MW[12] * {HWYO PCOST}) * {Inflation} * CCOST ; Costs - pa rking and operating
; COMPOSITE UTILITY
IF (MW[11]==0)
MW[121]= -999.999
ELSE
MW[121]= (MW[101] + MW[102] + MW[103] + MW[104] + K da)/(NCDASR)
ENDIF
; HOV2 ELEMENTS OF UTILITY ARE:
MW[101]=(MW[11] - ({Inflation}*MW[14]*{CTOLL}*60))*C IVTT ; In-vehicle time
MW[102]=({Inflation}*MW[14]*{CTOLL}*60)*CIVTT / 2.0 ; Toll
MW[103]=MW[13]*COVT ; Terminal time
MW[104]=((0.5 * 100 * ZI.1.@PRK@[J] + MW[12] * {HWY OPCOST}) * {Inflation} * CCOST / 2.0) ; Costs - p arking and operating
; COMPOSITE UTILITY
IF (MW[11]==0)
MW[122]= -999.999
ELSE
MW[122]= (MW[101] + MW[102] + MW[103] + MW[104] + K hov2)/(NCSR*NCDASR)
ENDIF
Basic Utilities Example
28
XCHOICE (Cont’d)
; WALK TO TRANSIT ELEMENTS OF UTILITY ARE:
MW[101]=(MW[24] + MW[25] + MW[26] + MW[27] + MW[29] + MW[30])*CIVTT + MW[28]*CCRIVTT ; Transit time
MW[102]=(MW[21] + MW[23] + MW[32] + MW[33])*COVT ; Access time + wait time
MW[103]=(MW[31])*CXFER ; Transfer penalty
MW[104]=(MW[34])*CCOST ; Transit fare
; COMPOSITE UTILITY
IF ((MW[24] + MW[25] + MW[26] + MW[27] + MW[28] + M W[29] + MW[30])==0)
MW[124]= -999.999
ELSE
MW[124]= (MW[101] + MW[102] + MW[103] + MW[104] + K walk)/NCTACC
ENDIF
; PNR TO TRANSIT ELEMENTS OF UTILITY ARE:
MW[101]=(MW[44] + MW[45] + MW[46] + MW[47] + MW[49] + MW[50])*CIVTT + MW[48]*CCRIVTT ; Transit time
MW[102]=(MW[41] + MW[43] + MW[52] + MW[53])*COVT ; Access time + wait time
MW[103]=(MW[51])*CXFER ; Transfer penalty
MW[104]=(MW[54])*CCOST ; Transit fare
MW[105]=MW[42]*CIVTT ; auto access time is in IVT minutes
; COMPOSITE UTILITY
IF ((MW[44] + MW[45] + MW[46] + MW[47] + MW[48] + M W[49] + MW[50])==0 | MW[42]==0)
MW[125]= -999.999
ELSE
MW[125]= (MW[101] + MW[102] + MW[103] + MW[104] + M W[105] + Kpnr)/NCTACC
ENDIF
ENDJLOOP
Basic Utilities Example

Florida Department of Transportation FSU 8 -15
FS
UT
MS
Tra
nsit
Mod
elin
g W
orks
hop
-20
07
29
XCHOICE determines shares based on the utilities of submodes
30
XCHOICE (Cont’d)
;************************************************** *************************************************** ****
; MODEL STRUCTURE
;************************************************** *************************************************** ****
; R oot
; |
; ---------------------- ------------------------------
; | |
; Auto Transit
; | |
; ---------------------- ----------- --------------------------------
; | | | | |
; Drive Alone Shared Ride Walk Access PNR Access KNR Access
; |
; ----------
; | |
; SR2 SR3+
;************************************************** *************************************************** ****
; XChoice Alternatives
XCHOICE ALTERNATIVES=da,hov2,hov3,walk,pnr,knr,
; Input Total Demand
DEMANDMW=21,
; Utilities
UTILITIESMW=11,12,13,14,15,16,
; Forecast Demand
ODEMANDMW=101,102,103,104,105,106,
; Top Level Nest
SPLIT = TOTAL NCDASR Auto NCTACC Transit,
; Auto Nest
SPLIT = Auto 1.0 da NCSR HOV, SPLITCOMP=153,
; SR Nest
SPLIT = HOV 1.0 hov2 1.0 hov3,
; Transit Nest
SPLIT = Transit 1.0 walk 1.0 pnr 1.0 knr,
; Working matrices
STARTMW=200
Example

Florida Department of Transportation FSU 8 -16
FS
UT
MS
Tra
nsit
Mod
elin
g W
orks
hop
-20
07
31
XCHOICE (Cont’d)
�Output files– Matrices with submodal tables
�HBW_B00.MAT, HBNW_B00.MAT, NHB_B00.MAT– Mode choice summary file– Mode choice debug file– Calibration summary file– User benefit files
Output Files
32
XCHOICE (Cont’d)
+++++ MODE XCHOICE SUMMARY +++++
BetaTest
Base
HBW - PK MODE XCHOICE RESULTS
HBW TOTAL = 306,714 1.0000
DRIVE ALONE = 244,756 0.7980
HOV2 = 51,687 0.1685
HOV3+ = 9,275 0.0302
WALK TO TRANSIT = 977 0.0032
PNR TO TRANSIT = 14 0.0000
KNR TO TRANSIT = 4 0.0000
Average Auto Occupancy =1.12
COEFFICIENTS HBW
IN VEHICLE TIME =-0.02000
COMMUTER RAIL TIME =-0.01600
OUT OF VEHICLE TIME =-0.04000
NUMBER OF TRANSFERS =-0.10000
OPERATING COST =-0.00300
Summary File

Florida Department of Transportation FSU 8 -17
FS
UT
MS
Tra
nsit
Mod
elin
g W
orks
hop
-20
07
33
Calibration Process…
34
What is mode choice calibration?
�The process of adjusting bias constants with the goal of making the sub-modal results match observed targets
� Iterative process�Absolutely necessary when calibrating/validating a
model�How to accomplish this in Olympus…

Florida Department of Transportation FSU 8 -18
FS
UT
MS
Tra
nsit
Mod
elin
g W
orks
hop
-20
07
35
36
Mode Choice Calibration
Sub-mode labelCharacter5
Sub-mode share
(NHB trips)Real4
Sub-mode share
(HBNW trips)Real3
Sub-mode share(HBW trips)
Real2
Sub-mode numberInteger1
DescriptionFormatField
Labels7
Values for Transit/KNR Access
sub-mode6
Values for Transit/PNR Accesssub-mode
5
Values for Transit/Walk Access
sub-mode4
Values for Auto/HOV3+
sub-mode3
Values for Auto/HOV2
sub-mode2
Values for Auto/Drive Alone
sub-mode1
DescriptionLine
MC_TARGETSFile Format:

Florida Department of Transportation FSU 8 -19
FS
UT
MS
Tra
nsit
Mod
elin
g W
orks
hop
-20
07
37
Mode Choice Calibration (Cont’d)
1,0.796858393,0.374629363,0.292007055,'DA CONSTANT base'
2,0.167790377,0.420218472,0.495772901,'CP-CARPOOL2 CONSTANT'
3,0.031419331,0.203113294,0.210045748,'CX-CARPOOL3+ CONSTANT'
4,0.003900001,0.002,0.002,WALK TO TRANSIT
5,0.000016101,0.00001,0.00005,PNR TO TRANSIT
6,1.58E-05,2.89E-05,0.000124296,KNR TO TRANSIT
;,HBW,NHBW,NHB,MODE
MC_TARGETS.CSVExample:
38
Mode Choice Calibration (Cont’d)
If ‘0’, do not calibrate mode choice modelIf ‘1’, calibrate mode choice model
Description
MC_Cal
Name
Catalog Key

Florida Department of Transportation FSU 8 -20
FS
UT
MS
Tra
nsit
Mod
elin
g W
orks
hop
-20
07
39
40
Mode Choice Calibration (Cont’d)
Fixing Iterations
Florida Department of Transportation FSU 8 -21
FS
UT
MS
Tra
nsit
Mod
elin
g W
orks
hop
-20
07
41
Time of Day
�Standard FSUTMS uses auto speeds from 24-hour assignment as for HBW mode choice– HBO & NHB use free-flow speeds
�SERPM6 uses time of day– Peak period trips use AM congested speeds– Off-peak period trips use free-flow speeds
�Standard FSUTMS design expected for most models
42
Game
Game 8.1Family Feud
Florida Department of Transportation FSU 8 -22
FS
UT
MS
Tra
nsit
Mod
elin
g W
orks
hop
-20
07
43
Computer Exercises
Mode Choice
Lesson 8
44
Lesson 8 Exercises
In this exercise you will complete the following:8.1 – Review Mode Summary
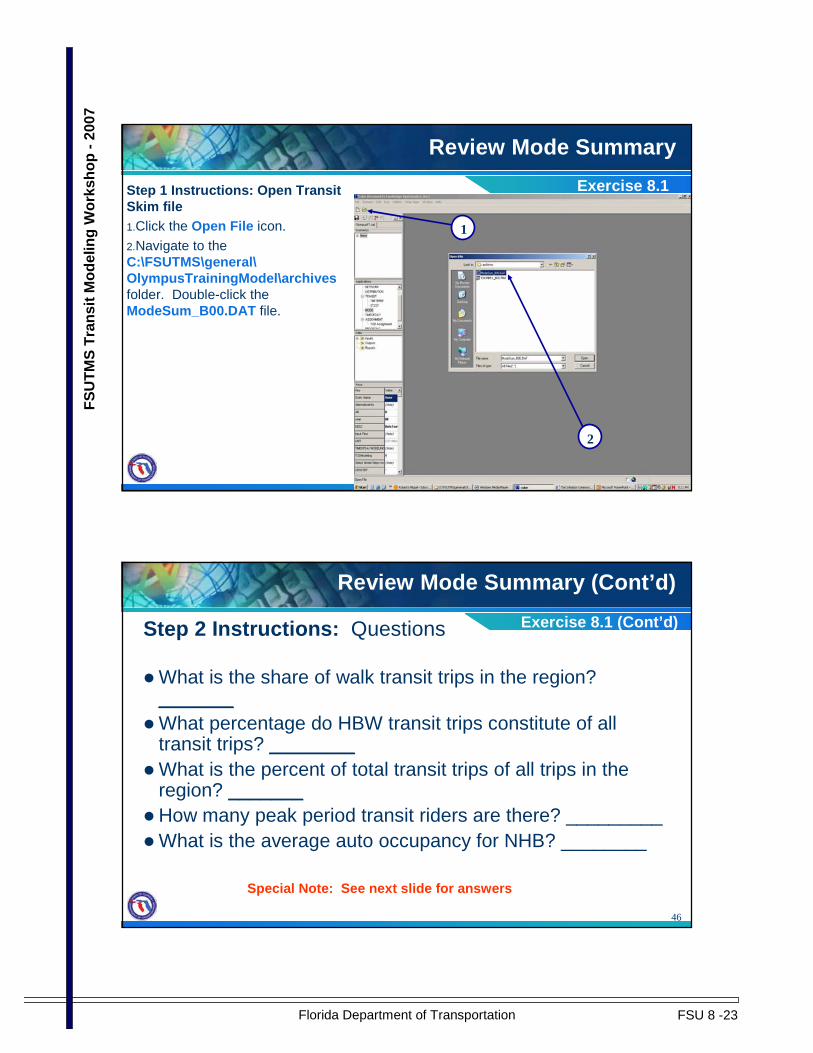
Florida Department of Transportation FSU 8 -23
FS
UT
MS
Tra
nsit
Mod
elin
g W
orks
hop
-20
07
45
Review Mode Summary
Exercise 8.1Step 1 Instructions: Open Transit Skim file1.Click the Open File icon.
2.Navigate to the C:\FSUTMS\general\OlympusTrainingModel\archivesfolder. Double-click the ModeSum_B00.DAT file.
1
2
46
Step 2 Instructions: Questions
� What is the share of walk transit trips in the region? _______
� What percentage do HBW transit trips constitute of all transit trips? ________
� What is the percent of total transit trips of all trips in the region? _______
� How many peak period transit riders are there? _________� What is the average auto occupancy for NHB? ________
Exercise 8.1 (Cont’d)
Review Mode Summary (Cont’d)
Special Note: See next slide for answers
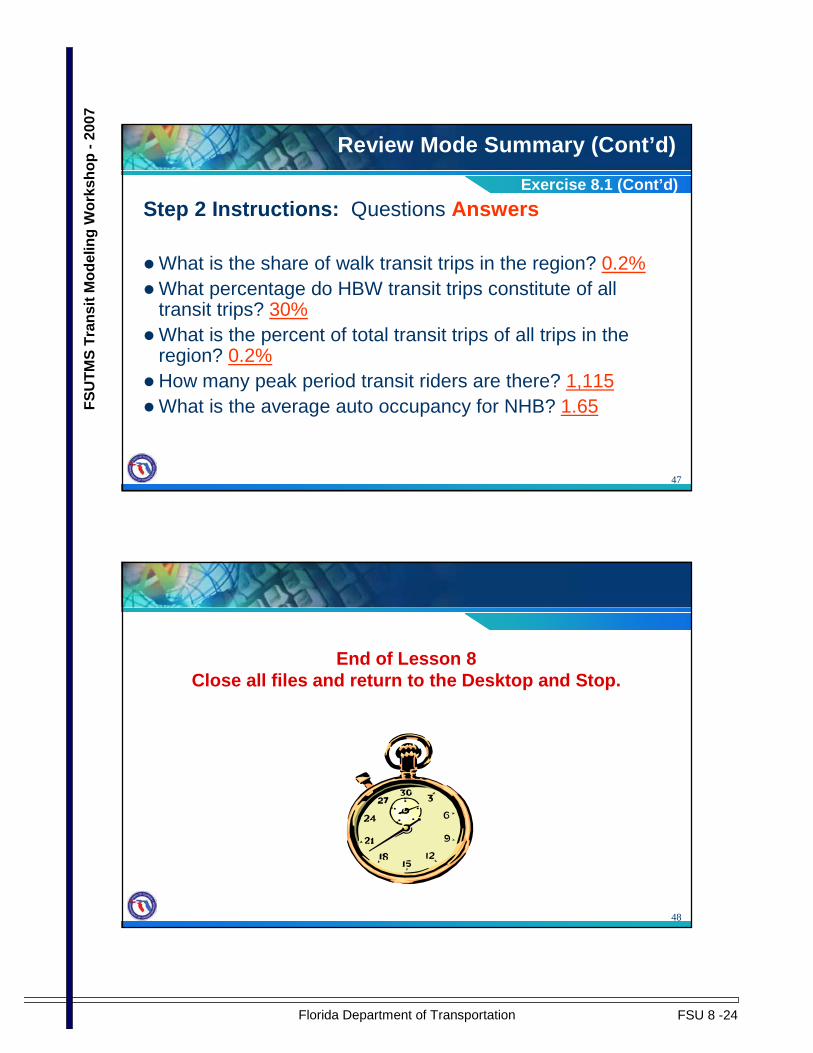
Florida Department of Transportation FSU 8 -24
FS
UT
MS
Tra
nsit
Mod
elin
g W
orks
hop
-20
07
47
Step 2 Instructions: Questions Answers
� What is the share of walk transit trips in the region? 0.2%� What percentage do HBW transit trips constitute of all
transit trips? 30%� What is the percent of total transit trips of all trips in the
region? 0.2%� How many peak period transit riders are there? 1,115� What is the average auto occupancy for NHB? 1.65
Exercise 8.1 (Cont’d)
Review Mode Summary (Cont’d)
48
End of Lesson 8Close all files and return to the Desktop and Stop.

Florida Department of Transportation FSU 8 -25
FS
UT
MS
Tra
nsit
Mod
elin
g W
orks
hop
-20
07
49
Summary
In this lesson, we covered:�Nesting Structures�XCHOICE�Mode Choice Calibration
50
Notes
Florida Department of Transportation FSU 8 -26
FS
UT
MS
Tra
nsit
Mod
elin
g W
orks
hop
-20
07
51
Notes
52
Notes

Florida Department of Transportation FSU 9 -1
FSU
TMS
Tran
sit M
odel
ing
Wor
ksho
p -2
007
1
Put me on the bus that takes me to grandma’s home
(Transit Assignment)
Lesson 9
2
Lesson Goals
In this lesson we will cover:Overview of transit assignmentHow it is done in OlympusUseful reports from PT (mode-mode transfer summary, etc.)Assignment reporting program– TAREPORTValidation

Florida Department of Transportation FSU 9 -2
FSU
TMS
Tran
sit M
odel
ing
Wor
ksho
p -2
007
3
FSUTMS Voyager (PT) Transit Model
PT ASSIGNMENTPT ASSIGNMENT
NETWORK PREPARATIONNETWORK PREPARATION
ACCESS CONNECTORSACCESS CONNECTORS
PATHPATH--BUILDING / SKIMBUILDING / SKIM
Transit ProcessTransit Process
MODE CHOICEMODE CHOICE Gives transit trips for each IJ
Produces transit path for each IJ
Loads transit trips to each route
4
Transit Assignment
Loads the transit trips to the transit networkAll-or-nothing assignmentFor most cases, assignment conducted by purpose and by period– Home-work trips are assigned to the peak period network– Non-work trips are assigned to the off-peak period network
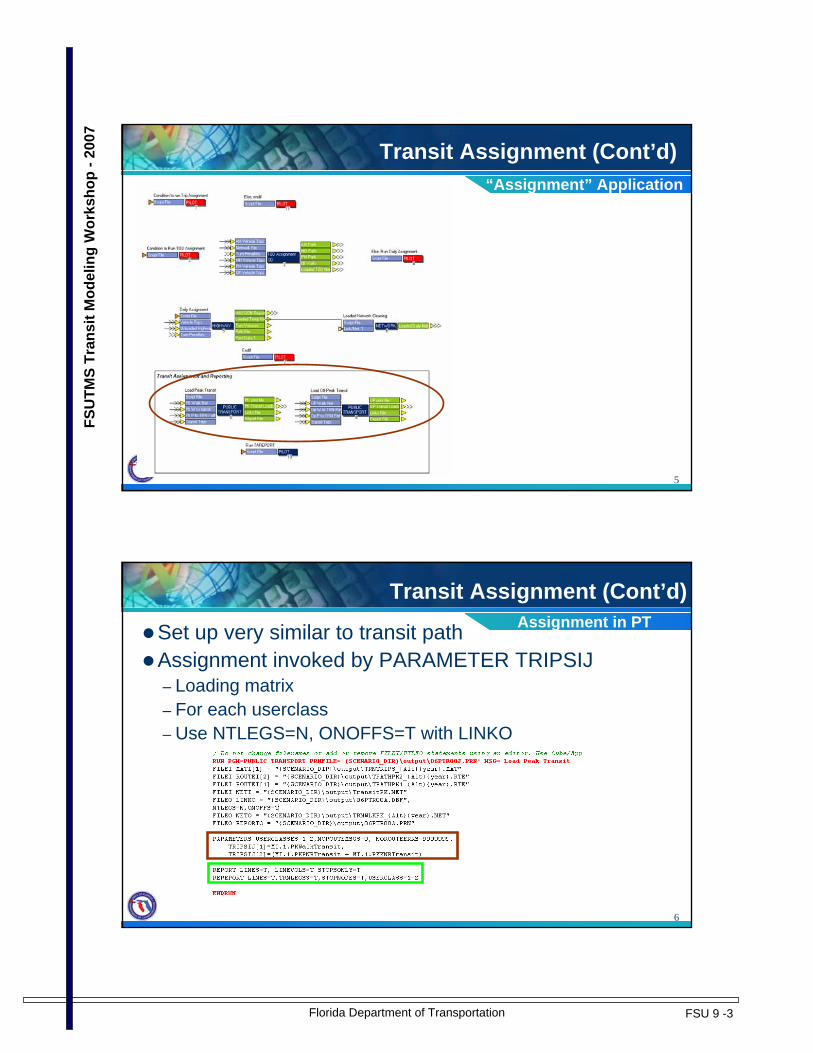
Florida Department of Transportation FSU 9 -3
FSU
TMS
Tran
sit M
odel
ing
Wor
ksho
p -2
007
5
Transit Assignment (Cont’d)“Assignment” Application
6
Transit Assignment (Cont’d)
Set up very similar to transit path Assignment invoked by PARAMETER TRIPSIJ– Loading matrix– For each userclass– Use NTLEGS=N, ONOFFS=T with LINKO
Assignment in PT

Florida Department of Transportation FSU 9 -4
FSU
TMS
Tran
sit M
odel
ing
Wor
ksho
p -2
007
7
Useful Reports From PT
Transfer Summary– By MODE– By TMODE– By OPERATOR– By USERCLASS
-----------------------------------REPORT XFERSUM=MODE UserClass=1MODE 21 31 1 12---------------------------------21 53.52 27.68 183.10 1.5631 18.48 329.84 717.59 0.441 193.42 707.27 -- --12 0.44 1.56 -- --
Print File
8
Useful Reports From PT (Cont’d)
A loaded network is created– Transit and non-transit network– Loaded volumes– Can be used to display transit loadingsA DBF file with loading by link– Used by the TAREPORT program
Other Output Files

Florida Department of Transportation FSU 9 -5
FSU
TMS
Tran
sit M
odel
ing
Wor
ksho
p -2
007
9
Useful Reports From PT (Cont’d)Transit On/Off
10
Useful Reports From PTTransit Line Profile

Florida Department of Transportation FSU 9 -6
FSU
TMS
Tran
sit M
odel
ing
Wor
ksho
p -2
007
11
Additional Assignment Features
FILEO LINKO can now output multiple files– Subscripted 1 through 4ONOFFS=T– Line-by-line output for ONs and OFFs– Required for TAREPORT program
12
LINKO Keywords
Loading data by individual userclass
Loading data for each NTLEG by link
Accumulates loadings by link; data for each link is distance, count-of-line, services-per-hour, transit volume and NT volumes
Line-by-line output for ONs and OFFsIf T, loadings on NTLEGSDescription
FBYCLASS
FNTBYLINK
FONELINKRECTONOFFSFNTLEGSValueKeyword
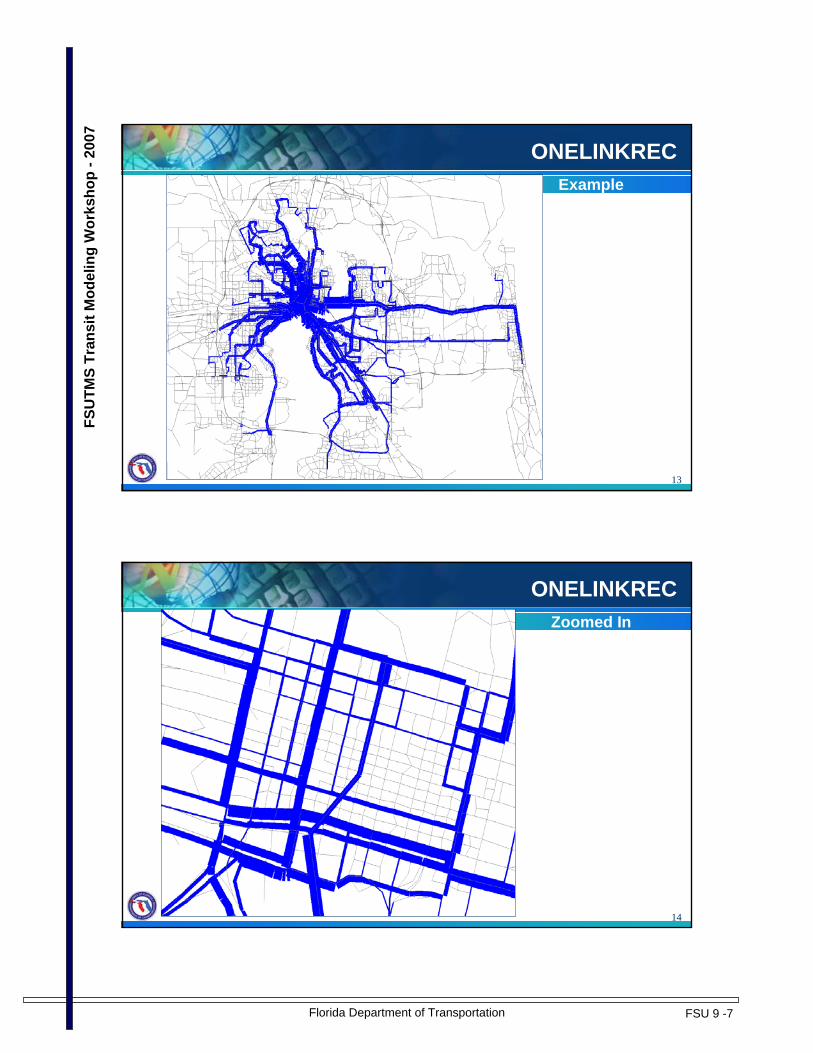
Florida Department of Transportation FSU 9 -7
FSU
TMS
Tran
sit M
odel
ing
Wor
ksho
p -2
007
13
ONELINKRECExample
14
ONELINKRECZoomed In

Florida Department of Transportation FSU 9 -8
FSU
TMS
Tran
sit M
odel
ing
Wor
ksho
p -2
007
15
ONELINKRECSkyway
16
TAREPORT

Florida Department of Transportation FSU 9 -9
FSU
TMS
Tran
sit M
odel
ing
Wor
ksho
p -2
007
17
TAREPORT (Cont’d)
18
TAREPORT (Cont’d)
Program reads control file named TAREPORT.CTL Reads the loaded transit link DBFsASCII summary report output by period
Field Columns Format Description
1 1 A1
Record indicator: “a” indicates alternative-specific extension “o” indicates loaded transit link DBF for the off-peak period “p” indicates loaded transit link DBF for the peak period
2 6-8 or 6-205
A3 or A200
If “a” in field #1, provide the alternative-specific extension in columns 6-8 Otherwise include the full path of the loaded transit link DBF
Format of TAREPORT.CTL

Florida Department of Transportation FSU 9 -10
FSU
TMS
Tran
sit M
odel
ing
Wor
ksho
p -2
007
19
TAREPORT (Cont’d)TAREPORT.CTL Example
; TAREPORT program filesa 00B p D:\FSUTMS\general\OlympusTrainingModel\Base\output\TRNLOADPK_B00.DBFo D:\FSUTMS\general\OlympusTrainingModel\Base\output\TRNLOADOP_B00.DBF
20
TAREPORT (Cont’d)Loaded DBF Columns
Field Format Description A Numeric Anode B Numeric Bnode
MODE Numeric Mode number OPERATOR Numeric Operator number
NAME Character “Short” route name LONGNAME Character Long route name
DIST Numeric Distance in miles TIME Numeric Transit travel time in minutes
LINKSEQ Numeric Node sequence number in transit route file HEADWAY,
HEADWAY[2] Numeric Headway. If using period=1, field name will be “Headway”. If period>1, field name will be “Headway[X]” where X is the period number
VOL Numeric Passenger load carried from anode to bnode STOPA Numeric “1” if anode is a transit stop, otherwise “0” ONA Numeric Boardings at anode in anode to bnode direction OFFA Numeric Alightings at anode in anode to bnode direction
STOPB Numeric “1” if bnode is a transit stop, otherwise “0” ONB Numeric Boardings at bnode in anode to bnode direction OFFB Numeric Alightings at bnode in anode to bnode direction
REV_VOL Numeric Only used if route is ONEWAY=F. Passenger load carried from bnode to anode REV_ONA Numeric Only used if route is ONEWAY=F. Boardings at anode in bnode to anode direction REV_OFFA Numeric Only used if route is ONEWAY=F. Alightings at anode in bnode to anode direction REV_ONB Numeric Only used if route is ONEWAY=F. Boardings at bnode in bnode to anode direction REV_OFFB Numeric Only used if route is ONEWAY=F. Alightings at bnode in bnode to anode direction

Florida Department of Transportation FSU 9 -11
FSU
TMS
Tran
sit M
odel
ing
Wor
ksho
p -2
007
21
TAREPORT (Cont’d)
Following output files are produced
Report fileTAREPORT.OUT
Report with results are stop-level by periodTASROUTE_ayy.PRN
Report with route-level results by periodTASUM_ayy.PRN
DescriptionFile
Report Files
22
TAREPORT (Cont’d)
Transit Assignment Summary Report04-11-2007 16:47:48.123
--------- Peak --------- ------- Off-peak ------- -- Daily --Route Name Mode Optr Dist Time Freq Pax MaxLd Time Freq Pax MaxLd Pax MaxLd
(mi) (min) (min) (min) (min)Rt 10 Shuttle 31 1 4.18 7.43 60.0 0.0 0.0Rt 11 E Main CombeeRd 31 1 14.99 26.48 60.0 0.0 0.0Rt 20 Grove Pk Crys Lk 31 1 16.48 27.90 60.0 0.0 0.0Rt 21 Edgewood 31 1 17.15 28.95 60.0 0.0 0.0Rt 30 Cleveland Hts 31 1 16.92 30.48 60.0 0.0 0.0Rt 31 S Fla Ave 31 1 14.94 26.69 30.0 0.0 0.0Rt 32 Medulla Loop 31 1 7.76 12.73 30.0 0.0 0.0Rt 32 South 31 1 22.44 30.22 60.0 0.0 0.0Rt 40 Ariana/Beacon 31 1 7.60 12.61 60.0 0.0 0.0Rt 53/54 Lakeside/Flightline 31 1 15.67 23.77 60.0 0.0 0.0Rt 53/55 Lakeside/Kidron Rd 31 1 14.35 21.78 60.0 0.0 0.0Rt 56 Kathleen/Mill Hall 31 1 11.74 18.97 60.0 0.0 0.0Rt 41 Central Ave 31 1 17.36 27.47 60.0 0.0 0.0Rt 42 W Memorial 31 1 13.99 22.47 30.0 0.0 0.0Rt 50 Kathleen 31 1 10.73 16.83 60.0 0.0 0.0Rt 51 Mall 31 1 13.25 22.28 30.0 0.0 0.0Rt 52 N Fla Ave 31 1 15.27 25.65 30.0 0.0 0.0Rt 10 Northside 21 2 13.22 32.47 60.0 0.0 0.0Rt 20 PCC 21 2 4.42 12.30 60.0 0.0 0.0Rt 30 Cypress Gardens 21 2 34.66 83.00 60.0 0.0 0.0Rt 40 Southside 21 2 13.77 36.99 60.0 0.0 0.0Rt 12/50 LL to WH 21 2 39.35 97.84 60.0 0.0 0.0Rt 22x Bartow Express 31 1 51.37 83.41 60.0 0.0 0.0Rt 15 Haines City 21 2 18.57 46.72 60.0 0.0 0.0Rt 25 Fort Meade to Bartow 21 2 28.70 56.12 120.0 0.0 0.0Rt 35 Regular Route 21 2 46.58 87.14 120.0 0.0 0.0Rt 50 Westside 21 2 9.49 23.19 60.0 0.0 0.0Rt 44 Southwest side 21 2 18.46 49.73 60.0 0.0 0.0
Output File
Route-Level
Report

Florida Department of Transportation FSU 9 -12
FSU
TMS
Tran
sit M
odel
ing
Wor
ksho
p -2
007
23
TAREPORT (Cont’d)Transit Assignment Route-Level Report04-11-2007 16:47:48.123Route name : Rt10 ShuttleLong name : Rt 10 ShuttleMode: 31 Operator: 1 Peak Freq: 60.00 Off-peak Freq: 0.00
------------------- Peak ------------------- ----------------- Off-peak ----------------- --------- Daily ---------Node Dist CumDist Time CumTime On Off Load Time CumTime On Off Load On Off Load
(mi) (mi) (min) (min) (min) (min)2849 0.04 0.04 0.08 0.08 0.0 0.0 0.0 0.00 0.00 0.0 0.0 0.0-2886 0.04 0.08 0.08 0.16 0.0 0.0 0.0 0.00 0.00 0.0 0.0 0.02909 0.04 0.12 0.08 0.24 0.0 0.0 0.0 0.00 0.00 0.0 0.0 0.0-2922 0.04 0.16 0.08 0.32 0.0 0.0 0.0 0.00 0.00 0.0 0.0 0.02949 0.05 0.21 0.11 0.43 0.0 0.0 0.0 0.00 0.00 0.0 0.0 0.0-2968 0.04 0.25 0.08 0.51 0.0 0.0 0.0 0.00 0.00 0.0 0.0 0.0-2976 0.04 0.29 0.09 0.60 0.0 0.0 0.0 0.00 0.00 0.0 0.0 0.0-2986 0.03 0.32 0.07 0.67 0.0 0.0 0.0 0.00 0.00 0.0 0.0 0.02983 0.03 0.35 0.07 0.74 0.0 0.0 0.0 0.00 0.00 0.0 0.0 0.0-2984 0.03 0.38 0.07 0.81 0.0 0.0 0.0 0.00 0.00 0.0 0.0 0.02982 0.04 0.42 0.09 0.90 0.0 0.0 0.0 0.00 0.00 0.0 0.0 0.0-2981 0.02 0.44 0.05 0.95 0.0 0.0 0.0 0.00 0.00 0.0 0.0 0.02990 0.06 0.50 0.14 1.09 0.0 0.0 0.0 0.00 0.00 0.0 0.0 0.02989 0.09 0.59 0.19 1.28 0.0 0.0 0.0 0.00 0.00 0.0 0.0 0.02988 0.17 0.76 0.36 1.64 0.0 0.0 0.0 0.00 0.00 0.0 0.0 0.02992 0.13 0.89 0.21 1.85 0.0 0.0 0.0 0.00 0.00 0.0 0.0 0.02993 0.13 1.02 0.20 2.05 0.0 0.0 0.0 0.00 0.00 0.0 0.0 0.02995 0.11 1.13 0.17 2.22 0.0 0.0 0.0 0.00 0.00 0.0 0.0 0.0-2987 0.13 1.26 0.22 2.44 0.0 0.0 0.0 0.00 0.00 0.0 0.0 0.0-2946 0.03 1.29 0.04 2.48 0.0 0.0 0.0 0.00 0.00 0.0 0.0 0.02929 0.14 1.43 0.26 2.74 0.0 0.0 0.0 0.00 0.00 0.0 0.0 0.0-2864 0.09 1.52 0.12 2.86 0.0 0.0 0.0 0.00 0.00 0.0 0.0 0.02870 0.16 1.68 0.21 3.07 0.0 0.0 0.0 0.00 0.00 0.0 0.0 0.02863 0.08 1.76 0.11 3.18 0.0 0.0 0.0 0.00 0.00 0.0 0.0 0.02816 0.42 2.18 0.57 3.75 0.0 0.0 0.0 0.00 0.00 0.0 0.0 0.02690 0.09 2.27 0.12 3.87 0.0 0.0 0.0 0.00 0.00 0.0 0.0 0.0-2669 0.17 2.44 0.23 4.10 0.0 0.0 0.0 0.00 0.00 0.0 0.0 0.0-2820 0.06 4.18 0.12 7.43 0.0 0.0 0.0 0.00 0.00 0.0 0.0 0.0
Output File
Stop-Level
Report
24
Transit Validation
Compare the transit boardings with the observed data– Validate by mode and/or operator
± 20% within each category– Check transfer rates
Transit Boardings

Florida Department of Transportation FSU 9 -13
FSU
TMS
Tran
sit M
odel
ing
Wor
ksho
p -2
007
25
Transit Validation (Cont’d)
CFRPM 4.0– Technical Memorandum No. 2 (Model Calibration
and Validation)
System-Wide
26
Validation Standards (1980s)

Florida Department of Transportation FSU 9 -14
FSU
TMS
Tran
sit M
odel
ing
Wor
ksho
p -2
007
27
Computer Exercises
Transit Assignment
Lesson 9
28
Lesson 9 Exercises
In this exercise you will complete the following:9.1 – Review transit assignment reports9.2 – Map transit boardings9.3 – Map transit desire lines (Optional)
Note: For this lesson you will need a completely fresh set of data. Please take a copy of the workshop CD. Delete the OlympusTrainingModel folder from C:\FSUTMS\general\ and copy the OlympusTrainingModel folder from the CD into C:\FSUTMS\general\. You must delete the version of the model on your hard drive before copying the fresh data or the model data will get intermixed and you may experience difficulties in completing the exercises in the rest of the workshop.

Florida Department of Transportation FSU 9 -15
FSU
TMS
Tran
sit M
odel
ing
Wor
ksho
p -2
007
29
Review Transit Assignment ReportsExercise 9.1
Step 1 Instructions: Navigate to the Olympus Model
1. Click on the FSUTMS Launcher icon
2. Select District 1 from the FSUTMS interface
3. Select Olympus Training Model
2
3
1
30
Run the model
Step 2 Instructions: CubeDouble Click on Base in the Scenario Manager.This action will display the Scenario Base dialog box that allows the user to execute the entire run by clicking on “Run” (see next slide).Click on the Run button (the model may take a few minutes to run).Once the model has completed the run successfully, click on the OKbutton.
Exercise 9.1 (Cont’d)
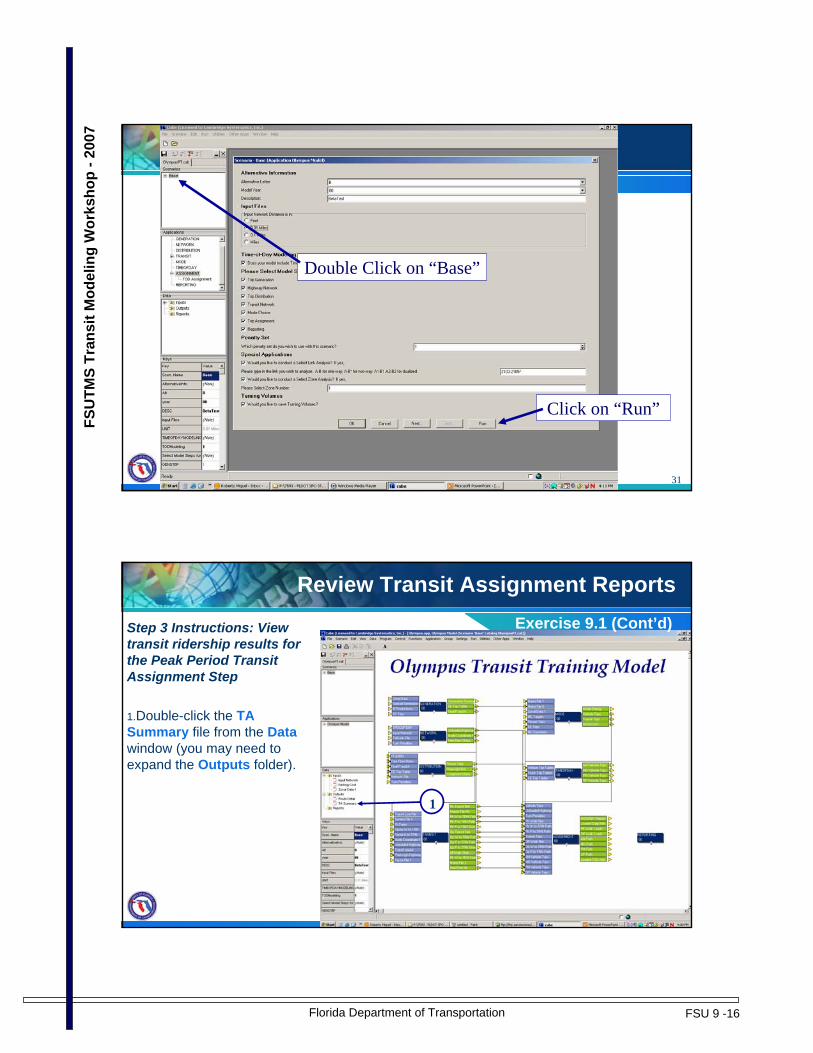
Florida Department of Transportation FSU 9 -16
FSU
TMS
Tran
sit M
odel
ing
Wor
ksho
p -2
007
31
Click on “Run”
Double Click on “Base”
32
Review Transit Assignment Reports
Step 3 Instructions: View transit ridership results for the Peak Period Transit Assignment Step
1.Double-click the TA Summary file from the Data window (you may need to expand the Outputs folder).
1
Exercise 9.1 (Cont’d)
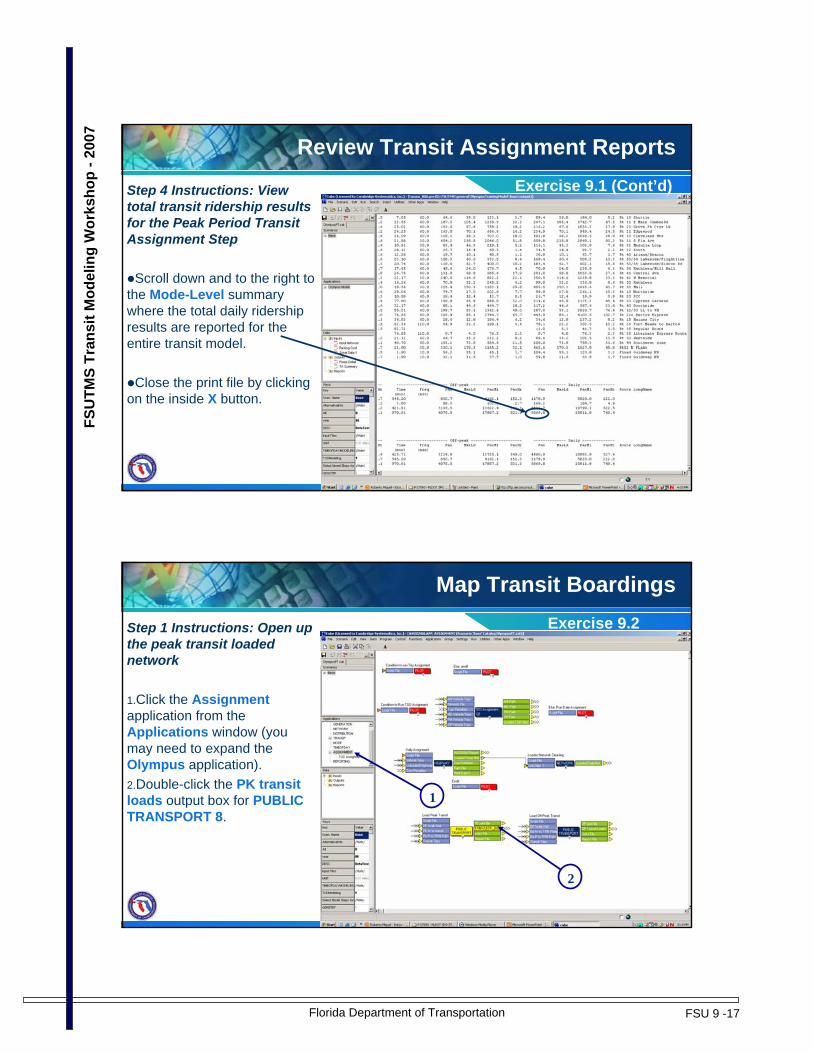
Florida Department of Transportation FSU 9 -17
FSU
TMS
Tran
sit M
odel
ing
Wor
ksho
p -2
007
33
Review Transit Assignment Reports
Step 4 Instructions: View total transit ridership results for the Peak Period Transit Assignment Step
Scroll down and to the right to the Mode-Level summary where the total daily ridershipresults are reported for the entire transit model.
Close the print file by clicking on the inside X button.
Exercise 9.1 (Cont’d)
34
Map Transit Boardings
Step 1 Instructions: Open up the peak transit loaded network
1.Click the Assignmentapplication from the Applications window (you may need to expand the Olympus application). 2.Double-click the PK transit loads output box for PUBLIC TRANSPORT 8.
1
2
Exercise 9.2

Florida Department of Transportation FSU 9 -18
FSU
TMS
Tran
sit M
odel
ing
Wor
ksho
p -2
007
35
Step 2 Instructions: Zoom in on Target Route.1. Select Center on Nodefrom the View menu at the top of the screen.2. Enter node 2580 and set the scale to 7060.
1
2
3
Map Transit BoardingsExercise 9.2 (Cont’d)
36
Step 3 Instructions: Elevate Transit Layer.
Set the TRN: TRNWLKPK_B00.NETlayer to the top by selecting it from the layer drop down menu.
Map Transit BoardingsExercise 9.2 (Cont’d)
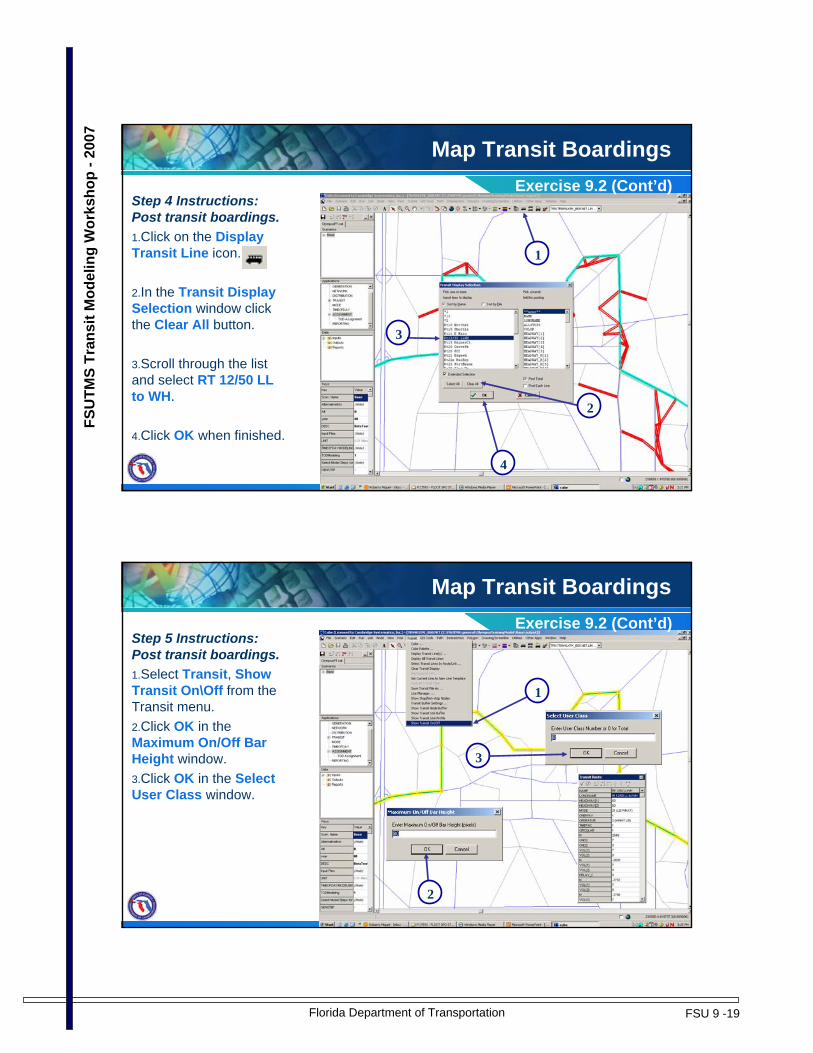
Florida Department of Transportation FSU 9 -19
FSU
TMS
Tran
sit M
odel
ing
Wor
ksho
p -2
007
37
Step 4 Instructions: Post transit boardings.1.Click on the Display Transit Line icon.
2.In the Transit Display Selection window click the Clear All button.
3.Scroll through the list and select RT 12/50 LL to WH.
4.Click OK when finished.
1
2
3
4
Map Transit BoardingsExercise 9.2 (Cont’d)
38
Step 5 Instructions: Post transit boardings.1.Select Transit, Show Transit On\Off from the Transit menu. 2.Click OK in the Maximum On/Off Bar Height window.3.Click OK in the Select User Class window.
1
2
3
Map Transit BoardingsExercise 9.2 (Cont’d)

Florida Department of Transportation FSU 9 -20
FSU
TMS
Tran
sit M
odel
ing
Wor
ksho
p -2
007
39
Step 6 Instructions: Post transit boardings.
The green bar represents boardings.
The blue bar represents alightings.
The teal bar represents through volumes.
Close the network by clicking on the inside Xbutton.
Map Transit BoardingsExercise 9.2 (Cont’d)
40
Map Transit Desire Lines
Step 1 Instructions: Open up the peak transit loaded network and transit trip table
1.Click the Assignmentapplication from the Applications window (you may need to expand the Olympus application). 2.Double-click the Transit Trips input box for PUBLIC TRANSPORT 8.3.Minimize the matrix and double-click the PK transit loads output box for PUBLIC TRANSPORT 8.
1
32
Optional Exercise 9.3

Florida Department of Transportation FSU 9 -21
FSU
TMS
Tran
sit M
odel
ing
Wor
ksho
p -2
007
41
Map Transit Desire LinesStep 2 Instructions: Link the transit trip table to the loaded network.1. Select Link to Matrixfrom the Node menu at the top of the screen.2. Select the transit trip table from the Available Linkage area in the Set Linkage to Matriceswindow.3. Click on the Addbutton. 4. Click on the Close button.
1
342
Optional Exercise 9.3 (Cnt’d)
42
Map Transit Desire LinesStep 4 Instructions: Create total transit desire lines.
Select Desire Lines from the Post menu.
Add the transit trip purposes together to get total transit ridership. To do this, right-click in the Matrix Table(s) field in the Desire Lines window and select each of the six tables. The tables may be separated by a “+” sign, comma, or space. Regardless of the sign, they will be added together.
Optional Exercise 9.3 (Cnt’d)

Florida Department of Transportation FSU 9 -22
FSU
TMS
Tran
sit M
odel
ing
Wor
ksho
p -2
007
43
Map Transit Desire LinesStep 5 Instructions: Finish specifying desire line settings and display.1. Set the Scale to 0.05.2. Set the Origin Zone to 150.3. Set the Destination Zones to 1-630.4. Click on Display to view trips by bandwidth from zone 150 to zones 1-630.5. Zoom in to the results by clicking on the Zoom Inbutton and dragging a square around downtown Olympus.
5
1 2
3
4
Optional Exercise 9.3 (Cnt’d)
44
Map Transit Desire Lines
Step 6 Instructions: Clear the results and close FSUTMS.
Select Clear All Postingsfrom the Post menu to remove the desire lines.
Click on Close button to close out the Desire Lineswindow.
Click on outside X button to close FSUTMS. If asked to save project file, say NO.
Optional Exercise 9.3 (Cnt’d)

Florida Department of Transportation FSU 9 -23
FSU
TMS
Tran
sit M
odel
ing
Wor
ksho
p -2
007
45
End of Lesson 9Close all files and return to the Desktop and Stop.
46
Summary
In this lesson we covered:Overview of transit assignmentHow it is done in OlympusUseful reports from PT Assignment reporting programValidation

Florida Department of Transportation FSU 9 -24
FSU
TMS
Tran
sit M
odel
ing
Wor
ksho
p -2
007
47
Notes
48
Notes

Florida Department of Transportation FSU 9 -25
FSU
TMS
Tran
sit M
odel
ing
Wor
ksho
p -2
007
49
Notes

Florida Department of Transportation FSU 10 -1
FSU
TMS
Tran
sit M
odel
ing
Wor
ksho
p-2
007
1
Sorry, it’s not perfect;to err is human
(Limitations of the Model)
Lesson 10
2
Lesson Goals
In this lesson we will cover:Assignment limitationsLimitations of the transit modeling process

Florida Department of Transportation FSU 10 -2
FSU
TMS
Tran
sit M
odel
ing
Wor
ksho
p-2
007
3
Game
Game 10.1
The Price is Right
4
Assignment Limitations
Do not try to validate ridership on all individual routes. Why?– Zone system cannot handle micro-level boarding/alighting
locations– Example of the aggregation problem (next slide)Do not try to match ridership exactly during validation. Why?– Over-specifying model leads to poor forecasting
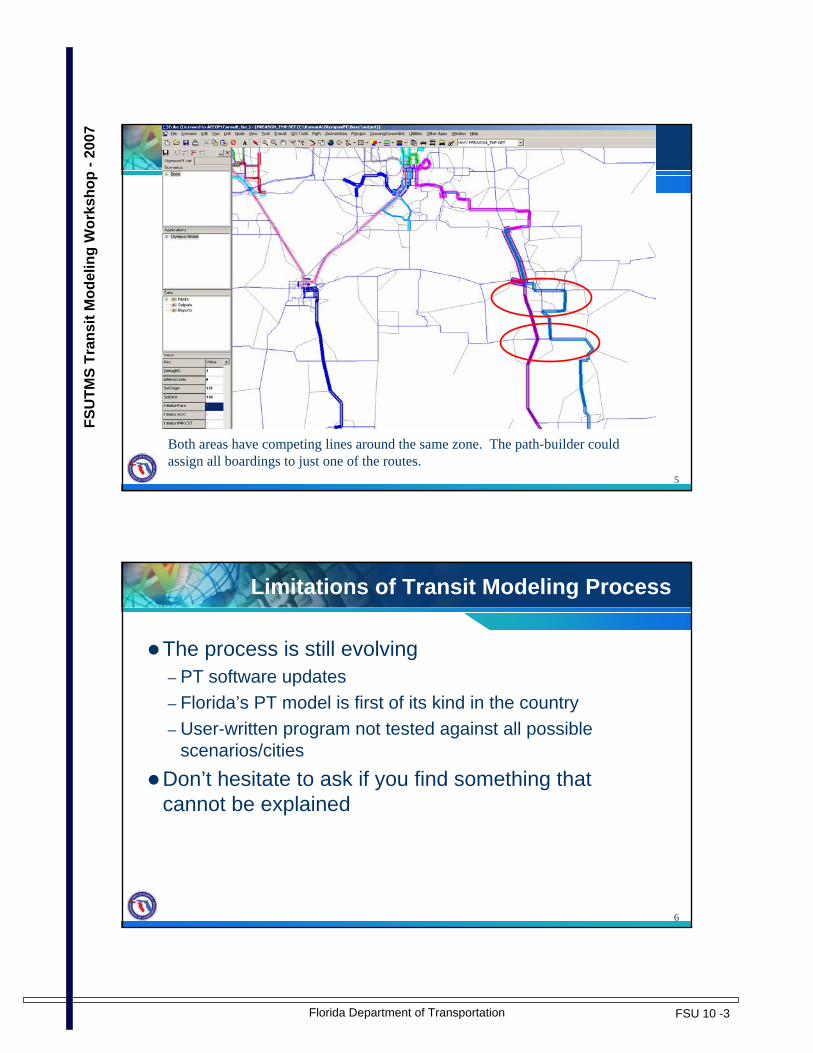
Florida Department of Transportation FSU 10 -3
FSU
TMS
Tran
sit M
odel
ing
Wor
ksho
p-2
007
5
Both areas have competing lines around the same zone. The path-builder could assign all boardings to just one of the routes.
6
Limitations of Transit Modeling Process
The process is still evolving – PT software updates– Florida’s PT model is first of its kind in the country– User-written program not tested against all possible
scenarios/citiesDon’t hesitate to ask if you find something that cannot be explained
Florida Department of Transportation FSU 10 -4
FSU
TMS
Tran
sit M
odel
ing
Wor
ksho
p-2
007
7
Summary
In this lesson we covered:Assignment limitationsTransit modeling process limitations
8
Notes

Florida Department of Transportation FSU 11 -1
FSU
TMS
Tran
sit M
odel
ing
Wor
ksho
p -2
007
1
To UB or not to UB!(User Benefits)
Lesson 11
2
Lesson Goals
In this lesson we will cover:Overview & definition of User BenefitsCalculation of User BenefitsApplication of User Benefits– Using TPP2UB
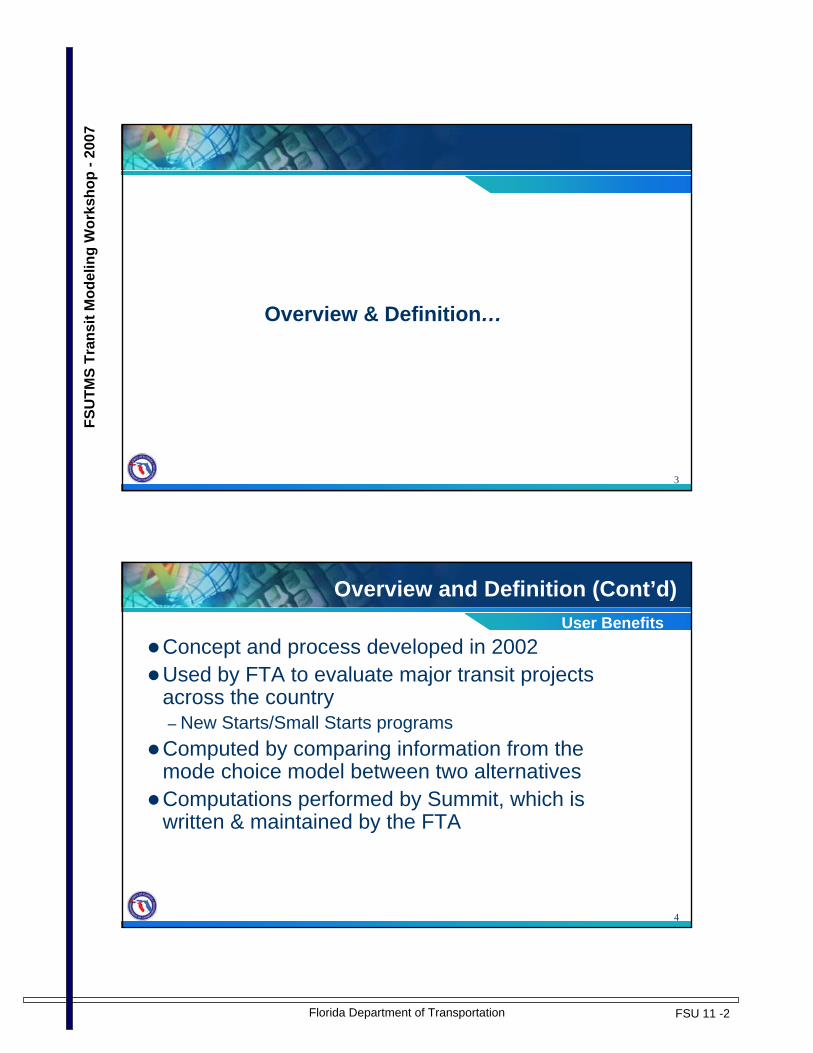
Florida Department of Transportation FSU 11 -2
FSU
TMS
Tran
sit M
odel
ing
Wor
ksho
p -2
007
3
Overview & Definition…
4
Overview and Definition (Cont’d)
Concept and process developed in 2002Used by FTA to evaluate major transit projects across the country– New Starts/Small Starts programsComputed by comparing information from the mode choice model between two alternativesComputations performed by Summit, which is written & maintained by the FTA
User Benefits

Florida Department of Transportation FSU 11 -3
FSU
TMS
Tran
sit M
odel
ing
Wor
ksho
p -2
007
5
Overview & Definition (Cont’d)
Transportation system user benefits– User benefits are the changes in mobility for individual
travelers that are caused by a project or policy change, measured in hours of travel time, and summed over all travelers.
Changes in mobility– Shorter transit times: in-vehicle, walk, wait– Fewer transfers– Relief of crush loading conditions– Shorter auto times due to lower congestion– Others
Definition
6
Calculation…

Florida Department of Transportation FSU 11 -4
FSU
TMS
Tran
sit M
odel
ing
Wor
ksho
p -2
007
7
Calculation
Derived from mode-choice model:
Share(tran) = ------------------------------------------------------------Mobility(drive) + Mobility(pool) + Mobility(tran)
Mobility(tran)
...tParkingCosβFareβTimeOutVehicleβimeInVehicleTββ)Mobility(m 43210 +∗+∗+∗+∗+=
8
Calculation (Cont’d)
Replaces travel time savings for mobilityReplaces new riders for cost effectiveness– Captures benefits for all transit trips– Captures benefits from any changed attributeReplaces low-income households and jobs near new stations
New Starts

Florida Department of Transportation FSU 11 -5
FSU
TMS
Tran
sit M
odel
ing
Wor
ksho
p -2
007
9
Calculation (Cont’d)
Reporting of trips and user benefits– Totals across all socio-economic segments– District-to-district summaries reports– Row totals, column totals thematic maps– Frequency distributions of per-trip benefits– Results for individual socio-economic segments
New Starts
10
Calculation (Cont’d)
User benefit comes from comparing transit logsumof two alternativesMode choice outputs binary file– Summit uses these binary files Olympus model includes the ability to produce these binary files
Summit

Florida Department of Transportation FSU 11 -6
FSU
TMS
Tran
sit M
odel
ing
Wor
ksho
p -2
007
11
Sample: Transportation Benefitsfor Individual Travel Markets
Report 1-5Total User Benefits (hours) for the Build Alternative
All Transit-Access MarketsHome-Based-Work
Production Attraction DistrictDistrict | 1 2 3 4 5 6 7 8 9 10 11 12 13 14 15 16 17 | Total-------------+--------------------------------------------------------------------------------------+------1 CBD | 4 -1 4 0 5 0 0 6 15 1 0 9 0 0 0 0 0 | 412 Urban | 194 86 67 0 39 0 0 73 281 8 0 220 0 15 0 0 0 | 9843 N Suburb | 135 50 37 0 21 0 0 10 39 2 0 54 0 3 0 0 0 | 3514 N Rural | 1 1 3 0 1 0 0 0 2 0 0 2 0 0 0 0 0 | 105 W Suburb | 219 140 41 0 93 0 0 23 240 4 0 83 0 3 0 0 0 | 8466 NW Suburb | -13 2 7 0 0 0 0 1 10 0 0 8 0 0 0 0 0 | 157 NW Rural | 42 18 13 0 5 0 0 2 4 0 0 8 0 0 0 0 0 | 938 S Suburb | 150 86 14 0 17 0 0 130 63 7 0 72 0 1 0 0 0 | 5409 SW Suburb | 201 147 17 0 108 0 0 31 195 5 0 62 0 1 0 0 0 | 766
10 SE Suburb | 18 12 3 0 4 0 0 3 7 0 0 14 0 0 0 0 0 | 6211 SE Rural | 2 4 2 0 1 0 0 1 3 1 0 8 0 0 0 0 0 | 2212 E Suburb | 832 467 88 0 111 0 0 97 191 25 0 909 0 20 0 0 0 | 273913 E Rural | 0 3 3 0 1 0 0 1 3 0 0 9 0 0 0 0 0 | 2014 NE Suburb | 104 49 13 0 10 0 0 5 11 2 0 78 0 3 0 0 0 | 27615 NE Rural | -41 -16 -2 0 -3 0 0 -1 -1 0 0 -7 0 0 0 0 0 | -7216 External | 835 345 123 0 79 0 0 37 95 7 0 138 0 8 0 0 0 | 166817 Other | 2 1 0 0 0 0 0 0 0 0 0 0 0 0 0 0 0 | 4-------------+--------------------------------------------------------------------------------------+------
Total | 2684 432 493 0 1158 0 0 0 0 || 1396 0 0 420 61 1665 55 0 | 8364
12
Sample: Transportation Benefits

Florida Department of Transportation FSU 11 -7
FSU
TMS
Tran
sit M
odel
ing
Wor
ksho
p -2
007
13
Application……
14
Application
Baseline– Basis for comparison for New Starts– Isolation of costs and benefits of projects– Typically “low-cost” alternativeBuild– Improvement from Baseline conditions, typically “higher-cost”– Transit network and mode choice model uses Baseline highway
network/skimsand person trip table
Two Alternatives

Florida Department of Transportation FSU 11 -8
FSU
TMS
Tran
sit M
odel
ing
Wor
ksho
p -2
007
15
Application (Cont’d)
Consistent treatment of both alternatives– Parking rates, transit fares, etc.– Level playing field for national comparisons– Avoidance of implicit penalties for good current service or
for good planningRun baseline and build– Produce summit data file using TPP2UB program
Two Alternatives
16
TPP2UB program
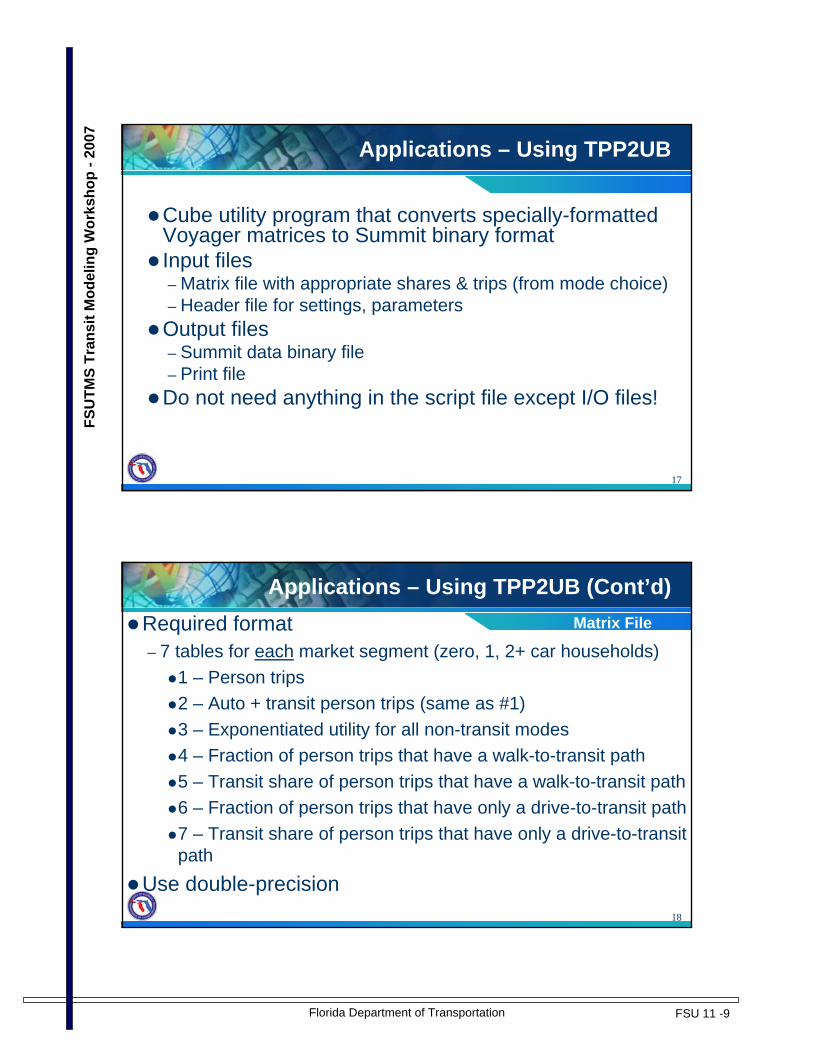
Florida Department of Transportation FSU 11 -9
FSU
TMS
Tran
sit M
odel
ing
Wor
ksho
p -2
007
17
Applications – Using TPP2UB
Cube utility program that converts specially-formatted Voyager matrices to Summit binary formatInput files– Matrix file with appropriate shares & trips (from mode choice)– Header file for settings, parametersOutput files– Summit data binary file– Print fileDo not need anything in the script file except I/O files!
18
Applications – Using TPP2UB (Cont’d)Required format– 7 tables for each market segment (zero, 1, 2+ car households)
1 – Person trips2 – Auto + transit person trips (same as #1)3 – Exponentiated utility for all non-transit modes 4 – Fraction of person trips that have a walk-to-transit path5 – Transit share of person trips that have a walk-to-transit path6 – Fraction of person trips that have only a drive-to-transit path7 – Transit share of person trips that have only a drive-to-transit path
Use double-precision
Matrix File

Florida Department of Transportation FSU 11 -10
FSU
TMS
Tran
sit M
odel
ing
Wor
ksho
p -2
007
19
Application – Using TPP2UB (Cont’d)
StringStringStringRealRealFormat
Alternative name description (60 chars max)UBALTNAMETime of day description (6 chars max)UBTODPurpose description (6 chars max)UBPURPOSEAuto in-vehicle time coefficientUBAUTOCOEFTransit in-vehicle time coefficientDescription
UBTRNCOEFName
Header File Variables
20
Applications – Using TPP2UB (Cont’d)
; HBWUBTRNCOEF=-0.0200UBAUTOCOEF=-0.0200UBPURPOSE='HBW'UBTOD='ALL'UBALTNAME='Base'
; HBOUBTRNCOEF=-0.0100UBAUTOCOEF=-0.0100UBPURPOSE='HBO'UBTOD='ALL'UBALTNAME='Base'
; NHBUBTRNCOEF=-0.0200UBAUTOCOEF=-0.0200UBPURPOSE='NHB'UBTOD='ALL'UBALTNAME='Base'
Header File Examples

Florida Department of Transportation FSU 11 -11
FSU
TMS
Tran
sit M
odel
ing
Wor
ksho
p -2
007
21
Application – Using TPP2UB (Cont’d)
Alternative name60Character7
Time of day6Character6
Character
Real
Real
Integer
Integer
Format
6
4
4
4
4
Bytes
Travel purpose5
Coefficient on auto in-vehicle time4
Coefficient on transit in-vehicle time3
Number of market segments2
Number of zones
Description1
Field
Input Binary File FormatHeader Record
22
Application – Using TPP2UB (Cont’d)
Transit share of person trips that have only a drive-to-transit path4Real10
Fraction of person trips that have only a drive-to-transit path4Real9
Transit share of person trips that have a walk-to-transit path4Real8
Fraction of person trips that have a walk-to-transit path4Real7Exponentiated utility for all non-transit modes4Real6
RealRealIntegerIntegerIntegerFormat
44222Bytes
Auto & transit person trips5Person trips4Socio-economic market segment number3Attraction zone2Production zone Description
1Field
Repeats for each market segment
Input Binary File FormatData Record
Florida Department of Transportation FSU 11 -12
FSU
TMS
Tran
sit M
odel
ing
Wor
ksho
p -2
007
23
Summary
In this lesson we covered:
●Overview and definition of User Benefits
●Calculation of User Benefits
●Application of User Benefits, including TPP2UB
24
Notes

Florida Department of Transportation FSU 12 -1
FSU
TMS
Tran
sitM
odel
ing
Wor
ksho
p -2
007
1
Computer Exercises
Final Summary Exercise
Lesson 12
2
Lesson 12 Exercises
In this exercise you will complete the following:12.1 – Comprehensive Summary

Florida Department of Transportation FSU 12 -2
FSU
TMS
Tran
sitM
odel
ing
Wor
ksho
p -2
007
3
Comprehensive Summary
Exercise 12.1
Step 1 Instructions: Navigate to the Olympus Model
1. Click on the FSUTMS Launcher icon
2. Select District 1 from the FSUTMS interface
3. Select Olympus Training Model
2
3
1
4
Comprehensive Summary (Cont’d)
Instructions:Using the fresh data provided for Lesson 9 and the techniques you learned throughout this workshop, you will be required to make significant edits to the transit model. You have a great amount of freedom in making these edits, but they must include the following adjustments, at a minimum:
– You must add at least 1 local bus line with at least 10 stops.– You must add at least 1 fixed guideway with at least 4 micro-coded
stations– You must adjust the fares for at least 1 mode and 1 operator
You may make as many additional edits as time permits. Be sure to document all of your changes. When you have finished, run your model and debug if necessary. The instructor will maintain an unaltered set of data.
Exercise 12.1 (Cont’d)

Florida Department of Transportation FSU 12 -3
FSU
TMS
Tran
sitM
odel
ing
Wor
ksho
p -2
007
5
Comprehensive Summary (Cont’d)Instructions (Cont’d):When your model has finished running, compare your results with the instructor’s data set. Be sure to look at such characteristics, including but not limited to:
– Total transit boardings and alightings;– Boardings and alightings on your new transit routes; and– Total ridership.
Also, compare your results with those of your classmates. Discuss the impact that your changes have made to your model results. If time permits, make an additional minor change to the model, such as adding a stop to an existing route or changing one particular fare. Rerun the model and check the results. Were the changes significant or minor? Did the model behave in the way you anticipated or were the results not what you expected?
Exercise 12.1 (Cont’d)
6
End of Lesson 12Close all files and return to the Desktop and Stop.
Florida Department of Transportation FSU 12 -4
FSU
TMS
Tran
sitM
odel
ing
Wor
ksho
p -2
007
7
Summary
This concludes the FSUTMS Transit Modeling Workshop!
Don’t forget to:Shut down your laptop,Fill out your evaluation form,Confirm your contact information and add your P.E. number if applicable, andTake your workbook, CD, and certificate with you!
8
Notes