FSIS Work Measurements - George Mason · FSIS Work Measurements . 2 ... The N60 sampling task is a...
14
Brandon Fallon Sara Hoffmann Arun Pillai SEOR Capstone Course Dr. Kathryn Laskey FSIS Work Measurements
-
Upload
trinhkhuong -
Category
Documents
-
view
216 -
download
0
Transcript of FSIS Work Measurements - George Mason · FSIS Work Measurements . 2 ... The N60 sampling task is a...

1
Brandon Fallon
Sara Hoffmann
Arun Pillai
SEOR Capstone Course
Dr. Kathryn Laskey
FSIS Work Measurements

2
Table of Contents 1. Introduction .......................................................................................................................................... 3
2. Background .......................................................................................................................................... 3
2.1 FSIS/PHIS Background ....................................................................................................................... 3
2.2 Fall 2013 Project Work ...................................................................................................................... 4
3. Problem Statement ................................................................................................................................... 5
4. Project Scope ............................................................................................................................................ 5
4.1 FSIS Prioritization ................................................................................................................................ 5
4.2 Validation of the Indirect Multiplier ................................................................................................... 5
4.3 Evaluation of PHIS Data Fields ............................................................................................................ 6
4.4Incremental Study ................................................................................................................................ 7
5.0 Preliminary Requirements ...................................................................................................................... 7
6.0 Solution Development ............................................................................................................................ 7
6.1 Statistical Analysis for DCS .................................................................................................................. 7
6.2 PHIS Data Analysis ............................................................................................................................... 7
7.0 Deliverables ............................................................................................................................................. 8
7.1 Indirect Multiplier Methodology ........................................................................................................ 8
7.2 Indirect Multiplier Algorithm .............................................................................................................. 8
7.3 Data Collection Plan ............................................................................................................................ 8
7.4 Updated Data Collection Sheets ......................................................................................................... 8
7.5Instructions for Data Collection ........................................................................................................... 8
7.6 Training for Data Collection ................................................................................................................ 8
7.7 N60 Task Improvements ..................................................................................................................... 8
7.8 PHIS Preliminary Analysis .................................................................................................................... 8
7.9 Final Project Report ............................................................................................................................ 9
8.0 Risks ........................................................................................................................................................ 9
8.1 Delays to Receive Information ............................................................................................................ 9
8.2 Furlough / Government Shutdown ..................................................................................................... 9
8.3 Incomplete/Incorrect Data Sheets ...................................................................................................... 9
8.4 Availability of Data from Small and Very Small Plants ........................................................................ 9
9.0 Project Schedule ................................................................................................................................... 11
10.0 References .......................................................................................................................................... 14
3
1. Introduction
The Food Safety and Inspection Service (FSIS) is a public health agency in the United States Department of Agriculture (USDA). Their responsibility is to ensure the commercial supply of meat, poultry and egg products is safe, wholesome, and correctly labeled and packaged. All tasks are assigned to Inspection Program Personnel (IPP) through the Public Health Information System (PHIS). A work measurement is a measure of work within an assignment reported as a full or partial staff year, which includes the amount of time to complete a task. As new PHIS tasks are developed the Agency needs a uniform procedure in measuring tasks times and inputting into the work measurement calculation. This project will develop a methodology for calculating the indirect/direct multiplier for the N60 task which can be applied to other work measurements.
2. Background
2.1 FSIS/PHIS Background The Federal Meat Inspection Act (FMIA) of 1906 was the foundation of federal inspections of meat, poultry and eggs. From the FMIA came the Pure Food and Drug Act which “prevented the manufacture, sale, or transportation of adulterated or misbranded foods, drugs, medicines, and liquors.”5
In 1981, the Food Safety and Inspection Service was created to perform meat and poultry grading and inspection activities. Until 1993, FSIS inspection of beef was mainly organoleptic – relying on sight, smell and touch. After an E. coli break out in the Pacific Northwest left over 400 sick and four people dead, the agency and stakeholders called for a more “scientific-based” approach. Through the Hazard Analysis and Critical Control Point (HACCP) System they focused on microbial pathogens that cause illness and how to prevent and reduce their presence in raw products. Since the introduction of HACCP, FSIS has stepped up its efforts to continue to monitor food for microbial pathogens, including Listeria monocytogenes, stricter tests of Salmonella and Campylobacter, along with identifying six serogroups of E.coli. In order for the FSIS to perform all its responsibilities, it employs over 7600 inspectors who work across the nation to cover over 6500 plants, divided into 10 districts. To better accommodate the work required for the inspectors, FSIS launched PHIS to help manage, collect and analyze data. This system also assists in scheduling the tasks deemed necessary to fulfill their public safety missions. PHIS is designed so it allocates an appropriate number of tasks so that inspectors are assigned a workload of 100% (targeting 75 – 125%) based on a 40 hour work week. This measurement is used to compute the annual number of hours needed to perform inspections which then determines how many inspectors need to be employed. This is used in the agency’s budget numbers which are in turn approved by Congress. Task times are comprised of four types of events; direct inspection, indirect inspection, external travel and internal travel. Direct inspection refers to any hands-on sampling inspection or direct

4
observation, including cutting, bagging and shipping to the lab. Indirect inspection comprises everything outside of the direct time (excluding travel), which can consist of preparing materials, reviewing plant documentation, and entering data into PHIS. External travel is the time spent going from plant to plant, while internal travel is time spent within the plant. The current system has a measurement for the direct task time and bases the indirect time on a set multiplier. Over the past several years, there has been an increase in the amount of indirect work that needs to be performed. For the purpose of this project, FSIS has asked GMU to focus on just one sampling technique, the N60 sampling task. The N60 sampling task is a method used in the MT60 and MT55 procedures for collecting raw beef trim to test for E. coli (O157:H7). The process is comprised of collecting 60 samples of before or after slaughtered beef intended for raw ground beef, other non-intact raw beef products, or when the intention is unknown. Each sample must be cut to the identical size, 1x3 inches and ⅛ inch thick. The samples are then bagged and shipped to the laboratory for testing via FedEx. A similar sampling task that may also be used is the 2lb Grab. This was performed when the meat was already cut into the desired dimensions, at which the inspector only needed to grab 2lb of meat. Similarly, the inspector then bagged the samples and shipped to the laboratory. This project will not consider the 2lb Grab.
2.2 Fall 2013 Project Work The overall need of FSIS will span across multiple semesters. As such, FSIS has proposed to a continued relationship with George Mason University. The first project occurred during the fall project team of 2013 by Christopher Bang, Amanda Kryway, Scott Motter and Karen Tung and will be referred to as the Fall 2013 Project. The present project is a continuation of their work and will set the stage for the continuation in the fall of 2014. While there are dozens of tasks assigned to the IPP, the scope of Fall 2013 Project focused on measuring the amount of time it took to complete indirect and direct tasks for the N60 and 2lb Grab sampling tasks. The team was asked to validate the current indirect multiplier of 1.8, which is translated as the total time to complete the indirect and direct tasks for the N60 method was direct time multiplied by 1.8. In order to measure the time to complete the tasks, the Fall 2013 Project developed a Data Collection Sheet (DCS) which broke out the indirect and direct activities necessary to perform the N60 method. The DCS were distributed to management across the nation who scheduled to perform the N60 method within a 3 week period. The goal of the Fall 2013 Project was to determine whether the current multiplier of 1.8 was appropriate, and if not, what modifications should be made. The Fall 2013 Project data collection included several other factors that could affect the amount of time it took to perform the indirect and direct tasks:
Plant Size (broken out by square footage) N60 vs. 2lb Grab Team Size (how many people were performing the sampling, either one or two) District (in which of the 10 districts was the sampling done) Connection Type (what internet connection were they using when the accessed PHIS)
Their results suggested that indirect time was not related to direct time as there was no correlation present. Furthermore, none of the five factors were statistically significant when

5
measuring indirect time. Direct time did show some relationship to the N60 vs. 2lb Grab and District factors, but the latter was not researched as to why it had an effect on the direct time.
3. Problem Statement
The Fall 2013 Project had three limitations which will be addressed in this project. First, Bargaining Unit Employees (BUEs) did not participate in the study. The BUEs are covered by a Collective Bargaining Agreement (CBA) with the National Joint Council of Food Inspection Locals (NJC) and were unable to participate until FSIS consulted the NJC. Therefore, FSIS management personnel participated in the Fall 2013 Project time study. To build off of the Fall 2013 Project, this project will perform a time study using the BUEs. Second, the Fall 2013 Project discovered some confusion when filling out the DCS. This project will update the DCS following the recommendations of the Fall 2013 Project. Third, the Fall 2013 Project was unable to collect data from all plant sizes. Plants are categorized by FSIS into three sizes based on the number of employees: very small, small and large. These plant classifications are different from the plant size criteria used in the Fall 2013 Project, which was based on the square footage of the plant. With the involvement of BUEs in the Spring 2014 Project, the goal is to target an equal number of inspections from the three types of plants based on employee size. FSIS wishes to further justify and define the methodology for calculating the time for the N60 sampling, to include direct and indirect task time measurements, which can potentially be applied to other sampling tasks. For the Spring 2014 Project, FSIS has advised removal of the 2lb Grab from the analysis due to the limited number of plants that perform the task. Hence, the focus will only be on the N60 sampling.
4. Project Scope
4.1 FSIS Prioritization The project for Spring 2014 has been split into two main objectives. The primary objective, and highest priority per FSIS, is to determine whether the indirect multiplier currently used by FSIS is valid, and if not, provide a corrected multiplier or substitute method of calculating the indirect sampling time. The second objective is to evaluate the format of PHIS data fields utilized by FSIS to determine whether it would be beneficial to conduct further investigation into the setup and utilization of PHIS, specifically related to the measurement of indirect task time.
4.2 Validation of the Indirect Multiplier FSIS has requested that the Spring 2014 Project team include the work conducted during the Fall 2013 Project in order to ensure that the recommendations presented can be independently validated prior to release outside the agency. Due to this request, the Spring 2014 Project team will collect, at a minimum, the same time measurements as utilized by the prior project, with the main difference being the data collection will be conducted with BUEs. Data collection will be conducted as directed by FSIS management with no oversight from George Mason. The data

6
collection process consultations between FSIS and the NJC, training of the process, and evaluation of data collection sheets will take approximately three weeks. Then, the actual data collection process is estimated to take approximately one month, with time measurements sent directly back to George Mason University for analysis. The Fall 2013 Project received 107 DCS. Of the 107 DCS received, the Fall 2013 Project was only able to use 88. Therefore, this project plan will request an additional 20% more DCS, from across the three plant sizes (based on employees). The goal is to collect at least 36 DCS from each of the plant sizes to ensure a minimum of 30 of each plant size is obtained. The Fall 2013 project team was unable to acquire data from any very small plants. Capturing very small plants in the time study can be difficult because sampling frequency is based in part on production volume and, therefore, very small plants typically require fewer MT60 and MT55 tasks. Even when PHIS schedules an MT60 or MT55 task, samples will only be collected if the establishment is making a product that requires such sampling. This will be overcome by selecting a large pool of inspectors who each perform N60 sampling at small and very small plants. When the PHIS schedule is available, a group of approximately 55 inspectors who are scheduled to perform at least one N60 inspection at very small facilities during the data collection period will be selected to participate in the time study. Assuming 66% of the scheduled very small and small inspections occur, this would result in approximate 36 completed DCS. Once the raw data is received, compiled, and formatted, the project team will conduct statistical analysis in order to determine whether the current FSIS indirect multiplier is valid. If the analysis shows that the indirect multiplier is not valid for use, a recommendation should be made to FSIS for either a new multiplier, or new process, to calculate future indirect inspection task time. These recommendations will also include suggestions for future work that will be based on the analysis and results from the projects. In addition, analysis of data collected by BUEs will be compared with data collected by FSIS management employees during the Fall 2013 Project. Finally, the methodology should be properly documented in order for FSIS to have the most accurate data of the time it takes to perform the task in order for FSIS management to determine staffing and assignment of the work. In addition, the methodology to determine the indirect multiplier must be clearly defined so that FSIS can utilize the methodology for other samplings.
4.3 Evaluation of PHIS Data Fields In the initial scope discussion meeting with the sponsor, the George Mason project team suggested that the PHIS data could be carefully analyzed in order to update the system to incorporate indirect tasks instead of using an indirect multiplier. The sponsor anticipated that with such a large level of effort required to analyze the system and a large portion of its data, the task would be a new semester project in the future. However, the sponsor did request that the Spring 2014 Project team take an initial look at the available data fields and determine

7
whether it would be an advantageous and worthwhile task to undertake. FSIS shall be able to collect the required data for the project team within two weeks and it is anticipated that during the data collection period for the task described in section 4.2, the GMU project team will analyze the available data fields.
4.4Incremental Study Due to the nature of this project and FSIS continuing work with George Mason, the Spring 2014 Project will be the continuation of the prior Fall 2014 Project’s work. Likewise, the Spring 2014 project work may set the stage for future projects. As such, it is imperative that the process and data collected is precise and well documented so it can be easily transferred to subsequent projects.
5.0 Preliminary Requirements
For this project, there are several requirements that will be presented to the sponsor:
Create a formal data collection process detailing how to conduct the time study to be performed by the inspectors. This will include the DCS with suggested updates, the instructions to the inspectors regarding how to fill the sheets out, and which plants to target.
Provide a preliminary analysis of PHIS data and report of any recommendations for future work within PHIS analysis.
Document any improvements to the N60 sampling program encountered while analyzing the data and after an on-site visit.
Provide a methodology for deriving the indirect multiplier that can be used by FSIS in order to repeat this process on other sampling techniques.
6.0 Solution Development
6.1 Statistical Analysis for DCS The Fall 2013 project team’s statistical analysis included Analysis of Variance (ANOVA) and t-tests. ANOVA determines if there are any systematic differences between subsets of the data. This will be used to determine if the average time to perform the tasks is different between the total data and the data subsets. The subsets of data will be broken out based on the five factors from the previous project team, but will also be expanded to include the different plant sizes based on FSIS guidelines (by employee size). Meanwhile the t-test determines if one data set is statistically different from another. This project will continue to use the same statistical analysis in order to compare the two data sets appropriately, but will not be limited to those statistical analyses in case a more appropriate way becomes apparent.
6.2 PHIS Data Analysis
As a secondary task, FSIS will provide PHIS data regarding the data entry fields. This data will be analyzed to determine if there is any value added in pursuing the analysis of the PHIS data for future projects. The analysis will also cover if there are any suggestions for including indirect
8
time instead of multipliers or improvements to the system to better calculate the time it takes to perform tasks. The analysis will be done based on the data received, information on the PHIS process, and an on-site visit. This work will provide a foundation on which future projects can build.
7.0 Deliverables
The following items will be provided to FSIS throughout this project:
7.1 Indirect Multiplier Methodology
Document a justifiable, defensible methodology for developing the indirect multiplier. Methodology must be applicable to other inspection tasks.
7.2 Indirect Multiplier Algorithm
If time allows, an algorithm will be provided that calculates the indirect multiplier based upon relevant factors.
7.3 Data Collection Plan
This will be a breakdown of how to conduct the time study to be performed by the inspectors. This will include the data collection sheet, instructions, training, and which plants to target.
7.4 Updated Data Collection Sheets
Based on suggestions from the prior project team’s work and from internal discussions, provide an updated data collection sheet to be completed by the inspectors
7.5Instructions for Data Collection
Based on the new data collection sheets and the feedback from the prior project team’s work, provide newly updated instructions on how to complete the data collection sheet.
7.6 Training for Data Collection
In addition to the instructions provided, this study will include training as well for how the data sheets should be filled out. This training will provide better direction for the inspectors on top of the instruction form.
7.7 N60 Task Improvements
Provide any suggestions for the N60 process based on observations from the data collection process and/or from the on-site visit. These suggestions are intended to help the process run more efficiently and timely.
7.8 PHIS Preliminary Analysis
Provide preliminary analysis of the PHIS system for data mining. Start the analysis of the PHIS data to determine whether there is any value added in future work being done on the analysis of PHIS.

9
7.9 Final Project Report
The final report will include:
Problem statement
Results of the IPP data collection process
Analysis of the IPP data collection, comparison of the analysis with IPP to that of management’s results
Proposed methodology for the indirect multiplier or subsequent recommendations for how to proceed with the work measurement study
Preliminary analysis of PHIS data
8.0 Risks
8.1 Delays to Receive Information
There is a risk that the plant personnel taking logging measurements will not get data sheets back to George Mason prior to the requested delivery date.
Likelihood: 2 Impact: 4
To mitigate this risk, George Mason will begin to compile data sheets as they are received and will setup data analysis sheets to be easily manipulated with an addition of data late in the schedule.
8.2 Furlough / Government Shutdown
There is a risk that the Government will go under a shutdown due to funding or will implement a furlough of employees. During that time, no FSIS Federal employee can interact with the team.
Likelihood: 1 Impact: 4
If the Government is shut down or furloughed, the team will adjust the weekly schedule to conduct work with the sponsor when they are on-duty and conduct internal work only during furlough days.
8.3 Incomplete/Incorrect Data Sheets
There is a risk that data sheets may be returned with missing or incorrectly entered data. If this occurs, the data sheet cannot be used for the data analysis.
Likelihood: 3 Impact: 3
Since this risk was observed as an issue during the Fall 2013 Project, FSIS will train personnel on how to fill out the sheets to prevent a large number of unusable sheets.
8.4 Availability of Data from Small and Very Small Plants
There is a risk that not enough data sheets will be collected from small and very small processing plants in order to produce statistically significant analysis.
Likelihood: 2

10
Impact: 3 The FSIS is requesting data from a larger number of plants anticipating this risk. If enough data is not collected, analysis will be completed with the understanding that additional data will be needed for a future project team to ensure statistical significance.

11
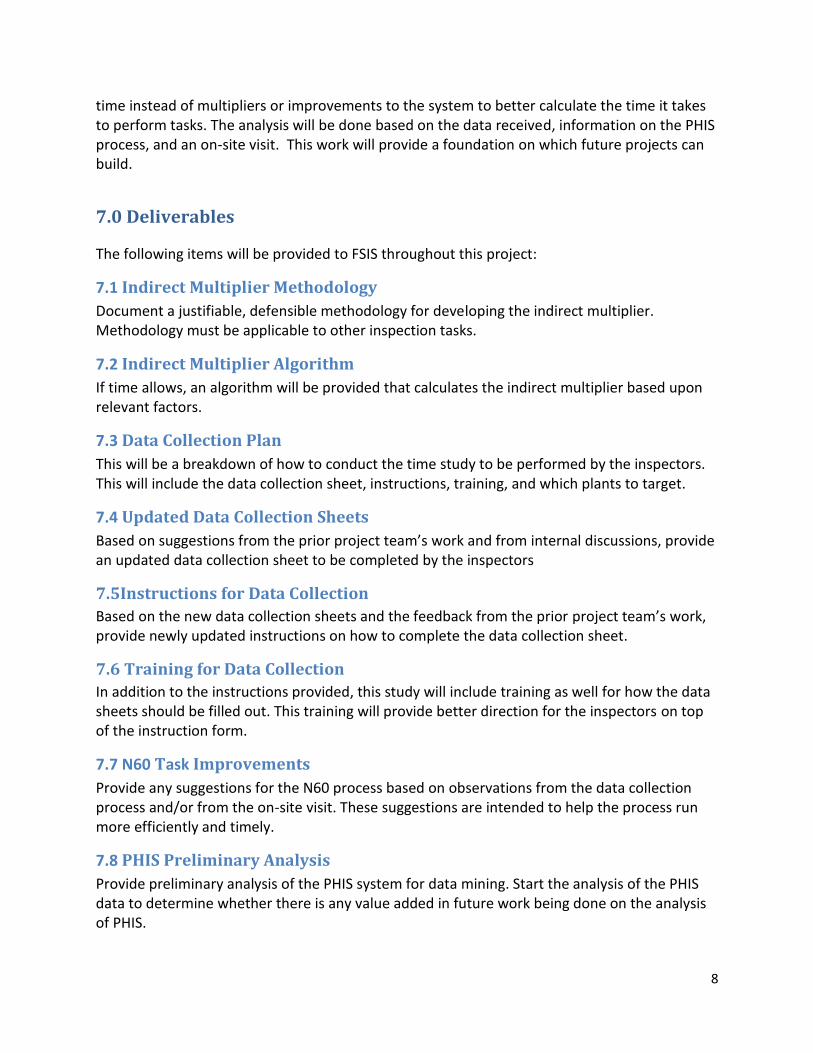
9.0 Project Schedule

12
13

14
10.0 References 1. Bang, Christopher, Amanda Kryway, Scott Motter, and Karen Tung. MT60 Case Study -
Final Report. Rep. George Mason University, 13 Dec. 2013. Web. 2. Fall 2013 MT60 Data Collection Spreadsheet. 13 Dec. 2013. Raw data. George Mason
University, Fairfax, Virginia. 3. N=60 Sampling. Beef Industry Food Safety Council, 2008. CD-ROM. 4. Tan, Regina PhD, The Food Safety and Inspection Service Office of Field Operations
Work Measurements Proposal to George Mason University, January 2014. 5. USDA Food Safety and Inspection Service. N.p., n.d. Web. 2014. www.fsis.usda.gov