Fs Pjt Final
55
By Bharat Vaid (10AC08) – DSP BlackRock D Pradeep (10AC21) – HDFC AMC SNV Pravin(10AC22)- ICICI Prudential R Raja Sugirtha( 10AC23) – Kotak Mahindra AMC K Rajeshwaran( 10AC24) – Canara Robeco
-
Upload
pravin-snv -
Category
Documents
-
view
265 -
download
0
Transcript of Fs Pjt Final

8/4/2019 Fs Pjt Final
http://slidepdf.com/reader/full/fs-pjt-final 1/55
ByBharat Vaid (10AC08) – DSP BlackRock
D Pradeep (10AC21) –
HDFC AMC
SNV Pravin(10AC22)- ICICI Prudential
R Raja Sugirtha(10AC23) – Kotak Mahindra AMC
K Rajeshwaran(10AC24) – Canara
Robeco

8/4/2019 Fs Pjt Final
http://slidepdf.com/reader/full/fs-pjt-final 2/55
HDFC Mutual Funds
- D PRADEEP

8/4/2019 Fs Pjt Final
http://slidepdf.com/reader/full/fs-pjt-final 3/55
Tax Saver Schemes @HDFC AMC
1. HDFC Tax Saver –
**** Zurich India TaxSaver Fund
December 18, 1995
2. HDFC Long Term Advantage - ***
December, 2000
Both Schemes has 2 options:
1. Growth
2. Dividend – offers Dividend payout and
Reinvestment
8/4/2019 Fs Pjt Final
http://slidepdf.com/reader/full/fs-pjt-final 4/55
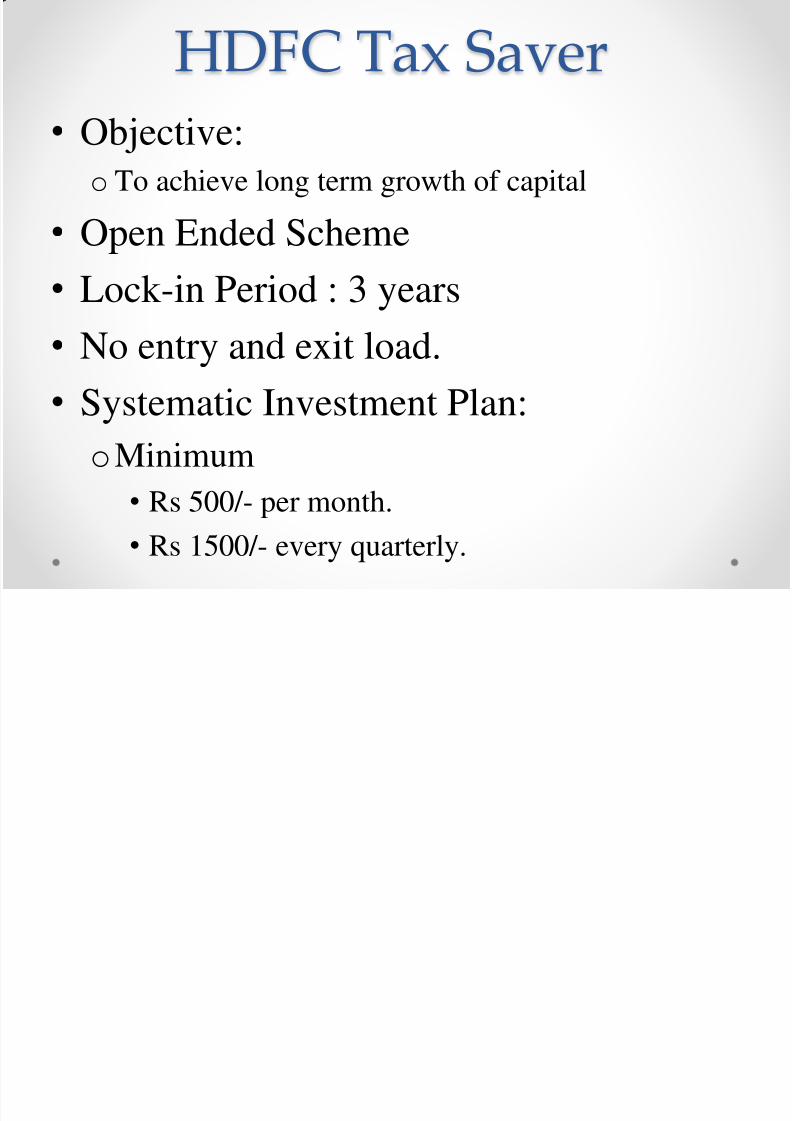
HDFC Tax Saver•
Objective:o To achieve long term growth of capital
• Open Ended Scheme
• Lock-in Period : 3 years
• No entry and exit load.
•
Systematic Investment Plan:oMinimum
• Rs 500/- per month.
•Rs 1500/- every quarterly.

8/4/2019 Fs Pjt Final
http://slidepdf.com/reader/full/fs-pjt-final 5/55
HDFC Tax Saver• Payout – T+3 or T+4 days
• Expense Ratio : 1.85
•
Investment Policy:• Identifying securities which offer superior levels of
yield at low levels of risk .
• Unique in Investment:
oMax in Large caps
o Indian Depository Receipts (IDR) of Standard
Chartered PLC (UK).

8/4/2019 Fs Pjt Final
http://slidepdf.com/reader/full/fs-pjt-final 6/55
Performance
Net Asset Value Rs 213.14
Assets Under Management Rs 3113.95 Crores
Return since Launch 31.71%
Return Grade Above Average
Risk Grade Below Average
Net Asset Value = Rs 54.15
Growth Option
Total Equity & Equity Related Holdings 94.18
Total Money Market Instrument & Other CreditExposures (aggregated holdings in a single issuer)
0.00
Cash, Cash Equivalents and Net Current Assets 5.82
Grand Total 100.00
Portfolio
Dividend Option

8/4/2019 Fs Pjt Final
http://slidepdf.com/reader/full/fs-pjt-final 7/55
Sector-wise Asset HoldingsSectors % Net Assets
Financial
13.38
Energy 11.43
HealthCare 11.39
FMCG 9.60
Technology 8.84
Engineering 6.09
Communication 4.14
Services 3.94
Automobile 3.64
Metals 3.19
Diversified 2.62
Chemicals 1.24
Construction 1.21
Others 19.29
8/4/2019 Fs Pjt Final
http://slidepdf.com/reader/full/fs-pjt-final 8/55
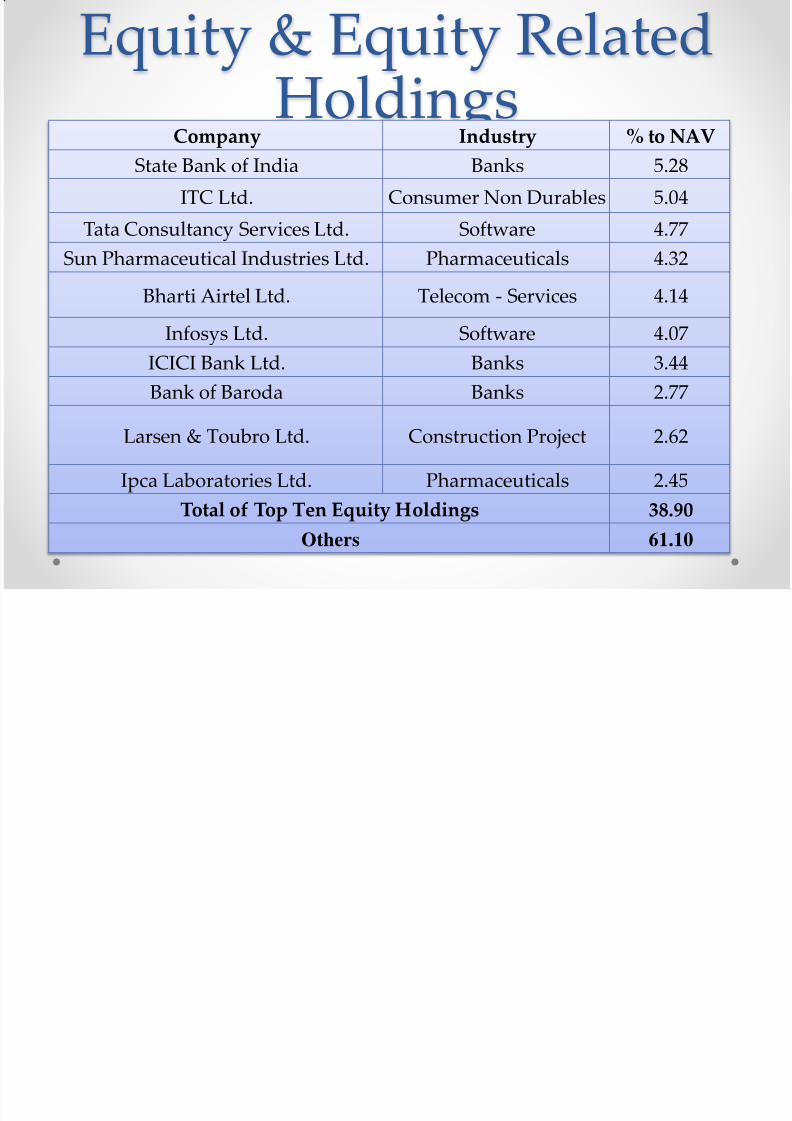
Equity & Equity RelatedHoldings
Company Industry % to NAVState Bank of India Banks 5.28
ITC Ltd. Consumer Non Durables 5.04
Tata Consultancy Services Ltd. Software 4.77
Sun Pharmaceutical Industries Ltd. Pharmaceuticals 4.32
Bharti Airtel Ltd. Telecom - Services 4.14
Infosys Ltd. Software 4.07
ICICI Bank Ltd. Banks 3.44
Bank of Baroda Banks 2.77
Larsen & Toubro Ltd. Construction Project 2.62
Ipca Laboratories Ltd. Pharmaceuticals 2.45
Total of Top Ten Equity Holdings 38.90
Others 61.10
8/4/2019 Fs Pjt Final
http://slidepdf.com/reader/full/fs-pjt-final 9/55
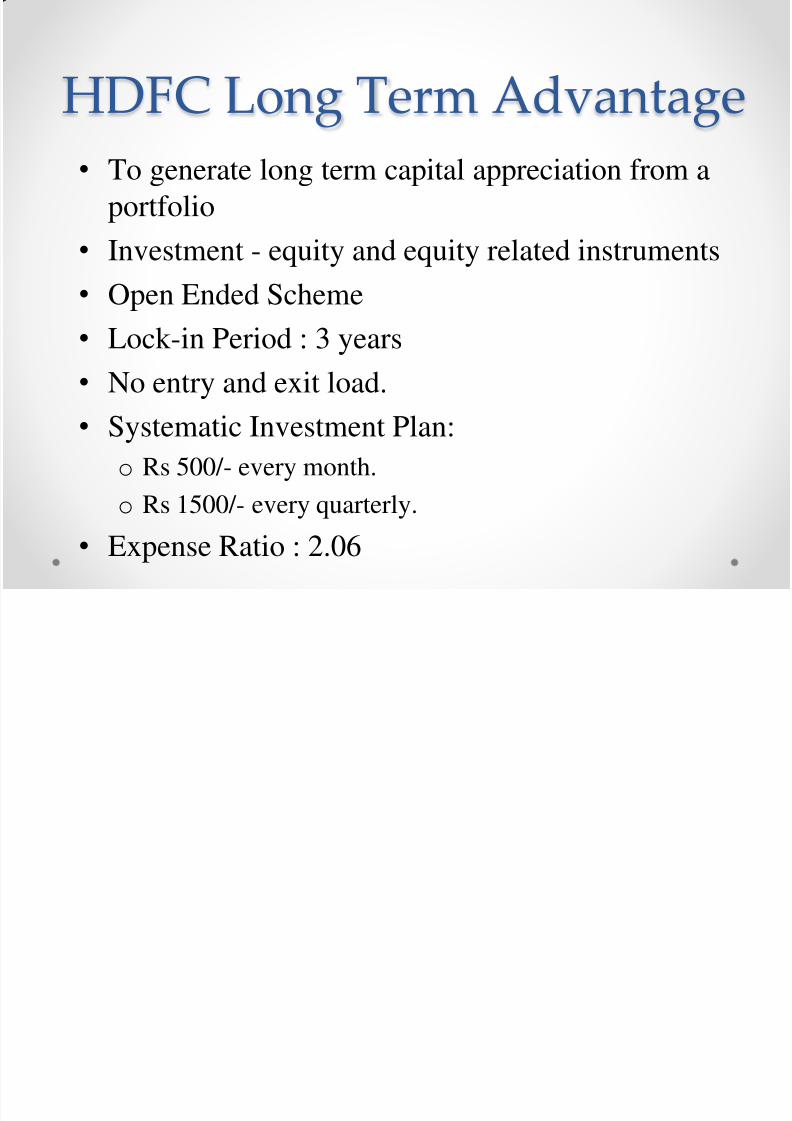
HDFC Long Term Advantage
• To generate long term capital appreciation from a
portfolio
• Investment - equity and equity related instruments
• Open Ended Scheme
• Lock-in Period : 3 years
• No entry and exit load.
• Systematic Investment Plan:
o Rs 500/- every month.
o Rs 1500/- every quarterly.
•Expense Ratio : 2.06
8/4/2019 Fs Pjt Final
http://slidepdf.com/reader/full/fs-pjt-final 10/55
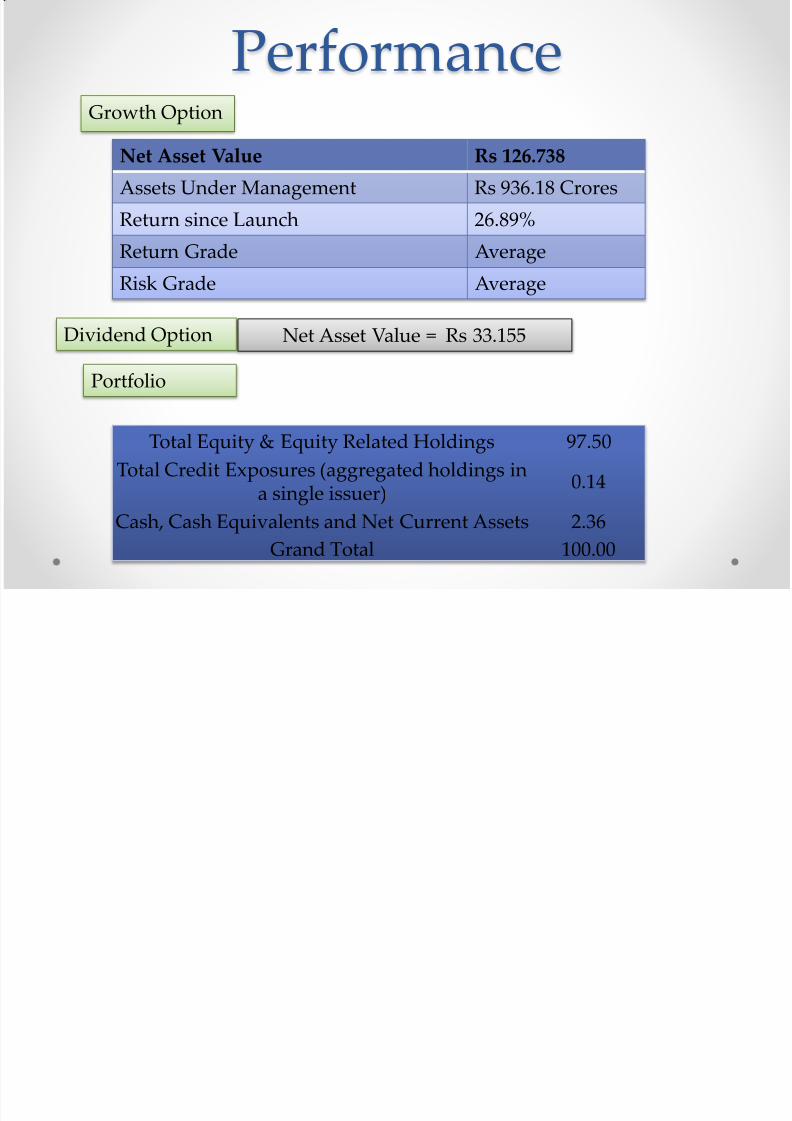
Performance
Net Asset Value Rs 126.738
Assets Under Management Rs 936.18 Crores
Return since Launch 26.89%
Return Grade Average
Risk Grade Average
Net Asset Value = Rs 33.155
Growth Option
Portfolio
Total Equity & Equity Related Holdings 97.50
Total Credit Exposures (aggregated holdings ina single issuer)
0.14
Cash, Cash Equivalents and Net Current Assets 2.36
Grand Total 100.00
Dividend Option
8/4/2019 Fs Pjt Final
http://slidepdf.com/reader/full/fs-pjt-final 11/55
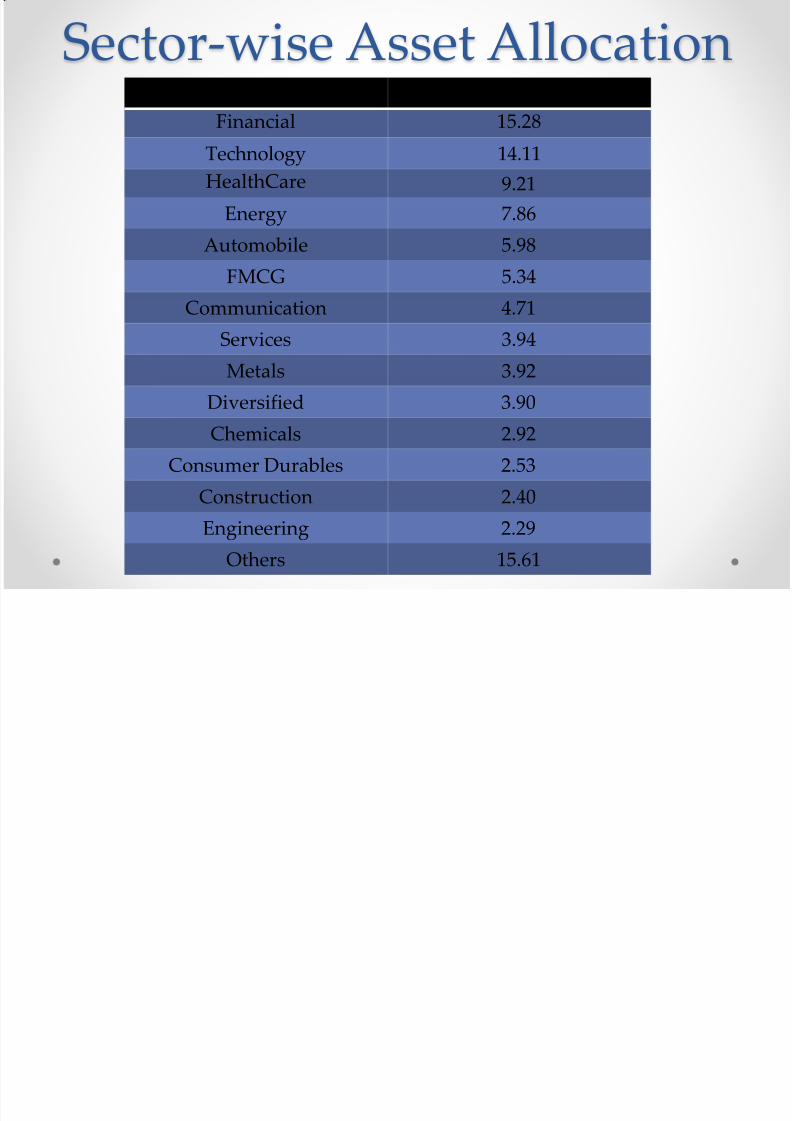
Sector-wise Asset AllocationSectors % Net Assets
Financial 15.28 Technology 14.11
HealthCare 9.21 Energy 7.86
Automobile 5.98
FMCG 5.34Communication 4.71
Services 3.94
Metals 3.92
Diversified 3.90
Chemicals 2.92
Consumer Durables 2.53
Construction 2.40
Engineering 2.29
Others 15.61

8/4/2019 Fs Pjt Final
http://slidepdf.com/reader/full/fs-pjt-final 12/55
Equity & Equity Related HoldingsCompany Industry % to NAV
Tata Consultancy Services Ltd. Software 7.71
ICICI Bank Ltd. Banks 7.26Infosys Ltd. Software 6.40
Reliance Industries Ltd. Petroleum Products 5.17State Bank of India Banks 5.05Bharti Airtel Ltd. Telecom - Services 4.71
Carborundum Universal Ltd. Industrial Products 3.92Balkrishna Industries Ltd. Auto Ancillaries 3.92
Larsen & Toubro Ltd. Construction Project 3.90
Ipca Laboratories Ltd. Pharmaceuticals 3.44
Total of Top Ten Equity Holdings 51.48
Others 48.52

8/4/2019 Fs Pjt Final
http://slidepdf.com/reader/full/fs-pjt-final 13/55
Investment Pattern• HDFC Tax Saver:
• HDFC Long Term Advantage:
Asset Portfolio Risk
Equity & Equity RelatedInstruments
Minimum80%
Medium toHigh
Debt Instruments & MoneyMarket Securities
Maximum20%
Low toMedium
Asset Portfolio Risk
Equity & Equity RelatedInstruments
80% Medium toHigh
Debt Instruments & MoneyMarket Securities
20% Low toMedium
8/4/2019 Fs Pjt Final
http://slidepdf.com/reader/full/fs-pjt-final 14/55
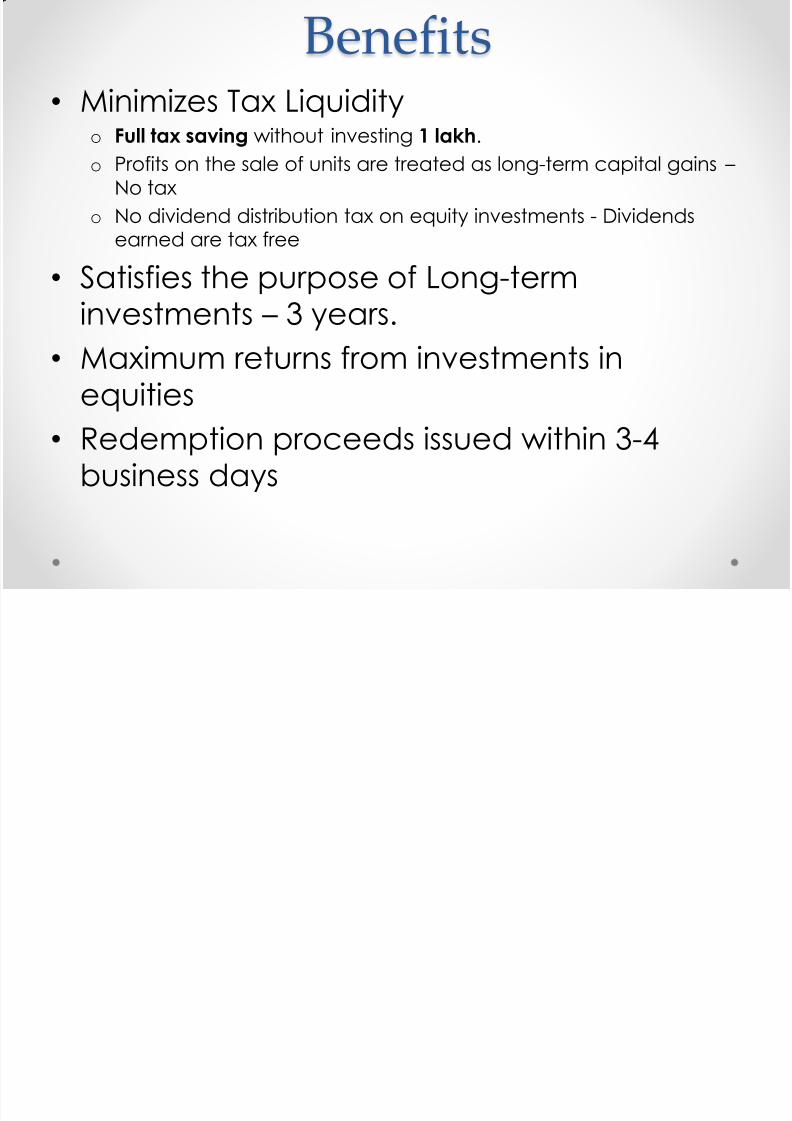
Benefits• Minimizes Tax Liquidity
o Full tax saving without investing 1 lakh.o Profits on the sale of units are treated as long-term capital gains –
No tax
o No dividend distribution tax on equity investments - Dividendsearned are tax free
• Satisfies the purpose of Long-terminvestments – 3 years.
• Maximum returns from investments in
equities
• Redemption proceeds issued within 3-4
business days

8/4/2019 Fs Pjt Final
http://slidepdf.com/reader/full/fs-pjt-final 15/55
Benefits•
Transparency –
NAV, AUM, Entire portfolio• Convenience – Purchase or sell the funds directly or
indirectly – STP & SWAP
• Flexibility
•
Consistency in dividend –
dividend rate >50%• Liquidity – Redeem after 3 years• Fund manager builds the portfolio for the long-term
: 3-year lock-in period
oGreater flexibility to make investment decisionsoNo worries about everyday redemptions.

8/4/2019 Fs Pjt Final
http://slidepdf.com/reader/full/fs-pjt-final 16/55
Competitive Advantage• AUM for HDFC Tax saver is higher than others• Expense ratio is good
• %Return Since launch is high
• Risk is less
• Growth in NAV is higher than others.
• Risk adjusted performance is higher than othersexcept Canara
• Profits are high.

8/4/2019 Fs Pjt Final
http://slidepdf.com/reader/full/fs-pjt-final 17/55
DSP BlackRock
- BHARAT VAID

8/4/2019 Fs Pjt Final
http://slidepdf.com/reader/full/fs-pjt-final 18/55
DSP Blackrock Tax SaverFund• DSP Blackrock Tax Saver Fund
Launched – Dec 2006
•
Optionsa. Growth
b. Dividend – Payout – Reinvestment
• Rating - ***
8/4/2019 Fs Pjt Final
http://slidepdf.com/reader/full/fs-pjt-final 19/55
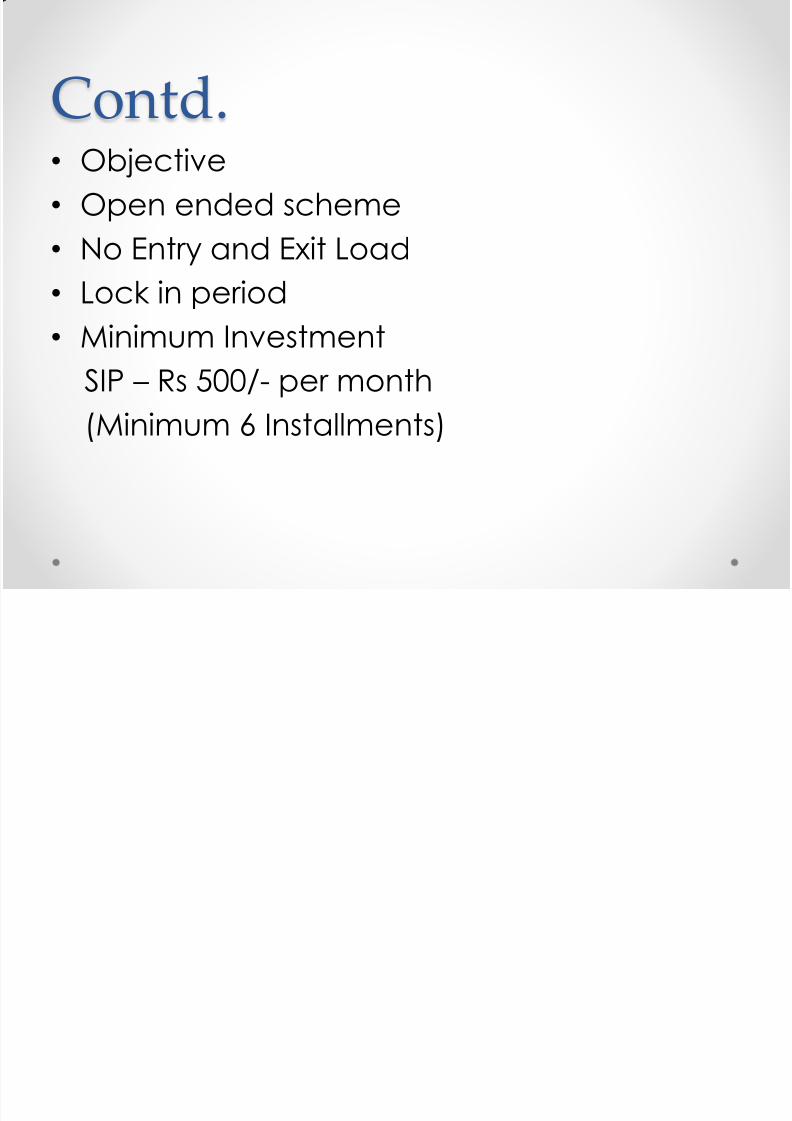
Contd.• Objective
• Open ended scheme
• No Entry and Exit Load
• Lock in period
• Minimum Investment
SIP – Rs 500/- per month
(Minimum 6 Installments)
8/4/2019 Fs Pjt Final
http://slidepdf.com/reader/full/fs-pjt-final 20/55
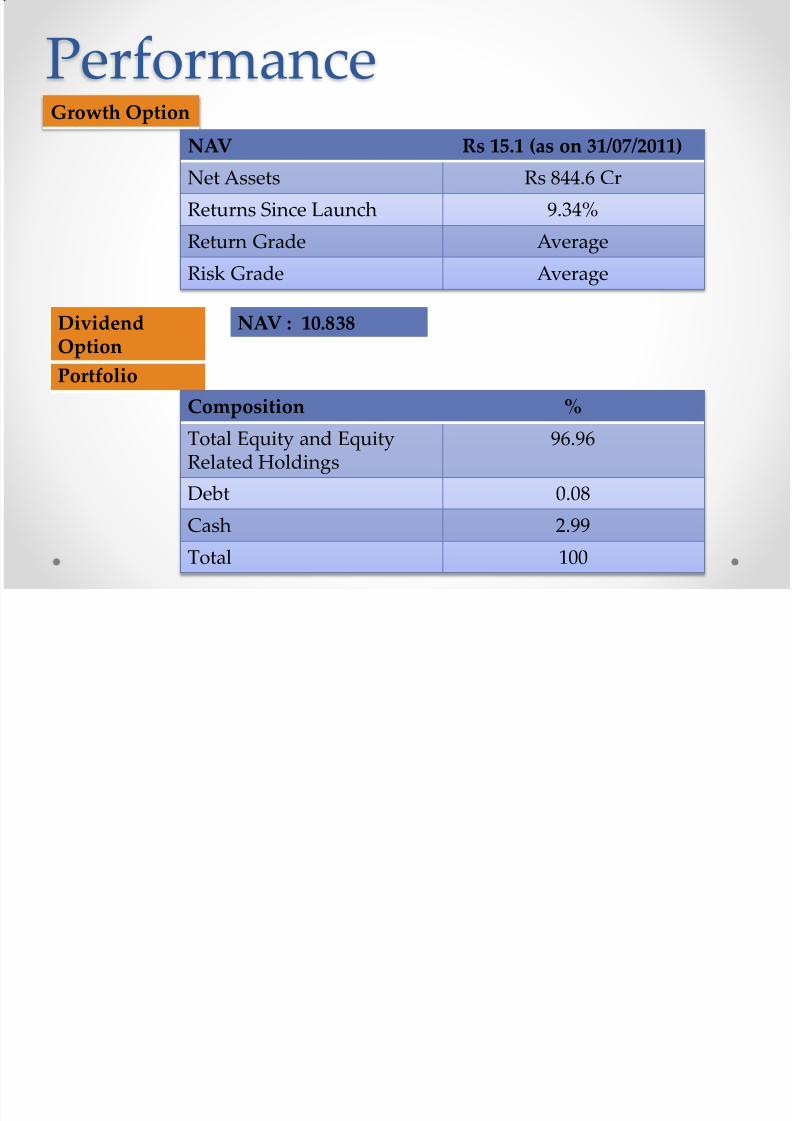
PerformanceGrowth Option
NAV Rs 15.1 (as on 31/07/2011)
Net Assets Rs 844.6 Cr
Returns Since Launch 9.34%
Return Grade Average
Risk Grade Average
Portfolio
Composition %Total Equity and EquityRelated Holdings
96.96
Debt 0.08
Cash 2.99
Total 100
DividendOption
NAV : 10.838
8/4/2019 Fs Pjt Final
http://slidepdf.com/reader/full/fs-pjt-final 21/55
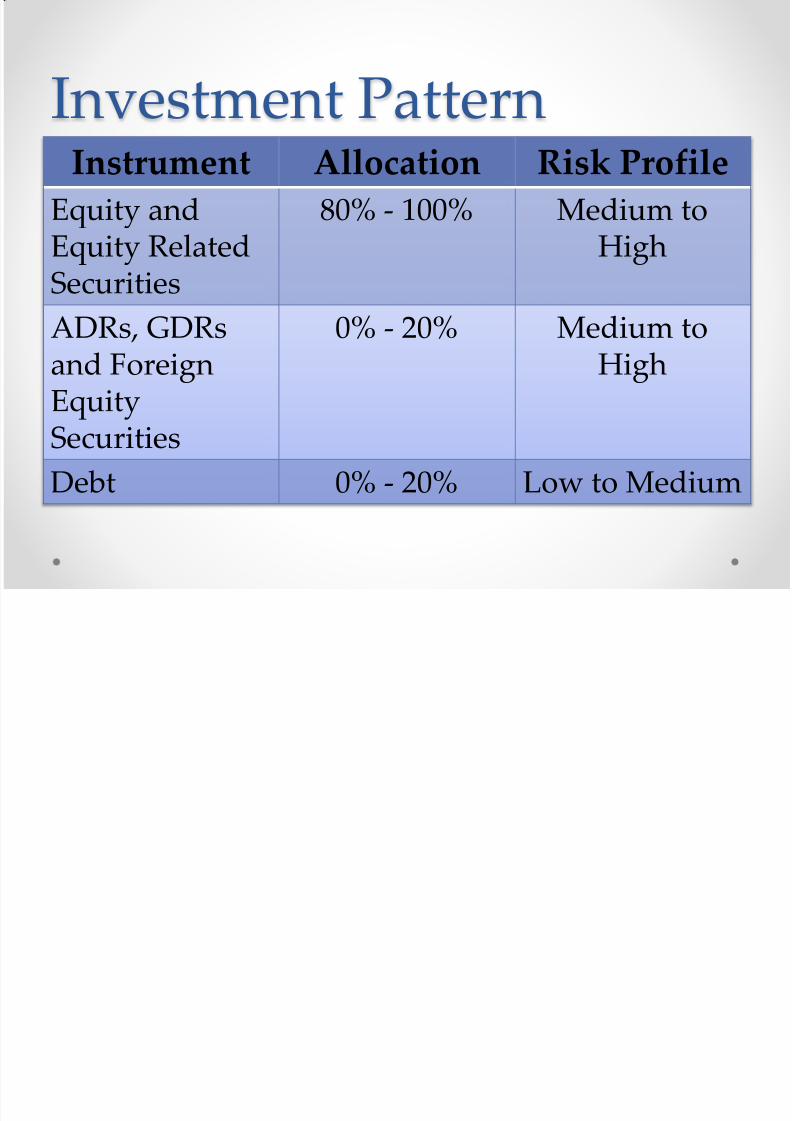
Investment PatternInstrument Allocation Risk Profile
Equity andEquity Related
Securities
80% - 100% Medium toHigh
ADRs, GDRsand Foreign
EquitySecurities
0% - 20% Medium toHigh
Debt 0% - 20% Low to Medium
A All i S

8/4/2019 Fs Pjt Final
http://slidepdf.com/reader/full/fs-pjt-final 22/55
Asset Allocation – SectorWise
E i d E i R l d
8/4/2019 Fs Pjt Final
http://slidepdf.com/reader/full/fs-pjt-final 23/55
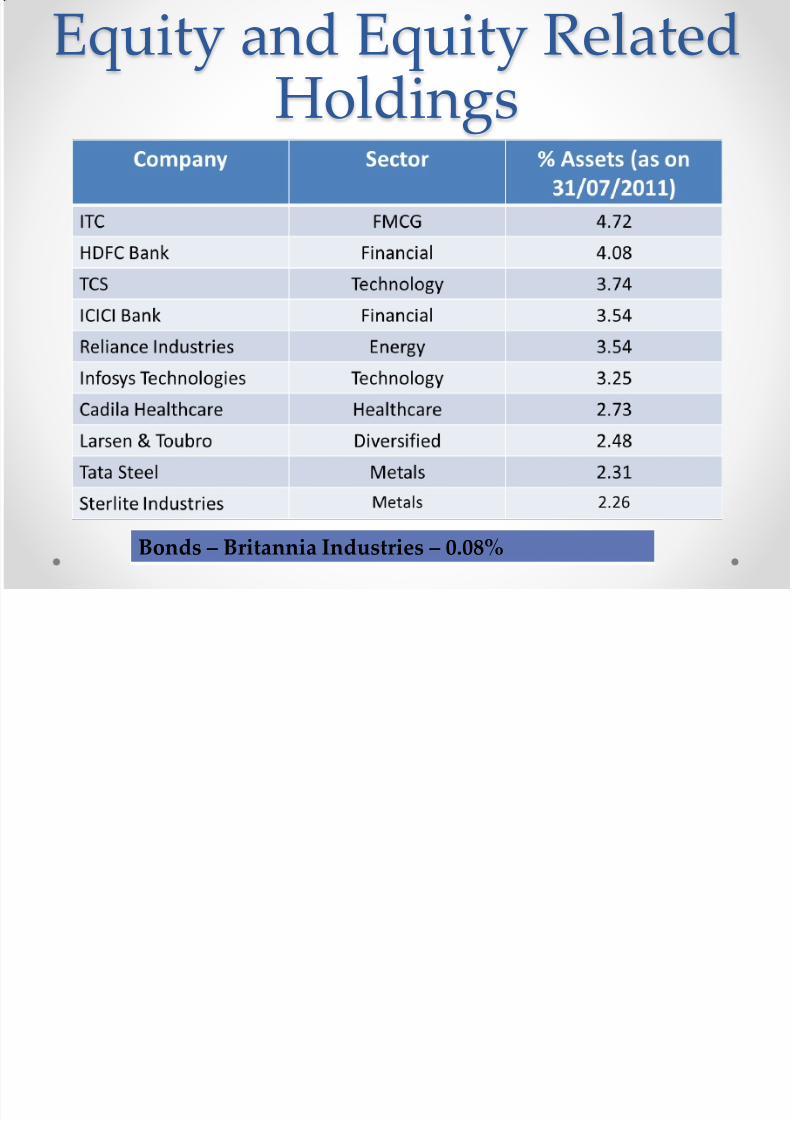
Equity and Equity RelatedHoldings
Bonds–
Britannia Industries–
0.08%

8/4/2019 Fs Pjt Final
http://slidepdf.com/reader/full/fs-pjt-final 24/55
Benefits• Tax Liquidity
• Liquidity – Redeem after 3 years
• Transparency – NAV, AUM, Entire portfolio
• Convenience – Purchase or sell the funds directly or indirectly
• Flexibility- Client & Fund Manager
• Purpose of Long-term investments is satisfied.
• Competitive Advantage:
• % Return is higher than Kotak
• Expense Ratio is lower than Canera &Kotak
• AUM is higher than Canera and Kotak
• Risk is less than kotak

8/4/2019 Fs Pjt Final
http://slidepdf.com/reader/full/fs-pjt-final 25/55
CANARA ROBECO
- K RAJESHWARAN
C R b E i T
8/4/2019 Fs Pjt Final
http://slidepdf.com/reader/full/fs-pjt-final 26/55
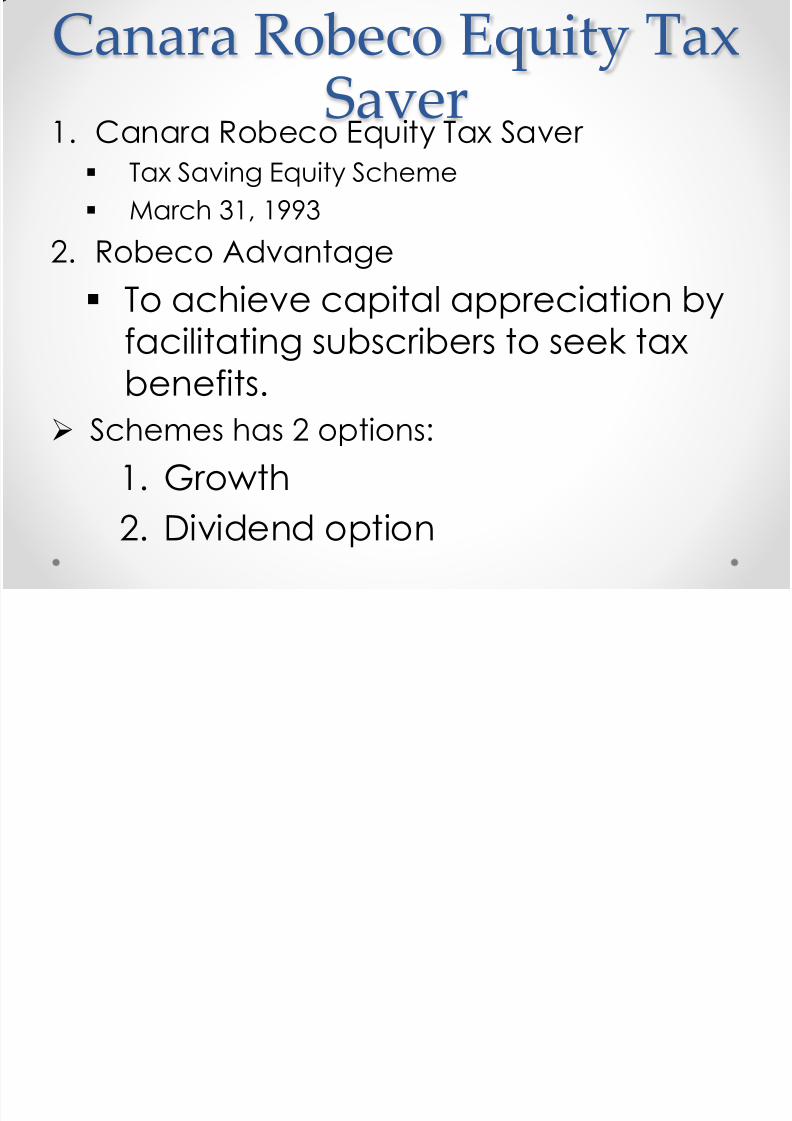
Canara Robeco Equity TaxSaver
1. Canara Robeco Equity Tax Saver Tax Saving Equity Scheme
March 31, 1993
2. Robeco Advantage
To achieve capital appreciation byfacilitating subscribers to seek taxbenefits.
Schemes has 2 options:
1. Growth
2. Dividend option
C R b E i T

8/4/2019 Fs Pjt Final
http://slidepdf.com/reader/full/fs-pjt-final 27/55
Canara Robeco Equity TaxSaver
• To achieve long term growth of capital
• Open Ended Scheme
•
Lock-in Period : 3 years• Lump sum Investment Plan
• Systematic investment plan
• Systematic transfer plan

8/4/2019 Fs Pjt Final
http://slidepdf.com/reader/full/fs-pjt-final 28/55
PerformanceGrowth Option
Net asset value Rs 24.86
Net assets 289.79
Returns since launch 15.10
Return grade High
Risk grade Belowaverage
Total Equity & Equity Related Holdings 93.13
Total Money Market Instrument & Other CreditExposures (aggregated holdings in a single issuer)
0.00
Cash, Cash Equivalents and Net Current Assets 6.87
Grand Total 100.00
Portfolio
Dividend option NAV – 17.43

8/4/2019 Fs Pjt Final
http://slidepdf.com/reader/full/fs-pjt-final 29/55
Equity & Equity Related Holdings
Company Sector Returns to nav
Bharti Airtel Telecommunications 7.08
HDFC Bank Financial 5.61
Infosys Technologies Software 4.45
ICICI Bank Financial 3.52
ITC Fmcg 3.49
BHEL Energy 3.11
State Bank of India Financial 2.42
Ipca Laboratories Diversified 2.38
Tata ConsultancyServices Software 2.31
Power Grid Corp. Energy 2.2
Total pf top ten holdings 36.57
8/4/2019 Fs Pjt Final
http://slidepdf.com/reader/full/fs-pjt-final 30/55
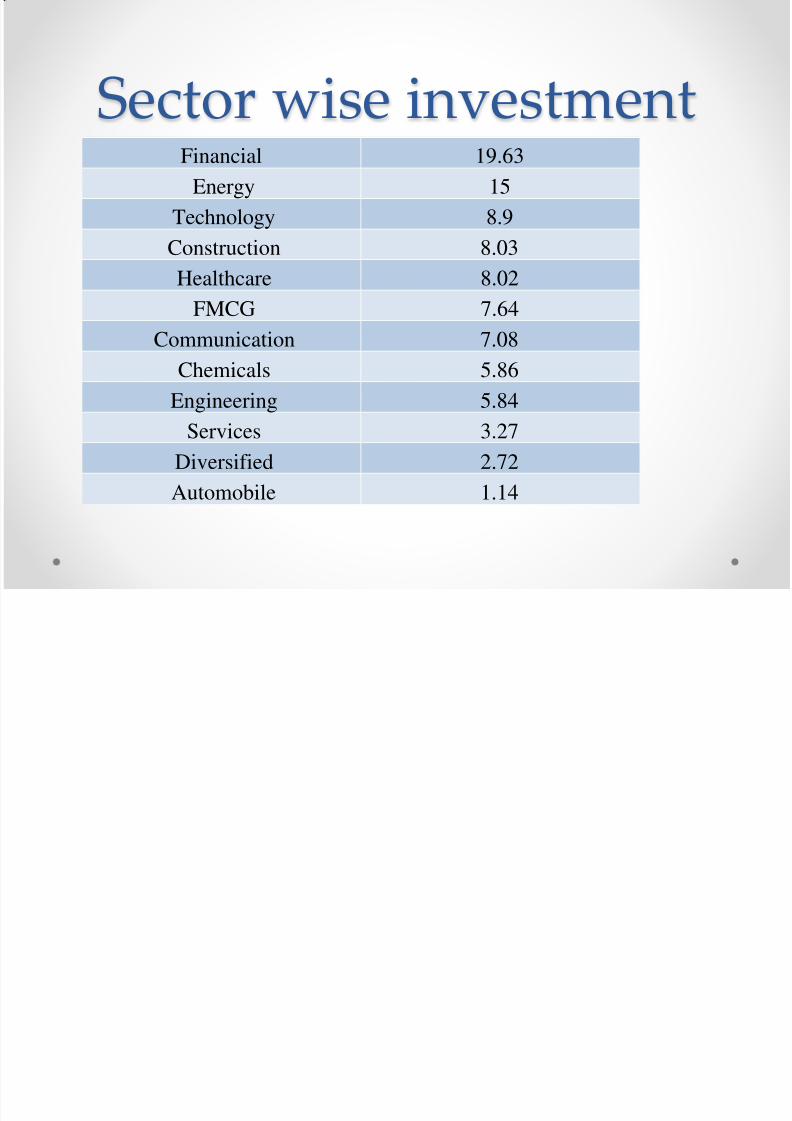
Sector wise investmentFinancial 19.63
Energy 15
Technology 8.9
Construction 8.03
Healthcare 8.02FMCG 7.64
Communication 7.08
Chemicals 5.86
Engineering 5.84
Services 3.27
Diversified 2.72
Automobile 1.14

8/4/2019 Fs Pjt Final
http://slidepdf.com/reader/full/fs-pjt-final 31/55
Benefits•
Tax Liquidity• Transparency – NAV, AUM, Entire portfolio
• Convenience – Purchase or sell the funds directly or indirectly
•
Flexibility- Client & Fund Manager • Liquidity – Redeem after 3 years
• Purpose of Long-term investments is satisfied
• Competitive Advantage:
• Risk is less and Return is high.
• Risk Adjusted performance is better
• % Returns are consistent
• Return Indicator(Alpha) is better than others.
8/4/2019 Fs Pjt Final
http://slidepdf.com/reader/full/fs-pjt-final 32/55
Kotak Mahindra AssetManagement Company
- R RAJA SUGIRTHA
8/4/2019 Fs Pjt Final
http://slidepdf.com/reader/full/fs-pjt-final 33/55
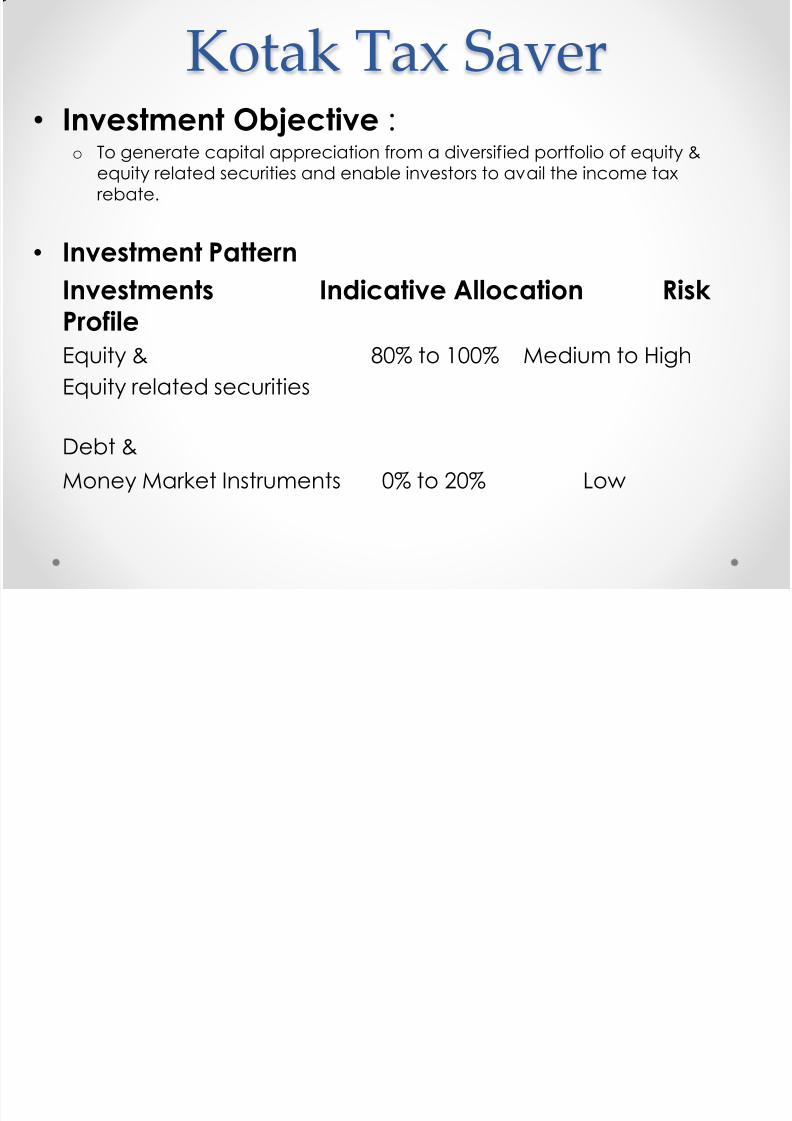
Kotak Tax Saver• Investment Objective :
o To generate capital appreciation from a diversified portfolio of equity &
equity related securities and enable investors to avail the income tax
rebate.
• Investment Pattern
Investments Indicative Allocation Risk Profile
Equity & 80% to 100% Medium to High
Equity related securities
Debt &
Money Market Instruments 0% to 20% Low
8/4/2019 Fs Pjt Final
http://slidepdf.com/reader/full/fs-pjt-final 34/55
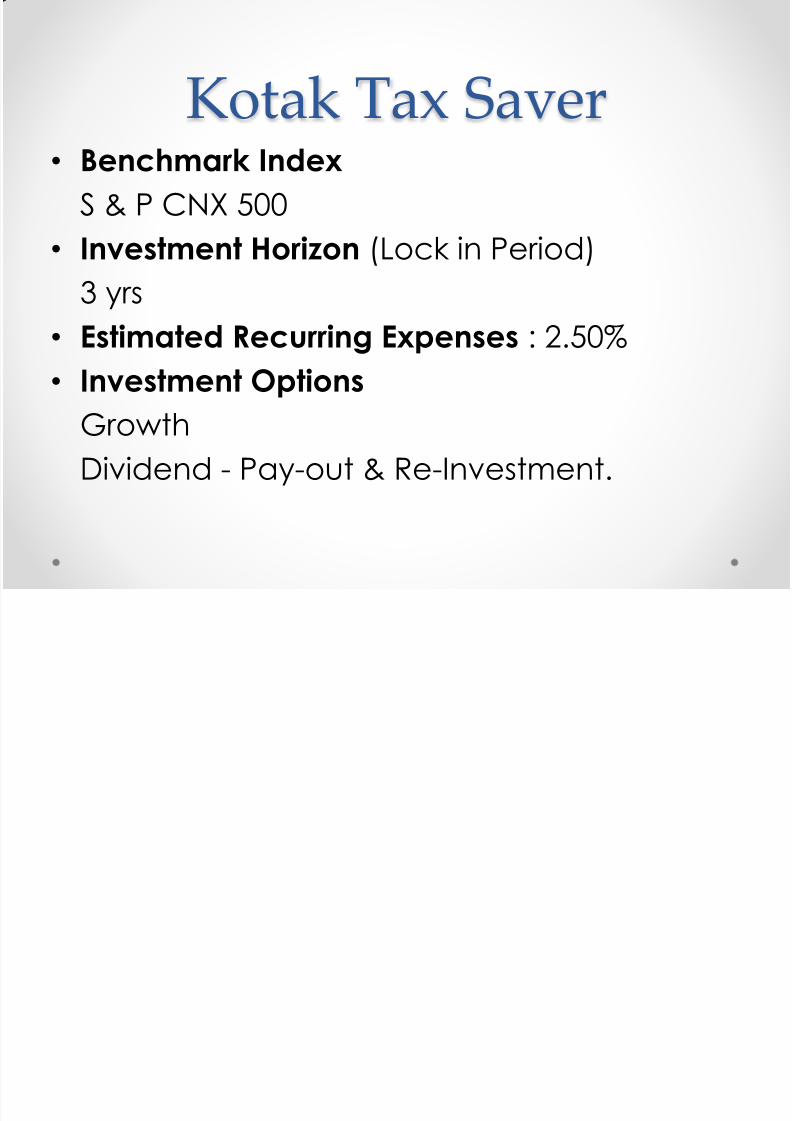
Kotak Tax Saver• Benchmark Index
S & P CNX 500
• Investment Horizon (Lock in Period)
3 yrs
• Estimated Recurring Expenses : 2.50%
• Investment Options
Growth
Dividend - Pay-out & Re-Investment.

8/4/2019 Fs Pjt Final
http://slidepdf.com/reader/full/fs-pjt-final 35/55
Kotak Tax Saver
• Minimum Investment
Initial : Rs 500 and in mulitiples of 500..Additional: Rs 500 and in mulitiples of 500.
Systematic: Rs 500 and in mulitiples of 500. • Minimum Redemption Size
Rs. 1000/- or 100 units
• Payout Schedule
o Transaction day + 3 working days
• Entry Load Nil • Exit Load Nil
8/4/2019 Fs Pjt Final
http://slidepdf.com/reader/full/fs-pjt-final 36/55
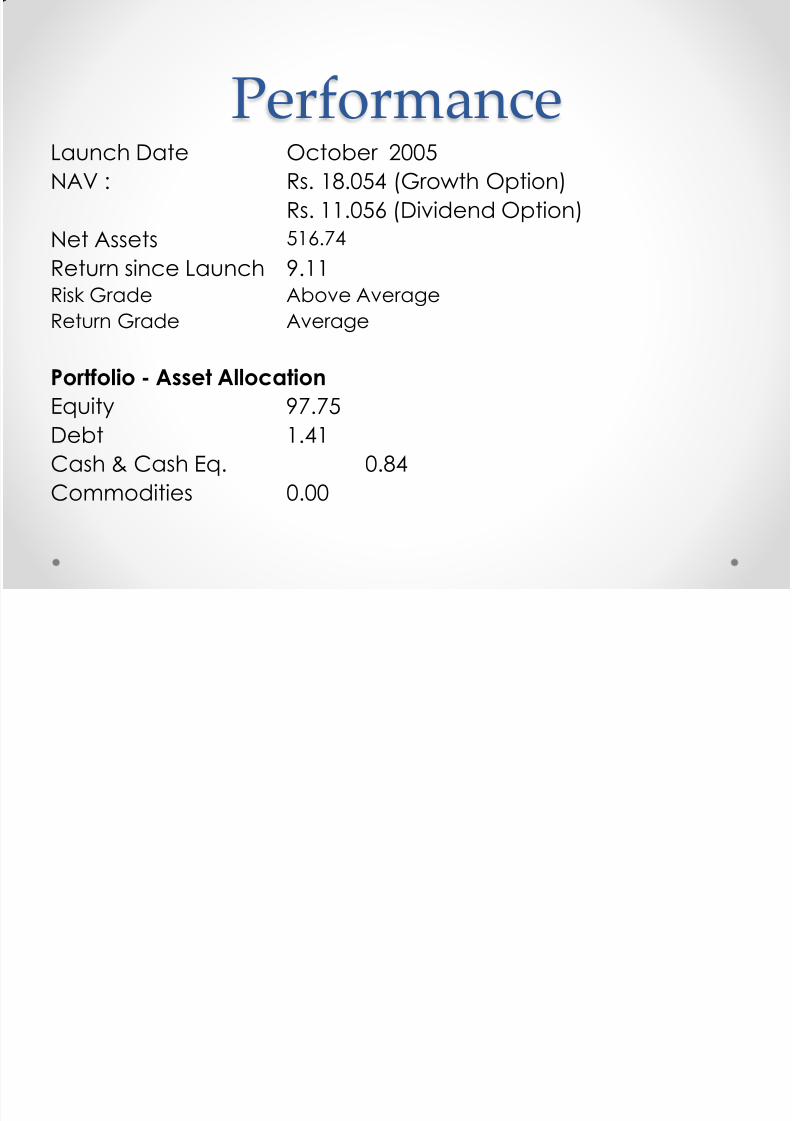
PerformanceLaunch Date October 2005
NAV : Rs. 18.054 (Growth Option)
Rs. 11.056 (Dividend Option)
Net Assets 516.74
Return since Launch 9.11Risk Grade Above Average
Return Grade Average
Portfolio - Asset Allocation
Equity 97.75
Debt 1.41
Cash & Cash Eq. 0.84
Commodities 0.00
8/4/2019 Fs Pjt Final
http://slidepdf.com/reader/full/fs-pjt-final 37/55
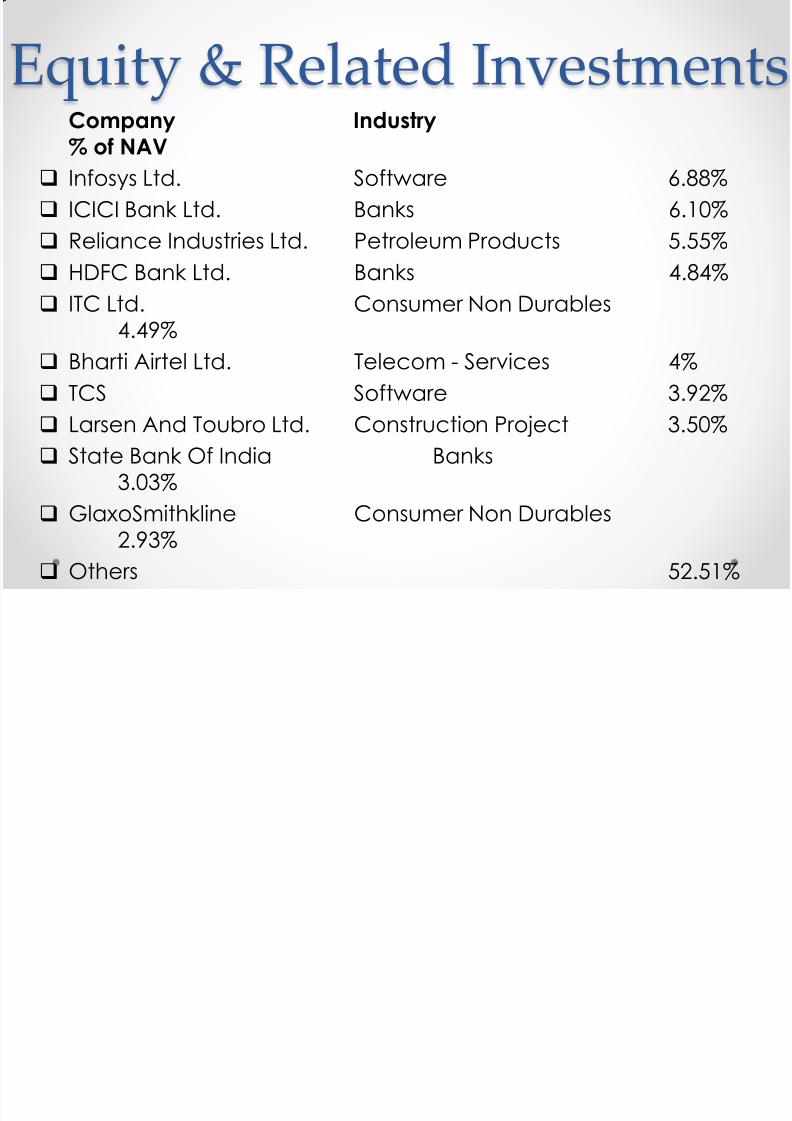
Equity & Related InvestmentsCompany Industry
% of NAV Infosys Ltd. Software 6.88%
ICICI Bank Ltd. Banks 6.10%
Reliance Industries Ltd. Petroleum Products 5.55%
HDFC Bank Ltd. Banks 4.84%
ITC Ltd. Consumer Non Durables4.49%
Bharti Airtel Ltd. Telecom - Services 4%
TCS Software 3.92%
Larsen And Toubro Ltd. Construction Project 3.50%
State Bank Of India Banks3.03%
GlaxoSmithkline Consumer Non Durables2.93%
Others 52.51%
8/4/2019 Fs Pjt Final
http://slidepdf.com/reader/full/fs-pjt-final 38/55
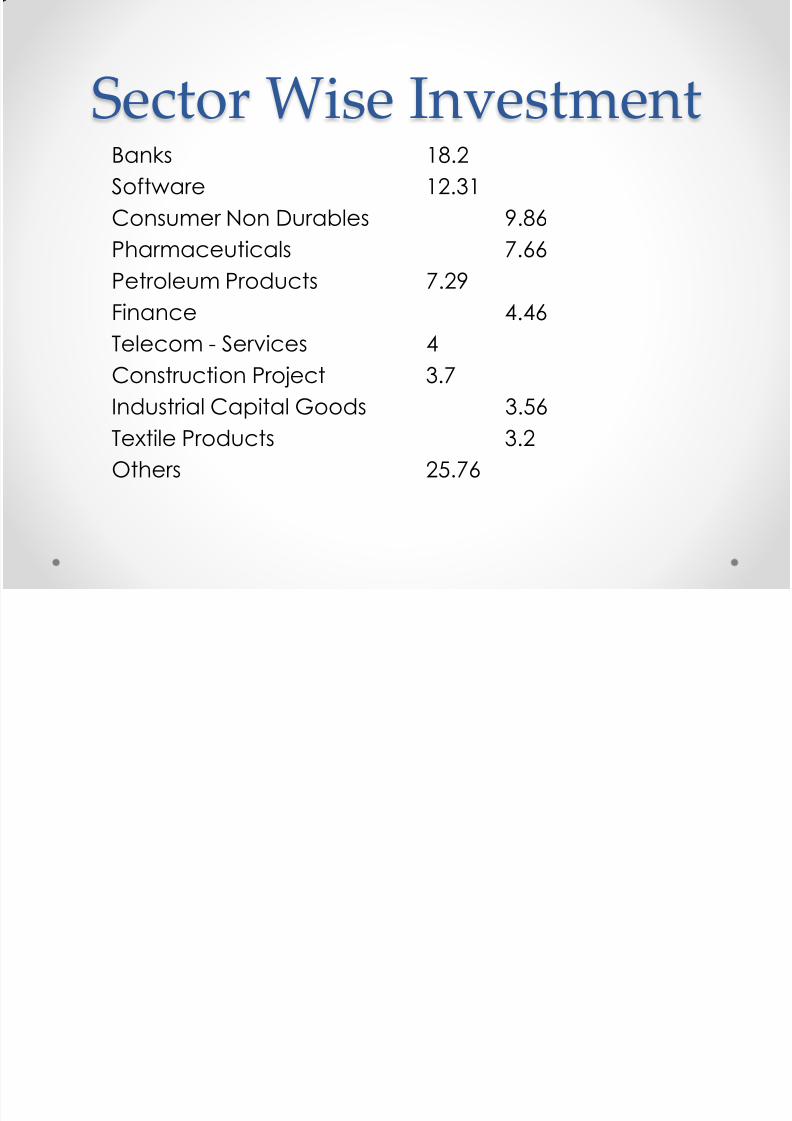
Sector Wise InvestmentBanks 18.2
Software 12.31
Consumer Non Durables 9.86
Pharmaceuticals 7.66
Petroleum Products 7.29Finance 4.46
Telecom - Services 4
Construction Project 3.7
Industrial Capital Goods 3.56
Textile Products 3.2
Others 25.76

8/4/2019 Fs Pjt Final
http://slidepdf.com/reader/full/fs-pjt-final 39/55
Benefits• Tax Liquidity
• Liquidity – Redeem after 3 years
• Transparency – NAV, AUM, Entire portfolio
• Convenience – Purchase or sell the funds directly or
indirectly• Flexibility- Client & Fund Manager
• Purpose of Long-term investments is satisfied
• Competitive Advantage:
• Expense Ratio is lower than Canara Robeco
• Growth in NAV is better than DSPBR and Canara

8/4/2019 Fs Pjt Final
http://slidepdf.com/reader/full/fs-pjt-final 40/55
- SNV PRAVIN
h

8/4/2019 Fs Pjt Final
http://slidepdf.com/reader/full/fs-pjt-final 41/55
Tax savers scheme at
ICICI Prudential Launch date- August 1999
Type- Open Ended Scheme
Lock in period- 3 years
Two Options – 1.Growth
2.Dividend
AUM – 1,323.19crores
Tax savers scheme at

8/4/2019 Fs Pjt Final
http://slidepdf.com/reader/full/fs-pjt-final 42/55
Investment objective-To generate regular returns by investingin a portfolio of fixed income securities/
debt instruments which mature on or before the date of maturity of the plan
Initial Investment – Rs 500
Additional investment – Rs 500
Tax savers scheme atICICI Prudential
8/4/2019 Fs Pjt Final
http://slidepdf.com/reader/full/fs-pjt-final 43/55
Performance
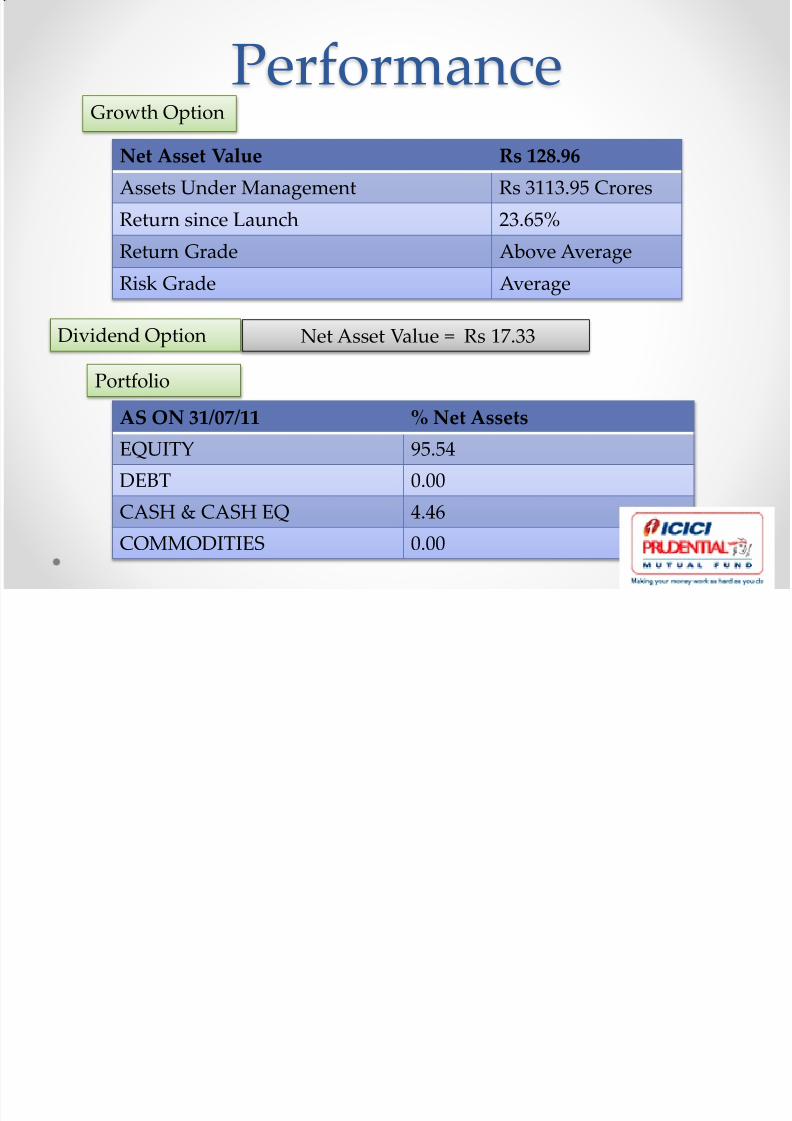
Net Asset Value Rs 128.96
Assets Under Management Rs 3113.95 Crores
Return since Launch 23.65%
Return Grade Above Average
Risk Grade Average
Growth Option
Net Asset Value = Rs 17.33
Portfolio
Dividend Option
AS ON 31/07/11 % Net AssetsEQUITY 95.54
DEBT 0.00
CASH & CASH EQ 4.46
COMMODITIES 0.00

8/4/2019 Fs Pjt Final
http://slidepdf.com/reader/full/fs-pjt-final 44/55
Sector wise Asset HoldingsEnergy 17.73 Financial 17.16 Technology 11.2 Healthcare 9.35 Engineering 9.12 Metals 7.96 Automobile 6.95 Communication 3.2 Services 1.96 FMCG 1.95 Construction 1.93 Diversified 1.35 Textiles 1.05
Equity & Equity Related Holdings
8/4/2019 Fs Pjt Final
http://slidepdf.com/reader/full/fs-pjt-final 45/55
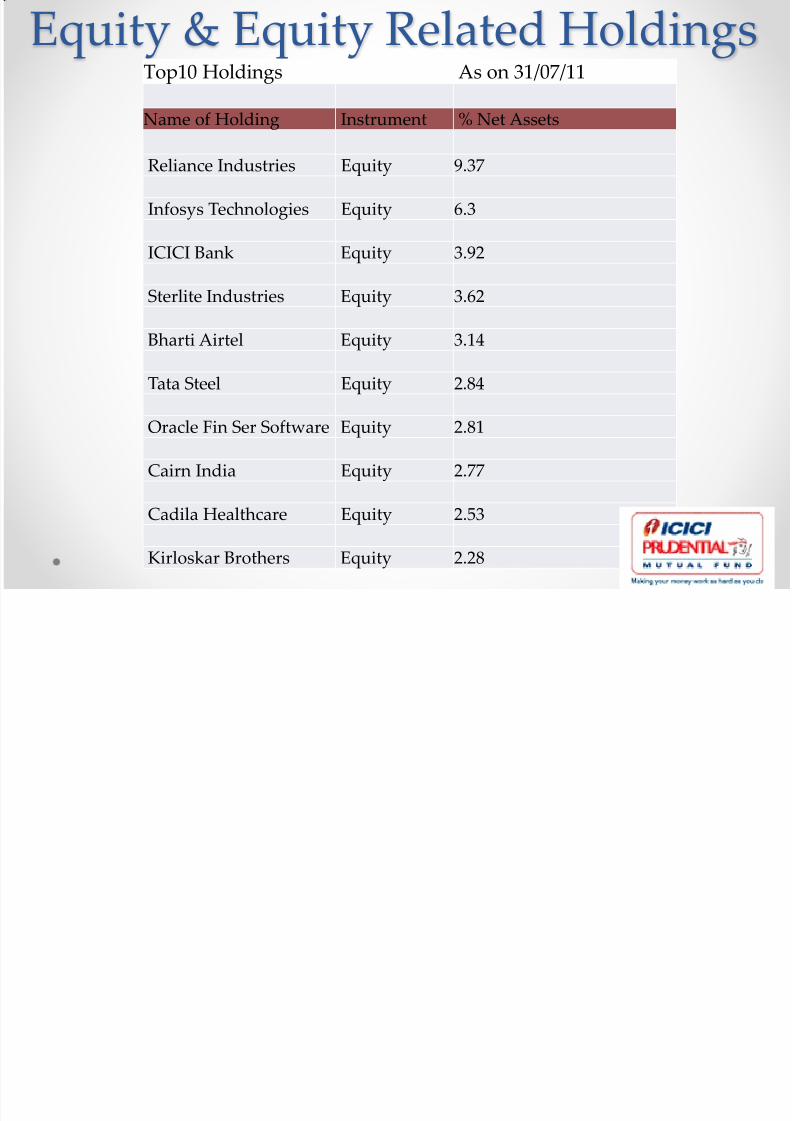
Equity & Equity Related HoldingsTop10 Holdings As on 31/07/11
Name of Holding Instrument % Net Assets Reliance Industries Equity 9.37 Infosys Technologies Equity 6.3 ICICI Bank Equity 3.92 Sterlite Industries Equity 3.62 Bharti Airtel Equity 3.14 Tata Steel Equity 2.84 Oracle Fin Ser Software Equity 2.81 Cairn India Equity 2.77 Cadila Healthcare Equity 2.53 Kirloskar Brothers Equity 2.28
8/4/2019 Fs Pjt Final
http://slidepdf.com/reader/full/fs-pjt-final 46/55
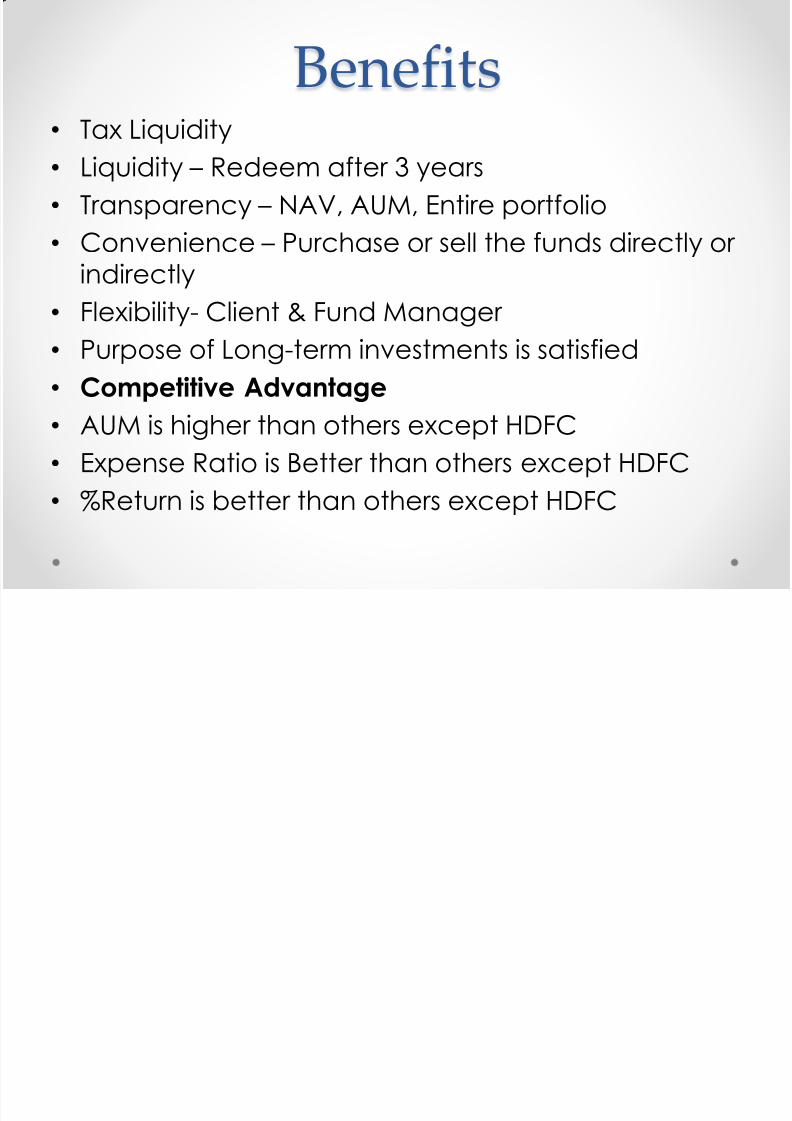
Benefits• Tax Liquidity
• Liquidity – Redeem after 3 years
• Transparency – NAV, AUM, Entire portfolio
• Convenience – Purchase or sell the funds directly or
indirectly• Flexibility- Client & Fund Manager
• Purpose of Long-term investments is satisfied
• Competitive Advantage
• AUM is higher than others except HDFC• Expense Ratio is Better than others except HDFC
• %Return is better than others except HDFC

8/4/2019 Fs Pjt Final
http://slidepdf.com/reader/full/fs-pjt-final 47/55
ANALYSIS&
COMPARISON
1 Assets Under Management
8/4/2019 Fs Pjt Final
http://slidepdf.com/reader/full/fs-pjt-final 48/55
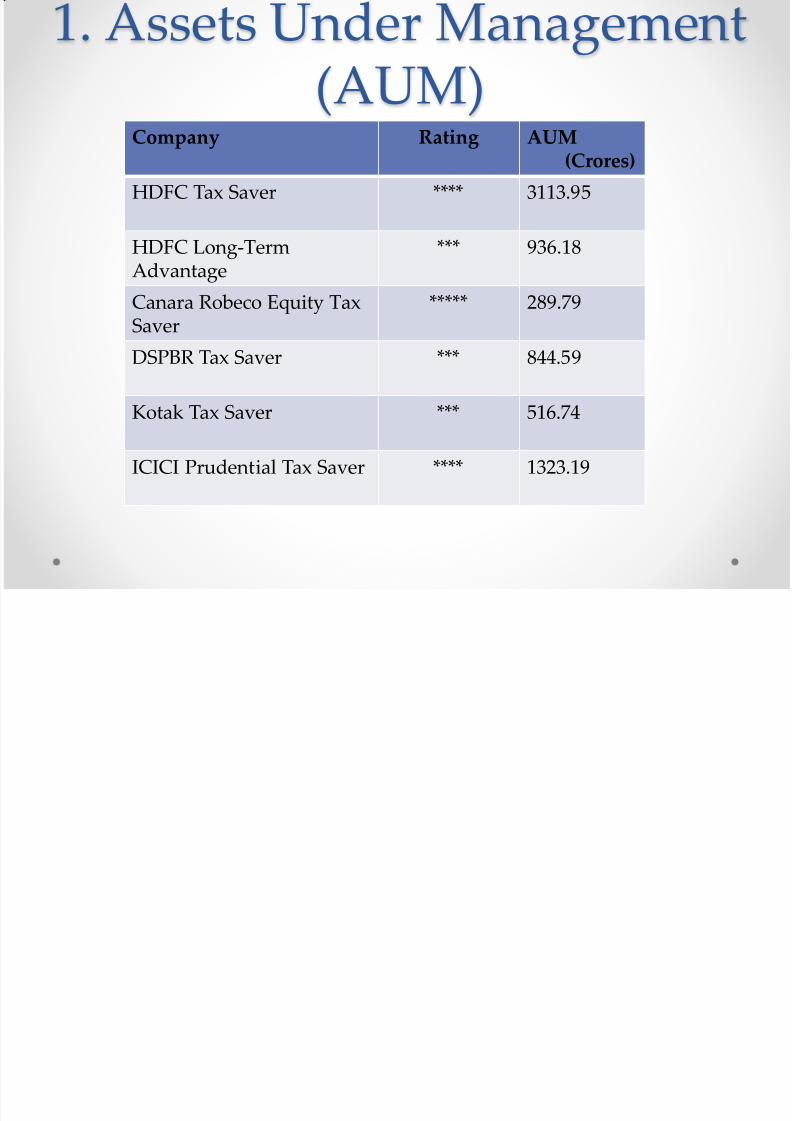
1. Assets Under Management(AUM)
Company Rating AUM(Crores)
HDFC Tax Saver **** 3113.95
HDFC Long-TermAdvantage
*** 936.18
Canara Robeco Equity TaxSaver
***** 289.79
DSPBR Tax Saver *** 844.59
Kotak Tax Saver *** 516.74
ICICI Prudential Tax Saver **** 1323.19
2 % R t
8/4/2019 Fs Pjt Final
http://slidepdf.com/reader/full/fs-pjt-final 49/55
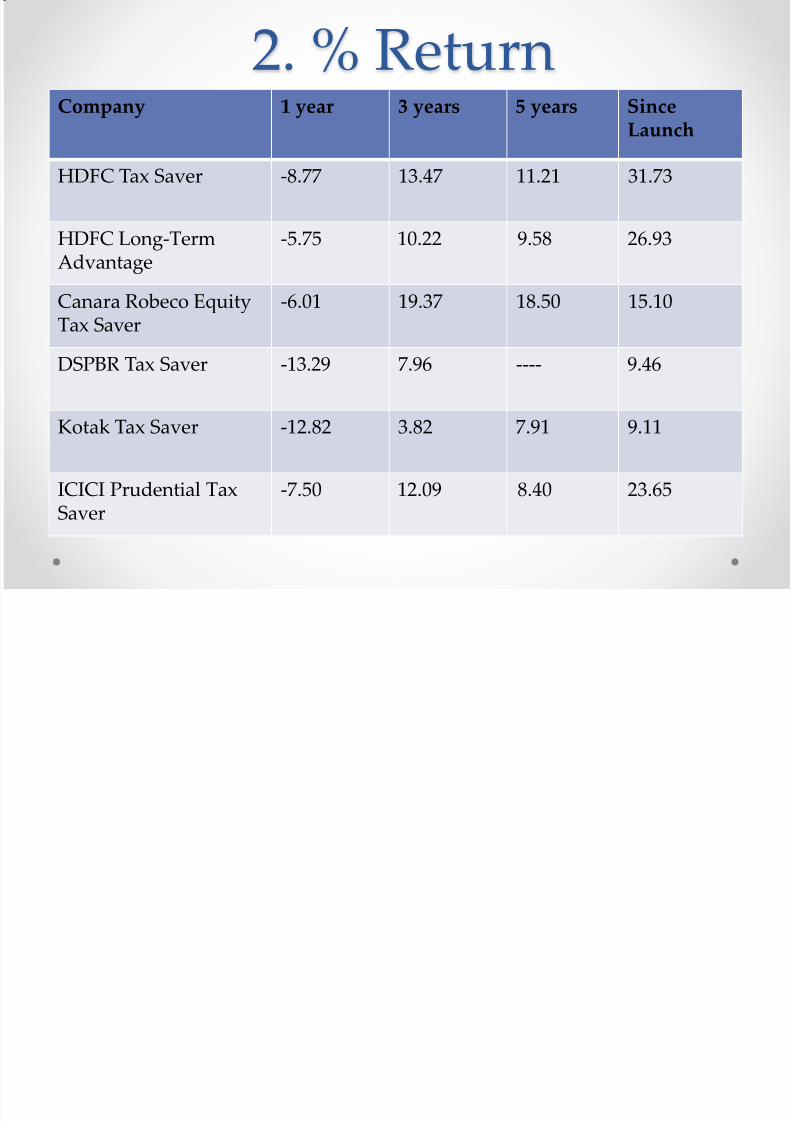
2. % Return
CompanyHDFC
CANARA ROBECO
DSP BlackRock
Kotak AMC
ICICI
Company 1 year 3 years 5 years SinceLaunch
HDFC Tax Saver -8.77 13.47 11.21 31.73
HDFC Long-TermAdvantage
-5.75 10.22 9.58 26.93
Canara Robeco EquityTax Saver
-6.01 19.37 18.50 15.10
DSPBR Tax Saver -13.29 7.96 ---- 9.46
Kotak Tax Saver -12.82 3.82 7.91 9.11
ICICI Prudential TaxSaver
-7.50 12.09 8.40 23.65
k

8/4/2019 Fs Pjt Final
http://slidepdf.com/reader/full/fs-pjt-final 50/55
3. Return & Risk
Company
HDFC Tax Saver
HDFC Long-TermAdvantage
Canara Robeco Equity TaxSaver
DSPBR Tax Saver
Kotak Tax Saver
ICICI Prudential Tax Saver
ICICI Prudential R.I.G.H.T
Company Risk Return SD Beta Sharpe
Ratio
Alpha
HDFC Tax Saver Below Avg AboveAvg
30.10 0.94 0.44 8.89
HDFC Long-Term Advantage
Below Avg Avg 29.80 0.93 0.33 5.53
Canara RobecoEquity TaxSaver
Below Avg High 31.72 0.96 0.58 13.89
DSPBR TaxSaver
Avg Avg 29.54 0.92 0.27 3.40
Kotak Tax Saver Above Avg Avg 32.26 1.01 0.15 - 0.04
ICICI PrudentialTax Saver
Avg AboveAvg
32.52 0.99 0.39 7.76
8/4/2019 Fs Pjt Final
http://slidepdf.com/reader/full/fs-pjt-final 51/55
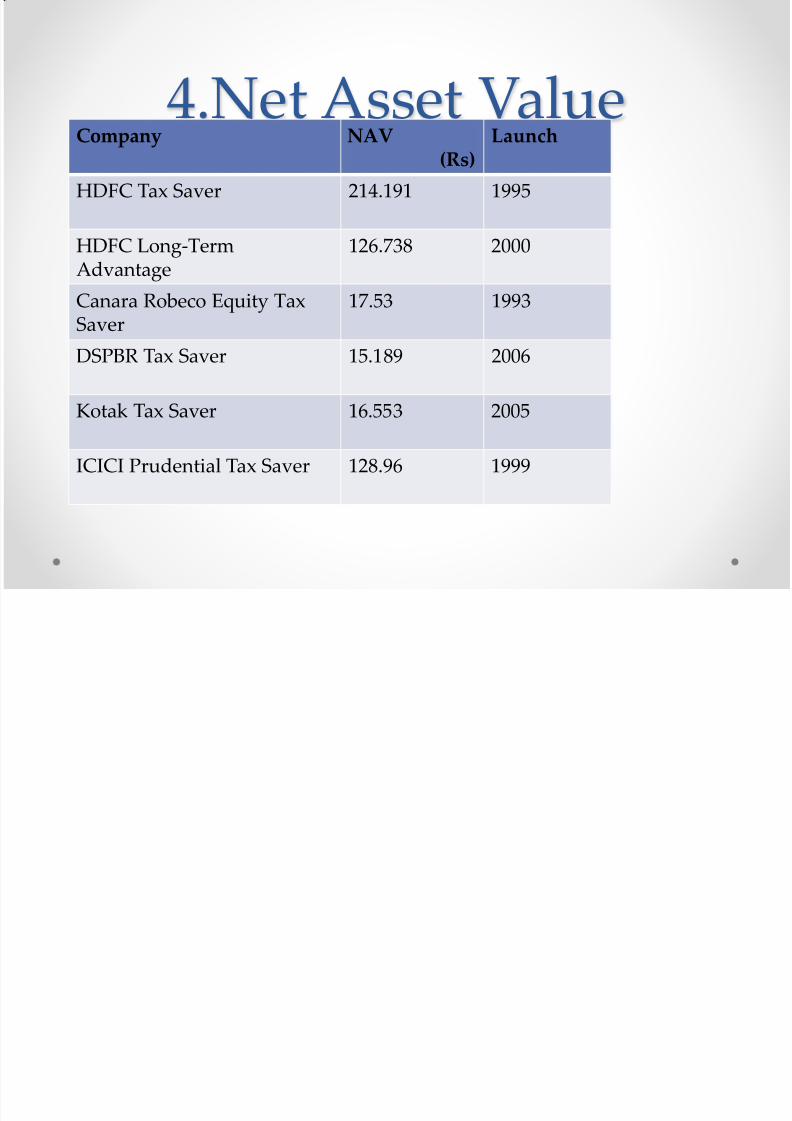
4.Net Asset ValueCompany NAV (Rs) Launch
HDFC Tax Saver 214.191 1995
HDFC Long-TermAdvantage
126.738 2000
Canara Robeco Equity TaxSaver
17.53 1993
DSPBR Tax Saver 15.189 2006
Kotak Tax Saver 16.553 2005
ICICI Prudential Tax Saver 128.96 1999
8/4/2019 Fs Pjt Final
http://slidepdf.com/reader/full/fs-pjt-final 52/55
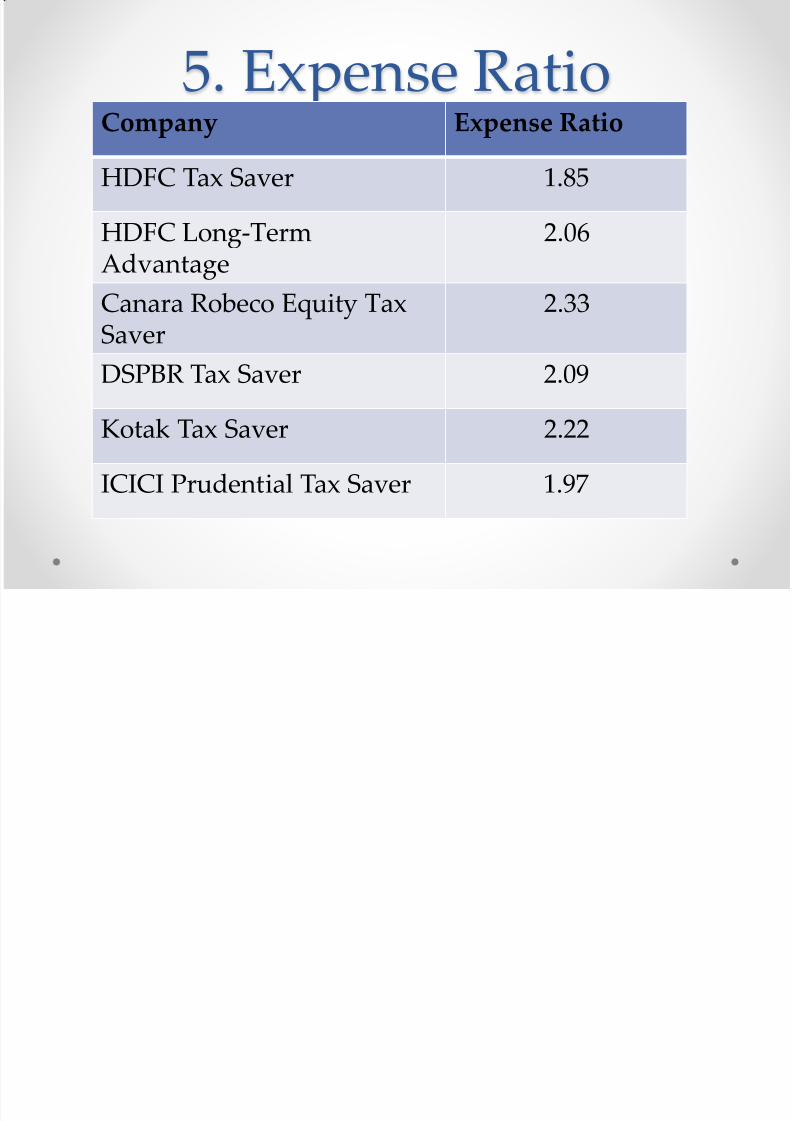
5. Expense RatioCompanyHDFC
CANARA ROBECO
DSP BlackRock
Kotak AMC
ICICI
Company Expense Ratio
HDFC Tax Saver 1.85
HDFC Long-TermAdvantage
2.06
Canara Robeco Equity TaxSaver
2.33
DSPBR Tax Saver 2.09
Kotak Tax Saver 2.22
ICICI Prudential Tax Saver 1.97

8/4/2019 Fs Pjt Final
http://slidepdf.com/reader/full/fs-pjt-final 53/55
Conclusion
1. HDFC Tax Saver
2. HDFC Long-term Advantage
3. Canara Robeco Equity Tax Saver 4. ICICI Prudential Tax Saver
5. DSPBR Tax Saver
6. Kotak Tax Saver
Future of Tax Saver

8/4/2019 Fs Pjt Final
http://slidepdf.com/reader/full/fs-pjt-final 54/55
Future of Tax SaverScheme
• TAX Liability ?

8/4/2019 Fs Pjt Final
http://slidepdf.com/reader/full/fs-pjt-final 55/55