
FS 5 Water web - snelandcare.org.au · The desirable pH range for livestock drinking water is...
4
temperature). Most Monitor farm dams had dissolved oxygen levels that were good or better (> 5.5 mg/L; Tables 2-5). pH The pH of water is a measure of acidity (pH < 7). Water should be neither too acid nor too alkaline (Tables 1-4) to support aquatic life. The desirable pH range for aquatic ecosystem protection on the Northern Tablelands is 6.5-9.0. Water Quality Water Quality Water Quality on New England wool properties on New England wool properties on New England wool properties Introduction During the Land, Water & Wool (LWW) Northern Tablelands Project (NSW), water quality in Monitor farm dams and creeks was measured to establish a baseline for the future. This Fact Sheet reports the results of water chemistry testing, and the diversity of aquatic macro- invertebrates (‘water bugs’) on farms. (See Box for methods.) Water bugs play a central role in aquatic food webs as food for fish and birds. As they are also sensitive to pollution or unnatural fluctuations in the physical and chemical environment, they are commonly used to indicate water quality and departure from natural conditions. Monitor farm dams The 27 farm dams varied from 0.03- 1.92 ha in area of surface water (Table 1). Four larger dams contained islands; one contained 12 islands. Most dam verges were well vegetated with an average of 95% pasture cover and an average of 2.7 tonnes of dry matter per hectare (range, 1.2-6.0 t DM/ha). Bare ground in dam verges varied up to 15%, and tree cover varied up to 20%. The water chemistry of the farm dams was generally good to excellent in terms of stock water quality and ecosystem protection (Tables 1-5). Electrical conductivity Electrical conductivity of water (ECw) is a measure of total dissolved salts and a surrogate for salinity. The ECw of the dam water on LWW Monitor farms varied from 40-721 µS/cm (Table 1), which is good to excellent for livestock (Tables 2, 4 & 5). Stock do not suffer if the ECw of water is less than 1600 µS/cm. Objectives have been set for the maintenance of healthy aquatic systems in the catchments where these dams are located (Table 3). A similar upper threshold for ECw (1500 µs/cm) to livestock is indicated. The water chemistry in farm dams was strongly influenced by parent material (basalt, granite and metamorphosed Land, Water & Wool Land, Water & Wool Land, Water & Wool Northern Tablelands Northern Tablelands Northern Tablelands Project Fact Sheet Project Fact Sheet Project Fact Sheet sediment or ‘trap’). The ECw in basalt dams was significantly higher than dams in granite and trap soils (Fig. 1). However, values did not give cause for concern on livestock health or environmental grounds. Soluble reactive phosphorus Soluble reactive phosphorus (SRP) measures the amount of phosphorus in water for use by plants. Too much phosphorus encourages potentially toxic build-up of blue-green algae, as well as other nuisance algae. Values were generally good to excellent (Tables 1 & 5), with only one-fifth of values exceeding the level (0.05 mg/L) associated with blue-green algae outbreaks (Table 3). However, only one- third of values fell within the threshold (0.015 mg/L) identified as desirable for the conservation of aquatic ecosystems. SRP increased with increasing available phosphorus in the soil surrounding dams and streams. Nitrate-nitrite oxides Oxides of nitrogen (NOx) measure the nitrogen available to plants in the water. High levels can indicate the potential for nuisance growth of green algae as well as pollution from external sources. NOx in Monitor farm dams ranged from 0.001-0.807 mg/L. Almost all values were less than 0.015 mg/L which is excellent for both aquatic ecosystem conservation and stock drinking water (Table 2). Turbidity Turbidity is a measure of the amount of particulate matter and silt suspended in water. High values are generally caused by surface soil and streambank erosion. Values less than 25 NTU are associated with moderate or better water quality for aquatic ecosystem protection. The values for Monitor farms ranged from 3-179 NTU, with most dams registering good or better water clarity (≤ 25 NTU; Table 5). Dissolved oxygen Dissolved oxygen indicates the ability of water to support aquatic animal life. The target for healthy aquatic ecosystems on the Northern Tablelands is 80-90% saturation (generally equivalent to > 6 mg/L at ambient Above, top to bottom—Australasian grebe nest, eggs and chick on Monitor farm dams. Adult grebes deliberately cover their eggs with weed when they leave the nest. Photos—Stuart Green. Figure 1. Electrical conductivity (mean ± s.e.m.) of water in farm dams in different parent materials. Sample sizes: basalt (n = 7), granite (n = 6) and trap (n = 14). 0 50 100 150 200 250 300 350 400 Basalt Granite Trap Electrical conductivity ( μ S/cm) The background, objectives and outcomes of this project are summarised at: www.landwaterwool.gov.au (Product number: PF030479) A technical guide A technical guide A technical guide Land, Water & Wool Land, Water & Wool Land, Water & Wool Northern Tablelands Northern Tablelands Northern Tablelands Project Fact Sheet Project Fact Sheet Project Fact Sheet 5
Transcript of FS 5 Water web - snelandcare.org.au · The desirable pH range for livestock drinking water is...

temperature). Most Monitor farm dams had dissolved oxygen levels that were
good or better (> 5.5 mg/L; Tables 2-5).
pH
The pH of water is a measure of acidity (pH < 7). Water should be neither too acid nor too alkaline (Tables 1-4) to support aquatic life. The desirable pH range for aquatic ecosystem protection
on the Northern Tablelands is 6.5-9.0.
Water QualityWater QualityWater Quality on New England wool propertieson New England wool propertieson New England wool properties
Introduction During the Land, Water & Wool (LWW) Northern Tablelands Project (NSW), water quality in Monitor farm dams and creeks was measured to establish
a baseline for the future.
This Fact Sheet reports the results of water chemistry testing, and the diversity of aquatic macro-invertebrates (‘water bugs’) on farms.
(See Box for methods.)
Water bugs play a central role in aquatic food webs as food for fish and birds. As they are also sensitive to pollution or unnatural fluctuations in the physical and chemical environment, they are commonly used to indicate water quality and
departure from natural conditions.
Monitor farm dams The 27 farm dams varied from 0.03-1.92 ha in area of surface water (Table 1). Four larger dams contained islands;
one contained 12 islands.
Most dam verges were well vegetated with an average of 95% pasture cover and an average of 2.7 tonnes of dry matter per hectare (range, 1.2-6.0 t DM/ha). Bare ground in dam verges varied up to 15%, and tree cover
varied up to 20%.
The water chemistry of the farm dams was generally good to excellent in terms of stock water quality and
ecosystem protection (Tables 1-5).
Electrical conductivity
Electrical conductivity of water (ECw) is a measure of total dissolved salts and a surrogate for salinity. The ECw of the dam water on LWW Monitor farms varied from 40-721 µS/cm (Table 1), which is good to excellent for livestock (Tables 2, 4 & 5). Stock do not suffer if the ECw of water is
less than 1600 µS/cm.
Objectives have been set for the maintenance of healthy aquatic systems in the catchments where these dams are located (Table 3). A similar upper threshold for ECw (1500
µs/cm) to livestock is indicated.
The water chemistry in farm dams was strongly influenced by parent material (basalt, granite and metamorphosed
Land, Water & WoolLand, Water & WoolLand, Water & Wool
Northern Tablelands Northern Tablelands Northern Tablelands
Project Fact SheetProject Fact SheetProject Fact Sheet
sediment or ‘trap’). The ECw in basalt dams was significantly higher than dams in granite and trap soils (Fig. 1). However, values did not give cause for concern on livestock health or
environmental grounds.
Soluble reactive phosphorus
Soluble reactive phosphorus (SRP) measures the amount of phosphorus in water for use by plants. Too much phosphorus encourages potentially toxic build-up of blue-green algae, as well as
other nuisance algae.
Values were generally good to excellent (Tables 1 & 5), with only one-fifth of values exceeding the level (0.05 mg/L) associated with blue-green algae outbreaks (Table 3). However, only one-third of values fell within the threshold (0.015 mg/L) identified as desirable for
the conservation of aquatic ecosystems.
SRP increased with increasing available phosphorus in the soil surrounding dams
and streams.
Nitrate-nitrite oxides
Oxides of nitrogen (NOx) measure the nitrogen available to plants in the water. High levels can indicate the potential for nuisance growth of green algae as well as pollution from external
sources.
NOx in Monitor farm dams ranged from 0.001-0.807 mg/L. Almost all values were less than 0.015 mg/L which is excellent for both aquatic ecosystem conservation and stock drinking water
(Table 2).
Turbidity
Turbidity is a measure of the amount of particulate matter and silt suspended in water. High values are generally caused by surface soil and streambank erosion. Values less than 25 NTU are associated with moderate or better water quality
for aquatic ecosystem protection.
The values for Monitor farms ranged from 3-179 NTU, with most dams registering good or better water clarity
(≤ 25 NTU; Table 5).
Dissolved oxygen
Dissolved oxygen indicates the ability of water to support aquatic animal life. The target for healthy aquatic ecosystems on the Northern Tablelands is 80-90% saturation (generally equivalent to > 6 mg/L at ambient
Above, top to bottom—Australasian grebe nest, eggs and chick on Monitor farm dams. Adult grebes deliberately cover their eggs with weed when they leave the
nest. Photos—Stuart Green.
Figure 1. Electrical conductivity (mean ± s.e.m.) of water in farm dams in different parent materials. Sample sizes: basalt (n =
7), granite (n = 6) and trap (n = 14).
0
50
100
150
200
250
300
350
400
Basalt Granite Trap
Electrical conductivity ( µS/cm
)
The background, objectives and outcomes of this project are summarised at: www.landwaterwool.gov.au (Product number: PF030479)
A technical guideA technical guideA technical guide
Land, Water & WoolLand, Water & WoolLand, Water & Wool
Northern Tablelands Northern Tablelands Northern Tablelands
Project Fact SheetProject Fact SheetProject Fact Sheet
555

The desirable pH range for livestock drinking water is 6.5-8.5. Water with a pH below 6.5 or above 8.5 can cause digestive upsets in stock and depressed
appetite.
The pH of dam water on most Monitor farms was good or better (6.5-9.0, Tables 1 & 5). pH was strongly affected by parent material, with dam water in basalt soils being significantly more alkaline than in granite and trap soils (Fig. 2). pH of dam water was a function of the pH of the soil
surrounding each dam (Fig. 3).
Dams vs streams Despite differences in the vegetative cover of trees surrounding dams and streams, the cover of overhanging trees and pastures, and of emergent vegetation in dams and streams, there were no consistent differences in water
quality between the two (Table 1).
The average turbidity, phosphorus and nitrogen concentrations in streams were lower than those in dams, but the differences were not significant due to the large variation in measurements and
Table 1. Water chemistry, vegetation, wetland size and opportunistic records of vertebrate fauna at Monitor farm dams (n = 27) and streams (n = 8). Significant differences between dams and streams for each variable (or its logarithmic transform) are
indicated by * (ANOVA, P < 0.05) and ** (P < 0.1).
Dams Streams
Average value
(± s.e.m.)
Range Average value
(± s.e.m.)
Range
Water chemistry
Electrical conductivity (µS/cm) 141 ± 31 40-721 222 ± 38 77-386
Soluble reactive phosphorus (mg/L) 0.069 ± 0.027 0.003-0.689 0.028 ± 0.009 0.009-0.083
Nitrate-nitrite oxides (mg/L) 0.036 ± 0.030
0.001-0.807 0.001 0.001-0.001
Turbidity (NTU) 22.0 ± 6.7 3-179 9.2 ± 1.8 3-18
Dissolved oxygen (mg/L) 7.6 ± 0.4 4.2-13.3 7.7 ± 0.6 5.2-10.6
pH 7.7 ± 0.2 6.7-9.9 7.9 ± 0.2 6.9-8.9
Vegetation
Tree cover adjacent* (%) 2.0 ± 0.4 0.0-7.0 6.6 ± 2.7 0.0-5.0
Tree cover overhanging water* (%) 0.5 ± 0.2 0.0-5.0 12.2 ± 9.8 0.0-80.0
Pasture cover overhanging water* (%) 0.02 ± 0.02 0.0-0.5 26.1 ± 13.1 0.0-90.0
Emergent aquatic vegetation cover* (%) 9.9 ± 2.6 0.2-50.0 20.0 ± 5.4 0.5-43.0
Wetland size
Surface area of water (m²)* 4407 ± 879 280-19 100 1174 ± 190 65-2200
Vertebrate fauna
No. of frog species* 1.07 ± 0.22 0-5 0.25 ± 0.16 0-1
No. of bird species* 2.56 ± 0.46 0-7 0.75 ± 0.37 0-3
No. of individual birds* 9.0 ± 1.7 0-33 2.4 ± 1.5 0-12
Aquatic macro-invertebrates
No. of families** 12.7 ± 0.7 6.0-19.3 15.1 ± 1.0 9.3-19.3
SIGNAL2 index* 3.1 ± 0.1 2.4-3.6 3.3 ± 0.1 2.9-3.6
Table 2. Safe or ‘trigger’ levels of water quality indicators for slightly disturbed ecosystems (upland rivers) and livestock drinking water, in south-eastern Australia. After
ANZECC & ARMCANZ (2000), Robson & Curran (2003) and SRC (2006).
Trigger Levels Livestock Drinking Water Quality— No Adverse Effect Expected
Dissolved oxygen (%) 90-110 a
Electrical conductivity (µS/cm) 30-350 No serious burden to any livestock: <1600 No adverse effects on beef cattle: 6000
No adverse effects on sheep: 7500
Oxides of nitrogen (NOx, mg/L) 0.015 100
pH 6.5-8.0 6.5-8.5
Soluble reactive phosphorus (mg/L) 0.015 Insufficient data
Turbidity (NTU) 2-25
a Equivalent to approximately 8-10 mg/L (D. Ryder, pers. comm.).
Below—Frog spawn in fringing aquatic vegetation on a Monitor farm dam. Photo—
Stuart Green.
Below—Backswimmers like this notonectid were common on New England wool properties and are tolerant of pollution.
Photo—Mark Dahm.
Sampling water quality
Twenty-seven farm dams and eight riparian sites were sampled on 17 Monitor farms in southern New England between 18 November 2005 and 13 January 2006. This period followed widespread rainfall totalling 150 mm in the preceding 33 days (Armidale climatic data). Local flooding and high flows in local streams were experienced prior to sampling. A further 217 mm fell
during the sampling period.
Each site was delimited by a 1.2 ha circular area centred on small farm dams or an equivalent area towards the upstream end of larger dams to encompass both water and dam verges. A 1.2 ha area, 200 m long x 60 m wide, was sampled along water-
ways, centred on the stream.
Each site was divided into three sections: the upstream, middle and downstream reaches in riparian sites, and three sides of each dam. Physico-chemical water measurements were
made in the field in each section.
Water and water bug samples were collected for laboratory analysis and identification in each section. Water bugs were sampled for up to 5 minutes per section according to the method of Chessman et al. (1995). The median value of the three water chemistry measurements per site was recorded, and water bug scores (number of families and SIGNAL2, Chessman 2003) per section were
averaged for each site.

Table 4. Critical values for water quality and macro-invertebrate variables on LWW
Monitor farms.
Very Poor Poor Fair Good Excellent References
Water quality
Dissolved oxygen (mg/L)
< 4.5 4.5-5.0 5.0-5.5 5.6-6.0 > 6 ANZECC & ARMCANZ (2000)
Electrical conductivity (µS/cm)
> 6000 1501-6000 751-1500 350-750 < 350 ANZECC & ARMCANZ (2000), EPA (2000a,b,c), Walter & Reuter
(1996)
Oxides of nitrogen (NOx, mg/L)
> 1.0 0.5-1.0 (reservoirs) 0.75-1.0 (rivers)
0.1-0.5 (reservoirs) 0.1-0.75 (rivers)
0.015-0.10 < 0.015 ANZECC & ARMCANZ (2000)
pH < 6.0 or > 9.5
6.0-6.2 or 9.3-9.5
6.2-6.4 or 9.1-9.3
6.4 or 8.6-9.0
6.5-8.5 EPA (2000a,b,c), Robson & Curran
(2003)
Soluble reactive phosphorus (mg/L)
> 0.2 0.05-0.2 (reservoirs) 0.11-0.20 (rivers)
0.06-0.10 (rivers)
0.015-0.05 < 0.015 ANZECC & ARMCANZ (2000)
Turbidity (NTU)
> 100 51-100 26-50 5-25 < 5 EPA (2000a,b,c)
Number of families
< 3 3-5 6-9 10-15 > 15 Walker & Reuter (1996)
SIGNAL2 index < 4 4.0-4.9 5.0-5.9 6.0-6.5 > 6.5 Chessman (1995)
Macro-invertebrates
the small number of riparian sites
sampled.
Opportunistic recording of frogs and birds during the day revealed more frog and bird species and individual birds on farm dams than in riparian zones. This was probably due to the differences between the two in size of wetland
habitat (area of water) (Table 1).
Although formal surveys were not conducted, waterbirds (Australasian grebe, grey teal, dusky moorhen, wood duck and black duck) were found breeding (nests or young) on 70% of farm dams, frogs were recorded at 67% of dams, and evidence of frog breeding (e.g. egg masses) was noted at 30% of
dams.
Water bugs as
indicators A wide range of water bugs occurs in aquatic ecosystems, and they vary in their sensitivity to environmental conditions. The assemblage of water bugs in any particular wetland or stream indicates the extent to which aquatic conditions have been affected by catchment land and water use. Water bug assemblages are also sensitive to natural fluctuations in the environment
(e.g. recent rainfall and river flows).
The number of water bug families varied from 6.0-19.3 and 9.3-19.3 for dams and streams, respectively, with an average of 12.7 and 15.1 families (good and excellent, respectively, Table 1). Every dam scored fair or better in terms
of family diversity.
SIGNAL2 stands for the second iteration of the ‘Stream Invertebrate Grade Number—Average Level.’ It was developed by Chessman (1995, 2003) to help indicate departure in water quality
from pristine or natural conditions.
Each water bug family is ranked in terms of sensitivity to pollution (from 1 = highly tolerant to 10 = highly sensitive), and a site SIGNAL is computed based on the average tolerance of the water bugs present.
SIGNAL thus reflects pollution severity.
The SIGNAL2 index varied from 2.4-3.6 and 2.9-3.6 for dams and streams, respectively. Streams averaged significantly higher than dams (Table 1), but all SIGNAL2 scores were less than 4. This indicates severe pollution in stream water (Chessman 1995), which is at variance with the other water quality
measurements.
A possible explanation for the discrepancy is that SIGNAL2 and water bug assemblages reflect aquatic conditions over a long period of time, whereas physico-chemical measurements are instantaneous.
Figure 3. The linear relationship between dam water pH and the pHCa of the soil around each dam. The linear regression is
statistically significant (P = 0.003).
y = 0.9727x + 3.0454
R2 = 0.3106
6.0
7.0
8.0
9.0
10.0
11.0
3.5 4.0 4.5 5.0 5.5 6.0 6.5
Soil pH (Ca)
Water pH (H2O)
Figure 2. The pH (mean ± s.e.m.) of dam water in different parent materials. Sample sizes: basalt (n = 7), granite (n =
6) and trap (n = 14).
0
2
4
6
8
10
12
Basalt Granite Trap
pH
Table 3. Water quality objectives for healthy aquatic systems in the upper Gwydir, Namoi and Macleay River
catchments (EPA 2000a,b,c).
Water Quality Objectives
Dissolved oxygen (mg/L)
> 6 (or 80-90% saturation)
Electrical conductivity (µS/cm)
< 1500
pH 6.5-9.0
Soluble reactive phosphorus (mg/L)
0.05 a
Total phosphorus (mg/L)
0.01-0.10 (rivers), 0.005-0.05 (lakes & reservoirs in Upper Namoi & Upper Macleay), 0.02-0.05 (lakes & reservoirs in Upper Gwydir)
Total nitrogen (mg/L)
0.10-0.75 (rivers), 0.10-0.50 (lakes & reservoirs)
Turbidity (NTU)
< 5 (low turbidity) 5-25 (medium turbidity) 26-50 (high turbidity) > 50 (very high turbidity) and < 10% change in seasonal mean NTU
a Values above this limit can be associated with blue-green algal blooms in streams and
farm dams (A. Boulton, pers. comm.).
See Fact Sheet 9 for information about the effects of grazing
management on water quality.
Land, Water & Wool (LWW) is the most comprehensive natural resource management research and development program ever undertaken for the Australian wool industry. LWW is a partnership between Australian Wool Innovation Limited and Land & Water Australia, and has seven core sub-programs. The Native Vegetation and Biodiversity sub-program is working with woolgrowers and demonstrating that biodiversity has a range of values, can add wealth to the farm business and can be managed as part of a productive and profitable commercial wool enterprise.
The Land, Water & Wool Northern Tablelands Project is led by Associate Professor Nick Reid, University of New England, in collaboration with Southern New England Landcare Ltd, and the Centre for Agricultural and Regional Economics.
Disclaimer—The information contained in this publication is intended for general use, to assist public knowledge and discussion and to help improve the sustainable management of land, water and vegetation. It includes general statements based on scientific research. Readers are advised and need to be aware that this information may be incomplete or unsuitable for use in specific situations. Before taking any action or decision based on the information in this publication, readers should seek expert professional, scientific and technical advice. To the extent permitted by law, the Commonwealth of Australia, Land & Water Australia (including its employees and consultants), the authors, and the Land, Water & Wool Program and its partners do not assume liability of any kind whatsoever resulting from any person’s use or reliance upon the content of this publication.
Copyright—of this publication, and all the information it contains, jointly vests in the Land and Water Resources Research and Development Corporation, with its brand name being Land & Water Australia, and Australian Wool Innovation Limited. Both Corporations grant permission for the general use of any or all of this information provided due acknowledgement is given to its source.
Authors—Nick Reid, Stuart Green and Jim Fittler. Editing & design—Kàren Zirkler. Date—December 2006.
Acknowledgement—The Project Team is indebted to the Monitor woolgrower families who allowed us to measure water quality on their farms. Wendy Miller sorted the aquatic macro-invertebrates and computed the SIGNAL2 indices. Andrew Boulton, Jann Williams, Mike Wagg, Renelle Jeffrey and Jane Thomas commented on drafts.
For more information, contact
• Southern New England Landcare PO Box 75A, Armidale, NSW 2350. Telephone 02 6772 9123 Facsimile 02 6771 2656 Email [email protected]
• Associate Professor Nick Reid Ecosystem Management, University of New England, Armidale NSW 2351. Telephone 02 6773 2539 Email [email protected]
• www.landwaterwool.gov.au
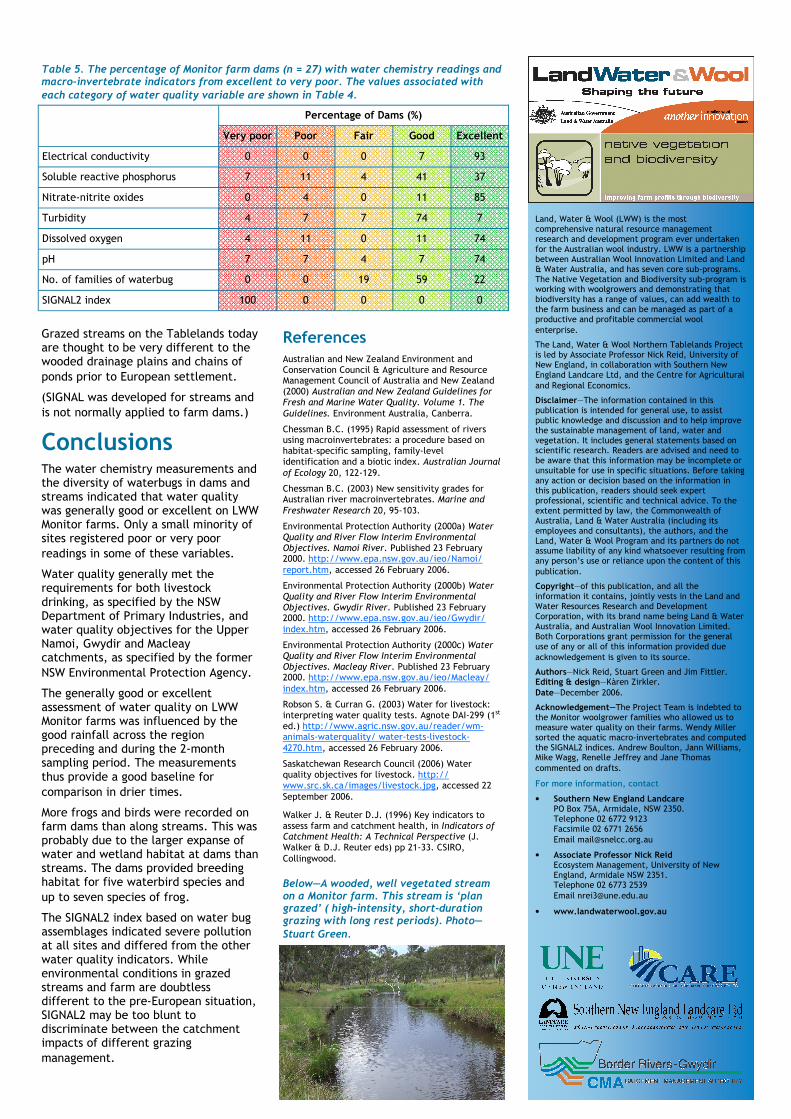
Table 5. The percentage of Monitor farm dams (n = 27) with water chemistry readings and macro-invertebrate indicators from excellent to very poor. The values associated with
each category of water quality variable are shown in Table 4.
Percentage of Dams (%)
Very poor Poor Fair Good Excellent
Electrical conductivity 0 0 0 7 93
Soluble reactive phosphorus 7 11 4 41 37
Nitrate-nitrite oxides 0 4 0 11 85
Turbidity 4 7 7 74 7
Dissolved oxygen 4 11 0 11 74
pH 7 7 4 7 74
No. of families of waterbug 0 0 19 59 22
SIGNAL2 index 100 0 0 0 0
Below—A wooded, well vegetated stream on a Monitor farm. This stream is ‘plan grazed’ ( high-intensity, short-duration grazing with long rest periods). Photo—
Stuart Green.
Grazed streams on the Tablelands today are thought to be very different to the wooded drainage plains and chains of
ponds prior to European settlement.
(SIGNAL was developed for streams and
is not normally applied to farm dams.)
Conclusions The water chemistry measurements and the diversity of waterbugs in dams and streams indicated that water quality was generally good or excellent on LWW Monitor farms. Only a small minority of sites registered poor or very poor
readings in some of these variables.
Water quality generally met the requirements for both livestock drinking, as specified by the NSW Department of Primary Industries, and water quality objectives for the Upper Namoi, Gwydir and Macleay catchments, as specified by the former
NSW Environmental Protection Agency.
The generally good or excellent assessment of water quality on LWW Monitor farms was influenced by the good rainfall across the region preceding and during the 2-month sampling period. The measurements thus provide a good baseline for
comparison in drier times.
More frogs and birds were recorded on farm dams than along streams. This was probably due to the larger expanse of water and wetland habitat at dams than streams. The dams provided breeding habitat for five waterbird species and
up to seven species of frog.
The SIGNAL2 index based on water bug assemblages indicated severe pollution at all sites and differed from the other water quality indicators. While environmental conditions in grazed streams and farm are doubtless different to the pre-European situation, SIGNAL2 may be too blunt to discriminate between the catchment impacts of different grazing
management.
References Australian and New Zealand Environment and Conservation Council & Agriculture and Resource Management Council of Australia and New Zealand (2000) Australian and New Zealand Guidelines for Fresh and Marine Water Quality. Volume 1. The
Guidelines. Environment Australia, Canberra.
Chessman B.C. (1995) Rapid assessment of rivers using macroinvertebrates: a procedure based on habitat-specific sampling, family-level identification and a biotic index. Australian Journal of Ecology 20, 122-129.
Chessman B.C. (2003) New sensitivity grades for Australian river macroinvertebrates. Marine and
Freshwater Research 20, 95-103.
Environmental Protection Authority (2000a) Water Quality and River Flow Interim Environmental Objectives. Namoi River. Published 23 February 2000. http://www.epa.nsw.gov.au/ieo/Namoi/report.htm, accessed 26 February 2006.
Environmental Protection Authority (2000b) Water Quality and River Flow Interim Environmental Objectives. Gwydir River. Published 23 February 2000. http://www.epa.nsw.gov.au/ieo/Gwydir/index.htm, accessed 26 February 2006.
Environmental Protection Authority (2000c) Water Quality and River Flow Interim Environmental Objectives. Macleay River. Published 23 February 2000. http://www.epa.nsw.gov.au/ieo/Macleay/index.htm, accessed 26 February 2006.
Robson S. & Curran G. (2003) Water for livestock: interpreting water quality tests. Agnote DAI-299 (1st ed.) http://www.agric.nsw.gov.au/reader/wm-animals-waterquality/ water-tests-livestock-4270.htm, accessed 26 February 2006.
Saskatchewan Research Council (2006) Water quality objectives for livestock. http://www.src.sk.ca/images/livestock.jpg, accessed 22 September 2006.
Walker J. & Reuter D.J. (1996) Key indicators to assess farm and catchment health, in Indicators of Catchment Health: A Technical Perspective (J. Walker & D.J. Reuter eds) pp 21-33. CSIRO, Collingwood.

![An integrated indexical investigation of˜selected heavy metals ......NIS[23] WHO[24] limits pH 21 5.1 6.9 5.9133 0.5946 6.5–8.5 6.5–8.5 71.43 Fe(mg/L) 21 0.039 1.742 0.3468 0.5785](https://static.fdocuments.net/doc/165x107/6148e1382918e2056c22f9f1/an-integrated-indexical-investigation-ofoeselected-heavy-metals-nis23.jpg)


![arXiv:2005.13949v1 [physics.app-ph] 25 May 20207.5 MHz F4 6.5 MHz F5 F6 7.5 MHz F7 F8 6.5 MHz F14 9.5 MHz F15 NA F16 8.5 MHz F17 NA F18 NA F19 7.5 MHz F11 6.5 MHz F20 NA F21 8.5 MHz](https://static.fdocuments.net/doc/165x107/5f758878eb2d114487007824/arxiv200513949v1-25-may-2020-75-mhz-f4-65-mhz-f5-f6-75-mhz-f7-f8-65-mhz.jpg)


