Fructose content in popular beverages made with … article Fructose content in popular beverages...
9
Original article Fructose content in popular beverages made with and without high-fructose corn syrup q Q6 Ryan W. Walker Ph.D. a , Kelly A. Dumke M.S. b , Michael I. Goran Ph.D. c, * a Charles Bronfman Institute for Personalized Medicine, Mount Sinai Icahn School of Medicine, New York, USA Q 5 b Division of Chronic Disease and Injury Prevention, Los Angeles County Department of Public Health, Los Angeles, California, USA c Preventive Medicine, University of Southern California, Keck School of Medicine, Los Angeles, California, USA article info Article history: Received 23 January 2014 Accepted 1 April 2014 Keywords: Fructose Obesity Nonalcoholic fatty liver disease Soda Juice SSB HFCS Sucrose abstract Objective: Excess fructose consumption is hypothesized to be associated with risk for metabolic disease. Actual fructose consumption levels are difficult to estimate because of the unlabeled quantity of fructose in beverages. The aims of this study were threefold: 1) re-examine the fructose content in previously tested beverages using two additional assay methods capable of detecting other sugars, especially maltose; 2) compare data across all methods to determine the actual free fructose-to-glucose ratio in beverages made either with or without high-fructose corn syrup (HFCS), and 3) expand the analysis to determine fructose content in commonly consumed juice products. Methods: Sugar-sweetened beverages (SSBs) and fruit juice drinks that were either made with or without HFCS were analyzed in separate, independent laboratories via three different methods to determine sugar profiles. Results: For SSBs, the three independent laboratory methods showed consistent and reproducible results. In SSBs made with HFCS, fructose constituted 60.6% 2.7% of sugar content. In juices sweetened with HFCS, fructose accounted for 52.1% 5.9% of sugar content, although in some juices made from 100% fruit, fructose concentration reached 65.35 g/L accounting for 67% of sugars. Conclusion: Our results provide evidence of higher than expected amounts of free fructose in some beverages. Popular beverages made with HFCS have a fructose-to-glucose ratio of approximately 60:40, and thus contain 50% more fructose than glucose. Some pure fruit juices have twice as much fructose as glucose. These findings suggest that beverages made with HFCS and some juices have a sugar profile very different than sucrose, in which amounts of fructose and glucose are equivalent. Current dietary analyses may underestimate actual fructose consumption. Ó 2014 The Authors. Published by Elsevier Inc. All rights reserved. Introduction Assessment of fructose content in foods and beverages is an important public health issue to consider, as Americans consume more per-capita high-fructose corn syrup (HFCS) than any other nation [1]. Fructose consumption in the U.S. population has doubled over the past 3 decades [2] and the consumption of excess fructose, due primarily to the way in which fructose is specifically metabolized by the liver [3,4], has been linked to fatty liver disease [5], dyslipidemia [6], type 2 diabetes [1], obesity [7], and gout [8]. However, others have argued that any additional fructose in HFCS is minimal, without any adverse health effects, and that HFCS-55 is “essentially” the same as su- crose in terms of sugar content and composition [9]. A growing body of clinical evidence suggests that fructose consumption plays a direct role in the risk for metabolic disease [10,11] and may have adverse effects on central appetite regulation compared with glucose [12]. Despite this evidence, current food-labeling practices do not provide information on fructose content in foods and beverages made with HFCS, fruit juice q This is an open access article under the CC BY-NC-ND license (http:// creativecommons.org/licenses/by-nc-nd/3.0/). Portions of this work were supported by The Ruth L. Kirschstein National Research Service Award National Institutes of Health Q 1 (grant no. 2 T32 ES013678-06). All authors contributed equally to the conception and design of the study; generation, collection, assembly, analysis, and/or interpretation of data; and drafting or revision of the manuscript. All authors approved the final version of the manuscript. Q 2 * Corresponding author. Tel.: þ1 323 442 3027; fax: þ1 323 442 4103. E-mail address: [email protected] (M. I. Goran). 0899-9007/$ - see front matter Ó 2014 The Authors. Published by Elsevier Inc. All rights reserved. http://dx.doi.org/10.1016/j.nut.2014.04.003 Contents lists available at ScienceDirect Nutrition journal homepage: www.nutritionjrnl.com Please cite this article inpress as: Walker RW, et al., Fructose content in popular beverages made with and without high-fructose corn..., Nutrition (2014), http://dx.doi.org/10.1016/j.nut.2014.04.003 Nutrition xxx (2014) 1–8 1 2 3 4 5 6 7 8 9 10 11 12 13 14 15 16 17 18 19 20 21 22 23 24 25 26 27 28 29 30 31 32 33 34 35 36 37 38 39 40 41 42 43 44 45 46 47 48 49 50 51 52 53 54 55 56 57 58 59 60 61 62 63 64 65 66 67 68 69 70 71 72 73 74 75 76 77 78 79 80 81 82 83 84 85 86 87 88 89 90 91 92 93 94 95 96 97 98 99 100 101 102 103 104 105 NUT9278_proof ■ 21 May 2014 ■ 1/8
Transcript of Fructose content in popular beverages made with … article Fructose content in popular beverages...
Original article
Fructose content in popular beverages made with and withouthigh-fructose corn syrupq
Q6 Ryan W. Walker Ph.D. a, Kelly A. Dumke M.S. b, Michael I. Goran Ph.D. c,*aCharles Bronfman Institute for Personalized Medicine, Mount Sinai Icahn School of Medicine, New York, USAQ5bDivision of Chronic Disease and Injury Prevention, Los Angeles County Department of Public Health, Los Angeles, California, USAc Preventive Medicine, University of Southern California, Keck School of Medicine, Los Angeles, California, USA
a r t i c l e i n f o
Article history:Received 23 January 2014Accepted 1 April 2014
Keywords:FructoseObesityNonalcoholic fatty liver diseaseSodaJuiceSSBHFCSSucrose
a b s t r a c t
Objective: Excess fructose consumption is hypothesized to be associated with risk for metabolicdisease. Actual fructose consumption levels are difficult to estimate because of the unlabeledquantity of fructose in beverages. The aims of this study were threefold: 1) re-examine the fructosecontent in previously tested beverages using two additional assay methods capable of detectingother sugars, especially maltose; 2) compare data across all methods to determine the actual freefructose-to-glucose ratio in beverages made either with or without high-fructose corn syrup(HFCS), and 3) expand the analysis to determine fructose content in commonly consumed juiceproducts.Methods: Sugar-sweetened beverages (SSBs) and fruit juice drinks that were either made with orwithout HFCS were analyzed in separate, independent laboratories via three different methods todetermine sugar profiles.Results: For SSBs, the three independent laboratory methods showed consistent and reproducibleresults. In SSBs made with HFCS, fructose constituted 60.6% ! 2.7% of sugar content. In juicessweetened with HFCS, fructose accounted for 52.1% ! 5.9% of sugar content, although in somejuices made from 100% fruit, fructose concentration reached 65.35 g/L accounting for 67% of sugars.Conclusion: Our results provide evidence of higher than expected amounts of free fructose in somebeverages. Popular beverages made with HFCS have a fructose-to-glucose ratio of approximately60:40, and thus contain 50% more fructose than glucose. Some pure fruit juices have twice as muchfructose as glucose. These findings suggest that beverages made with HFCS and some juices have asugar profile very different than sucrose, in which amounts of fructose and glucose are equivalent.Current dietary analyses may underestimate actual fructose consumption.
! 2014 The Authors. Published by Elsevier Inc. All rights reserved.
Introduction
Assessment of fructose content in foods and beverages is animportant public health issue to consider, as Americans consumemore per-capita high-fructose corn syrup (HFCS) than any other
nation [1]. Fructose consumption in the U.S. population hasdoubled over the past 3 decades [2] and the consumption ofexcess fructose, due primarily to the way in which fructose isspecifically metabolized by the liver [3,4], has been linked tofatty liver disease [5], dyslipidemia [6], type 2 diabetes [1],obesity [7], and gout [8]. However, others have argued that anyadditional fructose in HFCS is minimal, without any adversehealth effects, and that HFCS-55 is “essentially” the same as su-crose in terms of sugar content and composition [9]. A growingbody of clinical evidence suggests that fructose consumptionplays a direct role in the risk for metabolic disease [10,11] andmay have adverse effects on central appetite regulationcompared with glucose [12]. Despite this evidence, currentfood-labeling practices do not provide information on fructosecontent in foods and beverages made with HFCS, fruit juice
q This is an open access article under the CC BY-NC-ND license (http://creativecommons.org/licenses/by-nc-nd/3.0/).
Portions of this work were supported by The Ruth L. Kirschstein NationalResearch Service Award National Institutes of HealthQ1 (grant no. 2 T32ES013678-06). All authors contributed equally to the conception and design ofthe study; generation, collection, assembly, analysis, and/or interpretation ofdata; and drafting or revision of the manuscript. All authors approved the finalversion of the manuscript.Q2* Corresponding author. Tel.: "1 323 442 3027; fax: "1 323 442 4103.
E-mail address: [email protected] (M. I. Goran).
0899-9007/$ - see front matter ! 2014 The Authors. Published by Elsevier Inc. All rights reserved.http://dx.doi.org/10.1016/j.nut.2014.04.003
Contents lists available at ScienceDirect
Nutrition
journal homepage: www.nutr i t ionjrnl .com
Please cite this article in press as: Walker RW, et al., Fructose content in popular beverages made with and without high-fructose corn...,Nutrition (2014), http://dx.doi.org/10.1016/j.nut.2014.04.003
Nutrition xxx (2014) 1–8
1
2
3
4
5
6
7
8
9
10
11
12
13
14
15
16
17
18
19
20
21
22
23
24
25
26
27
28
29
30
31
32
33
34
35
36
37
38
39
40
41
42
43
44
45
46
47
48
49
50
51
52
53
54
55
56
57
58
59
60
61
62
63
64
65
66
67
68
69
70
71
72
73
74
75
76
77
78
79
80
81
82
83
84
85
86
87
88
89
90
91
92
93
94
95
96
97
98
99
100
101
102
103
104
105
NUT9278_proof ! 21 May 2014 ! 1/8
ryanwalker
ryanwalker
ryanwalker
ryanwalker
ryanwalker
ryanwalker
ryanwalker
ryanwalker
concentrate or crystalline fructose, all of which contain fructoseand are being used in increasing amounts as added sugar in thefood supply [13]. Because there are currently no disclosures offructose content in foods and beverages [13], and many nutritiondatabases only rely on product label information, it is chal-lenging to accurately determine actual fructose consumptionlevels in nutrition research.
Previous work has shown that the fructose content of sugar-sweetened beverages (SSBs) made with HFCS can be as high as65% of total sugar content, higher than that suggested by thefructose content of HFCS-55 (55% fructose) [14], potentiallycontributing to unexpectedly more fructose in the diet. However,this initial study was criticized [14] for not measuring other tracesugars (e.g., maltose) thought to be present in SSBs made withHFCS. Therefore, the aims of the present study were to: 1) re-examine the fructose content in previously tested beveragesusing two additional assay methods capable of detecting othersugars, especially maltose; 2) compare data across all methods todetermine the actual free fructose-to-glucose (F:G) ratio inbeverages made either with or without HFCS, and 3) expand theanalysis to determine fructose content in commonly consumedjuice products.
Methods and procedures
Based on product popularity [15], we selected 10 of the 23 beverages thatwere previously tested using liquid chromatography (LC) [14], for follow-upanalysis using two alternative methods to determine sugar content: 1) ametabolomics-type METQ3 approach based on mass spectrometry (MS) withcombined liquid and gas chromatography (GC) and 2) GC. Additionally, weextended the use of GC to analyze a selection of juice products, as describedhere.
Metabolomics-type approach
Popular SSBs were purchased from retailers in East Los Angeles, California,in 2012. Beverages were selected to replicate a previous study [14], in whichthe selection of beverages was based on consumption frequencies of childrenin past studies. Nutrition label information and serving size data were recor-ded. Immediately after opening bottled/canned beverages, 500 mL sampleswere aliquoted and transferred to Eppendorf cryotubes. All samples were heldunder refrigeration and sequentially flash frozen in liquid nitrogen within 1 hof the initial transfer. Samples were stored at #20$C overnight before ship-ment. Glucose, fructose, sucrose, and maltose standard solutions were createdfrom research grade reagents (Sigma-Aldrich, St. Louis, MO, USA) to serve ascontrols. Ten grams of the sucrose, fructose, and glucose reagents were addedto 100 mL of Millipore water and brought into solution. Two concentrations ofmaltose were prepared, 10 g/L and 1 g/L. Finally, a 50:50 solution of fructoseand sucrose was prepared by combining 5 g of each reagent with 100 mL ofwater. These sugar standard concentrations were chosen to replicate theapproximate sugar-content equivalents found in most sweetened beverageswith the two maltose preparations representing the very small amounts of thissugar that may be found in sweetened beverages. For all standards, 500 mLaliquots were taken and prepared as just described. All samples were shippedovernight packed in dry ice to Metabolon (Research Triangle Park, Durham, NC,USA). Samples were split into equal parts for analysis on the gas chromatog-raphy/mass spectrometry (GC/MS) and liquid chromatography/mass spec-trometry (LC/MS) platforms based on previously published methodology [16].The GC column was 5% phenyl and the temperature ramp was from 40$C to300$C in a 16-min period. Samples were analyzed on a Thermo-Finnigan TraceDSQ fast-scanning single-quadrupole MS using electron impact ionization. TheLC/MS portion of the platform was based on a Waters ACQUITY UPLC anda Thermo-Finnigan LTQ MS, which consisted of an electrospray ionizationsource and linear ion-trap mass analyzer. Compounds were identified bycomparison to library entries of purified standards or recurrent unknownentities. Identification of known chemical entities was based on comparison tometabolomic library entries of purified standards. The combination of chro-matographic properties and mass spectra gave an indication of a match to thespecific compound or an isobaric entity. Metabolon was blinded to the sourceof all samples and standards and samples were analyzed according to previ-ously described methodologies using a metabolomics approach to examine abroad array of simple and complex sugars [16]. Data for sucrose, glucose,fructose and maltose are presented in this manuscript.
Gas chromatography
The 10 SSBs analyzed in the MET analysis were again selected along with 4additional randomly selected SSBs and 20 other juice products. Online shoppingdatabases for Walmart, SuperValu, and Safeway were accessed to select sam-ples. To control for location and inventory, online store inventories wereselected within a defined zip code region (90033). Twenty juices were randomlyselected by choosing every 10th product in the retailers’ databases until 10products made with HFCS and 10 products made without HFCS, according topackage ingredients labels, were selected. One juice product was omitted fromthe analysis due to handling error, resulting in 19 products that proceeded toassay. All samples were aliquoted to sterile, sealed containers and sampleweights were determined and recorded. Samples were packaged and shippedovernight on dry ice to Covance Laboratories (Madison, WI, USA) for subsequentblinded analysis via GC, against internal standards, according to previouslypublished methods [17–19]. The sugar profile analysis conducted at Covancewas applicable to the determination of fructose, galactose, glucose, sucrose,lactose, and maltose in as little as 10 g of food products, syrups, and beveragesusing GC as described later. Once received, samples were prepared in accor-dance with Covance procedures and sugars were extracted from the homoge-nized sample with water. Aliquots were dried under inert gas and reconstitutedwith a hydroxylamine hydrochloride solution in pyridine containing phenyl--b-D-glucoside as the internal standard. The resulting oximes were converted tosilyl derivatives with hexamethyldisilazane and trifluoroacetic acid treatmentand analyzed by GC [17,18] using a flame ionization detector (Agilent 6890 N).An additional 10% of each sample analytical run was tested in duplicate andvalidated against two internal validated controls. Results underwent qualitycontrol comparison with internal validated controls, linearity expectations, andhistorical data. The limit of quantitation for most matrices is 0.1%. The relativestandard deviations, on a cereal matrix, for fructose, glucose, sucrose, andmaltose were 4.9%, 7.4%, 3.2%, and 6.4%, respectively. Specific gravity testing wasconducted [19] on all liquid samples to allow the reporting of sugar content inappropriate units of measure.
Comparison of laboratory obtained sugar values versus nutritional databasevalues
The Nutrition Data System for Research (NDSR, University of Minnesota, MN,USA) was used to assemble sugar content data for some of the products includedin this study. All SSB and juice products listed in the NDSR database werecompared against the GC-determined sugar values. The Nutrition CoordinatingCenter Food and Nutrient Database served as the source of food compositioninformation in NDSR [20]. The U.S. Department of Agriculture Nutrient DataLaboratory was the primary source of nutrient values and nutrient composition.These values were supplemented by food manufacturers’ information and dataavailable in the scientific literature [21]. Standardized, published imputationprocedures were applied to minimize missing values [22]. Fructose, sucrose, andglucose contents for all SSB and juice products, with an exact product match inthe NDSR database, were assembled for comparison. NDSR product volumes (floz.) varied, thus all product volumes were normalized to 12 fl oz. and sugaramounts in grams were calculated based on the NDSR referent volume. Thesedata were compared against the values obtained through GC, as described pre-viously. The mean GC-obtained sugar contents across matched products werecompared with the mean NDSR sugar values across matched products, andpercent difference was reported.
Data reporting
Examination of sugar composition in 10 beverages across three different methodsA mean with SD (reflecting the differences between analytical methods) and
coefficient of variation (CV) for intermethod variability were calculated forfructose, glucose, sucrose, and maltose to assess consistency across the inde-pendent methods (SPSS v18 [SPSS Inc, Chicago, IL, USA]). Percent of total sugar (%TS) was calculated for all measured sugars in the SSBs analyzed via the threemethodologies.
SSB and juice GC analysisData for individual sugars were reported in the following formats; %TS,
concentration of each sugar in grams per liter (g/L) and grams per serving (g/s). Free F:G ratios and the concentration of free fructose (Fconcentration) in eachproduct were also assessed. The raw F:G (F:GRaw) was adjusted (F:GAdjusted) toaccount for the additional glucose that the disaccharide maltose maycontribute to the overall sugar profile of the products. F:G values were re-ported using the first number, representing fructose, as the referent (e.g., F:Gof 60:40; reported as 60). Formulas used to obtain these values are presentedin Table 1.
R. W. Walker et al. / Nutrition xxx (2014) 1–82
Please cite this article in press as: Walker RW, et al., Fructose content in popular beverages made with and without high-fructose corn...,Nutrition (2014), http://dx.doi.org/10.1016/j.nut.2014.04.003
106
107
108
109
110
111
112
113
114
115
116
117
118
119
120
121
122
123
124
125
126
127
128
129
130
131
132
133
134
135
136
137
138
139
140
141
142
143
144
145
146
147
148
149
150
151
152
153
154
155
156
157
158
159
160
161
162
163
164
165
166
167
168
169
170
171
172
173
174
175
176
177
178
179
180
181
182
183
184
185
186
187
188
189
190
191
192
193
194
195
196
197
198
199
200
201
202
203
204
205
206
207
208
209
210
211
212
213
214
215
216
217
218
219
220
221
222
223
224
225
226
227
228
229
230
231
232
233
NUT9278_proof ! 21 May 2014 ! 2/8
ryanwalker
ryanwalker
ryanwalker
ryanwalker
ryanwalker
ryanwalker
ryanwalker
ryanwalker
ryanwalker
ryanwalker
ryanwalker
ryanwalker
ryanwalker
ryanwalker
ryanwalker
ryanwalker
ryanwalker
ryanwalker
Results
Fructose content of SSBs: Methodologic comparison
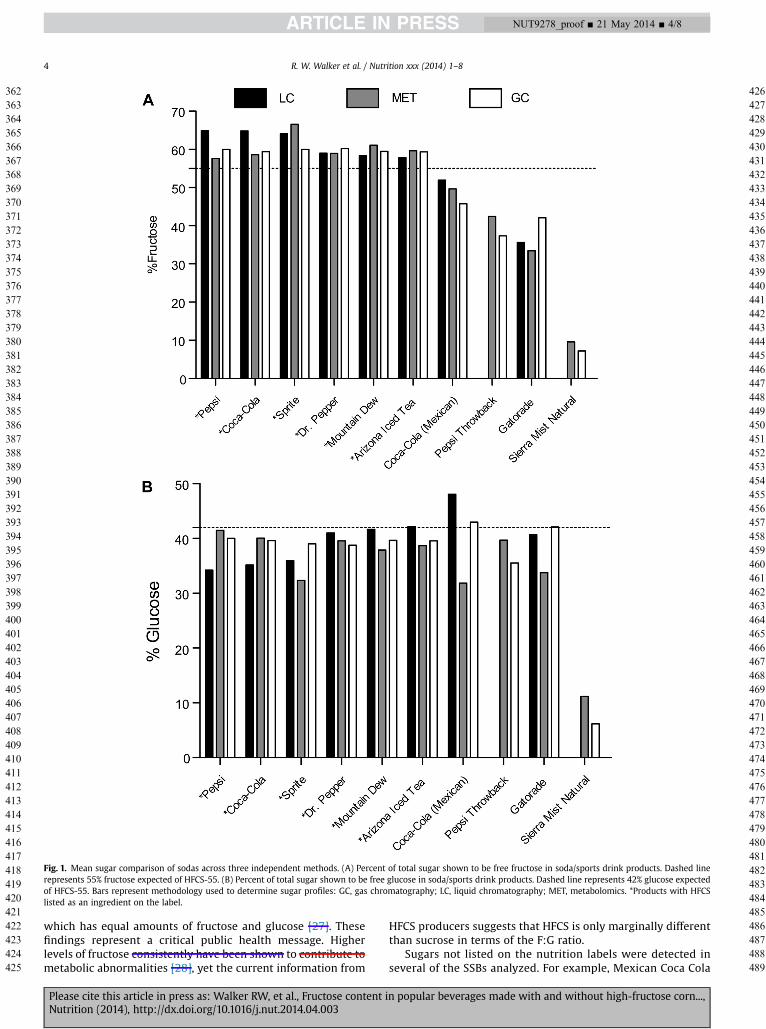
We first compared the fructose content of the original 10beverages, as measured by three independent methods/labo-ratories (LC [14], MET, and GC), which are displayed in Figure 1.Results were consistent across all three methodologies forpercent fructose and glucose (Fig. 1) as well as sucrose andmaltose (Supplementary Fig. 1). Free fructose content wasconsistent across methodologies with SDs remaining below3.6%, with the exception of Gatorade (SD % 4.5%). Mean freefructose content, expressed as a percent of all sugars, for bev-erages listing HFCS as an ingredient was 60.6% ! 2.7%. In allremaining beverages, the mean free fructose content, expressedas %TS, was 35.5% ! 15.4%. Mexican Coca-Cola consistentlycontained 49.1% ! 3% of total sugar as free fructose despiteneither HFCS or fructose being listed on the label. Additionally,Pepsi Throwback, Gatorade, and Sierra Mist, all which listneither HFCS nor fructose as added sweeteners, containedfructose as a %TS in w50%, 40%, and 8%, respectively. Analysesconfirmed that only very small amounts of maltose (not >1.7%of sugars) were present in the sampled beverages. The CVvalues for fructose and glucose were consistently <0.12 and 0.1,indicating high reliability between measures. Mexican Coca Colahad a glucose CV of 0.2 and an artificially elevated sucrose CV of0.9 due to the original analysis detecting no sucrose resulting ina very high SD. Sierra Mist was not assayed in the originalanalysis, therefore no CV was reported. The CV of sucrose inother products was in all cases <0.2. In the MET and GC ana-lyses, maltose was only detected in 4 and 3 of the 10 beverages,respectively. CV values ranged from 0.1 to 0.3, likely due to thevery small amounts detected via the two methods. Maltose wasnot measured in the initial study.
Sugar analysis using gas chromatography
SSBs and juicesBeverages listing HFCS as an ingredient had a mean F:GAd-
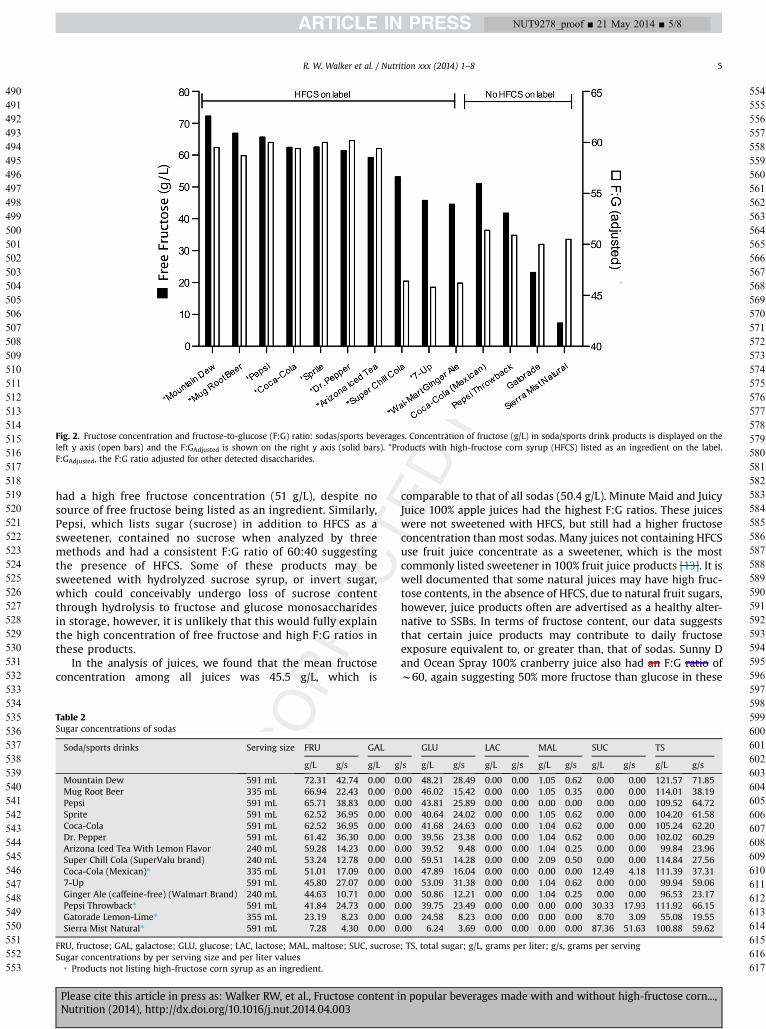
justed of 59.6 ! 0.5 (Fig. 2). Among products not listing HFCS as asweetener, the mean F:GAdjusted was 50.7 ! 0.6. F:GRaw valueswere not altered when adjusted for disaccharides. Mean Fcon-centration in products listing HFCS as an ingredient were 59.4 !8.9 g/L versus 30.8 ! 19.5 g/L for non-HFCS products (Fig. 2,Table 2). Sprite, Dr. Pepper, and Pepsi had free fructose ac-counting for 60% or more of total sugar. Several SSBs that didnot list HFCS or fructose as an ingredient on the nutrition labelhad Fconcentration substantially greater than zero (Mexican Coca-Cola, 51 g/L; Pepsi Throwback, 42 g/L; Gatorade, 23 g/L; SierraMist, 7 g/L). Pepsi lists sucrose as an included ingredient,
however, no sucrose was detected in Pepsi using GC method-ology and its F:GAdjusted was 60. Maltose was detected in eightproducts and levels did not exceed 2% of total sugar in any ofthese beverages. Galactose and lactose were not detected in anyof the products (Table 3).
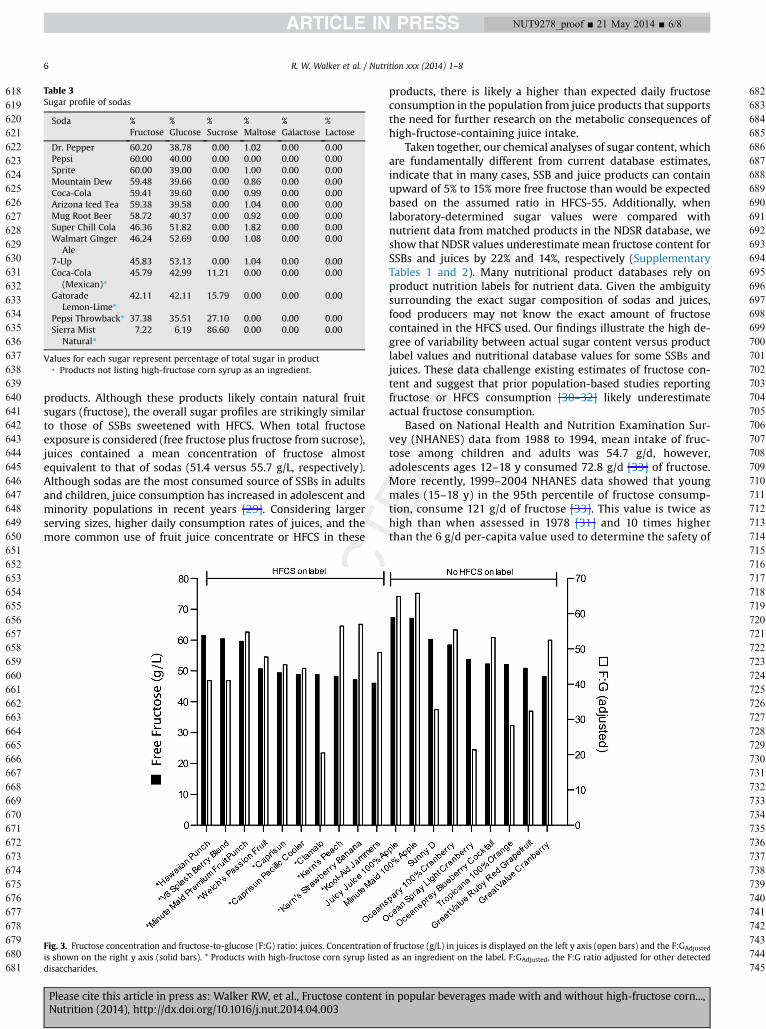
Minute Maid and Juicy Juice 100% apple juices hadF:GAdjusted values of 67.1 and 67.3, respectively, the highest inthe study. Mean Fconcentration for these two products were 65.7and 64.8 g/L, respectively (Fig. 3, Table 4). Five other juices hadF:GAdjusted values >55. Hawaiian Punch had the highestF:GAdjusted value (61.5) among the products listing HFCS as aningredient. Mean F:GAdjusted and Fconcentration for HFCS productswere 52.1 ! 5.9 and 45.7 ! 10.6 g/L, respectively. MeanF:GAdjusted and Fconcentration for non-HFCS products were 56.7 !6.9 and 45.2 ! 16.6 g/L, respectively. Maltose was detected insix products but did not exceed 1.9% of total sugar in any ofthese beverages. Galactose and lactose were not detected inany of the products (Table 5).
Discussion
This is the first study to comprehensively determine thefructose content and sugar profiles in both SSBs and juiceproducts. The results of the multimethod sugar profile analysiswere strikingly similar in terms of fructose content. Prior workdemonstrated that in popular SSBs, fructose constituted up to65% of the total sugar with an average of 59% in beverages madewith HFCS [14]. However, this initial analysis may have beenmethodologically limited [9] in that maltose, which maypotentially alter the fructose to glucose ratio, was not measured.In the present study, we used two additional and independentassays that were capable of detecting the presence of tracesugars, including maltose, and confirmed prior findings whilealso extending the analysis beyond SSBs to also include fruitjuices.
The clearest and most consistent finding in this study wasthat the five most popular [15] HFCS-sweetened sodas made bycompanies that comprise w90% of the annual beverage marketshare [15] (Coca-Cola, Pepsi, Dr. Pepper, Mountain Dew, andSprite) have F:G ratios of w60:40, meaning they contain 50%more fructose than glucose. This fructose content differsdramatically from the 50:50 ratio found in sucrose and from theassumed ratio of 55:42 in HFCS-55. These findings, which wereconfirmed by three independent laboratories and methodolo-gies, were maintained after adjusting for the presence of tracesugars, and support the initial report [14], providing furtherevidence for the elevated F:G ratios in the most popular SSBsmade with HFCS. HFCS can be manufactured to have variablefructose contents [23] and is also available in higher concen-trations up to HFCS-90 [24] (90% fructose). One possibleexplanation of the higher fructose content may be the blendingof HFCS-90 with HFCS-55 or glucose syrup [23] to createproducts with fructose contents higher than HFCS-55. Thisstrategy is both feasible and allowable under current regula-tions, as current FDA guidelines for use of HFCS-55 as aningredient only require it to be a “minimum” of 55% fructose[25,26] (with 3% allotted for other, unspecified sugars), andallow the unrestricted sales and use of HFCS-90 [23]. Withoutspecification of the actual fructose content and blend of HFCSused, it is unclear exactly how much actual added fructose iscontained in food and beverage products sweetened with HFCS.Given that we observed F:G ratios in excess of the expectedratio of 55:42 in some HFCS-containing products, it is not ac-curate to consider HFCS-55 nutritionally identical to sucrose,
Table 1Formulas
1. TSActual/100 g sample % S " L " M " G " F " GAL2. % TS in sample % (X g sugar O TSActual/100 g sample)*1003. TSActual/serving size % TSActual/100 g O (100 / X g/s)4. Amount individual sugars per serving % X g/100 g O (100 OX g/s)5. Grams G from disaccharide % g M " (0.5* g/L)6. F:GRaw % [F grams O (F grams " G grams)]* 1007. F:GAdjusted % [F grams O (F grams " G grams " grams G from
disaccharide)]* 100
F, fructose; G, glucose; GAL, galactose; L, lactose; M, maltose; S, sucrose; TS, totalsugar
* Sugar calculations (based on lab results provided in g/100 g sample format).
R. W. Walker et al. / Nutrition xxx (2014) 1–8 3
Please cite this article in press as: Walker RW, et al., Fructose content in popular beverages made with and without high-fructose corn...,Nutrition (2014), http://dx.doi.org/10.1016/j.nut.2014.04.003
234
235
236
237
238
239
240
241
242
243
244
245
246
247
248
249
250
251
252
253
254
255
256
257
258
259
260
261
262
263
264
265
266
267
268
269
270
271
272
273
274
275
276
277
278
279
280
281
282
283
284
285
286
287
288
289
290
291
292
293
294
295
296
297
298
299
300
301
302
303
304
305
306
307
308
309
310
311
312
313
314
315
316
317
318
319
320
321
322
323
324
325
326
327
328
329
330
331
332
333
334
335
336
337
338
339
340
341
342
343
344
345
346
347
348
349
350
351
352
353
354
355
356
357
358
359
360
361
NUT9278_proof ! 21 May 2014 ! 3/8
ryanwalker
ryanwalker
ryanwalker
ryanwalker
ryanwalker
ryanwalker
ryanwalker
ryanwalker
ryanwalker
ryanwalker
ryanwalker
ryanwalker
ryanwalker
ryanwalker
ryanwalker
which has equal amounts of fructose and glucose [27]. Thesefindings represent a critical public health message. Higherlevels of fructose consistently have been shown to contribute tometabolic abnormalities [28], yet the current information from
HFCS producers suggests that HFCS is only marginally differentthan sucrose in terms of the F:G ratio.
Sugars not listed on the nutrition labels were detected inseveral of the SSBs analyzed. For example, Mexican Coca Cola
Fig. 1. Mean sugar comparison of sodas across three independent methods. (A) Percent of total sugar shown to be free fructose in soda/sports drink products. Dashed linerepresents 55% fructose expected of HFCS-55. (B) Percent of total sugar shown to be free glucose in soda/sports drink products. Dashed line represents 42% glucose expectedof HFCS-55. Bars represent methodology used to determine sugar profiles: GC, gas chromatography; LC, liquid chromatography; MET, metabolomics. *Products with HFCSlisted as an ingredient on the label.
R. W. Walker et al. / Nutrition xxx (2014) 1–84
Please cite this article in press as: Walker RW, et al., Fructose content in popular beverages made with and without high-fructose corn...,Nutrition (2014), http://dx.doi.org/10.1016/j.nut.2014.04.003
362
363
364
365
366
367
368
369
370
371
372
373
374
375
376
377
378
379
380
381
382
383
384
385
386
387
388
389
390
391
392
393
394
395
396
397
398
399
400
401
402
403
404
405
406
407
408
409
410
411
412
413
414
415
416
417
418
419
420
421
422
423
424
425
426
427
428
429
430
431
432
433
434
435
436
437
438
439
440
441
442
443
444
445
446
447
448
449
450
451
452
453
454
455
456
457
458
459
460
461
462
463
464
465
466
467
468
469
470
471
472
473
474
475
476
477
478
479
480
481
482
483
484
485
486
487
488
489
NUT9278_proof ! 21 May 2014 ! 4/8
ryanwalker
ryanwalker
ryanwalker
ryanwalker
had a high free fructose concentration (51 g/L), despite nosource of free fructose being listed as an ingredient. Similarly,Pepsi, which lists sugar (sucrose) in addition to HFCS as asweetener, contained no sucrose when analyzed by threemethods and had a consistent F:G ratio of 60:40 suggestingthe presence of HFCS. Some of these products may besweetened with hydrolyzed sucrose syrup, or invert sugar,which could conceivably undergo loss of sucrose contentthrough hydrolysis to fructose and glucose monosaccharidesin storage, however, it is unlikely that this would fully explainthe high concentration of free fructose and high F:G ratios inthese products.
In the analysis of juices, we found that the mean fructoseconcentration among all juices was 45.5 g/L, which is
comparable to that of all sodas (50.4 g/L). Minute Maid and JuicyJuice 100% apple juices had the highest F:G ratios. These juiceswere not sweetened with HFCS, but still had a higher fructoseconcentration than most sodas. Many juices not containing HFCSuse fruit juice concentrate as a sweetener, which is the mostcommonly listed sweetener in 100% fruit juice products [13]. It iswell documented that some natural juices may have high fruc-tose contents, in the absence of HFCS, due to natural fruit sugars,however, juice products often are advertised as a healthy alter-native to SSBs. In terms of fructose content, our data suggeststhat certain juice products may contribute to daily fructoseexposure equivalent to, or greater than, that of sodas. Sunny Dand Ocean Spray 100% cranberry juice also had an F:G ratio ofw60, again suggesting 50% more fructose than glucose in these
Fig. 2. Fructose concentration and fructose-to-glucose (F:G) ratio: sodas/sports beverages. Concentration of fructose (g/L) in soda/sports drink products is displayed on theleft y axis (open bars) and the F:GAdjusted is shown on the right y axis (solid bars). *Products with high-fructose corn syrup (HFCS) listed as an ingredient on the label.F:GAdjusted, the F:G ratio adjusted for other detected disaccharides.
Table 2Sugar concentrations of sodas
Soda/sports drinks Serving size FRU GAL GLU LAC MAL SUC TS
g/L g/s g/L g/s g/L g/s g/L g/s g/L g/s g/L g/s g/L g/s
Mountain Dew 591 mL 72.31 42.74 0.00 0.00 48.21 28.49 0.00 0.00 1.05 0.62 0.00 0.00 121.57 71.85Mug Root Beer 335 mL 66.94 22.43 0.00 0.00 46.02 15.42 0.00 0.00 1.05 0.35 0.00 0.00 114.01 38.19Pepsi 591 mL 65.71 38.83 0.00 0.00 43.81 25.89 0.00 0.00 0.00 0.00 0.00 0.00 109.52 64.72Sprite 591 mL 62.52 36.95 0.00 0.00 40.64 24.02 0.00 0.00 1.05 0.62 0.00 0.00 104.20 61.58Coca-Cola 591 mL 62.52 36.95 0.00 0.00 41.68 24.63 0.00 0.00 1.04 0.62 0.00 0.00 105.24 62.20Dr. Pepper 591 mL 61.42 36.30 0.00 0.00 39.56 23.38 0.00 0.00 1.04 0.62 0.00 0.00 102.02 60.29Arizona Iced Tea With Lemon Flavor 240 mL 59.28 14.23 0.00 0.00 39.52 9.48 0.00 0.00 1.04 0.25 0.00 0.00 99.84 23.96Super Chill Cola (SuperValu brand) 240 mL 53.24 12.78 0.00 0.00 59.51 14.28 0.00 0.00 2.09 0.50 0.00 0.00 114.84 27.56Coca-Cola (Mexican)* 335 mL 51.01 17.09 0.00 0.00 47.89 16.04 0.00 0.00 0.00 0.00 12.49 4.18 111.39 37.317-Up 591 mL 45.80 27.07 0.00 0.00 53.09 31.38 0.00 0.00 1.04 0.62 0.00 0.00 99.94 59.06Ginger Ale (caffeine-free) (Walmart Brand) 240 mL 44.63 10.71 0.00 0.00 50.86 12.21 0.00 0.00 1.04 0.25 0.00 0.00 96.53 23.17Pepsi Throwback* 591 mL 41.84 24.73 0.00 0.00 39.75 23.49 0.00 0.00 0.00 0.00 30.33 17.93 111.92 66.15Gatorade Lemon-Lime* 355 mL 23.19 8.23 0.00 0.00 24.58 8.23 0.00 0.00 0.00 0.00 8.70 3.09 55.08 19.55Sierra Mist Natural* 591 mL 7.28 4.30 0.00 0.00 6.24 3.69 0.00 0.00 0.00 0.00 87.36 51.63 100.88 59.62
FRU, fructose; GAL, galactose; GLU, glucose; LAC, lactose; MAL, maltose; SUC, sucrose; TS, total sugar; g/L, grams per liter; g/s, grams per servingSugar concentrations by per serving size and per liter values
* Products not listing high-fructose corn syrup as an ingredient.
R. W. Walker et al. / Nutrition xxx (2014) 1–8 5
Please cite this article in press as: Walker RW, et al., Fructose content in popular beverages made with and without high-fructose corn...,Nutrition (2014), http://dx.doi.org/10.1016/j.nut.2014.04.003
490
491
492
493
494
495
496
497
498
499
500
501
502
503
504
505
506
507
508
509
510
511
512
513
514
515
516
517
518
519
520
521
522
523
524
525
526
527
528
529
530
531
532
533
534
535
536
537
538
539
540
541
542
543
544
545
546
547
548
549
550
551
552
553
554
555
556
557
558
559
560
561
562
563
564
565
566
567
568
569
570
571
572
573
574
575
576
577
578
579
580
581
582
583
584
585
586
587
588
589
590
591
592
593
594
595
596
597
598
599
600
601
602
603
604
605
606
607
608
609
610
611
612
613
614
615
616
617
NUT9278_proof ! 21 May 2014 ! 5/8
ryanwalker
ryanwalker
ryanwalker
products. Although these products likely contain natural fruitsugars (fructose), the overall sugar profiles are strikingly similarto those of SSBs sweetened with HFCS. When total fructoseexposure is considered (free fructose plus fructose from sucrose),juices contained a mean concentration of fructose almostequivalent to that of sodas (51.4 versus 55.7 g/L, respectively).Although sodas are the most consumed source of SSBs in adultsand children, juice consumption has increased in adolescent andminority populations in recent years [29]. Considering largerserving sizes, higher daily consumption rates of juices, and themore common use of fruit juice concentrate or HFCS in these
products, there is likely a higher than expected daily fructoseconsumption in the population from juice products that supportsthe need for further research on the metabolic consequences ofhigh-fructose-containing juice intake.
Taken together, our chemical analyses of sugar content, whichare fundamentally different from current database estimates,indicate that in many cases, SSB and juice products can containupward of 5% to 15% more free fructose than would be expectedbased on the assumed ratio in HFCS-55. Additionally, whenlaboratory-determined sugar values were compared withnutrient data from matched products in the NDSR database, weshow that NDSR values underestimate mean fructose content forSSBs and juices by 22% and 14%, respectively (SupplementaryTables 1 and 2). Many nutritional product databases rely onproduct nutrition labels for nutrient data. Given the ambiguitysurrounding the exact sugar composition of sodas and juices,food producers may not know the exact amount of fructosecontained in the HFCS used. Our findings illustrate the high de-gree of variability between actual sugar content versus productlabel values and nutritional database values for some SSBs andjuices. These data challenge existing estimates of fructose con-tent and suggest that prior population-based studies reportingfructose or HFCS consumption [30–32] likely underestimateactual fructose consumption.
Based on National Health and Nutrition Examination Sur-vey (NHANES) data from 1988 to 1994, mean intake of fruc-tose among children and adults was 54.7 g/d, however,adolescents ages 12–18 y consumed 72.8 g/d [33] of fructose.More recently, 1999–2004 NHANES data showed that youngmales (15–18 y) in the 95th percentile of fructose consump-tion, consume 121 g/d of fructose [33]. This value is twice ashigh than when assessed in 1978 [31] and 10 times higherthan the 6 g/d per-capita value used to determine the safety of
Table 3Sugar profile of sodas
Soda %Fructose
%Glucose
%Sucrose
%Maltose
%Galactose
%Lactose
Dr. Pepper 60.20 38.78 0.00 1.02 0.00 0.00Pepsi 60.00 40.00 0.00 0.00 0.00 0.00Sprite 60.00 39.00 0.00 1.00 0.00 0.00Mountain Dew 59.48 39.66 0.00 0.86 0.00 0.00Coca-Cola 59.41 39.60 0.00 0.99 0.00 0.00Arizona Iced Tea 59.38 39.58 0.00 1.04 0.00 0.00Mug Root Beer 58.72 40.37 0.00 0.92 0.00 0.00Super Chill Cola 46.36 51.82 0.00 1.82 0.00 0.00Walmart Ginger
Ale46.24 52.69 0.00 1.08 0.00 0.00
7-Up 45.83 53.13 0.00 1.04 0.00 0.00Coca-Cola
(Mexican)*45.79 42.99 11.21 0.00 0.00 0.00
GatoradeLemon-Lime*
42.11 42.11 15.79 0.00 0.00 0.00
Pepsi Throwback* 37.38 35.51 27.10 0.00 0.00 0.00Sierra Mist
Natural*7.22 6.19 86.60 0.00 0.00 0.00
Values for each sugar represent percentage of total sugar in product* Products not listing high-fructose corn syrup as an ingredient.
Fig. 3. Fructose concentration and fructose-to-glucose (F:G) ratio: juices. Concentration of fructose (g/L) in juices is displayed on the left y axis (open bars) and the F:GAdjusted
is shown on the right y axis (solid bars). * Products with high-fructose corn syrup listed as an ingredient on the label. F:GAdjusted, the F:G ratio adjusted for other detecteddisaccharides.
R. W. Walker et al. / Nutrition xxx (2014) 1–86
Please cite this article in press as: Walker RW, et al., Fructose content in popular beverages made with and without high-fructose corn...,Nutrition (2014), http://dx.doi.org/10.1016/j.nut.2014.04.003
618
619
620
621
622
623
624
625
626
627
628
629
630
631
632
633
634
635
636
637
638
639
640
641
642
643
644
645
646
647
648
649
650
651
652
653
654
655
656
657
658
659
660
661
662
663
664
665
666
667
668
669
670
671
672
673
674
675
676
677
678
679
680
681
682
683
684
685
686
687
688
689
690
691
692
693
694
695
696
697
698
699
700
701
702
703
704
705
706
707
708
709
710
711
712
713
714
715
716
717
718
719
720
721
722
723
724
725
726
727
728
729
730
731
732
733
734
735
736
737
738
739
740
741
742
743
744
745
NUT9278_proof ! 21 May 2014 ! 6/8
ryanwalker
ryanwalker
ryanwalker
ryanwalker
ryanwalker
consumption in 1976 [34]. Fructose can induce metabolicsyndrome in both animal models and humans [35] and fruc-tose exposure at the levels described here has been shown tobe metabolically deleterious in humans [36–38]. It is plausiblethat additional, unlabeled amounts of fructose contained inSSBs and juices can add up and, in combination with othercommonly consumed high-fructose-containing foods, canlead to fructose intake >100 g/d. Thus, the differentiationbetween specific types of sugars (especially fructose) inpopular beverages, and the accurate quantification of theirpresence, are crucial to informing responsible consumption ofthese products [39] and represent a critical opportunity toaffect public health.
In conclusion, this study supports and strengthens previousfindings regarding the fructose content of SSBs and provides newinformation on the sugar composition and overall fructose
content of commonly consumed SSB and juice products. Theresults support the initial findings [14], suggesting that the mostpopular sodas madewith HFCS as the sole added sweetener havean F:G ratio of 60:40, indicating 50% more fructose than glucoseand a meaningful difference from the equivalent F:G ratioobserved in table sugar (sucrose). The sugars galactose andlactose were not present and maltose was only detected in verysmall amounts in these products. As expected, certain fruit juicescontained fructose, however, some containedmore total fructosethan sodas, oftenwith 50% more fructose than glucose. AlthoughSSBs are a major source of fructose in the diet of Americans, ourresults demonstrate that juice products may contribute sub-stantially to total daily fructose consumption as well. Based onthese findings, current population estimates of fructose con-sumption determined via existing food nutrient data are likelyunderestimated.
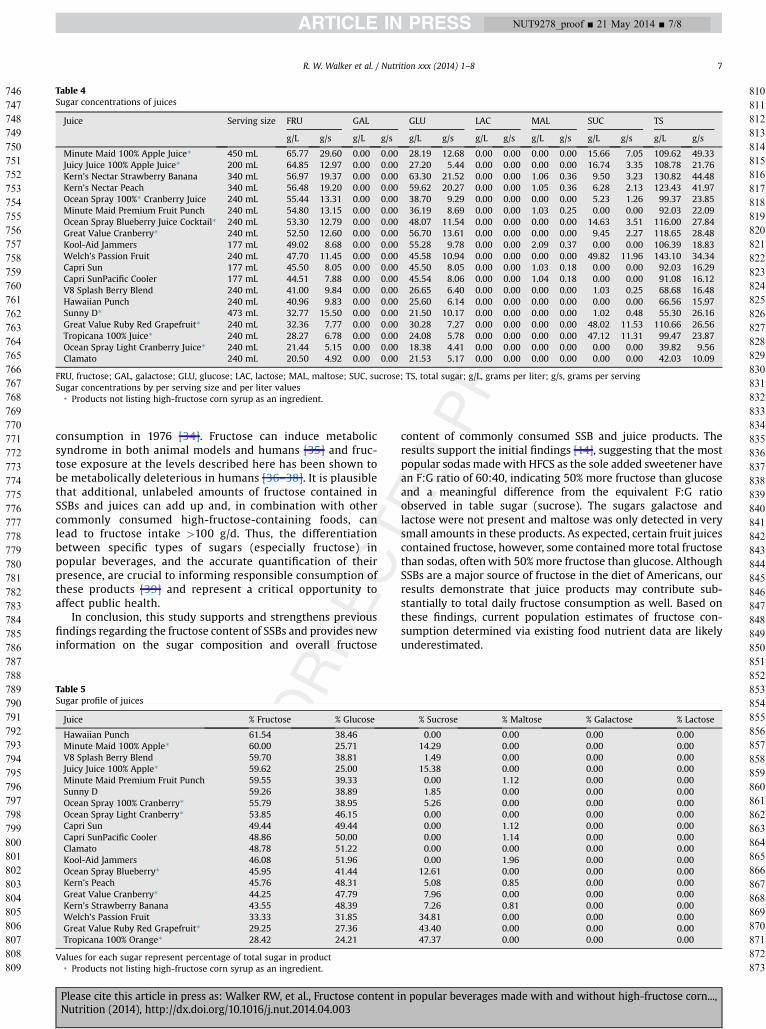
Table 4Sugar concentrations of juices
Juice Serving size FRU GAL GLU LAC MAL SUC TS
g/L g/s g/L g/s g/L g/s g/L g/s g/L g/s g/L g/s g/L g/s
Minute Maid 100% Apple Juice* 450 mL 65.77 29.60 0.00 0.00 28.19 12.68 0.00 0.00 0.00 0.00 15.66 7.05 109.62 49.33Juicy Juice 100% Apple Juice* 200 mL 64.85 12.97 0.00 0.00 27.20 5.44 0.00 0.00 0.00 0.00 16.74 3.35 108.78 21.76Kern’s Nectar Strawberry Banana 340 mL 56.97 19.37 0.00 0.00 63.30 21.52 0.00 0.00 1.06 0.36 9.50 3.23 130.82 44.48Kern’s Nectar Peach 340 mL 56.48 19.20 0.00 0.00 59.62 20.27 0.00 0.00 1.05 0.36 6.28 2.13 123.43 41.97Ocean Spray 100%* Cranberry Juice 240 mL 55.44 13.31 0.00 0.00 38.70 9.29 0.00 0.00 0.00 0.00 5.23 1.26 99.37 23.85Minute Maid Premium Fruit Punch 240 mL 54.80 13.15 0.00 0.00 36.19 8.69 0.00 0.00 1.03 0.25 0.00 0.00 92.03 22.09Ocean Spray Blueberry Juice Cocktail* 240 mL 53.30 12.79 0.00 0.00 48.07 11.54 0.00 0.00 0.00 0.00 14.63 3.51 116.00 27.84Great Value Cranberry* 240 mL 52.50 12.60 0.00 0.00 56.70 13.61 0.00 0.00 0.00 0.00 9.45 2.27 118.65 28.48Kool-Aid Jammers 177 mL 49.02 8.68 0.00 0.00 55.28 9.78 0.00 0.00 2.09 0.37 0.00 0.00 106.39 18.83Welch’s Passion Fruit 240 mL 47.70 11.45 0.00 0.00 45.58 10.94 0.00 0.00 0.00 0.00 49.82 11.96 143.10 34.34Capri Sun 177 mL 45.50 8.05 0.00 0.00 45.50 8.05 0.00 0.00 1.03 0.18 0.00 0.00 92.03 16.29Capri SunPacific Cooler 177 mL 44.51 7.88 0.00 0.00 45.54 8.06 0.00 0.00 1.04 0.18 0.00 0.00 91.08 16.12V8 Splash Berry Blend 240 mL 41.00 9.84 0.00 0.00 26.65 6.40 0.00 0.00 0.00 0.00 1.03 0.25 68.68 16.48Hawaiian Punch 240 mL 40.96 9.83 0.00 0.00 25.60 6.14 0.00 0.00 0.00 0.00 0.00 0.00 66.56 15.97Sunny D* 473 mL 32.77 15.50 0.00 0.00 21.50 10.17 0.00 0.00 0.00 0.00 1.02 0.48 55.30 26.16Great Value Ruby Red Grapefruit* 240 mL 32.36 7.77 0.00 0.00 30.28 7.27 0.00 0.00 0.00 0.00 48.02 11.53 110.66 26.56Tropicana 100% Juice* 240 mL 28.27 6.78 0.00 0.00 24.08 5.78 0.00 0.00 0.00 0.00 47.12 11.31 99.47 23.87Ocean Spray Light Cranberry Juice* 240 mL 21.44 5.15 0.00 0.00 18.38 4.41 0.00 0.00 0.00 0.00 0.00 0.00 39.82 9.56Clamato 240 mL 20.50 4.92 0.00 0.00 21.53 5.17 0.00 0.00 0.00 0.00 0.00 0.00 42.03 10.09
FRU, fructose; GAL, galactose; GLU, glucose; LAC, lactose; MAL, maltose; SUC, sucrose; TS, total sugar; g/L, grams per liter; g/s, grams per servingSugar concentrations by per serving size and per liter values
* Products not listing high-fructose corn syrup as an ingredient.
Table 5Sugar profile of juices
Juice % Fructose % Glucose % Sucrose % Maltose % Galactose % Lactose
Hawaiian Punch 61.54 38.46 0.00 0.00 0.00 0.00Minute Maid 100% Apple* 60.00 25.71 14.29 0.00 0.00 0.00V8 Splash Berry Blend 59.70 38.81 1.49 0.00 0.00 0.00Juicy Juice 100% Apple* 59.62 25.00 15.38 0.00 0.00 0.00Minute Maid Premium Fruit Punch 59.55 39.33 0.00 1.12 0.00 0.00Sunny D 59.26 38.89 1.85 0.00 0.00 0.00Ocean Spray 100% Cranberry* 55.79 38.95 5.26 0.00 0.00 0.00Ocean Spray Light Cranberry* 53.85 46.15 0.00 0.00 0.00 0.00Capri Sun 49.44 49.44 0.00 1.12 0.00 0.00Capri SunPacific Cooler 48.86 50.00 0.00 1.14 0.00 0.00Clamato 48.78 51.22 0.00 0.00 0.00 0.00Kool-Aid Jammers 46.08 51.96 0.00 1.96 0.00 0.00Ocean Spray Blueberry* 45.95 41.44 12.61 0.00 0.00 0.00Kern’s Peach 45.76 48.31 5.08 0.85 0.00 0.00Great Value Cranberry* 44.25 47.79 7.96 0.00 0.00 0.00Kern’s Strawberry Banana 43.55 48.39 7.26 0.81 0.00 0.00Welch’s Passion Fruit 33.33 31.85 34.81 0.00 0.00 0.00Great Value Ruby Red Grapefruit* 29.25 27.36 43.40 0.00 0.00 0.00Tropicana 100% Orange* 28.42 24.21 47.37 0.00 0.00 0.00
Values for each sugar represent percentage of total sugar in product* Products not listing high-fructose corn syrup as an ingredient.
R. W. Walker et al. / Nutrition xxx (2014) 1–8 7
Please cite this article in press as: Walker RW, et al., Fructose content in popular beverages made with and without high-fructose corn...,Nutrition (2014), http://dx.doi.org/10.1016/j.nut.2014.04.003
746
747
748
749
750
751
752
753
754
755
756
757
758
759
760
761
762
763
764
765
766
767
768
769
770
771
772
773
774
775
776
777
778
779
780
781
782
783
784
785
786
787
788
789
790
791
792
793
794
795
796
797
798
799
800
801
802
803
804
805
806
807
808
809
810
811
812
813
814
815
816
817
818
819
820
821
822
823
824
825
826
827
828
829
830
831
832
833
834
835
836
837
838
839
840
841
842
843
844
845
846
847
848
849
850
851
852
853
854
855
856
857
858
859
860
861
862
863
864
865
866
867
868
869
870
871
872
873
NUT9278_proof ! 21 May 2014 ! 7/8
ryanwalker
ryanwalker
ryanwalker
ryanwalker
ryanwalker
Acknowledgments
The authors acknowledge Emily Ventura, Ph.D. for her assis-tance with data collection and analysis.
Supplementary data
Supplementary data related to this article can be found athttp://dx.doi.org/10.1016/j.nut.2014.04.003.
References
[1] Goran MI, Ulijaszek SJ, Ventura EE. High fructose corn syrup and diabetesprevalence: a global perspective. Glob Public Health 2013;8:55–64.
[2] Sugar and Sweeteners Team, Market and Trade Economics, EconomicResearch Service, US Department of Agriculture. US per capita caloricsweeteners estimated deliveries for domestic food and beverage use, bycalendar year. Available at: http://www.ers.usda.gov/briefing/Sugar/data/table50.xls. Accessed.Q4
[3] Johnson RJ, Nakagawa T, Sanchez-Lozada LG, Shaflu M, Sundaram S, Le M,et al. Sugar, uric acid, and the etiology of diabetes and obesity. Diabetes2013;62:3307–15.
[4] Lyssiotis CA, Cantley LC. Metabolic syndrome: F stands for fructose and fat.Nature 2013;502:181–2.
[5] Vos MB, Lavine JE. Dietary fructose in nonalcoholic fatty liver disease.Hepatology 2013;57:2525–31.
[6] Stanhope KL. Role of fructose-containing sugars in the epidemics of obesityand metabolic syndrome. Annu Rev Med 2012;63:329–43.
[7] Basu S, Yoffe P, Hills N, Lustig RH. The relationship of sugar to population-level diabetes prevalence: An econometric analysis of repeated cross-sectional data. PLoS One 2013;8:e57873.
[8] Choi HK, Willett W, Curhan G. Fructose-rich beverages and risk of gout inwomen. JAMA 2010;304:2270–8.
[9] Hobbs L, Kreuger D. Response to “Sugar Content of Popular SweetenedBeverages Based on Objective Laboratory Analysis: Focus on FructoseContent.” Obesity (Silver Spring) 2011;19:687.
[10] Stanhope KL, Schwarz JM, Havel PJ. Adverse metabolic effects of dietaryfructose: Results from the recent epidemiological, clinical, and mechanisticstudies. Curr Opin Lipidol 2013;24:198–206.
[11] InterAct consortium. Consumption of sweet beverages and type 2 diabetesincidence in European adults: results from EPIC-InterAct. Diabetologia2013;56:1520–30.
[12] Page KA, Chan O, Arora J, Belfort-Deaguiar R, Dzuira J, Roehmoldt B, et al.Effects of fructose vs glucose on regional cerebral blood flow in brain re-gions involved with appetite and reward pathways. JAMA 2013;309:63–70.
[13] Ng SW, Slining MM, Popkin BM. Use of caloric and noncaloric sweeteners inUS consumer packaged foods, 2005 to 2009. J Acad Nutr Diet2012;112:1828–34.
[14] Ventura EE, Davis JN, Goran MI. Sugar content of popular sweetened bev-erages based on objective laboratory analysis: Focus on fructose content.Obesity (Silver Spring) 2011;19:868–74.
[15] Sicher J, editor & publisher. Top-10 CSD results for 2010. Beverage Digest2010;59:1–2.
[16] Milburn MV, Lawton KA. Application of metabolomics to diagnosis of in-sulin resistance. Annu Rev Med 2013;64:291–305.
[17] Mason BS, Slover HT. A gas chromatographic method for the determinationof sugars in foods. J Agric Food Chem 1971;19:551–4.
[18] Brosbt K. Gas liquid chromatography of trimethylsilyl derivations. Methodsin carbohydrate chemistry. New York: Academic Press; 1972.
[19] United States Pharmacopeia. Twenty-Sixth Revision, <841>. Rockville,Maryland: United States Pharmacopeial Convention, Inc; 2003.
[20] Sievert Y, Schakel S, Buzzard I. Maintenance of a nutrient database forclinical trials. Control Clin Trials 1989;10:416–25.
[21] Schakel S, Sievert Y, Buzzard M. Sources of data for developing andmaintaining a nutrient database. J Am Diet Assoc 1988;88:1268–71.
[22] Schakel S, Buzzard I, Gebhardt S. Procedures for estimating nutrient valuesfor food composition databases. J Food Comp Anal 1997;10:102–14.
[23] Parker K, Salas M, Nwosu VC. High fructose corn syrup: production, usesand public health concerns. Biotech Mol Biol Rev 2010;5:71–8.
[24] ADM. Cornsweet" 90. Product database. Available at: http://www.adm.com. Accessed May 8, 2013.
[25] Food chemical codex. 4th ed. Washington DC: National Academy Press;1996:191–2.
[26] U.S. Corn Refiners Association. Letter to Division of Dockets and Manage-ment (HFS-305), Food and Drug Administration. Re: Docket No. FDA-2012–P0904. Washington DC; 2013. Letter.
[27] Food and Drug Administration. High fructose corn syrup: questions andanswers. Food additives and ingredients. Available at: http://www.fda.gov/.Accessed April 12, 2013.
[28] Tappy L, Mittendorfer B. Fructose toxicity: is the science ready for publichealth actions? Curr Opin Clin Nutr Metab Care 2012;15:357–61.
[29] Han E, Powell LM. Consumption patterns of sugar-sweetened beverages inthe United States. J Acad Nutr Diet 2013;113:43–53.
[30] Marriott BP, Cole N, Lee E. National estimates of dietary fructose intakeincreased from 1977 to 2004 in the United States. J Nutr 2009;139:1228.S–35.S.
[31] Park YK, Yetley EA. Intakes and food sources of fructose in the UnitedStates. Am J Clin Nutr 1993;58(Suppl):737.S–47.S.
[32] Bray GA, Nielsen SJ, Popkin BM. Consumption of high-fructose corn syrupin beverages may play a role in the epidemic of obesity. Am J Clin Nutr2004;79:537–43.
[33] Vos MB, Kimmons JE, Gillespie C, Welsh J, Blanck HM. Dietary fructoseconsumption among US children and adults: the Third National Health andNutrition Examination Survey. Medscape J Med 2008;10:160.
[34] United States Department of Health and Human Services. Direct foodsubstances affirmed as generally recognized as safe; high fructose cornsyrup [docket no. 85 N-0548, 21 CFR parts 182 and 184]. Federal RegisterVol. 61, No. 165. Available at: www.gpo.gov. Accessed February 12, 2013.
[35] Aydin S, Aksoy A, Aydin S, Kalayci M, Yilmaz M, Kuloglu T, et al. Today’s andyesterday’s of pathophysiology: biochemistry of metabolic syndrome andanimal models. Nutrition 2014;30:1–9.
[36] Livesey G, Taylor R. Fructose consumption and consequences for glyca-tion, plasma triacylglycerol, and body weight: meta-analyses and meta-regression models of intervention studies. Am J Clin Nutr 2008;88:1419–37.
[37] Teff KL, Grudziak J, Townsend RR, Dunn TN, Grant RW, Adams SH, et al.Endocrine and metabolic effects of consuming fructose- and glucose-sweetened beverages with meals in obese men and women: Influence ofinsulin resistance on plasma triglyceride responses. J Clin EndocrinolMetab 2009;94:1562–9.
[38] Hudgins LC, Parker TS, Levine DM, Hellerstein MK. A dual sugar challengetest for lipogenic sensitivity to dietary fructose. J Clin Endocrinol Metab2011;96:861–8.
[39] Food and Drug Administration. Code of Federal Regulations Title 21. DirectFood substances Affirmed as Generally Recognized as Safe. Database ofSelect Committee on GRAS Substances (SCOGS) Reviews. Report no.50, 1979.
R. W. Walker et al. / Nutrition xxx (2014) 1–88
Please cite this article in press as: Walker RW, et al., Fructose content in popular beverages made with and without high-fructose corn...,Nutrition (2014), http://dx.doi.org/10.1016/j.nut.2014.04.003
874
875
876
877
878
879
880
881
882
883
884
885
886
887
888
889
890
891
892
893
894
895
896
897
898
899
900
901
902
903
904
905
906
907
908
909
910
911
912
913
914
915
916
917
918
919
920
921
922
923
924
925
926
927
928
929
930
931
932
933
934
935
936
937
938
939
940
941
942
943
944
945
946
947
948
949
950
951
952
953
954
955
956
957
958
959
960
961
962
963
964
965
966
967
968
969
NUT9278_proof ! 21 May 2014 ! 8/8
ryanwalker
ryanwalker
ryanwalker
ryanwalker
ryanwalker
ryanwalker
ryanwalker
ryanwalker
ryanwalker
ryanwalker
ryanwalker
ryanwalker
ryanwalker
ryanwalker
ryanwalker
ryanwalker
ryanwalker
ryanwalker
ryanwalker
ryanwalker
ryanwalker
ryanwalker
ryanwalker
ryanwalker
ryanwalker
ryanwalker
ryanwalker
ryanwalker
ryanwalker
ryanwalker
ryanwalker
Our reference: NUT 9278 P-authorquery-v9
AUTHOR QUERY FORM
Journal: NUT
Article Number: 9278
Please e-mail or fax your responses and any corrections to:
E-mail: [email protected]
Fax: +91 44 4596 4899
Dear Author,
Please check your proof carefully and mark all corrections at the appropriate place in the proof (e.g., by using on-screenannotation in the PDF file) or compile them in a separate list. Note: if you opt to annotate the file with software other thanAdobe Reader then please also highlight the appropriate place in the PDF file. To ensure fast publication of your paper pleasereturn your corrections within 48 hours.
For correction or revision of any artwork, please consult http://www.elsevier.com/artworkinstructions.
Any queries or remarks that have arisen during the processing of your manuscript are listed below and highlighted by flags inthe proof.
Locationin article
Query / Remark: Click on the Q link to find the query’s location in textPlease insert your reply or correction at the corresponding line in the proof
If there are any drug dosages in your article, please verify them and indicate that you have done so byinitialing this query
Q1 ‘NIH’ has been changed to a standard format ‘National Institutes of Health’ for identification purposes.Please check and amend if necessary.
Q2 One or more sponsor names may have been edited to a standard format that enables better searching andidentification of your article. Please check and correct if necessary: 1) National Institutes of Health, UnitedStates.
Q3 Please spell out MET on first use.
Q4 For all links, please include the month/day/year on which you accessed the link
Q5 Please provide city name for the affiliation “a”
Q6 Please confirm that given names and surnames have been identified correctly.
Please check this box or indicateyour approval if you have nocorrections to make to the PDF file ,
Thank you for your assistance.