
FRS for SMEs - Illustrative Financial Statements for SMEs - Illustrative... · ·...
78
Copyright © 2011. All rights reserved. AXP Solutions Sdn. Bhd. Printed in Malaysia A publication of AXP Technical Support Unit Knowledge . Create . Value MASB ED 72 FRS for SMEs Illustrative Financial Statements 2011 edition
Transcript of FRS for SMEs - Illustrative Financial Statements for SMEs - Illustrative... · ·...
Copyright © 2011. All rights reserved. AXP Solutions Sdn. Bhd. Printed in Malaysia
A publication of AXP Technical Support Unit
AXP Solutions Sdn. Bhd. (Co. no. 693866-X)A-3-03 & 05, SME Technopreneur Centre 2 Cyberjaya 2260, Jln Usahawan 163000 Cyberjaya, Selangor, MalaysiaTel: +60 3 8318 8297Fax: +60 3 8318 9297E-mail: [email protected]
Malaysia . Singapore . Hong Kong
MASB ED 72 FRS for SMEs Illustrative Financial Statements - 2011 edition
Knowledge . Create . Value
Knowledge . Create . Value
MASB ED 72 FRS for SMEs Illustrative Financial Statements2011 edition

i
FOREWORD Since 2007, AXP has issued several sets of Model Financial Statements for Malaysia, Singapore and Hong Kong markets that conform to local reporting standards and received encouraging responses from customers and other Audit Practitioners. As part of our mission to assist audit practitioners to resolve contemporary issues, we have prepared the Illustrative Financial Statements for FRS for SMEs 2011 (“IFS for FRS for SMEs 2011”) aiming to assist our existing clients and other audit practitioners to audit, and companies to prepare, financial statements that are in compliance with the prevailing financial reporting and disclosure requirements of the EXPOSURE DRAFT 72 Financial Reporting Standard for Small and Medium-sized Entities (“FRS For SMEs”). In addition to this IFS for FRS for SMEs 2011, AXP has also prepared the Illustrative Financial Statements for: 1. Malaysia Financial Reporting Standards 2010 (FRS 2010) 2. Malaysia Private Entity Reporting Standards 2009 (PERS 2009) [English and Malay versions] 3. International Financial Reporting Standard for Small and Medium-sized Entities (IFRS for SMEs) 4. Singapore Financial Reporting Standard for Small Entities (SFRS for Small Entities) 5. Hong Kong Financial Reporting Standard for Private Entities (HKFRS for Private Entities) [English and Chinese
versions] 6. Hong Kong Small and Medium-sized Entity Financial Reporting Standard (SME-FRS) [English and Chinese
versions]
ABOUT OUR IFS FOR FRS FOR SMES 2011 Our IFS for FRS for SMEs 2011 provides various alternative presentation and disclosure requirements for the FRS for SMEs’ Sections indicated in the scope below. Our IFS for FRS for SMEs 2011 is based on the financial statements of a hypothetic group of companies, called Illustrative Group Sdn. Bhd. and its subsidiaries, for the financial year ending 31 December 2011. We trust that you will find our IFS for FRS for SMEs 2011 a useful reference point when you are auditing or preparing 2011 financial statements. While every effort has been made to ensure that our IFS for FRS for SMEs 2011 demonstrates all the possible disclosure and presentation requirements of the FRS for SMEs, it should not be used as a substitute for the laws, regulations and existing body of FRS. However, should you have any questions on the application of any of the statutory and financial reporting requirements not presented in our IFS for FRS for SMEs 2011, you are welcomed to contact our Technical Support Unit for assistance.
REFERENCES IN OUR IFS FOR FRS FOR SMES 2011 To the left of each disclosure and presentation item, requirements under the FRS for SMEs are shown with “FRS”. Where there are alternative applications allowed under the FRS for SMEs, we have also presented the alternative disclosures throughout our IFS for FRS for SMEs 2011 for your reference.
SCOPE OF OUR IFS FOR FRS FOR SMES 2011 Our IFS for FRS for SMEs 2011 covers the following sections in the FRS for SMEs issued in 2010: Sections
Descriptions
1 Small and Medium-sized Entities 2 Concepts and Pervasive Principles 3 Financial Statement Presentation 4 Statement of Financial Position

ii
Sections
Descriptions
5 Statement of Comprehensive Income and Income Statement 6 Statement of Changes in Equity and Statement of Income and Retained Earnings 7 Statement of Cash Flows 8 Notes to the Financial Statements 9 Consolidated and Separate Financial Statements 10 Accounting Policies, Estimates and Errors 11 Basic Financial Instruments 13 Inventories 14 Investments in Associates 15 Investments in Joint Ventures 16 Investment Property 17 Property, Plant and Equipment 18 Intangible Assets other than Goodwill 19 Business Combinations and Goodwill 20 Leases 21 Provisions and Contingencies 22 Liabilities and Equity 23 Revenue 24 Government Grants 25 Borrowing Costs 26 Share-Based Payment 27 Impairment of Assets 28 Employee Benefits 29 Income Tax 30 Foreign Currency Translation 32 Events After the End of the Reporting Period 33 Related Party Disclosures 34 Specialised Activities (for agriculture and service concession arrangements) 35 Transition to the FRS for SMEs However, our IFS for FRS for SMEs 2011 does not include the disclosure and presentation requirements of: Sections Descriptions
12 Other Financial Instruments Issues 31 Hyperinflation 34 Specialised Activities (for extractive activities) AXP has exercised professional due care and diligence in the preparation of our IFS for FRS for SMEs 2011. However, the information contained herein is intended to be a general guide. While every effort has been made to ensure accuracy, no liability is accepted by AXP or any member of AXP on any grounds whatsoever to any party in respect of any errors or omissions, or any action or omission to act as a result of the information contained in our IFS for FRS for SMEs 2011.
ABOUT AXP AXP was formed in 2005 by a team of qualified accountants with years of extensive experience in both the public practice and commercial sector. Through extensive research and development since 2001 under both its predecessor and AXP, we have successfully developed in-house a wide range of IT tools and solutions for audit practitioners. Besides being able to optimise the business value of IT in the audit practice, our products also possess enhanced features and updates that are in full compliance with the requirements of the prevailing FRS. For more information on AXP, please visit us at www.myAXP.com or contact us at [email protected].
iii
ABOUT THE EDITORIAL TEAM The editorial team consists of both AXP’s Technical Adviser and Business Partners, who jointly possess a wealth of experience in financial reporting and wide exposure to the accounting industry in general. The profile of each team member is as follows: Keith Farmer, FCA, B.A., Technical Adviser of AXP, holds an honours degree in Economics and became a Fellow of the Institute Chartered of Accountants in England and Wales (“ICAEW”) in January 1983. He taught in London at the London School of Accountancy and Emile Woolf College and at the University of Essex until he came to Asia in early 1994. He has been based in Asia ever since.
His specialist subject is Financial Accounting. He has conducted courses for both students and practitioners in many parts of the world, including the UK, Malaysia, Singapore, Hong Kong, Kenya, and Mauritius for both private colleges and the Association of Chartered Certified Accountants (“ACCA”). His students have consistently won numerous prizes in the ACCA examinations.
Whilst Keith is justifiably proud of individual student performance, his key aim is to convey a fundamental understanding of the basic principles and concepts which underlie financial accounting and a detailed knowledge and application of the requirements of accounting standards. This is based on the three core principles of education: instruction, demonstration and experience. Understanding is important, in fact it is a prerequisite to developing the level of knowledge required to sit examinations with confidence and inspires individuals to achieve far more than they ever expected in far less time than they ever anticipated.
In furtherance of achieving his aim, Keith has recently embarked upon a three point strategy. Firstly, he is writing a series of books, primarily aimed at students, covering consolidation and accounting standards which contain numerous progressive worked examples. Secondly, he is currently engaged in developing a series of DVD's which, together with the books, will form an integral part of a new co-ordinated learning package. Finally, in the near future, this learning package will be extended to a structured continuing professional development programme. Ivan Er Soon Lock, C.A.(M), FCCA, B.Com(NZ), is a member of the Malaysian Institute of Accountants (“MIA”) and a fellow member of ACCA. Ivan first joined Deloitte in 1997 as an Audit Assistant, and subsequently became an Audit Manager. He left Deloitte in 2003 to join Horwath, another international public practice. At Horwath, he was soon promoted to become an Audit Principal. In 2005, he left Horwath to join AXP.
His experience includes managing the audit and the corporate finance functions and the setting up of the business improvement division of the practice, assisting companies listing on the stock exchange by providing consultancy services on listing exercise and financial management, advising on good accounting and internal control systems to a wide range of companies, provision of technical training on financial reporting standards and conducting due-diligence review on companies in Malaysia and China. Currently, he is involved in conducting financial reporting courses for internal and external parties. Eric Chia Kok Haur, C.A.(M), C.A.(NZ), B.Com(Hons), is a member of the MIA and New Zealand Institute of Chartered Accountants (“NZICA”). Eric started his career as an Audit Assistant with Deloitte in 1997. He was an Assistant Audit Manager when he left the firm to join KPMG Singapore in 2000. He was also an Assistant Audit Manager at KPMG, where he served until 2003. From KPMG, he moved on to H W Kuah & Co., another public practice in Singapore, as the Audit Manager. In 2005, he left H W Kuah & Co. to join AXP.
Eric is well-versed with the financial reporting environment of both Malaysia and Singapore. In addition, as he has spearheaded major audit assignments in China, he is also familiar with China financial reporting requirements. His experience includes managing audit and due diligence assignments, monitoring the budgetary function of the practice, provision of advisory services for corporate exercises and corporate governance matters, preparation and review of published financial statements, including those of significantly large groups of companies, and conducting training on technical subjects.

iv
Kua Le Ting, C.A.(M), FCCA, is a member of the MIA and a fellow member of ACCA. Ms. Kua joined Deloitte in 1995 as an audit assistant and was soon promoted to become an audit senior. She was in-charge of the managing and supervising of audit engagements ranging from small to big multinational companies. To further enhance her experience, she then joined the tax department of Deloitte, where she was involved in tax planning and consultancy services, in addition to preparing tax returns for both corporate and individual clients. She left the public practice in 1999 to set up her own consultancy business, LT Kua Consultation Services, specialising in personal financial planning and risk management planning. In addition, Ms. Kua is also involved in the preparation of various study materials for professional courses used in institutions of higher learning. Vicky Chuar Xin Peng, B.Com.(Hons), graduated in May 2007 and soon started her career in CPA Group as an Audit Assistant. Then she moved on to join BDO Binder while pursuing her study for the ACCA qualification, professional level. She was a Senior Associate when she left BDO Binder to join AXP in 2010 as Consultant (Customer support and technical research).
CONTACT US AXP Technical Support Unit Southern Malaysia 83A, Jalan Emas Satu, Taman Sri Skudai, 81300 Johor Bahru, Johor, Malaysia. Tel: 1300.882.297 or 607.557.5722 Fax: 607.557.7697 Central Malaysia A-3-03 & A-3-05, SME Technopreneur Centre 2 Cyberjaya, 2260, Jalan Usahawan 1, 63000 Cyberjaya, Selangor, Malaysia. Tel: 1300.882.297 or 603.8318.8297 Fax: 603.8318.9297 Singapore Blk 5000, Ang Mo Kio Ave 5, #03-09, TechPlace II, Singapore 569870. Tel: 65.6876.7297 Fax: 65.6853.1965 Hong Kong Suites 1201-4, 12/F, Tower 2, The Gateway, 25-27 Canton Road, Tsim Sha Tsui, Kowloon, Hong Kong
香港九龍尖沙咀廣東道 25-27號 港威大廈 2座 12樓 1201-4室 Tel: 852.2133.9127 Fax: 800.905.397
sssuuuppppppooorrrttt@@@mmmyyyAAAXXXPPP...cccooommm
Copyright © 2007 - 2011. All rights reserved. AXP Solutions Sdn. Bhd. No part of this publication may be reproduced, stored in a retrieval system, or transmitted in any form or by any means, electronic, mechanical, photocopying, recording, scanning, or otherwise without the prior written permission of AXP. However, written permission need not be obtained from AXP if it is used internally within the Firm.

FRS Ref. 3.23(a)
3.23(b)
ILLUSTRATIVE GROUP SDN. BHD. (Company No. 200212345A) (Incorporated in Malaysia) AND ITS SUBSIDIARIES
v
TABLE OF CONTENTS
Page No.
Report of the Directors 1 – 5
Statement by the Directors 6
Statutory Declaration 6
Independent Auditors’ Report 7 – 8
Financial Statements 1
Statements of Financial Position 9 – 10
Statements of Comprehensive Income – Expenses Classified by Function 11
Alternative presentation formats for Total Comprehensive Income – in one statement -
Statements of Comprehensive Income – Expenses Classified by Nature 12
Alternative presentation formats for Total Comprehensive Income – in two statements -
Income Statements – Expenses Classified by Function 13
Statements of Comprehensive Income 14
Statements of Changes in Equity 15 – 16
Statements of Income and Retained Earnings 2 Statements of Income and Retained Earnings - Expenses classified by Function 17 Statements of Income and Retained Earnings - Expenses classified by Nature 18 - 19
Statements of Cash Flows – Indirect Method 20 – 21
Alternative presentation formats for Statements of Cash Flows ~
Statements of Cash Flows – Direct Method 22
Notes to the Financial Statements
1 General Information 23
2 Significant Accounting Policies 24 – 36
3 Transition to the FRS for SMEs 36 – 37
4 Critical Accounting Judgements and Key Sources of Estimation Uncertainty 37 – 38
5 Property, Plant and Equipment 39 – 40
6 Investment Property 41
7 Goodwill 41
8 Other Intangible Assets 42
9 Subsidiaries 43
10 Investment in Associates 43
11 Investment in Jointly Controlled Entities 44
12 Other Financial Assets 44 – 45
13 Deferred Tax Assets / Liabilities 45 – 48
14 Biological Assets Carried at Fair Value through Profit or Loss 48

FRS Ref. 3.23(a)
3.23(b)
ILLUSTRATIVE GROUP SDN. BHD. (Company No. 200212345A) (Incorporated in Malaysia) AND ITS SUBSIDIARIES
vi
Page No.
15 Inventories 48 – 49
16 Trade and Other Receivables 49
17 Cash and Cash Equivalents 49 – 50
18 Share Capital 50 – 51
19 Share Premium 51
20 Treasury Shares 51 – 52
21 Premium for Option on Irredeemable Convertible Unsecured Loan Stocks 52 22 Property Revaluation Surplus 52 23 Translation Reserves 52 24 Equity-Settled Employee Benefits Reserves 52 25 Retained Earnings 52 – 53 26 Retirement Benefit Obligation 54 – 55
27 Provisions 55 – 56
28 Finance Lease Payables 56
29 Bank Overdrafts and Other Borrowings 57 – 58
30 Other Financial Liabilities 59
31 Trade and Other Payables 59
32 Deferred Revenue 59 – 60
33 Equity-Settled Share-Based Payments 60 – 61
34 Revenue 61
35 Profit Before Tax 62 – 63
36 Tax Expense 64
37 Dividends 64
38 Acquisition of A Subsidiary 64 – 65
39 Disposal of A Subsidiary 65 – 66
40 Purchases of Property, Plant and Equipment 66
41 Binding Sales Agreement 66 – 67
42 Related Party Transactions 67 – 68
43 Commitments 68 – 69
44 Contingent Liabilities 69
45 Reclassifications of Comparative Figures 69 – 70
46 Events after the Reporting Period 70
47 Authorisation for Issue of the Financial Statements 70
Additional Notes:
Change of the End of the Reporting Period 70
Presentation of First Set of Financial Statements 70
Presentation of First Set of Group Financial Statements 70
* Notes on the presentation of financial statements: 1. In accordance with: Section 3.21: In a complete set of financial statements, an entity shall present each financial statement with equal
prominence. Section 3.22: An entity may use titles for the financial statements other than those used in the FRS for SMEs as long
as they are not misleading. Section 9.25: In this illustrative financial statements, the entity elects to present separate financial statements. 2. These statements are prepared in accordance with Section 3.18 for illustration purpose only and do not form part of the financial statements of Illustrative Group Sdn. Bhd..

FRS Ref. 3.23(a)
3.23(b)
ILLUSTRATIVE GROUP SDN. BHD. (Company No. 200212345A) (Incorporated in Malaysia) AND ITS SUBSIDIARIES
3.23(c)
REPORT OF THE DIRECTORS FOR THE FINANCIAL YEAR ENDED 31 DECEMBER 2011
1
CA Ref. The directors hereby submit their report together with the audited financial statements of the Group
and the Company for the financial year ended 31 December 2011.
169(6)(b) PRINCIPAL ACTIVITIES The principal activities of the Company are that of investment holding and provision of
management services to its subsidiaries. The Group is principally engaged in investment holding, research and development, property investment, construction activities, rending of concession services, and agriculture products. There have been no significant changes in the nature of the activities during the financial year.
169(6)(c) RESULTS The Group The Company RM RM Profit for the financial year 7,262,336 166,886 Less: Attributable to non-controlling interest (156,807) -
Profit for the financial year attributable to owners of the parent
7,419,143
166,886
169(6)(p)
In the opinion of the directors, the results of the operations of the Group and the Company during the financial year have not been substantially affected by any item, transaction or event of a material and unusual nature.
169(6)(h) DIVIDENDS On 1 April 2011, the Company paid a 10% final tax exempt dividend (total dividend of RM1,105,020)
in respect of the previous financial year. The net dividend per share was 10 sen. On 31 August 2011, the directors declared a 10% interim tax exempt dividend (total dividend of RM1,132,020) in respect of the current financial year. The dividend was paid to the shareholders registered on 31 October 2011. The net dividend per share was 10 sen. The directors have proposed a 10% final tax exempt dividend in respect of the current financial year. The dividend is subject to approval by the shareholders at the forthcoming Annual General Meeting and has not been included as a liability in the financial statements. Total dividend payable is RM1,122,020 (dividend for treasury shares is not included), and the net dividend per share is 10 sen.
If the Company did not declare dividends: No dividends have been paid or declared since the end of the previous financial year. The directors
do not recommend that a dividend to be paid in respect of the current financial year. 169(6)(d) RESERVES AND PROVISIONS There were no material transfers to or from reserves or provisions except as disclosed in the financial
statements.
169(6)(e) SHARES AND DEBENTURES During the financial year, the authorised ordinary share capital of the Company has been increased
by 10,000,000 ordinary shares to 50,000,000 ordinary shares of RM1.00 each.

FRS Ref. 3.23(a)
3.23(b)
ILLUSTRATIVE GROUP SDN. BHD. (Company No. 200212345A) (Incorporated in Malaysia) AND ITS SUBSIDIARIES
3.23(c)
REPORT OF THE DIRECTORS FOR THE FINANCIAL YEAR ENDED 31 DECEMBER 2011
2
CA Ref. During the financial year, the Company has issued the following ordinary shares:
Date of Issue No. of Shares Issued Issue Price Purposes 1 June 2011 250,000 RM4.00 Part finance the acquisition of a subsidiary 6 June 2011 20,000 RM2.70 Exercise of ESOS The new ordinary shares issued rank pari passu in respect of the distribution of dividends and
repayment of capital with the existing ordinary shares. Details of the debentures issued during the financial year are set out in Note 29 and 30.
If the Company did not issue any new shares or debentures: The Company did not issue any new shares or debentures during the financial year.
169(11), (12)
EMPLOYEES’ SHARE OPTION SCHEME The Company has an Employees’ Share Option Scheme (‘ESOS’), which was approved at the Extraordinary General Meeting on 31 October 2006 by its shareholders, for all the eligible employees of the Group.
The details of the ESOS are contained in the By-Laws and the salient features of ESOS are disclosed in Note 33 to the Financial Statements.
The Company has obtained approval from the Companies Commission of Malaysia for the exemption from disclosing the name of the option holders as at 31 December 2011.
No. of ordinary shares of RM1 each covered under options
Grant Date
Option Price At
1.1.2011
Granted
Exercised At
31.12.2011 1 January 2007 2.70 25,000 - (20,000) 5,000 1 January 2010 3.60 30,000 - - 30,000 1 January 2011 4.50 - 60,000 - 60,000
55,000
60,000
(20,000,)
95,000
If the Company did not have any share options: 169(11), (12)
SHARE OPTIONS No options have been granted by the Company to any parties during the financial year to take up unissued shares of the Company. No shares have been issued during the financial year by virtue of the exercise of any option to take up unissued shares of the Company. At the end of the financial year, there were no unissued shares of the Company under options.

FRS Ref. 3.23(a)
3.23(b)
ILLUSTRATIVE GROUP SDN. BHD. (Company No. 200212345A) (Incorporated in Malaysia) AND ITS SUBSIDIARIES
3.23(c)
REPORT OF THE DIRECTORS FOR THE FINANCIAL YEAR ENDED 31 DECEMBER 2011
3
169(6)(a) DIRECTORS The directors who held office since the date of the last report are:
Ser L. T. Lian K. K. Mohd. bin R. Z. Gi J. Q. Ran H. P. Hija bin B. T. Yan D. V. Wen M. X. The L. P. (Appointed on 1 July 2011)
DIRECTORS’ BENEFITS 169(6)(f)
169(8)
During and at the end of the financial year, no arrangements subsisted to which the Company or its subsidiaries is a party, with the object or objects of enabling directors of the Company to acquire benefits by means of the acquisition of shares in, or debentures of, the Company or any other body corporate. Since the end of the previous financial year, no director has received or become entitled to receive a benefit (other than a benefit included in the aggregate amount of emoluments received or due and receivable by the directors shown in the financial statements or the fixed salary of a full-time employee of the Company) by reason of a contract made by the Company or a related corporation with the director or with a firm of which the director is a member, or with a company in which the director has a substantial financial interest.
169(6)(g) DIRECTORS’ INTERESTS According to the register of directors’ shareholding, the interests of directors in office at the end of
the financial year in the ordinary shares of the Company and its related corporations during the financial year are as follows:
No. of Ordinary Shares of RM1 each At 1.1.2011
(or date of appointment)
Bought
Sold
At 31.12.2011
Direct Interest in holding company – Be Competent Sdn. Bhd.
Ordinary Shares Ser L. T. 1,000,000 - - 1,000,000 Lian K. K. 600,000 - - 600,000 Mohd. bin R. Z. 400,000 - - 400,000 Gi J. Q. 200,000 - - 200,000 Direct Interest in a subsidiary –
AXP Property Sdn. Bhd.
Ordinary Shares The L. P. 20,000 - (20,000) - Deemed Interest in the Company Ordinary Shares Ser L. T. 7,000,000 500,000 - 7,500,000 Lian K. K. 7,000,000 500,000 - 7,500,000 Mohd. bin R. Z. 7,000,000 500,000 - 7,500,000 The L. P. - 250,000 - 250,000

FRS Ref. 3.23(a)
3.23(b)
ILLUSTRATIVE GROUP SDN. BHD. (Company No. 200212345A) (Incorporated in Malaysia) AND ITS SUBSIDIARIES
3.23(c)
REPORT OF THE DIRECTORS FOR THE FINANCIAL YEAR ENDED 31 DECEMBER 2011
4
No. of Ordinary Shares of RM1 each At 1.1.2011
(or date of appointment)
Bought
Sold
At 31.12.2011 Direct Interest in the Company Ordinary Shares Ser L. T. 4,145 359 - 4,504 Lian K. K. 3,273 458 - 3,731 Mohd. bin R. Z. 40,000 4,000 (2,000) 42,000 Ran H. P. 2,041 1,076 (246) 2,871 Hija bin B. T. 50,010 6,781 - 56,791 The L. P. 216,000 100,000 - 316,000 None of the other directors in office at the end of the financial year held any shares in the Company
or in any related corporations during the financial year ended 31 December 2011. By virtue of the abovementioned directors’ interests in the Company, these directors are also deemed to have interests in the subsidiaries of the Company to the extent of the Company’s interests in the subsidiaries.
OTHER STATUTORY INFORMATION 169(6)(i)
169(6)(k)
Before the financial statements of the Group and the Company were made out, the directors took reasonable steps:
(a) to ascertain that proper action had been taken in relation to the writing-off of bad debts and the making of allowance for doubtful debts, and have satisfied themselves that all known bad debts had been written-off and that adequate allowance had been made for doubtful debts; and
(b) to ensure that any current assets which were unlikely to be realised at their book values in the
ordinary course of business have been written down to their estimated realisable values.
169(6)(j)
169(6)(l) (i)
169(6)(l) (ii)
169(6)(o)
As of the date of this report, the directors are not aware of any circumstances:
(a) which would render the amount written off for bad debts or the amount of the allowance for doubtful debts inadequate to any substantial extent in the financial statements of the Group and the Company; or
(b) which would render the values attributed to current assets in the financial statements of the
Group and the Company misleading; or (c) which have arisen which render adherence to the existing method of valuation of assets or
liabilities of the Group and the Company misleading or inappropriate; or (d) not otherwise dealt with in this report or financial statements which would render any
amount stated in the financial statements of the Group and the Company misleading. 169(6)(m)
As of the date of this report, there does not exist: (a) any charge on the assets of the Group and the Company which has arisen since the end of the
financial year and secures the liability of any other person; or (b) any contingent liability of the Group and the Company which has arisen since the end of the
financial year.
FRS Ref. 3.23(a)
3.23(b)
ILLUSTRATIVE GROUP SDN. BHD. (Company No. 200212345A) (Incorporated in Malaysia) AND ITS SUBSIDIARIES
3.23(c)
REPORT OF THE DIRECTORS FOR THE FINANCIAL YEAR ENDED 31 DECEMBER 2011
5
169(6)(n)
No contingent or other liability has become enforceable, or is likely to become enforceable within the period of twelve months after the end of the financial year which, in the opinion of the directors, will or may substantially affect the ability of the Group and the Company to meet its obligations as and when they fall due.
169(6)(q)
In the opinion of the directors, no item, transaction or event of a material and unusual nature has arisen in the interval between the end of the financial year and the date of this report which is likely to affect substantially the results of operations of the Group and the Company for the succeeding financial year.
169(10) HOLDING COMPANY The Company is a subsidiary of Be Competent Sdn. Bhd., a company incorporated in Malaysia,
which is also regarded by the directors as the ultimate holding company.
AUDITORS The retiring auditors, Messrs. Auditors & Co., have indicated their willingness to be re-appointed in
accordance with Section 172(2) of the Companies Act, 1965.
Signed on behalf of the Board in accordance with a resolution of the directors,
Ser L T
Ser L. T.
Lian K K
Lian K. K. Kuala Lumpur
31 January 2012

FRS Ref. 3.23(a)
3.23(b)
ILLUSTRATIVE GROUP SDN. BHD. (Company No. 200212345A) (Incorporated in Malaysia) AND ITS SUBSIDIARIES
6
CA169 (15)
STATEMENT BY THE DIRECTORS Pursuant to Section 169 (15) of the Companies Act, 1965
The directors of Illustrative Group Sdn. Bhd. state that, in their opinion, the financial statements set out in pages 9 to 70 are drawn up in accordance with the provisions of the Companies Act, 1965 and the Financial Reporting Standard for Small and Medium-sized Entities so as to give a true and fair view of the state of affairs of the Group and the Company as at 31 December 2011 and of the results of their businesses and the cash flows of the Group and the Company for the financial year ended on that date.
Signed on behalf of the Board of Directors in accordance with a resolution of the directors,
Ser L T
Ser L. T.
Lian K K
Lian K. K. Kuala Lumpur
31 January 2012 CA169 (16)
STATUTORY DECLARATION Pursuant to Section 169 (16) of the Companies Act, 1965
I, Gi J. Q., the director primarily responsible for the financial management of Illustrative Group Sdn. Bhd., do solemnly and sincerely declare that the financial statements set out in page 9 to 70 are, in my opinion, correct and I make this solemn declaration conscientiously believing the same to be true, and by virtue of the provisions of the Statutory Declarations Act, 1960.
Subscribed and solemnly declared by )
the above named Gi J. Q. at ) Gi J Q
KUALA LUMPUR on 31 January 2012 ) Before me,
Commissioner for Oaths
__________________________________ COMMISSIONER FOR OATHS

7
Auditors & Co. Chartered Accountants
ISA c700 INDEPENDENT AUDITORS’ REPORT TO THE MEMBERS OF
ILLUSTRATIVE GROUP SDN. BHD. (Company No.: 200212345A) (Incorporated in Malaysia)
Report on the Financial Statements
We have audited the financial statements of Illustrative Group Sdn. Bhd., which comprise the statements of financial position of the Group and the Company as at 31 December 2011, and the statements of comprehensive income, changes in equity and cash flows of the Group and the Company for the financial year then ended, and a summary of significant accounting policies and other explanatory information, as set out on pages 9 to 70.
Director’s Responsibility for the Financial Statements
The directors of the Company are responsible for the preparation of the financial statements that give a true and fair view in accordance with Financial Reporting Standard for Small and Medium-sized Entities and the Companies Act, 1965 in Malaysia, and for such internal control as directors determine are necessary to enable the preparation of financial statements that are free from material misstatement, whether due to fraud or error.
Auditors’ Responsibility
Our responsibility is to express an opinion on these financial statements based on our audit. We conducted our audit in accordance with approved standards on auditing in Malaysia. Those standards require that we comply with ethical requirements and plan and perform the audit to obtain reasonable assurance about whether the financial statements are free from material misstatement.
An audit involves performing procedures to obtain audit evidence about the amounts and disclosures in the financial statements. The procedures selected depend on the auditor’s judgment, including the assessment of the risks of material misstatement of the financial statements, whether due to fraud or error. In making those risk assessments, we consider internal control relevant to the entity’s preparation of financial statements that give a true and fair view in order to design audit procedures that are appropriate in the circumstances, but not for the purpose of expressing an opinion on the effectiveness of the entity’s internal control. An audit also includes evaluating the appropriateness of accounting policies used and the reasonableness of accounting estimates made by the directors, as well as evaluating the overall presentation of the financial statements.
We believe that the audit evidence we have obtained is sufficient and appropriate to provide a basis for our audit opinion.
8
Auditors & Co. Chartered Accountants
ISA 700
INDEPENDENT AUDITORS’ REPORT TO THE MEMBERS OF ILLUSTRATIVE GROUP SDN. BHD. (Company No.: 200212345A) – Cont’d (Incorporated in Malaysia)
174(2)(a)
174(2)(b)
174(2)(c)(ii)
174(2)(c)(iii) 174(2)(c)(iv)
Opinion
In our opinion, the financial statements have been properly drawn up in accordance with Financial Reporting Standard for Small and Medium-sized Entities and the Companies Act, 1965 in Malaysia so as to give a true and fair view of the financial position of the Group and the Company as at 31 December 2011 and of their financial performance and cash flows for the financial year then ended.
Report on Other Legal and Regulatory Requirements
In accordance with the requirements of the Companies Act, 1965 in Malaysia, we also report the following:
(a) In our opinion, the accounting and other records and the registers required by the Act to be kept by the Company and its subsidiaries have been properly kept in accordance with the provisions of the Act.
(b) We have considered the financial statements and the auditors’ reports of all the subsidiaries of which we have not acted as auditors, which are indicated in Note 9 to the Financial Statements.
(c) We are satisfied that the financial statements of the subsidiaries that have been consolidated with the Company’s financial statements are in form and content appropriate and proper for the purposes of the preparation of the financial statements of the Group and we have received satisfactory information and explanations required by us for those purposes.
(d) The audit reports on the financial statements of the subsidiaries did not contain any qualification or any adverse comment made under Section 174(3) of the Act.
Other Matters
This report is made solely to the members of the Company, as a body, in accordance with Section 174 of the Companies Act, 1965 in Malaysia and for no other purpose. We do not assume responsibility to any other person for the content of this report.
Auditors & Co. Hu G E
Auditors & Co.
(AF – 99999)
Chartered Accountants
Kuala Lumpur
31 January 2012
Hu G. E.
No. 9999/88/12 (J)
Partner of the Firm
The accompanying notes form an integral part of the financial statements.
9
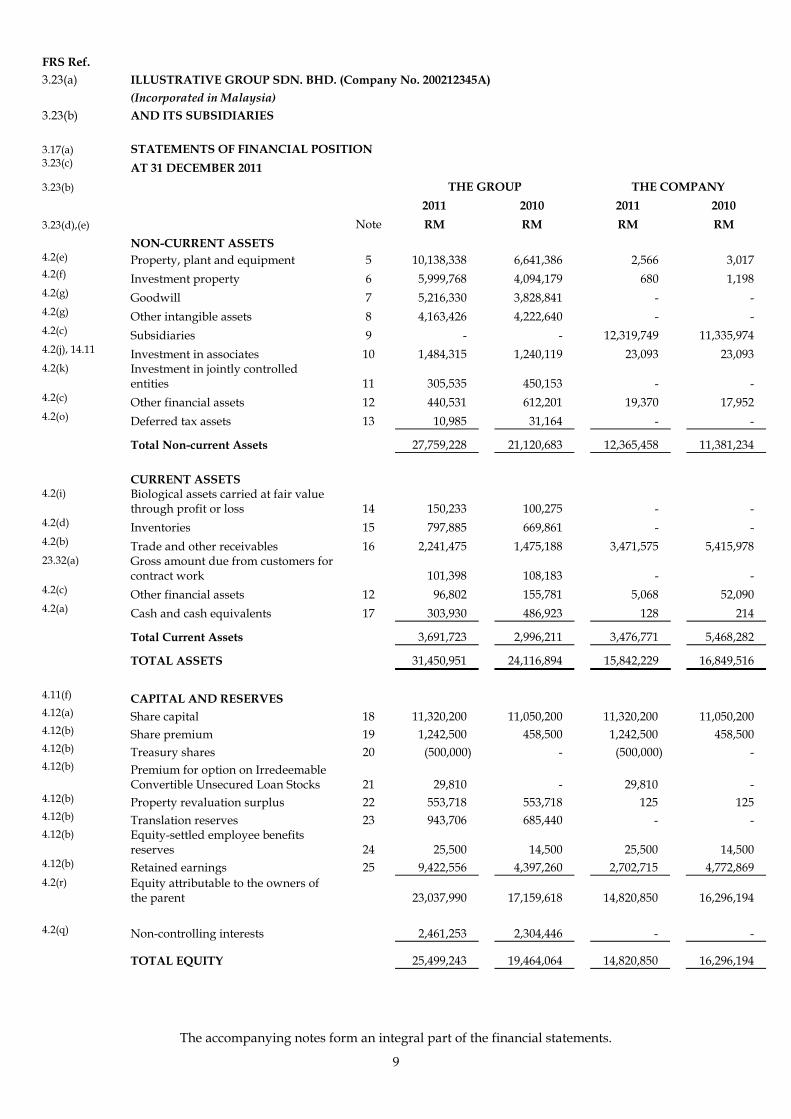
FRS Ref.
3.23(a) ILLUSTRATIVE GROUP SDN. BHD. (Company No. 200212345A)
(Incorporated in Malaysia)
3.23(b) AND ITS SUBSIDIARIES
3.17(a) STATEMENTS OF FINANCIAL POSITION 3.23(c) AT 31 DECEMBER 2011
3.23(b) THE GROUP THE COMPANY
2011 2010 2011 2010
3.23(d),(e) Note RM RM RM RM NON-CURRENT ASSETS 4.2(e) Property, plant and equipment 5 10,138,338 6,641,386 2,566 3,017 4.2(f) Investment property 6 5,999,768 4,094,179 680 1,198 4.2(g) Goodwill 7 5,216,330 3,828,841 - - 4.2(g) Other intangible assets 8 4,163,426 4,222,640 - - 4.2(c) Subsidiaries 9 - - 12,319,749 11,335,974 4.2(j), 14.11 Investment in associates 10 1,484,315 1,240,119 23,093 23,093 4.2(k) Investment in jointly controlled
entities 11
305,535
450,153 -
-
4.2(c) Other financial assets 12 440,531 612,201 19,370 17,952 4.2(o) Deferred tax assets 13 10,985 31,164 - -
Total Non-current Assets 27,759,228 21,120,683 12,365,458 11,381,234 CURRENT ASSETS 4.2(i)
Biological assets carried at fair value through profit or loss 14 150,233 100,275 - -
4.2(d) Inventories 15 797,885 669,861 - - 4.2(b) Trade and other receivables 16 2,241,475 1,475,188 3,471,575 5,415,978 23.32(a)
Gross amount due from customers for contract work 101,398 108,183 - -
4.2(c) Other financial assets 12 96,802 155,781 5,068 52,090 4.2(a) Cash and cash equivalents 17 303,930 486,923 128 214
Total Current Assets 3,691,723 2,996,211 3,476,771 5,468,282
TOTAL ASSETS 31,450,951 24,116,894 15,842,229 16,849,516
4.11(f) CAPITAL AND RESERVES 4.12(a) Share capital 18 11,320,200 11,050,200 11,320,200 11,050,200 4.12(b) Share premium 19 1,242,500 458,500 1,242,500 458,500 4.12(b) Treasury shares 20 (500,000) - (500,000) - 4.12(b)
Premium for option on Irredeemable Convertible Unsecured Loan Stocks 21 29,810 - 29,810 -
4.12(b) Property revaluation surplus 22 553,718 553,718 125 125 4.12(b) Translation reserves 23 943,706 685,440 - - 4.12(b)
Equity-settled employee benefits reserves 24 25,500 14,500 25,500 14,500
4.12(b) Retained earnings 25 9,422,556 4,397,260 2,702,715 4,772,869 4.2(r)
Equity attributable to the owners of the parent 23,037,990 17,159,618 14,820,850 16,296,194
4.2(q) Non-controlling interests 2,461,253 2,304,446 - -
TOTAL EQUITY 25,499,243 19,464,064 14,820,850 16,296,194

The accompanying notes form an integral part of the financial statements.
10
FRS Ref.
3.23(a) ILLUSTRATIVE GROUP SDN. BHD. (Company No. 200212345A)
(Incorporated in Malaysia)
3.23(b) AND ITS SUBSIDIARIES
3.17(a) STATEMENTS OF FINANCIAL POSITION 3.23(c) AT 31 DECEMBER 2011
3.23(b) THE GROUP THE COMPANY
2011 2010 2011 2010
3.23(d),(e) Note RM RM RM RM
NON-CURRENT LIABILITIES 4.2(o) Deferred tax liabilities 13 1,184,989 929,279 9,936 - 4.11(e) Retirement benefit obligation 26 66,743 72,240 - - 4.2(p) Provisions 27 30,449 44,888 - - 4.2(m) Finance lease payables 28 91,622 105,812 - - 4.2(m) Other borrowings 29 623,146 265,977 374,998 41,534 4.2(m) Other financial liabilities 30 100,000 - 100,000 -
Total Non-current Liabilities 2,096,949 1,418,196 484,934 41,534
CURRENT LIABILITIES 4.2(l) Trade and other payables 31 1,863,793 1,115,196 330,442 329,113 23.32(b)
Gross amount due to customers for contract work 3,211 1,453 - -
4.2(n) Current tax liabilities 34,598 68,272 - - 4.2(p) Provisions 27 163,358 165,268 - - 4.2(m) Finance lease payables 28 56,966 53,476 - - 4.2(a) Bank overdrafts 29 280,316 324,225 36,068 44,396 4.2(m) Other borrowings 29 1,352,517 1,406,744 169,935 138,279 4.11(d) Deferred revenue 32 100,000 100,000 - -
Total Current Liabilities 3,854,759 3,234,634 536,445 511,788
TOTAL LIABILITIES 5,951,708 4,652,830 1,021,379 553,322
TOTAL EQUITY AND LIABILITIES 31,450,951 24,116,894 15,842,229 16,849,516
* Note on the presentation of financial statements: In accordance with Section 4.9, FRS for SMEs does not prescribe the sequence or format in which items are to be presented.

The accompanying notes form an integral part of the financial statements.
11
FRS Ref.
3.23(a) ILLUSTRATIVE GROUP SDN. BHD. (Company No. 200212345A)
(Incorporated in Malaysia)
3.23(b) AND ITS SUBSIDIARIES
3.17(b)(i) STATEMENTS OF COMPREHENSIVE INCOME - Expenses classified by Function
3.23(c) FOR THE FINANCIAL YEAR ENDED 31 DECEMBER 2011
3.23(b) THE GROUP THE COMPANY
2011 2010 2011 2010
3.23(d),(e) Note RM RM RM RM
Continuing Operations
5.5(a) Revenue 34 23,743,683 19,326,112 381,809 291,722
5.11(b) Cost of sales (12,966,796) (11,656,606) - -
Gross profit 10,776,887 7,669,506 381,809 291,722
Other income 352,383 381,590 107,585 117,882
5.11(b) Distribution costs (618,208) (663,922) - -
5.11(b) Administrative expenses (1,664,403) (1,014,755) (265,406) (251,828)
5.11(b) Other expenses (214,557) (213,573) (9,761) (2,025)
5.5(b) Finance costs (243,782) (256,549) (39,472) (24,262)
5.5(c) Share of profit of associates 225,700 89,460 - -
Profit before tax 35 8,614,020 5,991,757 174,755 131,489
5.5(d) Tax expense 36 (1,203,963) (1,168,682) (7,869) -
Profit from continuing operations 7,410,057 4,823,075 166,886 131,489
Discontinued Operations
5.5(e) Profit from discontinued operations 9,086 15,796 - -
5.5(f) Profit For The Financial Year 7,419,143 4,838,871 166,886 131,489
Other Comprehensive Income 5.5(g)
Exchange differences on translation of foreign operations, net of tax 258,266 231,391 - -
5.5(i)
Total Comprehensive Income For The Financial Year 7,677,409 5,070,262 166,886 131,489
5.6(a) Profit for the financial year attributable to:
Owners of the parent 7,262,336 4,709,341 166,886 131,489
Non-controlling interests 156,807 129,530 - -
7,419,143 4,838,871 166,886 131,489
5.6(b) Total comprehensive income for the financial year attributable to:
Owners of the parent 7,520,602 4,940,732 166,886 131,489
Non-controlling interests 156,807 129,530 - -
7,677,409 5,070,262 166,886 131,489

The accompanying notes form an integral part of the financial statements.
12
FRS Ref.
3.23(a) ILLUSTRATIVE GROUP SDN. BHD. (Company No. 200212345A)
(Incorporated in Malaysia)
3.23(b) AND ITS SUBSIDIARIES
3.17(b)(i) STATEMENTS OF COMPREHENSIVE INCOME - Expenses classified by Nature 3.23(c) FOR THE FINANCIAL YEAR ENDED 31 DECEMBER 2011
3.23(b) THE GROUP THE COMPANY
2011 2010 2011 2010
3.23(d),(e) Note RM RM RM RM
Continuing Operations
5.5(a) Revenue 34 23,743,683 19,326,112 381,809 291,722
Other income 336,627 381,590 107,585 117,882 5.11(a)
Changes in inventories of finished goods and work in progress 268,393 (493,001) - -
5.11(a) Raw materials and consumable used (46,289) (68,739) - - 5.11(a) Contract costs recognised (9,363,577) (6,312,684) - - 5.11(a) Employees benefit expenses (490,010) (342,001) (58,975) (38,305) 5.11(a) Depreciation of property, plant and equipment (1,228,514) (876,403) (469) (492) 5.11(a) Amortisation of other intangible assets (208,748) (151,708) - - 5.11(a) Impairment losses recognised (40,007) (1,629) - - 5.11(a) Impairment losses reversed 15,756 - - - 5.11(a) Other expenses (4,355,212) (5,302,691) (215,723) (215,056) 5.5(b) Finance costs (243,782) (256,549) (39,472) (24,262)
5.5(c) Share of profit of associates 225,700 89,460 - -
Profit before tax 35 8,614,020 5,991,757 174,755 131,489
5.5(d) Tax expense 36 (1,203,963) (1,168,682) (7,869) -
Profit from continuing operations 7,410,057 4,823,075 166,886 131,489
Discontinued Operations
5.5(e) Profit from discontinued operations 9,086 15,796 - -
5.5(f) Profit For The Financial Year 7,419,143 4,838,871 166,886 131,489
Other Comprehensive Income 5.5(g)
Exchange differences on translation of foreign operations, net of tax 258,266 231,391 - -
5.5(i)
Total Comprehensive Income For The Financial Year 7,677,409 5,070,262 166,886 131,489
5.6(a) Profit for the financial year attributable to:
Owners of the parent 7,262,336 4,709,341 166,886 131,489
Non-controlling interests 156,807 129,530 - -
7,419,143 4,838,871 166,886 131,489
5.6(b) Total comprehensive income for the financial year attributable to:
Owners of the parent 7,520,602 4,940,732 166,886 131,489
Non-controlling interests 156,807 129,530 - -
7,677,409 5,070,262 166,886 131,489

The accompanying notes form an integral part of the financial statements.
13
FRS Ref.
3.23(a) ILLUSTRATIVE GROUP SDN. BHD. (Company No. 200212345A)
(Incorporated in Malaysia)
3.23(b) AND ITS SUBSIDIARIES
3.17(b)(ii) INCOME STATEMENTS - Expenses classified by Function 3.23(c) FOR THE FINANCIAL YEAR ENDED 31 DECEMBER 2011
3.23(b) THE GROUP THE COMPANY
2011 2010 2011 2010
3.23(d),(e) Note RM RM RM RM
Continuing Operations
5.5(a) Revenue 34 23,743,683 19,326,112 381,809 291,722
5.11(b) Cost of sales (12,966,796) (11,656,606) - -
Gross profit 10,776,887 7,669,506 381,809 291,722
Other income 352,383 381,590 107,585 117,882
5.11(b) Distribution costs (618,208) (663,922) - -
5.11(b) Administrative expenses (1,664,403) (1,014,755) (265,406) (251,828)
5.11(b) Other expenses (214,557) (213,573) (9,761) (2,025)
5.5(b) Finance costs (243,782) (256,549) (39,472) (24,262)
5.5(c) Share of profit of associates 225,700 89,460 - -
Profit before tax 35 8,614,020 5,991,757 174,755 131,489
5.5(d) Tax expense 36 (1,203,963) (1,168,682) (7,869) -
Profit from continuing operations 7,410,057 4,823,075 166,886 131,489
Discontinued Operations
5.5(e) Profit from discontinued operations 9,086 15,796 - -
5.5(f) Profit For The Financial Year 7,419,143 4,838,871 166,886 131,489
5.6(a) Profit for the financial year attributable to:
Owners of the parent 7,262,336 4,709,341 166,886 131,489
Non-controlling interests 156,807 129,530 - -
7,419,143 4,838,871 166,886 131,489

The accompanying notes form an integral part of the financial statements.
14
FRS Ref.
3.23(a) ILLUSTRATIVE GROUP SDN. BHD. (Company No. 200212345A)
(Incorporated in Malaysia)
3.23(b) AND ITS SUBSIDIARIES
3.17(b)(ii) STATEMENTS OF COMPREHENSIVE INCOME 3.23(c) FOR THE FINANCIAL YEAR ENDED 31 DECEMBER 2011
3.23(b) THE GROUP THE COMPANY
2011 2010 2011 2010
3.23(d),(e) Note RM RM RM RM
5.7 Profit For The Financial Year 7,419,143 4,838,871 166,886 131,489
Other Comprehensive Income 5.5(g)
Exchange differences on translation of foreign operations, net of tax 258,266 231,391 - -
5.5(i) Total Comprehensive Income For The Financial Year 7,677,409 5,070,262 166,886 131,489
5.6(b) Total comprehensive income for the financial year attributable to:
Owners of the parent 7,520,602 4,940,732 166,886 131,489
Non-controlling interests 156,807 129,530 - -
7,677,409 5,070,262 166,886 131,489

The accompanying notes form an integral part of the financial statements.
15
FRS Ref.
3.23(a) ILLUSTRATIVE GROUP SDN. BHD. (Company No. 200212345A)
(Incorporated in Malaysia)
3.23(b) AND ITS SUBSIDIARIES
3.17(c)
3.23(c)
Share Capital
Share
Premium
Treasury
Shares
Premium for
Option on
ICULS
Property
Revaluation
Surplus
Translation
Reserves *
Equity-settled
Employee
Benefits
Reserves
Retained
Earnings Total
Non-
controlling
Interests Total Equity
3.23(b),(d),(e) THE GROUP Note RM RM RM RM RM RM RM RM RM RM RM
6.3(c) Balance at 1 January 2010 11,045,200 450,000 - - 553,718 454,049 9,000 1,896,959 14,408,926 2,174,916 16,583,842
Profit for the financial year - - - - - - - 4,709,341 4,709,341 129,530 4,838,871
Other comprehensive income for the financial year - - - - - 231,391 - - 231,391 - 231,391
6.3(a) Total comprehensive income for the financial year - - - - - 231,391 - 4,709,341 4,940,732 129,530 5,070,262
6.3(c) Dividends 37 - - - - - - - (2,209,040) (2,209,040) - (2,209,040)
6.3(c) Issue of ordinary shares 5,000 8,500 - - - - (1,500) - 12,000 - 12,000
6.3(c) Recognition of share-based payments - - - - - - 7,000 - 7,000 - 7,000
6.3(c) Balance at 31 December 2010 11,050,200 458,500 - - 553,718 685,440 14,500 4,397,260 17,159,618 2,304,446 19,464,064
Profit for the financial year - - - - - - - 7,262,336 7,262,336 156,807 7,419,143
Other comprehensive income for the financial year - - - - - 258,266 - - 258,266 - 258,266
6.3(a) Total comprehensive income for the financial year - - - - - 258,266 - 7,262,336 7,520,602 156,807 7,677,409
6.3(c) Dividends 37 - - - - - - - (2,237,040) (2,237,040) - (2,237,040)
6.3(c) Issue of ordinary shares 270,000 784,000 - - - - (6,000) - 1,048,000 - 1,048,000
6.3(c) Buy-back of ordinary shares - - (500,000) - - - - - (500,000) - (500,000)
6.3(c) Issue of ICULS - - - 39,746 - - - - 39,746 - 39,746
6.3(c) Tax effect on issue of ICULS - - - (9,936) - - - - (9,936) - (9,936)
Transfer to retained earnings on disposal of property - - - - - - - - - - -
6.3(c) Recognition of share-based payments - - - - - - 17,000 - 17,000 - 17,000
6.3(c) Balance at 31 December 2011 11,320,200 1,242,500 (500,000) 29,810 553,718 943,706 25,500 9,422,556 23,037,990 2,461,253 25,499,243
* Disclosure in accordance with Section 30.25(b)
FOR THE FINANCIAL YEAR ENDED 31 DECEMBER 2011
Equity Attributable to the Owners of Parent
STATEMENTS OF CHANGES IN EQUITY
The accompanying notes form an integral part of the financial statements.
16
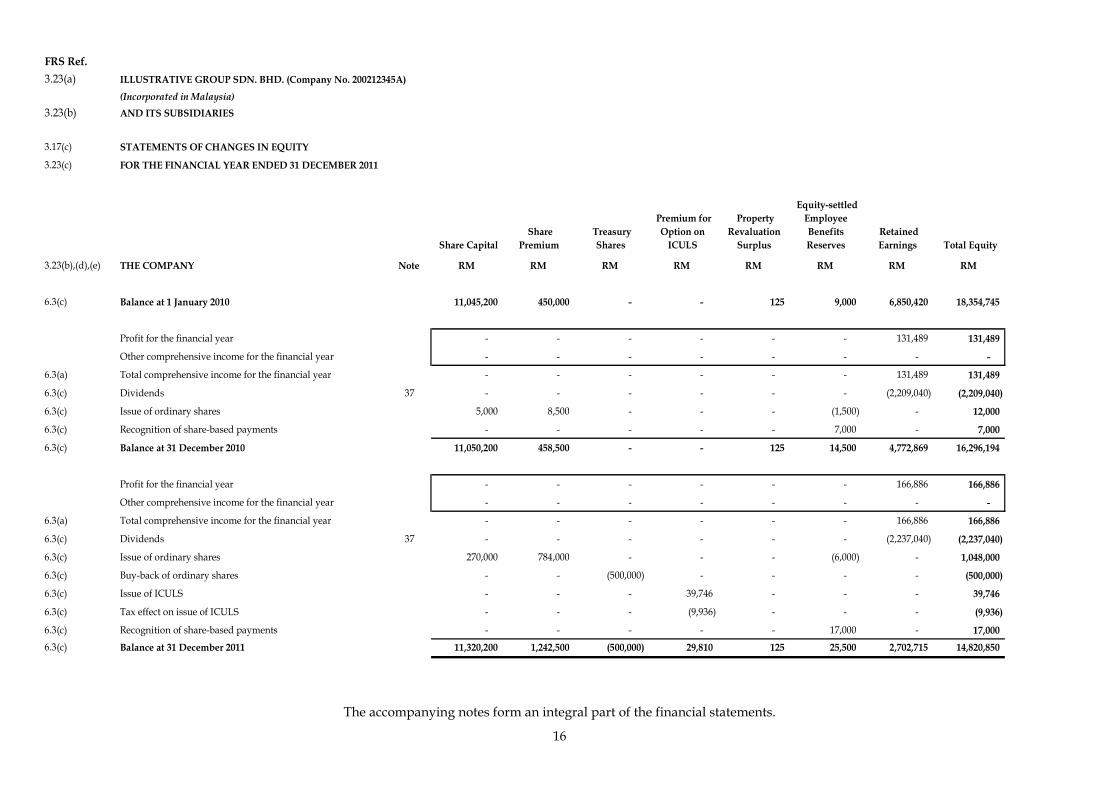
FRS Ref.
3.23(a) ILLUSTRATIVE GROUP SDN. BHD. (Company No. 200212345A)
(Incorporated in Malaysia)
3.23(b) AND ITS SUBSIDIARIES
3.17(c)
3.23(c)
Share Capital
Share
Premium
Treasury
Shares
Premium for
Option on
ICULS
Property
Revaluation
Surplus
Equity-settled
Employee
Benefits
Reserves
Retained
Earnings Total Equity
3.23(b),(d),(e) THE COMPANY Note RM RM RM RM RM RM RM RM
6.3(c) Balance at 1 January 2010 11,045,200 450,000 - - 125 9,000 6,850,420 18,354,745
Profit for the financial year - - - - - - 131,489 131,489
Other comprehensive income for the financial year - - - - - - - -
6.3(a) Total comprehensive income for the financial year - - - - - - 131,489 131,489
6.3(c) Dividends 37 - - - - - - (2,209,040) (2,209,040)
6.3(c) Issue of ordinary shares 5,000 8,500 - - - (1,500) - 12,000
6.3(c) Recognition of share-based payments - - - - - 7,000 - 7,000
6.3(c) Balance at 31 December 2010 11,050,200 458,500 - - 125 14,500 4,772,869 16,296,194
Profit for the financial year - - - - - - 166,886 166,886
Other comprehensive income for the financial year - - - - - - - -
6.3(a) Total comprehensive income for the financial year - - - - - - 166,886 166,886
6.3(c) Dividends 37 - - - - - - (2,237,040) (2,237,040)
6.3(c) Issue of ordinary shares 270,000 784,000 - - - (6,000) - 1,048,000
6.3(c) Buy-back of ordinary shares - - (500,000) - - - - (500,000)
6.3(c) Issue of ICULS - - - 39,746 - - - 39,746
6.3(c) Tax effect on issue of ICULS - - - (9,936) - - - (9,936)
6.3(c) Recognition of share-based payments - - - - - 17,000 - 17,000
6.3(c) Balance at 31 December 2011 11,320,200 1,242,500 (500,000) 29,810 125 25,500 2,702,715 14,820,850
STATEMENTS OF CHANGES IN EQUITY
FOR THE FINANCIAL YEAR ENDED 31 DECEMBER 2011
The accompanying notes form an integral part of the financial statements.
17
FRS Ref.
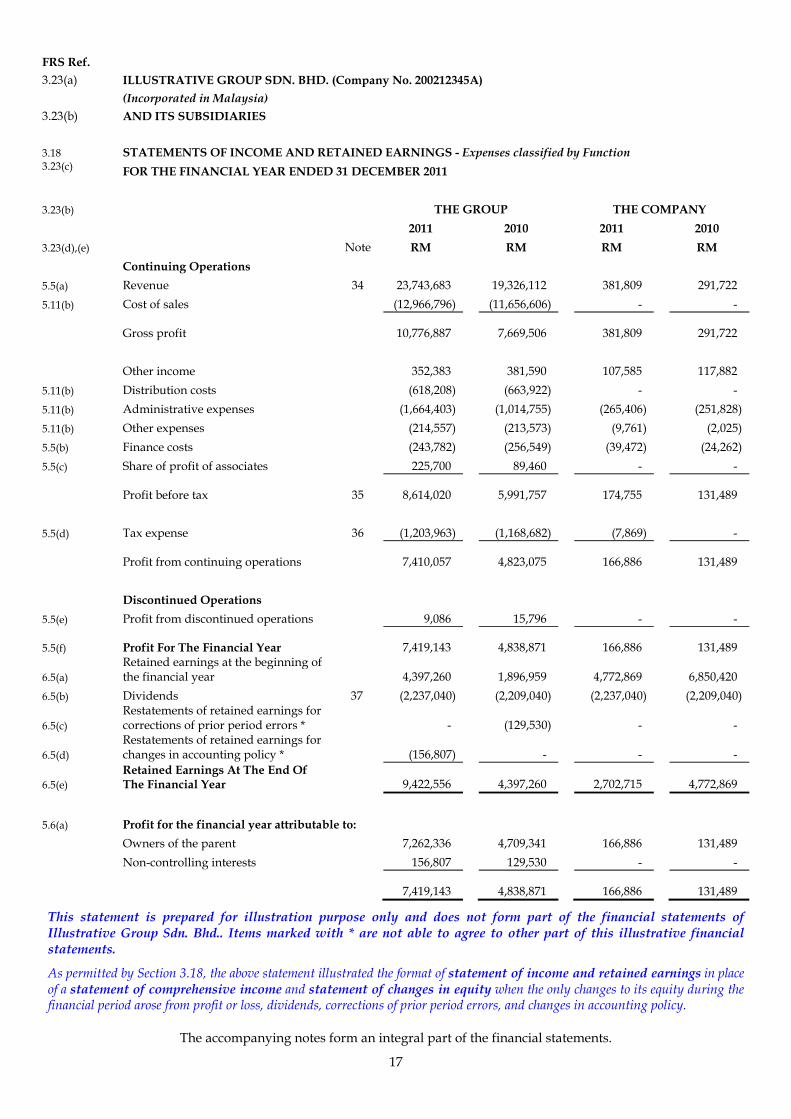
3.23(a) ILLUSTRATIVE GROUP SDN. BHD. (Company No. 200212345A)
(Incorporated in Malaysia)
3.23(b) AND ITS SUBSIDIARIES
3.18 STATEMENTS OF INCOME AND RETAINED EARNINGS - Expenses classified by Function 3.23(c) FOR THE FINANCIAL YEAR ENDED 31 DECEMBER 2011
3.23(b) THE GROUP THE COMPANY
2011 2010 2011 2010
3.23(d),(e) Note RM RM RM RM
Continuing Operations
5.5(a) Revenue 34 23,743,683 19,326,112 381,809 291,722
5.11(b) Cost of sales (12,966,796) (11,656,606) - -
Gross profit 10,776,887 7,669,506 381,809 291,722
Other income 352,383 381,590 107,585 117,882
5.11(b) Distribution costs (618,208) (663,922) - -
5.11(b) Administrative expenses (1,664,403) (1,014,755) (265,406) (251,828)
5.11(b) Other expenses (214,557) (213,573) (9,761) (2,025)
5.5(b) Finance costs (243,782) (256,549) (39,472) (24,262)
5.5(c) Share of profit of associates 225,700 89,460 - -
Profit before tax 35 8,614,020 5,991,757 174,755 131,489
5.5(d) Tax expense 36 (1,203,963) (1,168,682) (7,869) -
Profit from continuing operations 7,410,057 4,823,075 166,886 131,489
Discontinued Operations
5.5(e) Profit from discontinued operations 9,086 15,796 - -
5.5(f) Profit For The Financial Year 7,419,143 4,838,871 166,886 131,489
6.5(a) Retained earnings at the beginning of the financial year 4,397,260 1,896,959 4,772,869 6,850,420
6.5(b) Dividends 37 (2,237,040) (2,209,040) (2,237,040) (2,209,040)
6.5(c) Restatements of retained earnings for corrections of prior period errors * - (129,530) - -
6.5(d) Restatements of retained earnings for changes in accounting policy * (156,807) - - -
6.5(e) Retained Earnings At The End Of The Financial Year 9,422,556 4,397,260 2,702,715 4,772,869
5.6(a) Profit for the financial year attributable to:
Owners of the parent 7,262,336 4,709,341 166,886 131,489
Non-controlling interests 156,807 129,530 - -
7,419,143 4,838,871 166,886 131,489
This statement is prepared for illustration purpose only and does not form part of the financial statements of Illustrative Group Sdn. Bhd.. Items marked with * are not able to agree to other part of this illustrative financial statements.
As permitted by Section 3.18, the above statement illustrated the format of statement of income and retained earnings in place of a statement of comprehensive income and statement of changes in equity when the only changes to its equity during the financial period arose from profit or loss, dividends, corrections of prior period errors, and changes in accounting policy.

The accompanying notes form an integral part of the financial statements.
18
FRS Ref.
3.23(a) ILLUSTRATIVE GROUP SDN. BHD. (Company No. 200212345A)
(Incorporated in Malaysia)
3.23(b) AND ITS SUBSIDIARIES
3.18 STATEMENTS OF INCOME AND RETAINED EARNINGS - Expenses classified by Nature 3.23(c) FOR THE FINANCIAL YEAR ENDED 31 DECEMBER 2011
3.23(b) THE GROUP THE COMPANY
2011 2010 2011 2010
3.23(d),(e) Note RM RM RM RM
Continuing Operations
5.5(a) Revenue 34 23,743,683 19,326,112 381,809 291,722
Other income 336,627 381,590 107,585 117,882 5.11(a)
Changes in inventories of finished goods and work in progress 268,393 (493,001) - -
5.11(a) Raw materials and consumable used (46,289) (68,739) - - 5.11(a) Contract costs recognised (9,363,577) (6,312,684) - - 5.11(a) Employees benefit expenses (490,010) (342,001) (58,975) (38,305) 5.11(a) Depreciation of property, plant and equipment (1,228,514) (876,403) (469) (492) 5.11(a) Amortisation of other intangible assets (208,748) (151,708) - - 5.11(a) Impairment losses recognised (40,007) (1,629) - - 5.11(a) Impairment losses reversed 15,756 - - - 5.11(a) Other expenses (4,355,212) (5,302,691) (215,723) (215,056) 5.5(b) Finance costs (243,782) (256,549) (39,472) (24,262)
5.5(c) Share of profit of associates 225,700 89,460 - -
Profit before tax 35 8,614,020 5,991,757 174,755 131,489
5.5(d) Tax expense 36 (1,203,963) (1,168,682) (7,869) -
Profit from continuing operations 7,410,057 4,823,075 166,886 131,489
Discontinued Operations
5.5(e) Profit from discontinued operations 9,086 15,796 - -
5.5(f) Profit For The Financial Year 7,419,143 4,838,871 166,886 131,489
6.5(a) Retained earnings at the beginning of the financial year 4,397,260 1,896,959 4,772,869 6,850,420
6.5(b) Dividends 37 (2,237,040) (2,209,040) (2,237,040) (2,209,040)
6.5(c) Restatements of retained earnings for corrections of prior period errors * - (129,530) - -
6.5(d) Restatements of retained earnings for changes in accounting policy * (156,807) - - -
6.5(e) Retained Earnings At The End Of The Financial Year 9,422,596 4,397,260 2,702,715 4,772,869

The accompanying notes form an integral part of the financial statements.
19
FRS Ref.
3.23(a) ILLUSTRATIVE GROUP SDN. BHD. (Company No. 200212345A)
(Incorporated in Malaysia)
3.23(b) AND ITS SUBSIDIARIES
3.18 STATEMENTS OF INCOME AND RETAINED EARNINGS - Expenses classified by Nature 3.23(c) FOR THE FINANCIAL YEAR ENDED 31 DECEMBER 2011
3.23(b) THE GROUP THE COMPANY
2011 2010 2011 2010
3.23(d),(e) Note RM RM RM RM
5.6(a) Profit for the financial year attributable to:
Owners of the parent 7,262,336 4,709,341 166,886 131,489
Non-controlling interests 156,807 129,530 - -
7,419,143 4,838,871 166,886 131,489
This statement is prepared for illustration purpose only and does not form part of the financial statements of Illustrative Group Sdn. Bhd.. Items marked with * are not able to agree to other part of this illustrative financial statements. Note: As permitted by Section 3.18, the above statement illustrated the format of statement of income and retained earnings in place of a statement of comprehensive income and statement of changes in equity when the only changes to its equity during the financial period arose from:
• profit or loss,
• dividends,
• corrections of prior period errors, and
• changes in accounting policy.

The accompanying notes form an integral part of the financial statements.
20
FRS Ref.
3.23(a) ILLUSTRATIVE GROUP SDN. BHD. (Company No. 200212345A)
(Incorporated in Malaysia)
3.23(b) AND ITS SUBSIDIARIES
3.17(d)
3.23(c)
3.23(b)
2011 2010 2011 2010
3.23(d),(e) Note RM RM RM RM
7.3, 7.4, 7.7(a) CASH FLOWS FROM OPERATING ACTIVITIES
7.7(a) Profit before tax 8,614,020 5,991,757 174,755 131,489
7.8(b), (c) Adjustments for:
Amortisation of other intangible assets 208,748 151,708 - -
Defined benefits plan 37,693 31,270 - -
Depreciation of property, plant and equipment 1,228,514 876,403 469 492
Dividend income (1,718) (2,105) - -
Gain on disposal of investment property (2,659) (173) (61) -
Gain on fair value adjustment for other financial assets (64,256) (15,914) (24,474) (64,989)
Gain on fair value adjustment for investment property (53,911) (35,993) - (180)
Loss on fair value adjustment for jointly controlled entities 144,618 102,000
Loss on fair value adjustment for biological assets 13,230 10,800 - -
Gain/loss on disposal of a subsidiary (1,459) - 293,051 -
Gain/loss on disposal of property, plant and equipment (760) (1,088) (112) 28
Impairment losses on trade receivables 9,438 13,578 - -
Impairment losses on non-financial assets 40,007 1,629 - -
Impairment losses on inventories 466,250 45,303 - -
Interest expense 243,782 256,549 39,472 24,262
Interest income (657) (718) - -
Profit from discontinued operations (13,042) (20,844) - -
Provision for legal costs 347 - - -
Provision for warranties 113,718 91,634 - -
Reversal of impairment losses on non-financial assets (1,198) - - -
Reversal of impairment losses on trade receivables (348) (732) - -
Reversal of impairment losses on inventories (14,558) - - -
Reversal of provision for warranties (72,911) (31,695) - -
Share of profit of associates (225,700) (89,460) - -
Share options expenses 17,000 7,000 17,000 7,000
Unrealised loss on foreign exchange 90,459 79,948 - -
Operating profit before changes in working capital 10,774,647 7,460,857 500,100 98,102
7.8(a) (Increase)/Decrease in biological assets (65,288) 30,769 - -
7.8(a) Increase in inventories (414,745) (253,815) - -
7.8(a) Increase in trade and other receivables (500,825) (122,691) 1,944,303 2,056,317
7.8(a) Increase/(decrease) in trade and other payables 1,411,958 523,917 11,365 (69,504)
Cash generated from operations 11,205,747 7,639,037 2,455,768 2,084,915
Contributions to defined benefit plan (43,190) (41,540) - -
7.17 Income taxes paid (969,178) (765,940) (7,869) -
7.15 Interest paid (228,649) (255,907) (20,664) (24,262)
7.15 Interest received 657 718 - -
Utilisation of provision for warranties (57,503) (60,078) - -
Net cash from operating activities 9,907,884 6,516,290 2,427,235 2,060,653
STATEMENTS OF CASH FLOWS - Indirect Method
FOR THE FINANCIAL YEAR ENDED 31 DECEMBER 2011
THE GROUP THE COMPANY
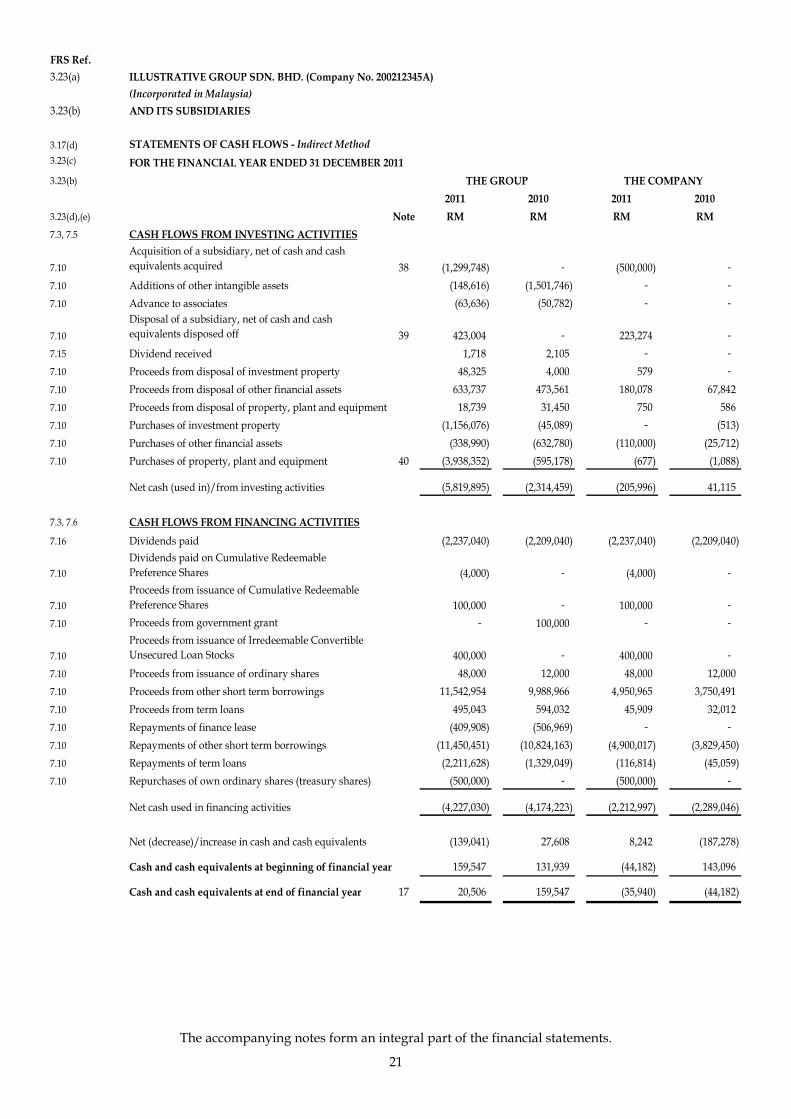
The accompanying notes form an integral part of the financial statements.
21
FRS Ref.
3.23(a) ILLUSTRATIVE GROUP SDN. BHD. (Company No. 200212345A)
(Incorporated in Malaysia)
3.23(b) AND ITS SUBSIDIARIES
3.17(d)
3.23(c)
3.23(b)
2011 2010 2011 2010
3.23(d),(e) Note RM RM RM RM
7.3, 7.5 CASH FLOWS FROM INVESTING ACTIVITIES
7.10
Acquisition of a subsidiary, net of cash and cash
equivalents acquired 38 (1,299,748) - (500,000) -
7.10 Additions of other intangible assets (148,616) (1,501,746) - -
7.10 Advance to associates (63,636) (50,782) - -
7.10
Disposal of a subsidiary, net of cash and cash
equivalents disposed off 39 423,004 - 223,274 -
7.15 Dividend received 1,718 2,105 - -
7.10 Proceeds from disposal of investment property 48,325 4,000 579 -
7.10 Proceeds from disposal of other financial assets 633,737 473,561 180,078 67,842
7.10 Proceeds from disposal of property, plant and equipment 18,739 31,450 750 586
7.10 Purchases of investment property (1,156,076) (45,089) - (513)
7.10 Purchases of other financial assets (338,990) (632,780) (110,000) (25,712)
7.10 Purchases of property, plant and equipment 40 (3,938,352) (595,178) (677) (1,088)
Net cash (used in)/from investing activities (5,819,895) (2,314,459) (205,996) 41,115
7.3, 7.6 CASH FLOWS FROM FINANCING ACTIVITIES
7.16 Dividends paid (2,237,040) (2,209,040) (2,237,040) (2,209,040)
7.10
Dividends paid on Cumulative Redeemable
Preference Shares (4,000) - (4,000) -
7.10
Proceeds from issuance of Cumulative Redeemable
Preference Shares 100,000 - 100,000 -
7.10 Proceeds from government grant - 100,000 - -
7.10
Proceeds from issuance of Irredeemable Convertible
Unsecured Loan Stocks 400,000 - 400,000 -
7.10 Proceeds from issuance of ordinary shares 48,000 12,000 48,000 12,000
7.10 Proceeds from other short term borrowings 11,542,954 9,988,966 4,950,965 3,750,491
7.10 Proceeds from term loans 495,043 594,032 45,909 32,012
7.10 Repayments of finance lease (409,908) (506,969) - -
7.10 Repayments of other short term borrowings (11,450,451) (10,824,163) (4,900,017) (3,829,450)
7.10 Repayments of term loans (2,211,628) (1,329,049) (116,814) (45,059)
7.10 Repurchases of own ordinary shares (treasury shares) (500,000) - (500,000) -
Net cash used in financing activities (4,227,030) (4,174,223) (2,212,997) (2,289,046)
Net (decrease)/increase in cash and cash equivalents (139,041) 27,608 8,242 (187,278)
Cash and cash equivalents at beginning of financial year 159,547 131,939 (44,182) 143,096
Cash and cash equivalents at end of financial year 17 20,506 159,547 (35,940) (44,182)
STATEMENTS OF CASH FLOWS - Indirect Method
FOR THE FINANCIAL YEAR ENDED 31 DECEMBER 2011
THE GROUP THE COMPANY

The accompanying notes form an integral part of the financial statements.
22
FRS Ref.
3.23(a) ILLUSTRATIVE GROUP SDN. BHD. (Company No. 200212345A)
(Incorporated in Malaysia)
3.23(b) AND ITS SUBSIDIARIES
3.17(d)
3.23(c)
3.23(b)
2011 2010 2011 2010
3.23(d),(e) Note RM RM RM RM
7.3, 7.4, 7.7(b) CASH FLOWS FROM OPERATING ACTIVITIES
7.9 Receipts from customers 23,889,419 19,276,862 381,698 291,962
7.9 Receipts from/(payments to) other receivables (15,690) 12,304 2,387,401 2,056,077
7.9 Payments to suppliers and for expenses (12,667,982) (11,650,129) (313,331) (263,124)
Contributions to defined benefit plan (43,190) (41,540) - -
7.17 Income taxes paid (969,178) (765,940) (7,869) -
7.15 Interest paid (228,649) (255,907) (20,664) (24,262)
7.15 Interest received 657 718 - -
Utilisation of provision for warranties (57,503) (60,078) - -
Net cash from operating activities 9,907,884 6,516,290 2,427,235 2,060,653
7.3, 7.5 CASH FLOWS FROM INVESTING ACTIVITIES
7.10
Acquisition of a subsidiary, net of cash and cash
equivalents acquired 38 (1,299,748) - (500,000) -
7.10 Additions of other intangible assets (148,616) (1,501,746) - -
7.10 Advance to associates (63,636) (50,782) - -
7.10
Disposal of a subsidiary, net of cash and cash
equivalents disposed off 39 423,004 - 223,274 -
7.15 Dividend received 1,718 2,105 - -
7.10 Proceeds from disposal of investment property 48,325 4,000 579 -
7.10 Proceeds from disposal of other financial assets 633,737 473,561 180,078 67,842
7.10 Proceeds from disposal of property, plant and equipment 18,739 31,450 750 586
7.10 Purchases of investment property (1,156,076) (45,089) - (513)
7.10 Purchases of other financial assets (338,990) (632,780) (110,000) (25,712)
7.18 Purchases of property, plant and equipment 40 (3,938,352) (595,178) (677) (1,088)
Net cash (used in)/from investing activities (5,819,895) (2,314,459) (205,996) 41,115
7.3, 7.6 CASH FLOWS FROM FINANCING ACTIVITIES
7.16 Dividends paid (2,237,040) (2,209,040) (2,237,040) (2,209,040)
7.10
Dividends paid on Cumulative Redeemable
Preference Shares (4,000) - (4,000) -
7.10
Proceeds from issuance of Cumulative Redeemable
Preference Shares 100,000 - 100,000 -
7.10 Proceeds from government grant - 100,000 - -
7.10
Proceeds from issuance of Irredeemable Convertible
Unsecured Loan Stocks 400,000 - 400,000 -
7.10 Proceeds from issuance of ordinary shares 48,000 12,000 48,000 12,000
7.10 Proceeds from other short term borrowings 11,542,954 9,988,966 4,950,965 3,750,491
7.10 Proceeds from term loans 495,043 594,032 45,909 32,012
7.10 Repayments of finance lease (409,908) (506,969) - -
7.10 Repayments of other short term borrowings (11,450,451) (10,824,163) (4,900,017) (3,829,450)
7.10 Repayments of term loans (2,211,628) (1,329,049) (116,814) (45,059)
7.10 Repurchases of own ordinary shares (treasury shares) (500,000) - (500,000) -
Net cash used in financing activities (4,227,030) (4,174,223) (2,212,997) (2,289,046)
Net (decrease)/increase in cash and cash equivalents (139,041) 27,608 8,242 (187,278)
Cash and cash equivalents at beginning of financial year 159,547 131,939 (44,182) 143,096
Cash and cash equivalents at end of financial year 17 20,506 159,547 (35,940) (44,182)
STATEMENTS OF CASH FLOWS - Direct Method
FOR THE FINANCIAL YEAR ENDED 31 DECEMBER 2011
THE GROUP THE COMPANY
FRS Ref. 3.23(a)
3.23(b)
ILLUSTRATIVE GROUP SDN. BHD. (Company No. 200212345A) (Incorporated in Malaysia) AND ITS SUBSIDIARIES
3.17(e) 3.23(c)
NOTES TO THE FINANCIAL STATEMENTS FOR THE FINANCIAL YEAR ENDED 31 DECEMBER 2011
23
1. GENERAL INFORMATION 3.24(a) 3.24(b)
33.5
30.2, 30.26
30.2
The Company is a private limited company domiciled and incorporated in Malaysia. The registered office and principal place of business is located at 83A, Jalan Emas 1, Taman Sri Skudai, 81300 Johor Bahru, Johor. The principal activities of the Company are that of investment holding and provision of management services to its subsidiaries. The Group is principally engaged in investment holding, research and development, property investment, construction activities, rending of concession services, and agriculture products. There have been no significant changes in the nature of the activities during the financial year. The Company is a subsidiary of Be Competent Sdn. Bhd., a company incorporated in Malaysia, which is also regarded by the directors as the ultimate holding company. The financial statements of each entity in the Group are presented in the functional currency, which is the currency of the primary economic environment in which the entities operate. The functional currency of the Company is Ringgit Malaysia (‘RM’) as the sales and purchases are mainly denominated in RM, receipts from operations are usually retained in RM and funds from financing activities are mainly generated in RM. For the purpose of the consolidated financial statements, the financial statements of each entity within the Group are expressed in RM, which is the functional currency of the Company, and the presentation currency for the consolidated financial statements.
30.26 If the presentation currency is different from the functional currency: The financial statements of the Group and the Company are presented in Ringgit Malaysia as the shareholders of the Company are primarily residing in Malaysia. Assets and liabilities for each statement of financial position presented are translated from the functional currency, United States Dollar, into Ringgit Malaysia at the closing rate at the end of the reporting period. Income and expenses for each statement of comprehensive income presented are translated at exchange rates approximate the exchange rates at the date of the transactions. All resulting exchange differences are recognised in other comprehensive income.
30.14 30.27
If there is a change in the functional currency: During the financial year, a substantial foreign operation (or the Company) has changed its functional currency from United States Dollar to Ringgit Malaysia as the currency that mainly influences the denomination and settlement of the sales price, cost of sales has changed. The translation procedure for the change of the functional currency has been applied prospectively from the date of the change.

FRS Ref. 3.23(a)
3.23(b)
ILLUSTRATIVE GROUP SDN. BHD. (Company No. 200212345A) (Incorporated in Malaysia) AND ITS SUBSIDIARIES
3.17(e) 3.23(c)
NOTES TO THE FINANCIAL STATEMENTS FOR THE FINANCIAL YEAR ENDED 31 DECEMBER 2011
24
8.5 2. SIGNIFICANT ACCOUNTING POLICIES 3.3, 8.4(a) The consolidated financial statements of the Group and the financial statements of the Company have been
prepared in accordance with the FRS for SMEs.
8.5(a)
Basis of Preparation The financial statements have been prepared on the historical cost basis, except for the revaluation of certain assets and liabilities. The principal accounting policies adopted are set out below.
9.2 9.4 9.26, 9.27(b)
9.18
9.17
9.20 9.21
9.15
Basis of Consolidation The consolidated financial statements incorporate the financial statements of the parent and all subsidiaries. Subsidiaries are entities controlled by the parent. Control exists when the parent has the power to govern the financial and operating policies of an entity so as to obtain benefits from its activities. Investment in subsidiaries are accounted for in the Company’s separate financial statements at cost less any accumulated impairment losses. The income and expenses of a subsidiary are included in the consolidated financial statements from the acquisition date until the date on which the parent ceases to control the subsidiary. Any difference between the proceeds from the disposal of a subsidiary and the carrying amount as at the date of disposal, excluding the cumulative amount of any exchange differences that relate to a foreign subsidiary recognised in equity, is recognised in the consolidated statement of comprehensive income as gain or loss on the disposal of the subsidiary. Consolidated financial statements are prepared using uniform accounting policies for like transactions and other events and conditions in similar circumstances. Non-controlling interests are presented in the consolidated statement of financial position within equity, separately from the equity of the owners of the parent. Non-controlling interests are also separately disclosed in the consolidated statement of comprehensive income. All intragroup balances, transactions, income and expenses are eliminated in full.
19.6 19.11 19.14
19.24(a)
Business Combinations Business combinations are accounted for by applying the purchase method. The cost of a business combination is measured at the aggregate of the fair values, at the date of exchange, of assets given, liabilities incurred or assumed, and equity instruments issued by the Group, in exchange for control of the acquiree, plus any costs directly attributable to the business combination. At the acquisition date, the Group allocates the cost of a business combination by recognising the acquiree’s identifiable assets, liabilities and contingent liabilities at their fair values. Any excess of the cost of the business combination over the acquirer’s interest in the net fair value of the identifiable assets, liabilities and contingent liabilities is recorded as goodwill. If, after reassessment, the Group’s interest in the net fair value of the identifiable assets, liabilities and contingent liabilities recognised exceeds the cost of the business combination, the excess is recognised immediately in profit or loss.

FRS Ref. 3.23(a)
3.23(b)
ILLUSTRATIVE GROUP SDN. BHD. (Company No. 200212345A) (Incorporated in Malaysia) AND ITS SUBSIDIARIES
3.17(e) 3.23(c)
NOTES TO THE FINANCIAL STATEMENTS FOR THE FINANCIAL YEAR ENDED 31 DECEMBER 2011
25
22.19
In the consolidated financial statements, non-controlling interest in the net assets of a subsidiary is included in equity. The Group treats changes in parent’s controlling interest in a subsidiary that does not result in a loss of control as transactions with equity holders in their capacity as equity holders. Accordingly, the carrying amount of the non-controlling interest is adjusted to reflect the change in the parent’s interest in the subsidiary’s net assets. Any difference between the amount by which the non-controlling interest is so adjusted and the fair value of the consideration paid or received, if any, are recognised directly in equity and attributed to equity holders of the parent. Gain or loss on these changes and the change in the carrying amounts of assets (including goodwill) or liabilities as a result of such transactions is not recognised.
17.4, 17.31(a) 17.15
17.31(b) 17.31(c) 17.20
17.19 17.23 17.27 17.30
17.28
Property, Plant and Equipment The cost of an item of property, plant and equipment is recognised as an asset when it is probable that future economic benefits associated with the item will flow to the Group and the Company and the cost of the item can be measured reliably. After recognition as an asset, all items of property, plant and equipment are carried at cost less any accumulated depreciation and any accumulated impairment losses. Except for freehold land and properties under construction which are not depreciated, depreciation is provided on a straight-line method so as to write off the depreciable amount of the following assets over their estimated useful lives, as follows: Buildings 50 years Plant and machinery 10 ~ 12 years Motor vehicles 5 years Equipment, furniture and fittings 3 ~ 5 years Depreciation of an asset begins when it is ready for its intended use. If there is an indication of a significant change in factors affecting the residual value, useful life or asset consumption pattern since the last annual reporting date, the residual values, depreciation method and useful lives of depreciable assets are reviewed, and adjusted prospectively. The carrying amounts of items of property, plant and equipment are derecognised on disposal or when no future economic benefits are expected from their use or disposal. Any gain or loss arising from the derecognition of items of property, plant and equipment, determined as the difference between the net disposal proceeds, if any, and the carrying amounts of the item, is recognised in profit or loss. Neither the sale proceeds nor any gain on disposal is classified as revenue.
Investment Property 16.2 16.5 16.7
16.3
16.8
Investment property which is held to earn rentals or for capital appreciation or both, is measured initially at its cost. Transaction costs are included in the initial measurement. After recognition as investment property, items of investment property whose fair value can be measured reliably without undue cost or effort are measured at fair value at each reporting date with changes in fair value recognised in profit or loss. Property interests held under operating leases are not classified and accounted for as investment property. If a reliable measure of fair value is no longer available without undue cost or effort for an item of investment property measured at fair value, it is thereafter account for as property, plant and equipment in accordance with Section 17 of the FRS for SMEs. The carrying amount of the investment property on that date becomes its cost.

FRS Ref. 3.23(a)
3.23(b)
ILLUSTRATIVE GROUP SDN. BHD. (Company No. 200212345A) (Incorporated in Malaysia) AND ITS SUBSIDIARIES
3.17(e) 3.23(c)
NOTES TO THE FINANCIAL STATEMENTS FOR THE FINANCIAL YEAR ENDED 31 DECEMBER 2011
26
19.22 19.23
19.23 27.25 27.28
Goodwill Goodwill arising on the acquisition of a subsidiary, being the excess of the cost of the business combination over the Group’s interest in the net fair value of the identifiable assets, liabilities and contingent liabilities recognised, is initially measured at cost and recognised as an asset. After initial recognition, goodwill is measured at cost less any accumulated amortisation and any accumulated impairment losses. Goodwill amortisation is calculated by applying the straight-line method to its estimated useful life. The estimated useful life of goodwill is 10 years. For the purpose of impairment testing, goodwill is allocated, at the acquisition date, to each of the Group’s cash-generating units that are expected to benefit from the synergies of the combination, irrespective of whether other assets or liabilities of the acquiree are assigned to those units. A cash-generating unit to which goodwill has been allocated is tested for impairment annually, and whenever there is an indication that the unit may be impaired, by comparing the carrying amount of the unit, including the goodwill, with the recoverable amount of the unit. An impairment loss is recognised for a cash-generating unit when the recoverable amount of the unit is less than the carrying amount of the unit. Any impairment loss recognised is first allocated to reduce the carrying amount of any goodwill allocated to the unit and then, to the other assets of the unit within pro rata on the basis of the carrying amount of each applicable asset in the unit. Any impairment loss recognised for goodwill is not reversed.
Other Intangible Assets 18.4 Intangible assets are recognised when it is probable that expected future economic benefits that are
attributable to the assets will flow to the Group and the Company, the cost of the assets can be measured reliably and the assets do not result from expenditure incurred internally on an intangible item.
18.9 18.18 18.27(b) 18.27(a) 18.24
i) Intangible Assets Acquired Separately Intangible assets acquired separately are measured at cost initially. Subsequently, intangible assets are measured at cost less any accumulated amortisation and any accumulated impairment losses. Patents and trademarks are amortised on a straight-line method over the estimated useful lives of 5 years. The amortisation period and method are reviewed if there is an indication of a significant change in factors affecting the residual value, useful life or asset consumption pattern since the last annual reporting date.
18.14 ii) Internally Generated Intangible Assets Costs associated with internally generated intangible assets arising from research and development activities are recognised as an expense when they are incurred unless they form part of the cost of another asset that meets the recognition criteria.
34.15 iii) Service Concession Rights Service concession rights are initially measured at fair value and are recognised to the extent that the Group receives a right to charge users of the toll service. Subsequently, service concession rights are measured at cost less any accumulated amortisation and any accumulated impairment losses. Concession rights are amortised on a straight line over the concession period.
14.12(a) Investment in Associates 14.2 14.3 9.27(b)
An associate is an entity over which the Group has significant influence and that is neither a subsidiary nor an interest in a joint venture. Significant influence is the power to participate in the financial and operating policy decisions of the investee but is not control or joint control over those policies. Investment in associates, other than those for which there is a published price quotation, are accounted for in the Company’s separate financial statements at cost less any accumulated impairment losses.

FRS Ref. 3.23(a)
3.23(b)
ILLUSTRATIVE GROUP SDN. BHD. (Company No. 200212345A) (Incorporated in Malaysia) AND ITS SUBSIDIARIES
3.17(e) 3.23(c)
NOTES TO THE FINANCIAL STATEMENTS FOR THE FINANCIAL YEAR ENDED 31 DECEMBER 2011
27
14.8(i)
14.8
14.8(h)
14.8(e)
Investment in associates are accounted for in the Group’s consolidated financial statements using the equity method until the date the Group ceases to have significant influence over the associates. Under the equity method, investment in associates are initially recognised at the transaction price and is subsequently adjusted to reflect the Group’s share of the profit or loss and other comprehensive income of the associates after the date of acquisition. Losses of associates in excess of the Group’s interest in the associates, include any long-term interests that form part of the Group’s net investment in the associates, are not recognised. Profits or losses on transactions entered into between the Group and associates are eliminated to the extent of the Group’s interest in the associates.
15.19(a) Interests in Joint Ventures 15.3 15.2 15.14 15.15
A joint venture is a contractual arrangement whereby the Group and other parties undertake an economic activity that is subject to joint control, where the strategic financial and operating decisions relating to the activity require the unanimous control of the parties sharing control. Interests in jointly controlled entities are measured at transaction price excluding transaction costs at initial recognition. Interests in jointly controlled entities are subsequently measured at fair value, with changes in fair value recognised in profit or loss, at each reporting date. It is measured at cost less any accumulated impairment losses when it is impracticable to measure fair value reliably without undue cost or effort.
Impairment of Assets, Other Than Goodwill, Inventories and Financial Assets 27.7 27.8 27.11 27.20 27.21
27.22 27.30(b),(c) 27.31(c)
At each reporting date, the Group and the Company assess whether there is any indication that an asset may be impaired. If any such indication exists, the recoverable amount of the asset is estimated. When there is an indication that an asset may be impaired but it is not possible to estimate the recoverable amount of the individual asset, the Group and the Company determine the recoverable amount of the cash-generating unit to which the asset belongs. The recoverable amount of an individual asset and a cash-generating unit is the higher of the fair value less costs to sell and value in use. In assessing value in use, the estimated future cash flows are discounted to their present value using a pre-tax discount rate that reflects current market assessments of the time value of money and the risks specific to the asset. If the recoverable amount of an individual asset or a cash-generating unit is less than the carrying amount, an impairment loss is recognised to reduce the carrying amount to its recoverable amount. An impairment loss for a cash-generating unit is firstly allocated to reduce the carrying amount of any goodwill allocated to the cash-generating unit, and then, to the other assets of the unit pro rata on the basis of the carrying amount of each appropriate asset in the cash-generating unit. The recoverable amount is the higher of an asset’s or cash-generating unit’s fair value less to sell, value in use and zero. An impairment loss recognised in prior periods for an individual asset or the appropriate assets of a cash-generating unit is reversed when there has been a change in the estimates used to determine the asset’s recoverable amount. An impairment loss is reversed to the extent that the asset’s carrying amount does not exceed the carrying amount that would have been determined, net of depreciation, if no impairment loss had been recognised in prior periods. A reversal of an impairment loss is recognised immediately in profit or loss.

FRS Ref. 3.23(a)
3.23(b)
ILLUSTRATIVE GROUP SDN. BHD. (Company No. 200212345A) (Incorporated in Malaysia) AND ITS SUBSIDIARIES
3.17(e) 3.23(c)
NOTES TO THE FINANCIAL STATEMENTS FOR THE FINANCIAL YEAR ENDED 31 DECEMBER 2011
28
30.7
30.9
30.10 30.11
Foreign Currencies ~ Foreign Currency Transactions Transactions in foreign currencies are initially recognised in the functional currency by applying to the foreign currency amount the spot exchange rates between the functional currency and the foreign currency at the date of the transactions. At the end of each reporting period, foreign currency monetary items are translated using the closing rate. Non-monetary items that are measured at historical cost in a foreign currency are translated using the exchange rates at the date of the transactions. Non-monetary items that are measured at fair value in a foreign currency are translated using the exchange rates at the date when the fair value was determined. Exchange differences are recognised in profit or loss in the period in which they arise except when a gain or loss on a non-monetary item is recognised in other comprehensive income. If so, any exchange differences relating to that gain or loss is recognised in other comprehensive income.
30.12 30.13
Foreign Currencies ~ Exchange Differences on Net Investment in Foreign Operations Exchange differences arising on monetary items that forms part of the Company’s net investment in foreign operations are recognised in the profit or loss in the separate financial statements of the Company. In the consolidated financial statements, such exchange differences are recognised initially in other comprehensive income and accumulated in equity under the heading of translation reserves.
30.23
Foreign Currencies ~ Foreign Operations Assets and liabilities of foreign operations, including goodwill arising on the acquisition and any fair value adjustments, are translated into Singapore Dollar at the closing rate at the end of the reporting period. Income and expenses are translated at exchange rates approximating the exchange rates at the date of the transactions. All resulting exchange differences are recognised in other comprehensive income.
Biological Assets 34.2(a),34.4 34.5 34.7(b)
34.5
Biological assets for which fair value is readily determinable without undue cost or effort are recognised at fair value less costs to sell. Changes in fair value less costs to sell are recognised in profit or loss. Fair values are determined based on present value of the estimated cash flows relating to the biological assets by applying assumptions made by the independent valuer. The valuer makes use of the measurements of plants and confirms model assumptions and growth trends. At the time of harvesting, the fruits are recognised at fair value less costs to sell.
13.22(a) Inventories 13.4 13.5 13.18
13.19, 27.2
27.4
Inventories are measured at the lower of cost and estimated selling price less costs to complete and sell. Cost of inventories comprises all costs of purchase, costs of conversion and other costs incurred in bringing the inventories to their present location and condition. Cost of inventories is measured by using the First-in First-out method. At each reporting date, inventories are assessed for impairment. If an item of inventory is impaired, the carrying amount is reduced to its selling price less costs to complete and sell; the impairment loss is recognised immediately in profit or loss. At each subsequent reporting date, the Group and the Company make a new assessment of selling price less costs to complete and sell. If there is any indication that an impairment loss recognised in prior periods may no longer exist or when there is clear evidence of an increase in selling price less costs to complete and sell due to changed economic circumstances, an impairment loss is reversed to the extent that the new carrying amount is the lower of the cost and the revised selling price less costs to complete and sell.
FRS Ref. 3.23(a)
3.23(b)
ILLUSTRATIVE GROUP SDN. BHD. (Company No. 200212345A) (Incorporated in Malaysia) AND ITS SUBSIDIARIES
3.17(e) 3.23(c)
NOTES TO THE FINANCIAL STATEMENTS FOR THE FINANCIAL YEAR ENDED 31 DECEMBER 2011
29
Share-based Payments 26.5 The Group operates an equity-settled share-based payments scheme to allow the employees of the Group
to acquire ordinary shares of the Company. The fair value of the options granted is recognised as employees benefit expenses with a corresponding credit to equity-settled employee benefits reserves. The fair value determined at the grant date is expensed in profit or loss in accordance with Section 26 Share-based Payment over the periods during which the employees become unconditionally entitled to the options, based on the Group’s estimate of the ordinary shares that will eventually vest, and adjusted for the effect of non market-based vesting conditions. At each reporting date, the Group revises the estimates of the number of options that are expected to become exercisable, and recognises the impact of the revision of the original estimates in employees benefit expenses and in a corresponding credit to equity-settled employee benefits reserves over the remaining vesting period.
26.14 If the entity has cash-settled share-based payment transactions, disclose the following accounting policy: The Group and the Company also incurred cash-settled share-based payment transactions. The liabilities incurred are measured at fair value. At each reporting date and date of settlement, the fair values were re-measured with any changes in fair value recognised in profit or loss for the period.
Provisions 21.4 21.7
A provision is recognised when the Group and the Company have an obligation at the reporting date as a result of a past event, it is probable that a transfer of economic benefits will be required to settle the obligation and a reliable estimate can be made of the amount of the obligation. The risks and uncertainties are taken into account in reaching the best estimate of a provision. When the effect of the time value of money is material, the amount recognised in respect of the provision is the present value of the expenditure expected to be required to settle the obligation.
Leases – as lessee
20.4 20.9 20.11
20.12
i) Finance Leases Leases of property, plant and equipment are classified as finance lease where substantially all the risks and benefits incidental to the ownership of the assets, but not the legal ownership, are transferred to the Group and the Company. The Group and the Company initially recognise its rights of use and obligations under finance leases as assets and liabilities in the statements of financial position at amounts equal to the fair value of the leased assets or, if lower, the present value of the minimum lease payments, determined at the inception of the leases. Any initial direct costs are added to the amount recognised as an asset. Minimum lease payments are apportioned between the finance charge and the reduction of the outstanding liability using the effective interest method. A finance charge is allocated to each period during the lease term so as to produce a constant periodic rate of interest on the remaining balance of the liability. Contingent rents are charged as an expense in the period in which they are incurred. The depreciation policy for depreciable leased assets is consistent with that of depreciable assets that are owned. If there is no reasonable certainty that the Group and the Company will obtained ownership by the end of the lease term, the leased assets are fully depreciated over the shorter of the lease terms and their useful life.

FRS Ref. 3.23(a)
3.23(b)
ILLUSTRATIVE GROUP SDN. BHD. (Company No. 200212345A) (Incorporated in Malaysia) AND ITS SUBSIDIARIES
3.17(e) 3.23(c)
NOTES TO THE FINANCIAL STATEMENTS FOR THE FINANCIAL YEAR ENDED 31 DECEMBER 2011
30
20.4 20.15
ii) Operating Leases A lease is classified as an operating lease if it does not transfer substantially all the risks and rewards incidental to ownership. Lease payments under operating leases are recognised as expense on a straight-line basis over the lease term.
Government Grants 24.4 24.5
Government grants that do not impose specified future performance conditions are recognised at their fair value in income when the grant proceeds are receivable. Government grants that impose specified future performance conditions are recognised at their fair value in income only when the performance conditions are met. Government grants received before the revenue recognition criteria are satisfied are recognised as a liability.
Financial Assets 11.12 11.13
11.41
Financial assets are recognised in the statements of financial position when the Group and the Company become a party to the contractual provisions of the instrument. On initial recognition, financial assets are measured at transaction price, include transaction costs for financial assets not at fair value through profit or loss, unless the arrangement constitutes, in effect, a financing transaction. After initial recognition, financial assets are classified into one of three categories: financial assets measured at fair value through profit or loss, financial assets that are debt instruments measured at amortised cost, and financial assets that are equity instruments measured at cost less impairment.
11.14(c)(i), 12.8 11.14(c)(i)
12.9
i) Financial Assets Measured at Fair Value Through Profit or Loss Financial assets are classified as at fair value through profit or loss when the financial assets are within the scope of Section 12 of the FRS for SMEs or if the financial assets are publicly traded or their fair value can otherwise be measured reliably. Changes in fair value are recognised in profit or loss. If a reliable measure of fair value is no longer available for an equity instrument that is not publicly traded but is measured at fair value through profit or loss, its fair value at the last date that instrument was reliably measurable is treated as the cost of the instrument, and it is measured at this cost amount less impairment until a reliable measure of fair value becomes available.
11.14(a) 11.16
ii) Financial Assets that are Debt Instruments Measured at Amortised Cost After initial recognition, debt instruments are measured at amortised cost using the effective interest method. Debt instruments that are classified as current assets are measured at the undiscounted amount of the cash or other consideration expected to be received.
Effective interest method is a method of calculating the amortised cost of financial assets and of allocating the interest income over the relevant period. The effective interest rate is the rate that exactly discounts estimate future cash receipts through the expected life of the financial assets or, when appropriate, a shorter period, to the carrying amount of the financial assets.
11.14(c)(ii), 12.8
iii) Financial Assets that are Equity Instruments Measured at Cost Less Impairment Equity instruments that are not publicly traded and whose fair value cannot otherwise be measured reliably, and contracts linked to such instruments that, if exercised, will result in delivery of such instruments, are measured at cost less impairment.

FRS Ref. 3.23(a)
3.23(b)
ILLUSTRATIVE GROUP SDN. BHD. (Company No. 200212345A) (Incorporated in Malaysia) AND ITS SUBSIDIARIES
3.17(e) 3.23(c)
NOTES TO THE FINANCIAL STATEMENTS FOR THE FINANCIAL YEAR ENDED 31 DECEMBER 2011
31
11.21
11.22 11.24
11.25(a)
11.25(b)
11.25(b)
vii) Impairment of Financial Assets At the end of each reporting period, the Group and the Company assess whether there is any objective evidence that financial assets that are measured at cost or amortised cost, are impaired. Objective evidence could include: - significant financial difficulty of the issuer or obligor. - a breach of contract. - the lender granting to the borrower a concession that the lender would not otherwise consider. - it becoming probable that the borrower will enter bankruptcy or other financial reorganisation. - observable data indicating that there is a measurable decrease in the estimated future cash flows from
the financial assets since the initial recognition of those assets. For certain category of financial assets, such as trade receivables, if it is determined that no objective evidence of impairment exists for an individually assessed financial asset, whether significant or not, the assets are included in a group with similar credit risk characteristics and collectively assessed for impairment. Impairment losses, in respect of financial assets carried at amortised cost are measured as the differences between the assets’ carrying amounts and the present values of their estimated cash flows discounted at the assets’ original effective interest rate. If there is objective evidence that impairment losses have been incurred on financial assets carried at cost less impairment, the amount of any impairment loss is measured as the difference between the asset’s carrying amount and the best estimate of the amount that the Group and the Company would receive for the asset if it were to be sold at the reporting date. The carrying amounts of the financial assets are reduced directly, except for the carrying amounts of trade receivables which are reduced through the use of an allowance account. Any impairment loss is recognised in profit or loss immediately. If, in later periods, the amount of any impairment loss decreases, the previously recognised impairment losses are reversed directly, except for the amounts related to trade receivables which are reversed to write back the amount previously provided in the allowance account. The reversal is recognised in profit or loss immediately.
11.33(a),(b) 11.33(c)
viii) Derecognition of Financial Assets Financial assets are derecognised when the contractual rights to the cash flows from the financial assets expire, or are settled, or the Group and the Company transfer to another party substantially all of the risks and rewards of ownership of the financial assets. On derecognition of financial assets in their entirety, the differences between the carrying amounts and the sum of the consideration received and any cumulative gains or losses are recognised in profit or loss in the period of the transfer.
Liabilities and Equity
22.3
22.8
i) Equity Instruments Ordinary shares are classified as equity. Equity instruments are any contracts that evidence a residual interest in the assets of the Company after deducting all of its liabilities. Equity instruments issued by the Company are measured at the fair value of the cash or other resources received or receivable, net of direct costs of issuing the equity instruments. If payment is deferred and the time value of money is material, the initial measurement shall be on a present value basis.

FRS Ref. 3.23(a)
3.23(b)
ILLUSTRATIVE GROUP SDN. BHD. (Company No. 200212345A) (Incorporated in Malaysia) AND ITS SUBSIDIARIES
3.17(e) 3.23(c)
NOTES TO THE FINANCIAL STATEMENTS FOR THE FINANCIAL YEAR ENDED 31 DECEMBER 2011
32
22.17 Distributions to owners are deducted from the equity, net of any related income tax benefits.
22.16 ii) Treasury Shares When the Company reacquires its own equity instruments (‘treasury shares’), treasury shares are deducted from equity at the fair value of the consideration given. No gains or losses are recognised in profit or loss on the purchase, sale, issue and cancellation of the treasury shares.
22.13
22.14
22.15
iii) Compound Financial Instruments Compound financial instruments issued by the Company are classified separately as financial liabilities and equity in accordance with the substance of the arrangement. The Company first determines the amount of the liability component by measuring the fair value of a similar liability that does not have a conversion feature or similar associated equity component. The Company then allocates the residual amount as the equity component. Transaction costs are allocated between the liability component and the equity component on the basis of their relative fair values. The allocation is not revised in a subsequent period. In the period after the compound financial instruments were issued, the Company then systematically recognises any difference between the liability component and the principal amount payable at maturity as additional interest expense using the effective interest method.
11.12 11.13
v) Financial Liabilities Financial liabilities are recognised on the statements of financial position when the Group and the Company become a party to the contractual provisions of the instrument. On initial recognition, financial liabilities are measured at transaction price, include transaction costs for financial liabilities not at fair value through profit or loss unless the arrangement constitutes, in effect, a financing transaction. After initial recognition, financial liabilities are classified into one of two categories: financial liabilities measured at fair value through profit or loss, or financial liabilities that are debt instruments measured at amortised cost.
12.8
12.9
vi) Financial Liabilities Measured at Fair Value Through Profit or Loss Financial liabilities are classified as at fair value through profit or loss when the financial liabilities are within the scope of Section 12 of the FRS for SMEs or if the financial liabilities are publicly traded or their fair value can otherwise be measured reliably. If a reliable measure of fair value is no longer available for an equity instrument that is not publicly traded but is measured at fair value through profit or loss, its fair value at the last date that instrument was reliably measurable is treated as the cost of the instrument, and it is measured at this cost amount less impairment until a reliable measure of fair value becomes available.
11.14(a) 11.16
vii) Financial Liabilities that are Debt Instruments Measured at Amortised Cost After initial recognition, financial liabilities other than financial liabilities at fair value through profit or loss are measured at amortised cost using the effective interest method. Gains or losses are recognised in profit or loss when the financial liabilities are derecognised or impaired. Effective interest method is a method of calculating the amortised cost of financial liabilities and of allocating the interest expense over the relevant period. The effective interest rate is the rate that exactly discounts estimate future cash payments through the expected life of the financial liabilities or, when appropriate, a shorter period, to the carrying amount of the financial liabilities.
FRS Ref. 3.23(a)
3.23(b)
ILLUSTRATIVE GROUP SDN. BHD. (Company No. 200212345A) (Incorporated in Malaysia) AND ITS SUBSIDIARIES
3.17(e) 3.23(c)
NOTES TO THE FINANCIAL STATEMENTS FOR THE FINANCIAL YEAR ENDED 31 DECEMBER 2011
33
11.36 11.38
viii) Derecognition of Financial Liabilities Financial liabilities are derecognised when the obligation specified in the contract is discharged, cancelled or expires. Any difference between the carrying amounts of financial liabilities derecognised and the consideration paid is recognised in profit or loss.
23.30 Revenue 23.3
23.10
23.14 23.17,23.18
23.29(a)
23.29(b) 23A.16 23.29(c)
Revenue is measured at the fair value of the consideration received or receivable, net of any trade discounts, volume rebates and indirect taxes applicable to the revenue. Revenue is recognised in the statements of comprehensive income based on the following: i) Sales of Goods Revenue from sales of goods is recognised when all the following conditions are satisfied: - the Group and the Company have transferred to the buyer the significant risks and rewards of ownership of the goods;
- the Group and the Company retain neither continuing managerial involvement to the degree usually associated with ownership nor effective control over the goods sold;
- the amount of revenue can be measured reliably; - it is probable that the economic benefits associated with the transaction will flow to the Group and the Company; and
- the costs incurred or to be incurred in respect of the transaction can be measured reliably. ii) Rendering of Services Revenue from rendering of services is recognised by reference to the stage of completion of the transaction at the end of the reporting period when the outcome of the transaction can be estimated reliably. iii) Installation Fees Revenue from installation services is recognised by reference to the stage of completion of the installation, unless they are incidental to the sales of goods, in which case they are recognised when the goods are sold. iv) Interest Revenue Interest revenue is recognised using the effective interest method. v) Royalty Revenue, Licence Fee Revenue and Property Rental Revenue Royalty revenue, licence fee revenue and property rental revenue are recognised on an accrual basis in accordance with the substance of the agreements when it is probable that the economic benefits associated with the transactions will flow to the Group and the Company and the amount of the revenue can be measured reliably. The Group operates ‘Free Unit Scheme’ to encourage its customers to acquire usage credits for its ‘X The 2’ software from the Group’s web site where customers will be awarded free credits in the future. On initial recognition of revenue, the fair value of the consideration received or receivable in respect of the initial sale is allocated between the award credits granted and the licence fee revenue. The consideration allocated to the award credits are measured by reference to their fair value, which is the amount for which the award credits could be sold separately. The consideration allocated to award credits is deferred and recognised as revenue when award credits are redeemed and the Group fulfils the obligations to supply the awards. vi) Dividend Revenue Dividend revenue is recognised when the shareholder’s rights to receive payment is established.

FRS Ref. 3.23(a)
3.23(b)
ILLUSTRATIVE GROUP SDN. BHD. (Company No. 200212345A) (Incorporated in Malaysia) AND ITS SUBSIDIARIES
3.17(e) 3.23(c)
NOTES TO THE FINANCIAL STATEMENTS FOR THE FINANCIAL YEAR ENDED 31 DECEMBER 2011
34
vii) Construction Contracts 23.17 23.31(b) 23.31(c)
‘
23.25
23.26
When the outcome of a construction contract activity can be estimated reliably, contract revenue and contract costs associated with the construction contract are recognised as revenue and expenses respectively by reference to the stage of completion of the contract activity at the end of the reporting period. Stage of completion is determined based on the proportion that contract costs incurred for work performed to date bear to the estimated total contract costs.
When the outcome of a construction contract cannot be estimated reliably, contract revenue are recognised only to the extent of contract costs incurred that it is probable will be recoverable and contract costs are recognised as expense in the period in which they are incurred.
When it is probable that total contract costs will exceed total contract revenue, the expected loss is recognised as expense immediately, with a corresponding provision for an onerous contract.
Employee Benefits i) Short-term Employment Benefits 28.5
28.6 28.7
28.6
28.8
Short-term employment benefits, such as wages, salaries and other benefits, are recognised as expense when the employees have rendered services to the Group and the Company.
The expected cost of accumulating compensated absences are recognised when the employees render services that increase their entitlement to future compensated absences. The expected cost of non-accumulating compensated absences, such as sick and medical leaves, are recognised when the absences occur.
The expected cost of accumulating compensated absences are measured as the additional amount expected to be paid as a result of the unused entitlement that has accumulated at the end of the reporting period.
The expected cost of profit-sharing and bonus payments are recognised when the Group and the Company have a present legal or constructive obligation to make such payments as a result of past events and a reliable estimate of the obligation can be made. A present obligation exists when the Group and the Company have no realistic alternative but to make the payments.
ii) Defined Contribution Plan 28.13
Contributions payable to the defined contribution plan are recognised as a liability and an expense when the employees have rendered services to the Group and the Company.
iii) Defined Benefit Plan 28.18 28.24 28.41(b)
28.15
The Group operates a funded Retirement Benefit Plan (‘the Plan’) for its eligible employees. Contributions to the Plan are made quarterly and are charged to profit or loss so as to spread the cost of the Plan over the employees’ working lives in the Group. The Group’s obligations under the Plan are determined based on triennial actuarial valuations where the amounts of benefits that the employees have earned in return for their services in the current and prior periods are estimated. The present values of the Plan’s obligations and the related current service and any past service cost are determined using the Projected Unit Credit Method. Actuarial gains and losses are recognised as income or expense in profit or loss in the period in which they arise. The Plan recognised in the statements of financial position is the net amount of the present value of the Plan adjusted for unrecognised past service cost, minus the fair value of the Plan assets. Any asset resulting from the computation is stated at the lower of the amount determined or the total of any cumulative past service cost, and the present value of available refunds and reductions in future contribution to the Plan.

FRS Ref. 3.23(a)
3.23(b)
ILLUSTRATIVE GROUP SDN. BHD. (Company No. 200212345A) (Incorporated in Malaysia) AND ITS SUBSIDIARIES
3.17(e) 3.23(c)
NOTES TO THE FINANCIAL STATEMENTS FOR THE FINANCIAL YEAR ENDED 31 DECEMBER 2011
35
28.21 Gains or losses on the curtailment or settlement of the Plan are recognised when the curtailment or settlement occurs.
iv) Termination Benefits 28.34 28.35
28.36
Termination benefits are recognised as a liability and an expense when the Group and the Company are demonstrably committed to either terminate the employment of the employees before the normal retirement date, or provide termination benefits as a result of an offer made for voluntary redundancy. The Group and the Company are demonstrably committed to a termination when the Group and the Company have a detailed formal plan for the termination and are without realistic possibility of withdrawal. Termination benefits in relation to the offer made to encourage voluntary redundancy are measured based on the number of employees expected to accept the offer.
Borrowing Costs 25.2 All borrowing costs are recognised as an expense in profit or loss in the period in which they are incurred.
Income Tax 29.7 29.4 29.6
29.29
29.14
29.15 29.16
29.18 29.19 29.20
Tax expense is recognised in profit or loss, except that a change attributable to an item of income or expense recognised as other comprehensive income is also recognised in other comprehensive income. Tax payable on taxable profit for current and past periods is recognised as a current tax liability to the extent unpaid. If the amount paid in respect of the current and past periods exceeds the amount payable for those periods, the excess is recognised as a current tax asset. Current tax assets and liabilities are measured at the amounts expected to be paid or recovered, using the tax rates and laws that have been enacted or substantially enacted by the reporting date. Current tax assets and liabilities are offset only when the Group and the Company have a legally enforceable right to set off the amounts and intend either to settle on a net basis, or to realise the asset and settle the liability simultaneously. Deferred tax is provided in full on temporary differences which are the differences between the carrying amounts in the financial statements and the corresponding tax base of an asset or liability at the end of the reporting period. Deferred tax liabilities are recognised for all taxable temporary differences that are expected to increase taxable profit in the future. Deferred tax assets are recognised for all deductible temporary differences that are expected to reduce taxable profit in the future and the carryforward of unused tax losses and unused tax credits. Deferred tax liabilities and assets are not recognised in respect of the temporary differences associated with unremitted earnings from foreign subsidiaries, associates and joint ventures to the extent that the investment is essentially permanent in duration. Deferred tax liabilities are also not recognised for temporary difference associated with the initial recognition of goodwill. Deferred tax liabilities and assets reflect the tax consequences that would follow from the manner in which the Group and the Company expect to recover or settle the carrying amounts of their assets and liabilities and are measured at the tax rates and laws that are expected to apply to the period when the asset is realised or the liability is settled, based on tax rates that have been enacted or substantially enacted by the reporting date.

FRS Ref. 3.23(a)
3.23(b)
ILLUSTRATIVE GROUP SDN. BHD. (Company No. 200212345A) (Incorporated in Malaysia) AND ITS SUBSIDIARIES
3.17(e) 3.23(c)
NOTES TO THE FINANCIAL STATEMENTS FOR THE FINANCIAL YEAR ENDED 31 DECEMBER 2011
36
29.21 29.22
The carrying amounts of the deferred tax assets are reviewed at each reporting date and a valuation allowance is recognised against deferred tax assets so that the net carrying amount equals the highest amount that is more likely than not to be recovered based on current or future taxable profit.
Cash and Cash Equivalents 7.2 Cash and cash equivalents in the statements of cash flows comprise cash and bank balances, short-term
bank deposits and other short-term, highly liquid investments that have a short maturity of three months or less from the date of acquisition, net of bank overdrafts.
3. TRANSITION TO THE FRS FOR SMES Basis of transition to the FRS for SMEs The Group’s financial statements for the financial year from 1 January 2010 to 31 December 2010 are the
first financial statements prepared in accordance with the FRS for SMEs, which is the beginning of the earliest period presented. The Group’s transition date is 1 January 2010. The Group prepared its opening FRS for SMEs statement of financial position at that date. The Group has applied all the mandatory exceptions and certain of the optional exemptions from full retrospective application of the FRS for SMEs. Previously, the Group presents the most recent financial statements under local generally accepted accounting principles (“local GAAP”).
35.10 Exemptions from full retrospective application The Group has elected to apply the following exemptions in preparing the financial statements:
35.10(d) i) Revaluation as deemed cost The Group has elected to use the previous local GAAP’s revaluation of property, plant and equipment,
investment property and intangible assets at 1 January 2010 as its deemed cost at the transition date.
Reconciliation The following reconciliations show the effect of the transition to the FRS for SMEs on the Group’s equity
and profit. 31 December
2010 1 January
2010 35.13(b) RM RM Total equity under local GAAP 19,095,050 16,346,572 Write-off of deferred charges that do not meet the FRS for SMEs definition of
an intangible assets
368,000
237,200 Fair value adjustment to biological assets 105 70
Total equity under FRS for SMEs
19,464,064
16,583,842
2010 35.13(c) RM Results for the financial year under local GAAP 4,708,036 Write-off of deferred charges that do not meet the FRS for SMEs definition of an intangible
assets 130,800
Fair value adjustment to biological assets 35
Profit for the financial year under FRS for SMEs
4,838,871
FRS Ref. 3.23(a)
3.23(b)
ILLUSTRATIVE GROUP SDN. BHD. (Company No. 200212345A) (Incorporated in Malaysia) AND ITS SUBSIDIARIES
3.17(e) 3.23(c)
NOTES TO THE FINANCIAL STATEMENTS FOR THE FINANCIAL YEAR ENDED 31 DECEMBER 2011
37
35.10(a) i) Write-off of deferred charges that do not meet the FRS for SMEs definition of an intangible assets Costs in relation to deferred charges that do not meet the definition of intangible assets under the FRS for SMEs have been included in retained earnings at the Group’s date of transition.
35.10(a) ii) Fair value adjustment to biological assets Previously, biological assets were stated at cost less any accumulated impairment losses. This adjustment reflects the measurement of the Group’s biological assets to fair value.
4. CRITICAL ACCOUNTING JUDGEMENTS AND KEY SOURCES OF ESTIMATION UNCERTAINTY 8.6 Critical Judgements in Applying the Accounting Policies 16.10(a)
The judgements, apart from those involving estimations described below, that the management has made in the process of applying the accounting policies and that have the most significant effect on the amounts recognised in the financial statements, other than those disclosed in Note 9, are as follows: 1. Fair Value of Investment Property, Jointly Controlled Entities and Other Financial Assets and Liabilities The fair value of investment property is derived from the current market prices of comparable real estate. The fair value is based on a valuation made by independent appraisers who hold a recognised and relevant valuation licence and have recent experience in valuing office buildings in the same location as the Group’s investment property. On the other hand, the fair value for certain other financial assets and financial liabilities are obtained from the quoted price in an active market, if quoted prices are unavailable, the price of a recent transaction for an identical financial assets or liabilities provides evidence of fair value as long as there has not been a significant change in economic circumstances or a significant lapse of the time since the transaction took place.
2. Fair Value of Biological Assets Biological assets, are valued at fair value less costs to sell. However, the market price and number of saleable assets may be significantly changed at harvest stage.
8.7 Key Sources of Estimation Uncertainty The key assumptions concerning the future, and other key sources of estimation uncertainty at the
reporting date, that have a significant risk of causing a material adjustment to the carrying amounts of assets and liabilities within the next financial year, other than those disclosed in Notes 26, 27, 29 and 33, are as follows: 1. Current Tax Liabilities Inland Revenue Board (IRB) has disqualified certain revenue of a subsidiary as tax exempt income (which are exempted from income tax), and raised income tax assessments on the chargeable income. The tax payable on the chargeable income from the financial year ended 31 December 2005 to 2010 is RM1 million. However, the subsidiary has appealed to the IRB on this decision. Based on the evidences available, the management is confidence that the appeal will be successful. Hence, additional tax liabilities have not been made in the financial statements.
2. Impairment Losses for Trade Receivables At the end of the reporting period, included in the allowance account for trade receivables of the Group is a collectively assessed impairment losses for trade receivables amounting to approximately RM23,000 (2010: RM30,000) representing 1% (2010: 3%) of the total trade receivables at the end of the reporting period. The estimates of collectively assessed impairment for trade receivables are based on the historical default rate. Hence, should the actual default rate becomes higher than the estimated default rate, the Group may be required to charge additional impairment losses to the profit or loss within the next financial year.
FRS Ref. 3.23(a)
3.23(b)
ILLUSTRATIVE GROUP SDN. BHD. (Company No. 200212345A) (Incorporated in Malaysia) AND ITS SUBSIDIARIES
3.17(e) 3.23(c)
NOTES TO THE FINANCIAL STATEMENTS FOR THE FINANCIAL YEAR ENDED 31 DECEMBER 2011
38
10.18 3. Change of Estimated Useful Lives for Property, Plant and Equipment The Group reviews the estimated useful lives of property, plant and equipment annually. During the financial year, the estimated useful lives of certain items of plant and machinery has been reduced from 12 years to 10 years after considering the changes in technological advancement and the market demand for goods produced using these items of plant and machinery.
The impact of the change in the estimated useful lives is to increase the depreciation in profit or loss by RM29,200 for the current financial year. The financial effects for the change in depreciation rate in 2011 and 2012 are estimated to increase the depreciation by RM17,560 and RM46,600 respectively, if there are no disposals of these assets.
4. Impairment Loss of Property, Plant and Equipment
The Group’s property, plant and equipment comprise a significant portion of the Group’s total assets. Changes in technology or industry conditions may cause the estimated period of use or the value of these assets to change. Long-lived assets including property, plant and equipment are reviewed for impairment at least annually or whenever events or changes in circumstances have indicated that their carrying amounts may not be recoverable. If any such indication exists, the recoverable amount is estimated.
The recoverable amount of an asset is the greater of its fair value less costs to sell and value in use. In assessing value in use, the estimated future cash flows are discounted to their present value using a pre-tax discount rate that reflects current market assessments of the time value of money and the risks specific to the asset, which requires significant judgement relating to level of revenue and amount of operating costs. The Group uses all readily available information in determining an amount that is a reasonable approximation of the value in use, including estimates based on reasonable and supportable assumptions and projections of revenue and operating costs. Changes in these estimates could have a significant impact on the carrying value of the assets and could result in additional impairment charge or reversal of impairment in future periods.

FRS Ref. 3.23(a)
3.23(b)
ILLUSTRATIVE GROUP SDN. BHD. (Company No. 200212345A) (Incorporated in Malaysia) AND ITS SUBSIDIARIES
3.17(e) 3.23(c)
NOTES TO THE FINANCIAL STATEMENTS FOR THE FINANCIAL YEAR ENDED 31 DECEMBER 2011
39
5. PROPERTY, PLANT AND EQUIPMENT
4.11(a) Freehold Land Buildings
Plant and
Machinery
Motor
Vehicles
Equipment,
Furniture and
Fittings Total
THE GROUP RM RM RM RM RM RM
Cost
17.31(d) At 1 January 2011 1,531,632 3,454,816 1,546,950 2,303,021 769,504 9,605,923
17.31(e)(i) Additions (Note 40) 288,881 2,326,336 238,652 1,594,500 45,960 4,494,329
17.31(e)(ii) Disposals (102) (650) (239) (32,012) (32,011) (65,014)
17.31(e)(ii) Disposal of a subsidiary (3,215) (65,913) (1,324,041) (932,085) (76,904) (2,402,158)
17.31(e)(iii) Acquisition of a subsidiary (Note 38) 143,085 59,605 - 295,950 79,605 578,245
17.31(iv) Transfer to investment property (Note 6) - (78,954) - - - (78,954)
16.10(e)(iii) Transfer from investment property (Note 6) 555,382 - - - - 555,382
17.31(vii) Exchange differences 123 349 - 65,954 3,201 69,627
17.31(vii) Other changes - - - - - -
17.31(d) At 31 December 2011 2,515,786 5,695,589 461,322 3,295,328 789,355 12,757,380
Accumulated Depreciation and Impairment Losses
17.31(d) At 1 January 2011 - 436,905 1,247,864 1,068,521 211,247 2,964,537
17.31(e)(ii) Disposals - (130) (120) (20,194) (26,591) (47,035)
17.31(e)(ii) Disposal of a subsidiary - (34,978) (903,048) (569,403) (54,921) (1,562,350)
17.31(e)(v) Impairment losses recognised (Note 35c) - - 2,046 - - 2,046
17.31(e)(v) Impairment losses reversed (Note 35c) - - (303) - - (303)
17.31(e)(vi) Depreciation (Note 35c) - 176,854 39,985 878,774 132,901 1,228,514
17.31(vii) Exchange differences - 87 - 32,910 636 33,633
17.31(vii) Other changes - - - - - -
17.31(d) At 31 December 2011 - 578,738 386,424 1,390,608 263,272 2,619,042
Carrying Amounts
17.31(d) At 31 December 2010 1,531,632 3,017,911 299,086 1,234,500 558,257 6,641,386
17.31(d) At 31 December 2011 2,515,786 5,116,851 74,898 1,904,720 526,083 10,138,338
FRS Ref. 3.23(a)
3.23(b)
ILLUSTRATIVE GROUP SDN. BHD. (Company No. 200212345A) (Incorporated in Malaysia) AND ITS SUBSIDIARIES
3.17(e) 3.23(c)
NOTES TO THE FINANCIAL STATEMENTS FOR THE FINANCIAL YEAR ENDED 31 DECEMBER 2011
40
4.11(a) Freehold Land Buildings
Motor
Vehicles
Equipment,
Furniture and
Fittings Total
THE COMPANY RM RM RM RM RM
Cost
17.31(d) At 1 January 2011 720 1,154 2,104 320 4,298
17.31(e)(i) Additions (Note 40) - 453 192 32 677
17.31(e)(ii) Disposals - - (744) (37) (781)
17.31(d) At 31 December 2011 720 1,607 1,552 315 4,194
Accumulated Depreciation and Impairment Losses
17.31(d) At 1 January 2011 - 107 1,045 129 1,281
17.31(e)(i) Disposals - - (101) (21) (122)
17.31(e)(vi) Depreciation (Note 35c) - 53 353 63 469
17.31(d) At 31 December 2011 - 160 1,297 171 1,628
Carrying Amounts
17.31(d) At 31 December 2010 720 1,047 1,059 191 3,017
17.31(d) At 31 December 2011 720 1,447 255 144 2,566
17.31 Note: The reconciliation need not be presented for prior periods.
17.32(a) 20.13(a)
The carrying amounts of the property, plant and equipment under finance lease are as follows:
The Group 2011 2010 RM RM Plant and machinery 28,594 92,021 Motor vehicles 487,490 143,932
516,084
235,953
17.32(a) The carrying amounts of the property, plant and equipment pledged to secure banking facilities are as
follows: The Group The Company 2011 2010 2011 2010 RM RM RM RM Freehold land 1,049,390 1,065,138 720 720 Buildings 2,060,302 1,087,194 1,395 837
3,109,692
2,152,332
2,115
1,557
FRS Ref. 3.23(a)
3.23(b)
ILLUSTRATIVE GROUP SDN. BHD. (Company No. 200212345A) (Incorporated in Malaysia) AND ITS SUBSIDIARIES
3.17(e) 3.23(c)
NOTES TO THE FINANCIAL STATEMENTS FOR THE FINANCIAL YEAR ENDED 31 DECEMBER 2011
41
6. INVESTMENT PROPERTY The
Group The
Company 2011 2011 RM RM
16.10(e) At 1 January 2011 4,094,179 1,198 16.10(e)(i) Additions 1,156,076 - 16.10(e)(i) Acquisition through business combination (Note 38) 1,217,852 - 16.10(e)(v) Disposals (45,666) (518) 16.10(e)(ii) Gain from fair value adjustment (Note 35c) 53,911 - 16.10(e)(v) Exchange gain/(loss) (156) - 16.10(e)(iv) Transfer from property, plant and equipment (Note 5) 78,954 - 16.10(e)(iii) Transfer to property, plant and equipment (Note 5) (555,382) -
16.10(e)
At 31 December 2011
5,999,768
680
16.10(b) The fair value of the investment property of the Group and the Company at 31 December 2011 is determined
by a valuation carried out by Messrs. Valuer & Co., an independent professional valuer, based on the open market values on an existing use basis. Messrs. Valuer & Co. has relevant recognised professional qualification and recent experience in valuing properties in the relevant locations.
16.10(c) The Group have pledged investment property with carrying amount of RM2,983,000 (2010: RM2,506,000) to secure banking facilities granted to the Group.
16.10(e) Note: The reconciliation need not be presented for prior periods.
7. GOODWILL The Group 2011 RM Cost 19.26 At 1 January 2011 3,828,841 19.26(a) Acquisition through business combinations (Note 38) 1,397,252 19.26(c) Derecognition on disposal of a subsidiary (Note 39) (176,930) 19.26(d) Exchange gain/(loss) 205,128 19.26 At 31 December 2011 5,254,291 Accumulated Impairment Losses 19.26 At 1 January 2011 - 19.26(b) Impairment losses recognised (Note 35c) 37,961 19.26 At 31 December 2011 37,961 Carrying Amounts 19.26 At 31 December 2011 5,216,330
19.26 Note: The reconciliation need not be presented for prior periods.

FRS Ref. 3.23(a)
3.23(b)
ILLUSTRATIVE GROUP SDN. BHD. (Company No. 200212345A) (Incorporated in Malaysia) AND ITS SUBSIDIARIES
3.17(e) 3.23(c)
NOTES TO THE FINANCIAL STATEMENTS FOR THE FINANCIAL YEAR ENDED 31 DECEMBER 2011
42
8. OTHER INTANGIBLE ASSETS The Group
Service Concession
Rights
Patents and Trademarks
Total RM RM RM
Cost 18.27(c) At 1 January 2011 3,896,583 463,752 4,360,335 18.27(e)(i) Additions 71,716 76,900 148,616 18.27(e)(ii) Disposals - - - 18.27(e)(iii) Acquisition through business combinations - - - 18.27(e)(vi) Exchange gain - 43 43 18.27(c) At 31 December 2011 3,968,299 540,695 4,508,994 18.27(e)(iv),(v)
Accumulated Amortisation and Impairment Losses
18.27(c) At 1 January 2011 - 137,695 137,695 18.27(e)(ii) Disposals - - - 18.27(e)(v) Impairment losses reversed (Note 35c) - (895) (895) 18.27(e)(iv) Amortisation (Note 35c) 154,678 54,070 208,748 18.27(e)(vi) Exchange loss - 20 20 18.27(c) At 31 December 2011 154,678 190,890 345,568 Carrying Amounts
18.27(e)
At 31 December 2010
3,896,583
326,057
4,222,640
18.27(e)
At 31 December 2011
3,813,621
349,805
4,163,426
18.27(e) Note: The reconciliation need not be presented for prior periods.
18.28(a) The carrying amounts of the Group’s patents and trademarks to protect the computer software developed by the Group in Malaysia, Singapore, United States, United Kingdom and Japan are RM349,805 (2010: RM326,057) at the reporting date. The average remaining amortisation period of these patents and trademarks is 8 years.
18.28(a) The carrying amounts of the Group’s service concession undertakes the operation, maintenance and toll collection of the XY Expressway and AX Expressway are RM3,813,621 (2010: RM3,896,583) at the reporting date. The average remaining amortisation period of the service concession is 30 years.
18.28(b) In 2010, the Group acquired the patent by way of a government grant in Hong Kong SAR. This intangible asset is initially recognised at the fair value of RM43,000, and subsequently measured using the cost model. The carrying amount of the said patent is RM37,500 (2010: RM42,000) at the reporting date.
18.28(c) The carrying amounts of other intangible assets whose titles are restricted are RM290,000 (2010: RM310,000).
18.28(c) The carrying amounts of other intangible assets pledged as securities for liabilities are RM50,000 (2010: RM50,000).

FRS Ref. 3.23(a)
3.23(b)
ILLUSTRATIVE GROUP SDN. BHD. (Company No. 200212345A) (Incorporated in Malaysia) AND ITS SUBSIDIARIES
3.17(e) 3.23(c)
NOTES TO THE FINANCIAL STATEMENTS FOR THE FINANCIAL YEAR ENDED 31 DECEMBER 2011
43
9. SUBSIDIARIES The Company 2011 2010 RM RM 9.26(b) Investment in subsidiaries 12,320,405 11,336,630 Less: Accumulated impairment losses (656) (656)
Carrying amounts
12,319,749
11,335,974
9.23(b) Although the Group holds not more than half of the voting power in AE S & I (Japan) Inc., a subsidiary incorporated in Japan, the Company has the power to cast the majority of votes at the meetings of the Board of Directors and the control of AE S & I (Japan) Inc. is by the Board. Thus, AE S & I (Japan) Inc. is controlled by the Company and the financial statements of AE S & I (Japan) Inc. are included in the consolidated financial statements.
9.23(c) The financial statements of AE S & I (PRC) Co., Ltd., a subsidiary incorporated in People Republic of China, are made up to 30 September to coincide with the reporting date of another investor of AE S & I (PRC) Co., Ltd., which is incorporated in Country Y, as a result of the statutory requirements in Country Y. For the purpose of preparing consolidated financial statements, the financial statements of AE S & I (PRC) Co., Ltd. for the financial year ended 30 September 2011 have been used, and appropriate adjustments have been made for significant transactions between 30 September 2011 and 31 December 2011.
9.23(d) As a result of the borrowings’ terms and conditions, the investment in AE S & I Limited of RM39,489 (2010: RM39,489) is subordinate to the borrowings obtained from a bank. Hence, the declaration of dividends and returns of capital by AE S & I Limited is subject to the said bank’s approval.
10. INVESTMENT IN ASSOCIATES The Group The Company 2011 2010 2011 2010 RM RM RM RM Cost of investment in: - unquoted associates 350,000 350,000 23,093 23,093 - quoted associate 628,900 628,900 - - Share of post-acquisition results 411,074 210,514 - - 14.13 Dividends received (50,000) (30,000) Loans to associates 144,341 80,705 - - 14.12(b)
Carrying amounts
1,484,315
1,240,119
23,093
23,093
14.12(c) Fair value of quoted associate accounted for using the equity method 693,000 642,900 - -
As a result of the borrowings’ terms and conditions, the loan to SERP Sdn. Bhd., an associate incorporated in
Malaysia, of RM47,809 (2010: RM47,201) is subordinate to the borrowings obtained from an offshore bank. Hence, the repayments of loan from SERP Sdn. Bhd. are subject to the said bank’s approval.
14.15 If the permitted treatment (fair value method) is elected, the entity shall disclose the information, as illustrated in “investment in jointly controlled entities”.

FRS Ref. 3.23(a)
3.23(b)
ILLUSTRATIVE GROUP SDN. BHD. (Company No. 200212345A) (Incorporated in Malaysia) AND ITS SUBSIDIARIES
3.17(e) 3.23(c)
NOTES TO THE FINANCIAL STATEMENTS FOR THE FINANCIAL YEAR ENDED 31 DECEMBER 2011
44
15.19(b) 11. INVESTMENT IN JOINTLY CONTROLLED ENTITIES The Group The Company 2011 2010 2011 2010 RM RM RM RM 15.21
Financial assets at fair value through profit or loss
305,535
450,153
-
-
11.43 The fair values of the financial assets at fair value through profit or loss is determined based on the quoted
market price in an active market.
15.20 If the permitted treatment (equity method) is elected, the entity shall disclose the information, as illustrated in “investment in associates”.
12. OTHER FINANCIAL ASSETS The Group The Company 2011 2010 2011 2010 RM RM RM RM Classify as: - Non-current asset 440,531 612,201 19,370 17,952 - Current asset 96,802 155,781 5,068 52,090
537,333
767,982
24,438
70,042
Other financial assets are analysed into: 11.41(a) Financial assets at fair value through profit or loss: Quoted equity instruments 447,710 583,180 12,020 26,148 11.41(b) Financial assets at amortised cost: Bonds 24,560 14,760 - - Loan stocks 45,720 65,723 12,418 43,894 Loans to related parties 5,865 6,268 - - Loans to external parties 4,506 4,209 - - 80,651 90,960 12,418 43,894 11.41(c) Financial assets at cost less impairment: Redeemable preference shares 8,672 93,542 - - Unquoted equity instruments 300 300 - - 8,972 93,842 - -
537,333
767,982
24,438
70,042
11.46 The carrying amounts of the Group’s other financial assets that have been pledged as collaterals for bank
facilities is RM114,456 (2011: RM124,439). In accordance with the terms and conditions, should the Group dispose off these financial assets, the proceeds from the disposal shall first be used to repay the outstanding debts.
FRS Ref. 3.23(a)
3.23(b)
ILLUSTRATIVE GROUP SDN. BHD. (Company No. 200212345A) (Incorporated in Malaysia) AND ITS SUBSIDIARIES
3.17(e) 3.23(c)
NOTES TO THE FINANCIAL STATEMENTS FOR THE FINANCIAL YEAR ENDED 31 DECEMBER 2011
45
11.43 The fair values of the financial assets at fair value through profit or loss is determined based on the quoted market price in an active market.
11.48(c) No impairment losses have been recognised in respect of the other financial assets during the financial year. 13. DEFERRED TAX ASSETS / LIABILITIES The amounts of deferred tax assets and liabilities, after appropriate offsetting, are included in the statements
of financial position, as follows:
The Group The Company 2011 2010 2011 2010
RM RM RM RM Deferred tax assets 19,985 36,664 - - Valuation allowance (9,000) (5,500) - -
10,985
31,164 -
-
Deferred tax liabilities 1,184,989 929,279 9,936 -
29.32(e) All the temporary differences, unused tax losses and unused tax credits do not have expiry date, unless
otherwise enacted in the future.
29.29 29.32(e)
Deferred tax assets are not recognised for certain deductible temporary differences as it is not probable that future taxable profit will be available against which the deductible temporary differences and unused tax losses can be utilised by the subsidiaries. However, the unused tax losses may be carried forward indefinitely. At the end of each reporting period, the subsidiaries reassess the unrecognised deferred tax assets. Previously unrecognised deferred tax assets are recognised to the extent that it has become probable that future taxable profit will allow the deferred tax assets to be recovered.

FRS Ref. 3.23(a)
3.23(b)
ILLUSTRATIVE GROUP SDN. BHD. (Company No. 200212345A) (Incorporated in Malaysia) AND ITS SUBSIDIARIES
3.17(e) 3.23(c)
NOTES TO THE FINANCIAL STATEMENTS FOR THE FINANCIAL YEAR ENDED 31 DECEMBER 2011
46
The following are the movements of deferred tax assets and liabilities (before offsetting): Relating to 29.32(d) THE GROUP At
beginning of the
financial year
Profit or loss
Other comprehensive
income 29.32(a) Equity
Valuation allowance
Exchange differences
Acquisition of a
subsidiary
Disposal of a
subsidiary
At end of the
financial year
2011 RM RM RM RM RM RM RM RM RM Deferred tax assets Provisions 58,844 (4,610) - - - - - - 54,234 Employees benefits 23,408 3,603 - - - - 3,268 (512) 29,767 Unused tax losses 52,035 3,844 - - (3,500) 10 - - 52,389 Deferred revenue 502 (80) - - - - - - 422 Others 980 118 - - - - - - 1,098
135,769 2,875 - - (3,500) 10 3,268 (512) 137,910
Deferred tax liabilities Irredeemable
Convertible Unsecured
Loan Stocks
-
-
-
9,936
-
-
-
-
9,936 Properties 1,022,088 - - - - - - - 1,022,088 Trade receivables 9,346 (1,452) - - - 25 321 (230) 8,010 Others 2,450 196,104 241 - - 39,085 71,847 (37,825) 271,880
1,033,884 194,652 241 9,936 - 39,110 72,168 (38,055) 1,311,914
Net amounts 191,777 241 9,936 (3,500) 39,100 68,900 (37,543)
(Note 36) (Note 36) (Note 38) (Note 39)

FRS Ref. 3.23(a)
3.23(b)
ILLUSTRATIVE GROUP SDN. BHD. (Company No. 200212345A) (Incorporated in Malaysia) AND ITS SUBSIDIARIES
3.17(e) 3.23(c)
NOTES TO THE FINANCIAL STATEMENTS FOR THE FINANCIAL YEAR ENDED 31 DECEMBER 2011
47
Relating to 29.32(d) THE GROUP At
beginning of the
financial year
Profit or loss
Other comprehensive
income 29.32(a) Equity
Valuation allowance
Exchange differences
Acquisition of a
subsidiary
Disposal of a
subsidiary
At end of the
financial year
2010 RM RM RM RM RM RM RM RM RM Deferred tax assets Provisions 53,273 5,571 - - - - - - 58,844 Employees benefits 20,545 2,863 - - - - - - 23,408 Unused tax losses 51,769 5,786 - - (5,500) (20) - - 52,035 Deferred revenue 450 52 - - - - - - 502 Others 1,105 (125) - - - - - - 980
127,142 14,147 - - (5,500) (20) - - 135,769
Deferred tax liabilities Properties 722,366 324,820 175 - - (25,273) - - 1,022,088 Trade receivables 9,226 151 - - - (31) - - 9,346 Others 1,984 466 - - - - - - 2,450
733,576 325,437 175 - - (25,304) - - 1,033,884
Net amounts 311,290 175 - (5,500) (25,284) - -
(Note 36) (Note 36)

FRS Ref. 3.23(a)
3.23(b)
ILLUSTRATIVE GROUP SDN. BHD. (Company No. 200212345A) (Incorporated in Malaysia) AND ITS SUBSIDIARIES
3.17(e) 3.23(c)
NOTES TO THE FINANCIAL STATEMENTS FOR THE FINANCIAL YEAR ENDED 31 DECEMBER 2011
48
29.32(d) The following are the movements of deferred tax liabilities of the Company: The Company 2011 2010 RM RM Irredeemable Convertible Unsecured Loan Stocks At beginning of the financial year - - Relating to equity 9,936 -
At end of the financial year
9,936 -
The Company does not recognised deferred tax on other temporary differences as the effects on the financial
statements are not significant.
14. BIOLOGICAL ASSETS CARRIED AT FAIR VALUE THROUGH PROFIT OR LOSS
The
Group The
Company 2011 2011 RM RM 34.7(c) Carrying amounts at 1 January 2011 100,275 - 34.7(c)(i) Gain/(loss) arising from changes in fair value less costs to sell (Note 35b) (13,230) - 34.7(c)(ii) Purchases 151,268 - 34.7(c)(iii) Harvest (85,980) - 34.7(c)(v) Exchange differences (2,100) -
34.7(c)
Carrying amounts at 31 December 2011
150,233
-
34.7(a) The biological assets comprise fruit trees and unharvested fruits.
16.10(e) Note: The reconciliation need not be presented for prior periods.
4.11(c) 15. INVENTORIES The Group The Company 2011 2010 2011 2010 RM RM RM RM At cost: Raw materials 30,421 42,238 - - Work-in-progress 11,000 16,772 - - Finished goods 20,000 30,000 - - Building materials 606,133 450,750 Publications 11,477 10,698 - - 679,031 550,458 - - At net realisable value: Finished goods 118,854 119,403 - - 13.22(b)
Carrying amounts
797,885
669,861
-
-

FRS Ref. 3.23(a)
3.23(b)
ILLUSTRATIVE GROUP SDN. BHD. (Company No. 200212345A) (Incorporated in Malaysia) AND ITS SUBSIDIARIES
3.17(e) 3.23(c)
NOTES TO THE FINANCIAL STATEMENTS FOR THE FINANCIAL YEAR ENDED 31 DECEMBER 2011
49
13.22(c) The amount of inventories recognised as an expense amounted to RM171,678 (2010: RM230,226).
13.22(e) Inventories with carrying amounts of RM82,288 (2010: RM69,108) have been pledged to licensed banks for bank facilities granted to the Group.
4.11(b) 16. TRADE AND OTHER RECEIVABLES The Group The Company 2011 2010 2011 2010 RM RM RM RM Trade receivables 2,018,249 1,209,418 432 321 Less: Impairment losses (69,392) (63,377) - - Net trade receivables 1,948,857 1,146,041 432 321
33.9(b) Amounts due from subsidiaries:
- trade nature - - 765,394 593,201 - non-trade nature and unsecured - - 2,702,415 4,820,005 - - 3,467,809 5,413,206
Other receivables, deposits and prepayments: - other receivables 210,585 223,726 3,102 2,103 - deposits 31,439 39,194 189 321 - prepayments 50,594 66,227 43 27 292,618 329,147 3,334 2,451
2,241,475
1,475,188
3,471,575
5,415,978
33.9(b)
33.9(b) 33.9(c)
The trade amounts due from subsidiaries are due 60 days after the date of sales. The non-trade amounts due from subsidiaries are unsecured, interest-free and have no fixed terms of repayments. No provisions for uncollectible receivables are required for the amounts of outstanding balances due from subsidiaries.
11.48(c) Included in the impairment losses recognised at the reporting date are balances of RM46,660 (2010: RM33,130) representing individually impaired trade receivables. These trade receivables have been placed under liquidation or are in significant financial difficulties and have defaulted on payments to the Group. The Group does not hold any collateral over these balances.
17. CASH AND CASH EQUIVALENTS The Group The Company 2011 2010 2011 2010 RM RM RM RM
Fixed deposits with licensed banks 206,625 271,791 - - Cash on hand and at banks 97,305 215,132 128 214
Total
303,930
486,923
128
214

FRS Ref. 3.23(a)
3.23(b)
ILLUSTRATIVE GROUP SDN. BHD. (Company No. 200212345A) (Incorporated in Malaysia) AND ITS SUBSIDIARIES
3.17(e) 3.23(c)
NOTES TO THE FINANCIAL STATEMENTS FOR THE FINANCIAL YEAR ENDED 31 DECEMBER 2011
50
7.21, 11.46 Fixed deposits with carrying amounts of RM3,540 (2010: RM3,540) have been pledged to licensed banks for bank facilities granted to the Group.
7.20 Cash and cash equivalents include the following items for the purpose of the statements of cash flows: The Group The Company 2011 2010 2011 2010 RM RM RM RM
Cash and cash equivalents 303,930 486,923 128 214 Bank overdrafts (Note 29) (280,316) (324,225) (36,068) (44,396) 7.21 Less: Fixed deposits pledged (3,540) (3,540) - - 20,074 159,158 (35,940) (44,182) 7.13 Effect of exchange rate changes 432 389 - -
Total
20,506
159,547
(35,940)
(44,182)
18. SHARE CAPITAL The Group and The Company Number of Shares Amounts 4.12(a)(i) Authorised Share Capital 2011 2010 2011 2010 Units Units RM RM 4.12(a)(iii) Ordinary Shares of RM1.00 each: 4.12(a)(iv) At beginning of the financial year 40,000,000 40,000,000 40,000,000 40,000,000 Increased 10,000,000 - 10,000,000 -
4.12(a)(iv)
At end of the financial year
50,000,000
40,000,000
50,000,000
40,000,000
8% Cumulative Redeemable Preference Shares of RM1.00 each: At beginning and end of the financial year 50,000 50,000 50,000 50,000 The Group and The Company Number of Shares Amounts 4.12(a)(ii) Issued and Fully Paid Share Capital 2011 2010 2011 2010 Units Units RM RM 4.12(a)(iii) Ordinary Shares of RM1.00 each: 4.12(a)(iv) At beginning of the financial year 11,050,200 11,045,200 11,050,200 11,045,200 Issued and fully paid 270,000 5,000 270,000 5,000
4.12(a)(iv)
At end of the financial year
11,320,200
11,050,200
11,320,200
11,050,200
During the financial year, the authorised ordinary share capital of the Company has been increased by
10,000,000 ordinary shares to 50,000,000 ordinary shares of RM1.00 each.

FRS Ref. 3.23(a)
3.23(b)
ILLUSTRATIVE GROUP SDN. BHD. (Company No. 200212345A) (Incorporated in Malaysia) AND ITS SUBSIDIARIES
3.17(e) 3.23(c)
NOTES TO THE FINANCIAL STATEMENTS FOR THE FINANCIAL YEAR ENDED 31 DECEMBER 2011
51
During the financial year, the Company has issued the following ordinary shares:
Date of Issue No. of Shares Issued Issue Price Purposes
1 June 2011 250,000 RM4.00 Part finance the acquisition of a subsidiary
6 June 2011 20,000 RM2.70 Exercise of ESOS 4.12(a)(v) The new ordinary shares issued rank pari passu in respect of the distribution of dividends and repayment of
capital with the existing ordinary shares.
4.12(a)(vi) At the reporting date, 100,000 (2010: Nil) ordinary shares are held by the Company as treasury shares (Note 20), and number of outstanding ordinary shares issued and fully paid (excluding treasury shares) is 11,220,200 (2010: 11,050,200) units.
4.12(b) 19. SHARE PREMIUM The Group and The
Company 2011 2010 RM RM At end of the financial year 1,242,500 458,500
Share premium arose from the issues of ordinary shares in excess of the par value, as follows: The Group and
The Company
RM 1 January 2002 Issues of 300,000 ordinary shares at an issue price of RM2.50 for working capital
purpose
450,000
1 October 2010 Issues of 5,000 ordinary shares at an issue price of RM2.70 for the exercise of ESOS 8,500 1 June 2011 Issue of 250,000 ordinary shares at an issue price of RM4.00 as part of the
consideration for the acquisition of a subsidiary
750,000
6 June 2011 Issues of 20,000 ordinary shares at an issue price of RM2.70 for the exercise of ESOS 34,000
1,242,500
4.12(b) 20. TREASURY SHARES The Group and The
Company 2011 2010 RM RM At end of the financial year 500,000 -
TR1.36 The shareholders of the Company, by a special resolution passed in a general meeting held on 30 April 2011,
approved the Company’s plan to repurchase its own ordinary shares. The directors of the Company are committed to enhancing the value of the Company to its shareholders and believe that the repurchase plan can be applied in the best interests of the Company and its shareholders.

FRS Ref. 3.23(a)
3.23(b)
ILLUSTRATIVE GROUP SDN. BHD. (Company No. 200212345A) (Incorporated in Malaysia) AND ITS SUBSIDIARIES
3.17(e) 3.23(c)
NOTES TO THE FINANCIAL STATEMENTS FOR THE FINANCIAL YEAR ENDED 31 DECEMBER 2011
52
During the financial year, the Company repurchased its issued ordinary shares as follows:
No. of Shares
Fair Value
Average Price
Units RM RM November 2011 100,000 500,000 5.00
4.12(b) 21. PREMIUM FOR OPTION ON IRREDEEMABLE CONVERTIBLE UNSECURED LOAN STOCKS The Group and The
Company 2011 2010 RM RM At beginning of the financial year - - Issues of 5% Irredeemable Convertible Unsecured Loan Stocks (Note 29) 29,810 -
At end of the financial year
29,810 -
This represents the equity component of 200,000 units of 5% Irredeemable Convertible Unsecured Loan Stocks
issued during the financial year (Note 29). 4.12(b) 22. PROPERTY REVALUATION SURPLUS Property revaluation surplus arose from the revaluation of landed property of the Group and of the Company
from previous local GAAP. 4.12(b) 23. TRANSLATION RESERVES Translation reserves arose from the exchange differences on the translation of foreign operations. 4.12(b) 24. EQUITY-SETTLED EMPLOYEE BENEFITS RESERVES Equity-settled employee benefits reserves represent the cumulative value of employee services for the issue of
ESOS. If the share option is exercised, the amount from the equity-settled employee benefits reserves is transferred to share premium. If the share option expires, the amount from the equity-settled employee benefits reserves is transferred to retained profits. The details of the equity-settled share-based payments are disclosed in Note 33.
4.12(b) 25. RETAINED EARNINGS Effective 1 January 2008, the Company was given the option to make an irrevocable election to move to a
single tier system or continue to use its tax credit under Section 108 of the Income Tax Act, 1967 for the purpose of dividend distribution until the tax credit is fully utilised or latest by 31 December 2013. The Company has elected to continue to use its tax credit under Section 108 of the Income Tax Act, 1967.

FRS Ref. 3.23(a)
3.23(b)
ILLUSTRATIVE GROUP SDN. BHD. (Company No. 200212345A) (Incorporated in Malaysia) AND ITS SUBSIDIARIES
3.17(e) 3.23(c)
NOTES TO THE FINANCIAL STATEMENTS FOR THE FINANCIAL YEAR ENDED 31 DECEMBER 2011
53
Accordingly, during the transitional period, the Company may utilise the tax credit in the Section 108 balance as at 31 December 2007 to distribute cash dividend payments to ordinary shareholders as defined under the Finance Act, 2007. At the end of the reporting period, subject to the agreement by the Inland Revenue Board: 1. the Company has sufficient tax credit under Section 108 (6) of the Income Tax Act, 1967 to frank the
payment of dividends out of all its retained earnings. 2. the Company has a balance of RM2,827,515 (2010: RM5,064,555) in the tax exempt account to declare tax
exempt dividends.
If the Company does not have sufficient tax credit to frank the payment of dividends: Subject to the agreement by the Inland Revenue Board, the Company has sufficient tax credit under Section 108 (6) of the Income Tax Act, 1967 to frank the payment of dividends up to RM659,887 (2010: RM422,950) of its retained earnings. The Company is required to pay an additional tax of RM510,698 (2010: RM1,217,968) to frank the payment of dividends out of all its retained earnings.
If the Company discontinued utilising or has fully utilised tax credit under Section 108: Effective 1 January 2008, the Company was given the option to make an irrevocable election to move to a
single tier system or continue to use its tax credit under Section 108 of the Income Tax Act, 1967 for the purpose of dividend distribution until the tax credit is fully utilised or latest by 31 December 2013. During the transitional period, the Company may utilise the tax credit in the Section 108 balance as at 31 December 2007 to distribute cash dividend payments to ordinary shareholders as defined under the Finance Act, 2007. If the Company elected to discontinue utilising tax credit under Section 108: However, the Company elected to discontinue utilising its tax credit under Section 108 of the Income Tax Act, 1967 with effect from the current financial year. Accordingly, tax on the Company’s profits is a final tax, and dividends distributed to shareholders will be exempted from tax. If the Company has fully utilised tax credit under Section 108: During the financial year, the Company has fully utilised its tax credit under Section 108 of the Income Tax Act, 1967 as at 31 December 2007 and it has automatically moved to the single tier tax system. Accordingly, tax on the Company’s profits is a final tax, and dividends distributed to shareholders will be exempted from tax.
A newly incorporated company move to Single tier system automatically: Effective 1 January 2008, companies are given the option to make an irrevocable election to move to a single tier system or continue to use its tax credit under Section 108 of the Income Tax Act, 1967 for the purpose of dividend distribution until the tax credit is fully utilised or latest by 31 December 2013. During the transitional period, the Company may utilise the tax credit in the Section 108 balance as at 31 December 2007 to distribute cash dividend payments to ordinary shareholders as defined under the Finance Act, 2007. Since the Company was incorporated on or after 1 January 2008, the Company is automatically moved to the single tier system. Under this single tier system, tax on the Company’s profits is a final tax, and dividends distributed to shareholders will be exempted from tax.
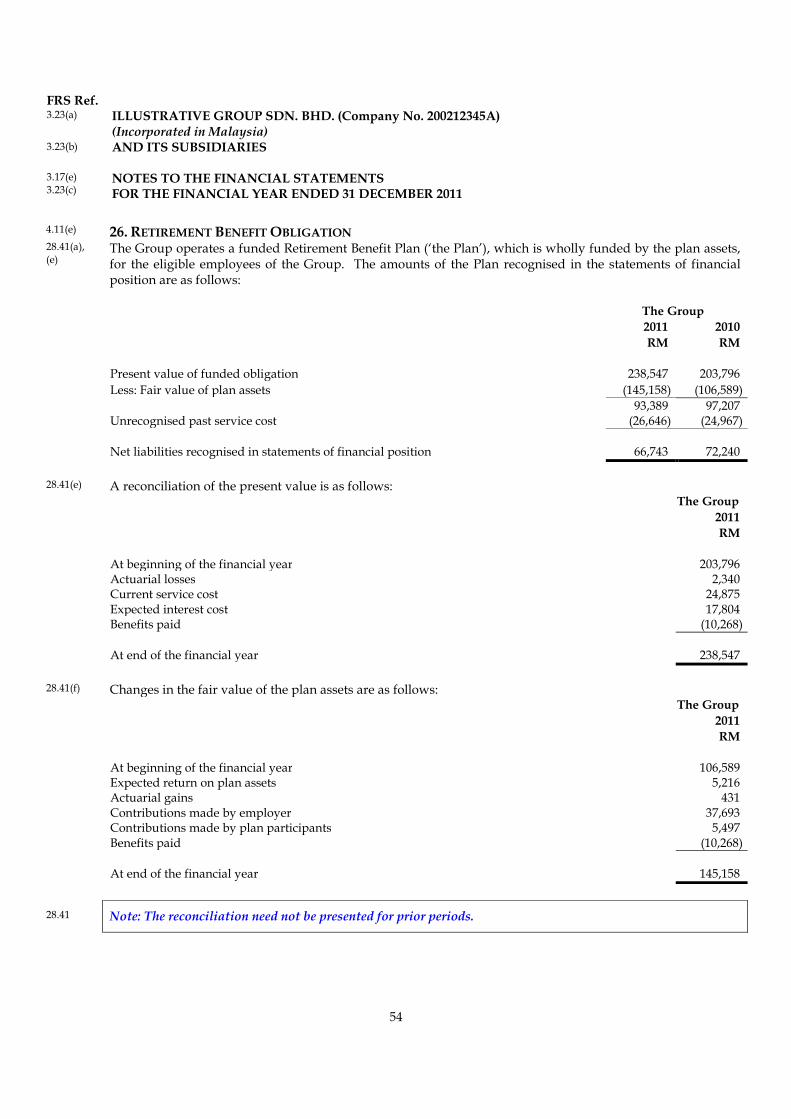
FRS Ref. 3.23(a)
3.23(b)
ILLUSTRATIVE GROUP SDN. BHD. (Company No. 200212345A) (Incorporated in Malaysia) AND ITS SUBSIDIARIES
3.17(e) 3.23(c)
NOTES TO THE FINANCIAL STATEMENTS FOR THE FINANCIAL YEAR ENDED 31 DECEMBER 2011
54
4.11(e) 26. RETIREMENT BENEFIT OBLIGATION 28.41(a), (e)
The Group operates a funded Retirement Benefit Plan (‘the Plan’), which is wholly funded by the plan assets, for the eligible employees of the Group. The amounts of the Plan recognised in the statements of financial position are as follows:
The Group 2011 2010 RM RM Present value of funded obligation 238,547 203,796 Less: Fair value of plan assets (145,158) (106,589) 93,389 97,207 Unrecognised past service cost (26,646) (24,967)
Net liabilities recognised in statements of financial position
66,743
72,240
28.41(e) A reconciliation of the present value is as follows: The Group 2011 RM At beginning of the financial year 203,796 Actuarial losses 2,340 Current service cost 24,875 Expected interest cost 17,804 Benefits paid (10,268)
At end of the financial year
238,547
28.41(f) Changes in the fair value of the plan assets are as follows: The Group 2011 RM At beginning of the financial year 106,589 Expected return on plan assets 5,216 Actuarial gains 431 Contributions made by employer 37,693 Contributions made by plan participants 5,497 Benefits paid (10,268)
At end of the financial year
145,158
28.41 Note: The reconciliation need not be presented for prior periods.

FRS Ref. 3.23(a)
3.23(b)
ILLUSTRATIVE GROUP SDN. BHD. (Company No. 200212345A) (Incorporated in Malaysia) AND ITS SUBSIDIARIES
3.17(e) 3.23(c)
NOTES TO THE FINANCIAL STATEMENTS FOR THE FINANCIAL YEAR ENDED 31 DECEMBER 2011
55
28.41(h) The fair value of the plan assets is analysed as follows: The Group 2011 2010 RM RM
Equity instruments of external parties 76,938 46,493 Cash and cash equivalents 22,279 13,541 Landed properties 45,592 46,124 Other assets 349 431
145,158
106,589
28.41(i) None of the above plan assets is owned by the Group and the Company. The Group and the Company do not
occupy any of the above properties or use any of the above assets.
28.41(j) The actual return on plan assets was RM5,647 (2010: RM4,961).
28.41(k) The principal actuarial assumptions used at the reporting date are as follows:
The Group 2011 2010 % % Discount rate to determine present value of the funded obligation 4 4 Expected rate of return on plan assets 5 5 Expected rate of return on reimbursement right recognised as an asset - - Expected rate of salary increases 5 5
4.11(e) 27. PROVISIONS The Group The Company 2011 2010 2011 2010 RM RM RM RM Classified as: - Non-current liability 30,449 44,888 - - - Current liability 163,358 165,268 - -
193,807
210,156 -
-
21.14(a) The analysis of the provisions is as follow: The Group
Warranties
Legal Costs
Total
RM RM RM
21.14(a)(i) At 1 January 2011 210,156 - 210,156 21.14(a)(ii) Additions (Note 35b) 113,718 347 114,065 21.14(a)(iii) Amounts charged against the provision (57,503) - (57,503) 21.14(a)(iv) Reversals of unused provisions (Note 35c) (72,911) - (72,911)
21.14(a)(i)
At 31 December 2011
193,460
347
193,807

FRS Ref. 3.23(a)
3.23(b)
ILLUSTRATIVE GROUP SDN. BHD. (Company No. 200212345A) (Incorporated in Malaysia) AND ITS SUBSIDIARIES
3.17(e) 3.23(c)
NOTES TO THE FINANCIAL STATEMENTS FOR THE FINANCIAL YEAR ENDED 31 DECEMBER 2011
56
21.14 Note: Comparative information is not required to be presented.
21.14(b),(c) Warranties Provision for warranties is made based on the management’s best estimate of the expenditure required, based on past experience of similar products and services, to be incurred during the warranty periods.
21.14(b),(c) Legal Costs During the financial year, a supplier of a subsidiary took legal action against the said subsidiary seeking damages, including interest costs and legal costs incurred and to be incurred, from the said subsidiary for the delay in making payments, but the subsidiary disputes liability since the quality of the products supplied by the supplier did not meet the original specification. However, based on the evidence available, the subsidiary’s lawyer advises that it is probable that the subsidiary will be found liable. A provision has been set up to recognise further costs associate with settling the supplier.
28. FINANCE LEASE PAYABLES The Group 2011 2010 RM RM 20.13(b) Future minimum lease payments - not later than one year 64,326 59,872 - later than one year and not later than five years 98,467 114,297 - later than five years 364 2,769 163,157 176,938 Future finance charges (14,569) (17,650)
Present value of finance lease payables
148,588
159,288
20.13(b) Present value of finance lease payables is analysed as follows: - not later than one year 56,966 53,476 - later than one year and not later than five years 91,293 103,502 - later than five years 329 2,310 Non-current 91,622 105,812
148,588
159,288
20.13(c) The Group obtains finance lease facilities to finance the acquisition of certain plant and machinery and motor
vehicles. The average remaining lease terms is 4 years as at 31 December 2011. Implicit interest rates of the finance lease of 4.0% are fixed at the date of the agreements, and the amount of lease payments are fixed throughout the lease period. The Group has the option to purchase the assets at the end of the agreements with minimum purchase considerations. There is no significant restriction clauses imposed on the finance lease arrangements.

FRS Ref. 3.23(a)
3.23(b)
ILLUSTRATIVE GROUP SDN. BHD. (Company No. 200212345A) (Incorporated in Malaysia) AND ITS SUBSIDIARIES
3.17(e) 3.23(c)
NOTES TO THE FINANCIAL STATEMENTS FOR THE FINANCIAL YEAR ENDED 31 DECEMBER 2011
57
29. BANK OVERDRAFTS AND OTHER BORROWINGS The Group The Company 2011 2010 2011 2010 RM RM RM RM BANK OVERDRAFTS (i) - secured 179,756 221,126 36,068 44,396 - unsecured 100,560 103,099 - -
Total bank overdrafts (Note 17)
280,316
324,225
36,068
44,396
OTHER BORROWINGS Non-current Liabilities Term loans (i): - secured 248,148 265,977 - 41,534 - unsecured - - - - 5% Irredeemable Convertible Unsecured Loan Stocks (ii) 374,998 - 374,998 - 623,146 265,977 374,998 41,534 Current Liabilities Secured: - term loans (i) 504,598 662,922 40,751 70,122 - revolving credits (i) 532,324 387,963 119,184 68,157 - other short-term trade facilities (i) 141,349 192,348 - - Unsecured: - term loans (i) 46,182 22,755 - - - other short-term trade facilities (i) 118,064 140,756 - - 5% Irredeemable Convertible Unsecured Loan Stocks (ii) 10,000 - 10,000 - 1,352,517 1,406,744 169,935 138,279
1,975,663
1,672,721
544,933
179,813
11.46
i) Bank Overdrafts, Term Loans, Revolving Credits and Other Short-term Trade Facilities The secured bank borrowings of the Group and the Company are secured by a legal charge over the Group’s and the Company’s landed properties, fixed and floating charges over assets of certain subsidiaries and guaranteed by the Company. The unsecured bank borrowings are guaranteed by the Company.
11.47 11.47
During the financial year, a subsidiary defaulted a payment of principal and interest for a term loan amounting to RM35,000 (2010: RMNil) due to technical error in processing the cheque. The default was remedied immediately by the subsidiary with a replaced cheque. The terms of the loan have not been altered. At the reporting date, there are no other defaults in payment of borrowings nor breaches of loan agreement terms.
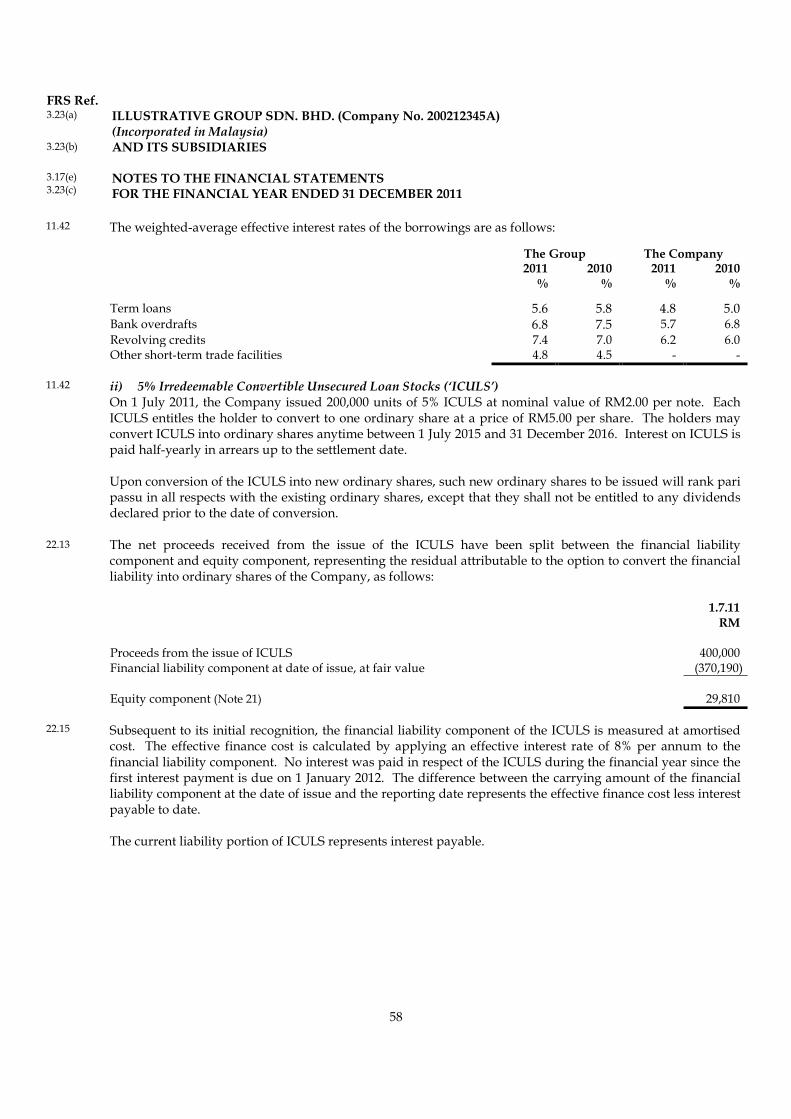
FRS Ref. 3.23(a)
3.23(b)
ILLUSTRATIVE GROUP SDN. BHD. (Company No. 200212345A) (Incorporated in Malaysia) AND ITS SUBSIDIARIES
3.17(e) 3.23(c)
NOTES TO THE FINANCIAL STATEMENTS FOR THE FINANCIAL YEAR ENDED 31 DECEMBER 2011
58
11.42 The weighted-average effective interest rates of the borrowings are as follows:
The Group The Company 2011 2010 2011 2010
% % % %
Term loans 5.6 5.8 4.8 5.0 Bank overdrafts 6.8 7.5 5.7 6.8 Revolving credits 7.4 7.0 6.2 6.0 Other short-term trade facilities 4.8 4.5 - -
11.42
22.13
ii) 5% Irredeemable Convertible Unsecured Loan Stocks (‘ICULS’) On 1 July 2011, the Company issued 200,000 units of 5% ICULS at nominal value of RM2.00 per note. Each ICULS entitles the holder to convert to one ordinary share at a price of RM5.00 per share. The holders may convert ICULS into ordinary shares anytime between 1 July 2015 and 31 December 2016. Interest on ICULS is paid half-yearly in arrears up to the settlement date. Upon conversion of the ICULS into new ordinary shares, such new ordinary shares to be issued will rank pari passu in all respects with the existing ordinary shares, except that they shall not be entitled to any dividends declared prior to the date of conversion. The net proceeds received from the issue of the ICULS have been split between the financial liability component and equity component, representing the residual attributable to the option to convert the financial liability into ordinary shares of the Company, as follows:
1.7.11 RM Proceeds from the issue of ICULS 400,000 Financial liability component at date of issue, at fair value (370,190)
Equity component (Note 21)
29,810
22.15 Subsequent to its initial recognition, the financial liability component of the ICULS is measured at amortised cost. The effective finance cost is calculated by applying an effective interest rate of 8% per annum to the financial liability component. No interest was paid in respect of the ICULS during the financial year since the first interest payment is due on 1 January 2012. The difference between the carrying amount of the financial liability component at the date of issue and the reporting date represents the effective finance cost less interest payable to date. The current liability portion of ICULS represents interest payable.
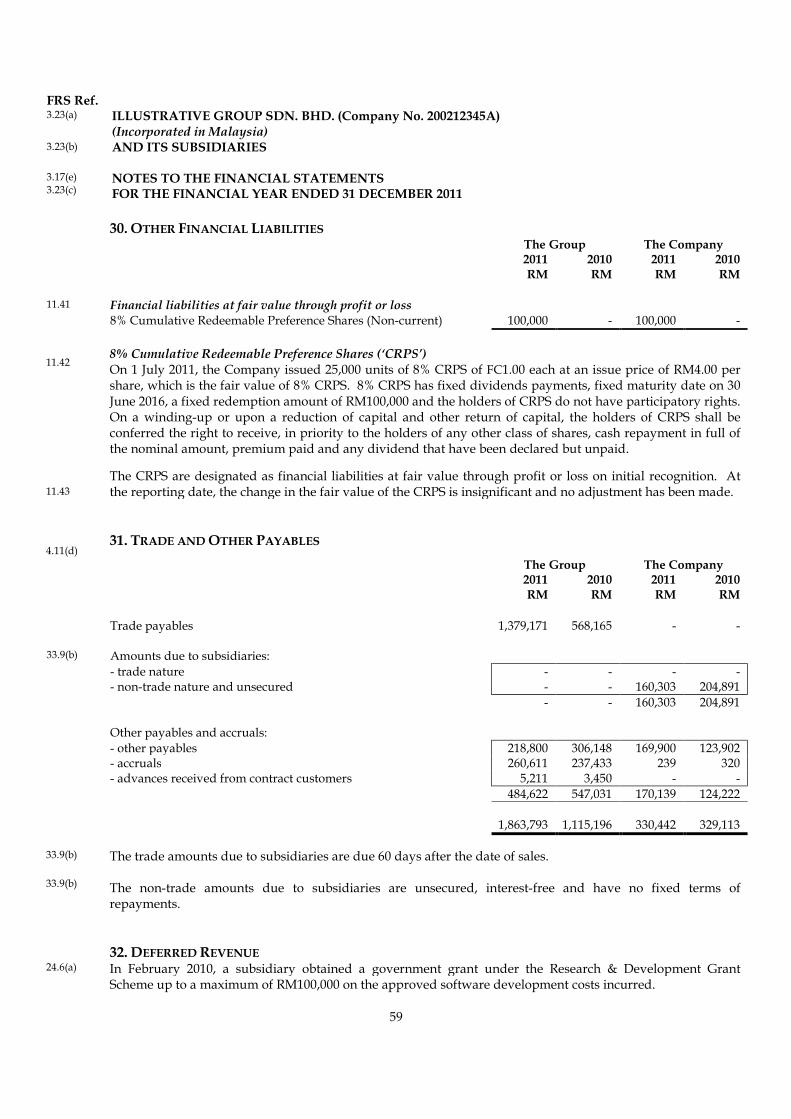
FRS Ref. 3.23(a)
3.23(b)
ILLUSTRATIVE GROUP SDN. BHD. (Company No. 200212345A) (Incorporated in Malaysia) AND ITS SUBSIDIARIES
3.17(e) 3.23(c)
NOTES TO THE FINANCIAL STATEMENTS FOR THE FINANCIAL YEAR ENDED 31 DECEMBER 2011
59
30. OTHER FINANCIAL LIABILITIES The Group The Company 2011 2010 2011 2010 RM RM RM RM 11.41 Financial liabilities at fair value through profit or loss 8% Cumulative Redeemable Preference Shares (Non-current) 100,000 - 100,000 -
11.42 11.43
8% Cumulative Redeemable Preference Shares (‘CRPS’) On 1 July 2011, the Company issued 25,000 units of 8% CRPS of FC1.00 each at an issue price of RM4.00 per share, which is the fair value of 8% CRPS. 8% CRPS has fixed dividends payments, fixed maturity date on 30 June 2016, a fixed redemption amount of RM100,000 and the holders of CRPS do not have participatory rights. On a winding-up or upon a reduction of capital and other return of capital, the holders of CRPS shall be conferred the right to receive, in priority to the holders of any other class of shares, cash repayment in full of the nominal amount, premium paid and any dividend that have been declared but unpaid.
The CRPS are designated as financial liabilities at fair value through profit or loss on initial recognition. At the reporting date, the change in the fair value of the CRPS is insignificant and no adjustment has been made.
4.11(d)
31. TRADE AND OTHER PAYABLES
The Group The Company 2011 2010 2011 2010 RM RM RM RM Trade payables 1,379,171 568,165 - - 33.9(b) Amounts due to subsidiaries:
- trade nature - - - - - non-trade nature and unsecured - - 160,303 204,891 - - 160,303 204,891 Other payables and accruals: - other payables 218,800 306,148 169,900 123,902 - accruals 260,611 237,433 239 320 - advances received from contract customers 5,211 3,450 - - 484,622 547,031 170,139 124,222
1,863,793
1,115,196
330,442
329,113
33.9(b)
33.9(b)
The trade amounts due to subsidiaries are due 60 days after the date of sales. The non-trade amounts due to subsidiaries are unsecured, interest-free and have no fixed terms of repayments.
32. DEFERRED REVENUE 24.6(a)
In February 2010, a subsidiary obtained a government grant under the Research & Development Grant Scheme up to a maximum of RM100,000 on the approved software development costs incurred.

FRS Ref. 3.23(a)
3.23(b)
ILLUSTRATIVE GROUP SDN. BHD. (Company No. 200212345A) (Incorporated in Malaysia) AND ITS SUBSIDIARIES
3.17(e) 3.23(c)
NOTES TO THE FINANCIAL STATEMENTS FOR THE FINANCIAL YEAR ENDED 31 DECEMBER 2011
60
24.6(b) The government grant granted is subject to the fulfilment of the condition that the percentage of the knowledge workers should attain 20% of the total employees of the said subsidiary by 30 June 2012. The subsidiary has achieved this condition on 20 January 2012.
33. EQUITY-SETTLED SHARE-BASED PAYMENTS 26.18(a) The Company has an Employees’ Share Option Scheme (‘ESOS’), which was approved at the Extraordinary
General Meeting on 31 October 2006 by its shareholders, for all the eligible employees of the Group.
26.18(a) Certain salient terms and conditions of the ESOS are as follows: 1. The exercise prices of the ESOS are set at 10% discount of the estimated share price of the Company’s
shares on the grant date. 2. The vesting period for the ESOS is 3 years. 3. The ESOS granted expires after 8 years from grant date. 4. The ESOS is forfeited if the employees leave during the vesting period. 5. An eligible employee shall not participate in more than one scheme implemented by any company within
the Group. 6. ESOS granted shall be exercisable by the option holders by notice in writing to the Company.
26.18(b) Movements of the number and the related weighted average exercise prices of ESOS are as follows:
The Group and The Company 2011 2010
No. of Share
Options
Weighted Average Exercise
Prices
No. of Share
Options
Weighted Average Exercise
Prices Units RM Units RM 26.18(b)(i) At beginning of the financial year 55,000 3.19 30,000 2.70 26.18(b)(ii) Granted 60,000 4.50 30,000 3.60 26.18(b)(iii) Forfeited - - - - 26.18(b)(iv) Exercised (20,000) 2.70 (5,000) 2.70 26.18(b)(v) Expired - - - - 26.18(b)(vi)
At end of the financial year
95,000
4.12
55,000
3.19
26.18(b)(vii)
Exercisable at end of the financial year
5,000
25,000
The Company issued 20,000 (2010: 5,000) new ordinary shares for the ESOS exercised during the financial year at weighted average exercise price of RM2.70 (2010: RM2.70). The ESOS was exercised on a regular basis throughout the financial year. The weighted average share price during the financial year was RM5.25 (2010: RM3.73).
26.18(b)(vii) The ESOS outstanding at the reporting date has the following weighted average exercise prices and remaining contractual life:
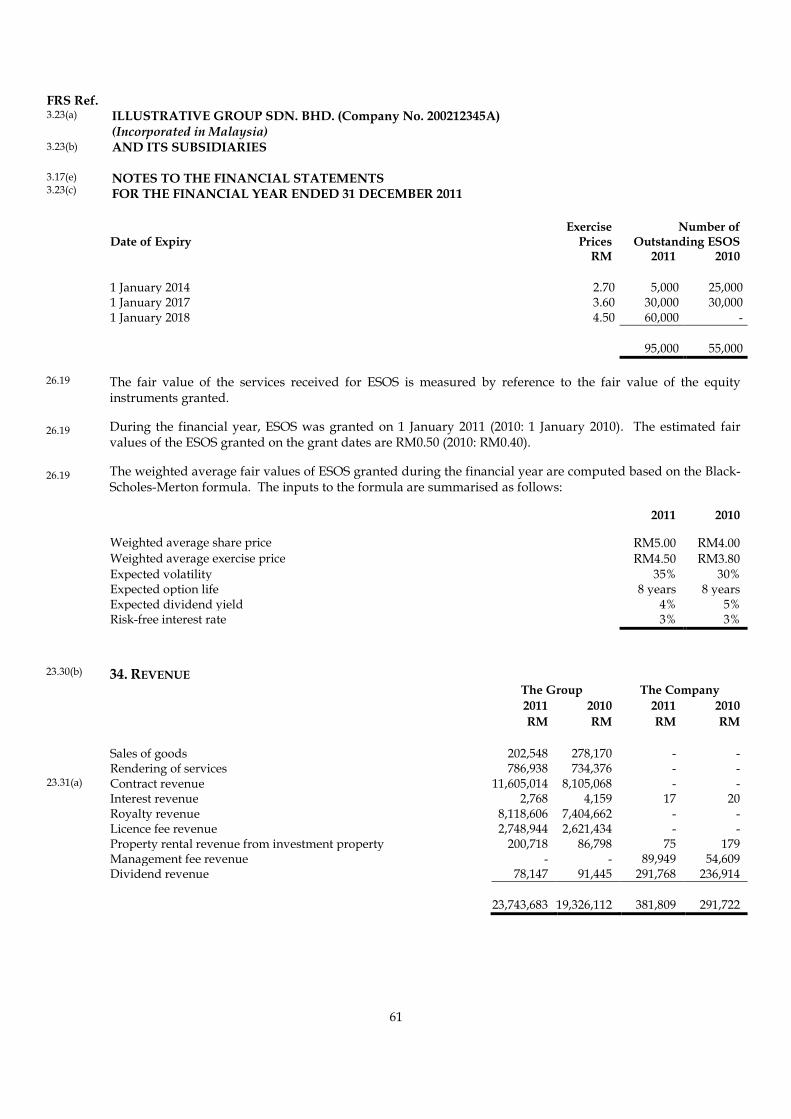
FRS Ref. 3.23(a)
3.23(b)
ILLUSTRATIVE GROUP SDN. BHD. (Company No. 200212345A) (Incorporated in Malaysia) AND ITS SUBSIDIARIES
3.17(e) 3.23(c)
NOTES TO THE FINANCIAL STATEMENTS FOR THE FINANCIAL YEAR ENDED 31 DECEMBER 2011
61
Date of Expiry
Exercise Prices
Number of Outstanding ESOS
RM 2011 2010 1 January 2014 2.70 5,000 25,000 1 January 2017 3.60 30,000 30,000 1 January 2018 4.50 60,000 -
95,000
55,000
26.19
26.19
26.19
The fair value of the services received for ESOS is measured by reference to the fair value of the equity instruments granted.
During the financial year, ESOS was granted on 1 January 2011 (2010: 1 January 2010). The estimated fair values of the ESOS granted on the grant dates are RM0.50 (2010: RM0.40).
The weighted average fair values of ESOS granted during the financial year are computed based on the Black-Scholes-Merton formula. The inputs to the formula are summarised as follows:
2011 2010
Weighted average share price RM5.00 RM4.00 Weighted average exercise price RM4.50 RM3.80 Expected volatility 35% 30% Expected option life 8 years 8 years Expected dividend yield 4% 5% Risk-free interest rate 3% 3%
23.30(b) 34. REVENUE The Group The Company 2011 2010 2011 2010 RM RM RM RM Sales of goods 202,548 278,170 - - Rendering of services 786,938 734,376 - - 23.31(a) Contract revenue 11,605,014 8,105,068 - - Interest revenue 2,768 4,159 17 20 Royalty revenue 8,118,606 7,404,662 - - Licence fee revenue 2,748,944 2,621,434 - - Property rental revenue from investment property 200,718 86,798 75 179 Management fee revenue - - 89,949 54,609 Dividend revenue 78,147 91,445 291,768 236,914
23,743,683
19,326,112
381,809
291,722

FRS Ref. 3.23(a)
3.23(b)
ILLUSTRATIVE GROUP SDN. BHD. (Company No. 200212345A) (Incorporated in Malaysia) AND ITS SUBSIDIARIES
3.17(e) 3.23(c)
NOTES TO THE FINANCIAL STATEMENTS FOR THE FINANCIAL YEAR ENDED 31 DECEMBER 2011
62
35. PROFIT BEFORE TAX a) Net gains or net losses on financial assets and liabilities The Group The Company 2011 2010 2011 2010 RM RM RM RM Net gains/(losses) on: 11.48(a)(i) - financial assets at fair value through profit or loss 64,256 15,914 24,474 64,989 11.48(c) Impairment loss on financial assets: 33.9(d) - trade receivables (related parties) - - - - - trade receivables (other than related parties) 9,438 13,578 - - 11.48(c) Reversal of impairment losses of trade receivables (348) (732) - - 11.42 Loss on fair value adjustment for jointly controlled entities (144,618) (100,000) - -
b) Other losses and expenses The Group The Company 2011 2010 2011 2010 RM RM RM RM CA9.1(q) Auditors’ remunerations 250,900 250,700 25,000 20,000 28.40 Contribution to defined contribution plan 37,123 26,378 4,385 3,299 30.25(a) Exchange loss:
- realised - unrealised
48,903 90,459
-
79,948
5,605
-
4,930
- 28.41(g) Expenses on defined benefit plan 37,693 31,270 - - CA9.1(h) Loss on disposal of: - property, plant and equipment - - - 28 - subsidiary - - 293,051 - 34.7(c)(i) Loss on fair value adjustment for biological assets (Note 14) 13,230 10,800 - - CA9.1(g) Hire of plant and machinery 2,500 5,890 - - IC201 Preliminary and pre-operating expenses 100 - - - 21.14(a)(ii) Provision for legal costs (Note 27) 347 - - - 21.14(a)(ii) Provision for warranties (Note 27) 113,718 91,634 - - CA9.1(g) Rental of premises 3,769 2,090 - - 18.29 Research and development expenditure recognised as expense 239,895 219,998 - - 28.43 Termination benefits 30,984 - - - 26.23(a) Value of services rendered by employees for issue of share options 17,000 7,000 17,000 7,000 20.16(b) Operating lease payments 529 432 - -
c) Other gains and income The Group The Company 2011 2010 2011 2010 RM RM RM RM 19.25(f) Excess of the Group’s interest in the fair value of the identifiable
assets, liabilities and contingent liabilities over cost -
-
-
-
30.25 Exchange gain: - realised - unrealised
- -
(50,490) -
- -
- -

FRS Ref. 3.23(a)
3.23(b)
ILLUSTRATIVE GROUP SDN. BHD. (Company No. 200212345A) (Incorporated in Malaysia) AND ITS SUBSIDIARIES
3.17(e) 3.23(c)
NOTES TO THE FINANCIAL STATEMENTS FOR THE FINANCIAL YEAR ENDED 31 DECEMBER 2011
63
The Group The Company 2011 2010 2011 2010 RM RM RM RM 16.10(e)(ii) Gain on fair value adjustment for investment property (Note 6) (53,911) (35,993) - (180) CA9.1(h) Gain on disposal of: - property, plant and equipment (760) (1,088) (112) - - investment property (2,659) (173) (61) - - subsidiary (Note 39) (1,459) - - - 23.30(b)(iii) Interest income from bank deposits (657) (718) - - 21.14(a)(iv) Reversal of provision for warranties (Note 27) (72,911) (31,695) - -
If the entity chooses to present the expenses by their functions, the following items are required to be
disclosed: 18.27(d) Amortisation of other intangible assets (Note 8) included in: - cost of sales 40,070 26,900 - - - other expenses 168,678 124,808 - - Depreciation of property, plant and equipment (Note 5) 1,228,514 876,403 469 492 27.32(a)
27.33(c)
27.33(b)
27.33(d)
Impairment losses recognised, included in other expenses, of: - goodwill (Note 7) - property, plant and equipment (Note 5) - other intangible assets
37,961 2,046
-
-
643 986
- - -
- - -
13.22(d), 27.33(a)
Impairment loss on inventories
466,250
150,303
-
-
27.32(b)
27.33(b)
27.33(d) 13.22(d)
Reversal of impairment losses, included in other income, of: - property, plant and equipment (Note 5) - other intangible assets (Note 8) - inventories
(303) (895)
(14,558)
- - -
- - -
- - -
11.48(b) d) Finance costs The Group The Company 2011 2010 2011 2010 RM RM RM RM
- bank overdrafts 28,322 23,411 4,914 5,432 - Cumulative Redeemable Preference Shares 4,000 - 4,000 - - finance lease 14,618 15,252 - - - Irredeemable Convertible Unsecured Loan Stocks 14,808 - 14,808 - - other short-term trade facilities 126,595 155,598 5,578 6,114 - term loans 55,439 62,288 10,172 12,716
Finance costs charged to profit or loss
243,782
256,549
39,472
24,262

FRS Ref. 3.23(a)
3.23(b)
ILLUSTRATIVE GROUP SDN. BHD. (Company No. 200212345A) (Incorporated in Malaysia) AND ITS SUBSIDIARIES
3.17(e) 3.23(c)
NOTES TO THE FINANCIAL STATEMENTS FOR THE FINANCIAL YEAR ENDED 31 DECEMBER 2011
64
36. TAX EXPENSE
The Group The Company 2011 2010 2011 2010 RM RM RM RM Current tax expense 29.31(a) Current financial year - Malaysia 705,153 600,345 7,869 10,239 CA-9-1(l) - payable outside Malaysia 300,457 256,348 - - 1,005,610 856,693 7,869 10,239 29.31(b) Under/(over) provision in prior years 3,076 (4,801) - (10,239) 1,008,686 851,892 7,869 - Deferred tax expense (Note 13) 29.31(c) Origination and reversal of temporary differences 209,216 311,290 - - 29.31(d) Changes in tax rates (17,439) - - - 191,777 311,290 - - 29.31(g) Change in valuation allowance (Note 13) 3,500 5,500 195,277 316,790 - -
Total tax expense
1,203,963
1,168,682
7,869
-
29.32(c) The applicable tax rate for the current financial year is 25%, as enacted by the government.
29.32(b) The effective tax rate of the Group is lower than the statutory tax rate as certain income of the subsidiaries are exempted from tax.
29.32(b) The effective tax rate of the Company is lower than the statutory tax rate as the Company’s dividend revenue are exempted from tax.
37. DIVIDENDS 32.8
On 1 April 2011, the Company paid a 10% final tax exempt dividend, total dividend of RM1,105,020 (2010: RM1,104,520), in respect of the previous financial year. The net dividend per share was 10 sen. On 31 August 2011, the directors declared a 10% interim tax exempt dividend, total dividend of RM1,132,020 (2010: RM1,105,020), in respect of the current financial year. The dividend was paid to the shareholders on 31 October 2011. The net dividend per share was 10 sen. After the reporting date, the directors have proposed a 10% final tax exempt dividend in respect of the current financial year. The dividend is subject to approval by the shareholders at the forthcoming Annual General Meeting and has not been included as a liability in the financial statements. Total dividend payable is RM1,122,020 (dividend for treasury shares is not included), and the net dividend per share is 10 sen.
38. ACQUISITION OF A SUBSIDIARY 19.25(a), (b), (c), (d)
On 1 June 2011, the Company acquired the entire (100%) equity interest in AXP Property Sdn. Bhd., a company incorporated in Malaysia and principally engaged in property investment, for a total consideration of RM1,500,000.

FRS Ref. 3.23(a)
3.23(b)
ILLUSTRATIVE GROUP SDN. BHD. (Company No. 200212345A) (Incorporated in Malaysia) AND ITS SUBSIDIARIES
3.17(e) 3.23(c)
NOTES TO THE FINANCIAL STATEMENTS FOR THE FINANCIAL YEAR ENDED 31 DECEMBER 2011
65
19.25(e) Assets, liabilities and contingent liabilities, including goodwill recognised at the acquisition date, are as follows:
Fair value
RM
Property, plant and equipment (Note 5) 578,245 Investment property (Note 6) 1,217,852 Trade and other receivables 112,368 Cash and bank balances 771 Trade and other payables (527,684) Current tax liabilities (23,469) Bank overdrafts (575,757) Other borrowings (609,977) Deferred tax liabilities (Note 13) (68,900) Contingent liability (701)
102,748 Goodwill on consolidation (Note 7) 1,397,252 19.25(d)
Purchase consideration
1,500,000
19.25(d) Less: Purchase consideration satisfied by issuance of new ordinary shares (1,000,000) 19.25(d)
Purchase consideration satisfied by cash
500,000
Cash and cash equivalents acquired 799,748
Acquisition of a subsidiary, net of cash and cash equivalents acquired
1,299,748
19.25(d)
The Company has issued 250,000 new ordinary shares at an issue price of RM4.00 to part finance the acquisition of AXP Property Sdn. Bhd..
39. DISPOSAL OF A SUBSIDIARY On 10 July 2011, the Board of Directors entered into an agreement to dispose off its entire interest in a
subsidiary, AE Packaging Sdn. Bhd., a packaging company, to streamline the Group’s operations. The disposal of the subsidiary was completed on 1 December 2011.
The net assets of AE Packaging Sdn. Bhd. at the date of disposal and at 31 December 2010 were as follows:
1.12.11 31.12.10 RM RM Property, plant and equipment 839,808 860,112 Inventories 43,788 90,255 Trade and other receivables 712,566 799,234 Cash and bank balances 1,986 321 Trade and other payables (880,600) (976,970) Current tax liabilities (17,166) (13,268) Bank overdrafts (201,716) (173,334)
FRS Ref. 3.23(a)
3.23(b)
ILLUSTRATIVE GROUP SDN. BHD. (Company No. 200212345A) (Incorporated in Malaysia) AND ITS SUBSIDIARIES
3.17(e) 3.23(c)
NOTES TO THE FINANCIAL STATEMENTS FOR THE FINANCIAL YEAR ENDED 31 DECEMBER 2011
66
1.12.11 31.12.10 RM RM Other borrowings (416,238) (300,052) Deferred tax liabilities (Note 13) (37,543) (36,504) Attributable goodwill (Note 7) 176,930 176,930
Net assets of AE Packaging Sdn. Bhd.
221,815
426,724
Gain on disposal (Note 35(c)) 1,459
Total consideration
223,274
Cash and cash equivalents disposed off 199,730
Disposal of a subsidiary, net of cash and cash equivalents disposed off
423,004
40. PURCHASES OF PROPERTY, PLANT AND EQUIPMENT The Group The Company 2011 2010 2011 2010 RM RM RM RM Purchases of property, plant and equipment (Note 5) 4,494,329 748,995 677 1,088 7.19 Less: Purchases made directly by: - term loans * (142,219) (36,129) - - 7.19(a) - finance lease (413,758) (117,688) - -
Purchases of property, plant and equipment made by cash payments
3,938,352
595,178
677
1,088
7.18(a) * Note: If the assets are acquired by directly assuming the related liabilities, the transaction is deemed to be a non-cash transaction.
41. BINDING SALES AGREEMENT 4.14(a), (b) On 15 November 2011, the Board of Directors enter into an agreement to dispose off an investment property
of the Group to realise the investment in the property. The disposal is expected to be completed by the second quarter during the financial year ending 31 December 2012, after the transaction is approved by the relevant authorities and shareholders of the buyer. Since the selling price less costs to sell is expected to exceed the net carrying amount of the relevant assets and liabilities, no impairment loss is recognised.
FRS Ref. 3.23(a)
3.23(b)
ILLUSTRATIVE GROUP SDN. BHD. (Company No. 200212345A) (Incorporated in Malaysia) AND ITS SUBSIDIARIES
3.17(e) 3.23(c)
NOTES TO THE FINANCIAL STATEMENTS FOR THE FINANCIAL YEAR ENDED 31 DECEMBER 2011
67
4.14(c) The carrying amount of these assets and liabilities are as follows:
The Group 31.12.11 RM Assets: Investment property
Trade and other receivables 543,924
10,396
554,320 Liabilities directly associated with assets: Trade and other payables 9,596 Other borrowings 213,512
223,108
Net amounts
331,212
33.9(a) 42. RELATED PARTY TRANSACTIONS The Group The Company 2011 2010 2011 2010 RM RM RM RM 33.10(a) Holding Company Dividend paid 1,450,000 1,400,000 1,450,000 1,400,000
33.10(b) Subsidiaries Dividend revenue - - 276,870 213,456 Property rental revenue - - 75 179 Management fee revenue - - 89,949 54,609
33.10(b) Associate Dividend revenue - - 14,898 23,458
33.10(d) Companies in which directors of the Company have interests Sales of goods 78,693 126,201 - - Licence fee revenue 2,304 1,870 - - Property rental revenue 96,812 33,943 - -
33.13 The directors are of the opinion that all the transactions above have been entered into in the normal course of business and have been established on terms and conditions that are not materially different from that obtainable in transactions with unrelated parties. *
* Note: This disclosure shall be included only if such terms can be substantiated.

FRS Ref. 3.23(a)
3.23(b)
ILLUSTRATIVE GROUP SDN. BHD. (Company No. 200212345A) (Incorporated in Malaysia) AND ITS SUBSIDIARIES
3.17(e) 3.23(c)
NOTES TO THE FINANCIAL STATEMENTS FOR THE FINANCIAL YEAR ENDED 31 DECEMBER 2011
68
33.6 Key management personnel compensation The Group The Company 2011 2010 2011 2010 RM RM RM RM
33.7
Total key management personnel compensation
320,648
314,355
319,568
313,275
43. COMMITMENTS Capital commitments of the Company and its subsidiaries 17.32(b) At the reporting date, the Group and the Company have the following commitments for the acquisition of the
property, plant and equipment:
The Group The Company 2011 2010 2011 2010 RM RM RM RM Contracted but not provided for 66,504 48,040 8,593 6,594 Authorised but not contracted for 20,124 30,324 - -
86,628
78,364
8,593
6,594
Capital commitments arising from the interest in jointly-controlled entities 15.19(d) The Group’s share of the capital commitments for the acquisition of the property, plant and equipment of the
jointly-controlled entities are as follows:
The Group 2011 2010 RM RM Contracted but not provided for 52,459 48,982 Authorised but not contracted for 21,212 10,036
73,671
59,018
Commitments arising from the investment property 16.10(d) The Group and the Company have entered into contracts for the repairs, maintenance and enhancements of
the investment property. The commitments for the contracts are as follows:
The Group The Company 2011 2010 2011 2010 RM RM RM RM Within one year 20,510 20,238 10,034 10,043 Later than one year and not later than five years 63,201 71,006 30,233 30,301
83,711
91,244
40,267
40,344

FRS Ref. 3.23(a)
3.23(b)
ILLUSTRATIVE GROUP SDN. BHD. (Company No. 200212345A) (Incorporated in Malaysia) AND ITS SUBSIDIARIES
3.17(e) 3.23(c)
NOTES TO THE FINANCIAL STATEMENTS FOR THE FINANCIAL YEAR ENDED 31 DECEMBER 2011
69
Operating lease commitments 20.16(a), (c)
The future minimum lease payments under non-cancellable operating leases of the Group for the leasing of certain of the office premises, with an average lease term of 8 years, is as follows:
The Group 2011 2010 RM RM Not later than one year 10,543 10,439 Later than one year and not later than five years 43,450 42,861 Later than five years 31,239 82,001
85,232
85,301
44. CONTINGENT LIABILITIES 21.15 During the financial year, a customer of a subsidiary took legal action against the said subsidiary for default
in payment of the warranty claims to the said customer amounting to RM40,000. However, based on legal opinion and the terms of the warranty agreement entered into with the customer, the said subsidiary has a merit to win the legal suit. Thus, additional provision has not been made in the financial statements of the Group. However, the associated legal costs have been accrued in the statements of financial position.
3.12 45. RECLASSIFICATIONS OF COMPARATIVE FIGURES During the financial year, the Group and the Company changed the classification of certain items in its
financial statements as a result of the adoption of FRS for SMEs, thus, the Group and the Company has reclassified the following comparative figures to conform with the current financial year’s presentation:
The Group As Previously Reported
As Restated 2010 2010 RM RM Statement of Financial Position Non-current assets Other investments 612,201 - Other financial assets - 612,201 Current assets Biological assets carried at fair value through profit or loss - 100,275 Inventories 770,136 669,861 Other investments 155,781 - Other financial assets - 155,781

FRS Ref. 3.23(a)
3.23(b)
ILLUSTRATIVE GROUP SDN. BHD. (Company No. 200212345A) (Incorporated in Malaysia) AND ITS SUBSIDIARIES
3.17(e) 3.23(c)
NOTES TO THE FINANCIAL STATEMENTS FOR THE FINANCIAL YEAR ENDED 31 DECEMBER 2011
70
The Company As Previously Reported
As Restated 2010 2010 RM RM Statement of Financial Position Non-current assets Other investments 17,952 - Other financial assets - 17,952 Current assets Other investments 52,090 - Other financial assets - 52,090
32.10(a),(b) 46. EVENTS AFTER THE REPORTING PERIOD After the reporting period,
a) the Company has obtained court approval to appeal against a legal suit won by a creditor at the end of the reporting period. Total amount claimed by the creditor is RM1 million. No provision has been made in the financial statements as the advocator of the Company estimates that the Company has a good chance of winning the litigation.
b) one of the Group’s debtors has gone into liquidation. The total outstanding amount due from this debtor is RM70,000. Of the total outstanding amount, the Group expects to recover approximately RM50,000. An impairment loss has been recognised for the estimated unrecoverable amount.
47. AUTHORISATION FOR ISSUE OF THE FINANCIAL STATEMENTS 32.9 The financial statements of the Group and of the Company were authorised for issue by the Board of
Directors on 31 January 2012.
The following additional notes are prepared for reference:
3.10 CHANGE OF THE END OF THE REPORTING PERIOD During the financial period, the Company changed the end of the reporting period from 30 June to 31
December to coincide with the end of the reporting period of its holding company in accordance with the Singapore Companies Act (or any other reasons). Thus, the amounts presented in the statements of comprehensive income, changes in equity and cash flows and the related notes for the current financial period are for a period of six months, and they are not entirely comparable with the comparative figures.
35.15 PRESENTATION OF FIRST SET OF FINANCIAL STATEMENTS This is the first set of financial statements prepared by the Company since its date of incorporation on
________________, thus, comparative figures are not presented.
35.15 PRESENTATION OF FIRST SET OF GROUP FINANCIAL STATEMENTS As the Group was formed during the financial period, comparative figures are not presented for the Group’s
financial statements.

�������������� ���� ���� �� ����������������������������� ��!"���"����"��#��$%�"&'$'�##����(��)�'�'*'�+�������$%�"&'$'�����',�"���'�'$�'���-�.�������+���#�/0'1-�.�������+���#�/��2'�-�2'"3��,42$'1! �25556789:;6<=7>?@?8AB?CCCCC6CCCCCDBEF?G=HICCCCC6CCCCCJ=EFCK=EFLMNOPQRPSTPUVNPWXYPNLQZP[\\]ZY_abPUc_cd_\PN_bebcZPfP#�++�����ghijklmnlopoqrlstlopouskvl


![IFRS for SMEs 2009 - Institute of Chartered Accountants …1].pdfAPPROVAL BY THE BOARD OF THE IFRS FOR SMEs ISSUED JULY 2009 231 BASIS FOR CONCLUSIONS see separate booklet ILLUSTRATIVE](https://static.fdocuments.net/doc/165x107/5ab9b13e7f8b9ac1058e2a10/ifrs-for-smes-2009-institute-of-chartered-accountants-1pdfapproval-by-the.jpg)


