FRPC reinforced concrete beam-column joints under cyclic ... reinforced concrete beam... · The RCC...
15
FRPC reinforced concrete beam-column joints under cyclic excitation Abhijit Mukherjee * , Mangesh Joshi Department of Civil Engineering, Indian Institute of Technology Bombay, Mumbai 400 076, India Available online 29 September 2004 Abstract An investigation on the performance of reinforced concrete beam-column joints under cyclic loading is reported. Joints have been cast with adequate and deficient bond of reinforcements at the beam-column joint. FRP sheets and strips have been applied on the joints in different configurations. The columns are subjected to an axial force while the beams are subjected to a cyclic load with controlled displacement. The amplitude of displacement is increased monotonically using a dynamic actuator. The hysteretic curves of the specimens have been plotted. The energy dissipation capacity of various FRP configurations has been compared. In addition, the control specimens have been reused after testing as damaged specimens that are candidates for rehabilitation. The rehabilitation has been carried out using FRP and their performance has been compared with that of the undamaged specimens. Ó 2004 Elsevier Ltd. All rights reserved. Keywords: Structural upgradation; Fiber reinforced polymer composites; Concrete; Beam-column joints; Cyclic loading; Hysteretic curves; Energy absorption 1. Introduction Although hundreds of thousands of successful rein- forced cement concrete (RCC) framed structures are annually constructed worldwide, there are large num- bers of them that deteriorate, or become unsafe due to changes in loading, changes in use, or changes in config- uration. Occurrence of natural calamities may also lead to review of engineering notions that make reworking of existing structures inevitable. The reworking is variously referred as repair, rehabilitation, retrofitting, and upgra- dation with distinct meanings attached to all these terminologies. In this paper, we use upgradation to sug- gest all these activities. The RCC beam-column joints may require upgradation due to deficient detailing of reinforcing bars, insufficient column sections or due to increased loading on the structure. Upgradation of these joints, however, is a challenging task that poses major practical difficulties. A variety of techniques have been applied to joints with the most common ones being the construction of RCC or steel jackets [1,2]. Rein- forced concrete jackets require intensive labor and often intricate detailing of steel in the form of diagonal collars. Moreover, concrete jackets increase the dimensions and weight of structural elements. Few attempts have been made in employing plain or corrugated steel plates [3,4]. In addition to corrosion protection, these ele- ments require special attachment through the use of either epoxy adhesives combined with bolts or special grouting. FRPC based strengthening strategy could be an attractive option in order to restore the joints. In addi- tion to being lighter, thinner and easier to implement FRPC reinforced joints have the virtue of making the joints more ductile. This property is extremely desirable for seismic upgradation of structures. However, a direct extension of the strategies adopted for beams and columns is difficult as the behavior of beam-column con- nections is complex and still not completely understood. 0263-8223/$ - see front matter Ó 2004 Elsevier Ltd. All rights reserved. doi:10.1016/j.compstruct.2004.08.022 * Corresponding author. Tel.: +91 22 2576 7343/578 2545; fax: +91 22 576 7302/578 3480. E-mail address: [email protected] (A. Mukherjee). Composite Structures 70 (2005) 185–199 www.elsevier.com/locate/compstruct
Transcript of FRPC reinforced concrete beam-column joints under cyclic ... reinforced concrete beam... · The RCC...

Composite Structures 70 (2005) 185–199
www.elsevier.com/locate/compstruct
FRPC reinforced concrete beam-column joints under cyclic excitation
Abhijit Mukherjee *, Mangesh Joshi
Department of Civil Engineering, Indian Institute of Technology Bombay, Mumbai 400 076, India
Available online 29 September 2004
Abstract
An investigation on the performance of reinforced concrete beam-column joints under cyclic loading is reported. Joints have been
cast with adequate and deficient bond of reinforcements at the beam-column joint. FRP sheets and strips have been applied on the
joints in different configurations. The columns are subjected to an axial force while the beams are subjected to a cyclic load with
controlled displacement. The amplitude of displacement is increased monotonically using a dynamic actuator. The hysteretic curves
of the specimens have been plotted. The energy dissipation capacity of various FRP configurations has been compared. In addition,
the control specimens have been reused after testing as damaged specimens that are candidates for rehabilitation. The rehabilitation
has been carried out using FRP and their performance has been compared with that of the undamaged specimens.
� 2004 Elsevier Ltd. All rights reserved.
Keywords: Structural upgradation; Fiber reinforced polymer composites; Concrete; Beam-column joints; Cyclic loading; Hysteretic curves; Energy
absorption
1. Introduction
Although hundreds of thousands of successful rein-
forced cement concrete (RCC) framed structures are
annually constructed worldwide, there are large num-
bers of them that deteriorate, or become unsafe due tochanges in loading, changes in use, or changes in config-
uration. Occurrence of natural calamities may also lead
to review of engineering notions that make reworking of
existing structures inevitable. The reworking is variously
referred as repair, rehabilitation, retrofitting, and upgra-
dation with distinct meanings attached to all these
terminologies. In this paper, we use upgradation to sug-
gest all these activities. The RCC beam-column jointsmay require upgradation due to deficient detailing of
reinforcing bars, insufficient column sections or due to
increased loading on the structure. Upgradation of these
0263-8223/$ - see front matter � 2004 Elsevier Ltd. All rights reserved.
doi:10.1016/j.compstruct.2004.08.022
* Corresponding author. Tel.: +91 22 2576 7343/578 2545; fax: +91
22 576 7302/578 3480.
E-mail address: [email protected] (A. Mukherjee).
joints, however, is a challenging task that poses major
practical difficulties. A variety of techniques have been
applied to joints with the most common ones being
the construction of RCC or steel jackets [1,2]. Rein-
forced concrete jackets require intensive labor and often
intricate detailing of steel in the form of diagonal collars.Moreover, concrete jackets increase the dimensions and
weight of structural elements. Few attempts have been
made in employing plain or corrugated steel plates
[3,4]. In addition to corrosion protection, these ele-
ments require special attachment through the use of
either epoxy adhesives combined with bolts or special
grouting.
FRPC based strengthening strategy could be anattractive option in order to restore the joints. In addi-
tion to being lighter, thinner and easier to implement
FRPC reinforced joints have the virtue of making the
joints more ductile. This property is extremely desirable
for seismic upgradation of structures. However, a direct
extension of the strategies adopted for beams and
columns is difficult as the behavior of beam-column con-
nections is complex and still not completely understood.

186 A. Mukherjee, M. Joshi / Composite Structures 70 (2005) 185–199
Research on this area can be classified into experiments
with quasistatic loading on bridge beam-column joints
[5,6], typical building frame joints [7,8] and frameworks
[9] report enhancement of both shear and bending capac-
ity. Cyclic load tests on joints with inadequate reinforce-
ment bond length [10], rehabilitated specimens [11],shear strengthened T joints [12–14], have also reported
substantial improvements in ultimate capacities. A com-
bination of FRP in various forms bars, plates and sheets
in structural enhancement have been investigated [15,16].
The suitability of adhesives of different moduli [17] has
also been studied. On some occasions a combination of
FRP and steel external reinforcements has been used
[18]. FRP in seismic retrofitting of strong-beam-weak-column frameworks that are prevalent in gravity load de-
signed buildings have been investigated [19].
Analytical models of externally reinforced beam-col-
umn joints have been presented using closed form solu-
tions [20], and finite element technique [21]. Design
methods have been suggested for shear [22] and bending
[20]. Pushover analysis has been employed in the design
of upgradation for bridge joints [21] and buildings [23]in seismic conditions.
Survey of existing constructions reveals that upgrada-
tion of structures is necessary in three conditions:
• The structure is inadequately designed for the present
load conditions.
• The structure is inadequately detailed for the present
loading. This also includes those structures that arefound deficient under seismic conditions.
• The structure is damaged and requires rehabilitation.
This paper includes joints of all the three varieties.
The motivation behind this program is to examine the
performance of fiber reinforced polymer composites
(FRP) in upgradation of healthy joints with adequate
and deficient reinforcements and also in rehabilitationof damaged joints. The load deflection relations ob-
400m
m40
0mm
400mm 400mm
A
A
B B
Fig. 1. Specimen with ducti
tained experimentally are discussed along with failure
types.
2. Experimental work
2.1. Specimen details
Two different types of RCC joints have been cast for
experimental verification. One set of joints has adequate
steel reinforcements with proper detailing of reinforce-
ments at the critical sections (Fig. 1). In the other set
of specimens the beam reinforcements have deficient
bond lengths at the junctions with the columns (Fig.2). When the beam of the joint is transversely loaded
the first set is characterized by a long plastic zone (duc-
tile) while the second set fails in reinforcement pull out
and exhibits sudden failure (non-ductile).
The concrete used is of M30 grade (30N/mm2) and
properties of other material used are shown in Table 1.
2.2. FRP reinforcements
The specimens in Figs. 1 and 2 were strengthened by
using carbon and glass FRP materials. Prior to the
application of the FRP the concrete substrate was
smoothed by grinding and cleaning. The cement paste
was removed from the surface and the coarse aggregates
were exposed. Acetone was used to clean the surface.
The corners of all the members were ground to createa minimum radius of 10mm. Epoxy putty was used to
fill the voids and concave areas. Figs. 3 and 4 present
schematic arrangement for two typical systems; L-over-
lays and precured carbon plates respectively.
2.3. Type A: L-reinforcement with GFRP/CFRP sheets
In this type, FRP sheets were applied in L shape toupgrade the joints. FRP has been applied in several
3mmφ stirrups @ 100mm c/c
100
100
#4 –6mmφ mild steel
Section A-A
3mmφ stirrups @ 100mm c/c
100
100
#4 –6mmφmild steel
Section B-B
le joint reinforcement.

400m
m40
0mm
400mm 400mm
A
A
B B
3mmφ stirrups @ 100mm c/c
100
100
#4 –6mmφ mild steel
Section A-A
3mmφ stirrups @ 100mm c/c
100
100
#4 –6mmφ mild steel
Section B-B
25 mm
Fig. 2. Specimen with non-ductile joint reinforcement.
Table 1
Properties of materials
Material Effective thickness (mm) Ultimate strength (MPa) Tensile modulus (GPa) Ultimate strain
Glass—G (fiber) 0.36 2250 70 0.0239
Carbon—C (fiber) 0.11 3500 230 0.0117
Carbon plate—CP (composite) 1.2 2800 165 0.017
Mild steel longitudinal reinforcement 6mm dia 275 198 0.045
Mild steel transverse reinforcement 3mm dia 555.13 193 0.043
FRP Overlays
(a) (b)
FRP Wrap
Fig. 3. Type A strengthening system—use of composite overlays.
(a) (b)
S512 plate
CFRP Wrap
Fig. 4. Type B strengthening system—use of precured carbon plate.
A. Mukherjee, M. Joshi / Composite Structures 70 (2005) 185–199 187
layers. In step 1 FRP has been applied on the top and
bottom surfaces concrete surfaces. The fibers were along
the axes of the members (Fig. 3a). Subsequently, FRP
wraps were provided over the inner layers (Fig. 3b).
The direction of fibers in wraps was perpendicular to
the axis of the members.
Each joint was used for two different lay ups. Fig. 5a
shows glass fiber sheets (80mm wide and 250mm long)on either side of the joint. On one side only one layer
is provided. On the other side two layers of FRP have
been provided to evaluate the efficacy of different extents
of upgradation. Both the column and the beam are then
wrapped by unidirectional glass fibers with 100mm lap
length as shown in step 2 of Fig. 5. Same configuration
is repeated using carbon fiber sheet using 1 and 2 layers
of overlays and single wrap with 100mm overlap. Bothadequate and deficient joints were reinforced using this
configuration.
2.4. Type B: reinforcement with plates
In this type, procured carbon plate (25mm wide and
1.2mm thick) have been used in the beams to improve
bending stiffness. To achieve a good bond between theplate and the concrete beam at the joint a groove
(25mm wide and 25mm deep) has been created inside
the concrete joint. The plates have been inserted into
the joint as shown in Fig. 6. The groove was left in the
specimens at the time of casting. Surfaces of the con-
crete specimens were prepared as discussed earlier. The

250
250
GFRP 2L (80X0.72)
GFRP 1L (80X0.36)
250
250
GFRP 1 Wrap
(a) (b)
GFRP 2L (80X0.72)
Fig. 5. Strengthening Type A with GFRP/CFRP Sheets.
(a) (b)
CFRP 1 Wrap
450
CFRP plate (25X1.2 mm)
Groove 25 mm
CFRP plate (25X1.2 mm)
Fig. 6. Strengthening Type B.
Table 3
Test matrix for non-ductile specimen
S.
no.
Specimen
name
Details
1. ND-1 –
2 G1L-ND Type A with single L of GFRP at top and bottom
3 G2L-ND Type A with two L of GFRP at top and bottom
4 C1L-ND Type A with single L of CFRP at top and bottom
5 C2L-ND Type A with two L of CFRP at top and bottom
6 CP1-D Type B with CFRP plate at top and bottom
188 A. Mukherjee, M. Joshi / Composite Structures 70 (2005) 185–199
groove was filled by injecting epoxy resin, and the plates
were inserted in grove as shown in step 1 of Fig. 6. The
beams and columns were then wrapped using a single
wrap of carbon sheet.
2.5. Rehabilitated specimens
The control specimens without FRP were used after
testing to evaluate the rehabilitation of joints with
FRP. From the failed specimens loose concrete was re-
moved and the cracks and voids were filled with epoxy
and sand mortar. The smooth surfaces were restored
prior to the application of FRP. Grooves were cut up
to 25mm depth using a rotary concrete cutter. Type Bstrengthening system with precured carbon plates was
used.
The detailed test matrix for adequate and deficient
specimens is presented in Tables 2 and 3 respectively.
Table 2
Test matrix for ductile specimen
S.
no.
Specimen
name
Details
1 D-1 –
2 G1L-D Type A with single L of GFRP at top and bottom
3 G2L-D Type A with two L of GFRP at top and bottom
4 C1L-D Type A with single L of CFRP at top and bottom
5 C2L-D Type A with two L of CFRP at top and bottom
6 CP1-D Type B with CFRP plate at top and bottom
7 Rehab. Type B with CFRP plate at top and bottom
2.6. Test program
The experimental setup is as shown in Fig. 7. The col-
umn was fixed at its ends on a loading frame. It was sub-
jected to a constant axial load of 100KN which is 50%
of ultimate load carrying capacity of the column. This
is considered the service load that the column is expected
to carry under normal loading conditions.Cyclic load was applied using a hydraulic actuator.
The load cycle was predefined as shown in Fig. 8. The
displacement started from the neutral position and it
oscillated harmonically about that position. It increased
at a uniform rate 0.25mm/cycle. Each cycle comprises of
three full waves of same amplitude in 10s (0.3Hz. fre-
quency). The final tip deflection was 22.5mm. The other
end of the beam was free. Vertical deflection of the tip ofthe beam was recorded directly by the linear variable
displacement transducer (LVDT) built in the actuator.
It was validated with another external LVDT. The data
were collected using a computerized data acquisition
system.

Fig. 7. Experimental setup.
A. Mukherjee, M. Joshi / Composite Structures 70 (2005) 185–199 189
3. Results and discussion
The beam tip load–displacement characteristics for
all the specimens are discussed here. The displacement
levels of the first few cycles did not generate any nonlin-
ear deformation in the structure and the loops followed
a straight line with its slope as initial stiffness. The onset
of stiffness degradation was identified by simultaneousappearance of tension cracks at the root of the cantilever
beam. The calculations show that at this point the steel
started to yield and it was not capable of taking any fur-
ther load. The additional load from this point was
carried by the FRP. At this point linearity of the ascend-
ing and the descending paths was lost and loops between
the two paths appeared. We term this phenomenon
yield. The post yield behavior is signified by monotonicdegradation of stiffness. To enable comparison among
different systems studied here the tip load–displacement
envelopes are plotted by joining the peaks of consecu-
tive loops. These plots have better clarity. The rate of
stiffness degradation can also be found out from these
plots.
Ability of the structure to survive an earthquake de-
pends to a large extent on its ability to dissipate the input
energy. Forms of energy dissipation include kinetic en-ergy, viscous damping and hysteretic damping, etc. An
estimate of the hysteretic damping can be found by the
area enclosed in the load–displacement hysteresis loops.
It may be noted that a wider loop (i.e. a large difference
in ordinates in the ascending and the descending paths)
would signify higher hysteretic damping. Cumulative en-
ergy dissipated was then calculated by summing up the en-
ergy dissipated in consecutive loops through out the test.Failure modes for different specimens are also discussed.

(a) Full cycle
0 100 200 300 400 500-30
-20
-10
0
10
20
30D
ispl
acem
ent (
mm
)
Time(Sec)
| | | | | | | | | | | | | | | | | | | 5 15 25 35 45 55 65 75 85
-2
-1
0
1
2
Dis
plac
emen
t (m
m)
Time(sec)
0
(b) Close view of cycle
Fig. 8. Predefined displacement cycle applied to beam end.
190 A. Mukherjee, M. Joshi / Composite Structures 70 (2005) 185–199
3.1. Ductile specimens
Beam tip load–displacement graphs for the ductile
specimens are plotted in Fig. 9. From the graphs it
can be seen that the load at yield was considerably
higher in the FRP reinforced specimens than the control
specimen. Column 3 of Table 4 summarizes the percent-
age increase in the yield load. The CP1-D exhibited the
highest increase in the yield load followed by the C2L-D, G1L-D and G2L-D specimens. It may be noted that
the forces at the tensile face of the beam are shared by
the steel and FRP in proportion of their relative stiff-
nesses. The stiffness of carbon is considerably higher
than that of glass. Therefore, for the same tip load,
the tensile force in steel is lower in the carbon reinforced
specimen than in the glass reinforced specimens. As a re-
sult, the steel in the carbon reinforced specimens yieldsat higher tip loads. The CP1-D specimens are anchored
at the joint through a groove. Therefore, they exhibit
higher stiffness than other sheet specimens. The speci-
mens with two-layer reinforcement had higher yield
loads than the specimens with one layer reinforcements.
Due to FRP reinforcements the displacement at yield
increased to a much lesser extent than the load (Column
5, Table 4). Another interesting point is that the glassreinforced specimens had much higher displacement at
yield than the carbon reinforced specimens. This is due
to the higher stiffness of carbon than that of glass. The
ultimate strain in glass is also considerably higher than
that in carbon. The CP1 specimens do not follow that
trend. The authors believe that better bonding of CP1
specimens through grooves has delayed the onset of
yield in them.
The load–displacement envelopes for ductile speci-men are plotted in Fig. 10. The envelopes let us compare
the relative performance of the specimens. All the FRP
reinforced specimens had higher peak loads than the
control specimen. The CP1 specimen had the highest
peak load followed by the C2L, G2L and G1L speci-
mens. The graph shows the superiority of Type-B
arrangement over Type-A reinforcements.
The rate of stiffness degradation is plotted in Fig. 11.All the FRP reinforced specimens had a total loss of
stiffness at a higher displacement level than the control
specimen. This is a highly desirable phenomenon be-
cause the joint collapse can be deferred through FRP
reinforcement. The carbon specimens have higher initial
stiffness and slower rate of degradation. The CP1 speci-
mens showed some initial gain in stiffness. The authors
believe that this is due to the rearrangement in the adhe-sively bonded groove. The initial stiffness and the ulti-
mate displacements are summarized in Table 5.
The overall performance of the joints can be summa-
rized by the energy dissipation of the structure. The cumu-
lative energy dissipation graphs for the specimens are
presented in Fig. 12. The energy dissipation of the FRP
reinforced specimens follows closely that of the control
specimen. The dissipation of energy is mainly throughthe yielding if steel. It may be remembered that the FRPs
remain elastic until failure. Therefore, not much dissipa-
tion of energy is expected through the deformation of
the FRP. The only agent of energy dissipation in FRP
at this stage is debonding and delamination and the result-
ing Coulomb damping. However, the FRPs have in-
creased the ultimate deformation of the structure to a
large extent. Through higher deformation the FRP rein-forced structures have exhibited much higher dissipation
of energy. The reasons of higher ultimate deformation
in FRP reinforced specimens will be discussed in conjunc-
tion with the failure mode. The carbon specimens exhibi-
ted higher energy dissipation than the glass specimens.
The photographs of the failed specimens have been
presented in Fig. 13. In Fig. 13a the failed control spec-
imen is shown. It may be noted that the beam has failedat the joint through the formation of a hinge. The hinge
has formed between the two shear links of the beam.
The concrete has spalled in such a fashion that two semi-
circular surfaces have been created. This has resulted in
free rotation of the beam limb with no transfer of bend-
ing moment to the column. The reinforcements have
been exposed due to spalling of concrete. This has re-
sulted in kinking of the reinforcements. Due to spallingthe cracks were too wide and therefore, they did not
come in contact in compression. The FRP reinforced

-15- 10 -5 0 5 10 15
-4
-2
0
2
4 Control G1L-D
-6
-4
-2
0
2
4
6
Load
(K
N)
Load
(K
N)
Load
(K
N)
Load
(K
N)
Load
(K
N)
G2L-D
-6
-4
-2
0
2
4
6
-6
-4
-2
0
2
4
6
C2L-D
CP 1-D
-20 -10 0 10 20
-20 -10 0 10 20 -20 -10 0 10 20
-20 -10 0 10 20
-8
-6
-4
-2
0
2
4
6
8
Displacement (mm)
Displacement (mm)
Displacement (mm)
Displacement (mm)
(a) (b)
(d)(c)
(e)
Displacement (mm)
Fig. 9. Load versus deflection for different non-ductile specimens.
Table 4
Yield points of ductile specimens
Specimen Yield load (N) Deflection at yield load
(mm)
Value % increase Value % increase
Control 3.8 – 1.9 –
�4.15 �1.86
G1L-D 4.61 21.32 1.71 �10.00
�4.65 12.05 �2.14 15.05
G2L-D 5.64 48.42 3.02 58.95
�5.54 33.49 �2.44 31.18
C2L-D 6.0 57.89 1.84 �3.16
�5.53 33.25 �2.0 7.53
CP1-D 8.215 116.18 4.975 161.84
�7.67 84.82 �2.87 54.3
A. Mukherjee, M. Joshi / Composite Structures 70 (2005) 185–199 191
specimens, on the other hand, did not have the semicir-
cular failure planes. The failure planes were approxi-
mately vertical (Fig. 13b–d). The authors believe that
the difference in the failure mode is due to the presence
of the FRP wraps. They confined the concrete and didnot allow it to spall. As a result, in cyclic opening and
closing of cracks the crack surfaces could react against
each other in compression. Therefore, the moment
resistance of the beam was not lost. This offered higher
collapse loads and displacement. To summarize, the
main cause of superior performance of the FRP rein-
forced joints is the continuous confinement provided
by the FRP wraps impeded the creation of hingethrough the spalling of concrete.

-25- 20 -15- 10 -5 0 10 15 20 25
-8
-6
-4
-2
0
2
4
6
8
10
CP 1
C2L
G2L
G1L
Control
Load
(K
N)
Displacement (mm)
5
Fig. 10. Load versus deflection envelope plots for ductile specimens.
0 2 4 6 8 10 12 14 16 18 20 220.0
0.5
1.0
1.5
2.0
2.5
3.0
3.5
4.0
4.5
5.0
5.5
6.0
Control
G2L
G1L
CP 1
C2L
Slo
pe (
KN
/mm
)
Displacement (mm)
Fig. 11. Stiffness versus deflection plots for ductile specimens.
0 2 4 6 8 10 12 14 16 180.0
0.5
1.0
1.5
2.0
2.5
3.0
3.5
4.0
4.5
5.0
5.5
6.0
6.5
CP 1 G1L
G2L
C2L
Control
Ene
rgy
diss
ipat
ion
(KN
-m)
Displacement (mm)
Fig. 12. Energy dissipation versus displacement plots for ductile
specimens.
192 A. Mukherjee, M. Joshi / Composite Structures 70 (2005) 185–199
Fig. 13d shows the failure of CP1 specimens. In this
case the CFRP plates were adhesively bonded into the
joint by inserting them inside a grove at the joint. The
figure shows that the carbon plates have pulled out of
the joint and there is no damage to the plate. A thin
layer of cement paste is on the surface of the pulledout portion. This shows that the pullout was due to
the failure of the cement paste in the groove. The
authors expect that this mode will change when larger
specimens would be tested; because then the groove
Table 5
Ultimate points in ductile specimens
Specimen Initial stiffness Ultim
Value (KN/mm) % increase Value
Control 2.32 – 12.7
�12.7
G1L-D 2.80 17.14 14.5
�15.8
G2L-D 4.06 75.00 16.4
�17.7
C2L-D 5.59 140.94 18.1
�17.8
CP1-D 3.28 41.37 15.3
�17.6
could be created through large aggregates. The mechan-
ical anchorage of the large aggregate would help increas-ing the pull out forces. However, this point needs to be
verified through tests. Another difference in these speci-
mens is that the steel reinforcements had torn com-
pletely through cup and cone formation. This shows
that the deformations in CP1 specimens were large en-
ough to reach the ultimate strain of steel. As a result,
the ultimate failure of the joint was not due to the yield-
ing of steel but the pull out of the CFRP plate.
3.2. Rehabbed specimens
A beam tip load–displacement relationship for
undamaged ductile specimen and rehabbed specimen is
plotted in Fig. 14. Also the load versus displacement
envelops for the same specimens are plotted in Fig. 15.
It shows that the use of composite system did not onlyrestore the original capacity of damaged specimen, but
also upgraded the ultimate load capacity by 55%. Also
displacement at ultimate load increased by 30%. Stiff-
ness versus displacement curves (Fig. 16) show that
there is 48% increase in initial stiffness. An increment
of 57% is observed in energy dissipation capacity of
ate deflection Energy dissipation capacity
(KNm)
(mm) % increase Value % increase
– 2.37 –
3
6 14.65 4.68 97.47
6 24.59
1 29.21 4.18 76.37
8 39.67
4 42.83 5.96 151.48
6 40.30
2 20.63 5.21 119.83
1 38.42
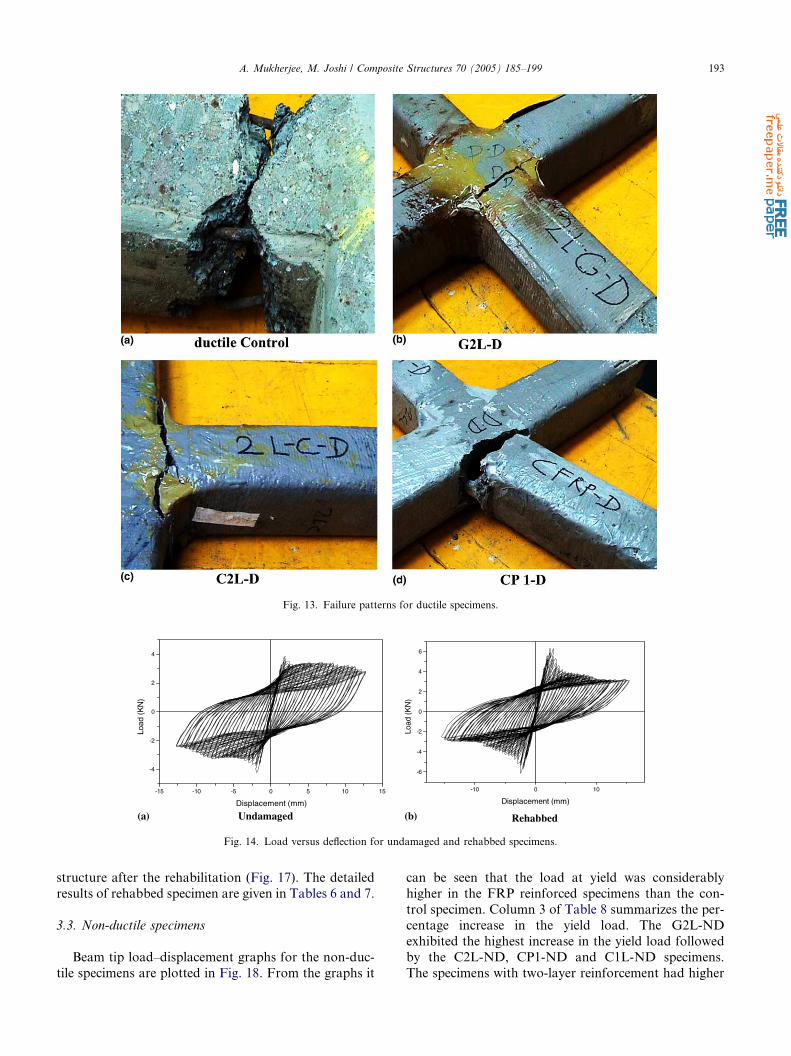
Fig. 13. Failure patterns for ductile specimens.
-15 -10 -5 0 5 10 15
-4
-2
0
2
4
Load
(K
N)
Displacement (mm)
Undamaged
-10 0 10
-6
-4
-2
0
2
4
6
Load
(K
N)
Displacement (mm)
Rehabbed (a) (b)
Fig. 14. Load versus deflection for undamaged and rehabbed specimens.
A. Mukherjee, M. Joshi / Composite Structures 70 (2005) 185–199 193
structure after the rehabilitation (Fig. 17). The detailed
results of rehabbed specimen are given in Tables 6 and 7.
3.3. Non-ductile specimens
Beam tip load–displacement graphs for the non-duc-
tile specimens are plotted in Fig. 18. From the graphs it
can be seen that the load at yield was considerably
higher in the FRP reinforced specimens than the con-
trol specimen. Column 3 of Table 8 summarizes the per-
centage increase in the yield load. The G2L-ND
exhibited the highest increase in the yield load followed
by the C2L-ND, CP1-ND and C1L-ND specimens.
The specimens with two-layer reinforcement had higher

-15 -10 -5 0 5 10 15
-6
-4
-2
0
2
4
6
8
Undamaged specimen
Rehabbed specimen
Load
(K
N)
Displacement (mm)
Fig. 15. Load versus deflection envelope plots for rehabbed and undamaged specimen.
0 2 4 6 8 10 12 140.0
0.5
1.0
1.5
2.0
2.5
3.0
3.5
Rehabbed
Undamaged
Stif
fnes
s (K
N/m
m)
Displacement (mm)
Fig. 16. Stiffness versus deflection plots for undamaged and rehabbed
Specimens.
0 2 4 6 8 10 12 14 16 180.0
0.5
1.0
1.5
2.0
2.5
3.0
3.5
4.0
Rehabbed
Undamaged
Ene
rgy
diss
ipat
ion
(KN
-m)
Displacement (mm)
Fig. 17. Energy dissipation versus deflection plots for undamaged and
rehabbed specimens.
Table 6
Yield points of undamaged and rehabilitated specimens
Strengthening configuration Yield load Deflection at yield load
Value (N) % increase Value (mm) % increase
Undamaged 3.8 – 1.9 –
�4.15 �1.86
Rehabbed 6.31 66.05 2.46 29.47
�5.97 43.86 �2.42 30.11
Table 7
Ultimate points in undamaged and rehabilitated specimens
Specimen Initial stiffness Ultimate deflection Energy dissipation capacity
(KNm)
Value (KN/mm) % increase Value (mm) % increase Value % increase
Control 2.32 – 12.7 – 2.37 –
�12.73
Rehabbed 3.43 47.84 12.38 �2.52 3.71 56.54
�14.97 17.6
194 A. Mukherjee, M. Joshi / Composite Structures 70 (2005) 185–199

-10 10-4
-3
-2
-1
0
1
2
3
4Lo
ad (
KN
)Lo
ad (
KN
)
Load
(K
N)
-20 -10 0 10 20
-20 -10 0 10 20-20 -10 0 10 20
-20 -10 0 10 20
-8
-6
-4
-2
0
2
4
6
8
Load
(K
N)
Load
(K
N)
Control ND G2L-ND
-4
-2
0
2
4
Displacement (mm) Displacement (mm)
Displacement (mm) Displacement (mm)
Displacement (mm)
C1L-ND C2L-ND
-8
-6
-4
-2
0
2
4
6
8
CP 1-ND
-6
-4
-2
0
2
4
6
0
(e)
(d)(c)
(a) (b)
Fig. 18. Load versus deflection for different non-ductile specimens.
A. Mukherjee, M. Joshi / Composite Structures 70 (2005) 185–199 195
yield loads than the specimens with one layer rein-forcements.
Due to FRP reinforcements the displacement at yield
increased to a much lesser extent than the load (Column
5, Table 8). Similar to the previous ductile specimens the
glass reinforced specimens had a much higher displace-
ment at yield than the carbon reinforced specimens.
The CP1-ND specimens do not follow that trend. The
authors believe that better bonding of CP1-ND speci-mens through grooves has delayed the onset of yield in
them.
The load–displacement envelopes for the ductile spec-
imens are plotted in Fig. 19. The envelopes let us com-
pare the relative performance of the specimens. All theFRP reinforced specimens had larger areas under the
envelopes than the control specimen. The G2L-ND
specimen had the largest envelope area followed by the
C2L-ND, CP1-ND and C1L-ND specimens. The graph
shows superiority of glass reinforcements over carbon
reinforcement in case of non-ductile specimen.
The rate of stiffness degradation is plotted in Fig. 20.
All the FRP reinforced specimens had a total loss ofstiffness at a higher displacement level than the control
specimen. This is a highly desirable phenomenon be-
cause the joint collapse can be deferred through FRP
reinforcement. The glass specimens have higher initial

Table 8
Test results for non-ductile specimens
Specimens Yield load Deflection at yield load
Value (N) % increase Value (mm) % increase
Control-ND 3.73 – 1.64 –
�3.6 �1.70
G2L-ND 7.6 103.75 1.829 15.24
�7.43 106.38 2.195 29.11
C1L-ND 4.2 12.60 1.34 �18.29
�4.14 10.99 �1.46 �14.11
C2L-ND 6.69 79.36 1.71 4.27
�6.67 85.28 �2.1 23.53
CP1-ND 6.28 68.36 2.92 78.05
�6.39 77.5 �4.02 136.47
-25 -20 -15 -10 -5 0 5 10 15 20 25-9-8-7-6-5-4-3-2-10123456789
CP 1
G2L
C2L
C1L
Control
Load
(K
N)
Dispalcement (mm)
Fig. 19. Load versus deflection envelope plots for non-ductile
specimens.
0 2 4 6 8 10 12 14 16 18 200.0
0.5
1.0
1.5
2.0
2.5
3.0
3.5
4.0
4.5
5.0
5.5
Control
G2L
CP1
C2L
C1L
Slo
pe (
KN
/mm
)
Displacement (mm)
Fig. 20. Stiffness versus deflection plots for non-ductile specimens.
196 A. Mukherjee, M. Joshi / Composite Structures 70 (2005) 185–199
stiffness and slower rate of degradation. The CP1 speci-
mens showed highest stiffness between displacement lev-
els of 3–6mm. The authors believe that this is due to the
rearrangement in the adhesively bonded groove. The ini-
tial stiffness and the ultimate displacements are summa-
rized in Table 9.
The overall performance of the joints can be summa-
rized by the energy dissipation of the structure. The
Table 9
Ultimate points in non-ductile specimens
Specimen Initial stiffness Ulti
Value (KN/mm) % increase Val
Control-ND 3.57 – 12
�13
G2L-ND 5.05 41.46 15
�16
C1L-ND 3.91 9.52 19
�20
C2L-ND 4.73 32.49 18
�18
CP1-ND 2.1 �41.17 14
�15
cumulative energy dissipation graphs for the specimens
are presented in Fig. 21. The energy dissipation of the
FRP reinforced specimens follows closely that of thecontrol specimen. The dissipation of energy is mainly
through the yielding if steel. In absence of adequate
development length considerable loss in energy dissipa-
tion capacity of control specimen is observed. FRPs
have increased the ultimate deformation of the structure
mate deflection Energy dissipation capacity
(KNm)
ue (mm) % increase Value % increase
.81 – 0.695 –
.11
.43 20.45 2.196 215.97
.04 22.35
.87 55.11 1.42 104.32
.30 55.07
.11 41.37 1.47 111.51
.72 42.79
.87 16.08 1.116 60.57
.01 14.49

0 2 4 6 8 10 12 14 16 18 20 22 240.0
0.1
0.2
0.3
0.4
0.5
0.6
0.7
0.8
0.9
1.0
1.1
1.2
1.3
1.4
1.5
1.6
G2 L
CP 1
C2L
C1L
Control
Ene
rgy
diss
ipat
ion
(KN
-m)
Displacement (mm)
Fig. 21. Energy dissipation versus displacement plots for non-ductile
specimens.
Fig. 22. Failure patterns for
A. Mukherjee, M. Joshi / Composite Structures 70 (2005) 185–199 197
to a large extent. Through higher deformation the
FRP reinforced structures have exhibited much higher
dissipation of energy. The reasons of higher ultimate
deformation in FRP reinforced specimens will be
discussed in conjunction with the failure mode. The
glass reinforced specimens exhibited higher energy dissi-pation than the carbon-reinforced specimens. The rela-
tive increase in energy dissipation capacity is more in
case of non-ductile specimen over the ductile specimen,
due to lower energy dissipation capacity of control
specimen.
The photographs of the failed specimens have been
presented in Fig. 22. In Fig. 22a the failed control spec-
imen is shown. It may be noted that the beam has failed
non-ductile specimens.

198 A. Mukherjee, M. Joshi / Composite Structures 70 (2005) 185–199
at the joint by pull out of steel reinforcement. Lack of
development length prevented the formation of plastic
hinge. The FRP reinforced specimens, on the other
hand, did not have the reinforcement pull out. The fail-
ure planes were approximately vertical (Fig. 22b–d). The
authors believe that the difference in the failure mode isdue to the presence of the FRP overlays and wraps.
They confined the concrete and did not allow it to spall.
FRP Overlays helped to hold the beam in its position.
As a result, the cracked concrete surfaces closed and
they could react against each other at subsequent cycles.
Therefore, the moment resistance of the beam was not
lost. This offered higher collapse loads and displace-
ment. To summarize, the main cause of superior per-formance of the FRP reinforced joints is the
continuous confinement provided by the FRP wraps
and overlays impeded the pull out of reinforcement
through the inadequately detailed specimens.
Fig. 22d shows the failure of CP1-ND specimens. The
failure pattern is similar to its counterpart ductile spec-
imen discussed previously. The figure shows that both
the CFRP plates and steel reinforcement have pulledout of the joint and there is no damage to the plate. A
thin layer of cement paste is on the surface of the pulled
out portion. This shows that the pullout was due to the
failure of the cement paste in the groove. As a result, the
ultimate failure of the joint was due to the pull out of
both the steel bars and the CFRP plate.
4. Conclusions
Both glass and carbon composite materials can be
efficiently used for seismic retrofitting as well as rehabil-
itation of reinforced concrete joints. Joints exhibit en-
hanced strength regardless of reinforcement detailing
and damage state. Considerable increase in yield load
can be achieved by use of these materials. Yield loadand initial stiffness depends on numbers of overlays pro-
vided in the joint area. Specimens strengthened using
CFRPs show stiffer behavior than GFRP strengthened
specimens. Energy dissipation capacity can be increased
with the use of small amount of composites. Test on
rehabbed specimen suggests that FRP not only restores
its original strength but there is considerable enhance-
ment in its yield load, initial stiffness and energy dissipa-tion capacity.
Acknowledgment
The authors would like to acknowledge the donation
of fiber and adhesive materials from Sika AG. The
financial support received from Board of Nuclear re-
search, India is thankfully acknowledged.
References
[1] Alcocer S, Jisra JO. Strengthening of reinforced concrete frame
connection rehabilitated by jacketing. ACI Struct J 1993;90(3):
249–61.
[2] Tsonos AG. Lateral load response of strengthened rein-
forced concrete beam to column joint. ACI Struct J 1999;96(1):
46–56.
[3] Beres A, EI-Borgi S, White RN, Gergely P. Experimental results
of repaired and retrofitted beam-column joint tests in lightly
reinforced concrete frame building. Technical report NCEER-92-
0025, State University New York at Buffalo, 1992.
[4] Ghobarah A, Aziz TS, Biddah A. Rehabilitation reinforced
concrete frame connections using corrugated steel jacketing. ACI
Struct J 1997;4(3):283–94.
[5] Pantelides CP, Gergely I, Reaveley LD, Nuismer RJ. Rehabili-
tation of cap beam-column joints with carbon fiber jackets. Proc
3rd Int Symp on non-metallic (FRP) reinforcement for concrete
structures, Sapparo Japan, vol. 1. Tokyo: Japan Concrete Insti-
tute; 1997. p. 587–95.
[6] Pantelides CP, Gergely J, Reaveley LD, Volnyy VA. Retrofit of
PC bridge pier with CFRP advance composites. J Struct Eng
ASCE 1999;125(10):1094–9.
[7] Li J, Bakoss SL, Samali B, Ye L. Reinforcement of concrete
beam-column connections with hybrid FRP sheet. Compos Struct
2000;47:805–12.
[8] Granata JP, Parvin A. An experimental study on Kevlar
strengthening of beam column connection. Compos Struct 2001;
53:163–71.
[9] Castellani A, Negro P, Colombo A, Grandi A, Ghisalberti G,
Castellani M. Carbon fiber reinforced polymers (CFRP) for
strengthening and repairing under seismic actions. Special Pub-
lication No. I.99.41, European Laboratory for Structural Assess-
ment, Joint Research Center, Ispra, Italy, 1999.
[10] Geng ZJ, Chajes MJ, Chou TW, Pan DYC. The retrofitting of
reinforced concrete column-to-beam connections. Compos Sci
Technol 1998;58:1297–305.
[11] Mosallam A. Seismic repair and upgrade of structural capacity of
reinforced concrete connections: Another opportunity for poly-
mer composites. In: Proc Int Composites Expo. Cincinnati: 1999.
p. 1–8.
[12] Gergely I, Pantelides CP, Nuismer RJ, Reaveley LD. Bridge pier
retrofit using fiber reinforced plastic composite. J Compos
Construct, ASCE 1998;2(4):165–74.
[13] Gergely J, Pantelides CP, Reaveley LD. Shear strengthening of
RCT-joints using CFRP composites. J Compos Construct, ASCE
2000;4(2):56–64.
[14] Ghobarah A, Said A. Shear strengthening of beam-column Joints.
Eng Struct 2001;24:881–8.
[15] Prota A, Nani A, Manfredi G, Cosenza E. Seismic upgrade of
beam-column joints with FRP reinforcement . Industria Italiana
del Cemento, November 2000. p. 1–17.
[16] Antonopoulos CP, Triantafillou TC. Experimental investigation
of FRP-strengthened RC beam-column joints. J Compos Con-
struct 2003;7(1):39–49.
[17] Mosallam SA. Strength and ductility of reinforced concrete
moment frame connections strengthened with quasi-isotropic
laminates. Composites: Part B 2000;31:481–97.
[18] El-Amoury T, Ghobarah A. Seismic rehabilitation of beam-
column joint using GFRP sheets. Eng Struct 2002;24:1397–407.

A. Mukherjee, M. Joshi / Composite Structures 70 (2005) 185–199 199
[19] D�Ayala D, Penford A, Valentini S. Use of FRP fabric for
strengthening of Reinforced concrete beam-column joints. In: 10th
Int. conference on structural faults and repair. London: July 2003.
[20] Antonopoulos CP, Triantafillou TC. Analysis of FRP-strength-
ened RC beam-column joints. J Compos Construct 2002;6(1):
41–50.
[21] Granata JP, Parvin A. Investigation on the effects of fiber
composites at concrete joints. Composites: Part B 2000;31:
499–509.
[22] Gergely J, Pantelides CP, Reaveley LD. Shear strengthening of
RCT-joints using CFRP composites. J Compos Construct ASCE
2000;4(2):56–64.
[23] Mukerjee A, Kalyani AR. Upgradation design of reinforced
concrete frames with fiber reinforced composites. J Compos
Construct ASCE, submitted for publication.