
From Immigration to Integration: Four Essays on Economic ...
162
From Immigration to Integration: Four Essays on Economic Aspects of the Transition Process Inauguraldissertation zur Erlangung des Doktorgrades der der Wirtschafts- und Sozialwissenschaftlichen Fakultät der Eberhard Karls Universität Tübingen Vorgelegt von Wido Geis aus Friedrichshafen 2011
Transcript of From Immigration to Integration: Four Essays on Economic ...

From Immigration to Integration:Four Essays on Economic Aspects of the
Transition Process
Inauguraldissertationzur Erlangung des Doktorgrades
der der Wirtschafts- und Sozialwissenschaftlichen Fakultätder Eberhard Karls Universität Tübingen
Vorgelegt von
Wido Geis
aus Friedrichshafen
2011

Dekan: Prof. Dr. rer. soc. Josef SchmidErstberichterstatter: Prof. Dr. rer. soc. oec. Wilhelm KohlerZweitberichterstatter: Prof. Dr. rer. pol. Herbert BrückerTag der mündlichen Prüfung: 2. Februar 2011
Contents
1 Introduction 1
1.1 Determinants of migration . . . . . . . . . . . . . . . . . . . . 4
1.2 Welfare effects of immigration and emigration . . . . . . . . . 8
1.3 Economics of integration . . . . . . . . . . . . . . . . . . . . . 12
2 How do Migrants Choose Their Destination Country? 16
2.1 Introduction . . . . . . . . . . . . . . . . . . . . . . . . . . . . 16
2.2 Our data set . . . . . . . . . . . . . . . . . . . . . . . . . . . . 19
2.3 Determinants of migration . . . . . . . . . . . . . . . . . . . . 23
2.4 Estimation strategy . . . . . . . . . . . . . . . . . . . . . . . . 30
2.5 Estimation results . . . . . . . . . . . . . . . . . . . . . . . . . 33
2.6 Conclusions . . . . . . . . . . . . . . . . . . . . . . . . . . . . 38
3 Does Educational Choice Erode the Immigration Surplus? 42
3.1 Introduction . . . . . . . . . . . . . . . . . . . . . . . . . . . . 42
3.2 Model setup . . . . . . . . . . . . . . . . . . . . . . . . . . . 47
3.3 Welfare effects of the educational adjustment . . . . . . . . . . 54
I

3.4 Welfare effects with a minimum wage . . . . . . . . . . . . . . 62
3.5 Policy implications . . . . . . . . . . . . . . . . . . . . . . . . 67
3.6 Conclusions . . . . . . . . . . . . . . . . . . . . . . . . . . . . 69
3.7 Appendix A: Proofs to lemmas 1 and 2 . . . . . . . . . . . . . 70
3.8 Appendix B: The immigration surplus in the inframarginal case 72
4 High Unemployment in Germany: Why do Foreigners SufferMost? 74
4.1 Introduction . . . . . . . . . . . . . . . . . . . . . . . . . . . . 74
4.2 Data and empirical approach . . . . . . . . . . . . . . . . . . 78
4.3 Decomposition of the native-immigrant unemployment gap . . 83
4.4 Educational degrees and experience . . . . . . . . . . . . . . . 86
4.5 Assimilation and language usage . . . . . . . . . . . . . . . . . 91
4.6 Discrimination and social networks . . . . . . . . . . . . . . . 96
4.7 Conclusions . . . . . . . . . . . . . . . . . . . . . . . . . . . . 101
4.8 Appendix: Cyclicality of skill-specific unemployment . . . . . 102
5 Why Applying Educational Requirements for Naturalization?104
5.1 Introduction . . . . . . . . . . . . . . . . . . . . . . . . . . . . 104
5.2 Naturalization and education . . . . . . . . . . . . . . . . . . 107
5.3 Optimal skill requirements for naturalization . . . . . . . . . . 114
5.4 Further benefits and costs from naturalization . . . . . . . . . 119
5.5 Naturalization policy with regard to children of non-naturalizedimmigrants . . . . . . . . . . . . . . . . . . . . . . . . . . . . 124
5.6 Conclusions . . . . . . . . . . . . . . . . . . . . . . . . . . . . 132
5.7 Appendix . . . . . . . . . . . . . . . . . . . . . . . . . . . . . 132
6 Conclusions 137
II

Bibliography 143
III

List of Tables
2.1 Individual Characteristics . . . . . . . . . . . . . . . . . . . . 21
2.2 Socio-economic and Institutional Variables . . . . . . . . . . . 24
2.3 Baseline estimates . . . . . . . . . . . . . . . . . . . . . . . . . 34
2.4 Estimates for individuals who have migrated after 1995 . . . . 39
2.5 Estimates for high skilled immigrants . . . . . . . . . . . . . . 40
4.1 Descriptive statistics . . . . . . . . . . . . . . . . . . . . . . . 80
4.2 Estimates for the unemployment gap between foreigners andnatives without controls . . . . . . . . . . . . . . . . . . . . . 84
4.3 Estimates for the unemployment gap between foreign born andnatives without controls . . . . . . . . . . . . . . . . . . . . . 85
4.4 Estimates with controls for education and experience . . . . . 89
4.5 Home country specific estimates with controls . . . . . . . . . 90
4.6 Estimates with controls for assimilation and language fluency . 93
4.7 Estimates with controls for discrimination and social networks 99
4.8 Estimates for the effect of labor market changes on skill-specificunemployment . . . . . . . . . . . . . . . . . . . . . . . . . . . 103
IV

5.1 Calibrated naturalization requirements . . . . . . . . . . . . . 123
V

List of Figures
4.1 Development of foreign unemployment in West Germany . . . 75
4.2 Foreign unemployment in the GSOEP . . . . . . . . . . . . . . 81
5.1 Effects of naturalization requirements on the skill structure ofimmigrants . . . . . . . . . . . . . . . . . . . . . . . . . . . . 110
5.2 Optimal naturalization requirements for different ability dis-tributions . . . . . . . . . . . . . . . . . . . . . . . . . . . . . 118
VI
1Introduction
The transition of a person from one nation to another is a long and complexprocess. It includes the move from one country to another as well as theintegration into a new society with a different value system. This process is ofextraordinary interest for economic research. At all stages, it has substantialeconomic consequences for the individual who passes through it and for otherpeople in the sending and immigration country, possibly even in the wholeworld. A large number of economic factors influences whether an individualenters this process and how the process proceeds.
An individual’s plans to migrate to another country can already havefar-reaching economic consequences. First, the individual invests time andmoney in collecting information on potential destination countries. Second,and more importantly, she adjusts her behavior and her economic decisionsin anticipation of a later migration; for instance, she learns the language ofthe immigration country or aspires a higher educational degree to be eligiblefor a certain immigration program. Economic research has shown that theoption to migrate has a substantial effect, not only on the welfare of thepotential emigrant, but also on the welfare of the whole population in theemigration country.
The transition from one nation to another is generally not finished withinone generation. Children and grandchildren of immigrants often still formseparated groups in the society of the immigration country. In most cases,not only the value systems of these groups, but also their qualification struc-
1
Chapter 1: Introduction 2
tures and economic outcomes largely differ from the native population. Inthe end of a successful transition, or integration respectively, the descendantsof immigrants are a non-distinguishable part of the society in the immigra-tion country and have the same economic prospects as others. This does notnecessarily mean that they have to abandon their cultural heritage. Theirheritage can also become a part of the cultural heritage of the immigrationcountry. Nevertheless, integration is not always successful. In some cases,descendants of immigrants still build separated population groups after cen-turies. The integration of immigrants into the society of the immigrationcountry has social and economic consequences. Better integrated peoplegenerally have better perspectives on the labor market and pay higher taxes.
In the (economic) literature on the transition of people from one coun-try to another, three areas can be distinguished: The first branch analyzesthe determinants of migration and tries to answer the questions why peo-ple migrate and how migration flows react to social, political and economicchanges. The second branch deals with effects of migration. The effects ofemigration and immigration on wage structures, unemployment patterns andnational budgets as well as welfare in different countries are in focus of thisliterature. The third branch is the integration literature. It analyzes theeconomic situation of people who have already migrated and examines theprocess of their integration into society and labor market of the immigrationcountry.
In my doctoral thesis, I analyze four specific aspects of the transition pro-cess of immigrants from one nation to another. The first is the determinantsof the location choice of a migrant. Potential migrants generally have thechoice between a large range of different immigration countries. From a theo-retical perspective, migrants should choose the country which offers them thebest living – the place where their expected utility is highest. To understand(and predict) migration flows, knowledge about the determinants of the ex-pected utility from living in different countries and the relative importanceof these determinants is necessary. Chapter 2, which is based on joint workwith Silke Übelmesser and Martin Werding, presents new empirical evidenceon the effects of various economic factors on the location choice of migrants.

Chapter 1: Introduction 3
The empirical analysis in chapter 2 is based on large microdata-sets from Ger-many, France, the UK and the US and uses a multinomial choice approach.We find that not only wages and unemployment rates, but also education andhealth system and labor market institutions, such as employment protectionand union coverage, are important determinants of the location choice.
The second aspect that is analyzed in my thesis are the effects of immi-gration on native welfare. There is already a large number of papers thatanalyze the welfare effects of immigration. However, the bulk of them as-sumes that immigration does not affect the economic decisions of natives,for instance with respect to education. In most cases, natives can build ex-pectations on future inflows and stocks of immigrants in the country. Asimmigration affects the labor market, information on future immigration canbe highly relevant for the educational decisions of natives. In chapter 3,I show that allowing for the native educational structure to adjust to im-migration changes the effect of immigration on native welfare. Under theassumption of a perfect labor market, the welfare effect from immigration isreduced substantially. Much depends on the formation of expectations. Theexpectations that natives have on (future) immigration when they decideabout their education need not necessarily be correct. I find that the higherthe expected immigration relative to the realized immigration, the lower isnative welfare. Thus, not only immigration per se, but also expectationsabout it are relevant for native welfare.
Differences in the economic situation of immigrants and natives are thethird aspect of the transition process that I analyze. In European countries,and in particular in Germany, immigrants have a higher probability to beunemployed than natives. In addition, immigrant unemployment in Ger-many reacts more to changes in the labor market situation, such as cyclicalfluctuations, than does native unemployment. In chapter 4, I decompose thedifference between immigrant and native unemployment into a baseline com-ponent, which denotes the (hypothetical) difference for a certain situation inthe labor market, and a situation component, which captures the strongerreaction of immigrant unemployment to changes in the labor market. Thesituation component can fully be explained by differences in human capital

Chapter 1: Introduction 4
endowment between immigrants and natives. As to the baseline component,discrimination of immigrants and/or a lack of social networks relevant forlabor markets also play a role. Nevertheless, lower educational degrees andlacking language skills explain more than 7/8 of the baseline component.
The fourth aspect of the transition process that is analyzed in this thesisis naturalization policy. Naturalization requirements, such as language tests,are a mechanism to select “new citizens”. In addition, as naturalization isgenerally attractive for immigrants, these requirements also provide an in-centive for immigrants to enhance their investments in education. Throughhigher taxes and lower welfare benefits, a higher educational level of im-migrants also increases welfare of natives. In chapter 5, I discuss how animmigration country should set these requirements to maximize native wel-fare. The optimal level of requirements depends on the ex-ante distributionof qualifications within the immigrant population and further aspects of nat-uralization that affect native welfare, such as the right to vote. I find that, forplausible parameter set-ups, the requirements that maximize native welfareare neither such high that no immigrant can reach them nor such low thatall immigrants meet them.
To complete the picture, I give a short overview of the existing literatureon the transition process of immigrants in the introductory chapter. More-over, I discuss the relationship between the four analyzed aspects and thesteps of the transition process in general in a concluding chapter.
1.1 Determinants of migration
Migrants have very different reasons for leaving their home country and mov-ing to another country. First of all, one should distinguish between peoplewho migrate voluntarily and people who migrate involuntarily. Displacement,wars, political persecution and famines may force people into (involuntary)migration. In most cases, people cannot anticipate such events, but have toflee at a moment’s notice. Thus, they cannot properly prepare their migra-tion. They do not have the time to plan the financing of the move and to col-lect information on potential destination countries. Therefore, most refugees

Chapter 1: Introduction 5
go to the nearest neighboring country. In these neighboring countries, theireconomic situation is often much worse than in their home countries. Thus,most of these migrants only stay abroad until the situation in their homecountry allows for their return.
Some refugees, especially victims of political persecution, also come toEurope or the US and ask for asylum there. As migration over a long dis-tance leads to substantial costs, fugitives in great need generally do nothave this option. Unlike in neighboring countries, the economic situationof refugees in Europe and the US is often better than their situation in thehome countries. Thus, they have little incentive to migrate back. Cortes(2004) states that refugee migrants in the US have even longer time hori-zons in the country than other migrants. Immigration policy with respect torefugees or asylum seekers is generally far less restrictive than with respectto other immigrants. Hence, migrants have a strong incentive to apply forasylum, also in cases where their refugee status might be questionable. Thismakes it difficult to properly distinguish refugees from voluntary migrationin empirical investigations. The existing literature on the migration patternsof refugees or asylum seekers is scarce. In econometric analyses, Hattonand Williamson (2006) and Hatton (2009) find that immigration policy withregard to refugees as well as violence in the home country are importantdeterminants of refugee migration.
Voluntary migration is a wholly different phenomenon. Patterns and de-terminants of voluntary migration have gained much interest by economicresearch. Beginning with the seminal papers by Sjaastad (1962), Todaro(1969) and Harris and Todaro (1970), an extensive theoretical research hasfocused on migration incentives. Wage differentials between home and im-migration country and differences in unemployment rates or employmentprobabilities have been identified as important determinants. Nevertheless,comparing the wages that immigrants earn in their home countries and inimmigration countries is not trivial. The position of a person in the incomedistribution of the immigration country can strongly differ from her positionin the home country, see Borjas (1987). High skilled immigrants often donot find jobs in their former occupations, but have to accept jobs in occupa-

Chapter 1: Introduction 6
tions far below their qualifications. A further complication is that potentialimmigrants in most cases may not be able to anticipate their wages in theimmigration country, see McKenzie et al. (2007). It is then their expectationsand not the actual wage in the immigration country which is decisive for themigration decision.
Wage differentials are not the only factor that influences the migrationdecision. In many cases, immigration legislation in potential immigrationcountries is even more important. It determines whether a migrant has theoption to legally enter a certain country. Furthermore, if this is the case, thelegislation influences the migration costs. This happens primarily throughcharges for application and necessary documents. If migrants cannot enterlegally, they still may have the option to immigrate illegally. However, illegalimmigrants have large disadvantages compared to legal immigrants. Theyoften have to hide from public authorities. They may have to accept lowwages, as employing them is also illegal. And they cannot participate in thesocial system of the country. Perhaps most importantly, they have no healthinsurance. Nevertheless, the economic situation of illegal immigrants in Eu-rope and the US is often still much better than their situation in the homecountries. Thus, many people who do not have the option to migrate legallydo migrate illegally. Due to obvious data restrictions, it is very difficult to as-sess the numbers of illegal migrants or even analyze their migration patterns.Hanson (2006) discusses some approaches to measure illegal immigration tothe US.
A further determinant is the distance between the home and the immi-gration country. Distance includes the geographical, but also the culturaldistance between the countries. Cultural distance relates to the similarityof religions, moral concepts, customs, conventions and languages, see Geiset al. (2010). The existence of people from the same clan, town, region orhome country also influences the migration decision and destination choice ofmigrants. These migrant networks form a community where a new migranteasily finds social contacts after arrival. In these networks, the cultural val-ues from the home country are generally preserved, hence cultural distancecarries less weight. In addition, migrant networks deliver information on des-

Chapter 1: Introduction 7
tination countries to potential migrants, so that migrants can better organizetheir migration. Furthermore, if family members are part of the network, mi-grants are possibly eligible for family reunification programs. In many cases,family reunification is the only legal way to migrate to a country. In othercases, it simplifies the admission. Munshi (2003) and Pedersen et al. (2008)provide in depth discussions of the economic relevance of migrant networks.
The living conditions in potential destination countries normally also havea strong effect on the migration decision. These conditions are to a greatextent determined by the environment and the climate in the immigrationcountries. Most people prefer regions with many sunshine hours and a lovelylandscape, see Graves (1980) for a discussion. The institutional setting in thecountry also affects the living conditions. In chapter 2, we analyze the effectsof different institutions, especially labor market institutions, on migrationdecisions. An important finding is that employment protection has a strongpositive effect on migration. Good health care and education systems as wellas generous family aid also have a positive effect. Actually, the expectedincome in the immigration country as well as migrant networks are also partof the living conditions. Nevertheless, the concept of living conditions is notsufficient to explain the migration decisions, as it does not consider migrationcosts.
Factors that influence migration decisions and migration patterns are aninteresting field of research on their own. In addition, knowledge about thesefactors can be helpful for evaluating immigration policy reforms. How manyand what type of migrants will come after the reform is always a crucialquestion in such evaluations. Up to now, most policy evaluations base theirpredictions of potential immigration flows on historical experiences. A typi-cal example for this are estimations of the migration potential after the EUEastern enlargement in 2004. Most of these estimations are based on themigration flows from Southern European countries to the other EU countriesafter the permission of freedom of movement. The estimated potentials inthese studies vary strongly. For the same time period and the same destina-tion countries, they differ up to the factor 10, see Fertig and Schmidt (2001)

Chapter 1: Introduction 8
and Flaig (2001).1
1.2 Welfare effects of immigration and emigra-tion
Considering the aggregate welfare of all people in the world, basic economictheory implies that migration leads to a welfare gain. Assuming perfect infor-mation, people who migrate definitely gain from migration. Otherwise, theywould not migrate. The effects on other people in emigration and immigra-tion countries are less clear. However, if they lose more than the migrantsgain, they would be willing to pay the would-be migrants for not migrating.These payments would be pareto-efficient, as the non-migrants would haveto pay the migrants less for non-migrating than they would gain from theirnon-migration. In the real world, however, such payments are not feasible.First, non-migrants do not know who the potential migrants are. Second,migrants cannot credibly commit themselves not to migrate. Thus, it is pos-sible that migration leads to a loss in aggregate welfare. Normally, policymakers as well as the public in immigration and emigration countries arenot interested in the effects of migration on the overall welfare in the worldbut in the effect on the welfare of the (native) population in their respectivecountries. Thus, economic research focuses either on the effect of immigra-tion on native welfare or the welfare effect of emigration. In the following,I discuss welfare effects of migration on people who migrate, on people whostay in the emigration country and on natives in the immigration country.
As stated above, the decision of migrants to live in another country shouldgenerally imply that migration increases their welfare. However, there is apossible combination of conditions for which migrants go and stay abroad,although they suffer a welfare loss from this. Migrants generally cannot basetheir migration decision on real knowledge about the conditions in the im-migration country, but have to form expectations about it, see McKenzie
1Zaiceva (2006) gives an overview over the studies.

Chapter 1: Introduction 9
et al. (2007). If these expectations are overly positive, it may happen thatpeople migrate to a country where their welfare is lower than in their homecountry in the long run. Generally, after recognizing this, migrants considercorrecting their “wrong” migration decision and migrate back. But if migra-tion is costly, return migration need not be financially feasible or profitableany more. In this case, migrants are “trapped” in the immigration country.Nowadays, transportation costs are relatively low, so that this can hardly oc-cur any more. Thus, the welfare effect of migration on the migrants shouldbe unambiguously positive. Nevertheless, the economic migration literaturehas not yet quantitatively analyzed the effect of migration on the welfare ofthe migrants.
The effect of migration on the welfare of people who stay in the emi-gration country is less clear. It surely depends on the population group thatemigrates. The typical emigration countries are less developed countries witha large share of low skilled people and only few highly qualified workers. Em-igration of low skilled people is generally regarded as unproblematic. Dueto the reduction in population, an outflow of immigrants normally reducesoverall GDP in the emigration country. However, GDP per capita need notdecrease. In most less developed countries, unemployment among low skilledpeople is extremely high, so that emigration of some low skilled people neednot even lead to a reduction in production and overall welfare. In contrastto low skilled emigration, high skilled emigration is generally regarded asan economic blow to the country. In low developed countries, high skilledworkers are often the limiting factor in production. Hence, their emigrationcan lead to strong reductions in GDP and GDP per capita. In addition,economic growth may also depend on the availability of high skilled work-ers, hence high skilled emigration can negatively affect the development of acountry in the long run. Bhagwati and Hamada (1974) have coined the term“brain drain” for the emigration of high skilled people from less developedcountries.
Nevertheless, there are conditions under which the emigration of highskilled workers from less developed countries can be welfare enhancing. Asubstantial theoretical literature has emerged that analyzes these conditions.

Chapter 1: Introduction 10
The main argument of this literature is the following: Wages abroad arehigher than in the emigration country and being high skilled is a precon-dition for emigration. Thus, the option to emigrate generates an incentivefor people to invest in their education and become high skilled. Under cer-tain conditions, this option can generate more additional high skilled workersthan will ultimately emigrate. In this case, the number of high skilled work-ers in the emigration country increases due to the option to emigrate. Thiscan lead to an increase in the welfare per capita, see Vidal (1998) for a dis-cussion. Following Stark et al. (1997) this phenomenon is sometimes called“brain gain”. Beine et al. (2008) analyze the empirical relevance of this phe-nomenon. They find that in some emerging countries a “brain gain” mayexist. However, in the least developed countries the negative effect of the“brain drain” is clearly pervasive.
Determining the welfare effects of emigration from developed countriesis more complex. The effect of emigration on economic success and growth,in general, depends on the occupational fields of the emigrants and not onlyon the fact of being high or low skilled. For instance, the economic impactof attorneys and engineers is completely different. Thus, the welfare effectof emigration depends not only on the educational level, but also on theoccupational fields of the emigrants. In the last resort, only empirical researchcan tell us about the characteristics of emigrants that determine the welfaregains or losses caused by their emigration. Due to data limitations, empiricalanalyses of the welfare effects of emigration are still relatively rare.
The effect of immigration on native welfare has been an important topicin economic research for years. In a seminal paper, Berry and Soligo (1969)have shown that immigration into a perfect labor market leads to a gainfor the native population, provided that the characteristics of immigrants donot exactly match the ones of natives. However, labor market frictions thatlead to unemployment (such as minimum wages, efficiency wages or searchcosts) can fundamentally change these results, see e.g. Brecher and Choudhri(1987). In particular, immigration of low skilled people can then lead to awelfare loss. If migration leads to changes in the international division oflabor and in trade, this also affects the welfare effects of immigration, see

Chapter 1: Introduction 11
Felbermayr and Kohler (2007). These changes may result from the changesin labor endowment in immigration and emigration countries.
Apart from adjustments in trade and the international division of labor,immigration can lead to further adjustment processes. Immigration affectsthe educational structure of natives, as long as natives are able to anticipatefuture immigration. The effects of emigration on the educational decisionsof people in the emigration country and the educational structure there hasgained much interest in economic research. In contrast, the effects on theeducational structure in the immigration country has hardly been investi-gated up to now. In chapter 3, I develop a theoretical model in order toanalyze the effect of immigration on the educational structure of natives andto determine how this adjustment affects the effects of immigration on nativewelfare. In this model, the welfare effect of immigration into a perfect labormarket is still positive. However, the adjustment of the native educationalstructure substantially lowers it. The adjustment of the native educationalstructure actually depends on the expectations of natives about future im-migration, and not on the realized immigration. As shown in chapter 3, ifexpected immigration exceeds realized immigration, this leads to a welfareloss. Therefore, when analyzing the welfare effects of immigration, one hasto consider expectation formation by the native population.
There may be further adjustment processes to an inflow of immigrants.Natives possibly do not move to, or even move away from cities with highshares of immigrants, see Peri (2007). Immigration can also affect the con-sumption patterns of natives, as natives get acquainted with typical productsfrom the home countries of immigrants. An assessment of the importance ofthese adjustment processes is first and foremost an empirical question. Nev-ertheless, profound theoretical knowledge of these processes is necessary tocorrectly design empirical investigations. Educational adjustment is a goodexample for this. If educational adjustment is left unconsidered, the decreaseor smaller increase in the number of high skilled natives is ascribed to exter-nal factors and the long run increase in the number of high skilled workersdue to high skilled immigration is overestimated. In most cases, this leadsto an overestimation of the welfare gains from high skilled immigration.
Chapter 1: Introduction 12
There are myriads of empirical papers on the welfare effects of immigra-tion. Most of them focus on the question how immigration affects wages andemployment probabilities of native workers, see Longhi et al. (2005a) andLonghi et al. (2006). Papers on the effect of immigration on other groupsof natives, such as capital owners and pensioners, are scarce. Unfortunately,these papers, and especially the newer and more elaborate ones, do not findmutually consistent results. One can basically distinguish between two re-sults or views, each of which is found in numerous studies using manifold es-timation approaches and propagated by an outstanding migration researcher.The view of David Card is that immigration has either a small positive effecton the wages of native workers or no effect at all. George Borjas argues thatimmigration has a substantial negative effect on the wages of native workers.The two sides vehemently criticize the works of each other, see e.g. Card(2009) and Borjas et al. (2008). Nevertheless, there is no apparent differencein the quality of the papers of the two sides. The issue seems impossible toresolve through conventional empirical research alone.
1.3 Economics of integration
In advanced economies, the economic situation of immigrants is often muchworse than the situation of natives. As shown in Geis et al. (2010), in thethree large European economies France, Germany and the UK, immigrantunemployment was about twice as high as native unemployment in 2005.In the US, the difference in the unemployment rates is smaller, but thereare substantial differences in the wage level between immigrants and natives.These differences can to some extent be explained by differences in the qual-ification structure. On average, immigrants have much lower formal degreesthan natives. In addition, many immigrants have problems with the lan-guage of the immigration country, so that they cannot optimally use theirskills. The full use of qualifications that immigrants have acquired in thehome country can be connected with further problems. For instance, theformal recognition of foreign degrees is often a long process.
Nevertheless, differences in qualifications in the broadest sense are not

Chapter 1: Introduction 13
the only possible explanation for the worse labor market situation of immi-grants. It can also result from discrimination. On the one hand, this canbe classical discrimination: employers are not willing to employ immigrants,employees are not willing to work together with immigrants, and consumersare not willing to buy goods from immigrants (see Becker, 1971). On theother hand, in hiring decisions natives may also be preferred to immigrants,because employers cannot assess the (foreign) certificates of immigrants. Em-ployers may simply decide against immigrant applicants because of the lowaverage educational level of immigrants (statistical discrimination). Thereare numerous empirical papers that analyze in how far the worse labor mar-ket situation of immigrants can be explained by differences in labor marketrelevant characteristics, and in how far it must be ascribed to discrimination.Most of them focus on wages and find that discrimination plays a role (seeNielsen et al., 2004).
In chapter 4, I analyze the differences in the unemployment rates betweenimmigrants and natives in Germany. I find that human capital measures,such as formal qualifications and language skills, cannot fully explain thedifference between immigrant and native unemployment. However, control-ling for social networks, this difference vanishes. Immigrant unemploymentis not only higher than native unemployment, but also reacts more to cyclicalfluctuations (see Dustmann et al., 2010). I find that this stronger sensitivityof immigrant unemployment can be fully explained by lower qualificationsof immigrants. A further interesting result of chapter 4 is that the labormarket performance differs over immigration groups. This is in line with theliterature. Large immigrant groups from relatively less developed countries,as people from Turkey in Germany, people from the Maghrebian countriesin France and people from Mexico in the US, generally have huge problemson the labor market. Immigrants from highly developed countries, in turn,often outperform natives. Thus, one should differentiate between immigrantgroups when analyzing differences between immigrants and natives.
The integration of immigrants into the labor market and the society ofan immigration country is not finished shortly after their arrival but a long-lasting process. During this integration process, immigrants improve their

Chapter 1: Introduction 14
fluency in the language of the immigration country, unless it is their nativelanguage. They collect knowledge on legal rules, conventions and customs.Furthermore, they socialize with natives and build a social network. Theaccumulation of human capital specific to the immigration country generallyimproves the situation of immigrants on the labor market. This improvement,in turn, also affects natives’ welfare. Immigrants with more human capitalpay higher taxes.
Beginning with the seminal work of Chiswick (1978), a branch of theempirical migration literature analyzes the process of the integration of im-migrants into the labor market. These papers generally find that with thetime spent in the immigration country the wages of immigrants increase andtheir employment probabilities decrease. A remarkable exception is Schmidt(1997), who does not find such a deterministic time trend for immigrantsin Germany. My own results in chapter 4 confirm his finding. An interest-ing extension of the empirical integration research is the family investmenthypothesis presented by Baker and Benjamin (1997). They find that, inthe first years after the immigration of couples, the wife is the main incomeearner. During this time the husband accumulates immigration country spe-cific human capital. Afterwards, the husband again assumes the role of themain income earner. Nevertheless, Blau et al. (2003) convincingly refute thisfinding.
Policy makers can influence the integration of immigrants into labor mar-ket and society of an immigration country. For instance, integration policymeasures can help immigrants to improve their language skills more rapidly.Integration policy can follow two different approaches. First, it can reducethe costs of integration for immigrants by offering them specific integrationmeasures, e.g. language courses. Second, it can increase their gains fromintegration by setting specific incentives. In chapter 5, I discuss how natu-ralization legislation can be used to improve the skill structure of immigrantsand thus also their integration. Most developed countries require the certi-fication of skills, primarily language tests, for naturalization. Immigrantswho do not fulfill these requirements anyway have an incentive to increasetheir skill level, if naturalization improves their situation (right to vote, pass-

Chapter 1: Introduction 15
port, etc.). In turn, the skill structure of immigrants affects native welfare:Higher skilled immigrants earn higher wages, pay more taxes and are lesslikely to receive social assistance. In chapter 5, I develop a model that allowsto determine an optimal requirement level for naturalization, i.e. a level thatmaximizes native welfare. This level induces some educational effort on thepart of the immigrants that would otherwise not have occurred.
Naturalization requirements are not the only policy measure with whichan immigration country can affect the skill structure of its immigrants. Im-migration countries could, for instance, also offer rewards for immigrantswho learn the language rapidly. Potential policy measures to improve theskill level of immigrants have not yet been in the focus of social science andeconomic research. Thus, we do not yet have a clear view of the (integra-tion) policy measures that suitably affect the skill structure of immigrants.Political leaders in countries with large, low skilled immigrant populations,as France, Germany and the UK, often (rightly) complain of problems withthe integration of immigrants. Thus, research on integration policy measuresis not only of academic but also of high political relevance. Due to the de-mographical change, Western countries will probably be forced to allow forsubstantial inflows of new immigrants in the future. Thus, a rapid integrationof immigrants will become ever more important in the future.
2How do Migrants Choose Their Destination
Country?
2.1 Introduction
Why do people migrate to other countries, and how do they choose their desti-nation country? From an economic perspective, the answer to these questionsis simple. People migrate because their expected utility from living abroad(corrected for the disutility from moving) is higher than the expected util-ity from living in their home country. They choose the destination countrywhere their expected utility is highest. If the determinants of expected utili-ties from living in different countries were known, migration policies could betailored to the needs of each country that wants to attract (specific groupsof) migrants. However, expected utilities cannot be measured and, in spiteof many years of intensive research, knowledge about their determinants isfar from complete.
Our aim in this paper is to shed more light on factors that may affect
This chapter is based on joint work with Silke Überlmesser andMartin Werding. The idea for the paper was developed in a jointdiscussion process. Data preparation and estimations were exclu-sively done by me. The final text was written in a process of pro-posals and revisions by all three authors.
16
Chapter 2: Choice of the Destination Country 17
the migration decision and in particular the choice between different desti-nation countries. Our analysis is based on a multinomial-choice frameworkwhere this choice is explained by various socio-economic and institutionalcharacteristics of potential immigration countries. We effectively focus onthe most important groups of potential explanations which can be meaning-fully captured in our empirical framework: expected net income in differentdestination countries, social networks, labor-market institutions and publiclyprovided goods, such as health and education systems.
Over the last few years, a series of papers has emerged that analyzethe determinants of migrants’ location choices (e.g., Pedersen et al., 2008;Mayda, 2007; Docquier and Marfouk, 2008). All these papers are based oninternational macro-data panels.1 They find that, besides unemploymentrates and GDP per capita (taken to measure expected income), distanceplays an important role for migration decisions. In addition, a common lan-guage and colonial ties appear to have a positive effect on the choice of aparticular destination country. In this literature, institutional features ofdestination countries are captured in a rough fashion only, e.g., by broadtypes of “welfare-state regimes” (see Pedersen et al., 2008; Mayda, 2007),and labor-market institutions are entirely neglected. Also, the use of aggre-gate data carries a number of problems, as the determinants of migrationcan mostly be measured only in terms of averages over the total populationor all immigrants, while possibilities to differentiate between different groupsof migrants are generally limited.2 If the determinants or their relative im-portance differ across groups, macro-level analyses need not lead to clear-cutresults. Therefore, we want to follow another route and base our analysis onmicro-data.
Unfortunately, there is no large international micro-data base which couldbe used for our purposes.3 We therefore construct our own data set, merging
1See Lundborg (1991) for an earlier study based on cross-section data.2Docquier and Marfouk (2008) differentiate between high-skilled and low-skilled mi-
grants, whereas the other researchers look at total migration between two countries.3The European Labour Force Survey would be such a data base but, in its publicly

Chapter 2: Choice of the Destination Country 18
micro-data from four of the most important immigration countries, namelyFrance, Germany, the UK and the US.4 We combine these micro-data withdata representing a number of institutions that potentially affect locationdecisions. Given the nature of our data, we are effectively estimating theeffects of these institutions on migrants’ decisions for a certain destinationcountry conditional on two points: First, that they are willing to migrateat all; and second, that they end up living in one of these four destinationcountries.5
From a technical point of view, Constant and D’Agosto (2008) is the pa-per which is probably closest to ours. Based on a data set covering Italianscientists living abroad, they analyze the determinants of their choice of adestination country. In contrast to our approach, however, they only use indi-vidual characteristics as explanatory variables and no general features of thedestination countries. There is a number of papers using similar approachesto determine the regional distribution of immigrants within their destinationcountries (e.g., Aslund, 2005; Bartel, 1989; Jaeger, 2000; Bauer et al., 2005,2007). Since political and economic institutions do not vary much acrossregions of one country, while they may differ substantially across countries,this literature is of limited relevance for us.
To date, the impact of institutions on migration decisions has hardly beenstudied in a systematic way.6 Thus, our results offer interesting and poten-tially important new insights regarding the determinants of migration. Ourmore conventional findings are that wages and migrant networks have a pos-
accessible form, it contains no information on the origin of migrants.4Defoort (2006) states that, together with Canada and Australia, these countries attract
77% of all migrants to the OECD world.5For an analysis of the unconditional migration decision, one would also have to observe
populations and institutions in the source countries, and one should probably be able toadd more destination countries.
6Borjas (1999b) investigated the role of welfare benefits for migration within the US,which led to his “welfare-magnet” hypothesis. More recently, Docquier and Marfouk (2008)found a positive effect of social expenditure and health expenditure on international migra-tion. We are not aware of any studies investigating labor-market institutions as potentialdeterminants of migrants’ location choices.

Chapter 2: Choice of the Destination Country 19
itive effect on the probability to migrate to a particular country, while theunemployment rate has a negative effect. The income tax wedge negativelyaffects migration, and the same applies to generous pension benefits, whilegood education systems and good health-care systems appear to have pos-itive effects. In addition, we find that among the labor-market institutionswe are considering, union coverage and unemployment benefits have nega-tive effects on the migration decision, while employment protection appearsto have mixed effects. In any case, the impact of labor-market institutionsbecomes less negative, or even positive when considering migrants’ decisionsto stay in their destination country compared to their decision to migrate.This points to “insider-outsider problems” related to these institutions. Allthese results are derived from a multitude of estimates with differing speci-fications, and they are rather robust against a number of changes related tothe basic specifications.
The paper is organized as follows. In the next section, we explain howour data set is constructed. Section 2.3 discusses potential determinantsof migration decisions and, in particular, the role of institutions for thesedecisions. In section 2.4, we set out our estimation strategy. Estimationresults derived from our full sample and some sub-samples are presented insection 2.5. Section 2.6 concludes.
2.2 Our data set
To construct our data set, we proceed in two steps. First, we merge micro-data from four immigration countries, namely France, Germany, the UK andthe US. Second, we complement these micro-data with information regard-ing economic and institutional features of the immigration countries whichpotentially have an impact on migrants’ location choices.
Our micro-data are combined from large official surveys of the British,French, German and US population. The source of our French data is theEnquête Emploi en Continu 2005, a representative survey of about 0.5% ofthe French population. The data for Germany are taken from the Mikrozen-sus 2005, a representative 1% survey of the German population (0.7% in the

Chapter 2: Choice of the Destination Country 20
Scientific Use File we are using). The British data are from the Labour ForceSurvey for the first quarter of 2005, a survey of about 0.2% of the popula-tion in the UK. For the US, we use the American Community Survey 2005,a representative 1% survey of the US population. In order to analyze themotives of individuals to migrate, flow data would actually be preferable tostock data. However, existing flow data generally contain much less infor-mation and are less precise than stock data. Therefore, we rely on data ofthe latter type, implying that we actually analyze decisions to migrate toanother country and stay there until the sampling period.
An important preliminary step is to find a proper definition of migrants.Immigrants could be defined as persons holding one or more foreign nation-alities. Yet, this approach is problematic as naturalization policies of thefour countries differ substantially. For instance, German policies are muchmore restrictive in this respect than American ones. Looking at individualswith foreign nationalities could thus lead to biased results. Defining immi-grants by their country of birth circumvents this problems. However, sinceforeign-born individuals whose parents are both natives are then classified asimmigrants, this definition can also lead to problems (e.g., if a considerableshare of the foreign-born population are children of armed forces positionedabroad). Therefore, we define immigrants as foreign-born individuals, butre-classify persons with two native parents as natives.7 The effect of thisre-classification on the overall number of immigrants is small, but their com-position changes notably (see Geis et al., 2010, for more details).
In the case of Germany, we have to deal with two specific issues. First,in the German data the country of birth of immigrants is not recorded. Wetherefore use the nationality, respectively the nationality before naturaliza-tion, as a proxy for the country of birth. The second issue is related to the“(Spät-)Aussiedler ” legislation. According to this legislation, persons withGerman ancestors (who sometimes emigrated centuries ago, mainly to coun-tries in Eastern Europe) can acquire the German nationality immediatelyupon arrival in Germany. After the fall of the “Iron Curtain”, a large num-
7For the UK, respectively, we re-classify persons who state to be “ethnically British”.

Chapter 2: Choice of the Destination Country 21
Table 2.1: Individual Characteristics
Variable Statistic France Germany UK US TotalAge mean 38.6 42.0 37.1 39.9 40.0
(variance) (10.6) (13.2) (10.5) (12.1) (12.2)Level of education median 2 3+4 3+4 3+4 3+4
ISCED-LevelSex share of males 45.6 52.0 47.6 50.8 49.8Born in the EU share (%) 17.2 19.3 19.1 3.8 6.7in Eastern Europe share(%) 5.9 31.2 4.9 5.3 8.8in Western Asia share (%) 10.1 13.9 4.5 3.7 5.3in Eastern Asia share (%) 8.2 7.5 40.9 30.5 26.7in Africa share (%) 54.5 3.1 23.6 4.2 6.6in Latin America share (%) 3.9 1.8 5.9 52.4 42.6Number of observations (in millions) 1.3 4.3 1.8 16.6 23.9Unweighted number of observations 6,890 21,073 3,240 127,186 158,389Note: Here, only immigrants who arrived 1985 or later are considered.
ber of “Spät-Aussiedler ” came to Germany (Koller, 1997). Yet, in spite oftheir quantitative importance, official statistics in Germany hardly collectany data on this group. In our data set, we are able to identify them asimmigrants,8 but we cannot assign them a country of birth.
In our econometric analysis, we include individual information regardingsex, age, the educational level and the source country. Table 2.1 summarizessome descriptive statistics regarding the sample derived from the four datasets that is used in our regressions.9
For the home countries of immigrants, we apply the following classifica-tion: EU countries, non-EU Europe (including Russia and Turkey), WestAsia (from Lebanon to Iran), East Asia and Oceania, Africa, Latin America,
8Alternative explanations for why Germans with German parents should have “mi-grated” to Germany are highly unlikely. For instance, since World War II Germany hadhardly any armed forces positioned abroad. Also, all persons with German nationalitywho came to Germany before 1949, mostly as refugees from former parts of the country,are automatically defined as natives.
9An in-depth analysis of the characteristics of immigrants in France, Germany, the UKand the US based on the same data set can be found in Geis et al. (2010).

Chapter 2: Choice of the Destination Country 22
Canada10 and “unclassified.”11 Unfortunately, a more detailed differentiationis not possible, due to existing classifications in the German and French datasources. Moreover, immigrants from one of our four destination countriesare excluded from the econometric analysis. The reason is that the choicebetween staying at home and migrating to another country is obviously dif-ferent from choosing a certain destination country given that one has decidedto migrate.
While information about age and sex is well-standardized across all fourdata sets, standardization is not trivial for the level of education. Here,we classify educational attainments of our observations based on the Inter-national Standard Classification of Education (ISCED) of 1997. For theGerman data, we use the algorithm proposed by Schroedter and Lüttinger(2006) and for the American data the mapping between years of schoolingand ISCED levels given in Institute for Education Sciences (2007). TheFrench data already contain education levels in the ISCED classification.For the British data, our re-classification follows the LFS User Guide (seeOffice for National Statistics, 2007), with two deviations.12 Also, we do notuse all ISCED levels, but form four categories: no secondary educational at-tainment (ISCED 0-1), lower-secondary educational attainments (ISCED 2),upper-secondary and post-secondary, non-tertiary educational attainments(ISCED 3-4) and tertiary educational attainments (ISCED 5-6). Differen-tiations between ISCED 3 and 4 or between ISCED 5 and 6 are hardlycomparable across countries.
10In the case of Germany, Canadians are excluded, as we cannot distinguish them fromUS Americans.
11By far the largest part of them being German “Spät-Aussiedler ”.12First, we classify people who state to have been in school, but have not acquired any
formal degree as ISCED 1, not ISCED 2. Second, we do not classify people who state tohave “other qualifications” as ISCED 3, but assign them the median ISCED level of peoplewith the same age and the same (last) occupation. For this, we use the SOC (StandardOccupational Classification) 2000 unit-level classification which distinguishes between 353different occupations (see Office for National Statistics, 2000). An assignment of educa-tional levels is necessary, as most foreign degrees are recorded as “other qualification” inthe British LFS.

Chapter 2: Choice of the Destination Country 23
We restrict our analysis to people who have migrated after 1985, sincethe economic and institutional variables we are interested in are not (com-pletely) available for earlier years. Furthermore, we do not consider migrantsaged younger than 25 at the time of the survey in our econometric analysis.For younger individuals, we cannot properly determine their formal qualifica-tions, as many of them have not reached their final educational attainments.Given all these corrections, our data base should be representative for thosegroups of migrants we are effectively looking at (using the relevant weightsfrom the original data sources).
In terms of economic and institutional determinants of migration deci-sions, we consider the following aspects to be important: wages, unemploy-ment rates, and taxes (i.e., expected net wages), immigrant networks, labour-market institutions (specifically, employment protection, union coverage, andunemployment benefits), the generosity of public pension schemes and thequality of education and health systems. In our empirical estimates, we in-clude these data for the year of immigration as well as for the year 2005.13
Where appropriate (and possible) we calculate information regarding thesedeterminants for the year 2005 from our micro-data, as this allows us to re-flect their variation by gender, education levels, income groups, country-of-origin groups, etc. For the year of immigration, we mainly use country-wideaverages taken from longer time series. Table 2.2 gives an overview overdefinitions and sources of these variables. The following section is meant todiscuss the potential role of these determinants in more detail.
2.3 Determinants of migration
From a theoretical point of view, migrants should choose the destinationcountry which offers them the highest expected utility. Thus, factors thatdetermine expected utility should also determine whether an individual de-
13This is part of our empirical strategy meant to deal with possible selectivity of ourdata through return migration (see Section 2.4). An exception is the size of immigrantnetworks; using 2005 data for this variable would obviously raise an endogeneity issue.

Chapter 2: Choice of the Destination Country 24Tab
le2.2:
Socio-econ
omic
andInstitutiona
lVariables
Nam
eTim
eDefinition
Source
Min.
Max
.Wage
2005
Immigrant
wages
inUS-$(P
PP)as
derivedin
Geiset
al.(
2010)
Our
micro-data
base,ow
ncalcula-
tion
s10.66
39.47
immig.year
Wages
inman
ufacturing
relative
toba
seyear
2005
times
averagewages
in2005
OECD
Main
Econo
mic
Indicators
databa
se,o
wncalculations
15.79
29.46
Unemploymentrate
2005
Unemploymentratesforim
migrants
(ILO
defin
ition)
diffe
rentiated
bygend
eran
dskills
Our
micro-data
base,ow
ncalcula-
tion
s3.55
28.69
immig.year
Total
unem
ploymentrate
ofindivid-
uals
aged
25to
54OECD
Main
econ
omic
indicators
databa
se3.99
12.91
Network
immig.year
Shareof
person
swiththesamecoun
-tryof
birthin
totalp
opulationof
the
immigration
coun
try(if>
0.2%
)
OECD
Internationa
lMigration
Statistics
databa
se,o
wncalculations
0.00
4.45
Employmentprotection
2005
Employment
protection
legislation
indicator;
rang
e0(not
restrictive)
–6(extremelyrestrictive)
OECD
Employ
mentOutlook
2004
0.2
3.1
immig.year
Employment
protection
legislation
indicator;
rang
e0(not
restrictive)
–6(extremelyrestrictive)
OECD
Employ
mentOutlook
2004
0.2
3.2
Union
Coverage
2005
Shareof
workers
coveredby
collective
wageagreem
ents
OECD
Employ
mentOutlook
2004
1493
immig.year
Shareof
workers
coveredby
collective
wageagreem
ents
OECD
Employ
mentOutlook
2004
1495
Unemploymentbe
nefits
2005
Benefitreplacem
entrate
inthefirst
fiveyearsof
unem
ploy
ment
OECD
Benefits
andWages
2007
13.8
39.4
immig.year
Benefitreplacem
entrate
inthefirst
fiveyearsof
unem
ploy
ment
OECD
Benefits
andWages
2007
11.1
43.5

Chapter 2: Choice of the Destination Country 25
Nam
eTim
eDefinition
Source
Min.
Max
.Tax
wedge
2005
Incometax
plus
employees’
social
se-
curity
contribu
tion
sdivided
byho
use-
holds’
currentreceipts.
Nickell(2006)
1439.4
immig.year
Incometax
plus
employees’
social
se-
curity
contribu
tion
sdivided
byho
use-
holds’
currentreceipts.
Nickell(2006)
11.5
39.4
Pension
bene
fits
2005
Gross
pensionreplacem
entrates
Feng
ean
dWerding
(2004)
30.6
67.4
immig.year
Gross
pensionreplacem
entrates
Feng
ean
dWerding
(2004)
16.6
71.7
Infant
mortality
2005
Deathsun
der1year
per1000
child
ren
born
OECD
Healthat
aGlance2007
3.6
6.8
immig.year
Deathsun
der1year
per1000
child
ren
born
OECD
Healthat
aGlance2007
3.6
10.6
Edu
cation
scores
2005
PISA-Scoresin
Sciences
OECD
PISA
2006
489
516
immig.year
Trend
inscores
from
educationtests
Han
ushekan
dWoessman
n(2009)
485
530
Family
expe
nditure
2005
Shareof
public
family
expe
nditurein
GDP
OECD
Social
Exp
enditure
databa
se0.62
3.20
immig.year
Shareof
public
family
expe
nditurein
GDP
OECD
Social
Exp
enditure
databa
se0.47
3.20

Chapter 2: Choice of the Destination Country 26
cides to migrate and which destination country the migrant chooses. In thissection, we discuss factors specific to the different destination countries thatare likely to affect expected utilities of migrants and derive hypotheses re-garding their effects.
Probably the most important determinant of the expected utility of anindividual living in a certain country is the income expected there. In theeconomic literature, income differentials have always been considered as themain driving force behind migration (see, e.g. Sjaastad, 1962; Todaro, 1969).The major source of variation in income across countries is wage income,while capital income need not be affected at all by a change in the country ofresidence when abstracting from relevant differences in taxation. Expectedwages of individuals in different countries depend on two components, viz.the wage that an individual would earn in each country and the probabilityto find employment there. Both components typically depend on the quali-fications of an individual, with high-skilled people earning higher wages andbeing less likely to become unemployed than low skilled people. For the es-timations, it would be optimal if expected wages could be observed directlyfor each individual. But this is obviously impossible. We therefore proceedas follows: For 2005, we use our micro-data to calculate hourly gross wagesand unemployment rates for immigrants, differentiated by gender and levelof education (for a detailed description of the procedures applied, see Geiset al., 2010). For the years of immigration, unemployment rates are onlyavailable at the aggregate level. Similarly, macro-level data for these yearsallow us to calculate average hourly gross wages only (i.e., labor compen-sation per employee divided by average working hours) without any furtherdifferentiation. Even though they are not a very precise measure for individ-ual wage income, average wages should still be more informative than GDPper capita, which is used in most similar studies.14
Benefits meant to replace wages, especially in the case of unemployment,are another important component of expected income. Accounting, in muchdetail, for unemployment benefits that potential immigrants would get in
14See, e.g., Pedersen et al. (2008); Mayda (2007); Docquier and Marfouk (2008)
Chapter 2: Choice of the Destination Country 27
the case of unemployment is difficult. In most cases, benefit entitlements arecontingent on earlier wages and on the duration a person has been employedin the country. Often, benefits decrease over time, with the time pattern ofthe decrease again depending on the duration a person has been employed.For our set-up, the most convincing measure for unemployment benefits thatis available is the average replacement rate for the first five years of unem-ployment as provided by the OECD (2004).
Old-age pensions also have a strong impact on expected income. Theeffect on migration is, however, not clear. Generous pension schemes mayattract, but also deter, migrants depending on the “implicit” (i.e., net) taxesthey imply. Also, potential migrants could fear the political risk that gen-erous systems might be scaled back or even discontinued in the context ofageing societies. Furthermore, redistributive features of national pension sys-tems may affect migrants with different skills in different ways (see Werdingand Munz, 2005). We therefore include pension replacement rates (as cal-culated in Fenge and Werding, 2004) in our estimations to see whether, andhow, pensions affect migration choices.
Quite generally, the various types of earnings replacement schemes donot necessarily increase the expected income of immigrants, since they arefinanced by (implicit or explicit) taxes or compulsory contributions. Takenin isolation, the tax system reduces expected income of migrants. To con-trol for this impact, we take the ratio of income taxes and social securitycontributions over income as a measure for the tax wedge (Nickell, 2006),effectively covering a large part of the tax burden falling on immigrants, butneglecting sales or value-added taxes.
Health systems, education systems and the like may also affect migrationdecisions. These systems can affect expected income, and they can alsohave direct effects on expected utility. Having access to good physicians incases of illness, e.g., generally increases the quality of life irrespective of thecosts involved. Measuring the quality of health care or education systemsis difficult. Expenditures are often used as a measure, but can be distortedthrough inefficiencies. Therefore, we use infant mortality in our regressions asa measure of health outcomes and test scores, such as those derived from the

Chapter 2: Choice of the Destination Country 28
PISA study, as a measure of the quality of education. As a historical measureof the quality of education, we use the interpolation of test scores proposedby Hanushek and Woessmann (2009). In addition, availability of child careand public family allowances could also affect the choices of migrants. Wetherefore use public family expenditure as a further control.
Like unemployment benefits and pensions, systems providing health care,education, etc. also have to be financed. Thus, they can have a negativenet effect for migrants. For education and family benefits this is obvious.Immigrants who have no children and do not intend to have children inthe future have no (direct) benefit from these systems, but they have topay for them through their taxes. If we were able to perfectly control forindividual tax burdens, this negative effect should vanish, i.e., it should befully absorbed by the tax measure. However, our control is imperfect in thisregard,15 so that the negative impact may show up on the benefit side.
Not all instruments of public policies that may affect migrants’ choicesrequire taxes. Labor market institutions, such as employment protectionor powerful unions, are also likely to affect the attractiveness of living in acertain country, either directly or indirectly via their effects on wages andemployment prospects of immigrants. However, the direction of these effectsis not clear. On the one hand, employment protection and union power nor-mally lead to more stable jobs and could thus be attractive for immigrants.On the other hand, these labor market institution may also hinder immi-grants to enter the labor market. In fact, they are often said to give riseto “insider–outsider” problems in labor markets (see Lindbeck and Snower,1986). Since potential immigrants are outsiders in this respect almost by def-inition, these institutions could negatively affect their choices. We thereforeinclude measures of employment protection legislation and union coverage(from OECD, 2004) in our estimation without having a clear expectation
15Most importantly, our tax measure bundles wage taxes and social security contribu-tions. With the exception of pension systems, we are unable to control for benefit enti-tlements (that may vary by age, sex, the number of children, etc.) which are effectivelylinked to current contributions. Also, inefficiencies involved in the various components ofpublic expenditure may not be fully reflected in the variation of tax rates.
Chapter 2: Choice of the Destination Country 29
regarding their effects.
Expected utilities of individuals living in different countries are not onlyaffected by economic factors but also by social ties. In particular, enter-ing a network of earlier immigrants from the same country or region can beimportant for individuals (see, e.g., Munshi, 2003). The impact of migrantnetworks on migration decisions has an economic interpretation, as networksmay reduce uncertainties and migration costs in many ways. Up to a point,they even reflect features of national immigration policies, as the latter con-tain family re-unification programs in most countries. Therefore, we use theshare of persons from the same source country in the population of the desti-nation country as a measure of the strength of the migrant network. Due todata limitations, we can actually do so only for immigrant groups represent-ing at least 0.2% of the population. This need not be a problem, however, assmaller groups are probably lacking the critical mass to deliver the benefitsof a network. Since the effects of networks on migration decisions may not belinear – additional persons are probably more important in smaller networksthan in larger ones – we also include the square of this measure.
Immigration policies are extremely complex and case-specific in all fourdestination countries, so that it is very difficult to measure their impactdirectly.16 In fact, we did not find a reliable proxy for them which could beused in our empirical work.17 Other factors, such as climate, geographicalaspects, but also xenophobia among the native population, may also playa role for migrants’ location choices. Nevertheless, we think that we haveincluded the most relevant factors in our empirical work given our focus.
16The new MIPEX index, e.g., does not cover the United States and only providesinformation about the policies effective in 2005, not for earlier years.
17In addition to estimates based on our full sample, we will also present results for thesub-sample of skilled migrants. As restrictions to migration are typically less importantfor this group than for low-skilled migrants, one can consider this as a robustness checkshowing, among other things, how crucial it is to directly control for immigration policies.

Chapter 2: Choice of the Destination Country 30
2.4 Estimation strategy
For the estimation, we use a combination of a Conditional and a MultinomialLogit Model (CMNL).18 The basic idea of the model is that among a rangeJ of options – in our case, among destination countries – individuals choosethe one that offers them the highest utility, Vij; here, i denotes the individualand j the option. Utility, in turn, depends on option-dependent explanatoryvariables, Xij, and on option-invariant ones, Zi. Assuming a linear relation-ship and adding an error term, utility levels are represented by the followingequation:
Vij = X ′ijβ + Z ′iγj + εij (2.1)
The observed variable yij indicates which option an individual has chosen.Thus, for k ∈ J , yik = 1 and yi¬k = 0 if Vik = maxj(Vij). Furthermore,it is assumed that the error terms, εij, are independent and log-Weibull-distributed. The density of this function is e(−εij−e−εij ). It can be shown thatthe probability function has the following form (see Amemiya (1981)):
pij = Prob(yij = 1|X,Z) =eX′ijβ+Z′iγj∑J
l=1 eX′ilβ+Z′iγl
(2.2)
For the estimation, this CMNL has to be transformed into a pure Con-ditional Logit Model. Following Cameron and Trivedi (2005), we use thefollowing probability function for the estimation:
pij = Prob(yij = 1|X,Z∗) =eX′ijβ+Z∗
′ij γ∗∑J
l=1 eX′ilβ+Z∗
′il γ∗
(2.3)
where Z∗ is the Kronecker product of Z and a J × J identity matrix I,Z∗ = Z ⊗ I, and γ∗ = [0′, γ′2, . . . , γ
′J ]; γ1 = 0 is a normalization. The model
is estimated by maximum likelihood. The resulting first-order condition is
18Although this combination is well-known in the econometric literature, it has no par-ticular name. It is sometimes called Mixed or Multinomial Logit Model, but these labelsalso refer to other models.

Chapter 2: Choice of the Destination Country 31
given by:N∑i=1
M∑j=1
yij(xij − x̄i) = 0 (2.4)
with x̄i =∑m
l=1 pilxil. The marginal effects of changes in the option-dependentexplanatory variables can be calculated as follows (cf. Cameron and Trivedi,2005):
∂pij∂xik
= pij(δijk − pik)β (2.5)
The equation gives the effect of a change in the independent variable foroption k on the probability that option j is chosen; δijk is equal to 1 if j = k
and 0 otherwise. For a given coefficient β that we estimate, there are thus 16marginal effects, four for each destination country. For lack of space, we willdisplay only the four marginal effects for j = k in the tables summarizingour estimation results. For instance, we display the marginal effect of anincrease in wages in the US on the probability to migrate to the US, not onthe probability to migrate to one of the other countries.19
Our empirical set-up involves two potential problems that we have todeal with through our estimation strategy. The first problem arises frompotential selectivity of our data set through re-migration. The second one isdue to the small number of destination countries from which we have takenour micro-data.
As we are using cross-section data, we observe migrants only at one pointin time. Our observations are thus actually the outcome of two decisions,namely the decision to migrate to a certain destination country and thedecision not to leave this country again, at least not before the observationperiod. Incentives to immigrate may differ between migrants who are going tostay in a country for a long time and immigrants who stay only temporarily.With our approach, we effectively focus on long-term immigrants who aregenerally also more interesting for policy makers. Still, for this group theincentives to immigrate and the incentives to stay on may differ. To deal
19We could also calculate a single marginal effect using some sort of representativecountry (with average characteristics).

Chapter 2: Choice of the Destination Country 32
with this, we include in our regressions variables for the socio-economic andinstitutional determinants of migration for the year of immigration and forthe year 2005. Historical values for the year of immigration are meant tocapture determinants of the migration choice, whereas the 2005-values controlfor the reasons to stay in the country.
Another challenge for our estimations is the low variation in our institu-tional variables, many of them being truly country-specific. Considering allof them in a single regression is not possible, as this would lead to multi-collinearity. On the other hand, more detailed information is not available,and adding more destination countries to our data set is all but easy. There-fore, we choose to expand the number of estimations using a multitude ofcombinations of the variables representing the various institutions capturedby our data.
The following individual-specific variables are included in all our regres-sions: gender, age (and age squared), level of education and region of thecountry of birth. Furthermore, all regressions contain information on wages,unemployment rates and the (squared) size of migrant networks, as these arevariables which are conventionally found to have a strong impact on migrants’location decisions. In a first step, institutional variables that mainly vary bycountries are then included one by one in the regressions. As there could alsobe interactions between these institutions, we repeat the estimations with allpossible pairs and triplets of institutions (while including four or more in-stitutional variables in a single estimation would lead to multi-collinearityproblems). Similar approaches have been proposed in other areas, for in-stance, by Sala-i Martin (1997) for an analysis of economic growth or byHegre and Sambanis (2006) to explain civil wars.
When aggregating the estimation results from the single regressions, welook at the medians of our estimators and the medians of the marginal ef-fects. Average figures as an alternative way of representing our results areaffected by outliers. To interpret our results, measures for the dispersionand significance of the estimates would be helpful. However, the literature

Chapter 2: Choice of the Destination Country 33
does not offer us appropriate, canonical measures.20 To get an idea of thevariation of estimates, we construct an aggregate standard error, adding thesquare of the average standard error from the regressions and the variance ofestimators across regressions and extracting the root.21 As a rough indicatorfor the significance of our results, we also determine for each variable theshare of regressions in which the estimated coefficient is significantly positiveor negative at the 1%-level. If 90% or more of our estimates yield coefficientsthat are highly significant and have a uniform sign, we take the result to besolid; if the same applies to at least 75% of our estimates, we take the resultto be worth being discussed.
2.5 Estimation results
Table 2.3 displays the median results derived from the full sample and thefull set of our estimations, i.e., all permutations in which we control for one,two or three institutional variables in addition to wages, unemployment ratesand networks (squared). Due to space limitations, estimates for individual-level characteristics are not reported. Results for the variables included in allspecifications are much in line with expectations. For instance, we find theexpected positive effect for wages and the expected negative effect for unem-ployment rates. Except for wages per hour at immigration, this holds on a1%-level of significance in all 93 regressions. The smaller share of significantregressions for historical wages could be due to the lower precision of this
20The extreme-bound criterion proposed by Leamer (1985), adding two standard devi-ations to the estimates located at the extreme ends of the distribution of all estimators,is too restrictive for our purpose. Our series of estimations are mechanically created and,hence, may contain outliers through mis-specifications that are severely punished by thiscriterion. Our results would look strong in terms of the criterion proposed by Sala-i Martin(1997). However, this criterion appears to be inappropriate in our eyes, as it concentrateson the significance of single estimates, but attaches no weight to the variation of coefficientsover specifications, which is quite large in our case.
21This should be a feasible approach as E(x − x′ + x′ − x′′)2 = E(x − x′)2 + E(x′ −x′′)2 + 2E[(x− x′)(x′− x′′)] and E[(x− x′)(x′− x′′)] = 0. Here, E(x− x′)2 is the squaredaverage standard error of the regressions and E(x′ − x′′)2 is the variance of estimatorsacross specifications.
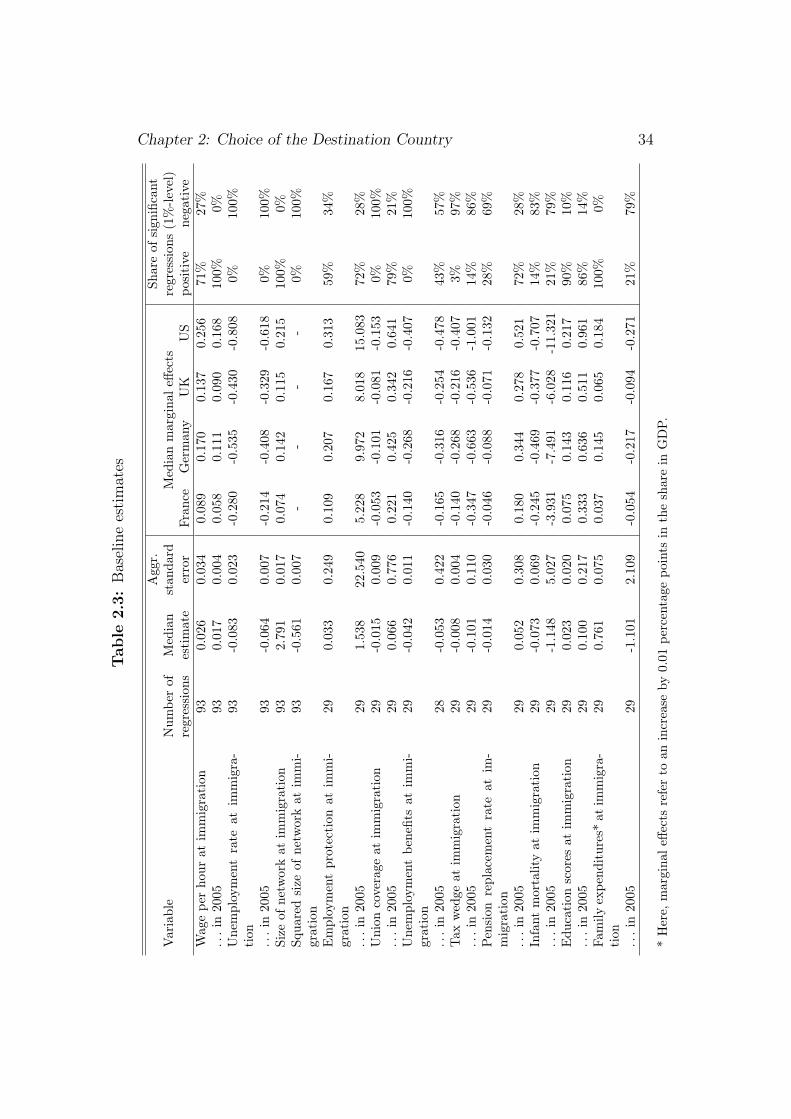
Chapter 2: Choice of the Destination Country 34Tab
le2.3:
Baselineestimates
Aggr.
Shareof
sign
ificant
Variable
Num
berof
Median
stan
dard
Medianmargina
leffe
cts
regression
s(1%-le
vel)
regression
sestimate
error
Fran
ceGerman
yUK
US
positive
negative
Wagepe
rho
urat
immigration
930.026
0.034
0.089
0.170
0.137
0.256
71%
27%
...in
2005
930.017
0.004
0.058
0.111
0.090
0.168
100%
0%Unemploymentrate
atim
migra-
tion
93-0.083
0.023
-0.280
-0.535
-0.430
-0.808
0%100%
...in
2005
93-0.064
0.007
-0.214
-0.408
-0.329
-0.618
0%100%
Size
ofnetw
orkat
immigration
932.791
0.017
0.074
0.142
0.115
0.215
100%
0%Sq
uaredsize
ofnetw
orkat
immi-
gration
93-0.561
0.007
--
--
0%100%
Employmentprotection
atim
mi-
gration
290.033
0.249
0.109
0.207
0.167
0.313
59%
34%
...in
2005
291.538
22.540
5.228
9.972
8.018
15.083
72%
28%
Union
coverage
atim
migration
29-0.015
0.009
-0.053
-0.101
-0.081
-0.153
0%100%
...in
2005
290.066
0.776
0.221
0.425
0.342
0.641
79%
21%
Unemploymentbe
nefitsat
immi-
gration
29-0.042
0.011
-0.140
-0.268
-0.216
-0.407
0%100%
...in
2005
28-0.053
0.422
-0.165
-0.316
-0.254
-0.478
43%
57%
Tax
wedge
atim
migration
29-0.008
0.004
-0.140
-0.268
-0.216
-0.407
3%97%
...in
2005
29-0.101
0.110
-0.347
-0.663
-0.536
-1.001
14%
86%
Pension
replacem
entrate
atim
-migration
29-0.014
0.030
-0.046
-0.088
-0.071
-0.132
28%
69%
...in
2005
290.052
0.308
0.180
0.344
0.278
0.521
72%
28%
Infant
mortalityat
immigration
29-0.073
0.069
-0.245
-0.469
-0.377
-0.707
14%
83%
...in
2005
29-1.148
5.027
-3.931
-7.491
-6.028
-11.321
21%
79%
Edu
cation
scores
atim
migration
290.023
0.020
0.075
0.143
0.116
0.217
90%
10%
...in
2005
290.100
0.217
0.333
0.636
0.511
0.961
86%
14%
Family
expe
nditures*at
immigra-
tion
290.761
0.075
0.037
0.145
0.065
0.184
100%
0%
...in
2005
29-1.101
2.109
-0.054
-0.217
-0.094
-0.271
21%
79%
*Here,
margina
leffe
ctsreferto
anincrease
by0.01
percentage
points
inthesharein
GDP.
Chapter 2: Choice of the Destination Country 35
variable (average hourly gross wages). Immigrant networks have a positiveeffect, which is significant in all regression, but their impact is decreasing, asthe squared network variable has a negative sign. This indicates that net-works really facilitate immigration to a country; however, when the networkis already large, a further increase in its size hardly has an additional positiveeffect.
Other results are less clear a priori, hence potentially more interesting.In the majority of regressions employment protection has a positive and sig-nificant effect on the decision to migrate and to stay in a specific destinationcountry. Positive effects become stronger when considering the year-2005figures compared to the year-of-immigration figures, but we are not inclinedto take this as a clear-cut result. By contrast, historical figures for unioncoverage and unemployment benefits affect the decision to immigrate nega-tively in a highly significant way. Upon their arrival, immigrants appear tobe “outsiders” where unions are strong, and they are hardly entitled to receiveany benefits if they cannot find a job or drop out of employment very soon.Interestingly, union coverage has a positive influence on the decision to stayin the destination country in more than three quarters of the cases, while theeffect of the benefit level is rather mixed based on year-2005 figures. Over-all, this indicates that migrants prefer destination countries with less strongprotection against labor-market risks when deciding about where to migrate.It also implies that (some) immigrants observed in our data set have become“insiders” in the labor market of their destination countries benefitting fromunion coverage, in particular.
We also find negative and significant effects of the income tax wedgeon migration decisions in almost all regression. This is clearly what oneshould expect given that we separately control for public services which arepotentially related to higher taxes. Pension replacement rates produce mixedeffects in our “baseline” estimates based on the full sample, with a highershare of coefficients that are significantly negative for the year of immigrationand a higher share of coefficients that are significantly positive for 2005. Boththese effects apply to more than two thirds of our estimates, but they couldbe more pronounced to be considered fully trustworthy.
Chapter 2: Choice of the Destination Country 36
For the other systems of public benefits included in our model, we findthat good health-care and education systems have a positive effect on migra-tion decisions, which is significant in about 80% to 90% of the regressions.22
Family expenditure is also a positive and (highly) significant determinant ofthe decision to migrate, while their impact becomes negative in about 80%of the cases regarding the decision to stay. This is surprising at first sight.Note, however, that we effectively use an input measure here – unlike theoutput measures employed for health care and the education system. If fam-ily benefits are organized inefficiently and migrants realize this while livingin the country, this could provide one explanation for the change in the sign.
To assess the quantitative importance of our estimates, we also calculatethe median of the marginal effects (see equation (2.5)) derived from theestimations.23 For instance, a marginal increase in the unemployment rate inFrance negatively affects the decision to migrate there by 0.280, while parallelincreases in Germany and the UK reduce immigration by 0.535 and 0.430,respectively. The effect is largest for an increase in the unemployment rate inthe USA (-0.808).24 Considering the impact of unemployment rates in 2005on decisions to stay, we find smaller effects. This could indicate that, aftersome years spent in the destination country, migrants are more integrated,thus hit less strongly by adverse developments in the labor market. In termsof marginal effects, wages are also more important regarding the decisionto migrate than with respect to the decision to stay. Things are differentwith regard to the tax wedge. Being more integrated, both socially and
22Of course, we expect higher quality of the health-care system to decrease infant mor-tality.
23Note that these marginal effects do not reflect indirect effects of changes in institu-tions. For instance, an increase in unemployment benefits is often linked to a decrease in(net) wages. Our marginal effects show the effects of institutions in ceteris-paribus termsand give us an idea of the importance of these institutions for the choice of a particulardestination country.
24Note that the ranking of marginal effects across our four countries reflects cross-country differences in the level of each variable and differences in migrants’ probabilitiesto live in a particular destination country. Therefore, marginal effects cannot be used forcomparisons across countries, but rather for evaluating the relative importance of differentdeterminants for migrants’ choices regarding a single country.

Chapter 2: Choice of the Destination Country 37
economically, may imply that (progressive) taxes become more burdensome.Marginal effects for the different branches of public policy considered herealso give us an impression of their relative importance for the decision tomigrate to a specific destination country. A marginal improvement in thequality of health care (measured via a marginal decrease in infant mortality)is more effective in attracting immigrants compared to a better educationsystem or higher family expenditure.25
To check for the robustness of our results, we also consider a numberof sub-samples. Specifically, we repeat our estimations for the sub-group ofindividuals who migrated after 1995 (see table 2.4), i.e., within a maximumperiod of 10 years, to reduce the potential selection of our sample throughre-migration. We also study the results for skilled migrants (see table 2.5),running regressions only for migrants whose qualifications are classified asISCED 3-6. Here, the point is that skilled migrants can be expected to berelatively free in their choice of a destination country, while low-skilled peopleoften face more restrictive immigration policies and thus have a more limitedchoice of destinations. In either of these cases, the estimates are much inline with the estimates for the total sample, both in terms of the direction ofeffects and in terms of their level of significance. In the case of more recentmigrants, exceptions may be due to the fact that the variation in institutionalvariables, hence the difference between historical and current figures, nowbecomes smaller. Whether this, or other (e.g., time or cohort) effects, explainthat the positive effects of employment protection at immigration are nowsignificant, while the negative effects of union coverage disappear is thus hardto tell. In the case of skilled migrants, historical variables that are basedon rough average figures, such as wages and the tax wedge, may not besuited to fully capture their effects for this sub-group. They clearly performweaker now. At the same time, the lower share of significant results foreducational scores at immigration may have a material interpretation, the
25Note, however, that we cannot assess the cost-effectiveness of any of these policymeasures, as we cannot tell how one Euro spent is transformed into a decrease of infantmortality (by one in 1000 births) or a (one-point) increase in education scores.
Chapter 2: Choice of the Destination Country 38
quality of education in the destination country probably being less importantfor individuals who are high skilled already when they arrive.
A result that is common to both sub-samples is that the negative effectsof pension replacement rates at the time of immigration are now clearly sig-nificant, while their positive effects regarding the decision to stay becomemore pronounced at least for skilled migrants. The negative effects can beexplained by the fact that more generous pension systems may be subject tohigher political risks and, in any case, involve higher contributions. Only ifimmigrants enter regular employment for a sufficient period of time, do theyqualify for generous pension benefits. Otherwise, high benefit levels actuallymean high (implicit) taxes for migrants. Positive effects of year-2005 pensionreplacement rates for skilled migrants could also reflect that more generouspension systems tend to have a stronger tax–benefit link (see Koethenbuergerand Profeta, 2008), so that skilled individuals find themselves better off stay-ing in countries with higher pensions that are less redistributive. Of course,the two differing effects could also indicate changes in national pension poli-cies, with recent pension reforms increasing the credibility of generous enti-tlements, or in the way these are perceived by migrants who become morefamiliar with the system over time.26
2.6 Conclusions
The decision to migrate to a particular country is a complex process andmay be affected by various factors. Economists conventionally expect wagesand unemployment rates to have an impact on this decision. In this paper,we show that the institutional setting in potential destination countries may
26In additional series of regressions, we normalized the population of each country to50 million by adjusting the sample weights (in order to avoid distortions through thedifferent sizes of our four countries), we dropped the German “(Spät)-Aussiedler ” (to leaveout individuals enjoying a highly preferential treatment in the migration law of just onecountry), and we restricted the sample to migrants arriving in 2000 or later. In all of thesecases, the results are essentially unchanged compared to those presented here, underliningthe robustness of our estimates.
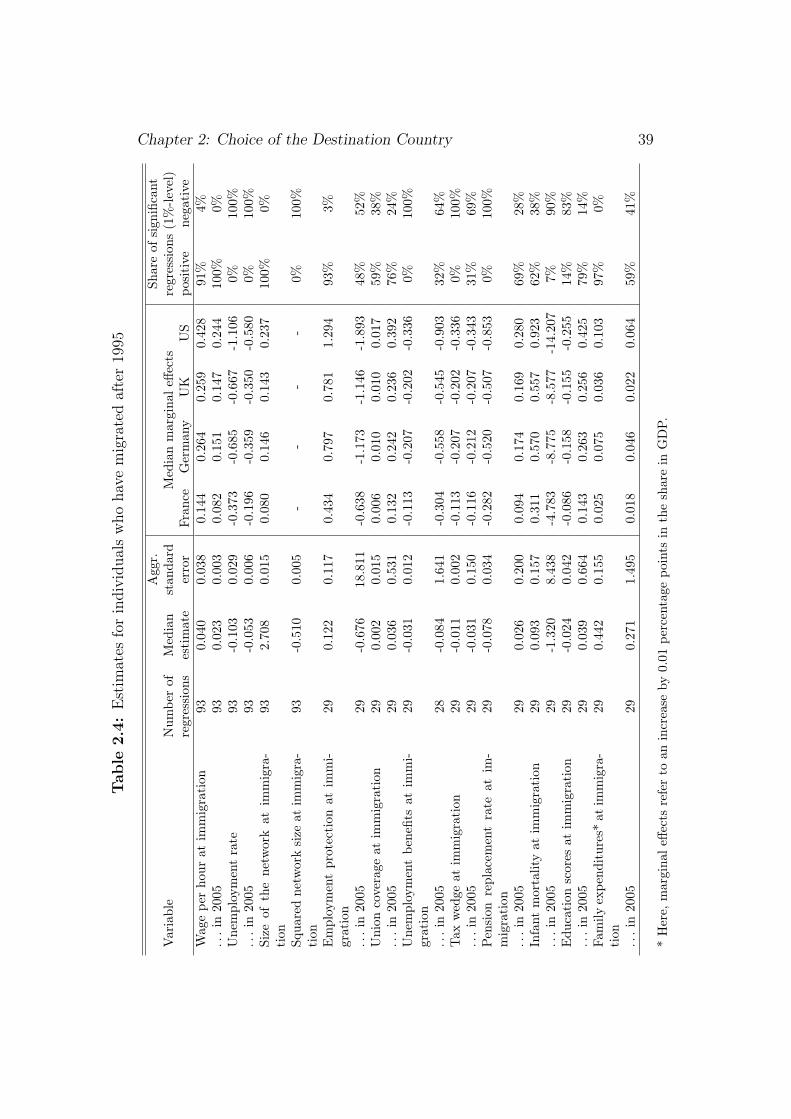
Chapter 2: Choice of the Destination Country 39Tab
le2.4:
Estim
ates
forindividu
alswho
have
migratedafter19
95
Aggr.
Shareof
sign
ificant
Variable
Num
berof
Median
stan
dard
Medianmargina
leffe
cts
regression
s(1%-le
vel)
regression
sestimate
error
Fran
ceGerman
yUK
US
positive
negative
Wagepe
rho
urat
immigration
930.040
0.038
0.144
0.264
0.259
0.428
91%
4%...in
2005
930.023
0.003
0.082
0.151
0.147
0.244
100%
0%Unemploymentrate
93-0.103
0.029
-0.373
-0.685
-0.667
-1.106
0%100%
...in
2005
93-0.053
0.006
-0.196
-0.359
-0.350
-0.580
0%100%
Size
ofthenetw
ork
atim
migra-
tion
932.708
0.015
0.080
0.146
0.143
0.237
100%
0%
Squa
rednetw
orksize
atim
migra-
tion
93-0.510
0.005
--
--
0%100%
Employmentprotection
atim
mi-
gration
290.122
0.117
0.434
0.797
0.781
1.294
93%
3%
...in
2005
29-0.676
18.811
-0.638
-1.173
-1.146
-1.893
48%
52%
Union
coverage
atim
migration
290.002
0.015
0.006
0.010
0.010
0.017
59%
38%
...in
2005
290.036
0.531
0.132
0.242
0.236
0.392
76%
24%
Unemploymentbe
nefitsat
immi-
gration
29-0.031
0.012
-0.113
-0.207
-0.202
-0.336
0%100%
...in
2005
28-0.084
1.641
-0.304
-0.558
-0.545
-0.903
32%
64%
Tax
wedge
atim
migration
29-0.011
0.002
-0.113
-0.207
-0.202
-0.336
0%100%
...in
2005
29-0.031
0.150
-0.116
-0.212
-0.207
-0.343
31%
69%
Pension
replacem
entrate
atim
-migration
29-0.078
0.034
-0.282
-0.520
-0.507
-0.853
0%100%
...in
2005
290.026
0.200
0.094
0.174
0.169
0.280
69%
28%
Infant
mortalityat
immigration
290.093
0.157
0.311
0.570
0.557
0.923
62%
38%
...in
2005
29-1.320
8.438
-4.783
-8.775
-8.577
-14.207
7%90%
Edu
cation
scores
atim
migration
29-0.024
0.042
-0.086
-0.158
-0.155
-0.255
14%
83%
...in
2005
290.039
0.664
0.143
0.263
0.256
0.425
79%
14%
Family
expe
nditures*at
immigra-
tion
290.442
0.155
0.025
0.075
0.036
0.103
97%
0%
...in
2005
290.271
1.495
0.018
0.046
0.022
0.064
59%
41%
*Here,
margina
leffe
ctsreferto
anincrease
by0.01
percentage
points
inthesharein
GDP.
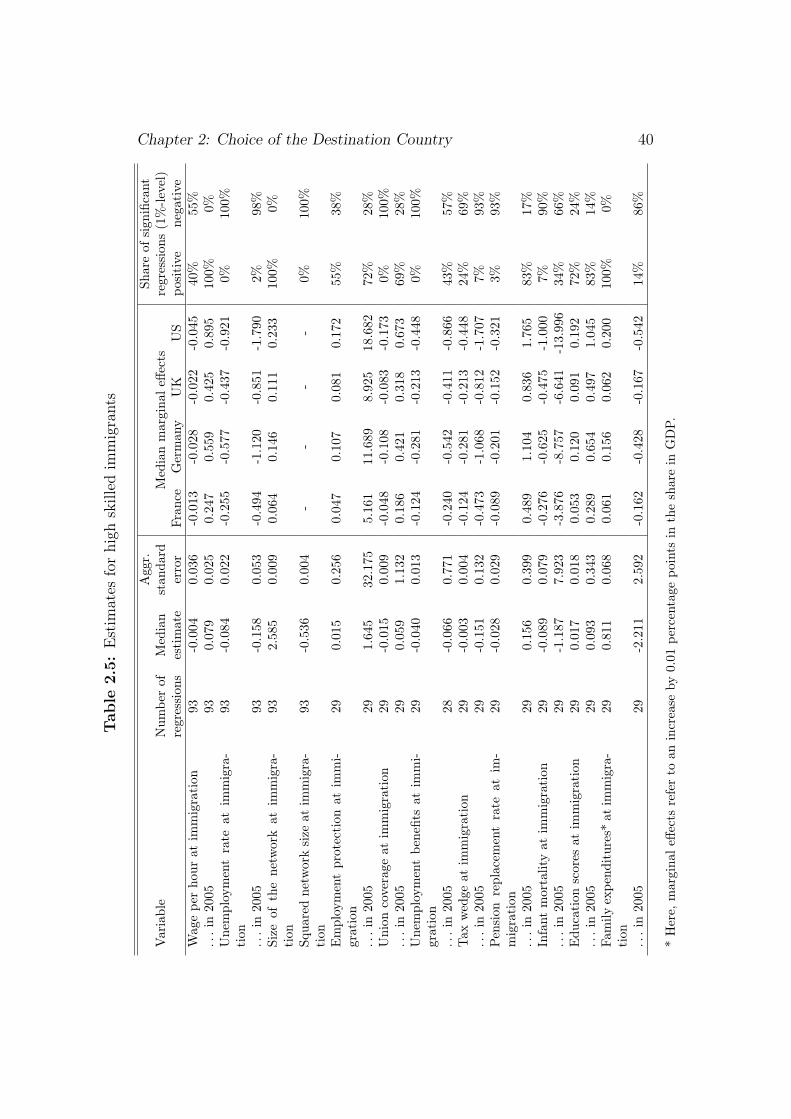
Chapter 2: Choice of the Destination Country 40
Tab
le2.5:
Estim
ates
forhigh
skilled
immigrants
Aggr.
Shareof
sign
ificant
Variable
Num
berof
Median
stan
dard
Medianmargina
leffe
cts
regression
s(1%-le
vel)
regression
sestimate
error
Fran
ceGerman
yUK
US
positive
negative
Wagepe
rho
urat
immigration
93-0.004
0.036
-0.013
-0.028
-0.022
-0.045
40%
55%
...in
2005
930.079
0.025
0.247
0.559
0.425
0.895
100%
0%Unemploymentrate
atim
migra-
tion
93-0.084
0.022
-0.255
-0.577
-0.437
-0.921
0%100%
...in
2005
93-0.158
0.053
-0.494
-1.120
-0.851
-1.790
2%98%
Size
ofthenetw
ork
atim
migra-
tion
932.585
0.009
0.064
0.146
0.111
0.233
100%
0%
Squa
rednetw
orksize
atim
migra-
tion
93-0.536
0.004
--
--
0%100%
Employmentprotection
atim
mi-
gration
290.015
0.256
0.047
0.107
0.081
0.172
55%
38%
...in
2005
291.645
32.175
5.161
11.689
8.925
18.682
72%
28%
Union
coverage
atim
migration
29-0.015
0.009
-0.048
-0.108
-0.083
-0.173
0%100%
...in
2005
290.059
1.132
0.186
0.421
0.318
0.673
69%
28%
Unemploymentbe
nefitsat
immi-
gration
29-0.040
0.013
-0.124
-0.281
-0.213
-0.448
0%100%
...in
2005
28-0.066
0.771
-0.240
-0.542
-0.411
-0.866
43%
57%
Tax
wedge
atim
migration
29-0.003
0.004
-0.124
-0.281
-0.213
-0.448
24%
69%
...in
2005
29-0.151
0.132
-0.473
-1.068
-0.812
-1.707
7%93%
Pension
replacem
entrate
atim
-migration
29-0.028
0.029
-0.089
-0.201
-0.152
-0.321
3%93%
...in
2005
290.156
0.399
0.489
1.104
0.836
1.765
83%
17%
Infant
mortalityat
immigration
29-0.089
0.079
-0.276
-0.625
-0.475
-1.000
7%90%
...in
2005
29-1.187
7.923
-3.876
-8.757
-6.641
-13.996
34%
66%
Edu
cation
scores
atim
migration
290.017
0.018
0.053
0.120
0.091
0.192
72%
24%
...in
2005
290.093
0.343
0.289
0.654
0.497
1.045
83%
14%
Family
expe
nditures*at
immigra-
tion
290.811
0.068
0.061
0.156
0.062
0.200
100%
0%
...in
2005
29-2.211
2.592
-0.162
-0.428
-0.167
-0.542
14%
86%
*Here,
margina
leffe
ctsreferto
anincrease
by0.01
percentage
points
inthesharein
GDP.

Chapter 2: Choice of the Destination Country 41
also play an important role. Effectively, our results indicate that wages andunemployment rates alone are not sufficient to fully explain location choicesof people who migrate internationally.
Besides the conventional effects of wages and unemployment rates, whichare positive respectively negative, we observe a positive, but declining ef-fect of the size of immigrant networks which has also been studied in manyearlier contributions. In addition, we find that labour-market institutions,such as union coverage and unemployment benefits, have negative effects fordecisions to migrate to specific countries, while they may play a positive roleregarding decisions to stay there. Results regarding employment protectionare rather mixed, but again the effects tend to become more positive formigrants already in the country. We take these results to point to “insider–outsider” problems related to these institutions – with migrants who stay onin a country increasingly becoming “insiders”.
Among the other institutional features we are considering, a higher taxwedge has a negative effect, unambiguously deterring (potential) migrants.We also find that the quality of health-care and education systems have apositive effect, while the impact of pension replacement rates is negativeregarding decisions to migrate to a given country and tends to be positiveregarding decisions to stay there.
Being aware of the shortcomings of our analysis due to data limitations,we think that by combining micro-data from four major destination countrieswe provide new insights as to whether and how institutions play a role formigration decisions.

3Does Educational Choice Erode the
Immigration Surplus?
3.1 Introduction
Public opinion commonly regards high skilled immigration as beneficial forthe domestic economy. Many developed countries, especially Anglo-Saxonones, pursue an immigration policy that is targeted at attracting high skilledimmigrants. For instance, in 2002 the UK has launched the Highly Skilled Mi-grant Programme (HSMP) that grants free entry for high skilled immigrants,independent of an employment contract.1 Most economists also regard im-migration, and especially high skilled immigration, as welfare enhancing.Building on the seminal results of Berry and Soligo (1969), Borjas (1995)has shown that immigration into a perfect labor market leads to a welfaregain for the native population as a whole, provided that it changes the skillcomposition of the labor force and wages are flexible. Thus, as the marketfor high skilled labor generally does not exhibit large frictions, high skilledimmigration should have a positive effect on native welfare.2 In principle,
1Zaletel (2006) gives an overview over the HSMP and various other immigration pro-grams for high skilled workers.
2Kemnitz (2009) shows that with certain labor market distortions high skilled immi-gration can also lead to a welfare loss. Moreover, changes in international trade due to
42
Chapter 3: Educational Choice and Immigration Surplus 43
such an immigration surplus may also occur for low-skilled immigration, al-though the prevalence of labor market imperfections, like minimum wages,arguably makes it a less likely outcome for low-skilled than for high-skilledimmigration. Empirical evidence on the wage effects of immigration is how-ever mixed.3
The notion of an immigration surplus rests on the assumption that im-migration has no influence on the skill composition of the native labor force.If immigration occurs in a single, unexpected event, then this assumptionseems reasonable. Education decisions are generally made in early stages oflife, with a strong element of persistence regarding the level and nature ofskills that people bring to the labor market. Hence, the skill compositionof the native work force is exogenous to unexpected immigration shocks, inwhich case the conventional calculus of the immigration surplus seems valid.
However, immigration seldom occurs as a one-time, unexpected shock.Instead, it takes the form of a rather steady yearly inflow of people whichis mainly governed by the rules of existing immigration policy. Existing im-migration policy is common knowledge, hence future immigration flows willtypically be anticipated and are likely to affect natives’ education decisions.Thus, the skill-composition of the native labor force that will prevail by thetime immigration occurs is not exogenous to the size and composition of the(anticipated) inflow of labor. A key tenet of the conventional theory of theimmigration surplus is thus put into question. In this paper, I readdress thattheory, developing a simple model of overlapping generations that allows meto take into account the educational adjustment to anticipated immigrationwhen calculating the immigration surplus.
Intuitively, if immigration policy is such that natives anticipate a futureinflow of high-skilled workers, and if educational decisions are responsive toexpected returns to education from educational wage premia, then we shouldexpect this policy to have a negative impact on education. If immigration
immigration can also reduce the immigration surplus, see Felbermayr and Kohler (2007).3As discussed in Longhi et al. (2005b) and Hanson (2009), estimated wage effects of
immigration vary substantially over different studies.

Chapter 3: Educational Choice and Immigration Surplus 44
policy is generally geared towards enhancing the skill level of domestic laborsupply, then this type of endogenous adjustment of native households wouldtend to undermine this objective. Does it also erode the well-known immi-gration surplus? Do such anticipation effects generally favor an immigrationpolicy by announcement, or should the government take natives by surprise?In this paper, I try to give tentative answers to these questions.
It is somewhat surprising that existing literature has so far hardly ad-dressed these questions. There is a long tradition of literature that is con-cerned with possible “brain drain” from high-skilled emigration in less de-veloped countries. Emphasizing anticipation effects in educational decisions,more recent literature has argued that this concern is misguided in that theprospect of emigration may in effect raise the expected return on education,thus enhancing the sending country’s stock of human capital, potentially in-creasing welfare even of non-migrating natives, (see e.g. Mountford, 1997;Stark and Wang, 2002; Vidal, 1998).
In contrast, the mirror image question of educational response to high-skilled immigration in the receiving country has so far received very littleattention. Fuest and Thum (2001) analyze the effects of low skilled immi-gration on the native education structure and native welfare. For this, theymodel a labor market with a unionized and a competitive sector and two typesof workers, low skilled and high skilled; high skilled workers are entrepreneursin their model. In the competitive sector, the earnings of low skilled work-ers and entrepreneurs equal their marginal productivities, whereas there isNash-bargaining in the unionized sector. Fuest and Thum (2001) find that,with educational adjustment, immigration does not affect native welfare, un-less the degree of unionization changes. The argument behind this is thefollowing: The educational choice implies that the expected incomes of highand low skilled people are the same and educational adjustment implies thatimmigration does not change these incomes. For the case that immigrationdecreases the degree of unionization, they find a positive effect on nativewelfare. This is due to the fact that a decrease in the degree of unionizationleads to a redistribution of income from workers to entrepreneurs and all en-trepreneurs are natives. Unlike the present paper, Fuest and Thum (2001) do
Chapter 3: Educational Choice and Immigration Surplus 45
not model an education market, but use fixed education costs. They assumethat education costs affect the education decision of natives but not nativewelfare.4
Lumpe and Weigert (2009) analyze the effects of high skilled immigrationin a search-theoretic framework. They find that it increases the averageeducational level of natives. Considering their modeling of the labor market,this result is not surprising. They assume that workers with different skilllevels are perfect substitutes. Skill differences between workers are perfectlycompensated by wage differences. The profits of a firm employing a workerincrease with the worker’s skill level. But by assumption, firms cannot selecthigh skilled workers. Instead, they rely on hiring of the next best workers.In this environment, the gain that a firm may expect from a job offer isincreasing in the average level of skills in the labor force. Thus, an increasein the average educational level due to high skilled immigration leads to adisproportional increase in the number of job offers. This, in turn, lowersfor all individuals the probability of becoming unemployed, independently oftheir skill levels. If unemployment benefits remain unchanged,5 this amountsto an increase in the expected wages for natives. Finally, the higher expectedwage rate creates an enhanced incentive to undergo education.
On the empirical side, Ramcharan (2002) analyzes empirically the effect ofimmigration on the increase in college education in the US in the early 20th-century. In states with large inflows of low skilled immigrants from Europe,the number of college students increased earlier than in others. Ramcharan’sestimations indicate that there is a causal relation.
In this paper, I look at anticipated immigration in a two-period over-lapping generations model. The young generation does not work, but may
4An additional weak point of their paper is that high skilled income differs over the twosectors. The share of high skilled workers in each sector is set fixed. With skill adjustment,it is not plausible that the additional high skilled workers do not change the distributionover sectors.
5Lumpe and Weigert (2009) has a weak point in the handling of unemployment benefits(and education subsidies). It does not model a budget constraint and consequently allowsfor unlimited deficit spending.
Chapter 3: Educational Choice and Immigration Surplus 46
engage in education which, in turn, requires high skilled labor input of theold generation. Individuals differ in terms of innate abilities that determinethe required educational effort for an individual to enter the next period asa skilled worker. Given the wage profile for high and low skilled workers,this determines a cut-off level of abilities separating individuals who undergoeducation from those who enter the next period as unskilled workers. Theability distribution across individuals then determines the skill compositionof the work force in the next period. The cost of education consists of wagespaid to high skilled teachers. The young generation pays for this cost whenentering the labor force in the next period. In equilibrium, these paymentsmust be equal to the educational investment made by the following younggeneration. I assume frictionless labor markets, hence wages reflect marginalproductivities of high and low skilled workers, respectively. The economy isassumed to produce a single final good, whereby the two types of workersare imperfect substitutes in production.
In this framework, natives’ expectations about future immigration deter-mine the threshold level that an individual needs to surpass for education tobe worthwhile. High skilled immigration increases low skilled wages and de-creases high skilled wages. Thus, the expectation of high skilled immigrationmoves the threshold to the left, so that less natives acquire high skills. Thisadjustment reduces the traditional immigration surplus, which is based oncomplementarities between natives and immigrants. Nevertheless, the wel-fare effect of high skilled immigration still tends to be positive. The sameholds for low skilled immigration. The expectations of young natives aboutfuture immigration do not necessarily coincide with the ultimately realizedinflow of people. As the expectations affect the threshold level for the ed-ucational decision of young natives, they affect native welfare. The higherexpected immigration relative to realized immigration, the lower native wel-fare.
In developed countries, labor markets are generally not frictionless. There-fore, I introduce a minimum wage in the model to check for the stability ofthe results. With respect to high skilled immigration, the results from themodel with a frictionless labor market are confirmed. An adjustment of the

Chapter 3: Educational Choice and Immigration Surplus 47
native educational structure still reduces the immigration surplus. If ex-pected immigration exceeds the ultimately realized immigration, a welfareloss can be the consequence of the adjustment. Low skilled immigration doesnot affect the native educational structure and has an unambiguous negativeeffect on native welfare. Thus with frictions on the labor market, the resultsfrom the perfect labor market still tend to hold for people who are only in-directly affected by the frictions, whereas they do not hold for people whoare directly affected. The paper is organized in the following way: In thesecond section, the baseline model is derived. In section 3.3, I analyze howan adjustment of the native education structure to (expected) immigrationaffects native welfare. In section 3.4, a minimum wage is introduced andsection 3.5 concludes.
3.2 Model setup
My analysis is based on a simple overlapping generations model. At eachpoint in time the population consists of two cohorts: young individuals ineducation and working age individuals in the labor market.6 When the in-dividuals are young, cohort t consists of a continuum i ∈ [0, 1] of nativeindividuals with mass N(t). When they are in the labor market, a massMH(t) high skilled and a mass ML(t) low skilled immigrants adds to the na-tive workforce. Subsequently, generations are dated such that N(t) denotesthe native generation born at the beginning of period t − 1. In t − 1, whenthey are young, natives have to decide either to acquire high skills or to staylow skilled. At this point in time, they are all uneducated. In making thisdecision, they maximize their future income less the education costs. In do-ing so, they know the working mechanisms of the labor market, their owninnate ability and the innate abilities of all other natives. The only thingthey cannot perfectly foresee at this stage is future immigration. Thus, theyhave to base their education decision on expectations about it.
6Adding a cohort of old people would have no influence on the results.

Chapter 3: Educational Choice and Immigration Surplus 48
To acquire high skills, young natives need teaching. For low skills, noschooling is necessary.7 The amount of teaching that an individual i needsto acquire high skills depends on her innate ability a(i); the higher innateability, the less educational input is necessary. I define the amount of teachingthat an individual needs to acquire high skills as s(i) = s[a(i)] with s′ <
0. s is measured in units of educational input, provided by high-skilledpeople (teachers). To keep the model tractable, I have to make some furthersimplifying assumptions on a and s. The continuum of native individuals i ∈[0, 1] is ranked according to innate ability, so that a′(i) > 0 holds. Dependingon the rank of an individual i, the functional form a(i) = i is assumed forinnate ability. For the necessary educational input to become high skilled,the functional form s(i) = 1 − a(i) = 1 − i is assumed. The innate abilitiesa(i) of natives in cohort t are uniformly distributed over the interval [0; 1].Thus, for the cumulative distribution function (cdf) of the innate abilitiesG(a), which measures the percentage of individuals with ability a or lower,G(a) = a holds. As s(i) = 1 − a(i), s is also uniformly distributed over theinterval [0; 1] with cdf K(s) = s.
It does not pay for all young natives to acquire high skills. For indi-viduals with a low level of innate ability, the individual education costs arelarger than the (discounted) difference between high an low skilled incomes.I define the cutoff-level of innate abilities for which education costs equal thedifference between high and low skilled income in cohort t as a∗(t). a∗(t) sep-arates individuals i for whom a(i) < a∗(t) holds, i.e. who are born in periodt − 1 and remain uneducated, from those who obtain education. With theassumed functional form of s(a), the share of people undergoing educationis 1 − a∗. I write i∗(t) for the solution to a(i) = a∗(t), i.e., i∗(t) = a∗(t),and s∗(t) = 1 − a∗(t) = 1 − i∗(t). Thus, from the N(t) natives in cohortt, the fraction a∗(t) = i∗(t) remains uneducated, while 1 − a∗(t) = 1 − i∗(t)decides to become educated. If i∗(t) is known, one can calculate the teaching
7In developed countries, not even a low educational level is reached without teaching.Nevertheless, assuming uniform teaching requirements for all individuals to acquire a loweducational level does not change the results.
Chapter 3: Educational Choice and Immigration Surplus 49
demand in the immigration country in period t− 1 as
N(t)
∫ i∗(t)
0
s(i)di =[s∗(t)]2
2N(t). (3.1)
Notice that, with a uniform ability distribution, s(i) = 1−i and s∗(i) = 1−i∗
hold.
To keep the model tractable, I assume that the amount of schooling ofan individual s(i) does not affect the time she is active in the labor market.Schooling only affects intensity of education. Low skilled individuals do notspend more time on the labor market than high skilled.8 This means, thatthe young generation born in t − 1 is either taking education, or else doingnothing. We can also assume, without altering the model in an importantway, that these individuals engage in some “autarcic” subsistence activity.High skilled immigrants acquire their skills abroad. High and low skilledimmigrants arrive in period t and start working right away. Thus, overalllow and high skilled labor supply are equal to
L(t) = a∗(t)N(t) +ML(t) (3.2)
H(t) = [1− a∗(t)]N(t) +MH(t) = HP (t) +HE(t). (3.3)
From the high skilled labor force, HE(t) individuals are engaged in teaching,and HP (t) are engaged in production. Note that HE(t) denotes high-skilledteachers educating generation N(t+ 1).
Teaching of cohort t takes place in period t − 1. Teaching technologyis such that one unit of teaching for cohort t requires 1/S units of high-skilled labor of cohort t−1, namely teachers educated in the previous period.
8Most other papers assume that the teaching intensity for high and low skilled peopledoes not differ, but that high skilled people enter the labor market later than low skilledpeople. Dropping the assumption that all individuals of one cohort enter the labor marketat the same time would enormously complicate our model. As the necessary schoolingfor a high educational level differs over individuals, the cohort structure would becomeinscrutable. Even teacher and student could then belong to the same cohort. Not beingable to use different education times is a disadvantage of my model. However, in exchangeit allows me to consider the education market explicitly.

Chapter 3: Educational Choice and Immigration Surplus 50
High skilled people can freely choose between doing teaching or working inproduction, so that the wage of teachers equals the wage of high skilledworkers in production: it is given by wH(t). Thus, schooling cost for anindividual of cohort t with ability i is equal to
c(i, t) = wH(t− 1)[1− a(i)]
S. (3.4)
For the marginal individual in t, schooling cost is
c∗(t) = wH(t− 1)s∗(t)
S. (3.5)
As cohort t consists of N(t) natives, the aggregate expenditure on educationin period t− 1 is equal to
E(t− 1) = wH(t− 1)[s∗(t)]2
2SN(t). (3.6)
In addition, equilibrium on the education market requires that
HE(t− 1)S =[s∗(t)]2
2N(t). (3.7)
High skilled individuals have to finance their education on their own. Asnatives do not have an income until they enter the labor market, I assumethat education is financed through borrowing. Thus, an individual of cohortt with ability i undergoing education in period t−1 will have to pay c(i, t)r(t)for education in period t.
Apart from education, I assume a single good with a constant returnsto scale production function Y (t) = F (HP (t), L(t), X1(t), . . . , Xj(t)), whichfulfills the Inada conditions.9 Besides high and low skilled labor, there areother production factors X that are not further specified and whose supply isfixed. At this stage, I assume perfect labor markets. Thus, all input factorsare compensated according to their marginal productivities. In section 3.4, I
9As not necessarily implied by the Inada conditions, ∂2F/∂Hft∂Lt > 0 is additionallyassumed.
Chapter 3: Educational Choice and Immigration Surplus 51
relax the assumption of perfect labor markets and introduce a minimum wagein the model. Assuming perfect labor markets, the existence of further pro-duction factors X besides labor has no effect on the analysis. However, theirexistence substantially alters the results when a minimum wage is present.
For the goods market equilibrium to hold in my model, relatively restric-tive assumptions on r(t) are necessary. As high skilled individuals have torepay educational credits, they can only spend wH(t)H(t)− r(t)E(t− 1) forgoods. Thus the goods market equilibrium is given by:
Y (t) = wH(t)HP (t)+wL(t)L(t)+∑j
wxj(t)Xj(t)+wH(t)HE(t)−r(t)E(t−1).
(3.8)By Euler’s homogeneous function theorem, output has to equal the sum ofthe input factors weighted with their marginal productivities. Thus
wH(t)HE(t) = r(t)E(t− 1)⇔ r(t) =wH(t)HE(t)
E(t− 1)(3.9)
has to hold. Noting (3.6) and (3.7), we can write
r(t) =wH(t)
wH(t− 1)
HE(t)
HE(t− 1)=
wH(t)
wH(t− 1)
[s∗(t+ 1)
s∗(t)
]2N(t+ 1)
N(t). (3.10)
Thus, r(t) reflects the aggregate growth of teachers’ income, or equivalently,the aggregate growth of educational expenditure.
Mechanically, the variable r(t) can be seen as something like a goodsmarket clearing relative price, or an educational cost-premium that ensuresequilibrium in the goods market. There are two alternative intuitive interpre-tations of this equation. One is to say that “savings” of high skilled people inperiod t, educated in period t−1, must finance educational investment madein period t. These investments depend on the educational margin s∗(t + 1)
chosen by cohort t + 1, born in t, and on the cost of education in period t,which in turn depends on the teachers’ wage wH(t) and their productivityS(t). We can also borrow from the terminology of financing old age pensionsystems by calling this a “reverse pay as you go” system of financing edu-cation: In period t, the old, working age generation finances the education

Chapter 3: Educational Choice and Immigration Surplus 52
undertaken by the young cohort who is educated then. There is a positiveexternality that the marginal individual exerts on all individuals who willend up educated in period t: By enhancing the aggregate savings of periodt, an expansion of s∗(t) would reduce the educational cost premium impliedby the “reverse pay as you go” system.
In the following, I analyze the educational decisions of cohort t, who de-cides on education in period t− 1 and who is active on the labor market int. For this analysis, it is crucial what information is available to individu-als in period t− 1 and how they build expectations about unknown factors.I assume, of course, that they have full information on the cost of an ed-ucational input which is equal to wH(t− 1)/S. I also assume that eachindividual knows her ability a(i) and the abilities of all other native individ-uals. Moreover, young natives know the working mechanisms of the labormarket, the functional form of F (. . .) and that wages equal the marginalproducts of labor. However, in period t− 1 they have no information on im-migration inflows in t. Thus, they have to build expectations about it. Theseare given by M e
H(t) and M eL(t), with superscript e indicating that values are
based on expectations in period t − 1 about unknown period t values. Asproduction and wages are affected by the labor supply of immigrants in t, theinformation that young natives have on them in t − 1 are also based on ex-pectations. The education criterion for young natives to become high skilledis weH(t) − re(t)c(i, t) ≥ weL(t). All individuals with an ability that ensuresthis inequality will take out education, while the rest remains uneducated,since the return to education would not cover their costs.
For the individual at the (educational) margin, acquiring high skills andstaying low skilled has to lead to the same future welfare. Thus, the cut-offvalue of innate ability a∗(t) that individuals of cohort t must surpass in orderto find education worthwhile is determined by
weH(t)− re(t)wH(t− 1)
S[1− a∗(t)] = weL(t) (3.11)

Chapter 3: Educational Choice and Immigration Surplus 53
where (3.5) was inserted for c∗(t). This leads to
s∗(t) = 1− a∗(t) =weH(t)− weL(t)
wH(t− 1)
S
re(t). (3.12)
r(t) does not only depend on period t variables but also on variables fromperiod t+1, namely s∗(t+1) and N(t+1). We assume that young individualshave no information on period t+ 1 and expect these factors to be constantover time after period t. Thus, s∗e(t + 1) = s∗(t) and N e(t + 1) = N(t).(3.10) simplifies to r(t) = wH(t)/wH(t− 1) and (3.12) becomes
s∗(t) = 1− a∗(t) =
[1− weL(t)
weH(t)
]S. (3.13)
The effect of immigration on native education may now be derived bytotally differentiating the following system of equations:
s∗(t) =
[1− weL(t)
weH(t)
]S (3.14)
weL(t) = FL[HeP (t), Le(t)] (3.15)
weL(t) = FH [HeP (t), Le(t)] (3.16)
HeP (t) = M e
H(t) +N(t)
[[s∗(t)]− [s∗(t)]2
2S
](3.17)
Le(t) = [1− s∗(t)]N(t) +M eL(t) (3.18)
Note that in (3.17) we have replaced s∗(t + 1) = s∗(t). (3.17) incorporatesequilibrium on the teachers market, given by (3.7).
Proposition 1. The expectation of high skilled immigration leads to a de-crease in the share of high skilled natives. The expectation of low skilledimmigration increases it.
Proof. Rewriting (3.14) as s∗(t)weH(t) = (weH(t)− weL(t))S and totally dif-ferentiating it leads to
[weH(t)ds∗(t) + s∗(t)dweH(t)] = [dweH − dweL]S (3.19)

Chapter 3: Educational Choice and Immigration Surplus 54
with
dHeP (t) = dM e
H(t) +
[1− s∗(t)
S
]N(t)ds∗(t) (3.20)
dLe(t) = −N(t)ds∗(t) + dM eL(t) (3.21)
dweL = FLLdLe(t) + FLHdHeP (t) (3.22)
dweH = FHLdLe(t) + FHHdHeP (t) (3.23)
Inserting (3.21)-(3.23) into (3.19) and setting dM eL(t) = 0 we find:
ds∗(t)dM e
H(t)=
(S − s∗(t))FHH − SFHLweH(t)−N(t)[ (S−s∗(t))2
SFHH − 2(S − s∗(t))FHL + SFLL]
(3.24)
Setting dM eH(t) = 0 leads to:
ds∗(t)dM e
L(t)=
(S − s∗(t))FHL − SFLLweH(t)−N(t)[ (S−s∗(t))2
SFHH − 2(S − s∗(t))FHL + SFLL]
(3.25)
Intuitively, proposition 1 is fairly straightforward: Anticipated additionalhigh-skilled migration raises weL(t)/weH(t), and from (3.14) this provides adirect incentive for the marginal individual to abstain from education. Thisthen has an opposing effect on future endowments and wages, which restoresequilibrium with a lower s∗(t). For changes in anticipated low-skilled immi-gration, the argument is analogous. Nevertheless, assuming perfect substi-tutability between low and high skilled labor, proposition 1 would not holdany more. The cutoff-ability level a∗(t) would then be given by the relativeproductivity of low skilled labor compared to high skilled labor (see (3.13)).
3.3 Welfare effects of the educational adjust-ment
The effects of (expected) immigration in period t on native welfare of cohortst−1 and t is summarized in lemma 1. Native welfare equals total production

Chapter 3: Educational Choice and Immigration Surplus 55
less the wage sum paid to immigrants. A change in expected high (low) skilledimmigration in t can be connected with a change in ultimately realized high(low) skilled immigration. However, this is not necessarily the case and theextents can differ. I capture this by writing εH and εL for the ratios of actualto anticipated immigration of the two types of labor. If natives correctlyanticipate future immigration, εH = εL = 1 holds. For εH = εL = 0, noimmigration takes place in the end.
Lemma 1. The effects of expected high and low skilled immigration in periodt on native welfare W in periods t− 1 and t are given by:
∂W (t− 1)
∂M eH(t)
= − [wH(t− 1)− FHHMH(t− 1)− FHLML(t− 1)]
×s∗(t)
SN(t)
∂s∗(t)
∂M eH(t)
, (3.26)
∂W (t− 1)
∂M eL(t)
= − [wH(t− 1)− FHHMH(t− 1)− FHLML(t− 1)]
×s∗(t)
SN(t)
∂s∗(t)
∂M eL(t)
, (3.27)
∂W (t)
∂M eH(t)
= − [FHHMH(t) + FHLML(t)− FHLMH(t)− FLLML(t)]
×N(t)∂s∗(t)
∂M eH(t)
+ [wH(t)− wL(t)]N(t)∂s∗(t)
∂M eH(t)
− [FHHMH(t) + FHLML(t)] εH , (3.28)∂W (t)
∂M eL(t)
= − [FHHMH(t) + FHLML(t)− FHLMH(t)− FLLML(t)]
×N(t)∂s∗(t)
∂M eL(t)
+ [wH(t)− wL(t)]N(t)∂s∗(t)
∂M eL(t)
− [FHLMH(t) + FLLML(t)] εL (3.29)
Proof. The proof is given in Appendix A.
From lemma 1, several propositions can be deduced. First, the effect of(additional) immigration on native welfare without educational adjustmentis non-zero and depends on the structure of the immigrant population. If nolow (high) skilled immigrants are already in the country, the effect of high(low) skilled immigration is positive.

Chapter 3: Educational Choice and Immigration Surplus 56
Proposition 2. Without adjustment of the native educational structure, theeffect of (additional) high skilled immigration on native welfare is positive, ifMH(t) > − FHL
FHHML(t). For MH(t) < − FHL
FHHML(t), it is negative. The effect
of (additional) low skilled immigration is positive, if ML(t) > −FHLFLL
MH(t).
Proof. Without educational adjustment, immigration does not affect theshare of high skilled natives, ∂s∗(t)
∂MeH(t)
= ∂s∗(t)∂Me
L(t)= 0, and cohort t − 1 is not
affected by the immigration. Hence, the overall welfare effect W ∗(t) equalsthe welfare effect in t, W (t). Moreover, εH = 1 (εL = 1) holds, as realizedimmigration is analyzed. From lemma 1, the welfare effect of additional high(low) skilled immigration is thus given by:
∂W ∗(t)
∂MH(t)=
∂W (t)
∂MH(t)= −FHHMH(t)− FHLML(t) (3.30)
∂W ∗(t)
∂ML(t)=
∂W (t)
∂ML(t)= −FLLML(t)− FHLMH(t) (3.31)
∂W ∗(t)∂MH(t)
is larger than zero, ifMH(t) > − FHLFHH
ML(t) holds; ∂W∗(t)
∂ML(t)is larger than
zero, if ML(t) > −FHLFLL
MH(t) holds.
The traditional “immigration surplus” is only an inframarginal concept.It compares native welfare without immigrants with native welfare with acertain number of immigrants of one educational type. In inframarginalanalyses, a positive effect is generally found, whereas at the margin no effectoccurs. Setting MH(t) = ML(t) = 0, this zero effect is also present in (3.30)and (3.31). As shown in Appendix B, −FHH(MH(t))2 is a reasonable, strictlyovervaluing, approximation for the immigration surplus ∆W ∗(t). To relatethis to proposition 2, consider that ∆MH(t) = MH(t). Thus, with the resultsfrom proposition 2 (and the further propositions) an upper bound for theinframarginal effects can be derived.
The effects of educational adjustment can also be derived from lemma 1.As summarized in proposition 3, educational adjustment primarily leads to aredistribution of native welfare between cohort t, who is active on the labormarket when the immigrants arrive, and cohort t − 1, who is active in thepreceding period and who provides the teachers for cohort t. Cohort t − 1

Chapter 3: Educational Choice and Immigration Surplus 57
gains from the expectation of high skilled immigration in t, whereas cohortt suffers a welfare loss. The expectation of low skilled immigration has theoppositive effect: Cohort t profits and of t− 1 looses.
Proposition 3. An adjustment of the native education structure to (ex-pected) high skilled immigration in t increases native welfare in t − 1, aslong as ML(t − 1) < κ(MH(t − 1)) holds. It decreases native welfare int, if ML(t) < ν (MH(t)). An adjustment of the native education structureto (expected) low skilled immigration in t decreases native welfare in t − 1,as long as MH(t − 1) < κ′(ML(t − 1)). It increases native welfare in t, ifMH(t) < ν ′(ML(t)).
Proof. An adjustment to expected high (low) skilled immigration leads to awelfare gain (loss) in t − 1, as long as ML(t − 1) < wH(t−1)−FHHMH(t−1)
FHL(t−1)=
κ(MH(t − 1)) ⇔ MH(t − 1) < wH(t−1)−FHLML(t−1)FHH(t−1)
= κ′(MH(t − 1)). Underthis condition, the term in brackets in (3.26) and (3.27) is larger than zeroand the signs of the welfare effects are given by − ∂s∗(t)
∂MeH(t)
and − ∂s∗(t)∂Me
L(t).
Expected immigration leads to a direct welfare effect in t through theincrease in production and to an indirect welfare effect through educationaladjustment. In (3.28) and (3.29), the direct welfare effects are given by theterms which include εH and εL. The effects of educational adjustment aregiven by ∂s∗(t)
∂MeH(t)
, ∂s∗(t)
∂MeL(t)
and the factors in front. For expected high skilledimmigration, the effect of educational adjustment is negative, as long as
ML(t) <wH(t)− wL(t)
(FHL − FLL)N(t)+FHL − FHHFHL − FLL
MH(t) = ν (MH(t))
holds. Analogously, as long as
MH(t) <wH(t)− wL(t)
(FHL − FHH)N(t)+FHL − FLLFHL − FHH
ML(t) = ν ′ (ML(t)) ,
the effect of educational adjustment to low skilled immigration is positive.
Proposition 3 shows that educational adjustment to high skilled immi-gration leads only to a real redistribution between the cohorts t − 1 and t,if the stocks of low skilled immigrants in the two cohort are not too large.

Chapter 3: Educational Choice and Immigration Surplus 58
Analogously, low skilled immigration leads only to a real redistribution, if thestocks of high skilled immigrants are not too large. The rationale behind thisis simple. Assume that, in t− 1 and t, large stocks of low skilled immigrantsare in the country. Cohort t − 1 should profit from educational adjustmentdue to an increase in goods production. However, the welfare increase is notequally shared between high and low skilled people. Due to the adjustmentof the wage structure, only low skilled people actually gain, but high skilledpeople lose. If the share of low skilled immigrants is too large, the wholewelfare increase flows off into the wages of low skilled immigrants. Analo-gously, if the stock of low skilled immigrants in t is too high, the decrease inwelfare in t is to a great extent borne by them. Native welfare even increasesdue to the increase in high skilled wages. In the real world, this redistribu-tion between natives and incumbent immigrants may play a role. However,the number of incumbent immigrants is normally not large enough that areversion of the welfare effects is feasible.
Lemma 1 also allows us to get insights about the overall welfare effects ofimmigration (or the expectation about it) taking into account the adjustmentof the educational structure of natives. However, we need an idea how welfarechanges in cohorts t − 1 and t should be aggregated. This is not trivial, asdifferent individuals are concerned. For the aggregation, I use an interest /time preference rate of δ to transform values from t − 1 to t. In a situationwithout immigration, δ corresponds to r (in this case r is one, if cohort sizesdo not change over time). However, in contrast to r, δ does not react toimmigration. There is no plausible argument why immigration should affectthe weight that is given to the welfare of cohort t− 1 compared to welfare ofcohort t.
Aggregating the welfare effects of the two cohorts, the overall effect ofan adjustment of the native educational structure to immigration can beanalyzed. For this purpose, the case with only one type of immigration int, no immigration in t − 1 and perfect anticipation of immigration is con-sidered. In this setting, educational adjustment reduces the positive effectof immigration on native welfare. As this setting is a good approximationfor the “traditional” immigration surplus (see above), this implies that the

Chapter 3: Educational Choice and Immigration Surplus 59
“traditional” immigration surplus is also reduced.
Proposition 4. ForMH(t−1) = ML(t−1) = 0, ML(t) = 0 (MH(t) = 0) andδ = r(t), an adjustment of the educational structure of natives to correctlyanticipated future high (low) skilled immigration decreases the positive welfareeffect of this immigration.
Proof. Under the conditions in the proposition, the effect of high skilledimmigration on overall native welfare W ∗(t) can be written as:
∂W ∗(t)
∂MH(t)= −FHHMH(t)− [FHHMH(t)− FHLMH(t)]N(t)
∂s∗(t)
∂MH(t)
+
[wH(t)− δwH(t− 1)
s∗(t)
S− wL(t)
]N(t)
∂s∗(t)
∂MH(t)(3.32)
By (3.13), the term in the second row is zero for δ = r(t) . The first term inthe first row equals the welfare effect without adjustment of the educationstructure, see proposition 2. The second term gives the additional effect ofthe adjustment. As FHH < 0,−FHL < 0 and ∂s∗(t)
∂MH(t)< 0, it is negative.
Analogously, the effect of low skilled immigration is given by
∂W ∗(t)
∂ML(t)= −FLLML(t) + [FLLML(t)− FHLML(t)]N(t)
∂s∗(t)
∂ML(t)
+
[wH(t)− δwH(t− 1)
s∗(t)
S− wL(t)
]N(t)
∂s∗(t)
∂ML(t).(3.33)
The second bracket is again zero and the term in the first bracket is negative.Thus, educational adjustment lowers the welfare effect.
From (3.32), the overall welfare effect of high skilled immigration is givenby:
−FHH − [FHH − FHL]N(t) ∂s∗(t)∂MH(t)
(3.34)
The sign of (3.34) is ambiguous. It depends on the reaction of low skilledwages to changes in high skilled labor FHL; for FHL → 0, the welfare effectis positive. Inserting (3.24) into (3.34), setting FHL = 0 and S = 1 and

Chapter 3: Educational Choice and Immigration Surplus 60
simplifying it leads to:
− (1− s∗(t))(FHH)2
wH(t)N(t)− (1− s∗(t))2FHH − FLL
− FHH > 0
wH(t)N(t)− (1− s∗(t))FHH − FLL−(1− s∗(t))FHH
> 0 (3.35)
The overall welfare effect of low skilled immigration is given by:
−FLL + [FLL − FHL]N(t)∂s∗(t)
∂ML(t)(3.36)
As the effect of high skilled immigration, it depends on FHL, which is also thereaction of high skilled wages to changes in low skilled labor. For FHL → 0,the welfare effect is again positive; inserting (3.25) into (3.36) and settingFHL = 0 and S = 1 leads to:
− (FLL)2
wH(t)N(t)− (1− s∗(t))2FHH − FLL
− FLL > 0
wH(t)N(t)− (1− s∗(t))2FHH
−FLL> 0 (3.37)
The inequality holds, as FHH < 0 and FLL < 0.
The expectations of young people about future immigration need notequal the immigration that is ultimately realized. If the expected inflow ofhigh or low skilled people is smaller than the realized inflow, the positivewelfare effect of immigration increases;10 otherwise, educational adjustmentwould not lower the gains from immigration. If it exceeds realized immi-gration, the welfare effect of immigration decreases and ultimately becomesnegative. Proposition 5 shows that an increase in expected immigration thatis not accompanied by an increase in realized immigration has a negativewelfare effect. This implies that, for a given level of realized immigration,
10As above, it is assumed that no immigrants of the respective other type are in thecountry. Otherwise, changes in the wage sum of incumbent immigrants can affect theresult.

Chapter 3: Educational Choice and Immigration Surplus 61
the higher the expected immigration, the lower the welfare gain.
Proposition 5. If realized high skilled immigration does not change (εH = 0)and MH(t − 1) = ML(t − 1) = ML(t) = 0 and δ = r(t) hold, an increase inexpected high skilled immigration reduces native welfare. If εL = 0, MH(t −1) = ML(t−1) = MH(t) = 0 and δ = r(t), an increase in expected low skilledimmigration reduces native welfare.
Proof. For high skilled immigration, the welfare effect of an increase in ex-pected immigration that is not realized is given by:
∂W ∗(t)
∂M eH(t)
= − [FHHMH(t)− FHLMH(t)]N(t)∂s∗(t)
∂M eH(t)
+ [wH(t)− δwH(t− 1)s∗(t)− wL(t)]N(t)∂s∗(t)
∂M eH(t)
.(3.38)
Both terms on the right hand side are smaller than zero. As to the firstterm, this is obvious, as ∂s∗(t)
∂MeH(t)
< 0. As to the second term, it results as theterm in brackets is positive. Replacing the realized wages by the expectedwages, the bracket would be zero, as in proposition 4. As ∂weH(t)
∂MeH(t)
< ∂wH(t)∂Me
H(t)
and ∂weL(t)
∂MeH(t)
> ∂wL(t)∂Me
H(t)the term in brackets is larger than zero.11 The expected
high skilled immigration decreases the number of low skilled natives so muchthat some young natives who decide for a low skill level could improve theirlifetime welfare acquiring high skills. Analogously, the effect of expected lowskilled immigration that is not realized is given by
∂W ∗(t)
∂M eL(t)
= [FLLML(t)− FHLML(t)]N(t)∂s∗(t)
∂M eL(t)
+ [wH(t)− δwH(t− 1)s∗(t)− wL(t)]N(t)∂s∗(t)
∂M eL(t)
. (3.39)
As ∂weH(t)
∂MeL(t)
> ∂wH(t)∂Me
L(t)and ∂weL(t)
∂MeL(t)
< ∂wL(t)∂Me
L(t), both terms in brackets on the right
hand side are smaller than zero.
11 ∂weH(t)
∂MeH(t) = (F e
HH − F eHL)N(t) ∂s∗(t)
∂MeH(t) +F e
HH(t) < ∂wH(t)∂Me
H(t) = (FHH − FHL)N(t) ∂s∗(t)∂Me
H(t) ,∂we
L(t)∂Me
H(t) = (F eHL − F e
LL)N(t) ∂s∗(t)∂Me
H(t) + F eHL < ∂wL(t)
∂MeH(t) = (FHL − FLL)N(t) ∂s∗(t)
∂MeH(t)
Chapter 3: Educational Choice and Immigration Surplus 62
Altogether, educational adjustment reduces the immigration surplus inperfect labor markets. However, the effect of immigration on native welfareis still positive in most cases. If young natives do not perfectly foresee futureimmigration, their expectations have a substantial effect on future nativewelfare. Independently of the realized immigration, an increase in expectedhigh or low skilled immigration lowers native welfare. If no immigration isultimately realized, the expectation of immigration unambiguously reducesnative welfare. Nevertheless, all these results rely on the assumption thatthe stock of the respective other group of immigrants is small. If this stockis large, changes in the wage sum of incumbent immigrants can reverse theeffects of (additional) immigration on native welfare.
3.4 Welfare effects with a minimum wage
In the real world, labor markets are not frictionless. In particular, developedcountries generally have institutions that ensure a certain minimum income.These institutions are always justified by humanity, but the organizationand the minimum income level vary vastly between countries. Labor marketfrictions can fundamentally change the welfare effects of immigration; forinstance, if there is a minimum wage that is binding for low skilled workers,low skilled immigration leads to a welfare loss (see Brecher and Choudhri,1987). To get an idea in how far the results in the preceding sections dependon the assumption of frictionless labor markets, I introduce a minimum wagein my model. Other labor market frictions, as efficiency wages and searchexternalities, can also influence the welfare effects of immigration. However,as a minimum wage is one of the strongest labor market frictions in the realworld, I concentrate on this issue
Introducing a minimum wage w(t) in my model makes some additionalassumptions necessary. The minimum wage is exogenously given and doesnot react to changes in the labor market. It is never binding for high skilled

Chapter 3: Educational Choice and Immigration Surplus 63
and always binding for low skilled labor.12 Thus,
w(t) =∂F (He
P (t), LeP (t), X1(t), . . . , Xj(t))
∂LeP (t)
=∂F (HP (t), LP (t), X1(t), . . . , Xj(t))
∂LP (t)(3.40)
with LP (t) denoting the number of employed low skilled workers.
When the number of high skilled workers increases, low skilled employ-ment increases. Nevertheless, high skilled wages still adjust downward. Thiscan be shown using the Euler equation. It is given by:
Y (t) = F (HP (t), Lp(t), X1(t), . . . , Xj(t))
= wH(t)HP (t) + wtLP (t) +∑j
wxj(t)Xj(t); (3.41)
The last two terms from (3.8) are not considered, as (3.9) still has to hold. Asthe Euler equation holds for all combinations of input factors, the derivativeswith respect to HP (t) of the left and right hand side have also to be equal.These derivatives are given by:
wH(t) + w(t)HP (t)
LP (t)=
(∂wH(t)
∂HP (t)+∂wH(t)
∂LP (t)
∂LP (t)
∂HP (t)
)HP (t) + wH(t)
+w(t)HP (t)
LP (t)+∑j
∂wxj(t)
∂HP (t)Xj(t) (3.42)
As long as there are other production factors than labor whose prices reactto changes in high skilled labor (∂wxj(t)
∂HP (t)> 0), an increase in high skilled labor
leads to a decrease in high skilled wages, w′H(t) =(∂wH(t)∂HP (t)
+ ∂wH(t)∂LP (t)
∂LP (t)∂HP (t)
)<
0, although low skilled labor increases ( ∂LP (t)∂HP (t)
> 0).13
Moreover, I assume that unemployment benefits equal the minimum wage.
12Without this assumption, a confusing multitude of cases would have to be analyzed.13If high and low skilled labor are the only production factors, high skilled wages do not
change,(
∂wH(t)∂HP (t) + ∂wH(t)
∂LP (t)∂LP (t)∂HP (t)
)= 0.

Chapter 3: Educational Choice and Immigration Surplus 64
To keep the state budget balanced, I additionally have to introduce a (rudi-mentary) tax system in the model. As I am not interested in distortions viathe tax system, I use a lump-sum tax which is only paid by natives. Thus,high skilled immigration should not lead to a fiscal externality. From thestate budget constraint, the tax in t, τ(t), is given by:
τ(t) =w(t) (L(t)− LP (t))
N(t)(3.43)
τ(t) adjusts to changes in unemployment and the number of tax payers,whereas w(t) is fixed. Modeling a tax system would not be necessary ifzero income for unemployed individuals was assumed. However, in devel-oped countries that apply minimum wages, unemployed people generally havesome form of income (e.g. social assistance). In addition, many countries donot apply direct minimum wages but have social assistance programs thatwork as indirect minimum wages.14 Therefore, to draw conclusions for thereal world, unemployed individuals should also have an income in the model.As it affects the expected income of low skilled individuals, the choice of theincome of unemployed is not trivial for the model.
The modeling of the choice of an individual between acquiring high andlow skills in section 3.2 still holds; nevertheless, weL(t) now equals w(t).15
As shown in proposition 6, expected high skilled immigration still leads to adecrease in the number of high skilled natives. Expected low skilled immigra-tion does not affect the education decision of natives. Due to the minimumwage, additional low skilled workers do not lead to more low skilled labor inproduction, but only to more benefit recipients. Thus, low skilled immigra-tion does not affect high skilled wages.16
Proposition 6. In the presence of a minimum wage, high skilled immigration
14Profit-maximizing individuals are not willing to work for wages below the social assis-tance.
15Assuming no income for unemployed, weL(t) = LP (t)
L(t) w(t) would hold.16With zero income for low skilled people, low skilled immigration would increase the
share of high skilled, as low skilled immigration leads to a decrease in LP (t)L(t) .

Chapter 3: Educational Choice and Immigration Surplus 65
still decreases the share of high skilled natives.
Proof. The educational cutoff-equation with a minimum wage is:
S (weH(t)− w(t))− s∗(t)weH(t) = 0 (3.44)
Implicit differentiation of (3.44) leads to:
∂s∗(t)
∂M eH(t)
= − w′H(t− 1) (S − s∗(t))w′H(t− 1)N(t) (S − s∗(t))− SweH(t)
< 0 (3.45)
The effect of low skilled immigration on native welfare is trivial. As itdoes not increase production, each additional low skilled individual leads toa loss of w(t).17 Therefore in the following, only the welfare effects of highskilled immigration are analyzed. The effect of high skilled immigration onnative welfare of cohorts t and t− 1 is derived and summarized in lemma 2.
Lemma 2. The effect of high skilled immigration in t on native welfare int− 1 and t is given by:
∂W (t− 1)
∂M eH(t)
= −[wH(t− 1) + w(t− 1)
∂LP (t− 1)
∂HP (t− 1)− w′H(t− 1)MH(t− 1)
]×s∗(t)
SN(t)
∂s∗(t)
∂M eH(t)
(3.46)
∂W (t)
∂M eH(t)
=
[wH(t) + w(t)
∂LP (t)
∂HP (t)− w′H(t)MH(t)
]N(t)
∂s∗(t)
∂M eH(t)
+
[w(t)
∂LP (t)
∂HP (t)− w′H(t)MH(t)
]εH (3.47)
Proof. The proof is given in appendix A.
If native education does not adjust to immigration, high skilled immigra-tion leads to an increase in native welfare. Both terms in the second bracket
17As native education does not adjust to low skilled immigration, it has no welfare effectin t− 1.

Chapter 3: Educational Choice and Immigration Surplus 66
in (3.47) are positive. Thus, proposition 2 still holds with respect to highskilled immigration. However, the effect is no more conditional on a smallstock of low skilled immigrants. The same holds for proposition 3. From(3.46) and (3.47), it can easily be seen that educational adjustment leads toa decrease in native welfare in cohort t and an increase in t− 1. The termsin brackets are positive and ∂s∗(t)
∂MeH(t)
is negative.
Proposition 4 also holds for high skilled immigration with a minimumwage. From (3.46) and (3.47) the overall welfare effect of high skilled immi-gration is:
∂W ∗(t)
∂MH(t)= N(t)
([wH(t) + w(t)
∂LP (t)
∂HP (t)− w′H(t)MH(t)
]
−δ[wH(t− 1) + w(t− 1)
∂LP (t− 1)
∂HP (t− 1)
]s∗(t)
S
)∂s∗(t)
∂MH(t)
+
[w(t)
∂LP (t)
∂HP (t)− w′H(t)MH(t)
](3.48)
With MH(t − 1) = 0. For w(t − 1) = w(t), δ = 1, and ∂LP (t−1)∂HP (t−1)
= ∂LP (t)∂HP (t)
,18
this can be rewritten as:
∂W ∗(t)
∂MH(t)=
[wH(t)− wH(t− 1)
s∗(t)
S− w′H(t)MH(t)
]N(t)
∂s∗(t)
∂MH(t)
+
[w(t)
∂LP (t)
∂HP (t)− w′H(t)MH(t)
](3.49)
As s∗(t)S
< 1, the term in the first bracket is positive. The second bracketequals the welfare effect of immigration without educational adjustment.Thus, educational adjustment still leads to a reduction in native welfare.The sign of the overall welfare effect cannot be unambiguously determined.For certain parameter set-ups, the overall welfare effect can become negative.For high skilled immigration, proposition 5 still holds: If realized high skilled
18 ∂LP (t−1)∂HP (t−1) and ∂LP (t)
∂HP (t) can potentially differ due to different endowments with highskilled labor. However, this differences should generally be very small.

Chapter 3: Educational Choice and Immigration Surplus 67
immigration does not change, an increase in expected immigration leads toa welfare loss. To see this, replace ∂s∗(t)
∂MH(t)by ∂s∗(t)
∂MeH(t)
in (3.49) and set the last
bracket equal to zero. As the term in front of ∂s∗(t)∂MH(t)
is positive, the effect isnegative.
Altogether, in spite of a minimum wage, the propositions on the effects ofeducational adjustment to immigration still hold for high skilled immigration.This indicates that they are not only valid for frictionless labor markets butalso for labor markets that exhibit frictions. Nevertheless, the propositionsdo not hold anymore with respect to low skilled immigration. Low skilledimmigration does not lead to changes in the native educational structureanymore. Thus, for groups of workers that are directly affected by stronglabor market frictions the propositions do not hold. In the real world stronglabor market frictions often affect only small parts of the labor force. Thus,the welfare effect of educational adjustment to immigration should also bean issue in the real world.
3.5 Policy implications
The findings in this paper have strong implications for the optimal design ofimmigration policy. First, if immigration is foreseeable, natives adjust theireducational level to it. Less natives acquire the qualifications that immigrantstypically have. To keep the model manageable, only two qualification levelsare analyzed in the paper. Nevertheless, adjusting proposition 1 for morequalification levels is straightforward. For instance, assume that the supplyof low skilled labor is fixed. High skilled individuals can choose between tech-nical and administrative skills and technical skills lead to higher educationcosts. In proposition 1, high skilled workers can then simply be replaced bytechnically skilled workers and low skilled workers by administratively skilledworkers.
An expected inflow of workers with certain qualifications has the effectthat less natives acquire these qualifications. This means that immigrationpolicy programs that are targeted at attracting specialized workers, as the

Chapter 3: Educational Choice and Immigration Surplus 68
German Greencard for IT specialists, can after all be counterproductive. Inthe short run, such programs may be successful. Immigrants may removethe shortage of workers with certain qualifications. However, less nativeswill decide to acquire the respective qualifications in the long run. As soonas the inflow of foreign workers with the respective qualifications stops, theshortage will again appear and possibly be even stronger. In this context,physicians in the UK are an interesting example. For years, the number offoreign physicians has been high and the number of native physicians hasbeen low. It is obvious that the UK has hired foreign physicians, because thesupply of natives has not been sufficient. Nevertheless, it is also most likelythat, without the foreign physicians, the UK would have had to motivatemore young natives to study medical science. For doing this, it would havehad to improve the working conditions for physicians.
As young natives cannot perfectly foresee future immigration, their ex-pectations about immigration are decisive for their educational choice. Asshown in proposition 5, the higher expected immigration relative to realizedimmigration, the lower native welfare. Immigration policy, and even morethe public discussion about it, can strongly affect the expectations aboutfuture immigration. If an immigration program is extensively discussed inthe media, (young) natives will generally expect that this program leads to alarge inflow of immigrants. Similarly, if forecasts of future immigration flowsare discussed in the media, young natives will generally revise their expec-tations about future immigration according to these numbers. My resultsclearly indicate that policy makers and experts should be extremely cau-tious in discussing migration policy in public. An understatement of futureimmigration is always better than an overstatement.
Nevertheless, my findings indicate that immigration is welfare-enhancingfor natives in the immigration country – at least if the immigrants reallyenter the labor market. Hence, countries should be open for immigrants whocan provide for their living themselves. They just should be cautious howthe native educational structure changes.

Chapter 3: Educational Choice and Immigration Surplus 69
3.6 Conclusions
Unexpected immigration leads to an increase in native welfare. If nativesadjust their education decision to immigration, the welfare effect of immi-gration is substantially smaller and not unambiguously positive anymore. Iflow (high) skilled wages do not react too much to high (low) skilled labor sup-ply, it is still positive. This holds not only in a frictionless labor market. In alabor market with a minimum wage, the same pattern results with respect tohigh skilled immigration, as long as the minimum wage is not binding for highskilled labor. Thus, an adjustment of the educational structure of the nativepopulation substantially alters the welfare effects of immigration. Decidingabout their education, young natives cannot perfectly foresee future immi-gration and have to build expectations. As shown in the paper, the higherthe expected number of future immigrants compared to realized immigra-tion, the lower native welfare after immigration. When making immigrationpolicy, possible changes in the educational structure of natives should betaken into account. As these changes depend on the expectations of youngnatives about future immigration, policy makers should carefully observe theformation of expectations about future immigration in the society.
A further interesting result from my model is that an adjustment of thenative education structure to immigration leads to a strong redistributionof native welfare between different cohorts. Policy makers do not necessar-ily attach the same importance to the welfare of different cohorts. This isevident, if certain cohorts have the right to vote and others not. Thus, animmigration policy that does not maximize overall welfare but the welfareof certain groups or cohorts may be optimal for politicians. For example,low skilled immigration may lead to an increase in overall welfare but reducewelfare of cohort t− 1. Then, a policy maker that only considers the welfareof cohort t−1 will not allow for low skilled immigration, although it enhancesoverall welfare.

Chapter 3: Educational Choice and Immigration Surplus 70
3.7 Appendix A: Proofs to lemmas 1 and 2
Lemma 1
Proof. The effect of immigration in t on native welfare W of cohort t − 1
in period t − 1 equals the effect on output less the wage sums paid to theincumbent immigrants:
∂W (t− 1)
∂M eH(t)
=∂
∂M eH(t)
[F (HP (t− 1), L(t− 1), X1(t− 1), . . . , Xj(t− 1))
−wH(t− 1)MH(t− 1)− wL(t− 1)ML(t− 1)]
=
[∂F (. . .)
∂HP (t− 1)− ∂wH(t− 1)
∂HP (t− 1)MH(t− 1)− ∂wL(t− 1)
∂HP (t− 1)ML(t− 1)
]×∂HP (t− 1)
∂HE[t− 1)
∂HS(t− 1)
∂s∗(t)
∂s∗(t)
∂M eH(t)
= −[wH(t− 1)− ∂wH(t− 1)
∂HP (t− 1)MH(t− 1)− ∂wL(t− 1)
∂HP (t− 1)ML(t− 1)
]×s∗(t)
SN(t)
∂s∗(t)
∂M eH(t)
, (3.50)
∂W (t− 1)
∂M eL(t)
=∂
∂M eL(t)
[F (HP (t− 1), L(t− 1), X1(t− 1), . . . , Xj(t− 1))
−wH(t− 1)MH(t− 1)− wL(t− 1)ML(t− 1)]
= −[wH(t− 1)− ∂wH(t− 1)
∂HP (t− 1)MH(t− 1)− ∂wL(t− 1)
∂HP (t− 1)ML(t− 1)
]×s∗(t)
SN(t)
∂s∗(t)
∂M expL (t)
. (3.51)

Chapter 3: Educational Choice and Immigration Surplus 71
The effect in cohort t is given by
∂W (t)
∂M eH(t)
=∂
∂M eH(t)
[F (HP (t), L(t), X1(t), . . . , Xj(t))
−wH(t)MH(t)− wL(t)ML(t)]
=∂F (. . .)
∂HP (t)
∂HP (t)
∂s∗(t)
∂s∗(t)
∂M eH(t)
+∂F (. . .)
∂L(t)
∂L(t)
∂s∗(t)
∂s∗(t)
∂M eH(t)
+∂F (. . .)
∂HP (t)
∂HP (t)
∂MH(t)
∂MH(t)
∂M eH(t)
− wH(t)∂MH(t)
∂M eH(t)
−[∂wH(t)
∂HP (t)MH(t) +
∂wL(t)
∂HP (t)ML(t)
]∂HP (t)
∂s∗(t)
∂s∗(t)
∂M eH(t)
−[∂wH(t)
∂L(t)MH(t) +
∂wL(t)
∂L(t)ML(t)
]∂L(t)
∂s∗(t)
∂s∗(t)
∂M eH(t)
−[∂wH(t)
∂HP (t)MH(t) +
∂wL(t)
∂HP (t)ML(t)
]∂HP (t)
∂MH(t)
∂MH(t)
∂M eH(t)
= −[∂wH(t)
∂HP (t)MH(t) +
∂wL(t)
∂HP (t)ML(t)
−∂wH(t)
∂L(t)MH(t)− ∂wL(t)
∂L(t)ML(t)
]×N(t)
∂s∗(t)
∂M eH(t)
+ [wH(t)− wL(t)]N(t)∂s∗(t)
∂M eH(t)
−[∂wH(t)
∂HP (t)MH(t) +
∂wL(t)
∂HP (t)ML(t)
]∂MH(t)
∂M eH(t)
, (3.52)
∂W (t)
∂M eL(t)
=∂
∂M eL(t)
[F (HP (t), L(t), X1(t), . . . , Xj(t))
−wH(t)MH(t)− wL(t)ML(t)]
= −[∂wH(t)
∂HP (t)MH(t) +
∂wL(t)
∂HP (t)ML(t)
−∂wH(t)
∂L(t)MH(t)− ∂wL(t)
∂L(t)ML(t)
]×N(t)
∂s∗(t)
∂M eL(t)
+ [wH(t)− wL(t)]N(t)∂s∗(t)
∂M eL(t)
−[∂wH(t)
∂L(t)MH(t) +
∂wL(t)
∂L(t)ML(t)
]∂ML(t)
∂M eL(t)
. (3.53)

Chapter 3: Educational Choice and Immigration Surplus 72
Lemma 2
Proof. The effect of high skilled immigration on native welfare W of cohortt− 1 equals the effect on output less the wage sums paid to immigrants:
∂W (t− 1)
∂M eH(t)
=∂
∂M eH(t)
[F (HP (t− 1), LP (t− 1), X1(t− 1), . . . , Xj(t− 1))
−wH(t− 1)MH(t− 1)− w(t− 1)ML(t− 1)]
=
[∂F (. . .)
∂HP (t− 1)+
∂F (. . .)
∂LP (t− 1)
∂LP (t− 1)
∂HP (t− 1)− w′H(t− 1)MH(t− 1)
]
×∂HP (t− 1)
∂HE(t− 1)
∂HE(t− 1)
∂s∗(t)
∂s∗(t)
∂M eH(t)
. (3.54)
The effect in t is given by:
∂W (t)
∂M eH(t)
=∂
∂M eH(t)
[F (HP (t), LP (t), X1(t), . . . , Xj(t))− wH(t)MH(t)
−w(t)ML(t)]
=
[∂F (. . .)
∂HP (t)+∂F (. . .)
∂LP (t)
∂LP (t)
∂HP (t)− w′H(t)MH(t)− wH(t)
]∂MH(t)
∂M eH(t)
+
[∂F (. . .)
∂HP (t)+∂F (. . .)
∂LP (t)
∂LP (t)
∂HP (t)− w′H(t)MH(t)
]∂HP (t)
∂s∗(t)
∂s∗(t)
∂M eH(t)
.
(3.55)
3.8 Appendix B: The immigration surplus inthe inframarginal case
The immigration surplus IS(t) is defined as the increase in total domesticproduction Y (t) = F (HP (t), L(t), . . .) due to immigration less the wage sum
Chapter 3: Educational Choice and Immigration Surplus 73
paid to immigrants. For high skilled immigration it can be written as:
IS(t) = F (H1P (t), . . .)− F (H0
P (t), . . .)− ∂F (H1P (t), . . .)
∂H1P (t)
MH(t) (3.56)
with H1P (t) = c(t)N(t) − HS(t)19 and H1
P (t) = H0P (t) + MH(t) − HS(t).
As F (HP (t), . . .) is strictly monotonically increasing in HP (t), (3.56) can berewritten as:
IS =∂F (Hy
P (t), . . .)
∂HyP (t)
MH(t)− ∂F (H1P (t), . . .)
∂H1P (t)
MH(t) (3.57)
with HyP (t) = H0
P (t) + y(H1P (t) − H0
P (t)), 0 ≤ y ≤ 1. As by the Inadaconditions ∂F (HP (t),...)
∂HP (t)is strictly monotonic increasing in HP (t), (3.57) can be
rewritten as:
IS = −∂2F (Hz
P (t), . . .)
∂ (HzP (t))2 MH(t)
(H1P (t)−Hy
P (t))
= −∂2F (Hz
P (t), . . .)
∂ (HzP (t))2 M2
H(t) (1− y) (3.58)
with HzP (t) = Hy
P (t) + z(H1P (t) − Hy
P (t)). For constant second derivativesof the production function, the immigration surplus is overestimated by afactor of 1
(1−y), if (3.34) is used as approximation for it. As ∂2F (HP (t),...)
∂(HP (t))2<0,
by the Inada conditions, y is closer to zero than to one.
19The demand for teachers does not change, as immigration does not affect the educationstructure of the succeeding cohort.
4High Unemployment in Germany: Why do
Foreigners Suffer Most?
4.1 Introduction
A substantial part of today’s German labor force consists of immigrants. In2008, the share of foreigners amounted to 8.8%(see Statistisches Bundesamt,2009). The share of foreign born people is still considerably larger(17.1%in 2005, see Geis et al., 2010). Thus, the performance of immigrants inthe labor market has a sizeable effect on overall welfare in Germany. Thelabor market situation of immigrants is bad: In 2008, the unemploymentrate of foreigners was 18.1%, whereas the overall unemployment rate wasonly 8.0% (Bundesanstalt für Arbeit, 2009). Comparing the developmentsof total and foreign unemployment over time, leads to an additional finding.The gap between foreign and native unemployment is particularly high inyears with high overall unemployment rates. Figure 4.1 depicts foreign andoverall unemployment rates in West Germany between 1969 and 2008.1
This paper analyzes empirically the reasons for the gap between native
1Focussing on West Germany has two advantages. First, it allows to trace unemploy-ment back to the years before 1990. Second, as over 95% of the foreigners in Germanytoday live in West Germany, it also makes foreigners and natives better comparable.Therefore, in the following the paper focuses on West Germany.
74

Chapter 4: Foreigner Unemployment in Germany 75
Figure 4.1: Development of foreign unemployment in West Germany
Source: Bundesanstalt für Arbeit (2009). Since 2002 data include former Eastern Berlin.
and immigrant unemployment as well as the stronger fluctuation in immi-grant unemployment. I find that the lower endowment with human capitalof immigrants is the main reason. Besides lower formal degrees, lacking lan-guage skills are also a reason for the worse situation of foreigners. At least forthe gap between native and immigrant unemployment, differences in socialnetworks also play a role.
Up to now, empirical papers on the differences between immigrant andnative unemployment in Germany are scarce. In contrast to this, a sub-stantial literature deals with differences in wages between immigrants andnatives in Germany (see Thomsen et al., 2007; Lang, 2005, and the referncesin these papers). This is astonishing, as employment and unemploymentrates immensely differ between natives and immigrants in Germany, whereaswage levels are nearly identical (see Geis et al., 2010). In contrast, in theUS, the difference in unemployment rates between immigrants and natives isnegligible, whereas the difference in wages is much larger than in Germany(see Geis et al., 2010). Explanations for differences in un-/employment and

Chapter 4: Foreigner Unemployment in Germany 76
wages between natives and immigrants may be the same (differences in hu-man capital, discrimination, etc.), but the (quantitative) relevance of theseexplanations can be very different (see Nordin and Rooth, 2009). Thus, tounderstand why immigrants are so badly integrated into the German labormarket, differences in un-/employment rates have to be analyzed.
Dustmann et al. (2010) is the only paper documenting that immigrantemployment in Germany (and the UK) reacts considerably more to cyclicalvariations than native employment.2 They also analyze the effects of cyclicalfluctuations on wages and find no difference between immigrants and na-tives. Moreover, they include controls for (crude) education groups and agein their empirical analysis and still find a stronger cyclicality of immigrantunemployment. My estimations also indicate that formal degrees cannot fullyexplain the stronger reaction of immigrant unemployment to changes on thelabor market. The fact that immigrant unemployment is not only higher butalso more cyclical than native unemployment has implications for an empir-ical analysis of the native-immigrant un-/employment gap. The gap can bedecomposed into a baseline component and a labor market situation compo-nent3 (in the following called situation component): The baseline componentmeasures the difference between immigrant and native unemployment as-suming some fixed level of native unemployment. The situation componentmeasures the extent to which immigrant and native unemployment reactdifferently to changes in the labor market (or to changes in the overall un-employment rate respectively). The decomposition allows us to assess howlarge immigrant unemployment would be for different situations on the la-bor market. This is a precondition for evaluating labor market measures forimmigrants, when the labor market changes due to cyclical fluctuations.
Using data from the German Socio-Economic Panel (GSOEP), I analyze
2Nevertheless, there are also some papers on the cyclical development of the unemploy-ment rates of the Black in the U.S.: Abbring et al. (2001), Bradbury (2000), Couch andFairlie (2008), Fairlie and Sundstrom (1997) and Fairlie and Sundstrom (1999).
3This component measures primarily the effect of cyclical fluctuations. However, asthe baseline is calculated for a fixed unemployment rate and not the trend unemploymentrate, it is not a business cycle component in the proper meaning of the word.

Chapter 4: Foreigner Unemployment in Germany 77
the two components of the native-immigrant unemployment gap. Fixing na-tive unemployment at zero and defining immigrants as foreigners, I find abaseline component of 5.6. This means that, for a native unemploymentrate of zero, the unemployment rate of immigrants would be 5.6 percent.The situation component is 0.7. This means that a one percentage pointincrease in the total unemployment rate increases immigrant unemploymentby 0.7 percentage points more than native unemployment. In a further step,I analyze potential explanations for these differences between native and im-migrant unemployment. I include controls for various factors that can affectthe probability of an individual to be employed in my empirical analysis. Ifirst include the “classical” determinants of the labor market situation of anindividual: Personal characteristics, such as age and sex, educational degreesand employment experience. Both, the baseline and the situation compo-nent of the unemployment gap are still significant. However, the baselinecomponent decreases by 3/4 and the situation component by 4/5.
The “classical” determinants of the labor market situation are primarilymeasures for general human capital. However, country-specific human capi-tal, as language skills, can also affect the labor market success of immigrants.Additionally controlling for lacking skills in the German language decreasesboth components of the unemployment gap by 1/2. The situation componentis no more statistically significant indicating that this component is poten-tially fully explained by the “classical” determinants and lacking country-specific human capital. Not only human capital but also the position ofan individual in the society can affect her employment success. Immigrantscan have a lower position than natives due to discrimination. This can betaste based discrimination or some sort of statistical discrimination. How-ever, lacking social networks can also impair the position of immigrants inthe society. Including self-assessed discrimination and / or measure for so-cial networks (number of friends, contact to Germans) in my estimations, thebaseline component as well as the situation component of the unemploymentgap become statistically and economically insignificant.
The paper is organized in the following way. In section 4.2, the empiricalapproach and the data are described. Section 4.3 discusses estimates for the

Chapter 4: Foreigner Unemployment in Germany 78
components of the native-immigrant unemployment gap without controls. Insection 4.4, the effect of the “classical” determinants of labor market success,educational degrees and employment experience, on the unemployment gapare analyzed. Section 4.5 deals with the effects of language fluency andassimilation. In section 4.6, the relevance of discrimination and lacking socialnetworks for the difference between native and immigrant unemployment arediscussed. Section 4.7 concludes and discusses policy implications.
4.2 Data and empirical approach
Employment rates of immigrants can be strongly affected by immigrationand emigration flows. Assume, for instance, that at a certain point in time alarge number of highly qualified people arrive and immediately get a job. Theemployment rate of immigrants will rise, although no unemployed incumbentimmigrant comes into employment. The unemployment rate of immigrantswill correspondingly decrease. At a later point in time, the aforementionedhighly qualified people may again emigrate. Then, the immigrant unem-ployment rate will increase, although no immigrant is actually fired. Thelabor market situation in an immigration country can have a strong effecton migration flows, as it affects migration incentives (e.g. expected wages)and immigration policy (e.g. recruitment programs for specialized workers).Thus, in- and outflows of immigrants can affect the situation component ofthe unemployment gap between immigrants and natives.
Dustmann et al. (2010) find that cyclical immigration flows are not thedriving force behind the stronger cyclicality of immigrant unemployment inGermany. Analyzing the native-immigrant unemployment gap, one shouldnevertheless control for changes in the composition of the immigrant laborforce.4 A convenient way to do this, is to use panel data and follow theemployment history of the same individuals over time. To properly measure
4The effects of (cyclical) changes in the immigrant labor force are potentially also aninteresting object of investigation. However, they have nothing to do with the integrationof immigrants that is actually analyzed with the native-immigrant unemployment gap.
Chapter 4: Foreigner Unemployment in Germany 79
the situation component5, the data has to contain observations for differ-ent labor market situations. The German Socio-Economic Panel (GSOEP)6
is well suited to analyze the native-immigrant unemployment gap. It con-tains a sufficient number of immigrants and allows to follow the employmenthistories of individuals over more than two business cycles (encompassing alarge range of labor-market situations). In addition, the GSOEP containsinformation on a large variety of individual characteristics. In particular, itcontains information on language usage of immigrants and social networks– information that is found in few data sets. Descriptive statistics for thevariables that are used in the empirical analysis can be found in table 4.1.
In 1984, the GSOEP was launched with two partial samples, one for na-tives (sample A) consisting of 4,500 households and one for foreigners (sampleB) consisting of 1,400 households. This “foreigner sample” mainly covers thefamilies of former “guest worker”.7 In later years, various additional sampleshave been included in the GSOEP. Thereof, the “immigrant sample” (sampleD) that was launched with 522 households in 1994/95 is also interesting formy analysis, as it covers more or less all immigrant groups.8 Some of thesampled immigrant households have migrated back in the meantime, so thatthe composition of immigrants has also changed in the GSOEP. The GSOEPallows to distinguish return migration from panel mortality. Persons whohave migrated back are not considered in my estimations.9 One could arguethat the sampling of the GSOEP yields to some kind of cohort bias. How-ever, comparing samples A and B, this bias should have the same extent forimmigrants and natives.
I define individuals who state in the survey to be working as employed
5If the situation component is not properly measured, the unemployment gap cannotbe decomposed.
6See Wagner et al. (2007) for further information on the GSOEP.7Only households with an Italian, Spanish, Greek, Yugoslavian or Turkish head were
sampled.8The sampling restriction for sample D was that at least one household member has
immigrated after 1984.9Completely balancing the panel would lead to a large loss of observations.

Chapter 4: Foreigner Unemployment in Germany 80
Table 4.1: Descriptive statistics
Total Natives Foreigners Born in In former ElsewherePopulation Turkey Yugoslavia
Number of observations 196,014 155,173 40,841 13,940 7,179 18,122Female 51.32% 52.54% 46.70% 46.38% 50.72% 48.10%Age 44 46 38 38 43 44
(17.2) (17.6) (14.1) (13.4) (12.5) (14.7)Birth year 1950 1949 1955 1956 1950 1949
(17.7) (18.3) (14.4) (13.1) (12.0) (14.4)Empl. Experience 16.2 16.7 13.8 11.9 18.5 18.7
(13.2) (13.3) (12.5) (11.8) (11.9) (12.9)Unempl. Experience 0.5 0.5 0.8 1.0 0.9 0.6
(1.6) (1.5) (1.8) (2.1) (1.8) (1.6)CASMIN 1a 6.58% 2.51% 23.02% 25.91% 22.32% 18.12%CASMIN 1b 20.30% 17.48% 31.68% 35.71% 27.35% 28.82%CASMIN 1c 33.87% 36.06% 25.03% 21.09% 35.23% 29.32%CASMIN 2a 4.89% 4.63% 5.92% 6.34% 2.10% 3.35%CASMIN 2c-gen. 3.48% 3.76% 2.36% 1.24% 0.89% 2.16%CASMIN 2c-voc. 4.88% 5.70% 1.57% 0.84% 0.45% 3.10%CASMIN 3a 3.16% 3.74% 0.80% 0.68% 0.45% 1.74%CASMIN 3b 6.03% 6.91% 2.52% 1.69% 2.16% 4.49%Degree abroad 14.65% 0.87% 67.00% 74.57% 82.35% 54.39%Years abroad 3.9 0.7 15.9 19.1 21.3 18.8
(9.3) (4.6) (12.4) (10.9) (10.1) (12.6)Partly for. lang. at home 7.32% 0.22% 35.96% 36.40% 37.21% 27.52%Mostly for. lang. at home 5.14% 0.08% 25.59% 41.94% 16.17% 17.18%Newspaper language 4.57 4.99 3.12 2.43 3.48 3.62(1 only for. - 5 only Ger.) (1.01) (0.16) (1.32) (1.18) (1.12) (1.35)Sometimes discriminated 7.35% 0.33% 35.72% 43.24% 31.93% 24.80%Often discriminated 1.67% 0.06% 8.16% 12.02% 5.61% 5.06%No contact with Germany 2.91% 0.00% 13.99% 21.57% 10.11% 9.55%Number of friends 4.4 4.3 4.8 5.7 4.3 3.9
(4.3) (4.0) (5.3) (6.6) (3.3) (3.9)Standard deviations are given in parentheses.
and individuals who state to be unemployed as unemployed. Moreover, Idefine individuals as being non-working but in the labor force, if they stateto be unemployed or non-working for reasons other than old age (over 65),education or training, maternity leave and military / community service.Unemployment rates that are based on these definitions are lower than theofficial unemployment rates. This is mainly due to the fact that in theofficial statistics self-employed people, civil servants and employees with in-come below the reporting threshold for social security are not counted asemployed. For an analysis of the native-immigrant unemployment gap, theseworkers should be considered. Otherwise switching from dependent employ-ment to self-employment and the like, which may be affected by the labormarket situation, can bias the results. As shown in figure 4.2, official unem-ployment rates and unemployment rates calculated using the aforementioned

Chapter 4: Foreigner Unemployment in Germany 81
Figure 4.2: Foreign unemployment in the GSOEP
Source: Own calculations; only persons in West Germany are considered.
definitions show the same temporal variations.10 As in the official data, theforeign unemployment rate shows a stronger variation than native unemploy-ment rate. Thus, the effect of in- and outflow of immigrants on the situationcomponent of the immigrant-native unemployment gap is obviously not sub-stantial for the considered years.
For the empirical analysis of the native-immigrant unemployment gap,I use Pooled Probit11 as estimation model. The dependent variable in thebaseline specification is a binary variable indicating if an individual is un-
10Curves for samples A-F were included. Samples E+F (launched in 1998 and 2000)cover the whole population and are large (7,000 households). Thus, they make the numbersfor the later years more reliable.
11A random or fixed effects model is not suitable for my analysis, as the variation ofinterest comes mainly from the cross-sectional dimension. The baseline component of theunemployment gap is solely determined by cross-sectional differences between immigrantsand natives. In addition, the main determinants of the unemployment gap (e.g. educationlevels) do hardly vary over time.

Chapter 4: Foreigner Unemployment in Germany 82
employed or employed (see above). The gap between native and immigrantemployment rates may differ from the gap between unemployment rates.Therefore, I use a binary variable for being employed or non-working (seethe definitions above) as dependent variable in some extensions. I decidedfor the unemployment gap as baseline specification, as non-working is in mostcases voluntary.
To measure the baseline component of the unemployment gap, I use adummy variable indicating if an individual is an immigrant or a native per-son. Immigrants can either be defined by nationality or by country of birth.As the definition of immigrants can affect the results, I work with both defi-nitions alternately. To measure the situation component, I use an interactionbetween the immigrant dummy and state-specific unemployment rate at therespective time. In addition, I also control for the current labor marketsituation using state-specific unemployment rates in all estimations. Thesestate-specific unemployment rates are annual values12 from the official statis-tic.13 In home-country specific regressions, I use dummies for being born inTurkey, former Yugoslavia, Southern Europe, Eastern Europe and elsewhereinstead of the immigrant dummy. Each of these dummies is then interactedwith the state-specific unemployment rates to measure the situation compo-nents of the unemployment gaps for the various groups.
To get qualitatively and quantitatively interpretable results, I calculatemarginal effects at the mean. The beta-coefficient for the interacted termsand the interaction term would not even be qualitatively interpretable (seeAi and Norton, 2003). At the mean denotes that the marginal effects arecalculated for an individual with mean characteristics (mean values for theexplaining variables). In Probit regressions, marginal effects differ over obser-
12In the GSOEP individual employment is inquired by the month. However, seasonalunemployment patterns are beyond the scope of this paper. Moreover, most other variablesof interest are only available on a yearly base.
13The unemployment rates could also be calculated from the GSOEP. However, this hastwo disadvantages. First, this could lead to endogeneity bias, which is minimized usinga different source and definition of the unemployment rates. Second, the GSOEP is toosmall to calculate reliable state specific unemployment rates and the economic situationin Germany differs over states.

Chapter 4: Foreigner Unemployment in Germany 83
vations, as they depend on the ex-ante probability of the dependent variable(the probability to be unemployed in this case). Therefore, the results pre-sented in the following hold for average immigrants, but not necessarily forimmigrants with characteristics far away from the average.
4.3 Decomposition of the native-immigrant un-employment gap
In this section, I present estimates for the baseline and situation componentof the native-immigrant unemployment gap without further controls. Theseresults tell us in how far the unemployment gap is driven by the labor mar-ket situation and allow us to assess how large the unemployment gap wouldbe under different labor market situations (different aggregate unemploy-ment rates). With this information, predictions of immigrant unemploymentcan be derived from predictions of the overall unemployment rate. This isnecessary for evaluating immigration policy measures. It allows us to calcu-late immigrant unemployment in the counterfactual case, although the labormarket situation changes due to cyclical variation.14
Estimation results for the two components of the unemployment gap aregiven in tables 4.2 and 4.3. In table 4.2, immigrants are defined by nation-ality, whereas in table 4.3 they are defined by country of birth. Estimatedmarginal effects for the baseline specification (samples A and B) and definingimmigrants as foreigners are displayed in the first column of table 4.2. Thevalue for the baseline component is given by the estimate for the foreignerdummy of 0.056. This value indicates that the immigrant unemployment ratewould be 5.6 percent, if there was no native unemployment. The estimatefor the interaction term of 0.0070 measures the situation component. It indi-cates that, if the overall unemployment rate increases by 1 percentage point,immigrant unemployment increases by 0.70 percentage points more than na-
14As such immigration policy measures generally work in the long run, (cyclical) labormarket changes are an important issue for their evaluation.

Chapter 4: Foreigner Unemployment in Germany 84
Table 4.2: Estimates for the unemployment gap between foreigners andnatives without controls
(1) (2) (3) (4) (5) (6)Unemployment rate 0.0070*** 0.0072*** 0.0064*** 0.0068*** 0.0073*** 0.0084***
(0.0005) (0.0004) (0.0004) (0.0006) (0.0008) (0.0011)Foreigner 0.0564*** 0.0552*** 0.0576*** 0.0554*** 0.0599*** 0.0461***
(0.0039) (0.0039) (0.0038) (0.00050) (0.0063) (0.0078)Foreigner*unempl. 0.0069*** 0.0070*** 0.0074*** 0.0076*** 0.0061*** 0.0131***
(0.0014) (0.0014) (0.0013) (0.0018) (0.0024) (0.0027)R2 0.0281 0.0257 0.0234 0.0314 0.0250 0.0037Observations 122956 133536 169861 71772 51184 158451Samples A+B A-D A-F A+B A+B A+B
The dependent variable is a dummy variable for unemployment/employment, in (6) for non-employment/employment. The estimation method is pooled Probit and the displayed coefficients aremarginal effects at the mean. Standard errors are given in parenthesis; * significant at the 10%-level, **significant at the 5%-level and *** significant at the 1%-level. In (4) only males and in (5) only femalesare considered.
tive unemployment. For an overall unemployment rate of 7.2 percent, theWest German unemployment rate in 2008, my estimation predicts a differ-ence between native an immigrant unemployment of 5.6 + 0.7 × 7.2 = 10.6
percentage points. This almost exactly equals the actual difference of 10.5percentage points.15 To test the robustness of these results, I have repeatedthe regression using more samples from the GSOEP (columns 2 and 3 intable 4.2) and differentiating between men (column 4) and women (column5). The estimation results are hardly affected by these changes.
Changing the definition of immigrants to people who are born abroadhas a stronger effect on the results. The estimated baseline component ofthe unemployment gap is reduced to 5.5 percentage points and the situa-tion component to 0.57 percentage points. Nevertheless, the difference tothe baseline estimates is not statistically significant. Differentiating betweenhome country groups shows that the unemployment gap varies strongly overimmigrant groups. I find the highest baseline component for people fromTurkey with 10.1 percentage points. The estimate for people from formerYugoslavia is 5.4 percentage points and thus only about half as large. Theestimates for people from Eastern and Southern European countries, 4.016
15The official foreign unemployment rate in West Germany was 16.8 percentage pointsand the official native unemployment rate 6.3 percentage points.
16Including additional samples from the GSOEP, the estimate for people from Eastern

Chapter 4: Foreigner Unemployment in Germany 85
Table 4.3: Estimates for the unemployment gap between foreign born andnatives without controls
(1) (2) (3) (4) (5) (6)Unemployment rate 0.0070*** 0.0069*** 0.0068*** 0.0068*** 0.0085*** 0.0078***
(0.0005) (0.0004) (0.0005) (0.0004) (0.0011) (0.0011)Foreign born 0.0551*** 0.0576*** 0.0620***
(0.0041) (0.0038) (0.0080)Foreign born*unempl. 0.0057*** 0.0060*** 0.0113***
(0.0014) (0.0013) (0.0027)Born in Turkey 0.1009*** 0.1042*** 0.1527***
(0.0082) (0.0083) (0.0134)Turkey*unemployment 0.0108*** 0.0115*** 0.0134***
(0.0028) (0.0029) (0.0045)Former Yugoslavia 0.0539*** 0.0539*** 0.0083
(0.0090) (0.0091) (0.0156)Yugoslavia*unempl. 0.0140*** 0.0142*** 0.0231***
(0.0029) (0.0030) (0.0047)Southern Europe 0.0350*** 0.0357*** -0.0147
(0.0068) (0.0069) (0.0013)S. Europe*unempl. 0.0006 0.0017 0.0016
(0.0025) (0.0025) (0.0045)Eastern Europe 0.0398** 0.0660*** 0.1192***
(0.0173) (0.0098) (0.0286)E. Europe*unempl. 0.0023 0.0055* -0.0018
(0.0041) (0.0029) (0.0082)Born elsewhere 0.0084 0.0273** 0.0023
(0.0105) (0.0113) (0.0228)Elsewhere*unempl. -0.0010 -0.0008 -0.0038
(0.0026) (0.0025) (0.0067)R2 0.0271 0.0290 0.0319 0.0329 0.0048 0.0100Observations 122956 133536 122956 133536 158451 158451Samples A+B A-D A+B A-D A+B A+B
The dependent variable is a dummy variable for unemployment/employment, in (5) and (6) for non-employment/employment. The estimation method is pooled Probit and the displayed coefficients aremarginal effects at the mean. Standard errors are given in parenthesis; * significant at the 10%-level, **significant at the 5%-level and *** significant at the 1%-level.
and 3.5 percentage points, are still smaller and the estimate for people bornelsewhere is even insignificant. The estimates for the situation component ofthe unemployment gap are only significant for people from Turkey and for-mer Yugoslavia. They are 1.08 and and 1.40 percentage points, respectively.Thus, immigrants from Turkey and former Yugoslavia exhibit not only thelargest unemployment compared to natives. They also suffer most from de-teriorations of the labor market situation in Germany. This indicates that
Europe becomes much larger. This is not surprising as after 1989 many people fromEastern Europe have immigrated to Germany and fundamentally changed this populationgroup.

Chapter 4: Foreigner Unemployment in Germany 86
integration policy should focus on these two groups, which are also amongthe largest.
Analyzing the employment gap instead of the unemployment gap leads toan interesting result. If immigrants are defined as foreigners, the estimate forthe baseline component of 4.6 percentage points is noticeably smaller thanthe estimate for the unemployment gap of 5.6 percentage points (see table4.2). The situation component of 1.31 percentage is almost twice as high.Defining immigrants as foreign born people or differentiating between homecountry groups does not change this pattern (see table 4.3). Thus, comparedto natives, the employment of immigrants obviously reacts more to changesin the labor market than their unemployment. The fact that immigrants inmost cases have/had17 shorter claims for unemployment insurance may be anexplanation for this, although unemployment is self-assessed. Nevertheless,the extent of the difference remains puzzling.
4.4 Educational degrees and experience
Since the ground-breaking work of Mincer (1974) empirical economists gener-ally use years of schooling or educational degrees and employment experienceto explain the labor market success of individuals. In virtually all studies,statistically and economically highly significant effects of education and ex-perience are found. This finding is independent of whether labor marketsuccess is measured by employment probabilities, wages or something else.Immigrants and natives in Germany strongly differ with respect to their edu-cational degrees. In 2005, 14% of the foreign born people between 25 and 65had no educational degree, whereas the overall share was only 4% (Statistis-ches Bundesamt, 2007).18 Thus, the difference in the educational structure
17Before the Hartz IV reforms 2005 unemployment benefit claims strongly depended onthe time that a person has worked in Germany.
18Nevertheless, as shown in Geis et al. (2010), differentiating between education groups,immigrant unemployment rates are still considerably higher than native unemploymentrates.

Chapter 4: Foreigner Unemployment in Germany 87
between immigrants and natives may explain the unemployment gap.
From a theoretical point of view, the effects of low education and lowexperience levels of immigrants on the baseline component of the unemploy-ment gap are obvious. The German labor market exhibits frictions that affectprimarily low skilled labor. In particular, the generous social benefits in Ger-many lead to such frictions. These frictions prevent wages from declining tothe equilibrium level and thus lead to unemployment. By the same reason-ing, an effect of education and experience on the situation component of theunemployment gap can be explained. A worsening of the labor market sit-uation is generally connected to a reduction of productivity. This reductionshould lead to declining wages. However, labor market frictions prevent wagereductions, so that unemployment increases. As the frictions are stronger forlow skilled people, their unemployment increases more. Thus, low educa-tion levels of immigrants can also explain the situation component of theunemployment gap.
As to cyclical changes which are the driving force behind changes in thelabor market, there is yet another explanation for the different reactions ofimmigrant and native unemployment. For most jobs, firm or job specifichuman capital is necessary. Firm specific human capital has, at least partly,to be financed by the employer. Hence, hiring a new worker is more costlythan retaining an incumbent worker. If a worker is not needed for a certaintime but his job has to be filled again later on, depending on the time span,it can pay off for the employer to hold the worker. The higher the job specifichuman capital of a worker, the more likely he is retained for a certain timespan, for instance during a recession, although he is not needed. High skilledworkers generally need more firm specific human capital than low skilledworkers, think for instance of assembly-line workers and developing engineers.Thus, they are more likely retained. Unfortunately, thorough theoretical andempirical research in how far the effects of business cycles on low and highskilled labor differ does not yet exists.19 Nevertheless, additional estimation
19Hoynes (2009) and Dustmann et al. (2010) indicate that low skilled workers arestronger affected by business cycles.

Chapter 4: Foreigner Unemployment in Germany 88
results, discussed in Appendix A, show that low skilled unemployment inGermany indeed reacts more to changes in the labor-market situation thanhigh skilled unemployment.
To control for education in my estimations, I use the Comparative Anal-ysis of Social Mobility in Industrial Nations (CASMIN) classification for ed-ucational degrees. The CASMIN classification divides educational degreesinto eight20 groups (see Brauns et al., 2003). It is similar to the InternationalStandard Classification of Education (ISCED), but considers explicitly vo-cational degrees. These vocational degrees play an important role on theGerman labor market. Thus, they should be considered analyzing unem-ployment. Employment experience is directly observed in the GSOEP.21
Following the literature, I also include its square in the regressions to controlfor potential non-linearities. Not only employment experience but also un-employment experience can affect human capital and labor market success ofan individual. Motivation often decreases and skills that have to be trainedcontinuously, such as fluency in a foreign language, decline. Analogous toemployment experience, I also add unemployment experience and its squarein my estimations. In addition to education and experience, I also control inall regression for sex, age and birth cohort (measured by year of birth).
Estimation results with controls for education, experience and personalcharacteristics are given in table 4.4.22 All estimates, including the ones forunemployment experience, have the expected signs and are highly signifi-cant (except for one CASMIN dummy). Defining immigrants as foreigners,the estimate for the baseline component of the unemployment gap is 1.5percentage points and the estimate for the situation component is 0.15 per-centage points. Both are statistically significant. A comparison with theresults without controls shows that educational degrees and experience re-
20In the GSOEP and in my estimations level 2c is further divided into vocational andgeneral maturity.
21The GSOEP even distinguishes between experience in full and part time employment.I use the sum of the two as employment experience.
22The square terms do not appear in the tables, as for them no own marginal effectexists. Their estimates are highly significant.

Chapter 4: Foreigner Unemployment in Germany 89
Table 4.4: Estimates with controls for education and experience
(1) (2) (3) (4) (5) (6)Unemploymentrate
0.0036*** 0.0036*** 0.0063*** 0.0036*** 0.0036*** 0.0036***
(0.0003) (0.0003) (0.0009) (0.0003) (0.0003) (0.0003)Foreigner 0.0149*** 0.0146*** 0.0082 0.0127*** 0.0116***
(0.0024) (0.0024) (0.0070) (0.0029) (0.0029)Foreigner*unempl. 0.0015** 0.0019*** 0.0064*** 0.0014* 0.0012***
(0.0007) (0.0007) (0.0023) (0.0007) (0.0007)Foreign born 0.0135***
(0.0024)Foreign born*un. 0.0008
(0.0007)Female 0.0061*** 0.0072*** 0.1487*** 0.0056*** 0.0061*** 0.0061***
(0.0017) (0.0017) (0.0057) (0.0017) (0.0017) (0.0017)Age 0.0004*** 0.0004*** 0.0141*** 0.0004*** 0.0004*** 0.0004***
(0.0001) (0.0001) (0.0005) (0.0001) (0.0001) (0.0001)Birth year -0.0003*** -0.0003*** -0.0024*** -0.0003*** -0.0003*** -0.0003***
(0.0001) (0.0001) (0.0003) (0.0001) (0.0001) (0.0001)Employment -0.0011*** -0.0012*** -0.0192*** -0.0011*** -0.0011*** -0.0011***experience (0.0001) (0.0001) (0.0005) (0.0001) (0.0001) (0.0001)Unemployment 0.0171*** 0.0183*** 0.0593*** 0.0170*** 0.0171*** 0.0170***experience (0.0006) (0.0006) (0.0036) (0.0006) (0.0006) (0.0006)CASMIN 1a 0.0329*** 0.0346*** 0.1352*** 0.0350*** 0.0328*** 0.0317***(inad. completed) (0.0062) (0.0062) (0.0154) (0.0063) (0.0062) (0.0062)CASMIN 1b 0.0189*** 0.0187*** 0.0739*** 0.0198*** 0.0188*** 0.0189***(gen. el. school) (0.0033) (0.0032) (0.0098) (0.0033) (0.0033) (0.0033)CASMIN 1c 0.0110*** 0.0113*** 0.0527*** 0.0112*** 0.0110*** 0.0114***(basic voc. qual.) (0.0024) (0.0024) (0.0081) (0.0024) (0.0024) (0.0024)CASMIN 2b 0.0012 0.0037 0.0261** 0.0019 0.0011 0.0010(inter. gen. qual.) (0.0037) (0.0037) (0.0119) (0.0037) (0.0037) (0.0037)CASMIN 2c-gen. -0.0164*** -0.0171*** 0.0754*** -0.0166*** -0.0164*** -0.0165***(gen. mat. cert.) (0.0028) (0.0030) (0.0149) (0.0028) (0.0028) (0.0028)CASMIN 2c-voc. -0.0131*** -0.0135*** -0.0659*** -0.0134*** -0-0130*** -0-0131***(voc. mat. cert.) (0.0029) (0.0029) (0.0101) (0.0029) (0.0029) (0.0029)CASMIN 3a -0.0136*** -0.0154*** -0.1088*** -0.0139*** -0.0135*** -0.0135***(lower tert. ed.) (0.0035) (0.0033) (0.0123) (0.0035) (0.0035) (0.0036)CASMIN 3b -0.0167*** -0.0154*** -0.1282*** -0.0169*** -0.0167*** -0.0167***(higher tert. ed.) (0.0027) (0.0027) (0.0086) (0.0027) (0.0027) (0.0027)Degree abroad 0.0031
(0.0031)Years abroad 0.0002
(0.0001)R2 0.2388 0.2350 0.2395 0.2384 0.2388 0.2389Observations 122956 133536 158451 122956 122956 122956Sample A+B A-D A+B A+B A+B A+B
The dependent variable is a dummy variable for unemployment/employment, in (3) it is non-employment/employment. The estimation method is pooled Probit and the displayed coefficients aremarginal effects at the mean. Standard errors are given in parenthesis; * significant at the 10%-level, **significant at the 3%level and *** significant at the 1%-level. The reference category for the educationlevels is CASMIN 2a (intermediate vocational qualification).
duce the estimate for the baseline component by about 3/4 and the estimatefor the situation component by about 4/5. Defining immigrants as foreignborn leads to a similar estimate for the baseline component of 1.4 percentagepoints. However, the situation component of 0.8 percentage points is con-

Chapter 4: Foreigner Unemployment in Germany 90
Table 4.5: Home country specific estimates with controls
(1) (2) (3) (4) (5) (6)Unemployment rate 0.0035*** 0.0035*** 0.0035*** 0.0032*** 0.0031*** 0.0052***
(0.0003) (0.0003) (0.0003) (0.0003) (0.0003) (0.0012)Born in Turkey 0.0251*** 0.0125** 0.0062 0.0068 0.0055 0.0303
(0.0042) (0.0049) (0.0049) (0.0058) (0.0057) (0.0192)Turkey*unemployment 0.0033** 0.0028** 0.0022* 0.0031** 0.0035** 0.0107**
(0.0014) (0.0013) (0.0013) (0.0015) (0.0015) (0.0050)Former Yugoslavia 0.0073 -0.0030 -0.0082* -0.0082 -0.0105** -0.0567***
(0.0050) (0.0051) (0.0047) (0.0053) (0.0052) (0.0196)Yugoslavia*unempl. 0.0036** 0.0021 0.0018 0.0013 0.0015 0.0096*
(0.0014) (0.0013) (0.0011) (0.0012) (0.0013) (0.0056)Southern Europe 0.0069* 0.0006 -0.0052 -0.0070 -0.0095** -0.0610***
(0.0038) (0.0042) (0.0043) (0.0047) (0.0045) (0.0180)S. Europe*unempl. -0.0021 -0.0019 -0.0022* -0.0017 -0.0016 0.0004
(0.0014) (0.0014) (0.0012) (0.0013) (0.0012) (0.0050)Eastern Europe 0.0081 0.0076 0.0069 0.0093 0.0197*** 0.0338
(0.0082 (0.0091) (0.0089) (0.0108) (0.0058) (0.0268)E. Europe*unempl. 0.0008 0.0016 0.0016 0.0017 -0.0005 0.0025
(0.0020) (0.0021) (0.0021) (0.0022) (0.0017) (0.0076)Born elsewhere 0.0102 0.0085 0.0045 -0.0039 0.0047 0.0095
(0.0065) (0.0078) (0.0075) (0.0070) (0.0072) (0.0299)Elsewere*unempl. -0.0012 -0.0018 -0.0018 -0.0033 -0.0033 -0.0019*
(0.0022) (0.0027) (0.0025) (0.0025) (0.0020) (0.0103)Mostly foreign 0.0087*** 0.0075*** 0.0069*** 0.0082*** 0.0687***language at home (0.0021) (0.0022) (0.0024) (0.0024) (0.0144)Partly foreign 0.0046*** 0.0032** 0.0036** 0.0038** 0.0237**language at home (0.0015) (0.0016) (0.0018) (0.0016) (0.0107)Foreigner 0.0091** 0.0055 0.0071 -0.0076
(0.0039) (0.0045) (0.0044) (0.00141)No contact 0.0173** 0.0188*** 0.0519***to Germans (0.0068) (0.0068) (0.0187)Number of friends -0.0004*** -0.0004*** -0.0013**
(0.0001) (0.0001) (0.0006)R2 0.2395 0.2489 0.2489 0.2579 0.2541 0.3124Observations 122956 104165 104165 82093 90637 105238Sample A+B A+B A+B A+B A-D A+B
The dependent variable is a dummy variable for unemployment/employment, in (6) it is non-employment/employment. The estimation method is pooled Probit and the displayed coefficients aremarginal effects at the mean. Standard errors are given in parenthesis; * significant at the 10%-level, **significant at the 3%level and *** significant at the 1%-level. Not shown in the table in all regressionCASMIN-Dummies, (squared) employment and unemployment experience, age birth year and sex wereused as additional explaining variables.
siderably smaller and insignificant. Differentiating between home countrygroups leads to similar findings, see table 4.5. Only the baseline componentfor people from Turkey and the situation components for people from Turkeyand former Yugoslavia are still significant at the 5 percent level.23 Comparedto the regression without controls, all estimates for the components of the
23At the 10 percent level, the baseline component for people from Southern Europe isalso significant.
Chapter 4: Foreigner Unemployment in Germany 91
unemployment gap decreased by more than 2/3.
Although foreign educational degrees are officially equivalent to nativedegrees, their contents can strongly differ. Thus, people who have acquireda degree abroad may not be perfect substitutes for people who have acquiredthe degree in the immigration country. This could be one explanation whythe unemployment gap is still significant. The GSOEP contains the informa-tion whether the highest degree has been acquired in Germany or abroad.24
Including an indicator for the place of the highest degree in my regression, Ifind no significant effect for it. Besides degrees, working experience may alsobe imperfectly comparable over countries. Therefore, I also use the years aperson has lived abroad as additional control. The estimated effect is alsoinsignificant. In both cases, the estimates for the situation component of theunemployment gap virtually did not change. The changes in the estimatesfor the baseline component are not significant. Thus, the place where edu-cational degrees and employment experience are acquired does obviously notplay an important role for the success of immigrants in the German labormarket.
4.5 Assimilation and language usage
Beginning with Chiswick (1978), numerous economic papers deal with theeffects of assimilation on the labor market success of immigrants. Most ofthem measure labor market success by income. Nevertheless, some papersas Clark and Lindley (2009) and Venturini and Villosio (2008) also considerthe employment probability as an additional indicator.25 Empirical analy-ses have shown that, (directly) after arriving in the immigration country,immigrants earn much lower wages and have a lower probability to be em-ployed than comparable natives. With the time that immigrants have spent
24I use a dummy variable indicating, if a person has acquired her highest educationalor her highest vocational degree or both abroad.
25Amuedo-Dorantes and de la Rica (2007) analyze occupational assimilation instead ofincome assimilation.

Chapter 4: Foreigner Unemployment in Germany 92
in the immigration country, their wages converge to the level of comparablenatives.26 With respect to employment, such an assimilation process is lessobvious (see Clark and Lindley, 2009; Venturini and Villosio, 2008). The needfor immigrant assimilation can be explained by lacking immigration countryspecific skills, especially language fluency, at the time of arrival.27
The number of years an immigrant has lived in the immigration countryis an obvious and often used measure for assimilation. As long as only im-migrants are considered, the usage of years since migration as an explainingvariable in a regression analysis does not pose a problem. However, as theaim of my estimations is to explain differences in the unemployment ratesbetween natives and foreigners, I necessarily also have to consider observa-tions for natives. Years since migration cannot even be set missing for them.What is now the “right” value for the years since migration of natives? Atfirst sight, one could think of setting years since migration to zero for natives.However, this is nonsense, as it would mean that natives have the same de-gree of assimilation as foreigners who have just arrived. Another possibilitywould be to set years since migration equal to some large value (e.g. 100 orthe life expectancy). Nevertheless, the (exact) value for years of migrationwould neither be justified.
There is a possibility to control for years since migration in the regressionsin spite of this problem. If the number of years that an individual has lived inGermany is used as an additional control variable, years since migration canbe interpreted as an interaction between years in Germany and being foreignborn.28 Including the two variables in my baseline estimation, the estimatefor years since migration is statistically insignificant and positive, see table
26See Borjas (1994) and Borjas (1999a).27Immigrant assimilation can also be explained independent of an increase in human
capital. Assume that there is on the job search of the Burdett and Mortensen (1998)-type.Immigrants have to anew start their career path when they enter the immigration country(searching a first job, improving their wages by job changes and wage bargaining etc.).Thus, their wages successively assimilate to the native wage level.
28This means that natives get a value of zero. However, in the calculation of the marginaleffects, it is considered that years since migration only have explaining power for foreigners.
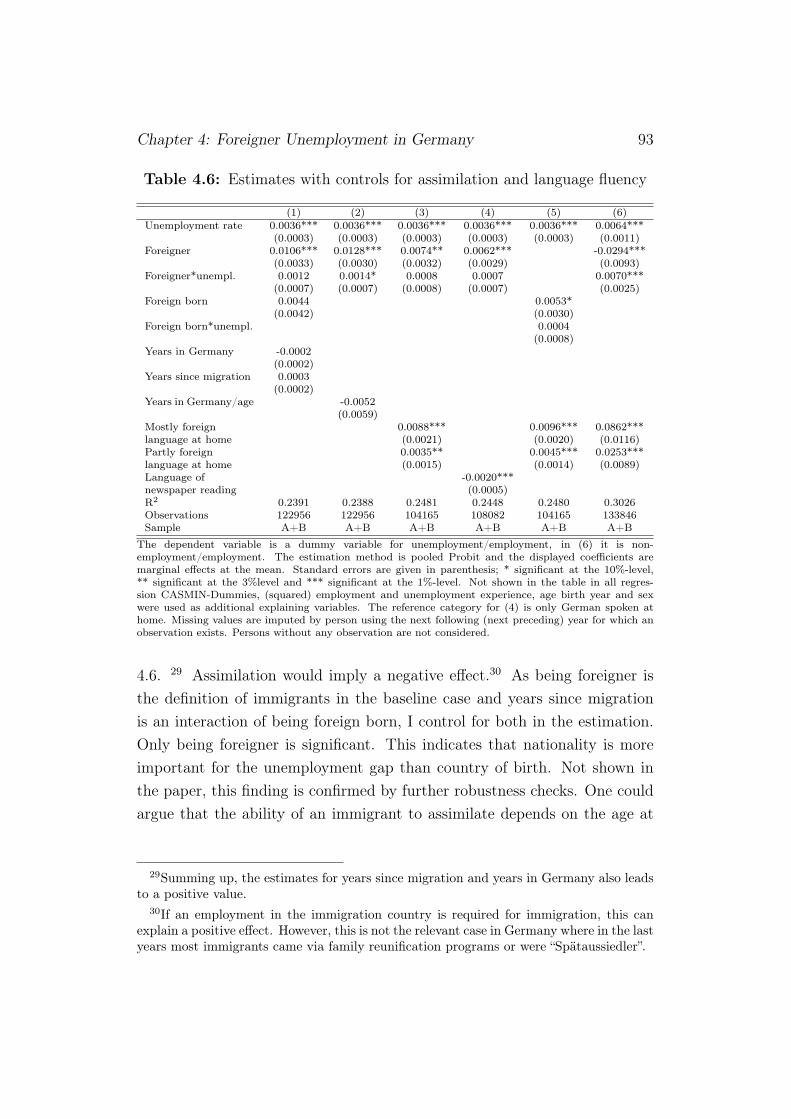
Chapter 4: Foreigner Unemployment in Germany 93
Table 4.6: Estimates with controls for assimilation and language fluency
(1) (2) (3) (4) (5) (6)Unemployment rate 0.0036*** 0.0036*** 0.0036*** 0.0036*** 0.0036*** 0.0064***
(0.0003) (0.0003) (0.0003) (0.0003) (0.0003) (0.0011)Foreigner 0.0106*** 0.0128*** 0.0074** 0.0062*** -0.0294***
(0.0033) (0.0030) (0.0032) (0.0029) (0.0093)Foreigner*unempl. 0.0012 0.0014* 0.0008 0.0007 0.0070***
(0.0007) (0.0007) (0.0008) (0.0007) (0.0025)Foreign born 0.0044 0.0053*
(0.0042) (0.0030)Foreign born*unempl. 0.0004
(0.0008)Years in Germany -0.0002
(0.0002)Years since migration 0.0003
(0.0002)Years in Germany/age -0.0052
(0.0059)Mostly foreign 0.0088*** 0.0096*** 0.0862***language at home (0.0021) (0.0020) (0.0116)Partly foreign 0.0035** 0.0045*** 0.0253***language at home (0.0015) (0.0014) (0.0089)Language of -0.0020***newspaper reading (0.0005)R2 0.2391 0.2388 0.2481 0.2448 0.2480 0.3026Observations 122956 122956 104165 108082 104165 133846Sample A+B A+B A+B A+B A+B A+B
The dependent variable is a dummy variable for unemployment/employment, in (6) it is non-employment/employment. The estimation method is pooled Probit and the displayed coefficients aremarginal effects at the mean. Standard errors are given in parenthesis; * significant at the 10%-level,** significant at the 3%level and *** significant at the 1%-level. Not shown in the table in all regres-sion CASMIN-Dummies, (squared) employment and unemployment experience, age birth year and sexwere used as additional explaining variables. The reference category for (4) is only German spoken athome. Missing values are imputed by person using the next following (next preceding) year for which anobservation exists. Persons without any observation are not considered.
4.6. 29 Assimilation would imply a negative effect.30 As being foreigner isthe definition of immigrants in the baseline case and years since migrationis an interaction of being foreign born, I control for both in the estimation.Only being foreigner is significant. This indicates that nationality is moreimportant for the unemployment gap than country of birth. Not shown inthe paper, this finding is confirmed by further robustness checks. One couldargue that the ability of an immigrant to assimilate depends on the age at
29Summing up, the estimates for years since migration and years in Germany also leadsto a positive value.
30If an employment in the immigration country is required for immigration, this canexplain a positive effect. However, this is not the relevant case in Germany where in the lastyears most immigrants came via family reunification programs or were “Spätaussiedler”.

Chapter 4: Foreigner Unemployment in Germany 94
which she has immigrated. Then, an obvious measure for assimilation wouldbe years in Germany relative to age. Compared to years since migration, thismeasure has the additional advantage that no control for years in Germanyis needed. Such a control can be problematic in combination with age. Theestimated effect for this relative assimilation measure is negative, as expected(see table 4.6). However, it is insignificant. Thus, my estimation resultsindicate that the time immigrants have spent in Germany does not explaintheir employment situation. It is neither an (important) determinant of thenative-immigrant unemployment gap.
Language skills are generally the most important part of country specifichuman capital. Thus, they are probably a better measure for the labormarket relevant aspects of immigrant assimilation than years since migration.The GSOEP does not directly measure the fluency of immigrants in theGerman language. However, it contains a question on the language spokenat home. Three response options are given: mostly German, mostly mynative language and both. Using this information, I built dummy variablesfor speaking mostly a foreign language at home and speaking partly a foreignlanguage at home (the answer both).31 Including these two dummies in mybaseline specification, I get highly significant and positive estimates for them.In addition, as expected, the estimate for mostly speaking a foreign languageat home is larger than the estimate for partly speaking a foreign language.The inclusion of language skills into my estimation has also a strong effecton the estimates for both components of native-immigrant unemploymentgap. The baseline component is with 0.74 percentage points only abouthalf as large as in the case without these controls (1.49 percentage points).Nevertheless, it is still significant at the 5 percent level. The estimate for thesituation component is statistically insignificant and, with 0.08 percentagepoints, negligibly small.32
31This information is not available for all years. For immigrants, for whom at least oneobservation exists, missing years have been imputed. In a loop, missing values have in afirst step been replaced by the value for the following year and in a second step by thevalue of the preceding year.
32The estimate indicates that an increase in overall unemployment by 10 percentage
Chapter 4: Foreigner Unemployment in Germany 95
Robustness checks confirm these results. Defining immigrants as foreignborn people leads to a similar picture, although the estimate for the baselinecomponent is only 0.53 percentage points and significant at the 10 percentlevel, see table 4.6. Differentiating between home country groups, only base-line and situation component for people from Turkey remain significant, seetable 4.5. Considering countries of birth, naturalization and thus nationalitycan also be a measure of assimilation. Including a foreigner dummy, the base-line effect for people from Turkey also becomes insignificant. Analyzing thenative-immigrant employment gap instead of the unemployment gap leads topeculiar results: The estimate for the baseline component is highly significantand negative. The estimate for the situation component is highly significantand positive. This would indicate that, in good economic situations, foreign-ers are less likely to be non-working than comparable natives but react moreto economic changes by leaving the labor market. As a further robustnesscheck, I use a different measure of language skills. The GSOEP containsalso the following question: What nationality newspaper do you read? withresponse options ranging from Only newspaper of my home country (1) toonly German newspapers (5).33 Using this variable instead of the languagespoken at home leads to similar estimates for the two components of the un-employment gap, see table 4.6.34 Nevertheless, as many people do not readnewspapers regularly, this measure may be doubtful. Therefore, languagespoken at home is used as control for language skills in the following.
Altogether, my estimates show that the language skills of immigrants, ormore broadly their country specific human capital, are an important expla-nation for the native-immigrant unemployment gap. Controlling for usageof the German language, the situation component of the gap becomes in-
points leads only to a 0.8 percentage points higher increase in the unemployment rate ofimmigrants compared to the increase in the unemployment rate of natives with the samehuman capital endowment. An effect that is obviously economically insignificant.
33Natives are assumed to read only German newspapers. For immigrants who state toread no newspaper at all, the variable is set to missing. Missing years are imputed asdescribed above.
34Not shown in the paper including both measures in the same regression leads topeculiar results.

Chapter 4: Foreigner Unemployment in Germany 96
significant. Thus, the stronger reaction of immigrant unemployment to la-bor market changes can potentially be fully explained by their lower humancapital endowment. Lacking language skills are also an explanation for thebaseline component of the gap. Nevertheless, the baseline component is notfully explained by differences in human capital endowment. In addition, theresults in this section indicate that years since migration are not closely re-lated to language skills and cannot explain immigrant unemployment. Thisis in line with Schmidt (1997) who shows that earnings of immigrants inGermany neither strictly increase with years since migration. Obviously, thelabor market situation of immigrants does not automatically improve withthe time spent in Germany.
4.6 Discrimination and social networks
In the preceding sections, I have analyzed the impact of differences in humancapital endowment on the native-immigrant unemployment gap and foundthat these differences cannot fully explain the gap. Although human capitalis surely the most important determinant of the labor market success ofan individual, it is not the only one. Her social position also affects herlabor-market situation. Various factors determine the social position of anindividual. Such factors are the influence that she has on others, the extentto which others owe her favors and the number and social positions of otherindividuals with whom she is acquainted. Human capital is certainly animportant determinant of the social position of an individual. However,it cannot fully explain it.35 Other factors, such as the possessions of anindividual and the social position of her parents, also play an important role.
There are various modes of action how an individual’s position in thesociety, or more concretely her social network, affects her labor market suc-cess. First, social contacts determine which information she has about the
35In how far the position is explained by human capital depends on in how far soft skills,such as capacity for teamwork, are regarded as human capital.

Chapter 4: Foreigner Unemployment in Germany 97
labor market.36 This information is particularly important for job search.Even though job offers are publicized, social contacts can help individualsto find out about it, as collecting information on job offers is not costless.The second mode of action is also related to the information flow. Potentialemployers have more information about people with whom they have director indirect social contacts. Everything else equal, a risk averse employer willprefer a candidate about whom she has more information.
A further argument why employers should prefer applicants with a highsocial position is gift exchange. Potential employers may already owe thecandidate or some of his relatives a favor, or they may want the candidateor his relatives to owe them a favor. In Germany, gift exchange is probablynot important for regular jobs, but it may play a role for internships andthe like. In addition, the position in the society determines the self-image ofan individual. A strong position generally leads to a better self-assessment.This, in turn, helps the individual to sell well in job interviews and thelike. Many more channels through which the position of an individual in thesociety affect her labor-market success are imaginable. Unfortunately, thereis not yet much research on the effects of the social position on the labormarket success of individuals (see Granovetter, 2005; Montgomery, 1991, fortheoretical approaches).
The most obvious argument why the position of immigrants in the soci-ety should on average be lower than the position of natives is discrimination.Other members of the society may simply not be willing to have social con-tacts to them, because they are immigrants, or because of their ethnicity(discrimination in the sense of Becker, 1971). Thus, employers may not bewilling to hire immigrants. Beckerian discrimination is not the only poten-tial explanation for disadvantages of immigrants in recruitment processes.Information asymmetries and statistical discrimination may also play a role.In particular with respect to application documents, there can be very pro-nounced information asymmetries. A potential employer can often quite
36It can also affect the time, when she has the information. Having earlier the informa-tion of a job offer, an individual can for instance better prepare application documents.

Chapter 4: Foreigner Unemployment in Germany 98
exactly assess the content of native degrees and the quality of native edu-cational institutions, whereas she has hardly an idea of foreign degrees andinstitutions. If such an employer is risk averse, she always prefers a nativeworker to a comparable immigrant worker. Similarly, immigrants, or certaingroups of them, may on average have bad labor market relevant characteris-tics compared to natives, e.g. worse skills in the German language. In thiscase, an employer who cannot completely observe these characteristics mayalso prefer native applicants (statistical discrimination).37
The effect of discrimination on the labor market success of immigrants isoften measured by the following approach. In an estimation, controls for allobserved labor market relevant characteristics are used. The remaining dif-ference between immigrants and natives is ascribed to discrimination, see forinstance Nielsen et al. (2004). This approach is not convincing as it requiresthat all labor market relevant characteristics are observed.38 Otherwise theestimated discrimination effect is biased and no statement on discriminationcan be made. In general, there is hardly an alternative to this approach, asan objective measure for discrimination does not exists. The GSOEP offersa question on experienced discrimination. Of course, self-assessed discrimi-nation is no clean measure for real discrimination. Immigrants will often notbe aware that they have worse labor market relevant characteristics than na-tives and ascribe disadvantages to discrimination. Nevertheless, estimationresults should give us at least an idea about the effects of discrimination.They should more or less be an upper bound. The exact wording of thequestion about discrimination is: Over the last two years how often wereyou discriminated against in Germany based on your origin? with responseoptions never, seldom and often.39 Including dummies for being often andseldom discriminated against affects the estimates for the unemployment gap.Not only the estimate for the situation component, that has already been in-
37See e.g. Altonji and Pierret (2001), Chaudhuri and Sethi (2008).38Moreover, it has to be controlled for all non-linearities in the effects of these charac-
teristics.39Missing values are imputed as for language spoken at home.
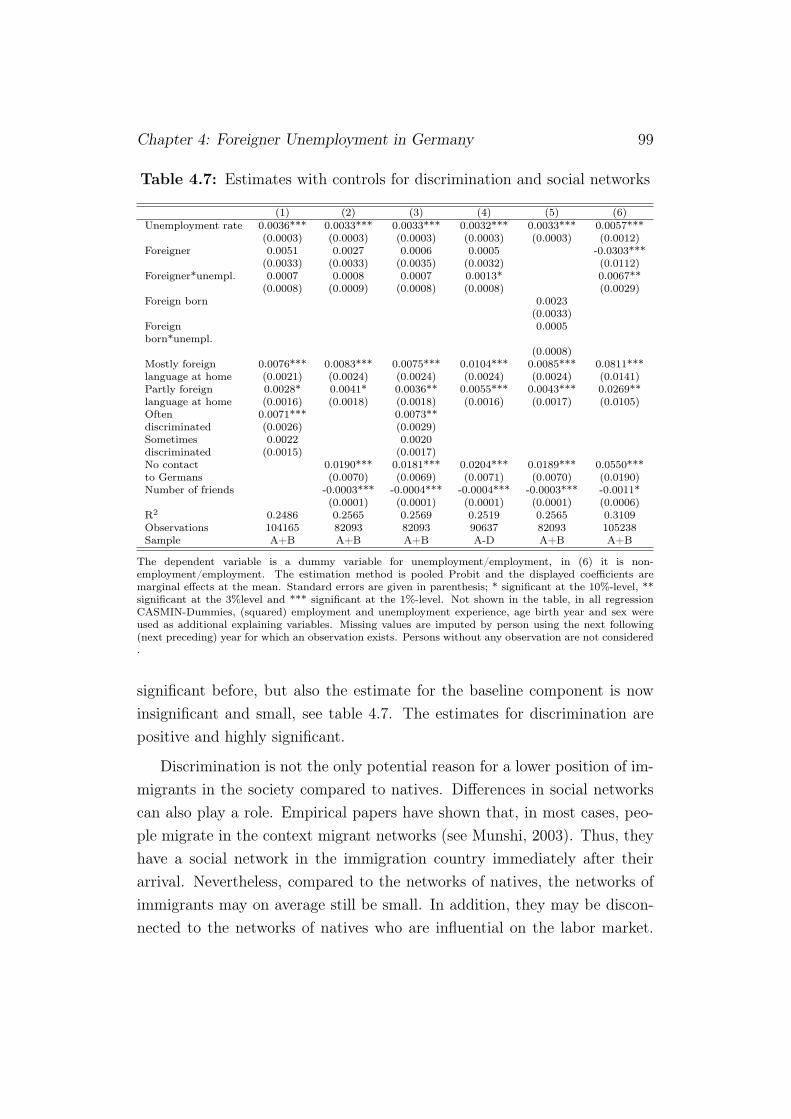
Chapter 4: Foreigner Unemployment in Germany 99
Table 4.7: Estimates with controls for discrimination and social networks
(1) (2) (3) (4) (5) (6)Unemployment rate 0.0036*** 0.0033*** 0.0033*** 0.0032*** 0.0033*** 0.0057***
(0.0003) (0.0003) (0.0003) (0.0003) (0.0003) (0.0012)Foreigner 0.0051 0.0027 0.0006 0.0005 -0.0303***
(0.0033) (0.0033) (0.0035) (0.0032) (0.0112)Foreigner*unempl. 0.0007 0.0008 0.0007 0.0013* 0.0067**
(0.0008) (0.0009) (0.0008) (0.0008) (0.0029)Foreign born 0.0023
(0.0033)Foreignborn*unempl.
0.0005
(0.0008)Mostly foreign 0.0076*** 0.0083*** 0.0075*** 0.0104*** 0.0085*** 0.0811***language at home (0.0021) (0.0024) (0.0024) (0.0024) (0.0024) (0.0141)Partly foreign 0.0028* 0.0041* 0.0036** 0.0055*** 0.0043*** 0.0269**language at home (0.0016) (0.0018) (0.0018) (0.0016) (0.0017) (0.0105)Often 0.0071*** 0.0073**discriminated (0.0026) (0.0029)Sometimes 0.0022 0.0020discriminated (0.0015) (0.0017)No contact 0.0190*** 0.0181*** 0.0204*** 0.0189*** 0.0550***to Germans (0.0070) (0.0069) (0.0071) (0.0070) (0.0190)Number of friends -0.0003*** -0.0004*** -0.0004*** -0.0003*** -0.0011*
(0.0001) (0.0001) (0.0001) (0.0001) (0.0006)R2 0.2486 0.2565 0.2569 0.2519 0.2565 0.3109Observations 104165 82093 82093 90637 82093 105238Sample A+B A+B A+B A-D A+B A+B
The dependent variable is a dummy variable for unemployment/employment, in (6) it is non-employment/employment. The estimation method is pooled Probit and the displayed coefficients aremarginal effects at the mean. Standard errors are given in parenthesis; * significant at the 10%-level, **significant at the 3%level and *** significant at the 1%-level. Not shown in the table, in all regressionCASMIN-Dummies, (squared) employment and unemployment experience, age birth year and sex wereused as additional explaining variables. Missing values are imputed by person using the next following(next preceding) year for which an observation exists. Persons without any observation are not considered.
significant before, but also the estimate for the baseline component is nowinsignificant and small, see table 4.7. The estimates for discrimination arepositive and highly significant.
Discrimination is not the only potential reason for a lower position of im-migrants in the society compared to natives. Differences in social networkscan also play a role. Empirical papers have shown that, in most cases, peo-ple migrate in the context migrant networks (see Munshi, 2003). Thus, theyhave a social network in the immigration country immediately after theirarrival. Nevertheless, compared to the networks of natives, the networks ofimmigrants may on average still be small. In addition, they may be discon-nected to the networks of natives who are influential on the labor market.
Chapter 4: Foreigner Unemployment in Germany 100
A rough measure for the size of the social network of an individual is thenumber of her (good) friends. The GSOEP contains a question on this. Arough measure for the connection of immigrant and native networks are pri-vate contacts between immigrants and natives. Based on questions abouthaving been on a visit to Germans or having be visited by Germans withinthe the last 12 months, I built a dummy variable indicating if an immigranthas private contacts to Germans or not. Including these two variables in myestimations has the same effect as including discrimination. The estimatefor the situation component and the estimate for the baseline component areboth insignificant and small, see table 4.7. Having no contacts to Germans ishighly significant and has the expected positive sign. The number of friendsis highly significant and has the expected negative sign. Various robustnesschecks lead to the same results, see tables 4.5 and 4.7.
Including both self-assessed discrimination and number of friends andno contact to Germans in a regression, both have significant effects (seetable 4.7). Thus, the effect of discrimination on employment is not fullyexplained by my measures for differences in social networks. Nevertheless,this does not necessarily mean that discrimination plays an important rolein the German labor market. On the one hand, self-assessed discriminationis at least to a certain degree endogenous, so that the estimate may beupward biased. On the other hand, my measures for social networks arevery rough. My estimates show that social networks have an effect on theindividual employment probability. However, they probably do not capturethe complete effect of social networks on un-/employment. Therefore, oneshould also be cautious interpreting these estimates quantitatively.
My results indicate that the worse social position of immigrants and inparticular smaller social networks can be an explanation for their high un-employment. However, one has to be a bit cautious in interpreting this asa causal relation. The employment situation of a person can have an ef-fect on her social position. As co-workers often become part of the socialnetwork, employment may enlarge the network. In addition, as staffs inmost cases consist of immigrants and natives, employment may increase theprobability that immigrants have social contacts to Germans. With respect

Chapter 4: Foreigner Unemployment in Germany 101
to discrimination, the same holds. Immigrants may not be discriminatedagainst because they are immigrants, but because they are immigrants andunemployed; think of the “welfare magnet” debate. Nevertheless, my resultsshow that the high unemployment of immigrants is related to their socialposition and in particular to their social networks. Thus, social networks areprobably an important issue for future research on the labor market situationof immigrants.
4.7 Conclusions
The unemployment rate of immigrants in Germany is not only higher than therate of natives. It also reacts more to changes in the labor market situation.Decomposing the native-immigrant unemployment gap into a baseline anda situation component, I find a baseline component of 5.6 percentage pointsand a situation component of 0.7 percentage points. The large part of thedifference, about 3/4 of the baseline and 4/5 of the situation component, canbe explained by differences in the endowment with “classical” human capital(educational degrees and experience). Also controlling for language skills,the situation component becomes insignificant and the baseline componentagain decreases by 1/2. Adding (self-assessed) discrimination and/or controlsfor social networks the baseline component also becomes insignificant.
What do these results imply for immigration and integration policy? IfGermany wants to decrease its immigrant unemployment, it has to improvethe education of immigrants. In the long run, a higher educational level willquite likely also improve the position of immigrants in the German society.Improving fluency in the German language is probably easier for an immi-grant than reaching a higher educational degree. Good language skills areactually a precondition to acquire an additional degree in Germany. Thus,the starting point for integration policy are (better) language classes for im-migrants. Possibly, immigrants have to be obligated to join this programs.The native-immigrant unemployment gap in Germany is immense and thecosts of unemployment for the German state are large due to the generouswelfare state. Thus, if a measure to improve the human capital of immigrants

Chapter 4: Foreigner Unemployment in Germany 102
is effective, even rather high investments in it will pay off. Hence, researchand political effort should be put in the search for effective measures.
My results also have some implication for further research on integrationof immigrants. First, besides human capital, social networks and the likeare also an explanation for differences in the labor-market success betweenimmigrants and natives. To fully understand how social networks affect thelabor market success of immigrants, more theoretical and empirical researchis necessary. Disentangling the effects of discrimination and social networkswould not only be an enrichment for the (economic) research on integrationand minorities. Social networks can also be a starting point for integrationpolicy. Second, immigrant employment in Germany reacts much strongerto changes on the labor market, especially business cycles, than native un-employment. Thus, the labor-market situation has to be considered whenanalyzing differences between immigrant and native un-/employment. Thisis particularly important for evaluations of immigration policy measures un-der changing labor market situations.
4.8 Appendix: Cyclicality of skill-specific un-employment
As discussed in section 3, there is not yet much evidence on the connectionbetween skill levels and cyclicality of unemployment. Using the data fromthe GSOEP, I test if low skilled unemployment reacts more to changes of thelabor-market situation than high skilled unemployment. Analogous to theanalysis of the situation component of the native-immigrant unemploymentgap, I regress individual un-/employment on the overall unemployment rate,the individual education level and an interaction between the two. The re-sults are given in table A1. They clearly show that low skilled unemploymentreacts more to changes on the labor market than high skilled unemployment.As I do not want to control for some sort of selection here, the regressionsare weighted by standard population weights.

Chapter 4: Foreigner Unemployment in Germany 103
Table 4.8: Estimates for the effect of labor market changes on skill-specificunemployment
(1) (2) (3) (4) (5) (6)Unempl. rate 0.0102*** 0.0074*** 0.0069*** 0.0035*** 0.0034*** 0.0036***
(0.0003) (0.0006) (0.0006) (0.0003) (0.0003) (0.0003)CASMIN -0.0172*** -0.0139*** -0.0070*** -0.0057***
(0.0009) (0.0010) (0.0006) (0.0004)CASMIN*unempl. -0.0023*** -0.0017*** -0.0009*** -0.0009***
(0.0002) (0.0003) (0.0002) (0.0001)ISCED -0.0187***
(0.0015)ISCED*unemployment -0.0024***
(0.0004)CASMIN 1a 0.0466***(inad. comp.) (0.0105)CASMIN1a*un. 0.0015
(0.0031)CASMIN 1b 0.0296***(gen. el. school) (0.0053)CASMIN1b*un. 0.0043**
(0.0017)CASMIN 1c 0.0164***(basic voc. qual.) (0.0034)CASMIN1c**un.. 0.0009
(0.0010)CASMIN 2b 0.0013(inter. gen. qual.) (0.0047)CASMIN2b*un. 0.0047***
(0.0012)CASMIN 2c-gen. -0.0219***(gen. mat. cert.) (0.0030)CASMIN2cg*un. -0.0016
(0.0010)CASMIN2c-voc. -0.0182***(voc. mat. cert.) (0.0045)CASMIN2cv*un. 0.0027**
(0.0012)CASMIN 3a -0.0136***(lower tert. ed.) (0.0048)CASMIN3a*un. -0.0030**
(0.0013)CASMIN 3b -0.0138***(higher tert. ed.) (0.0034)CASMIN3a*un. -0.0035***
(0.0010)R2 0.0650 0.0414 0.0316 0.2498 0.2387 0.2512Controls no no no yes yes yesSample Overall West West West A+B West
The estimation method is pooled Probit and the displayed coefficients are marginal effects at the mean;the dependent variable is individual unemployment. Except for (5), which is unweighed, all estimationsare weighted by population weights. Standard errors are given in parenthesis;* significant at the 10%-level,** significant at the 3%level and *** significant at the 1%-level. Controls include (squared) employmentand unemployment experience, age birth year sex and an foreigner/native. The reference category for theeducation levels in (6) is CASMIN 2a (intermediate vocational qualification).
5Why Applying Educational Requirements
for Naturalization?
5.1 Introduction
In most developed countries, passing a language test is a necessary conditionfor naturalization. In addition, some immigration countries, such as Ger-many and the US, require tests on their history, their political and socialsystems and the like. Such skill requirements for naturalization are the sub-ject of controversial public discussion. However scientific research has not yetfocused on them. The aim of this paper is to reveal the rationales behind skillrequirements for naturalization. In addition, this paper analyzes by means ofa theoretical model based on a human-capital approach how an immigrationcountry should optimally shape the requirements for naturalization.
Basically, one can distinguish two different motives for imposing skill re-quirements for naturalization. First, the government of an immigration coun-try may want to select its “new” citizens. Second, the government may wantto affect the educational structure of (naturalized) immigrants by means ofthese requirements. The government of an immigration country, which repre-sents the native population, can have an interest in the selection of additionalcitizens. With citizenship, immigrants generally obtain the right to vote inthe country. Thus, a large number of naturalizations can substantially af-fect election outcomes and hence the balance of powers in the country. The
104

Chapter 5: Educational Requirements for Naturalization 105
preferences of immigrants with respect to public goods and services may dif-fer from the preferences of natives. Thus, as political leaders will in manycases consider the needs of the naturalized immigrants when making deci-sions about public expenditure and taxes, naturalization can have negativeeconomic effects on the natives. Mariani (2004) analyzes the effect of natu-ralizations on political decisions. Discussing skill requirements for natural-ization as a measure to select naturalized immigrants raises a fundamentalquestion: There are many possible selection criteria (e.g. durations of stay).Why should the government of an immigration country base the selection of“new” citizens on the educational level of the immigrants? The educationallevel is an appropriate selection criterion, if the naturalization of high skilledis less problematic (or more attractive) for natives than the naturalization oflow skilled. This can be the case, if the native population is relatively welleducated and individual preferences with respect to public goods depend onthe educational level.
Skill requirements for naturalization can also be used as a measure toimprove the skill structure of (naturalized) immigrants. Basic prerequisitefor doing this is that immigrants adjust their educational level to the re-quirements. In general, immigrants will only adjust their educational level,if naturalization leads to some welfare gain for them. There are hardly anyobvious economic gains from naturalization. Permanent residence and work-ing permits are normally preconditions for naturalization. Thus, natural-ization does not directly improve the situation of immigrants in the labormarket. Moreover, in most countries permanent immigrants also have thesame claims for welfare benefits as natives (the US is a remarkable exception),so that naturalization does neither directly change the financial situation ofimmigrants. Nevertheless, naturalization has positive effects for immigrants.They can participate in political decisions and thus in the shaping of publicexpenditure and taxes. They get access to restricted jobs, such as policemanand attorney-at-law. And, the passport of the immigration country in manycases simplifies traveling abroad. These positive effects can be such valuablefor the immigrants that they are willing to make additional investments ineducation to meet the naturalization requirements.

Chapter 5: Educational Requirements for Naturalization 106
Why should an immigration country exploit the willingness of immigrantsto incur expenses for an improvement of their educational structure and notsimply “sell” the citizenship? Aside from the fact that, from an ethical per-spective, selling the citizenship would be highly problematic, some argumentsmilitate in favor of using naturalization requirements to improve the educa-tional structure of immigrants. Generally, the fiscal balance of a person –that is roughly her tax payments less her receipt of public benefit – increasesin her educational level. Moreover, high skilled workers may be more im-portant for the economic development of a country than low skilled workers,as high skilled work is for instance necessary for research and developmentactivities. Moreover, the educational levels of parents have an influence onthe educational levels of their children (see Tsukahara, 2007), so that an im-provement of the educational structure of immigrants can have a positivewelfare effect in the long run.
As stated above, economic research has not yet dealt with skill require-ments for naturalization. Altogether, social science research and, in par-ticular, economic research on naturalization policy is still extremely scarce.There is a series of econometric studies on the determinants of the individualnaturalization decision (e.g. Yang, 1995; Constant et al., 2007; Chiswick andMiller, 2008). Bratsberg et al. (2002) analyze the effects of naturalization onthe income of immigrants in the US and find a causal effect of naturalizationon the wages of naturalized immigrants. Fougère and Safi (2008), DeVoretzand Pivnenko (2006) and Bevelander and Veenmann (2008) show that nat-uralization also has a positive effect on the employability of immigrants.Setting a different focus, Bertocchi and Strozzi (2004) show that citizenshiplegislation has an effect on migration flows. Naturalization policy may notonly have economic effects on (naturalized) immigrants but also on the na-tive population. The only paper, I am aware of, that deals with such effectsis Mariani (2004), who analyzes naturalization policy in a political economyframework. He models an economy with a public good that is consumed onlyby part of the native population and shows that the form of the right to votein the country should have an effect on its naturalization policy.
My paper shall be a first step on the way towards a scientific foundation

Chapter 5: Educational Requirements for Naturalization 107
for the discussion about skill requirements for naturalization. In a first step,section 5.2 analyzes how skill requirements for naturalization affect the skillstructure of the immigrant population. In a second step, in section 5.3,I discuss how the government of an immigration country should set theserequirements. In my theoretical model, I assume that the government onlyconsiders the fiscal balance of the immigrants and maximizes native welfare.An immigration country has to consider further effects of naturalization, suchas the right to vote for the naturalized immigrants, when deciding aboutskill requirements for naturalization. How these further effects influence theoptimal requirement level is analyzed in section 5.4. If skill requirements fornaturalization have a positive welfare effect, this implies that they should alsobe imposed on the children of non-naturalized immigrants. In section 5.5,potential gains and risks from imposing skill requirements for these childrenare discussed. Section 5.6 concludes.
5.2 Naturalization and education
Most immigration countries use some form of skill requirements, such aspassing a language test or successfully taking language classes, for grantingnaturalization to immigrants. For immigrants who already possess all skillsthat are required or would eventually acquire these skills anyway, the require-ments will generally not affect behavior. For immigrants who lack at leastsome of the required skills, the decision becomes more difficult. If they wantto be naturalized, they have to invest in additional skills. The more skillsare missing, the more they have to invest. Such an investment is costly andwill often appear as an too high, if judged from the direct expected returnsfrom enhanced income and employment perspectives alone.
In most cases, naturalization increases the overall lifetime welfare of im-migrants. With naturalization, they acquire the right to vote and can partic-ipate in decisions about taxes and public goods. They get access to certainrestricted occupations that require citizenship, such as police officers. Ad-ditionally, the passport of the immigration country in many cases facilitatestraveling and enables immigrants to make longer stays in their home coun-

Chapter 5: Educational Requirements for Naturalization 108
tries without losing the right to return. In some countries, such as the USA,citizens also have better access to family reunification programs. Thus, tak-ing into account these benefits from naturalization, the investment neededto meet the skill requirements may be worthwhile. Whether this is the caseor not depends on the individual migrant’s abilities. More specifically, herinnate abilities will likely determine the cost of meeting the naturalizationrequirement, and her preferences will determine the benefits from obtain-ing naturalization status. In the following, I shall assume heterogeneity inmigrants’ innate abilities, but uniform benefits from naturalization.
With respect to the naturalization decision, four immigrant groups canbe distinguished. The first group consists of all immigrants who would notgain from naturalization in any case, whereas immigrants in all other groupsgain from naturalization. This group consists, for instance, of people whosehome country passport allows freer traveling than the immigration countrypassport. These people will never apply for naturalization, so that natural-ization rules do not affect them. This first group, as well as immigrants whoare, for whatever reason, permanently ineligible for naturalization,1 are notconsidered in the following analysis. The second group are immigrants whoseex-ante optimal skill level already lies above the requirements for naturaliza-tion. “Ex-ante” optimal refers to the skill level that an individual obtains ina first stage, based on her innate abilities without considering naturalizationrequirements. Immigrants in this group need not invest in additional skillsto apply for naturalization. As they gain from naturalization, they apply fornaturalization and are naturalized. The third group are immigrants whoseex-ante optimal skill level does not meet the naturalization requirements,but for whom the gains from naturalization outweigh the costs for additionalinvestments in education. These people invest in additional skills until theymeet the requirement and then apply for naturalization. The last group are
1This does not include immigrants who have not yet reached minimum lengths of stayrequired for naturalization. The educational decision of these immigrants is clearly affectedby naturalization requirements. They additionally have to decide about the timing of theirpotential additional investments in education (either immediately or when the minimumlength of stay is met).

Chapter 5: Educational Requirements for Naturalization 109
immigrants for whom the investment in education to meet the naturalizationrequirements is not profitable. These immigrants keep their ex-ante optimalskill level and do not apply for naturalization.
Generally, the probability of holding the skills that are required for natu-ralization is positively correlated with the educational level of an immigrant.The costs of the investments in additional skills that are necessary for natural-ization are negatively correlated with the educational level. This is obvious,as less well educated people in most cases lack more of these skills. Thus, thegroup that meets the requirements ex-ante, in the following indexed by h,primarily includes immigrants with a high educational level. The group forwhom increasing the skill level to reach naturalization is not profitable, in-dexed by l, mainly includes low skilled people. The skill levels of immigrantsfor whom it pays to increase their skill level, indexed by m, lie somewhere inthe medium range.
Figure 5.1 shows how educational requirements for naturalization changethe skill structure of immigrants, for two different continuous distributionsof ex-ante optimal human capital or skill levels. The human capital (or skilllevel) that is required for naturalization is given by H̄. For immigrants whoseskill levels are beneath the requirement level and above a certain thresholdvalue Hl (the group m), it pays to increase the skill levels to meet the natu-ralization requirements. Hl is discussed in more detail in the analysis below.Immigrants with abilities below and above this interval do not change theirskill-levels, either because it does not pay off or because it is unnecessary,given their low (high) skill-levels obtained in the first stage. The naturaliza-tion requirement thus leads to a discontinuity of the skill-distribution amongimmigrants, which substantially complicates the analysis, as will be seen be-low. The two graphs show that sizes and average skill levels of the threegroups, l, m and h, depend on the level of skill requirements for natural-ization and the distribution of ex-ante optimal human capital levels. In thefollowing, I will largely focus on the uniform distribution.
A simple theoretical model may illustrate the effect of a skill requirementfor naturalization on the three groups: There is a continuum of immigrantsi ∈ [0, 1] with mass I. Individuals are sorted according to their innate abilities

Chapter 5: Educational Requirements for Naturalization 110
Figure 5.1: Effects of naturalization requirements on the skill structure ofimmigrants
HlH 1 H(a)
g[H(a)]
l m h
g[H(a)]
H(a)1HlH
l m h
General caseUniform distribution
a(i). The human capital of an immigrant H(i) increases in her innate abilitya(i) and her learning effort e(i) according to the following skill-formationfunction:
H(i) =√a(i)e(i) (5.1)
a(i) is uniformly distributed in the interval [0, 1] and 0 < e(i) < 1 has tohold. Analogously, there is a continuum of natives n ∈ [0, 1] with mass N .
With respect to production and wages, the simplest possible assumptionsare made. The economy produces one single good and is a closed economy.Human capital is the only production factor. A linear production functionY = αHo is assumed, with Ho being the overall stock of human capital.Wages w equal the marginal productivity of human capital, ∂F/∂Ho = α =
w. Thus, w is independent of Ho. The government collects a proportionalincome tax t that is used to finance public services and benefits. Publicservices and benefits are distributed to all people in the country in a lump-sum way. The amount that each individual in the country receives is sb. Byassumption, the state adjusts sb to keep the budget balanced, whereas t isfixed.

Chapter 5: Educational Requirements for Naturalization 111
Acquiring skills leads to costs for the individuals which depend on learningeffort e(i). The following functional form is assumed:
c(e(i)) =1
2βe(i) (5.2)
These costs can be interpreted as opportunity costs, e.g. from leisure fore-gone. They do neither affect overall production nor the state budget. Thedecision making of immigrants about their education consists of two stages.In the first stage, immigrants choose the educational level that maximizestheir income less the education costs, leaving the naturalization requirementout of consideration. In the second stage, they revise their educational de-cision considering the naturalization requirement. Either they increase theireducational level to meet the requirement or they keep the ex-ante optimaleducational level from the first stage. After having taken their final educationdecision, individuals enter the labor market and work. The wage income ofan individual wH(i) is interpreted as lifetime wage income and it is assumedthat at each point in time only one cohort is present in the labor market. Theeducational decision of a migrant in the first stage is given by the followingmaximization problem:
maxe(i)
[(1− t)wH(i) + sb− c(e(i))]
= maxe(i)
((1− t)w
√a(i)e(i) + sb− 1
2βe(i)
)=⇒ [(1− t)w]2e(i) = β2a(i) (5.3)
To simplify the further analysis, I assume that (1 − t)w = β holds. Thisshould not lead to much loss of generality, as β w and t are fixed in themodel. The ex-ante optimal level of human capital is then:
H̃(a) = a(i) (5.4)
Following the distribution of a(i), H̃(a) is also uniformly distributed in the

Chapter 5: Educational Requirements for Naturalization 112
interval [0, 1].2
When analyzing the second stage of the educational decision of immi-grants, gains from naturalization have to be considered. I assume that thesegains are decreasing in the level of human capital. This can be motivatedby the fact that low skilled immigrants are more likely to lose access to theimmigration country. First, if they return to their home countries, it is moredifficult for them to re-enter the immigration country, as immigration poli-cies generally favor high skilled people. Second, low skilled people are oftenmore in danger of becoming delinquent and being deported. In most cases,delinquency is the only condition under which immigrants with a permanentresidence permit can be deported. In the model, the gains from naturaliza-tion of an immigrant are supposed to be B(1− H̃(a)).
Immigrants whose ex-ante optimal human capital is higher than the re-quired human capital level, H̃(a) = a(i) > H̄, are naturalized without chang-ing their human capital level. Immigrants for whom the individual gain fromnaturalization B(1 − H̃(a)) does not outweigh the loss from the additional(over-)investment in education do neither apply for naturalization and norchange their educational level. This loss equals the costs for the additionalinvestment in education less the higher pre-tax wage due to the increasein human capital. Thus, for immigrants for whom the following inequalityholds, it does not pay to invest in additional skills to meet the naturalizationrequirements.
B(1− H̃(a)) < c(e(H̄)− e(H̃(a)))− (w(1− t)H̄ − w(1− t)H̃(a)) (5.5)
with e(H(a)) = H(a)2/a (see (5.1)). Actually, there is still a second ordereffect: The higher tax payments of better educated immigrants also lead tohigher public benefits. However, for a single individual this effect is negligible.Hence, I assume that immigrants do not consider the state budget whenmaking their second stage educational decision.
2For (1 − t)w 6= β, H̃(a) and a(i) would still both be uniformly distributed but ondifferent intervals.

Chapter 5: Educational Requirements for Naturalization 113
From (5.5), the highest ability level for which it does not pay for an immi-grant to invest in additional education to meet the naturalization requirementis given by:
B(1− H̃(a))− 1
2w(1− t)
(H̄ ′2
a− H̃(a)2
a
)+ w(1− t)H̄ − wH̃(a) = 0
⇒ w(1− t)(H̄ − a)− w(1− t) 1
2a(H̄2 − a2) +B(1− a) = 0
⇒ Hl(H̄, B) = a =
(H̄ + η
)−√−2 B
w(1−t)H̄2 + 2ηH̄ + (η)2
1 + 2η
(5.6)
with η = B/((1 − t)w). For immigrants whose ability levels lie betweenHl(H̄, B) and H̄, acquiring additional skills in the second stage pays off.These people put exactly as much additional effort into education as theyneed to meet the naturalization requirements. Thus, the ultimate educationallevel of this medium group is H̄.
Altogether, the model leads to the three immigrant groups discussedabove: High skilled immigrants h, for whom a(i) > H̄ holds, are natural-ized without improving their educational level. Medium skilled immigrantsm, for whom a(i) ∈
[Hl(H̄, B); H̄
]holds, increase their learning effort until
they reach the required educational level H̄. Then, they are naturalized.Low skilled immigrants l, for whom a(i) < Hl(H̄, B) holds, do not increasetheir learning effort and are not naturalized. The necessary educational in-vestments to reach the requirements would not pay for them. The effect ofchanges in H̄ on the sizes of groups h and l are obvious. The higher the re-quirements for naturalization, the smaller the group which does not have toinvest into additional skills h and the larger the group for whom it does notpay to invest into additional skills l. The effect on the middle group m is byfar less clear. It depends inter alia on the distribution of the ex-ante optimaleducational levels, see figure 5.1.3 In the real world, skill requirements for
3Up to now, the assumption of a uniform distribution has not been used in the calcu-

Chapter 5: Educational Requirements for Naturalization 114
naturalization (and skills per-se) are not one-dimensional. Thus, the boundsbetween the three groups are less clear than in the model.
5.3 Optimal skill requirements for naturaliza-tion
The optimal skill requirements for naturalization depend on the aims of nat-uralization policy. One possible aim of an immigration country is to integrateimmigrants as well as possible into its society. As naturalization generallyimproves integration, a government with this aim should impose only verylow skill requirements, if at all. Another aim may be to keep immigrantsout of the political decision process. This can be rational, as the preferencesof immigrants with respect to public goods may differ from the preferencesof natives. In this case, the government may be tempted to impose verytough naturalization requirements. Skill requirements for naturalization arean appropriate policy measure when the educational structure of (natural-ized) immigrants shall be influenced. For other aims of naturalization policy,other types of policy measure are more suitable. For instance, to keep immi-grants away from political decisions, the state can also impose long durationsof stay as a requirement for naturalization.
Why should a state take measures to influence the educational structureof its immigrants? In many developed countries, immigrants are on averagefar less skilled than natives. Lacking qualifications of immigrants, especiallylacking language skills, often lead to problems on the labor market and pre-vent their integration into society. There are several rationales why nativescould have an interest in improving the skill structure of immigrants. First,improving the skill structure of immigrants can help strengthen the coher-ence of the society. Idealism of natives is not essential for this argument, asit may seem at first sight. A strong coherence of the society can also haveconcrete advantages for natives; for instance, it may lead to less delinquency.
lations.
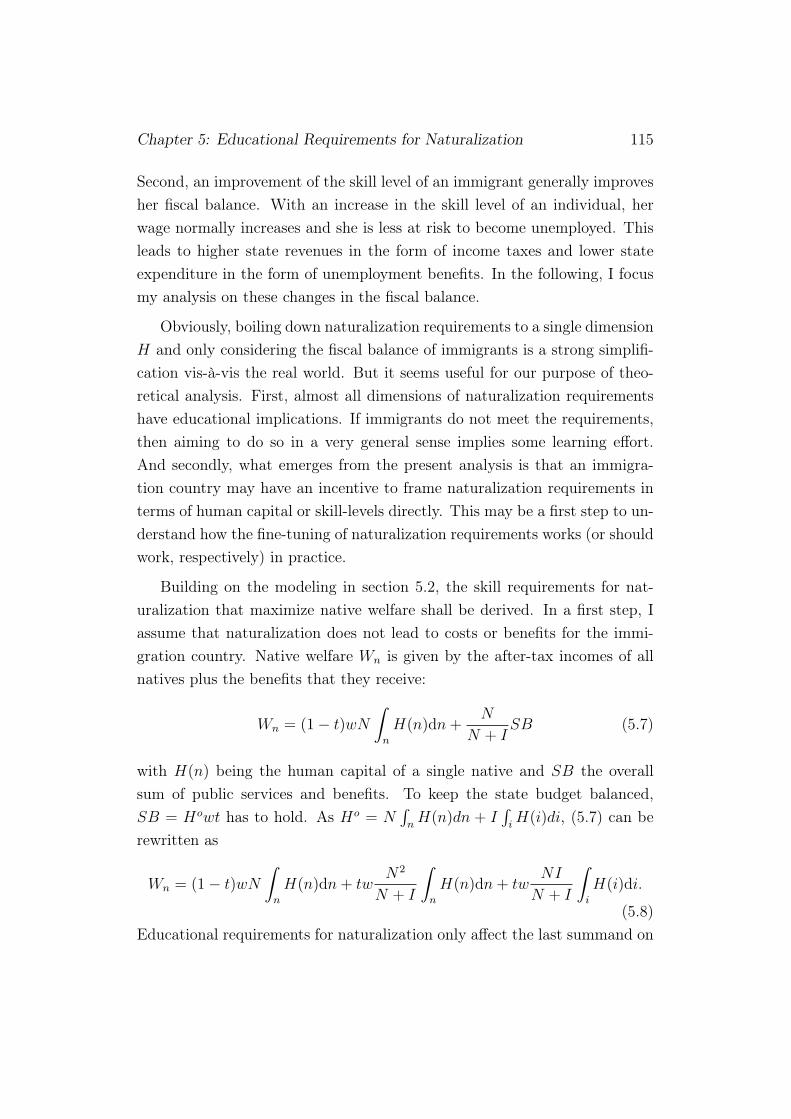
Chapter 5: Educational Requirements for Naturalization 115
Second, an improvement of the skill level of an immigrant generally improvesher fiscal balance. With an increase in the skill level of an individual, herwage normally increases and she is less at risk to become unemployed. Thisleads to higher state revenues in the form of income taxes and lower stateexpenditure in the form of unemployment benefits. In the following, I focusmy analysis on these changes in the fiscal balance.
Obviously, boiling down naturalization requirements to a single dimensionH and only considering the fiscal balance of immigrants is a strong simplifi-cation vis-à-vis the real world. But it seems useful for our purpose of theo-retical analysis. First, almost all dimensions of naturalization requirementshave educational implications. If immigrants do not meet the requirements,then aiming to do so in a very general sense implies some learning effort.And secondly, what emerges from the present analysis is that an immigra-tion country may have an incentive to frame naturalization requirements interms of human capital or skill-levels directly. This may be a first step to un-derstand how the fine-tuning of naturalization requirements works (or shouldwork, respectively) in practice.
Building on the modeling in section 5.2, the skill requirements for nat-uralization that maximize native welfare shall be derived. In a first step, Iassume that naturalization does not lead to costs or benefits for the immi-gration country. Native welfare Wn is given by the after-tax incomes of allnatives plus the benefits that they receive:
Wn = (1− t)wN∫n
H(n)dn+N
N + ISB (5.7)
with H(n) being the human capital of a single native and SB the overallsum of public services and benefits. To keep the state budget balanced,SB = Howt has to hold. As Ho = N
∫nH(n)dn + I
∫iH(i)di, (5.7) can be
rewritten as
Wn = (1− t)wN∫n
H(n)dn+ twN2
N + I
∫n
H(n)dn+ twNI
N + I
∫i
H(i)di.
(5.8)Educational requirements for naturalization only affect the last summand on

Chapter 5: Educational Requirements for Naturalization 116
the right hand side. Without requirements, it is
twNI
N + I
1∫0
H̃(i)di = twNI
N + I
1∫0
H̃(a)dG(a). (5.9)
With requirements it becomes
twNI
N + I
Hl(H̄,B)∫0
H̃(a)dG(a) +
H̄∫Hl(H̄,B)
H̄dG(a) +
1∫H̄
H̃(a)dG(a)
. (5.10)
The increase in native welfare due to naturalization requirements is thusgiven by
∆Wn = twNI
N + I
H̄∫Hl(H̄,B)
H̄dG(a)−H̄∫
Hl(H̄,B)
H̃(a)dG(a)
. (5.11)
Imposing the uniform distribution for a, we have G(a) = a and dG(a) = daand
∆Wn = twNI
N + I
H̄∫Hl(H̄,B)
H̄da−H̄∫
Hl(H̄,B)
H̃(a)da
. (5.12)
Taking into account H̃(a) = a, we have
∆Wn = twNI
N + I
[H̄2 − H̄Hl(H̄, B)−
∫ H̄
Hl(H̄,B)
ada
]
= twNI
N + I
[H̄2 − H̄Hl(H̄, B)− 1
2
(H̄2 −
[Hl(H̄, B)
]2)]=
1
2tw
NI
N + I
[H̄ −Hl(H̄, B)
]2. (5.13)
The state chooses the naturalization requirement H̄ that maximizes na-tive welfare or the increase in native welfare because of the naturalizationrequirement ∆Wn, respectively. As native welfare is not affected by H̄, aslong as there is no naturalization requirement, the two optimization prob-

Chapter 5: Educational Requirements for Naturalization 117
lems are obviously equivalent. In the following, the calculation steps for thesecond problem are presented, as they are much more intuitive than the stepsfor the first problem. Inserting
Hl(H̄, B) =
(H̄ + η
)−√−2 B
w(1−t)H̄2 + 2ηH̄ + (η)2
1 + 2η
into (5.13), the optimal naturalization requirement can be found from
maxH̄
{1
2tw
NI
N + I
(2ηH̄ − η +
√−2B
wH̄2 + 2ηH̄ +
(Bw
)2
1 + 2η
)2}. (5.14)
=⇒ NI
N + Itw
1
(1 + 2η)2
(2ηH̄ − η +
√−2ηH̄2 + 2ηH̄ + (η)2
)
×
(2η +
1
2
−4ηH̄ + 2Bw√
−2ηH̄2 + 2ηH̄ + (η)2
)= 0
=⇒ H̄∗1 =1
2+
√8(
Bw(1−t)
)3
+ 8 (η)2 + 2η
2 (1 + 2η)(5.15)
The calculation steps are given in the appendix. Table 5.1 on page 123displays some calibrated skill requirements H̄∗1 and native welfare gains ∆Wn1
for different parameter set-ups.
As shown in the appendix, the optimal educational requirement H̄∗1 in-creases in the benefits from naturalization B. Due to the higher benefits,immigrants are willing to increase their educational levels more to reach thenaturalization requirement. Thus, the government can increase its educa-tional requirements to a certain degree and the immigrants who applied fornaturalization beforehand will still apply for naturalization. The range ofability levels for which it is optimal to acquire an educational level of H̄ in-stead of H̃(a) increases. Thus, total welfare also increases in B (also shown

Chapter 5: Educational Requirements for Naturalization 118
Figure 5.2: Optimal naturalization requirements for different ability distri-butions
lHlH' lHlHlH' lH'H HH'H 'H'H
m mml llh hhH(a) H(a) H(a)
g[H(a)] g[H(a)]g[H(a)]
in the appendix).4
The optimal educational requirement for naturalization depends on theassumed distributions of abilities. This is obvious from figure 5.2 in whichsome distribution are depicted. Thus the requirement found in (5.15) isobviously influenced by the assumed uniform distribution. Due to its highvariance, the uniform distribution is actually not perfectly appropriate formy analysis. In contrast to most other distributions, no unambiguous opti-mal naturalization requirement is found for the uniform distribution, if thedistance between H̄ and Hl(H̄, B) is fixed. However, to my knowledge, theuniform distribution is the only distribution that remains mathematicallytractable, when the discontinuity due to the naturalization requirement isconsidered.5 Figure 5.2 depicts optimal human capital requirements for nat-uralization for different ability distributions and a fixed distance between H̄and Hl(H̄, B). The graphs also show that an increase in this distance (to thedistance between H̄ ′ and H ′l), which would be the consequence of a higherB, leads to a higher increase in immigrant human capital and thus, underthe assumptions discussed above, also in native welfare.
This indicates that it is in the interest of natives that the individual
4Analogously, an increase in wages reduces the importance of the gains from natural-ization relative to income (see appendix).
5Not even the Pareto distribution remains mathematically tractable.

Chapter 5: Educational Requirements for Naturalization 119
gains from naturalization for the immigrants B are rather high. There aretwo possibilities for a government to increase these gains, namely by improv-ing the situation of naturalized immigrants and by downgrading the situationof non-naturalized immigrants. In the real world, improving the situation ofnaturalized immigrants without affecting non-naturalized immigrants is al-most impossible. Nationality leads to the same rights and duties for natural-ized immigrants and natives. Downgrading the situation of non-naturalizedimmigrants is also difficult. In developed countries, anti-discrimination legis-lation generally leaves little scope for doing so. Nevertheless, as discussed inMazzolari (2009), the US have exacerbated the access to welfare benefits forimmigrants in 1996. In addition, in most countries, immigration legislationwith respect to family members (family re-unification programs) can be usedto affect the situation of non-naturalized immigrants.
5.4 Further benefits and costs from naturaliza-tion
In the preceding section, I have assumed that naturalization does not lead tocosts for the immigration country. The costs of an immigration country forthe administration of naturalization are generally negligibly small. However,if preparatory classes and naturalization tests are at least partly financedby the state, naturalization costs can be substantial. Besides these directcosts, naturalization has other consequences for the immigration countryand its population that can be interpreted as indirect costs or benefits. Themost important of these consequences is probably that immigrants obtainthe right to vote.6 For the native population as a whole, the right to votefor immigrants is conceivably disadvantageous (see Benhabib, 1996; Dolmasand Huffman, 2004). Beforehand, natives had been able to chose extent,
6Of course, this holds only true for democratic societies. Moreover, immigrants canachieve the right to vote in some cases without naturalization (e.g. in Germany, EU-citizens have the right to vote in communal elections).

Chapter 5: Educational Requirements for Naturalization 120
composition and allocation of public goods, as well as the tax burden, thatwere optimal for them. Now, the wishes of the naturalized immigrants haveto be taken into account and composition and allocation of public goods willgenerally change. Although these changes are not costs in the literal sense,in a theoretical analysis of the effects of naturalization policy, they can beinterpreted as such.
A further consequence of naturalization policy that can be interpreted asindirect costs or benefits7 are changes in the incentives for immigration. Forpeople who think about migrating to a certain country, the naturalizationpolicy of this country can be quite an important factor. First, it can bedecisive for the occupational success in the immigration country. For someoccupations, a native citizenship is required and, for others which are con-nected with traveling, the passport of the immigrant country may facilitatethe work. Second, naturalization policy can be an indicator how difficult itis to get integrated into the society of the immigration country. Bertocchiand Strozzi (2004) show that citizenship legislation has a significant effect onmigrant flows. Various other effects of naturalization policy on native welfarecan also be interpreted as indirect costs or benefits. In particular, natural-ization can have an effect on the identity and the behavior of an immigrant.For instance, naturalized immigrants may invest more of their savings in theimmigration country and less in their home countries.
What is the effect of these indirect costs and benefits on the optimaleducational requirement for naturalization? To answer this question, weneed an idea how they affect native welfare. For simplicity, I assume thatthe naturalization of each immigrant leads to the same costs and benefits forthe immigration country. The sum of all costs and benefits can be positiveor negative, but I refer to it as naturalization costs c in the following. As allimmigrants with an educational level above Hl(H̄, B) obtain the citizenship,
7It is beyond the scope of this paper to judge if these incentives lead to costs of benefitsfor the native population in the immigration country. Nevertheless, they can affect nativewelfare and are thus an example for indirect costs and benefits from naturalization policy.
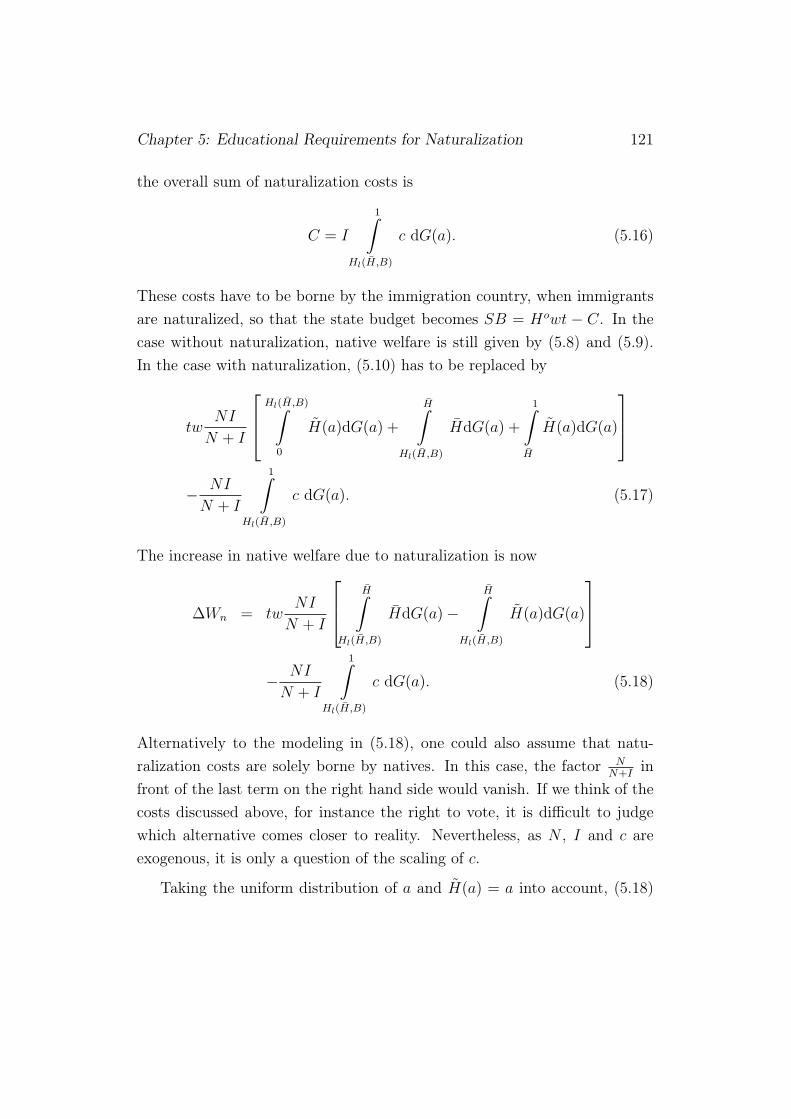
Chapter 5: Educational Requirements for Naturalization 121
the overall sum of naturalization costs is
C = I
1∫Hl(H̄,B)
c dG(a). (5.16)
These costs have to be borne by the immigration country, when immigrantsare naturalized, so that the state budget becomes SB = Howt − C. In thecase without naturalization, native welfare is still given by (5.8) and (5.9).In the case with naturalization, (5.10) has to be replaced by
twNI
N + I
Hl(H̄,B)∫0
H̃(a)dG(a) +
H̄∫Hl(H̄,B)
H̄dG(a) +
1∫H̄
H̃(a)dG(a)
− NI
N + I
1∫Hl(H̄,B)
c dG(a). (5.17)
The increase in native welfare due to naturalization is now
∆Wn = twNI
N + I
H̄∫Hl(H̄,B)
H̄dG(a)−H̄∫
Hl(H̄,B)
H̃(a)dG(a)
− NI
N + I
1∫Hl(H̄,B)
c dG(a). (5.18)
Alternatively to the modeling in (5.18), one could also assume that natu-ralization costs are solely borne by natives. In this case, the factor N
N+Iin
front of the last term on the right hand side would vanish. If we think of thecosts discussed above, for instance the right to vote, it is difficult to judgewhich alternative comes closer to reality. Nevertheless, as N , I and c areexogenous, it is only a question of the scaling of c.
Taking the uniform distribution of a and H̃(a) = a into account, (5.18)

Chapter 5: Educational Requirements for Naturalization 122
can be reshaped to
∆Wn =1
2tw
NI
N + I
[H̄ −Hl(H̄, B)
]2 − NI
N + Ic[1−Hl(H̄, B)
]. (5.19)
Inserting Hl(H̄, B), the optimal H̄ is found by
maxH̄
NI
N + I
{tw
2
(2ηH̄ − η +
√−2 B
w(1−t)H̄2 + 2ηH̄ + (η)2
1 + 2η
)2
−c
(1−
(H̄ + η
)−√−2ηH̄2 + 2ηH̄ + (η)2
1 + 2η
)}.
=⇒
{tw
(1 + 2η)2
(2ηH̄ − η +
√−2ηH̄2 + 2ηH̄ + (η)2
)
×
(2η +
1
2
−4ηH̄ + 2 Bw(1−t)√
−2ηH̄2 + 2ηH̄ + (η)2
)
− c
1 + 2η
(− 1 +
1
2
−4ηH̄ + 2η√−2ηH̄2 + 2ηH̄ +
(Bw
)2
)}= 0 (5.20)
Unfortunately, there is no closed form analytical solution for (5.20); hencewe must resort to numerical methods. Table 5.1 gives an overview over opti-mal naturalization requirements H̄∗2 and welfare increases ∆Wn2 for variousparameter set-ups. In the model, an immigration country should only offernaturalization, if it leads to an increase in native welfare ∆Wn2 > 0. If nat-uralization costs c are too high, no (optimal) naturalization requirement H̄∗2exists for which the increase in native welfare is positive (indicated by – intable 5.1).
The simulations show that, as in the case without naturalization costs,the optimal naturalization requirement H̄∗2 increases in the individual benefitsfrom naturalization B. A higher B leads also to a higher increase in nativewelfare and thus to more native welfare. An increase in the naturalizationcost c leads also to a higher optimal naturalization requirement H̄∗2 , but toless native welfare. The higher c relative to B, the more likely no H̄∗2 exists

Chapter 5: Educational Requirements for Naturalization 123
Table 5.1: Calibrated naturalization requirements
I w t B H̄∗1 ∆Wn1 c H̄∗2 ∆Wn2 ∆W#n2
100 100 0.1 0.1 0.524 0.275 0.01 0.960 0.003 0.993100 100 0.1 0.1 0.524 0.275 0.001 0.568 0.228 0.327100 100 0.1 0.1 0.524 0.275 0 0.524 0.275 0.275100 100 0.1 0.1 0.524 0.275 -0.001 0.478 0.327 0.228100 100 0.1 0.01 0.507 0.028 0.01 1.050 –∗ –∗100 100 0.1 0.01 0.507 0.028 0.001 0.953 0.000 0.099100 100 0.1 0.01 0.507 0.028 0 0.507 0.028 0.028100 100 0.1 0.01 0.507 0.028 -0.001 0.053 0.099 0.000100 100 0.1 1 0.575 2.750 0.01 0.619 2.278 3.268100 100 0.1 1 0.575 2.750 0.001 0.579 2.701 2.800100 100 0.1 1 0.575 2.750 0 0.575 2.750 2.750100 100 0.1 1 0.575 2.750 -0.001 0.570 2.800 2.701100 100 0.5 0.1 0.532 2.475 0.001 0.537 2.426 2.525100 100 0.05 0.1 0.523 0.130 0.001 0.618 0.085 0.184100 10 0.1 0.1 0.575 0.275 0.001 0.619 0.228 0.327100 1000 0.1 0.1 0.507 0.275 0.001 0.552 0.228 0.32710 100 0.1 0.1 0.524 0.028 0.001 0.568 0.023 0.0331000 100 0.1 0.1 0.524 2.525 0.001 0.568 2.091 3.000N=10000∗ Immigration country does not offer of naturalization.
for which a positive effect on native welfare results. In addition, for positivenaturalization costs, the naturalization requirement H̄∗2 decreases in the taxrate t, whereas, in the case without or with negative naturalization costs, itincreases in the tax rate. In all cases, H̄∗2 increases in the wage level.
∆Wn2 compares native welfare with naturalization requirements to nativewelfare without naturalization, but we are actually interested in a comparisonto native welfare with naturalization without requirements. Assuming that,in this case, naturalization costs occur for all immigrants, ∆W#
n2 has beencalculated. Considering that ∆W#
n2 is the overall increase in native welfare,the simulated effects of naturalization requirements on natives are very small.Nevertheless, this finding is, at least partly, driven by the model assumption.

Chapter 5: Educational Requirements for Naturalization 124
For instance, assuming a broader range for innate ability than the interval[0, 1] leads to a higher increase in native welfare.
The simulation results show that indirect costs and benefits from nat-uralization have a strong effect on the optimal educational requirement fornaturalization. In the real world, naturalization can have a large numberof effects that can be interpreted as indirect costs and benefits. In relationto the fiscal balance of an immigrant, the extent of these costs and benefitscan be much higher than in the model. Thus, the human capital require-ment which maximizes the fiscal balance of immigrants can strongly differfrom the human capital requirements that maximizes native welfare in fact.Nevertheless, the results above show clearly that an immigration countrycan use skill requirements for naturalization not only to select “new citizens”but also to improve the qualification structure of the immigrant population.This improvement in the qualification structure can lead to an increase innative welfare, even if naturalization leads to costs for the immigration coun-try. Thus, governments that care about native welfare may be tempted toimpose skill requirements for naturalization.
5.5 Naturalization policy with regard to chil-dren of non-naturalized immigrants
In the preceding sections, I have discussed optimal naturalization require-ments for persons who have immigrated. I have shown that the immigrationcountry has an incentive to set requirements in a way that it is not optimal,or even possible, for all immigrants to naturalize. This poses the questionhow the state should deal with the children of immigrants who are not natu-ralized. The state can either claim the same naturalization requirements asfrom persons that have migrated (a ius sanguinis legislation) or it can givethe citizenship to these children without requirements (a ius soli legislation).
The practice of dealing with children of non-naturalized immigrants sub-stantially depends on how the nation of the immigration country definesitself. If it defines itself as people who have been born on the same land (a

Chapter 5: Educational Requirements for Naturalization 125
ius soli definition), children of non-naturalized immigrants are part of thenation and therefore natives. In this case, it is ethically impossible to ex-clude them from nationality. In addition, a pure redistribution of welfarebetween children of (non-naturalized) immigrants and children of natives,for instance in the form of higher tax payments, would not affect native wel-fare. A nation can also define itself as people with common ancestors (aius sanguinis definition). In this case, there is no normative compulsion tonaturalize the children of immigrants. Moreover, a redistribution of welfarebetween children of immigrants and children of natives leads to an increasein native welfare. Assuming a strict ius sanguinis definition, this is still thecase, when the children of immigrants are naturalized, at least as long asboth of their parents (or all of their ancestors, respectively) are immigrants.In the real world, nations generally use a mixture of ius sanguinis and iussoli to define themselves.
Educational degrees of parents influence the success of their children inthe education system (see Tsukahara, 2007). Thus, the increase in the ed-ucational level of immigrants due to naturalization requirements may lastover multiple generations. This implies that educational requirements fornaturalization also improve the fiscal balance of the children of immigrants.If the increase in the educational levels of these children does not leads tocosts for them, educational requirements for naturalization lead to a welfaregain in the following generations. In my model, the condition for this is thathigher educational levels of parents affect the innate abilities of their chil-dren and not their learning efforts. Naturalization requirements for childrenof non-naturalized immigrants could lead to an increase in native welfare inthe long run, even if the nation of the immigration country defines itself bythe land of birth.
Despite of these potential gains, an analysis of naturalization require-ments for the children of non-naturalized immigrants only makes sense, ifthe nation of the immigration country defines itself by common ancestors.Naturalization requirements for these children are an option for policy makersin the case of a ius sanguinis definition but not in the case ius soli definition.Therefore, I assume a ius sanguinis definition in the following. Only taking

Chapter 5: Educational Requirements for Naturalization 126
into account the fiscal balance of immigrants, educational requirements forthe naturalization of the children of non-naturalized immigrants should leadto a large welfare gain in the long run. Using a strict ius sanguinis defini-tion, higher (private) education costs, which may be necessary for a highereducational level of the children of immigrants, do not affect native welfare.In terms of my model, this means that it does not matter if the higher edu-cational level of the parents affects the ability or the learning effort of theirchildren.
Nevertheless, a strong transmission of educational levels from parentsto children can also lead to problems with naturalization requirements forchildren of non-naturalized immigrants. If it does not pay for parents toincrease their skill level to meet the naturalization requirements, in manycases, it will neither pay for their children. Thus, in the long run, a minoritywithout the citizenship of the immigration country can evolve. The existenceof such a minority can possibly lead to costs for the immigration country (e.g.in the form of social tensions and riots). These costs can be larger than thegains from naturalization requirements, so that naturalization requirementsharm the immigration country in the long run.
In the following, the gains (or losses) from imposing naturalization re-quirements for the children of non-naturalized immigrants are analyzed moreformally. For this, I assume that a mass of I immigrants comes to the im-migration country at a certain point in time, t = 0 (at this time the stockof immigrants is 0). Later on, no further immigrants arrive. Moreover, I usea strict ius sanguinis definition for the nation of immigration country. Con-cretely, I assume that, independent of their citizenship, neither immigrantsnor their descendants are part of the native population. The governmentof the immigration country has the choice between imposing naturalizationrequirements for the children of non naturalized immigrants (a ius sanguinislegislation) and naturalizing these children without requirements (a ius solilegislation). In principle, the immigration country could impose different skillrequirements for people who have migrated and children of non-naturalizedimmigrants. However, this is not the case in the real world due to equalityconsiderations. Therefore, I assume one single naturalization requirement for

Chapter 5: Educational Requirements for Naturalization 127
all immigrants.
In the real world, the transmission of skills from parents to children isa complex and largely unexplored process. To keep the model tractable, Iassume a relatively simple intergenerational transmission: There is a one-to-one relation between parents and children; each parent has one child and eachchild one parent.8 With probability y, the innate ability of a child equals theeducational level of her parent. With probability 1− y, the innate ability ofa child is independent of the educational level of the parent. In this case, theability levels of immigrant children have the same distribution as the abilitylevels of first generation immigrants. Thus, for any subset of the mass ofI(t) descendants of immigrants in generation t, we find that, for a fraction y,a(t) = H(t− 1) holds and, for a fraction 1− y, a(t) is uniformly distributedon the interval [0, 1].
Moreover, I assume that wages w, benefits from naturalization B and thetax rate t do not change over time. Thus, those children of non-naturalizedimmigrants who have the same educational level as their parents do notnaturalize, as naturalization does not pay for them. As the other childrenhave the same ability distribution as first generation immigrants, the childrenof non-naturalized immigrants who are naturalized have the same abilitydistribution as naturalized first generation immigrants. This means that thenaturalization of people who have migrated and of people who have beenborn in the immigration country leads to the same increase in native welfareper naturalized immigrant in the respective generation: ∆Wn(0)/I∗(o) =
∆Wn(t)/I∗(t) with I∗(t) being the mass of naturalized immigrants.9 Becauseof the intergenerational transmission of educational levels, an increase in the
8Thus, potential marriages between (descendants of) immigrants and natives are alsoomitted in the analysis
9Analogously to (5.19), the increase in native welfare in t from naturalization of immi-grant children in t is
∆Wn =12twNI∗∗(t)N + I
[H̄ −Hl(H̄, B)
]2 − NI∗∗(t)N + I
c[1−Hl(H̄, B)
](5.21)
with I∗∗(t) being 1− y times the stock of non-naturalized immigrants.

Chapter 5: Educational Requirements for Naturalization 128
educational level of immigrants in generation t also leads to a gain in nativewelfare in the following generation. Not taking into account naturalizationin later generations, the net present value of the overall gain in all generationfrom naturalization in period 0 is ∆W ∗
n . Assuming an infinite time horizonand an (intergenerational) discount rate of r, this is related to the gain inperiod 0 in the following way:
∆W ∗n =
∆Wn
1− ry. (5.22)
If the educational level of children is independent of the education of theirparents y = 0, ∆W ∗
n = ∆Wn holds.
To analyze the long run effects of naturalization policies with regard tothe children of non-naturalized immigrants, one has to know how many de-scendants of an immigrant cohort remain non-naturalized in the followinggenerations. In the first generation, the mass of non-naturalized immigrantsis given by
N0 = G(a)I = Pr
a(i) <
(H̄ + B
w
)−√−2B
wH̄2 + 2B
wH̄ +
(Bw
)2
1 + 2Bw
I.
(5.23)If children of immigrants are naturalized without requirements, the numberof non-naturalized immigrants is zero in all following generations. If childrenof non-naturalized immigrants have to fulfill the same requirements as actualimmigrants, their number in the second generation is
N(1) =[yG+ (1− y)G2
]I. (5.24)
In the third and fourth generation, it is
N(2) =[y2G+ 2y(1− y)G2 + (1− y)2n3
]I (5.25)
N(3) =[y3G+ 3y2(1− y)G2 + 3y(1− y)2G3 + (1− y)3G4
]I.(5.26)

Chapter 5: Educational Requirements for Naturalization 129
and, in the T + 1-th generation, it is
N(T ) =T∑t=0
[(T
t
)yT−t(1− y)tnGt+1
]I. (5.27)
If the educational level of a child is independent from the educational levelof her parent (y = 0), the number of non-naturalized immigrants in period Tis nT I. If there is perfect transmission of educational levels (the educationallevel of the child equals the level of the parent, y = 1), it is nI.
In the same way, long run gains in native welfare from skill requirementsfor naturalization with a ius soli and ius sanguinis legislation can be derived.In the first generation, the gain is:
∆W tn(0) = (1− n) ∆WnI (5.28)
with ∆Wn being the increase in native welfare per naturalized immigrant (∆Wn(0) = ∆Wn(0)/(1 − G)I in generation 0). If the immigration countryapplies a ius sanguinis legislation, the gain in the second period is given by
∆W tn(1) = y(1−G)∆Wn + (1− y)(1−G)G∆Wn
= [y (1−G) + (1− y)(1−G)G] ∆WnI. (5.29)
The first term on the right hand side is the gain from naturalizations in gen-eration 0.10 The second term is the gain from naturalizations in generation
10Naturalization in generation 0 leads to a gain in generation 1 because of the transmis-sion of educational levels.

Chapter 5: Educational Requirements for Naturalization 130
1. In the third, and fourth generation respectively, it is
∆W tn(2) =
{y2 (1−G) + y(1− y)(1−G)G
+(1− y)(1−G)[yG+ (1− y)G2
] }∆WnI (5.30)
∆W tn(3) =
{y3 (1− n) + y2(1− y)(1−G)G+
y(1− y)(1−G)[yG+ (1− y)G2
]+(1− y)(1−G)
[y2G+ 2y(1− y)G2 + (1− y)2G3
] }∆WnI.
(5.31)
The gain in the T + 1-th period is
∆W tn(T ) =
[T∑t=1
(yT−t(1− y)(1−G)
t∑i=1
[(t− 1
i− 1
)yt−i(1− y)i−1Gi
])
+yT (1−G)
]∆WnI. (5.32)
The net present value of all gains from naturalization up to generation T
follows as
∆W ∗n =
T∑k=0
rk
[k∑t=1
(yk−t(1− y)(1−G)
t∑i=1
[(t− 1
i− 1
)yt−i(1− y)i−1Gi
])
+yk(1−G)
]∆WnI. (5.33)
With an infinite time horizon, this can be rewritten as
∆W ∗n =
∞∑k=0
rk
[k∑t=1
(yk−t(1− y)(1−G)
t∑i=1
[(t− 1
i− 1
)yt−i(1− y)i−1Gi
])]
×∆WnI +(1−G)∆WnI
(1− ry). (5.34)
If a ius soli legislation is applied, children of immigrants are unconditionally

Chapter 5: Educational Requirements for Naturalization 131
naturalized and the net present value of gain in native welfare is
∆W ∗nu =
(1−G)∆WnI
(1− ry). (5.35)
Thus, imposing naturalization requirements also on the children of non-naturalized immigrants has the following, positive effect on native welfare:
∆(∆W ∗n) =
∞∑k=0
rk
[k∑t=1
(yk−t(1− y)(1−G)
×t∑i=1
[(t− 1
i− 1
)yt−i(1− y)i−1Gi
])]∆WnI (5.36)
If the innate ability levels of all children are equal to the educational levelsof their parents (y = 1), a ius sanguinis legislation does not lead to a welfaregain (∆G = 0). If the educational level of parent and child are completelyindependent, a positive welfare gain of
∆(∆W ∗nu) =
rG(1−G)∆WnI
(1− rG)(5.37)
results.
As stated above, the existence of a large non-naturalized minority in acountry may lead to costs. For an immigration country, it is then only opti-mal to impose naturalization requirements on the children of non-naturalizedimmigrants, if ∆(∆W ∗
nu) is larger than the net present value of these costs.In the real world, it is hardly possible to correctly assess the expected costsof a non-naturalized minority and to compare them with long run gainsfrom naturalization requirements. Nevertheless, my results show that, atthe first sight, an immigration country whose nation defines itself by iussanguinis should also impose naturalization restrictions for the children ofnon-naturalized immigrants. However, the negative consequences of the exis-tence of a large non-naturalized minority may outweigh these positive effectsin the long run.

Chapter 5: Educational Requirements for Naturalization 132
5.6 Conclusions
Skill requirements for naturalization are an appropriate policy measure to im-prove the human capital endowment of immigrants. An increase in the skilllevel of immigrants generally leads to an increase in native welfare. Higherskilled immigrants are more productive, earn higher wages and pay highertaxes. The skill requirements for naturalization that maximize native welfaredepend on various factors. These factors are the ex-ante distribution of skillswithin the immigrant population, the exact relationship between skill levelsand tax payments, other aspects of naturalization that affect native welfare,such as the right to vote, and the individual gains of immigrants from nat-uralization. The paper shows that the skill requirements for naturalizationwhich maximize native welfare are, under realistic conditions, not so low thatit pays off for all immigrants to increase their skill level to meet them. Therequirements are neither so high that all immigrants have to increase theirskill level to reach them. Thus, skill requirements for naturalization thatare not / cannot be met by all immigrants are much more than a sortingmechanism for “new” citizens.
My results imply that, with regard to the children of non-naturalized im-migrants, a ius sanguinis legislation is preferable to a ius soli legislation, atleast if these children are not automatically considered as natives. Neverthe-less, if the existence of a non-naturalized minority leads to costs, for instancein the form of riots, a ius soli legislation can lead to a higher long-run nativewelfare, especially if the educational level of children strongly depends on theeducational level of their parents.
5.7 Appendix
Derivation of the result in (5.15):For (5.15) to hold, either the first or the second large parenthesis in thesecond to last row has to be zero. For the first parenthesis, I do not find a

Chapter 5: Educational Requirements for Naturalization 133
zero point in the interval (0; 1):
2ηH̄ − η +√−2ηH̄2 + 2ηH̄ + (η)2 = 0√
−2ηH̄2 + 2ηH̄ +(
B(1−t)w
)2
= −2ηH̄ + η
−2ηH̄2 + 2ηH̄ + (η)2 = 4 (η)2 H̄2 − 4 (η)2 H̄ + (η)2
(4η + 2) H̄2 − (4η + 2) H̄ = 0
H̄ = 0;(H̄ = 1
)(5.38)
The only solution H̄ = 0 does not lie within the interval (by insertion it canbe seen that H̄ = 1 is no solution). The second parenthesis has for feasiblevalues for B, w and t a zero point within the interval (0; 1):
2η +1
2
−4ηH̄ + 2η√−2ηH̄2 + 2ηH̄ + (η)2
= 0
⇒ −2η
√−2ηH̄2 + 2ηH̄ + (η)2 =
1
2
(−4ηH̄ + 2η
)⇒
√−2ηH̄2 + 2ηH̄ + (η)2 = H̄ − 1
⇒ −2ηH̄2 + 2ηH̄ + (η)2 = H̄2 − H̄ +1
4
⇒ (1 + 2η) H̄2 − (1 + 2η) H̄ −(
1
4− (η)2
)= 0
⇒ H̄ =
1 + 2η ±
√(1 + 2η)2 − 4 (1 + 2η)
(14−(
B(1−t)w
)2)
2 (1 + 2η)
⇒ H̄∗ =1
2+
√8 (η)3 + 8 (η)2 + 2η
2 (1 + 2η)(5.39)
With numerical methods, it can be shown that (for feasible values for B and(1 − t)w) the term in (5.39) is the only solution and a maximum and lieswithin the interval (0; 1).

Chapter 5: Educational Requirements for Naturalization 134
Effects of B and w on H̄∗ (no naturalization costs):
∂H̄∗
∂B=
1(24(η)2+16η+2)2√
8(η)3+8(η)2+2η
1(1−t)w2 (1 + 2η)−
√8 (η)3 + 8 (η)2 + 2η4 1
(1−t)w
4 (1 + 2η)2
=1
(1− t)w
(24 (η)2 + 16η + 2
)(1 + 2η)− 4
(8 (η)3 + 8 (η)2 + 2η
)4(
1 + 2 B(1−t)w
)2√
8 (η)3 + 8 (η)2 + 2η
=1
(1− t)w
48 (η)3 + 56 (η)2 + 20η + 2− 32 (η)3 − 32(
B(1−t)w
)2
− 8η
4 (1 + 2η)2√
8 (η)3 + 8 (η)2 + 2η
=1
(1− t)w16 (η)3 + 24 (η)2 + 12η + 2
4 (1 + 2η)2√
8 (η)3 + 8 (η)2 + 2η> 0 (5.40)
∂H̄
∂w= − B
(1− t)w2
16 (η)3 + 24 (η)2 + 12η + 2
4 (1 + 2η)2√
8 (η)3 + 8 (η)2 + 2η< 0 (5.41)
Welfare effects of an increase in B (no naturalization costs):The effect of an increase in benefits from naturalization for immigrants onnative welfare is given by:
∂
∂B
((1− t)wN
∫n
H(n)dn+N
N + ISB
)
=∂
∂Btw
NI
N + ImaxH̄
H̄∫H̃(i)
(H̄ − H̃(a)
)tw da > 0 (5.42)
The equality holds as B only affects the immigrants that opt for naturaliza-

Chapter 5: Educational Requirements for Naturalization 135
tion. The proof that the effect is larger than zero is as follows:
∂
∂BmaxH̄∗
H̄∫H̃(a)
(tw
NI
N + IH̄ − H̃(a)
)da
=∂
∂B
1
2tw
NI
N + I
2ηH̄∗ − η +√−2ηH̄∗2 + 2ηH̄∗ + (η)2
1 + 2η
2
= tw NIN+I
(2ηH̄∗−η+
√−2B
wH̄∗2+2ηH̄∗+(η)2
1+2η
)(1
1+2η
)2
×
[(1 + 2η)
(2H̄∗ − 1 + −2H̄∗2+2H̄∗+2η
2√−2 B
(1−t)w H̄∗2+2ηH̄∗+(η)2
)
−2
(2ηH̄∗ − η +
√−2ηH̄∗2 + 2ηH̄∗ + (η)2
)](5.43)
To derive the marginal effect of an increase in B, I assume the optimaleducation requirements H̄∗ to be fixed. If B has a positive effect on welfarewith fixed H̄∗, it definitely also increases welfare with an adjustment of H̄∗.The change from the fixed (no more optimal) H̄∗ to the new optimal H̄∗, bythe definition of H̄, has to increase welfare. The first and the second largebracket in (5.43) are positive (the first bracket equals the probability to betreated). Thus, it has only to be shown that the third large bracket is alsopositive:
(1 + 2
B
w
)2H̄∗ − 1 +−2H̄∗2 + 2H̄∗ + 2B
w
2√−2B
wH̄∗2 + 2B
wH̄∗ +
(Bw
)2
−2
2B
wH̄∗ − B
w+
√−2
B
wH̄∗2 + 2
B
wH̄∗ +
(B
w
)2

Chapter 5: Educational Requirements for Naturalization 136
= 2H̄∗ − 1 +
(1 + 2
B
w
) −H̄∗2 + H̄∗ + Bw√
−2BwH̄∗2 + 2B
wH̄∗ +
(Bw
)2
−2
√−2
B
wH̄∗2 + 2
B
wH̄∗ +
(B
w
)2
= 2H̄∗ − 1 +
(−2ηH̄
∗2 + 2B
(1− t)wH̄∗ + (η)2
)− 12
×
[(1 + 2η)
(−H̄∗2 + H̄∗ + η
)−2(−2ηH̄∗2 + 2ηH̄∗ + (η)2) ]
= 2H̄∗ − 1 +(−2ηH̄
∗2 + 2ηH̄∗ + (η)2)− 12
×(−H̄∗2 + H̄∗ + η + 2ηH̄∗2 − 2ηH̄∗
)= 2H̄∗ − 1 +
(−2ηH̄
∗2 + 2ηH̄∗ + (η)2)− 12
×(
(1− 2η) H̄ −(
1− 2B
(1− t)w
)H̄∗2 + η
)> 0 (5.44)
By (5.15), 0, 5 < H̄∗ ≤ 1. The inequality holds as long η < 12, a condition
that should generally be fulfilled.

6Conclusions
As for all immigration countries, the integration of immigrants is a challengefor Germany. Especially people with Turkish roots, the largest immigrantgroup in Germany, often exhibit strong integration deficits. These deficitslead to high shares of welfare recipients among the immigrants and to highcrime rates. Thus, lacking integration is connected with large public expen-diture for the immigration country. Discussing immigration policy, policymakers as well as the public often fear that new immigrants will not be will-ing or able to properly integrate. Therefore, immigration countries are oftenextremely reluctant to allow for new inflows of permanent migrants.
Integration deficits are generally reflected in problems of immigrants onthe labor market. In Germany, the unemployment rate of immigrants is muchhigher than the unemployment rate of natives. Moreover, as shown in chap-ter 4, they are also more affected by cyclical variations on the labor market.My empirical investigations clearly indicate that lacking human capital is themain reason for the worse labor market performance of immigrants. On av-erage, immigrants have much lower formal educational degrees than natives.In addition, many immigrants cannot make full use their qualifications onthe labor market because of lacking language skills. Remarkably, the labormarket situation of immigrants, ceteris paribus, does not significantly im-prove with years in Germany. Discrimination and / or lacking labor marketrelevant social networks also play a certain role for the labor market situationof immigrants, but compared to human capital their influence is small.
137

Chapter 6: Conclusions 138
This clearly indicates that the starting point to improve the labor marketsituation of immigrants lies in their education. It is difficult to increase the(formal) qualification level of an immigrant after she has entered the labormarket. However, improving her language fluency is less demanding. Themain measure to do this are courses in the German language. On the onehand, the state should offer a large variety of language courses to meet theneeds of the immigrants. On the other hand, it should set strong incentivesfor immigrants to participate in these courses. For immigrants who do notalready have permanent residence permits, this can happen in the form ofrequirements for the extension of residence permits. With respect to otherimmigrants, one could think of cuts of welfare benefits for those who donot participate. Incentives to learn the German language are particularlyimportant for mothers of young children. Immigrant women often do nothave much contact to natives and their language skills are very bad. Inaddition, their fluency in the German language can have an effect on thesuccess of their children in the educational system and the labor market. Iftheir husbands work, social assistance legislation should generally have noeffect on their education decision. Thus, other measures to set incentives forthem to improve their language skills have to be considered.
Various policy measures can be used to improve the educational level andthus the integration of immigrants. An important step on the way towardscomplete integration into the society of the immigration country is natural-ization. Educational requirements for naturalization can be a strong incen-tive for immigrants to improve their qualifications, especially their languageskills. Chapter 5 analyzes which educational requirements for naturalizationmaximize native welfare. The optimal requirements depend on the educa-tional structure of the immigrants as well as on other aspects of naturalizationlegislation that affect native welfare ( e.g. the right to vote). For feasible pa-rameter set-ups, the optimal requirement level is neither unattainably high,nor so low that all immigrants meet it without investing in their education.Thus, naturalization policy may be an appropriate policy instrument to im-prove the qualification structure and the integration of immigrants.
A large variety of further policy measures to improve the educational
Chapter 6: Conclusions 139
structure of immigrants or their integration is conceivable. It is an importantchallenge for integration research to discuss these measures and analyze theireffectiveness. For doing this, empirical data are necessary. Accompanyingevaluations from various pilot projects in the field of supportive integrationmeasures may deliver new insights in the next years. These findings may helpthe German government to improve its integration policy. Lacking integra-tion not only is a problem for people who have immigrated themselves butalso for their offspring. Hence, in the long run the positive welfare effects ofa better integration of immigrants, for instance in the form of lower welfarerecipient rates and less delinquency, can be enormous. These positive effectscan justify high public spending for integration measures. Intensified inte-gration research may help political decision makers in optimally allocatingpublic expenditure for integration.
Governments generally search for an immigration policy that maximizesnative welfare. The short run effect of immigration hardly depends on theintegration of immigrants. However, integration plays a central role in thelong run. By improving their educational level, especially their languageskills, immigrants also improve their position on the labor market: Theyare less at risk to become unemployed, earn higher wages and pay highertaxes. Therefore the fiscal balance of an immigrant generally improves withintegration. In studies on the welfare effects of immigration, integrationpatterns have hardly been considered up to now.1 Hence, as integrationmay improve the effect of immigration on native welfare, the results of thesestudies are probably to pessimistic.
Integration research strongly indicates that the willingness or ability tointegrate varies over immigrant groups. This has implications for immigra-tion policy. Assume that there are two equal groups of immigrants that havethe same educational structure, but differ with respect to their ability tointegrate. Not considering integration patterns, one would predict the sameeffect on native welfare for the immigration of both groups. If integrationpatterns are considered, the predicted effects on native welfare strongly dif-
1Generally, the educational level of immigrants is assumed to be fixed.

Chapter 6: Conclusions 140
fer. Discussing group specific immigration programs, policy makers shouldconsider the willingness and ability of these groups to integrate.
Including integration patterns is not the only challenge for the evalua-tion of immigration policies. Adjustment processes in the native populationhave similarly gained insufficient interest up to now. In chapter 3, I haveshown that a reaction of the native educational structure to immigration canfundamentally change the welfare effects of immigration. The education ofan adult person generally does not change any more, so that for single in-flows of immigrants this adjustment does not play a role. However, steadyinflows of immigrants over a longer period affect the expectation formationof natives, and these expectations, in turn, can have a strong effect on thenative educational structure. The same holds true for (the announcement of)policy reforms that can possibly lead to a large inflow of immigrants, suchas EU enlargements. Considering such adjustment processes is particularlyimportant, when occupation specific immigration programs are discussed.For instance, the low number of native physicians in the UK surely explainsthe high number of foreign physicians. However, the high number of foreignphysicians is quite likely also an explanation for the low number of nativephysicians.
A further adjustment of the native population to immigration, discussedmore intensely in migration research, is movement of people within the im-migration country. It has been argued that natives may leave cities whereimmigrants live or do not move there. However, Peri (2007) finds no evidencefor this in the US, where natives are traditionally more mobile than in Europe.It is impossible to consider all potential adjustment processes to immigrationin an evaluation of a certain immigration policy program. Nevertheless, toget satisfying evaluation results, at least the most important processes haveto be considered. Here lies a challenge for future immigration research. Po-tential adjustment processes to immigration have to be identified and their(economic) importance has to be evaluated. Important effects then have tobe considered in the evaluation of immigration programs. Combined withthe consideration of integration patterns, this should make estimation of thewelfare effects of immigration more reliable. Perhaps, it leads to completely

Chapter 6: Conclusions 141
new and surprising insights.
Integration policy does not only affect the welfare effects of immigration,but also the willingness of people to migrate. The expected income in an im-migration country is normally one of the most important reasons for peopleto migrate. As the individual income increases with integration, people willgenerally consider their expectations about integration when making theirmigration decision. Thus, an important side effect of a good integrationpolicy is that it makes a country more attractive for potential immigrants.Moreover, as discussed in chapter 5, naturalization legislation can have astrong positive effect on the migration decision. The estimation of potentialimmigration flows after policy reforms, such as enlargements of the Euro-pean Union, is a central task of migration research. Future research has toanalyze to what extent the consideration of integration policy measures andintegration patterns can improve estimations of migration potentials.
There is a large number of further factors that can influence the migrationdecision, but are not yet used for estimations of migration potentials. Inchapter 2 the influence of various labor market institutions as well as thehealth and education system, on migration are analyzed. The results indicatethat good health and education systems and strong employment protectionhave positive effects on the decision of migrants move to a certain country.Altogether, there is still much research necessary to obtain a comprehensivepicture of the factors that influence the migration decision. However, this isa precondition to make reliable ex-ante predictions of migration potentials.Ideally, reliable predictions of future immigration flows and assessments ofthe welfare effects of immigration should be the basis of decision-making forimmigration policy.
Migration has been an important topic od research in social sciences andeconomics for years. Nevertheless, many questions still remain unsettled andmany aspects have not yet been investigated. Integration has attracted lessinterest, and especially economic research on integration policy is scarce. Thefour chapters of my thesis have given some new insights in the economics ofimmigration and integration. The results obtained hopefully contribute to-wards a more comprehensive picture on the economics of immigration and

Chapter 6: Conclusions 142
integration. The issues addressed certainly need continued attention. I hopethat the research presented in my thesis will stimulate further fruitful re-search.

Bibliography
Abbring, J. H., G. J. van den Berg, and J. C. van Ours (2001):“Business Cycles and Compositional Variation in U.S. Unemployment,”Journal of Business and Economic Statistics, 19, 436–448.
Ai, C. and E. C. Norton (2003): “Interaction terms in logit and probitmodels,” Economics Letters, 80, 123–129.
Altonji, J. G. and C. R. Pierret (2001): “Employer Learning And Sta-tistical Discrimination,” The Quarterly Journal of Economics, 116, 313–350.
Amemiya, T. (1981): “Qualitative Response Models: A Survey,” Journal ofEconomic Literature, 19, 1483–1536.
Amuedo-Dorantes, C. and S. de la Rica (2007): “Labour MarketAssimilation of Recent Immigrants in Spain,” British Journal of IndustrialRelations, 45, 257–284.
Aslund, O. (2005): “Now and forever? Initial and subsequent locationchoices of immigrants,” Regional Science and Urban Economics, 35, 141–165.
Baker, M. and D. Benjamin (1997): “The Role of the Family in Im-
143

Bibliography 144
migrants’ Labor-Market Activity: An Evaluation of Alternative Explana-tions,” American Economic Review, 87, 705–27.
Bartel, A. P. (1989): “Where Do the New U.S. Immigrants Live?” Journalof Labor Economics, 7, 371–91.
Bauer, T. K., G. Epstein, and I. N. Gang (2005): “Enclaves, languageand the location choice of immigrants,” Journal of Population Economics,18, 649–662.
——— (2007): “The Influence of Stocks and Flows on Migrants’ LocationChoices,” in Aspects of Worker Well-Being, Research in Labor Economics,ed. by S. W. P. und Olivier Bargainć, 199–229.
Becker, G. S. (1971): The Economics of Discrimination, University ofChicago Press.
Beine, M., F. Docquier, and H. Rapoport (2008): “Brain Drain andHuman Capital Formation in Developing Countries: Winners and Losers,”Economic Journal, 118, 631–652.
Benhabib, J. (1996): “On the political economy of immigration,” EuropeanEconomic Review, 40, 1737–1743.
Berry, A. R. and R. Soligo (1969): “Some Welfare Aspects of Interna-tional Migration,” Journal of Political Economy, 77, 778–794.
Bertocchi, G. and C. Strozzi (2004): “Citizenship Laws and Interna-tional Migration in Historical Perspective,” CEPR Discussion Papers 4737,C.E.P.R. Discussion Papers.
Bevelander, P. and J. Veenmann (2008): “The Effect of Naturalizationon Wage Growth: A Panel Study of Young Male Immigrants,” in The Eco-nomics of Citizenship, ed. by P. Bevelander and D. J. DeVoretz, MalmoeUniversity, 63–88.
Bhagwati, J. and K. Hamada (1974): “The brain drain, internationalintegration of markets for professionals and unemployment : A theoreticalanalysis,” Journal of Development Economics, 1, 19–42.
Bibliography 145
Blau, F. D., L. M. Kahn, J. Y. Moriarty, and A. P. Souza (2003):“The Role of the Family in Immigrants’ Labor-Market Activity: An Evalua-tion of Alternative Explanations: Comment,” American Economic Review,93, 429–447.
Borjas, G. J. (1987): “Self-Selection and the Earnings of Immigrants,”American Economic Review, 77, 531–53.
——— (1994): “The Economics of Immigration,” Journal of Economic Lit-erature, 32, 1667–1717.
——— (1995): “The Economic Benefits from Immigration,” Journal of Eco-nomic Perspectives, 9, 3–22.
——— (1999a): “The economic analysis of immigration,” in Handbook ofLabor Economics Vol. 3, ed. by O. Ashenfelter and D. Card, Elsevier,chap. 28, 1697–1760.
——— (1999b): “Immigration and Welfare Magnets,” Journal of Labor Eco-nomics, 17, 607–37.
Borjas, G. J. B., J. Grogger, and G. H. Hanson (2008): “ImperfectSubstitution between Immigrants and Natives: A Reappraisal,” NBERWorking Papers 13887, National Bureau of Economic Research, Inc.
Bradbury, K. L. (2000): “Rising tide in the labor market: to what de-gree do expansions benefit the disadvantaged?” New England EconomicReview, 2000, 3–33.
Bratsberg, B., J. F. Ragan, and Z. M. Nasir (2002): “The Effect ofNaturalization on Wage Growth: A Panel Study of Young Male Immi-grants,” Journal of Labor Economics, 20, 568–597.
Brauns, H., S. Scherer, and S. Steinmann (2003): “The CASMINEducational Classification in International Comparative Research,” in Ad-vances in Cross-National Comparison. An European Working Book for De-mographic and Socio-Economic Variables, ed. by C. Wolff and J. H.-P.Hoffmeyer-Zlottnik, 196–221.
Bibliography 146
Brecher, R. A. and E. U. Choudhri (1987): “International migrationversus foreign investment in the presence of unemployment,” Journal ofInternational Economics, 23, 329–342.
Bundesanstalt für Arbeit (2009): Arbeitsmarkt in Zahlen: Arbeit-slosigkeit im Zeitverlauf.
Burdett, K. and D. T. Mortensen (1998): “Wage Differentials, Em-ployer Size, and Unemployment,” International Economic Review, 39, 257–73.
Cameron, A. C. and P. K. Trivedi (2005): Microeconometrics: Methodsand Applications, Cambridge University Press.
Card, D. (2009): “Immigration and Inequality,” American Econimc Review,99, 1–21.
Chaudhuri, S. and R. Sethi (2008): “Statistical Discrimination with PeerEffects: Can Integration Eliminate Negative Stereotypes?” Review of Eco-nomic Studies, 75, 579–596.
Chiswick, B. R. (1978): “The Effect of Americanization on the Earningsof Foreign-born Men,” Journal of Political Economy, 86, 897–921.
Chiswick, B. R. and P. W. Miller (2008): “Citizenship in the UnitedStates: The Roles of Immigrant Characteristics and Country of Origin,”IZA Discussion Papers 3596, Institute for the Study of Labor (IZA).
Clark, K. and J. Lindley (2009): “Immigrant assimilation pre and postlabour market entry: evidence from the UK Labour Force Survey,” Journalof Population Economics, 22, 175–198.
Constant, A. F. and E. D’Agosto (2008): “Where Do the Brainy ItaliansGo?” IZA Discussion Papers 3325, Institute for the Study of Labor (IZA).
Constant, A. F., L. Gataullina, and K. F. Zimmermann (2007):“Naturalization Proclivities, Ethnicity and Integration,” IZA DiscussionPapers 3260, Institute for the Study of Labor (IZA).

Bibliography 147
Cortes, K. E. (2004): “Are Refugees Different from Economic Immigrants?Some Empirical Evidence on the Heterogeneity of Immigrant Groups in theUnited States,” The Review of Economics and Statistics, 86, 465–480.
Couch, K. A. and R. W. Fairlie (2008): “Last Hired, First Fired? Black-White Unemployment and the Business Cycle,” IZA Discussion Papers3713, Institute for the Study of Labor (IZA).
Defoort, C. (2006): “Tendances de long terme des migrations interna-tionales: Analyse à partir des 6 principaux pays receveurs,” Mimeo.
DeVoretz, D. J. and S. Pivnenko (2006): “The economic causes andconsequences of Canadian citizenship,” Journal of International Migrationand Integration, 6, 435–468.
Docquier, Frédéric, O. L. and A. Marfouk (2008): “What determinesmigrants’ destination choice?” Mimeo.
Dolmas, J. and G. W. Huffman (2004): “On The Political Economy OfImmigration And Income Redistribution,” International Economic Review,45, 1129–1168.
Dustmann, C., A. Glitz, and T. Vogel (2010): “Employment, wagesand the economic cycle: Differences between immigrants and natives,”European Economic Review, 54, 1–17.
Fairlie, R. W. and W. A. Sundstrom (1997): “The Racial Unemploy-ment Gap in Long-Run Perspective,” American Economic Review, 87, 306–10.
——— (1999): “The Emergence, persistence, and recent widening of theracial unemployment gap,” Industrial and Labor Relations Review, 52, 252–270.
Felbermayr, G. J. and W. Kohler (2007): “Immigration And NativeWelfare,” International Economic Review, 48, 731–760.

Bibliography 148
Fenge, R. and M. Werding (2004): “Ageing and the tax implied in publicpension schemes: simulations for selected OECD countries,” Fiscal Studies,25, 159–200.
Fertig, M. and C. M. Schmidt (2001): “Aggregate-level migration studiesas a tool for forecasting future migraion streams,” in International Migra-tion; Trends, Policies and economic Impact, ed. by S. Djajić, 110–136.
Flaig, G. (2001): “Die Abschätzung der Migrationspotentiale der os-teuropäischen EU-Beitrittsländer,” Konjunkturpolitik-Applied EconomicsQuarterly, 52, 55–76.
Fougère, D. and M. Safi (2008): “The Effects of Naturalization on Im-migrants’ Employment Probability (France, 1968-1999),” IZA DiscussionPapers 3372, Institute for the Study of Labor (IZA).
Fuest, C. and M. Thum (2001): “Immigration and skill formation inunionised labour markets,” European Journal of Political Economy, 17,557–573.
Geis, W., S. Uebelmesser, and M. Werding (2010): “Why go to Franceor Germany, if you could as well go to the UK or the US? Selective Fea-tures of Immigration to four major OECD Countries,” Journal of CommonMarket Studies, forthcoming.
Granovetter, M. (2005): “The Impact of Social Structure on EconomicOutcomes,” Journal of Economic Perspectives, 19, 33–50.
Graves, P. E. (1980): “Migration and Climate,” Journal of Regional Sci-ence, 20, 227–237.
Hanson, G. H. (2006): “Illegal Migration from Mexico to the UnitedStates,” Journal of Economic Literature, 44, 869–924.
——— (2009): “The Economic Consequences of the International Migrationof Labor,” Annual Review of Economics, 1, 179–208.
Hanushek, E. A. and L. Woessmann (2009): “Do Better Schools Leadto More Growth? Cognitive Skills, Economic Outcomes, and Causation,”

Bibliography 149
NBER Working Papers 14633, National Bureau of Economic Research,Inc.
Harris, J. R. and M. P. Todaro (1970): “Migration, Unemployment &Development: A Two-Sector Analysis,” American Economic Review, 60,126–42.
Hatton, T. J. (2009): “The Rise and Fall of Asylum: What Happened andWhy,” Economic Journal, 119, 118–213.
Hatton, T. J. and J. G. Williamson (2006): “Refugees, Asylum Seekers,and Policy in Europe,” in Labor mobility and the world economy, ed. byF. Foders and R. J. Langhammer, Springer, 249–284.
Hegre, H. and N. Sambanis (2006): “Sensitivity Analysis of EmpiricalResults on Civil War Onset,” Journal of Conflict Resolution, 50, 508–535.
Hoynes, H. (2009): “The Employment and Earnings of Less Skilled WorkersOver the Business Cycle,” in Finding Jobs: Work and Welfare Reform, ed.by R. Blank and D. Card, Russell Sage Foundation, 23–71.
Institute for Education Sciences (2007): Comparative Indicators ofEducation in the United States and Other G-8 Countries: 2006.
Jaeger, D. A. (2000): “Local labor markets, admission categories and immi-grant location choice,” Working paper, Department of Economics, HunterCollege.
Kemnitz, A. (2009): “Native welfare losses from high skilled immigration,”International Tax and Public Finance, 16, 560–570.
Koethenbuerger, Marko, P. P. and P. Profeta (2008): “Why aremore redistributive social security systems smaller? A median voter ap-proach,” Oxford Economic Papers, 60, 275–292.
Koller, B. (1997): “Aussiedler der großen Zuwanderungswellen - was istaus ihnen geworden? : die Eingliederungssituation von Aussiedlerinnenund Aussiedlern auf dem Arbeitsmarkt in Deutschland,” Mitteilungen ausder Arbeitsmarkt und Berufsforschung, 30, 766–789.
Bibliography 150
Lang, G. (2005): “The difference between wages and wage potentials: Earn-ings disadvantages of immigrants in Germany,” Journal of Economic In-equality, 3, 21–42.
Leamer, E. E. (1985): “Sensitivity Analyses Would Help,” American Eco-nomic Review, 75, 308–313.
Lindbeck, A. and D. J. Snower (1986): “Wage Setting, Unemployment,and Insider-Outsider Relations,” American Economic Review, 76, 235–239.
Longhi, S., P. Nijkamp, and J. Poot (2005a): “A Meta-Analytic As-sessment of the Effect of Immigration on Wages,” Journal of EconomicSurveys, 19, 451–477.
——— (2005b): “A Meta-Analytic Assessment of the Effect of Immigrationon Wages,” Journal of Economic Surveys, 19, 451–477.
——— (2006): “The Fallacy of ’Job Robbing’: A Meta-analysis of Estimatesof the Effect of Immigration on Employment,” Journal of Migration andRefugee Issues, 1, 131–152.
Lumpe, C. and B. Weigert (2009): “Immigration Policy, EquilibriumUnemployment, and Underinvestment in Human Capital,” LABOUR, 23,97–130.
Lundborg, P. (1991): “Determinants of Migration in the Nordic LaborMarket,” Scandinavian Journal of Economics, 93, 363–75.
Mariani, F. (2004): “The Political Economy of Immigrants Naturaliza-tion,” Discussion Papers (IRES - Institut de Recherches Economiques etSociales) 2004022, Université catholique de Louvain, Institut de RecherchesEconomiques et Sociales (IRES).
Mayda, A. M. (2007): “International migration: A panel data analysis ofthe determinants of bilateral flows,” CReAM Discussion Paper Series 0707,Centre for Research and Analysis of Migration (CReAM), Department ofEconomics, University College London.

Bibliography 151
Mazzolari, F. (2009): “Dual Citizenship Rights: Do They Make More andBetter Citizens?” Demography, 46, 169–191.
McKenzie, D., J. Gibson, and S. Stillman (2007): “A land of milk andhoney with streets paved with gold: Do emigrants have over-optimistic ex-pectations about incomes abroad?” CReAM Discussion Paper Series 0709,Centre for Research and Analysis of Migration (CReAM), Department ofEconomics, University College London.
Mincer, J. A. (1974): Schooling, Experience, and Earnings, National Bu-reau of Economic Research, Inc.
Montgomery, J. D. (1991): “Social Networks and Labor-Market Out-comes: Toward an Economic Analysis,” American Economic Review, 81,1407–18.
Mountford, A. (1997): “Can a brain drain be good for growth in thesource economy?” Journal of Development Economics, 53, 287–303.
Munshi, K. (2003): “Networks In The Modern Economy: Mexican MigrantsIn The U.S. Labor Market,” The Quarterly Journal of Economics, 118,549–599.
Nickell, W. (2006): “The CEP-OECD Institutions Data Set (1960-2004),”CEP Discussion Papers 0759, Centre for Economic Performance, LSE.
Nielsen, H. S., M. Rosholm, N. Smith, and L. Husted (2004): “Qual-ifications, discrimination, or assimilation? An extended framework foranalysing immigrant wage gaps,” Empirical Economics, 29, 855–883.
Nordin, M. and D.-O. Rooth (2009): “The Ethnic Employment andIncome Gap in Sweden: Is Skill or Labor Market Discrimination the Ex-planation?” Scandinavian Journal of Economics, 111, 487–510.
OECD (2004): Employment Outlook: 2004 Edition.
Office for National Statistics (2000): Standard Occupational Classi-fication 2000.

Bibliography 152
——— (2007): LFS User Guide – Volume 9: EuroStat & EuroStat DerivedVariables.
Pedersen, P. J., M. Pytlikova, and N. Smith (2008): “Selection andnetwork effects–Migration flows into OECD countries 1990-2000,” Euro-pean Economic Review, 52, 1160–1186.
Peri, G. (2007): “Immigrants’ Complementarities and Native Wages: Evi-dence from California,” NBER Working Papers 12956, National Bureau ofEconomic Research.
Ramcharan, R. (2002): “Migration and Human Capital Formation: Theoryand Evidence from the U.S. High School Movement,” IMF Working Papers02/123, International Monetary Fund.
Sala-i Martin, X. X. (1997): “I Just Ran Two Million Regressions,” Amer-ican Economic Review, 87, 178–183.
Schmidt, C. M. (1997): “Immigrant performance in Germany: Labor earn-ings of ethnic German migrants and foreign guest-workers,” The QuarterlyReview of Economics and Finance, 37, 379–397.
Schroedter, Julia H., Y. L. and P. Lüttinger (2006): “Die Um-setzung der Bildungsskala ISCED-1997 für die Volkszählung 1970, dieMikrozensus- Zusatzerhebung 1971 und die Mikrozensen 1976-2004,”ZUMA-Methodenbericht 2006/08, GESIS - Leibniz-Institut für Sozialwis-senschaften.
Sjaastad, L. A. (1962): “The Costs and Returns of Human Migration,”Journal of Political Economy, 70, 80–93.
Stark, O., C. Helmenstein, and A. Prskawetz (1997): “A brain gainwith a brain drain,” Economics Letters, 55, 227–234.
Stark, O. and Y. Wang (2002): “Inducing human capital formation: mi-gration as a substitute for subsidies,” Journal of Public Economics, 86,29–46.
Bibliography 153
Statistisches Bundesamt (2007): Bevölkerung mit Migrationshinter-grund: Ergebnisse des Mikrozensus 2005 (Fachserie 1 Reihe 2.2).
——— (2009): Bevölkerung und Erwerbstätigkeit: Ausländische Bevölkerung(Fachserie 1 Reihe 2).
Thomsen, S. L., J. Gernandt, and A. Aldashev (2007): “EarningsProspects for People with Migration Background in Germany,” DiscussionPaper 07-031 [rev.], Center for European Economic Research (ZEW).
Todaro, M. P. (1969): “A Model for Labor Migration and Urban Unem-ployment in Less Developed Countries,” American Economic Review, 59,138–48.
Tsukahara, I. (2007): “The Effect of Family Background on OccupationalChoice,” LABOUR, 21, 871–890.
Venturini, A. and C. Villosio (2008): “Labour-market assimilation offoreign workers in Italy,” Oxford Review of Economic Policy, 24, 518–542.
Vidal, J.-P. (1998): “The effect of emigration on human capital formation,”Journal of Population Economics, 11, 589–600.
Wagner, G. G., J. R. Frick, and J. Schupp (2007): “The German Socio-Economic Panel Study (SOEP) - Scope, Evolution and Enhancements,”Journal of Applied Social Science Studies (Schmollers Jahrbuch), 127, 139–169.
Werding, M. and S. Munz (2005): “Public pensions and internationalmigration: some clarifications and illustrative results,” Journal of PensionEconomics and Finance, 4, 181–207.
Yang, P. Q. (1995): “Explaining Immigrant Naturalization,” InternationalMigration Review, 28, 449–477.
Zaiceva, A. (2006): “Reconciling the Estimates of Potential Migration intothe Enlarged European Union,” IZA Discussion Papers 2519, Institute forthe Study of Labor (IZA).

Bibliography 154
Zaletel, P. (2006): “Competing for the Highly Skilled Migrants: Implica-tions for the EU Common Approach on Temporary Economic Migration,”European Law Journal, 12, 613–635.