From green to grey; observed changes in garden vegetation ...downloads.gigl.org.uk/website/Garden...
50
LONDON: GARDEN CITY? From green to grey; observed changes in garden vegetation structure in London, 1998-2008
Transcript of From green to grey; observed changes in garden vegetation ...downloads.gigl.org.uk/website/Garden...
London: garden city?From green to grey; observed changes in garden
vegetation structure in London, 1998-2008

AcknowledgementsThe research partners would like to thank all those involved in the project and compilation of this report. In particular, Chloë Smith, the researcher, lead report author and project co-ordinator, and Dave Dawson, who collaborated significantly on methods, analysis and presentation. Guidance and assistance were provided by John Archer, Elaine Hughes, Mathew Frith, Catherine Harris, Mandy Rudd, Peter Massini, Matt Thomas, Barnaby Dawson and others. Matt Davies contributed the original idea as well as project support. Dave Allen and other volunteers generously gave their time and access to their gardens. This project was made possible thanks to a legacy left to The Wildlife Trusts by Dame Mary Smieton, an enthusiastic gardener and, in 1959, the second woman ever to lead a government department (education) in Britain.
Reference Smith, C., Dawson, D., Archer, J., Davies, M., Frith, M., Hughes, E. and Massini, P., 2011. From green to grey; observed changes in garden vegetation structure in London, 1998-2008, London Wildlife Trust, Greenspace Information for Greater London, and Greater London Authority. Published 2011, London Wildlife Trust. © London Wildlife Trust, Greenspace Information for Greater London, and Greater London Authority
A summary report London: Garden City? (Chloë Smith, 2010) is also available. All rights reserved. No part of this report may be reprinted or reproduced or utilized in any form or by any electronic, mechanical, or other means, no known or hereafter invented, including photocopying and recording, or in any information storage or retrieval system, without permission in writing from the publishers.
2

3
Contents
Introduction to project 6
The importance of gardens 6
Aims of Project 6
Organisation of this report 6
Study 1: Garden Land Cover 7
Introduction 7
Methods 7
Data categories 8
Sampling 9
Corrections for bias 9
Recording of habitats and features 9
Quality control 10
Land cover area estimates 10
Tree number estimates 10
Change analysis 10
Confidence intervals 10
Number and area of private domestic gardens 11
Garden size 11
Garden plot size and type 12
Average garden composition 14
Total land cover areas 17
Garden plot type and land cover 15
Garden plot size and land cover 15
Observed changes in area of land cover 16
The scale of the current resource 20
Green spaces 20
Variation within London’s gardens 21
Small gardens 22
Front gardens 22
Back and other garden types 23
Change in gardens 24
Study 2: Gardens subject to housing development 26
Introduction 26
Methods 26
Developments that were investigated 26
Geographical Information System 27
Systematic assessment 27
Land cover assessment 27
The Sample 28
Estimating total areas 28
Results 29
Changes due to development 29
Conclusions 31
Study 3: Focusing priorities 32
Introduction 32
Methods 32
Maps 36
Conclusions 38
Recommendations for future study 38
Appendix 1 40
Appendix 2 47
Glossary of terms 48
References 49
4
List of TablesStudy 1: Garden Land Cover
Table 1.1 – Land cover categories and definitions
Table 1.2 - Total areas of land covers estimated to be
present in London’s gardens
Study 2
Table 2.1 – Land cover categories and definitions
Table 2.2 – Total areas and change in land cover
Study three
Table 3.1 - Map layer information
List of chartsStudy 1: Garden Land Cover
Pie chart 1.1 - London’s total garden area distribution
between garden types
Chart 1.1 - The average size of a garden in each of Greater
London’s boroughs
Pie chart 1.2 - The average composition of a front garden
Pie chart 1.3 - The average composition of a back garden
Pie chart 1.4 - The average composition of an ‘other’ garden
Pie chart 1.5 - Total percentage of land cover categories,
estimated for the 37940 ha total garden space of London in
2007.
Chart 1.2 - Change in area of land cover categories for all
gardens
Chart 1.3 - Changes in the total area of various land covers
found in front gardens
Chart 1.4 - Changes in the total area of various land covers
found in back gardens
Chart 1.5 - Changes in the total area of various land covers
found in other gardens
List of maps
Introduction
Gardens in Greater London
Study three
Campaign 1 – LSOAs with priority gardens for wildlife
habitat protection
LSOAs with the largest gardens
LSOAs with the largest patches of connected gardens
LSOAs with the most gardens
Area of SINC in LSOA
Campaign 2 – LSOAs where gardens are most important
for health and welfare
LSOAs with greatest % cover of Areas of Deficiency (AoD)
LSOAs with the most gardens
The Index of Multiple Deprivation in LSOAs
LSOAs with the least open space
Campaign 3 – target LSOAs for garden creation
LSOAs with greatest % cover of Area of Deficiency
LSOAs with the smallest gardens
The Index of Multiple Deprivation in LSOAs
LSOAs with the least open space
Campaign 4 – LSOAs with gardens of priority for climate
adaptation
LSOAs with smallest average garden size
Heat index score by LSOA – predicted climate chance
scenario
List of appendicesAppendix 1
Study 1: Garden Land Cover
1.1 - MasterMap® information
1.2 – Ground truth survey study
1.3 – Note on classification of buildings
1.4 - Total areas of land covers 1998-1999 table
1.5 - Changes in land covers table
1.6 – Change statistics results table
1.7 – Total numbers of trees table
1.8 – Raw land cover totals for 2006-2008
1.9 – Raw land cover totals for 1998-1999
Appendix 2
Study 2
2.1 – Change statistics results table

The importance of gardensGardens make up a significant amount of London’s land
cover. It is understood that this land is valuable for people
and wildlife, and that climate change means it becomes even
more important. But until now, the character and scale of this
resource has not been fully documented.
Increasing attention is now being given to the role of private
gardens in maintaining biodiversity in suburban and urban
areas (Davies et al., 2009, Cannon et al., 2005, Gaston, et
al., 2005a). Within London, gardens are a priority habitat for
the London Biodiversity Action Plan (the Habitat Action Plan
is being led on behalf of the London Biodiversity Partnership
(LBP) by London Wildlife Trust) and a core habitat focus for
London Wildlife Trust’s Living Landscapes vision in the capital.
Concerns regarding the detrimental environmental impact
of paving over front gardens have been highlighted by the
Greater London Assembly and others (Greater London
Assembly Environment Committee, 2005). Reflecting
concerns about flooding, recent legislation changes
have removed the right to pave front gardens (to an area
greater than 5m2) with traditional surfaces without planning
permission or making adequate provision for drainage
(Communities and Local Government, 2008). Anecdotal
information and localised research (e.g. Ealing’s Local
Agenda 21 Pollution & Public Health Project Group, 2005)
suggest that the vegetated area of gardens in London has
decreased over time, mainly due to the loss of front gardens to
paving to create parking areas, for convenience or ‘cleanliness’
and the loss of back gardens to built ‘backland’ development.
However, no wide-reaching comparative study has yet been
undertaken. There are also no current comprehensive data on
the value of London’s gardens for wildlife.
A lack of baseline information limits the possibilities of
applying ecological knowledge to urban conservation
planning (Niemelä, 1999; Miller & Hobbs, 2002). Baseline
information about the garden resource in London is
needed to inform policy and decision-making and provide a
benchmark from which to measure change.
Perhaps more than any other green space categories,
gardens fulfil multiple roles. They may provide a valuable
wildlife habitat, a multifunctional space for people, and
an environmental resource to cushion the likely impacts
of climate change. They may also represent a significant
leisure space and area for enjoyment of the outdoors and
for the cultivation of plants; the expression of people’s direct
relationships with nature on their doorstep. However, gardens
are different to other green space; land cover is highly
heterogeneous and, being privately owned, gardens are
subject to variable management.
An understanding of the current status and changing uses
of gardens is of importance for conservation and planning
policy makers within London. In light of this need, London
Wildlife Trust, the GLA and Greenspace Information for
Greater London (GiGL) commissioned this research project
to establish the current use of London gardens and identify
key land use changes over a period of 5-10 years.
Aims of ProjectThe project aimed to generate a baseline of information
regarding London’s gardens to inform our understanding of
their role for wildlife, people and the environment, to develop
transferable methods of investigation, and interrogate some
key lines of enquiry from stakeholders. In particular, the
project aimed to: a) establish the current garden resource in
London in terms of overall land use and variation within this;
b) quantify the changes that have occurred to land cover
within London’s gardens over recent years and; c) provide
evidence to focus campaigns, policy and other action to
enhance gardens for wildlife.
Organisation of this reportThe project report is divided into three chapters each
documenting a stand-alone study that addresses a different
line of enquiry with different methods. Many of the conclusions
and recommendations are compatible and interlinked.
Study 1 documents a London-wide investigation of garden
land cover. Here the project outlines the current baseline area
and number of gardens in London and a typical garden’s land
cover composition. This study also addresses the key question
of change over time in the vegetated component of gardens.
The second study reports an investigation of housing
developments on garden land granted planning permission
and implemented in recent years. This work reports the
changes that occur as a consequence of this particular kind
of development to the land that was originally garden and
provides an estimate of the overall impact.
The third study reports the output of an exercise to identify
priority areas for campaigning and advice regarding gardens
and their roles for wildlife, people and the environment. This
work demonstrates the ability of data based models to focus
public engagement. It provides a working model and a baseline
for further geographically based enquiry in the future.
Introduction to project
5

IntroductionGreater London has 2.0 million dwellings which have an
associated private garden, providing 3.8 million individual
garden plots (counting front and back gardens separately).
This makes a ground survey of a large enough sample
of gardens prohibitively expensive in terms of resources
and time. This study therefore used two series of colour
aerial photographs of Greater London (Cities Revealed
aerial photography ©The GeoInformation Group 2008)
to determine the land cover present in a representative
sample of London’s gardens. The earlier photographs were
taken between 1998 and 1999 and the later set was taken
between 2006 and 2008.
Land cover measurements from the most recent photographs
provide the best estimate of the current ‘baseline’ for
London1. For example, the area covered by lawn, tree
canopy or hard surfacing in a garden. Land covers were also
recorded for each garden as it appears in the earlier series of
photographs. This paired sample allows land cover change
over time to be examined.
Methods
Aerial photographs were stored and displayed in a
Geographical Information System (GIS) (MapInfo
Professional Version 9.5). Garden polygon boundaries from
the Ordnance Survey MasterMap® Topography Layer data
(updated June 2006) were used to define garden plots
for the study (see appendix 1.1 for information about this
product). A polygon is the enclosed boundary around a
topographical feature. A total of 3,267,174 polygons were
identified as ‘garden land’ from MasterMap®. On inspection
these were found to include: i) front garden plots ii) back
garden plots, iii) gardens that due to position and shape were
neither front nor back gardens and therefore termed ‘other’,
and iv) polygons that comprised a front and back garden plot
joined by a side passage or narrow strip of land. A number
of polygons in each borough were exceptionally small and,
on examination, were found to be due to mapping errors.
Polygons less than 1m2 were therefore removed from the
GIS, resulting in 3,259,226 polygons.
1 Unless otherwise specified ‘London’ refers to Greater London, the area covered by the 33 administrative authorities including the City of London.
Study 1: Garden Land Cover
Produced by GreenspaceInformation for Greater London
Based upon the Ordnance Survey 1:10 000 mapwith the permission of The Controller of Her Majesty’s Stationery Office© Crown Copyright. All rights reserved.Licence No. LA100032379
Greater London’s Gardens
Scale 1:300000
6

Data categories
Land cover categories for gardens were defined and
guidelines for their interpretation were developed following:
a) trial analysis of garden polygons and exploration of the
aerial photograph data, b) comparison of ground truth results
to aerial interpretation, and c) consultation with stakeholders
to address areas of interest. These categories are outlined in
table 1.1 and ground truth survey is detailed in appendix 1.2.
Aerial photograph interpretation allowed only broad land
cover types to be recorded sufficiently well. Small features
such as compost heaps or ponds could, unfortunately, not be
detected with enough confidence.
Interpretation of the building category defined here requires
a degree of caution. In this study, “buildings” exclude the
dwelling (house, flat, bungalow etc.) and any other building
as classified by MasterMap®, but are buildings within the
garden plot visible on the aerial photograph, in most cases
these are sheds and glasshouses. Some larger (footprint
greater than 12m2) garden outbuildings (and most garages)
are classed as “building” by MasterMap® (Ordnance survey,
2009) and therefore are not included in the assessment of
garden cover even when they are within the garden boundary.
Ideally, the building category used in this study would
include all extensions to dwellings, as the effect of such
smaller permitted developments (i.e. not requiring planning
permission) is of interest, particularly given that they are not
covered by the study of gardens subject to planning in the
second chapter of this project. However, there is inconsistent
inclusion of extensions in MasterMap® building polygons
because of Ordnance Survey criteria and the age of the
topographical layer used (see appendix 1.3 for more detail).
This limits final conclusions regarding the impact of specific
kinds of building on gardens and points to a need for further
work in the future (see recommendations for future work).
Tree canopy and lawn were readily identifiable. All other types
of vegetation (hedges, climbers, small shrubs, herbaceous
beds, rockeries, and wild areas) were classed together as
‘other vegetation’ (see table 1.1 below).
Table 1.1 – Land cover categories and definitions
Land cover type Definition
Tree canopy A ‘tree’ refers to a mature woody species (or with a 2m wide canopy). No further
distinction (e.g. between coniferous or deciduous) was made.
“Other vegetation” Includes, small to medium sized (<2m wide) herbaceous or woody plants – flowers,
shrubs etc. such as grown typically in a flower bed – scrub growth such as bramble
cover, climbers such as ivy or wisteria and hedges.
Lawn A grass/turf area. May be densely or sparsely vegetated, tall or closely mown. In this
study lawn, also includes areas dominated by small ephemeral herbaceous plants.
Hard surfacing Includes full spectrum of permeability e.g. paving, bricks, concrete, gravel or
‘decking’. Includes patios, paths, steps and driveways.
Building All sheds, glasshouses, summerhouses and other small (<12m2) detached buildings,
house extensions completed after June 2006 and some (unknown proportion of)
extensions prior to this date (see appendix 1.3).
Side passageway Narrow side path or passage along the side or between houses that is included
within the garden polygon. Often shaded, but likely to be hard surface.
Other Land cover type that is recognisable (i.e. not ‘unknown’) but doesn’t fit into any of the
broader categories. Typically, swimming pools, large compost heaps, garden debris,
garden furniture and occasional large ponds.
Unknown Area of garden that is obscured by deep shadow, poor photograph exposure or due
to the photograph angle.
7
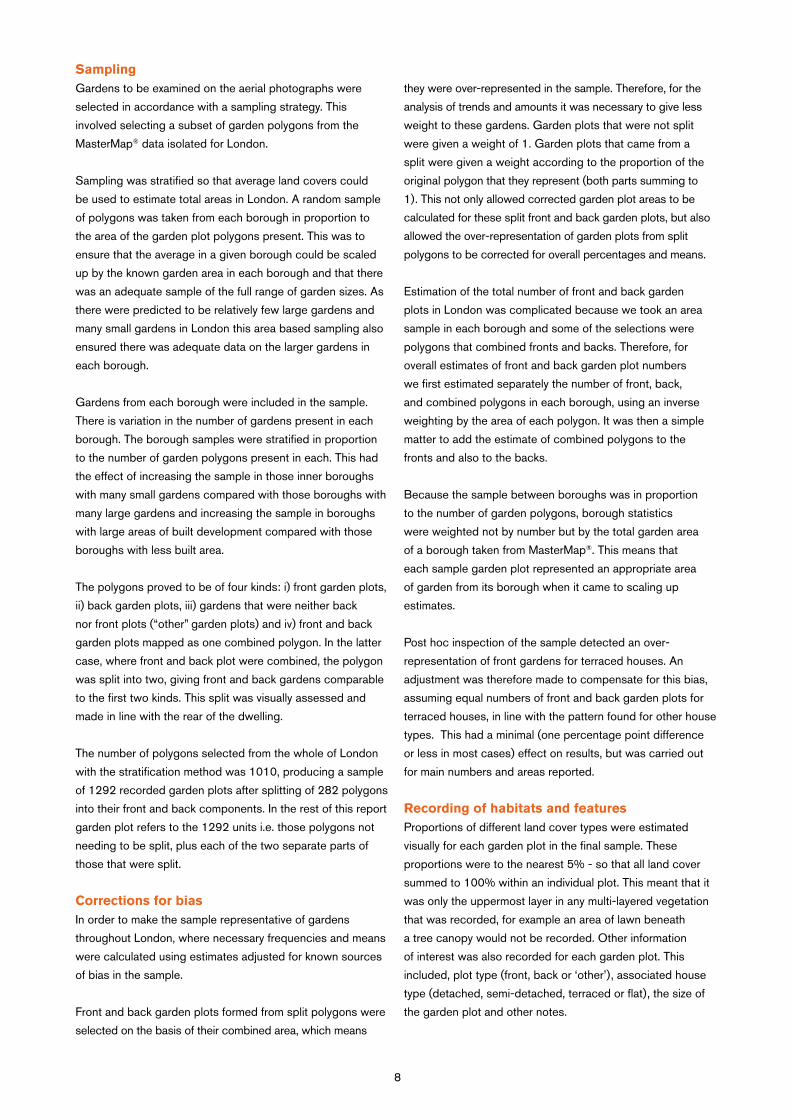
Sampling Gardens to be examined on the aerial photographs were
selected in accordance with a sampling strategy. This
involved selecting a subset of garden polygons from the
MasterMap® data isolated for London.
Sampling was stratified so that average land covers could
be used to estimate total areas in London. A random sample
of polygons was taken from each borough in proportion to
the area of the garden plot polygons present. This was to
ensure that the average in a given borough could be scaled
up by the known garden area in each borough and that there
was an adequate sample of the full range of garden sizes. As
there were predicted to be relatively few large gardens and
many small gardens in London this area based sampling also
ensured there was adequate data on the larger gardens in
each borough.
Gardens from each borough were included in the sample.
There is variation in the number of gardens present in each
borough. The borough samples were stratified in proportion
to the number of garden polygons present in each. This had
the effect of increasing the sample in those inner boroughs
with many small gardens compared with those boroughs with
many large gardens and increasing the sample in boroughs
with large areas of built development compared with those
boroughs with less built area.
The polygons proved to be of four kinds: i) front garden plots,
ii) back garden plots, iii) gardens that were neither back
nor front plots (“other” garden plots) and iv) front and back
garden plots mapped as one combined polygon. In the latter
case, where front and back plot were combined, the polygon
was split into two, giving front and back gardens comparable
to the first two kinds. This split was visually assessed and
made in line with the rear of the dwelling.
The number of polygons selected from the whole of London
with the stratification method was 1010, producing a sample
of 1292 recorded garden plots after splitting of 282 polygons
into their front and back components. In the rest of this report
garden plot refers to the 1292 units i.e. those polygons not
needing to be split, plus each of the two separate parts of
those that were split.
Corrections for biasIn order to make the sample representative of gardens
throughout London, where necessary frequencies and means
were calculated using estimates adjusted for known sources
of bias in the sample.
Front and back garden plots formed from split polygons were
selected on the basis of their combined area, which means
they were over-represented in the sample. Therefore, for the
analysis of trends and amounts it was necessary to give less
weight to these gardens. Garden plots that were not split
were given a weight of 1. Garden plots that came from a
split were given a weight according to the proportion of the
original polygon that they represent (both parts summing to
1). This not only allowed corrected garden plot areas to be
calculated for these split front and back garden plots, but also
allowed the over-representation of garden plots from split
polygons to be corrected for overall percentages and means.
Estimation of the total number of front and back garden
plots in London was complicated because we took an area
sample in each borough and some of the selections were
polygons that combined fronts and backs. Therefore, for
overall estimates of front and back garden plot numbers
we first estimated separately the number of front, back,
and combined polygons in each borough, using an inverse
weighting by the area of each polygon. It was then a simple
matter to add the estimate of combined polygons to the
fronts and also to the backs.
Because the sample between boroughs was in proportion
to the number of garden polygons, borough statistics
were weighted not by number but by the total garden area
of a borough taken from MasterMap®. This means that
each sample garden plot represented an appropriate area
of garden from its borough when it came to scaling up
estimates.
Post hoc inspection of the sample detected an over-
representation of front gardens for terraced houses. An
adjustment was therefore made to compensate for this bias,
assuming equal numbers of front and back garden plots for
terraced houses, in line with the pattern found for other house
types. This had a minimal (one percentage point difference
or less in most cases) effect on results, but was carried out
for main numbers and areas reported.
Recording of habitats and features
Proportions of different land cover types were estimated
visually for each garden plot in the final sample. These
proportions were to the nearest 5% - so that all land cover
summed to 100% within an individual plot. This meant that it
was only the uppermost layer in any multi-layered vegetation
that was recorded, for example an area of lawn beneath
a tree canopy would not be recorded. Other information
of interest was also recorded for each garden plot. This
included, plot type (front, back or ‘other’), associated house
type (detached, semi-detached, terraced or flat), the size of
the garden plot and other notes.
8
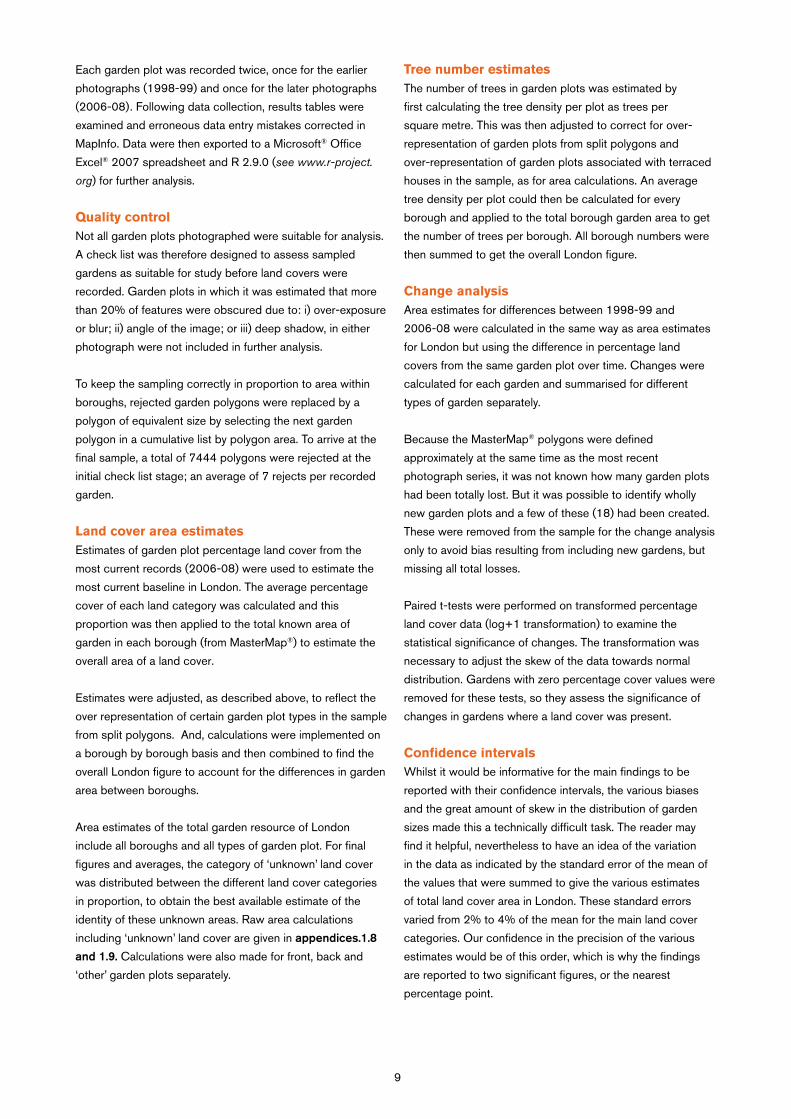
Each garden plot was recorded twice, once for the earlier
photographs (1998-99) and once for the later photographs
(2006-08). Following data collection, results tables were
examined and erroneous data entry mistakes corrected in
MapInfo. Data were then exported to a Microsoft® Office
Excel® 2007 spreadsheet and R 2.9.0 (see www.r-project.
org) for further analysis.
Quality controlNot all garden plots photographed were suitable for analysis.
A check list was therefore designed to assess sampled
gardens as suitable for study before land covers were
recorded. Garden plots in which it was estimated that more
than 20% of features were obscured due to: i) over-exposure
or blur; ii) angle of the image; or iii) deep shadow, in either
photograph were not included in further analysis.
To keep the sampling correctly in proportion to area within
boroughs, rejected garden polygons were replaced by a
polygon of equivalent size by selecting the next garden
polygon in a cumulative list by polygon area. To arrive at the
final sample, a total of 7444 polygons were rejected at the
initial check list stage; an average of 7 rejects per recorded
garden.
Land cover area estimatesEstimates of garden plot percentage land cover from the
most current records (2006-08) were used to estimate the
most current baseline in London. The average percentage
cover of each land category was calculated and this
proportion was then applied to the total known area of
garden in each borough (from MasterMap®) to estimate the
overall area of a land cover.
Estimates were adjusted, as described above, to reflect the
over representation of certain garden plot types in the sample
from split polygons. And, calculations were implemented on
a borough by borough basis and then combined to find the
overall London figure to account for the differences in garden
area between boroughs.
Area estimates of the total garden resource of London
include all boroughs and all types of garden plot. For final
figures and averages, the category of ‘unknown’ land cover
was distributed between the different land cover categories
in proportion, to obtain the best available estimate of the
identity of these unknown areas. Raw area calculations
including ‘unknown’ land cover are given in appendices.1.8
and 1.9. Calculations were also made for front, back and
‘other’ garden plots separately.
Tree number estimatesThe number of trees in garden plots was estimated by
first calculating the tree density per plot as trees per
square metre. This was then adjusted to correct for over-
representation of garden plots from split polygons and
over-representation of garden plots associated with terraced
houses in the sample, as for area calculations. An average
tree density per plot could then be calculated for every
borough and applied to the total borough garden area to get
the number of trees per borough. All borough numbers were
then summed to get the overall London figure.
Change analysisArea estimates for differences between 1998-99 and
2006-08 were calculated in the same way as area estimates
for London but using the difference in percentage land
covers from the same garden plot over time. Changes were
calculated for each garden and summarised for different
types of garden separately.
Because the MasterMap® polygons were defined
approximately at the same time as the most recent
photograph series, it was not known how many garden plots
had been totally lost. But it was possible to identify wholly
new garden plots and a few of these (18) had been created.
These were removed from the sample for the change analysis
only to avoid bias resulting from including new gardens, but
missing all total losses.
Paired t-tests were performed on transformed percentage
land cover data (log+1 transformation) to examine the
statistical significance of changes. The transformation was
necessary to adjust the skew of the data towards normal
distribution. Gardens with zero percentage cover values were
removed for these tests, so they assess the significance of
changes in gardens where a land cover was present.
Confidence intervalsWhilst it would be informative for the main findings to be
reported with their confidence intervals, the various biases
and the great amount of skew in the distribution of garden
sizes made this a technically difficult task. The reader may
find it helpful, nevertheless to have an idea of the variation
in the data as indicated by the standard error of the mean of
the values that were summed to give the various estimates
of total land cover area in London. These standard errors
varied from 2% to 4% of the mean for the main land cover
categories. Our confidence in the precision of the various
estimates would be of this order, which is why the findings
are reported to two significant figures, or the nearest
percentage point.
9
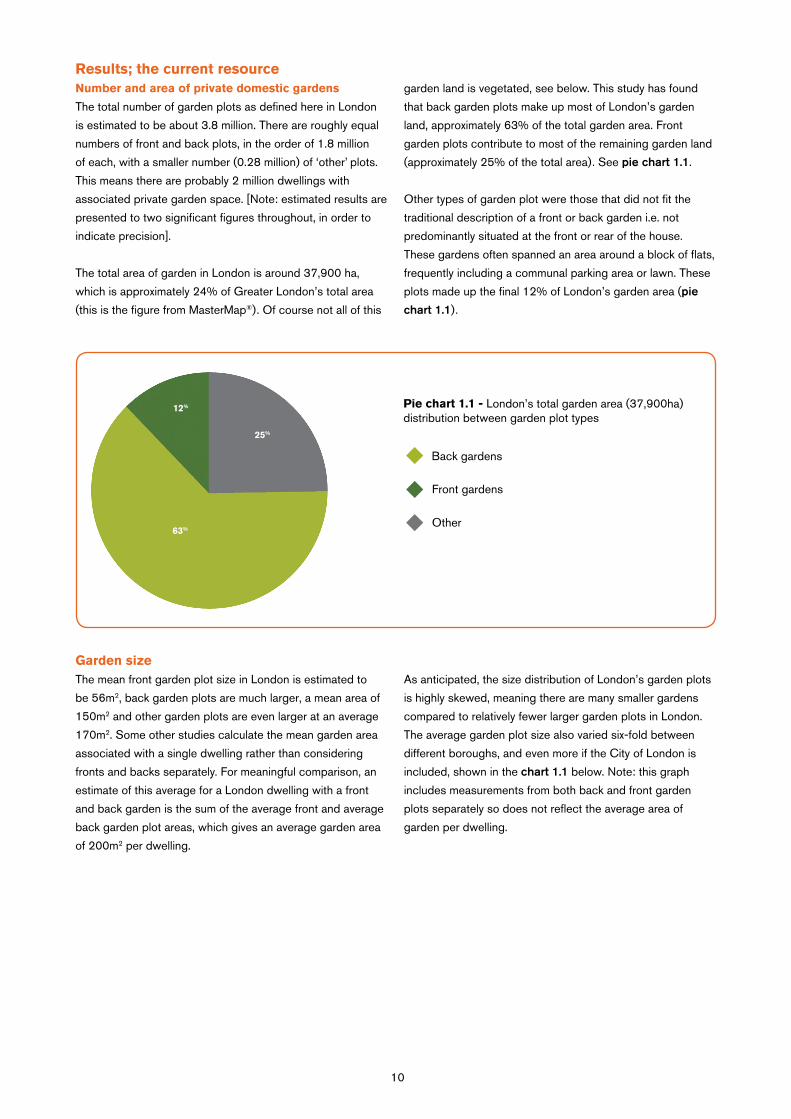
Results; the current resourceNumber and area of private domestic gardens
The total number of garden plots as defined here in London
is estimated to be about 3.8 million. There are roughly equal
numbers of front and back plots, in the order of 1.8 million
of each, with a smaller number (0.28 million) of ‘other’ plots.
This means there are probably 2 million dwellings with
associated private garden space. [Note: estimated results are
presented to two significant figures throughout, in order to
indicate precision].
The total area of garden in London is around 37,900 ha,
which is approximately 24% of Greater London’s total area
(this is the figure from MasterMap®). Of course not all of this
garden land is vegetated, see below. This study has found
that back garden plots make up most of London’s garden
land, approximately 63% of the total garden area. Front
garden plots contribute to most of the remaining garden land
(approximately 25% of the total area). See pie chart 1.1.
Other types of garden plot were those that did not fit the
traditional description of a front or back garden i.e. not
predominantly situated at the front or rear of the house.
These gardens often spanned an area around a block of flats,
frequently including a communal parking area or lawn. These
plots made up the final 12% of London’s garden area (pie
chart 1.1).
Garden sizeThe mean front garden plot size in London is estimated to
be 56m2, back garden plots are much larger, a mean area of
150m2 and other garden plots are even larger at an average
170m2. Some other studies calculate the mean garden area
associated with a single dwelling rather than considering
fronts and backs separately. For meaningful comparison, an
estimate of this average for a London dwelling with a front
and back garden is the sum of the average front and average
back garden plot areas, which gives an average garden area
of 200m2 per dwelling.
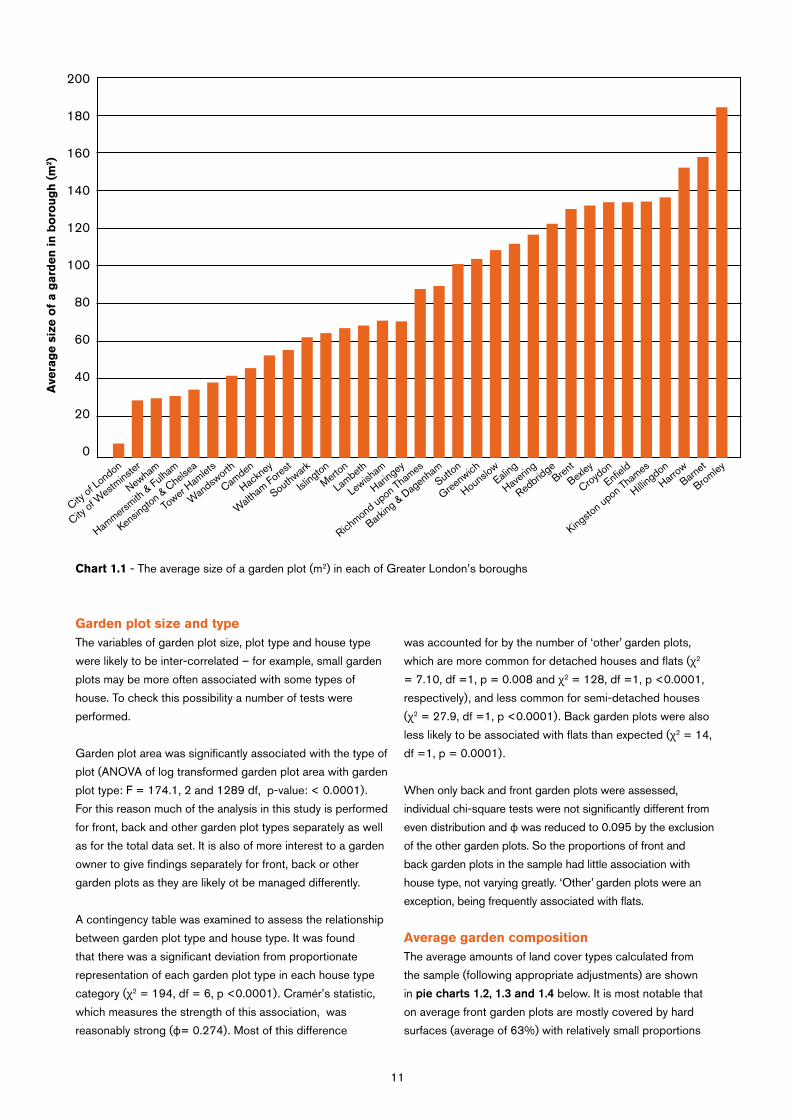
As anticipated, the size distribution of London’s garden plots
is highly skewed, meaning there are many smaller gardens
compared to relatively fewer larger garden plots in London.
The average garden plot size also varied six-fold between
different boroughs, and even more if the City of London is
included, shown in the chart 1.1 below. Note: this graph
includes measurements from both back and front garden
plots separately so does not reflect the average area of
garden per dwelling.
Pie chart 1.1 - London’s total garden area (37,900ha) distribution between garden plot types
u
u
u
Back gardens
Other
Front gardens
63%
25%
12%
10
200
180
160
140
120
100
80
60
40
20
0
City of L
ondon
City of W
estm
inster
Newha
m
Hammers
mith & Fulh
am
Kensin
gton & C
helse
a
Tower
Hamlet
s
Wan
dsworth
Camden
Hackn
ey
Walt
ham Fores
t
Southwark
Isling
ton
Merton
Lambeth
Lewish
am
Haring
ey
Richmond
upon T
hames
Barking
& Dag
enha
mSutt
on
Greenw
ich
Hounslo
wEali
ng
Haveri
ng
Redbrid
geBren
t
Bexley
Croydon
Enfield
Kingsto
n upon T
hames
Hillingdon
Harrow
Barnet
Bromley
Ave
rag
e s
ize o
f a g
ard
en
in
bo
rou
gh
(m
2 )
Chart 1.1 - The average size of a garden plot (m2) in each of Greater London’s boroughs
Garden plot size and typeThe variables of garden plot size, plot type and house type
were likely to be inter-correlated – for example, small garden
plots may be more often associated with some types of
house. To check this possibility a number of tests were
performed.
Garden plot area was significantly associated with the type of
plot (ANOVA of log transformed garden plot area with garden
plot type: F = 174.1, 2 and 1289 df, p-value: < 0.0001).
For this reason much of the analysis in this study is performed
for front, back and other garden plot types separately as well
as for the total data set. It is also of more interest to a garden
owner to give findings separately for front, back or other
garden plots as they are likely ot be managed differently.
A contingency table was examined to assess the relationship
between garden plot type and house type. It was found
that there was a significant deviation from proportionate
representation of each garden plot type in each house type
category (χ2 = 194, df = 6, p <0.0001). Cramér’s statistic,
which measures the strength of this association, was
reasonably strong (φ= 0.274). Most of this difference
was accounted for by the number of ‘other’ garden plots,
which are more common for detached houses and flats (χ2
= 7.10, df =1, p = 0.008 and χ2 = 128, df =1, p <0.0001,
respectively), and less common for semi-detached houses
(χ2 = 27.9, df =1, p <0.0001). Back garden plots were also
less likely to be associated with flats than expected (χ2 = 14,
df =1, p = 0.0001).
When only back and front garden plots were assessed,
individual chi-square tests were not significantly different from
even distribution and φ was reduced to 0.095 by the exclusion
of the other garden plots. So the proportions of front and
back garden plots in the sample had little association with
house type, not varying greatly. ‘Other’ garden plots were an
exception, being frequently associated with flats.
Average garden compositionThe average amounts of land cover types calculated from
the sample (following appropriate adjustments) are shown
in pie charts 1.2, 1.3 and 1.4 below. It is most notable that
on average front garden plots are mostly covered by hard
surfaces (average of 63%) with relatively small proportions
11
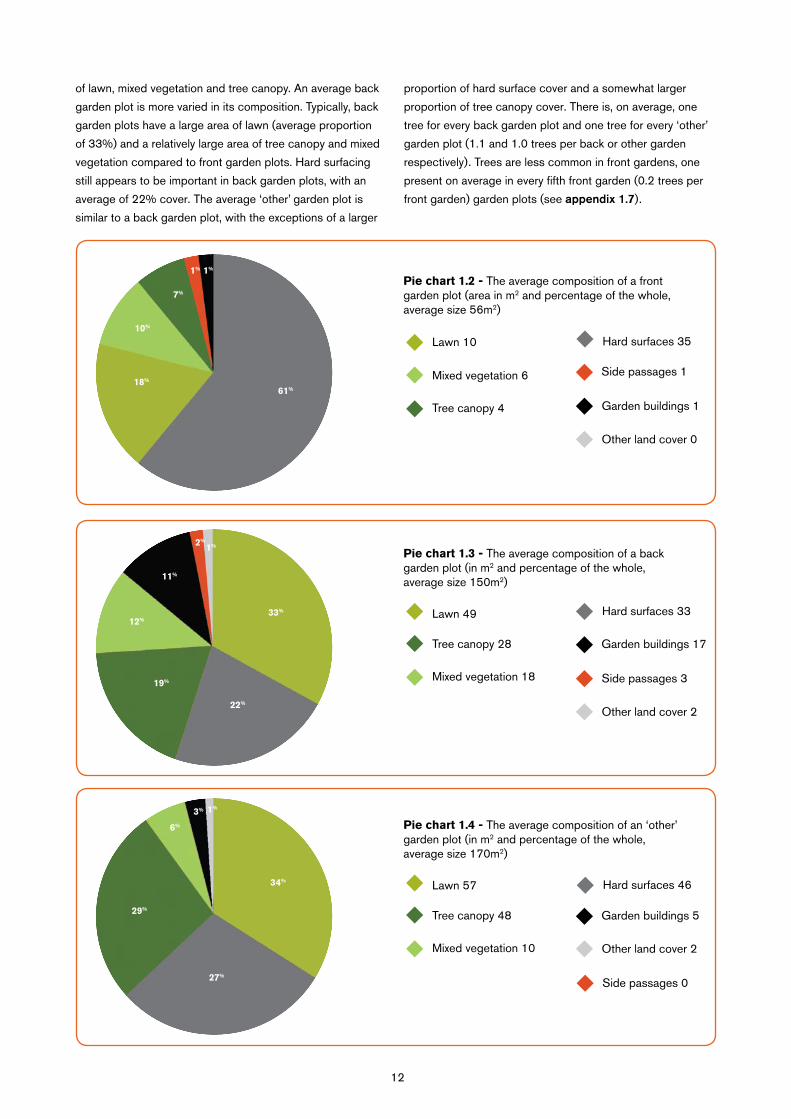
of lawn, mixed vegetation and tree canopy. An average back
garden plot is more varied in its composition. Typically, back
garden plots have a large area of lawn (average proportion
of 33%) and a relatively large area of tree canopy and mixed
vegetation compared to front garden plots. Hard surfacing
still appears to be important in back garden plots, with an
average of 22% cover. The average ‘other’ garden plot is
similar to a back garden plot, with the exceptions of a larger
proportion of hard surface cover and a somewhat larger
proportion of tree canopy cover. There is, on average, one
tree for every back garden plot and one tree for every ‘other’
garden plot (1.1 and 1.0 trees per back or other garden
respectively). Trees are less common in front gardens, one
present on average in every fifth front garden (0.2 trees per
front garden) garden plots (see appendix 1.7).
Pie chart 1.2 - The average composition of a front garden plot (area in m2 and percentage of the whole, average size 56m2)
61%18%
10%
7%
1% 1%
Tree canopy 4u
u Hard surfaces 35u Lawn 10
u Mixed vegetation 6 u Side passages 1
u Other land cover 0
u Garden buildings 1
Pie chart 1.3 - The average composition of a back garden plot (in m2 and percentage of the whole,average size 150m2)
33%
12%
11%
2%
1%
u
u
u
Garden buildings 17
Other land cover 2
u Lawn 49 u Hard surfaces 33
Mixed vegetation 18
u
u
Tree canopy 28
Side passages 3
22%
19%
Pie chart 1.4 - The average composition of an ‘other’ garden plot (in m2 and percentage of the whole,average size 170m2)
34%
29%
6%
3% 1%
Mixed vegetation 10
u Garden buildings 5
u Other land cover 2
u
u
u
Lawn 57 u Hard surfaces 46
Tree canopy 48
u Side passages 027%
12

Total land cover areasWhen averages are scaled up to London, the total area
of vegetated land cover (lawn, tree canopy and mixed
vegetation) in London’s gardens is approximately 22,000 ha.
This is 57% of the total garden land resource of London.
There are estimated to be 2.5 million garden trees in London
(appendix 1.7). The pie chart 1.5 below illustrates the
proportions of different land covers that make up the total
37,900 ha of London garden land; these are also listed in
table 1.2.
Pie chart 1.5 - Total percentage of land cover catego-ries, estimated for the 37,900 ha total garden space of London in 2006-08.
33%
18%
10%
7%1%
Mixed vegetation
u
u
u
Lawn u Hard surfaces
Tree canopy u
u
u
Garden buildings
Other land cover
Side passages
29%
2%
Analysed separately, it can be seen how different types of
garden contribute to the total areas of garden land cover
types in London. These results are also shown in table 1.2
on page 14. Front garden plots in London contribute to a
large area of hard surfacing. Back gardens contribute most
significantly to the total garden vegetated land cover, or
green space, in London. Back garden plots include about 1.9
million garden trees, front gardens 0.4 million garden trees
and other garden plots 0.3 million garden trees (appendix
1.7).
13

Table 1.2 - Total areas of land covers estimated to be present in London’s garden plots in 2006-08 (2 s.f.) and
associated percentages. Also given for front, back and other types of plot. (Areas scaled up from sample and ‘unknown’
land cover proportionally distributed amongst other categories). Standard errors of raw figures were of the order of 3%
for the main categories
Variation in London’s garden plots
Garden plot type and land coverThe percentage cover of several different land cover
categories differed between front, back and other types.
Several of these differences in percentage land cover were
found to be statistically significant in Kruskal Wallis rank sum
tests (tree canopy χ2= 147, df = 2, p-value < 0.0001; lawn
χ2= 159, df = 2, p-value < 0.0001; mixed vegetation χ2= 38,
df = 2, p-value = < 0.0001; hard surfacing χ2= 364, df =
2, p-value < 0.0001 and building χ2= 282, df = 2, p-value <
0.0001). This means that the three different types of garden
plot differ in terms of their garden composition, as illustrated
by pie charts 1.2 - 1.4. This is also likely to be related to the
different sizes of garden types, see next section.
Garden plot size and land cover The amount of some land covers was correlated with garden
plot area. The percentage covers of hard surface, buildings
and mixed vegetation decreased as garden plot area
increased. This means that these land covers tend to occupy
a smaller proportion of larger garden plots than smaller
garden plots. The Pearson product moment correlation
coefficients were all highly significant: hard surface r -0.23,
df 1146, buildings r -0.14, df 431, mixed vegetation r -0.14,
df = 841.
There was also a negative correlation between the
percentage unknown land cover and garden plot area
Land cover type
Total area (ha)
% of garden area
% of London
Total area in Front garden plots (ha)
% of front garden plot area
Total area in back garden plots (ha)
% of back garden plot area
Total area in ‘other’ garden plots (ha)
% of ‘other’ garden plots area
All land
Tree canopy
Lawn
Mixed vegetation
Total ‘green’ land covers
37900 100% 24% 9400 100% 24000 100% 4600 100%
6700 18% 4% 740 8% 4600 19% 1300 28%
11000 29% 7% 1630 17% 7900 33% 1500 33%
4000 11% 3% 930 10% 2800 12% 280 6%
22000 58% 14% 3300 35% 15000 63% 3100 67%
Hard surface
13000 34% 8% 5900 63% 5300 22% 1300 28%
Buildings 2800 7% 2% 120 1% 2600 11% 140 3%
Side passage
590 2% <1% 100 1% 480 2% 10 <1%
Other 340 1% <1% 10 <1% 280 1% 50 1%
14

Chart 1.2 - Change in area of land cover categories (ha) for all garden between 1998-99 and 2006-08 (unknown land
cover distributed proportionally between known categories)
(Pearson product moment correlation coefficient r -0.10, df =
929). This declining percentage of unknown land cover with
increasing garden area is likely due to shadows from walls or
the building covering a proportionately larger area in a small
garden plot compared to a large garden.
The percentage cover of tree canopy and of lawn did
however increase with increasing garden plot area. Although
these increases were not statistically significant, some
land cover must increase, given the significant decreases
documented above and that the percentages add up to 100.
Apart from these changes in the amounts of any particular
cover type, small garden plots were more likely to lack some
elements of cover. As a result of this, the number of cover
types increased significantly as garden plot size increased.
This is also likely to be related to garden type, as described
above. It may be that equivalent areas made up of large
garden plots and/or back gardens have a richer variety of
habitats than if they were made up of small garden plots and/
or front gardens.
Change in garden composition over time
Observed changes in area of land coverOver the time period studied, there were a number of
notable changes in the different land cover types of London’s
gardens. The total area values for 1998-99 are given in
appendix 1.4. Changes over the 8.5 years (on average) in
the areas of land cover are illustrated in the graph below and
tabulated in appendix 1.5.
Hard surface showed the biggest gain, increasing in cover
by 2,600 ha over the time period, which is an increase of
26% on the original area of hard surface in 1998-99. Lawn
showed the largest reduction in area, decreasing by 2,200
ha, down 16% of the 1998-99 amount. All vegetated land
(lawn, tree canopy and other vegetation) decreased in total
area over time. Overall, the area of vegetation was reduced
by 3000 ha, a 12% drop on the 1998-99 area of vegetation,
see chart 1.2. A number of changes over time in land cover
types (tests on raw data before unknown areas proportionally
distributed) were statistically significant (analysis results are
given in appendix 1.6).
3000
2000
1000
0
-1000
-2000
-3000
Tota
l are
a o
f ch
an
ge in
lan
d c
ove
r (h
a)
Tree canopyMixed
vegetation Lawn
Hardsurfaces
Buildings
Side passages Other
Land cover categories
15

When different garden plot types are examined separately,
similar trends of land cover change emerge for each type but
with varying magnitude. Changes in lawn and hard surfacing
are common for all garden plot types, with an increase in
garden buildings also notable for back garden plots, see
appendix 1.5.
In front garden plots, the largest changes in percentage
land cover were a decrease in lawn and a parallel increase
in hard surface. Both of these land covers were significantly
different between the two time periods. Mixed vegetation
and tree canopy showed smaller decreases in coverage
and buildings showed a small increase in coverage (which
were not significant over this time period). These major land
cover trends are illustrated in chart 1.3 below. The unknown
percentage area cover also showed a significant reduction
between the two sets of photographs, probably because the
second set of photographs were of higher quality.
Chart 1.3 - changes over 8.5 year study period in the total area of various land covers found in front garden plots
1998 - 1999 2006 - 2008
7000
6000
5000
4000
3000
2000
1000
0
Hard surfaces
Lawn
Mixed vegetation
Tree canopy
Buildings
Change in major land covers (front gardens)
Tota
l are
a o
f la
nd
co
ver
(ha)
16
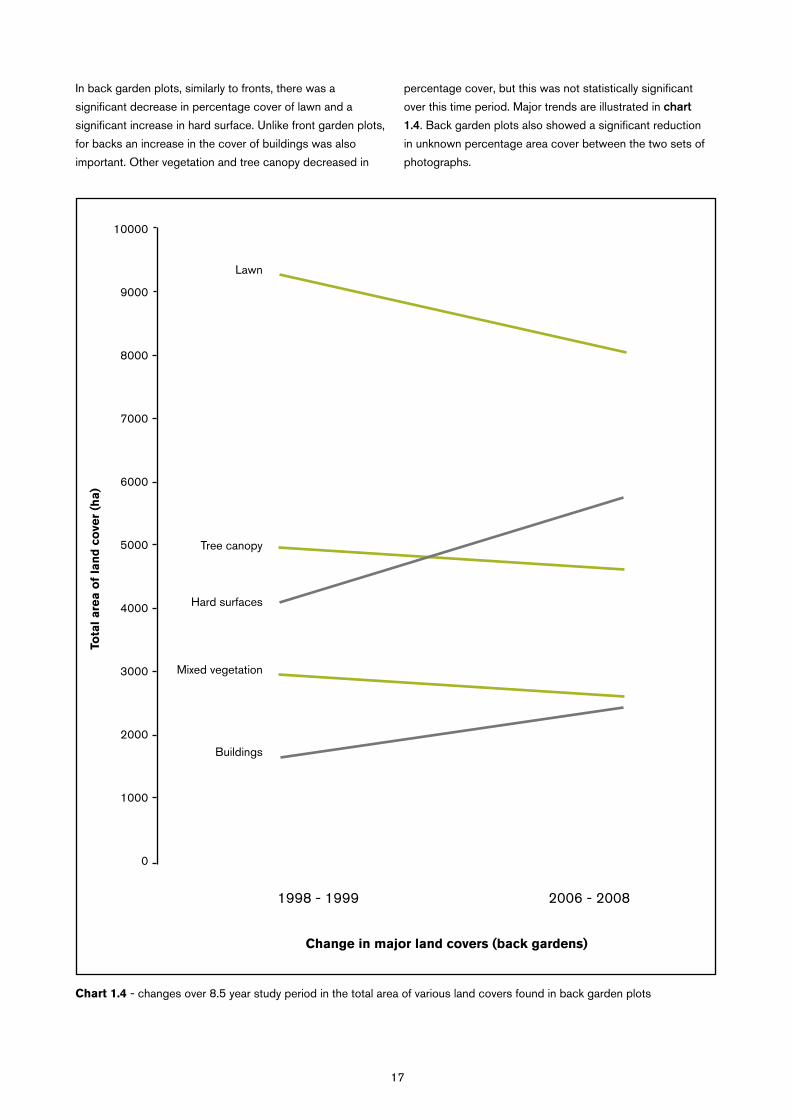
In back garden plots, similarly to fronts, there was a
significant decrease in percentage cover of lawn and a
significant increase in hard surface. Unlike front garden plots,
for backs an increase in the cover of buildings was also
important. Other vegetation and tree canopy decreased in
percentage cover, but this was not statistically significant
over this time period. Major trends are illustrated in chart
1.4. Back garden plots also showed a significant reduction
in unknown percentage area cover between the two sets of
photographs.
Chart 1.4 - changes over 8.5 year study period in the total area of various land covers found in back garden plots
1998 - 1999 2006 - 2008
10000
9000
8000
7000
6000
5000
4000
3000
2000
1000
0
Hard surfaces
Lawn
Mixed vegetation
Tree canopy
Buildings
Change in major land covers (back gardens)
Tota
l are
a o
f la
nd
co
ver
(ha)
17
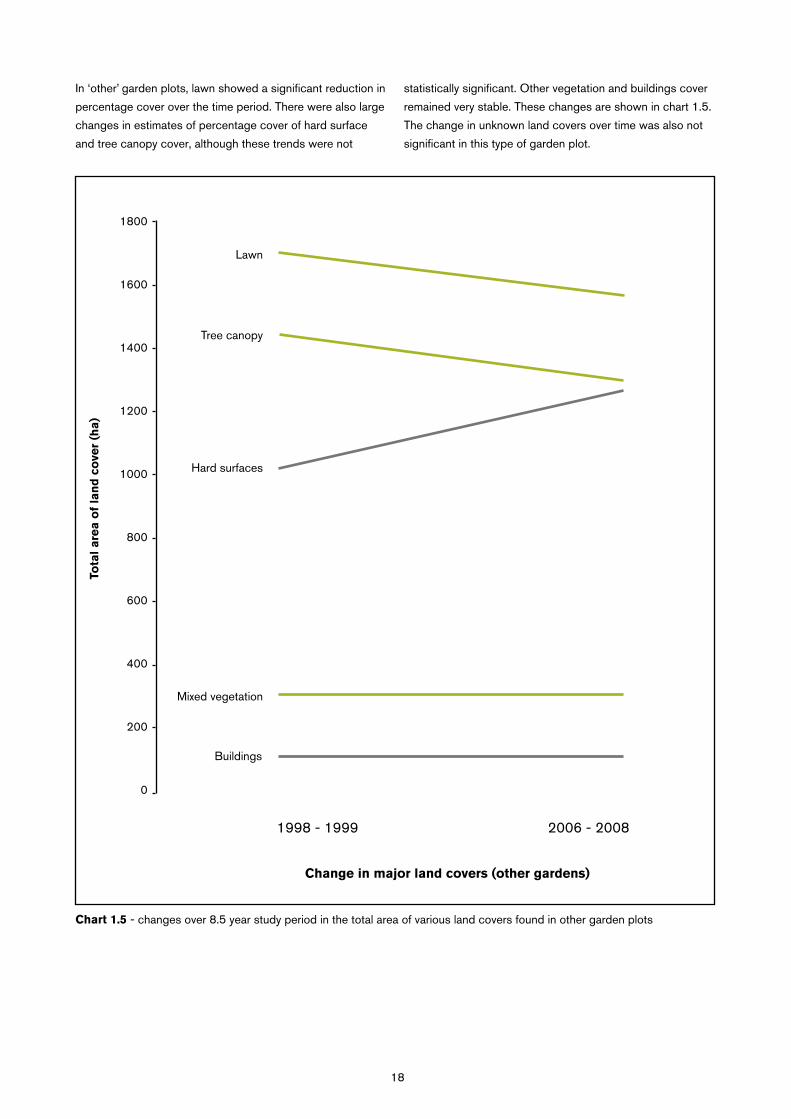
Chart 1.5 - changes over 8.5 year study period in the total area of various land covers found in other garden plots
In ‘other’ garden plots, lawn showed a significant reduction in
percentage cover over the time period. There were also large
changes in estimates of percentage cover of hard surface
and tree canopy cover, although these trends were not
statistically significant. Other vegetation and buildings cover
remained very stable. These changes are shown in chart 1.5.
The change in unknown land covers over time was also not
significant in this type of garden plot.
1998 - 1999 2006 - 2008
1800
1600
1400
1200
1000
800
600
400
200
0
Hard surfaces
Lawn
Mixed vegetation
Tree canopy
Buildings
Change in major land covers (other gardens)
Tota
l are
a o
f la
nd
co
ver
(ha)
18
DiscussionThe scale of the current resourceThis study has been able to improve and advance quantitative
information about London’s garden resource, developing
the platform for informed discussion with regards to policies
and practice. The results unequivocally show that London’s
gardens together form a substantial land use in the capital,
nearly a quarter of the city’s land surface.
The total area of private garden space in the UK is often
quoted to be around 400,000 ha (Gilbert, 1989; Owen,
1991) and national study has recently improved this estimate
to 432,924 ha (Davies, et al., 2009). This means that
London’s 37,900 ha of garden land represents around 9% of
the total UK garden resource.
Although Londoners may be surprised that their garden or
gardens contribute to such a large overall area of garden
land in the city, the proportion of London that is garden is not
unusual in the context of studies of other UK cities. Research
carried out in Sheffield found approximately 23% (33 km2) of
the city area comprises of domestic gardens (Gaston et al.,
2004b) and a study comparing the garden resources in five
UK cities – Edinburgh, Belfast, Leicester, Oxford and Cardiff
– calculated that the area of each city covered by domestic
gardens ranged from 21.8% to 26.8% (Loram et al., 2007).
The total area of garden in London is not contiguous;
approximately 2 million dwellings, including shared flats and
multiple occupancy buildings, have gardens and garden
land is therefore subject to physical fragmentation as well
as fragmented ownership. Each garden plot within the total
garden space of London is subject to varying design, use,
management and maintenance; each will have their own
history. This represents a unique situation compared with other
(semi-) natural habitats in the city. To understand the role of the
garden resource in London, this study analysed the features
within garden plots on a London-wide scale for the first time.
Green spacesAnecdotally, London is known to be one of the greenest -
most verdant - cities in Europe. Clearly there is compelling
evidence that gardens contribute to a significant green
habitat in the capital. Over half of the garden land in London
includes vegetation cover – including grassy lawns, flower
beds and low level vegetation, hedges and tree canopy.
Taken together, this total area of vegetated land cover in
London’s gardens is estimated to be 22,000 ha (over 150
times the size of Hyde Park) approximately 14% of London.
For comparison, the vegetated areas of London’s garden
plots amount to almost 75% of the combined area of
London’s Sites of Importance for Nature Conservation, which
number about 1500 in total).
Habitats within a typical private garden can be home to a
diverse range of wildlife. More than 700 invertebrate species
were identified within a sample of gardens in Sheffield
(Gaston et al., 2004). Jennifer Owen found 91 hoverfly,
343 moth, 21 butterfly, 51 bee, 41 wasp and 251 beetle
species in a long-term study of her Leicestershire garden
(Owen, 1991). Good invertebrate diversity encourages
a range of other species. The Mammal Society found 43
different mammal species in gardens, with an average of five
mammals observed in a single garden (Harris, 2002). Birds
are well known garden visitors, and manage to maintain high
population densities in areas of human settlement thanks to
garden habitats. In an analysis of Breeding Bird Survey data,
Newson et al. (2005) found a large proportion (17-62%) of
the populations of common bird species (blackbird, song
thrush, dunnock, greenfinch, starling, house sparrow, wood
pigeon and jackdaw) were found in locations containing
habitat associated with humans, though 10% of the UK
was estimated to be classified as such habitat. The range
of vegetation that was identified in this study indicates that
many of London’s gardens may have suitable habitat for a
range of wildlife.
There is a fairly large area of tree canopy within London’s
gardens, 6,700 ha in total (47 times the area of Hyde Park),
which represents 4% of London. Some of this canopy cover
will be due to over-hang of non-garden trees, e.g. street trees.
This strategy estimates that there are around 2.5 million mature
trees actually growing within London’s garden plots, which
will account for most of the canopy area. London’s garden
trees are likely to represent an important habitat resource
for tree-dwelling species in gardens. However, there may
be in the region of seven million trees in Greater London,
about a quarter of which are in woodland (Dawson, 2005).
Trees provide about 18% cover in gardens compared with an
estimate of 30% for London as a whole (Dawson, 2005).
Garden trees are likely to increase the biodiversity of
individual gardens, for example garden trees were one of the
most important correlates with insect diversity in gardens in
Sheffield (Smith et al., 2006). The protection of the garden
tree resource must be an important aim. However, trees
can be controversial in residential areas. They may cause
problems with regards to roots, shade, leaf and fruit fall
and require some maintenance. A few tree species may
cause additional structural problems through suckering
(e.g. Ailanthus and Robinia). Developing positive attitudes
to garden trees may be a good mechanism to promote
the protection of existing trees and the planting of more
(for example, as in the Forestry Commission’s Tree and
Woodland Framework for London http://www.forestry.gov.uk/
ltwf). There is hope that some people are already doing this,
19
given that the decline of garden tree canopy cover over the
last eight and a half years has generally been less than that of
lawn or other kinds of vegetation.
Lawns are a popular and practical land cover in traditional
British gardens (a direct descendent of 18th century English
landscape design) and this is reflected in the garden
space of London. Nearly a third of London’s garden space
is covered by lawn. Lawns occupy a much larger area of
London’s garden resource than other forms of garden
vegetation, mainly due to their cover in back gardens, and are
therefore important to consider in approaches to preserving
and improving the garden green space. Lawns may also play
a critical role in the development of sustainable drainage
systems and in the building of soils, which are often depleted
in urban areas (Gaston et al., 2005b).
Studies have shown that a normal garden lawn can be
surprisingly biodiverse, although this is dependent on the
underlying substrates, age and management. Thompson
et al. (2004) measured the floral composition and diversity
of lawns in Sheffield. They found a wide diversity of
plants growing in lawns (159 vascular plant species were
identified). In particular, lawns were an important source of
native plant species within gardens, accounting for up to
69% of the total native richness of the gardens in Sheffield.
The value of lawns for wildlife is likely to be strongly
dependent on management techniques. The species in
a garden lawn will depend on various factors, including
the lawn age, height and frequency of cutting, soil fertility,
use of herbicides and initial seed mixture (Gilbert, 1989).
Garden owners may be surprised by lawns’ special ability to
maintain native species and so to boost the biodiversity of
a typical garden. This presents an opportunity to emphasise
the importance of relaxing lawn management techniques to
enhance their wildlife role, and the benefits of lawns over
hard surfaces as a ground cover.
Other kinds of vegetation including hedges, climbers,
shrubs and herbaceous borders were less extensive in
their area coverage of London’s gardens than lawn or tree
canopy. These habitats and features are most difficult to
identify with the methods employed, and may therefore be
slightly underestimated. Following Owen’s idea of a garden
representing a habitat in a permanent state of succession
(Owen, 1991), this mixed vegetation may be seen as a
garden’s ‘woodland edge flora’. It is therefore an important
intermediate habitat for many garden species, forming edge
habitats and various sources of shelter and food.
Garden borders may be particularly important sources
of soil biodiversity. Smith et al. (2006) sampled lawn and
border soil invertebrate diversity in public parks and gardens
in the borough of Kensington and Chelsea, London. They
demonstrated that garden planted borders can be a good
source of native soil biodiversity in urban areas, and suggested
that the environmental heterogeneity and low level of
disturbance of borders favour a higher invertebrate diversity
than is found in typically more homogeneous lawns. The study
focused on invertebrate diversity, but soil diversity also benefits
plant communities and other species such as birds and small
mammals that feed on invertebrates. Though they cover a
smaller area of gardens, hedgerows, climbers and planted
borders can be important for supporting wildlife in gardens.
Altogether, the sheer scale of the green space resource in
gardens suggests that the vegetated area of gardens within
the capital is a significant and strategically important wildlife
habitat. However, because of the fragmented nature and
management of private garden and the transient nature of
garden ownership and lack of protective status, the quality
of habitats across the whole resource is likely to be very
variable. Changes to the management of a large enough
proportion of gardens in London clearly has the potential to
benefit wildlife conservation significantly.
Variation within London’s gardens
Two of the key sources of variation within London’s gardens
were garden plot size and/or type. The typical front garden
plot is different from the typical back or ‘other’ types of
garden in terms of land cover composition, and smaller plots
were also likely to have different coverage compared to larger
plots. The two factors are also linked, because front gardens
tend to be small. We didn’t test here the inter-category
correlation.
Nationally the average area of garden associated with a
dwelling (i.e. front plus back where both are present) is
estimated to be around 190m2 (Davies et al., 2009). This
study has found the equivalent area of garden in London
to be 200m2. In Edinburgh, Belfast, Leicester, Oxford and
Cardiff mean garden areas by this definition range from 155
to 253m2 (Loram et al., 2007), so London gardens appear no
different in size to those in other UK cities.
Urban gardens tend to have strongly skewed size distributions
(Gaston et al., 2005b; Loram et al., 2007), meaning there is
a large number of small gardens compared to relatively few
larger gardens. This is also the case for London’s garden plots,
meaning that small plots are very common.
There were marked differences between different types
of garden plot in London. Front plots tend to have a larger
area of hard surface and less area given over to vegetation,
whereas back and other kinds of garden plot are most
20
important for providing vegetated habitats and usually have
less hard surfacing. One of the main reasons for these
differences is likely to be their sizes. Garden plot size was
correlated with garden type: front garden plots are smallest
(mean 56m2), back garden plots are much larger (mean
150m2) and other types of plot are largest (mean 170m2). As
outlined above, the size of a garden is an important factor in
determining its composition. However, there are of course
also social and functional differences between different types
of garden plot that will affect composition.
Independent of garden plot type, there was a greater variety
of habitat types to be found in large garden plots than in
small ones. It seems likely that a block including numerous
large garden plots will have a greater diversity of habitat than
a similarly large block mosly comprising of small garden plots.
In summary, size and type of a garden are likely to be key
considerations driving the composition of individual gardens
and therefore are also an important source of variation to take
into account when engaging the public with garden issues.
Small gardensA large number of small garden plots in a city present certain
challenges for garden wildlife. The findings for London
support those of Smith et al. (2005) that garden size plays a
significant role in determining the resources for wildlife they
may contain. Many London garden plots are small, and this
small size has an impact on internal composition, probably
because of the physical and perceived limitations that small
size imposes upon garden design and management.
One characteristic of small garden plots is that the
proportional cover of certain features decline with garden
area. In London’s gardens the proportional cover of hedges,
climbers, flower beds and shrubs declined with increasing
garden plot size. Smith et al. (2005) also found that the
proportional cover of their land cover category ‘cultivated
flower bed’ was negatively related to garden area. In both
cases this relationship occurs because as gardens become
smaller the ratio of perimeter to area increases. So in small
gardens, planting that is around the perimeter boundary, such
as a flower bed or hedgerow, will occupy a larger proportion
of the garden area than the same feature in a large garden.
The planting of hedges, border vegetation and climbers
along fences may therefore be particularly important for
small gardens to improve habitat availability, and presents
a practical way of introducing vegetation for small gardens
where space is at a premium. The cumulative habitat of
perimeter vegetation in many small gardens where they form
a block of gardens may also benefit some species.
It was also found that features which tend to be a fixed size
such as hard surfacing, buildings and side passageways
occupy a larger proportion of small garden plots than
large plots. For example, a 5 x 5m patio will cover a larger
proportion of a 50m2 garden plot than a 150m2 plot. Smith
et al. (2005) found a similar relationship between equivalent
land cover categories and garden size for back garden plots
in Sheffield.
This has important consequences regarding advice for
smaller gardens. The issue of hard surfacing may be most
important for smaller gardens, where this is likely to be a
dominant land cover (not only in the individual garden, but
accumulatively within a mosaic of small gardens). Novel
approaches to hard surfacing, which reduce the effective size
of standard patios or paths may be particularly important for
small gardens to reduce the overall proportional cover of hard
surfacing and improve drainage.
There was a considerable difference in the average sized
garden between different London boroughs, mostly reflecting
their different levels of urbanisation and historic development.
Outer-London boroughs such as Bromley and Barnet, which
are characteristically suburban and with much detached
(and semi-detached) housing, included garden plots with
the largest average sizes, whereas, inner London boroughs,
which are more densely populated, or much terraced
housing or flats such as Kensington and Chelsea and City of
Westminster, had typically small garden plots.
This finding has potential consequences for the approach to
garden advice for different boroughs. ‘Small garden advice’
focusing on greening up hard surface and introducing more
habitat diversity would be best focused on certain (especially
inner London) boroughs. ‘Larger garden advice’, highlighting
the importance of wildlife-friendly lawn management, pond
construction and the retention of trees may be best targeted
at boroughs at the top end of the scale of average garden
size where back gardens, in particular, will include areas
distant from the dwelling.
Front gardens
Together, front garden plots make up a smaller proportion of
London’s garden space (25%) than back gardens (63%).
Nevertheless, the total front garden resource is large and,
as rows of adjacent front gardens are a commonly seen
in London, the habitats within front gardens could have a
significant local landscape effect too. The overall area of front
garden plots estimated in this study is also two times greater
than the “conservative estimate” of 47.8 km2 (4780 ha) of
front garden space in London used by the Greater London
Assembly Environment Committee’s Crazy Paving study
(Greater London Assembly Environment Committee, 2005).
In addition, front garden plots contribute disproportionately
to the overall amount of hard surfacing in London. It is
21
calculated here that London’s front garden plots contribute
5900 ha of hard surfacing, 41 times the size of Hyde Park (a
figure much greater than a previous estimate in a smaller scale
study of 3200 ha (Greater London Assembly Environment
Committee, 2005)). The issues surrounding hard surfacing
are therefore particularly significant in front gardens.
The composition of London’s front gardens is likely to reflect
their function as well as typically small size. Hard surfacing
appears to be an important land cover in all types of garden
plot, but it is the major land cover in front garden plots. Front
gardens normally lead onto a public highway and are more
open and visible than back gardens. They are therefore more
appropriate as a parking space for vehicles, likely to have
access to the front door via a hard surface path and are
perhaps less likely to be used for leisure activities. Front plots
are also much more likely to function as a display of status as
they are most publicly visible. The composition of an average
London garden suggests that these roles are important to
front garden owners.
Hard surfacing of gardens for practical reasons may occur
at the expense of vegetation, therefore reducing habitat
availability for wildlife. Smith et al., (2005) found that land cover
types that tend to remain at a constant absolute size may be
present at the expense of vegetated land cover in smaller back
gardens. Evidence from London’s garden plots suggests that
this relationship may be even more important for front gardens.
Front garden plots tended to have a larger proportion of
space given over to fewer land cover types, with hard surfaces
dominating, at the expense of vegetated habitats.
Hard surfacing that is impermeable causes the additional
problem of reducing rain water drainage and causing run-off
of water and flooding problems (Communities and Local
Government, 2008). Hard surfaces also have a higher
maximum daytime surface temperature (Communities and
Local Government, 2008). The extensive hard surface cover
coupled with a parallel lack of vegetation in front gardens
means that the hard surfaced areas in these gardens are also
less likely to be ‘buffered’ by softer land covers either within
the garden or in adjoining gardens than is the case for hard
surfaced areas in back or other gardens. Drainage problems
are therefore likely to be more significant for front gardens
than backs, compounding the impact that this will have upon
adjoining pavements and roads.
Back and other garden typesBack gardens comprise 63% of the total garden land area
in London. This means that how people chose to use and
manage their back garden plot has an important influence
on the total area of London’s garden habitat. The average
composition of a back garden in London perhaps reflects
the traditional British garden design: a large area of lawn
and an area of hard surfacing (patio and path), smaller areas
of planting (herbaceous plants and shrubs), a tree and at
least one outbuilding (shed, glasshouse etc.). In general a
back garden plot in London has a more equitable cover of
different land cover types than front gardens, which tend to
be dominated by hard surface. A mixture of different surfaces
and habitats means that back gardens are a richer source of
habitat diversity for wildlife than front gardens.
Back gardens are also typically larger, which means that
they may be more likely to have undisturbed areas at some
distance from the dwelling with benefits for wildlife in terms of
habitat disturbance and breeding. This is unlike the situation
in front gardens, which are by definition more likely to be near
to roads and more frequently disturbed by passers-by and
foot access to the dwelling.
Back gardens tend to be largely covered by vegetated
habitats. On average, 64% of a London back garden was
‘green habitats’, compared with only 35% of the average
front garden. Back garden plots are particularly important
for garden trees. About 1.9 million of the 2.5 million trees
in London’s garden plots are found in back plots, which is
an average of about 1 tree per back plot (one tree was also
present, on average, in every ‘other’ garden, though being
rarer, these gardens contributed less to the total number
of garden trees – 270,000 trees). This compares with only
400,000 trees found in front garden plots (an average of
about one tree in every five front plots).
Back and ‘other’ garden plots are very similar in their
composition, with lawn occupying the biggest area of space.
Buildings are more likely to be found in back gardens, which
reflects the available space as well as the privacy of the back
garden space compared to the typically overlooked front or
‘other’ garden (which may also typically be communal).
Based on national information, it has been suggested
that larger gardens provide the best habitat for mammals,
including hedgehog (Erinaceus europaeus), fox (Vulpes
vulpes), grey squirrel (Sciurus carolinensis), wood mouse
(Apodemus sylvaticus), occasionally common shrew
(Sorex araneus) and, when they are well vegetated, the
bank vole (Clethrionomys glareolus) (Gilbert, 1989; Harris,
2002). Back and ‘other’ kinds of garden plot in London are
considerably larger than front garden plots and have more
variety of habitats. They may therefore be much more likely to
be able to provide the habitat suitable for mammals and this
could be a particular focus in some of the outer boroughs.
Where plots together form blocks of garden, these are more
likely to be large plot and to include a wide range of habitats
than a similar number of smaller front gardens.
22
Change in gardensBy examining measurable changes in land cover between
garden plots that could be seen in both early and recent
photographs, this study was able to estimate the overall
changes that have occurred to the London garden resource
due to gardening trends and uses. We were unable to study
the loss or gain of whole gardens in any detail.
Garden hard surfaces in general have increased in area by
26% over the study period, which is a gain of twice the area
of Hyde Park every year. When correctly laid, most modern
paving materials shed water off their surface, resulting in
excess water running away into sewers and drains rather than
soaking into the land (Anon, 2006). The permeability of the
hard surfacing recorded in this study is unknown because
of the aerial photograph interpretation methods employed.
However, it is likely that much of the hard surfacing recorded
in front gardens is impermeable. Traditional impermeable
driveways that allow uncontrolled runoff of rainwater from front
gardens onto roads can contribute to flooding and pollution of
watercourses (Communities and Local Government, 2008).
Increased levels of rainwater run-off from hard surfaces
in London increase the water flow into combined outflow
drainage systems. This means that, in times of heavy rainfall,
there is a greater likelihood of sewage discharge into London’s
rivers and the possibility of localised flooding (GLA, 2005).
The large increase in garden hard surfaces over the study
period means that the permeability of London’s garden area
has also likely decreased considerably during this time.
Aside from the rate of garden vegetation loss, the changes in
all green habitats detected in this study represent a real loss of
wildlife habitat during this period. A mean of 6m2 of vegetation
has been lost in an average front garden plot and 11m2 of
vegetation lost in a back garden plot over 8.5 years. The loss
of each tree, hedge or square metre of lawn is a loss for the
wildlife that depends upon these habitats. On an individual
garden plot scale, changes in composition of garden land
covers can have significant impact on the biodiversity value of
a garden. On the scale of a block of suburban garden plots,
changes occurring somewhere in the block will adversely
affect the variety of wildlife to be seen in any one of the
component gardens (Dawson & Gittings, 1990).
These changes also have to be considered with regards
to our changing climate. Buildings and hard surfaces in
an urban environment absorb solar radiation, causing an
increase in air temperature within urban centres above that of
surrounding areas – the ‘urban heat island effect’. Vegetated
spaces within an urban matrix of land covers have the
opposite effect, because evapotranspiration from vegetation
and soils leads to a cooling of air temperatures (Taha et al.,
2000). Where gardens include a vegetated component of
land cover they are likely to be contributing to this cooling
effect in built up areas. The London Climate Change
Adaptation Strategy outlines climate projections taken from
the Hadley Centre’s Regional Climate Modeling for the UK
and south-east England (and therefore Greater London). All
climate change scenarios predict warmer, wetter winters,
hotter, drier summers and an increase in the frequency and
intensity of extreme weather in Greater London (GLA, 2008).
Therefore, with rising temperatures the green spaces in
London’s gardens may be more important than ever before
to adapt to the impacts of climate change. The loss of
vegetated land cover from London’s gardens is therefore
a concern and a trend that needs to be reversed if the full
potential of gardens to aid climate change adaptation and
comfort is to be realised. Emphasising these, perhaps hidden,
environmental roles of gardens to the public and providing
advice on suitable planting for increased temperatures and
flooding scenarios may help to reverse this trend.
Since October 2008 the paving of front gardens for
hard standing is no longer a permitted development right
without planning permission. It is permitted to lay new (or
replacement) driveways or parking areas greater than 5m2
only if they are constructed using permeable surfaces that
allow water to soak into the ground, for example porous
asphalt or gravel (Communities and Local Government,
2008). This legislation may slow the trend of increased
hard surfacing of London’s gardens in the future, or at least
improve the permeability of the hard surfacing that is being
used. However, it remains to be seen how strictly enforced
this legislation will be and how many planning applications
will be made and accepted for the impermeable hard
surfacing of gardens. Emphasis of this new legislation and,
in particular, encouragement to convert impermeable hard
surfacing to permeable alternatives, should be key public
engagement strategies to reduce the environmental impact
of garden hard surfaces. Importantly, this legislation does
not mitigate for the loss of vegetated land covers that is the
parallel trend with increasing hard surfacing found in this study.
Garden buildings (as measureable in this study) have
increased in area from 1,800 ha to 2,800 ha. The increase
in garden buildings is a particular phenomenon of back
gardens, 94% of the increase in buildings occurred in back
gardens. The magnitude of this trend was unexpected
and suggests that garden sheds and glasshouses are a
more common feature, though the use of these buildings is
not known, as the category was not further divided in this
study. This category will have included some, but not all,
extensions to houses added during the study period, which is
a limitation to interpretation. However, it is clear that a trend
towards increased area of buildings in gardens exists and is
apparently at the expense of back garden vegetated habitat,
23
which is a cause for concern. The contribution of building
extensions to this trend and the nature of outbuildings
involved is a priority for future enquiry. Encouraging climbers
on fences and the walls of buildings and the construction of
green roofs could partly mitigate for the loss of vegetation to
garden buildings.
Significantly, the increase in hard surfaces and buildings in
London’s gardens has been a driver of major losses of green
habitat in the capital. In front garden plots a loss of vegetation
has been largely due to its replacement with hard surfaces
– likely to be the paving over of front gardens for car parking
and convenience. In back garden plots, vegetation has been
lost almost equally to hard surfaces and the construction or
extension of buildings.
In total, an area of vegetated garden land about 21 times
the size of Hyde Park was lost over the 8.5 years studied,
representing a 12% reduction on the amount in 1998-99.
Yearly this represents a loss of an area two and a half times
the size of Hyde Park, which is a cause for concern, should
this trend continue. Hypothetically, if the loss of green space
observed during the period of study were to carry on, we
would lose all of our garden green space by the year 2068.
This is unlikely to happen for a number of reasons, but it
emphasises a worrying trend.
The loss of lawn habitat in particular is a statistically
significant change. We can be certain this loss is not a result
of chance in the sample. The loss of other vegetation also
showed a downward trend, but this could be the result of
chance, so studies across further years would be necessary
to find out if this is a real long term trend, as might be
expected. Perhaps surprisingly, the number of trees growing
in gardens changed little over the study period, with just the
hint of a small loss. This suggests that the removal of garden
trees is less of a concern than might be anticipated across
the whole of London over this time scale. A longer-term study
would be required to see if there is a significant decline over
a greater time period.
It is very possible that a considerable amount of loss of green
space, particularly due to the paving over of front gardens for
parking, may have occurred prior to the time period of study,
as the drivers of this loss clearly pre-date the study period in
origin. Unfortunately, the quality of earlier aerial photographs
available was not good enough to allow examination of
earlier change. Without a longer term study it is hard to know
whether the trend might begin to slow, however, it is clear
that it must be a goal of conservation organisations to slow or
reverse this trend now.
ConclusionsIn terms of the direct loss of wildlife habitats, increased
rainwater runoff and raised daytime surface temperatures,
the trend of the replacement of vegetation for hard surfacing
and buildings is a major concern. These issues become more
concerning in a future climate scenario of increased daytime
temperatures and reduced rainfall. Urban green spaces can
represent a wildlife resource that is not subject to the factors
leading to loss or degradation of habitats in rural areas
(e.g. agriculture), with the additional benefits of providing
people with a direct contact with the natural world. However,
evidence suggests that current trends in the loss of total
garden vegetation are harming our garden resource both for
wildlife and as mitigation for the likely effects of climate change.
If we are to maximise the potential of London’s gardens to
support biodiversity, the trend of increased hard surfacing
and reduced vegetation in them needs to be halted and
reversed. But a limitation of gardens as a conservation
resource is that they are outside the immediate control of
local government and other agencies (Gaston et al., 2005a);
this makes it difficult to directly influence management.
A key mechanism for change is therefore engaging public
involvement. Key aims for public engagement must be: firstly,
to highlight the significant role of individual garden habitats
in terms of contributing to the overall garden resource and,
secondly, to drive improvements in the quality of this resource
by appealing to people’s interests in maintaining wildlife-
friendly gardens. Voluntary nature conservation organisations,
such as London Wildlife Trust, have an important role to
engage with members of the public and influence wildlife-
and climate-friendly management of gardens. For example,
the Trust launched its ‘Garden for a Living London’ campaign
in July 2008 to raise awareness of the value of London’s
gardens and ask Londoners to do one thing to create a
wildlife and climate change friendly garden. This campaign
will benefit from the improved baseline information generated
in the present study.
To a garden owner, the area of their individual garden may
seem limited, particularly for those living in inner city terraced
housing, but the sum of all these gardens contributes
substantially to the overall amount of green space in urban
areas across the country (Davies et al., 2009). The findings
of this project document how individual gardens in London
contribute to a strategically important green space resource.
This information can be used to highlight the importance of the
combined garden resource in London and motivate individual
garden owners to protect or improve the quality of their garden
as part of a broader neighbourhood green space.
24

The size of garden plots and plot type appear to be influential
(related) factors of in terms of the composition of London
gardens, and the changes to land covers that occurred were
different in front, back and other kinds of garden plot (though
further work is needed to see how the two factors relate to
each other). This strongly suggests that advice regarding
wildlife friendly garden design and management would be
most efficient if tailored to certain types and sizes of garden,
as well as different kinds of people. The large number of
small garden plots, particularly in some parts of London,
means that advice for people should be specifically tailored
to address the issues of small gardens.
Aside from public engagement, the second mechanism for
change is legislation, regulation and policy, with effective
enforcement mechanisms. There is now a requirement for
planning permission to be received in order to pave more
than five square metres of a front garden with traditional,
impermeable driveways that do not provide for the water
to run to a permeable area (Communities and Local
Government, 2008). This is an improvement on previous
situation by raising awareness of the drainage consequences
of hard surfacing garden land and encouraging good
practice. It may deter some cases of unnecessary paving
altogether. However the paving legislation does not concern
the loss of vegetation (or consequences for wildlife habitat or
cooling effects) that can occur regardless of surface type and
success depends on adequate enforcement.
Existing planning controls are in place to prevent
inappropriate housing development on back garden land.
In particular the declassification of gardens as previously
developed land or ‘brownfield’ in summer 2010 (Communities
and Local Government, 2010b) has gone some way to
changing how they are perceived by developers and relieves
gardens from inclusion in local authority targets for previously
developed land. The effects of housing development are dealt
with in study 2 of this report.
The findings here highlight not only the value of London’s
garden land for wildlife habitat and as an environmental
resource, but also show that these roles are under threat.
This report therefore provides evidence to support future
policy decisions.
IntroductionThe loss of front garden vegetated land to paving for parking
areas and the loss of back garden land to in-fill housing
developments can be seen as the two main concerns
regarding changes to garden green space over time. This
part of the Garden Research Project addresses the latter
issue, with the aim of quantifying the impact that known
housing developments have on the land cover in gardens.
The Greater London Authority (GLA) has highlighted the
importance of gardens as a green space within London and
in particular, has drawn attention to housing development
on back gardens (often dubbed ‘garden grabbing’, ‘in-fill’, or
‘backland development’) as a key issue. Most new buildings
or major changes to existing buildings need planning
permission (see www.planningportal.gov.uk). The GLA
maintain the London Development Database (LDD), which
includes records of planning permissions meeting specific
criteria from Greater London.
Until recently gardens were designated as ‘previously
developed land’, commonly termed brownfield land in planning
guidance. On June 9th 2010, gardens were removed from
the brownfield classification in Planning Policy Statement 3
(PPS3) on Housing, the intended effect that gardens do
not come under pressure from previously developed land
targets and trajectories for strategic housing development
plans (Communities and Local Government, 2010b). This
does not mean that garden land is under no pressure at all
from development, but gives local authorities more freedom
to judge individual applications on local appropriateness and
makes appeal on grounds of affordable housing needs less
likely (Communities and Local Government, 2010a).
This study aims to qualify the impacts of developments where
they have been completed to understand the changes that
occur to that land as a consequence.
Determining if there has been change in numbers of
developments or impacts over time was not the intention of
this report, though this has been done elsewhere by different
methodology (see Communities and Local Government, 2010a).
Methods Developments that were investigatedThe London Development Database includes details of
both ‘live’ and ‘completed’ developments given planning
permission. The database was filtered to identify housing
developments, completed between 1st April 2005 and
31st March 2008, which were probably carried out on
garden land according to details available. These were
developments where the previous and final land use was
Study 2: Gardens subject to housing development
25
given as ‘residential’ and there were no housing units on the
site before development, to exclude estate redevelopments.
Developments ranged from single terraced houses built onto
the end of a row of houses, to small developments of several
properties on a number of gardens. These developments
were examined with the aim of estimating the changes that
occurred to the garden surfaces subject to development.
There are many smaller developments and minor changes
to existing buildings that can be carried out on garden
land without planning permission, and these ‘permitted
developments’ are not examined in this study (although they
are clearly likely to have an impact, as suggested in Study 1).
Geographical Information SystemA Geographic Information System (GIS) was built in MapInfo
Professional 9.5 to include topographical information about
London and information about selected developments.
In total, 1115 sites were identified in the LDD (financial
years 2005-07) as developments that may affect private
garden land. The co-ordinates of these developments were
displayed as points (eastings and northings) in the GIS.
This GIS included: a) polygons defining garden land from
MasterMap®, an Ordnance Survey database of topographical
information and b) Ordnance Survey street and house names,
c) two series of aerial photographs of Greater London, the
first taken in 1998-99 and the second in 2006-08 (Cities
Revealed).
Aerial photographs enable known larger developments
on garden land to be observed both before and after
development is complete. This has the advantage of allowing
us to see the changes that have occurred to garden plots
directly because of housing development during the time
period available for study.
Systematic assessmentEach suspected garden development was first assessed
visually in a two stage systematic checking process:
Stage 1: Developments were inspected to check if they
affected private garden land, as defined by MasterMap®.
Those that did not involve garden land were disregarded.
Sites where the housing development and/or final
landscaping within the development curtilage was not
complete were also not analysed further.
Stage 2: Development sites were assessed for quality of
visual information. Sites were disregarded when it was
estimated that visual information was obscured for more
than 20% of the area being assessed. Three criteria were
considered: i) poor photograph exposure or blur, ii) non-
vertical photograph angle, iii) deep shadow over an area.
Land cover assessmentFollowing the checks described above, the curtilage
boundary of a development was estimated and digitised
on-screen. Curtilage boundary was defined as the boundary
of the new development, including the building, garden and
driveway/parking space. This was taken either from the
current OS MasterMap® boundary, where this had been
updated to reflect the new development, or a visual estimate
from the aerial photograph.
The proportions of habitats, surfaces and unknown areas
within the defined curtilage boundary were then estimated
(to nearest 5% cover) both in the pre-development and
post-development photographs. The number of mature
trees (judged as a crown canopy of >2m wide) assessed
as growing within the curtilage boundary was estimated.
The number of garden plots intersecting the development
curtilage was recorded before and after development occurred
as in some cases more than one garden plot is involved in a
development. It is important to note that the garden habitats
recorded in the ‘before development’ data do not necessarily
represent a whole garden plot, but the area that is within the
curtilage of the planned development. This area may therefore
include parts of one or several garden plots, and in a very few
cases, also an area that is not garden land.
Land cover categories recorded were the same as those
used for the study of garden change in chapter one. The only
exception was that in this study of development ‘building’
refers to newly built dwelling houses as well as garden
buildings such as sheds and glass houses (table 2.1).
Because the curtilage boundary was defined by the recorder,
land cover estimates were not affected if the new garden and
dwelling boundaries had been updated in the MasterMap®
layer The categories were defined by appraising photograph
quality and ground truth survey of volunteers’ gardens. This
process is outlined in appendix 1.2 of chapter one.
26

The SampleOn visual examination of the suggested sites from the LDD,
934 records were accepted to be developments that were
given permission upon private garden land (181 developments
did not affect gardens). There were 319 developments in
financial year (FY) 2005-06, 314 developments in FY 2006-
07 and 301 developments in FY 2007-08 on garden land.
Of these developments, 172 (54%) in FY 2005-06, 161
(51%) in FY 2006-07 and 78 (26%) in FY 2007-08 (total
411) were completed at the time of the aerial photograph
and acceptable on grounds of photograph quality.
The most recent set of aerial photographs used for analysis
were taken between 2006 and 2008, with most dating
from 2006-07. Recent developments were more likely to be
incomplete at the time of photography, which explains why
the housing development completions in the LDD from 2007
were under-represented in the sample compared with those
completed in 2005 and 2006.
In order to make conclusions about the impact of all
developments over the three years in question, it was
necessary to assume that the non-assessed developments
were not significantly different from the assessed developments.
The rejected and recorded garden developments were
therefore assessed to see if there was any observable
systematic bias – none was found (see box 1).
Estimating total areasThe area of land cover types was calculated by multiplying
estimated percentage cover (expressed as a decimal fraction)
of a land cover type by development curtilage area (rounded
to nearest m2) for each individual development assessed
(once for each time period). As there was no appreciable
bias in terms of development size (see box 1) within the
sample, it was possible to scale up estimates to the total area
of housing developments across the three years to give us
the best estimates of the total amounts of various land covers
affected by back garden developments between 1st April
2005 and 31st March 2008.
Table 2.1 – Land cover categories and definitions
Land cover type Definition
Tree canopy A ‘tree’ refers to a mature woody species (or with a 2m wide canopy). No further
distinction (e.g. between coniferous or deciduous) was made.
“Other vegetation” Includes, small to medium sized (<2m wide) herbaceous or woody plants – flowers,
shrubs etc. such as grown typically in a flower bed – scrub growth such as bramble
cover, climbers such as ivy or wisteria and hedges.
Lawn A grass/turf area. May be densely or sparsely vegetated, tall or closely mown. In this
study lawn, also includes areas dominated by small ephemeral herbaceous plants.
Hard surfacing Includes full spectrum of permeability e.g. paving, bricks, concrete, gravel or
‘decking’. Includes patios, paths, steps and driveways.
Building All sheds, glasshouses, summerhouses and other small (<12m2) detached buildings,
house extensions completed after June 2006 and some (unknown proportion of)
extensions prior to this date (see appendix 1.3).
Side passageway Narrow side path or passage along the side or between houses that is included
within the garden polygon. Often shaded, but likely to be hard surface.
Other Land cover type that is recognisable (i.e. not ‘unknown’) but doesn’t fit into any of the
broader categories. Typically, swimming pools, large compost heaps, garden debris,
garden furniture and occasional large ponds.
Unknown Area of garden that is obscured by deep shadow, poor photograph exposure or due
to the photograph angle.
27
This was done year by year, to account for the smaller sample
from 2007 and because there is interest in per annum totals.
The average (arithmetic mean) area of each land cover per
development in the sample was calculated (total area/number
of developments in sample) within each year. This average
was then multiplied by the total number of developments (i.e.
all completed developments on garden land) in each year to
get the area of habitat and the year totals were summed to find
the overall total area in the three financial years. Areas were
calculated separately for the time period before development
and after development, so that change could be estimated.
A similar method was used to calculate the number of trees
present and gardens impacted, before and after development.
The total area of unknown garden land cover (scaled up to
all developments) was 4.6 ha before development and 2.6
ha after development. As a best estimate from the available
information, the nature of the unknown area was estimated by
proportionally distributing it between the known categories of
land cover.
ResultsThe median size of a housing development curtilage across
the three years studied was 246m2; the mean size was 422
m2. The distribution of development sizes was right skewed,
meaning that there were many small developments and
fewer large developments. At any one development site, the
number of new housing units varied between 1 and 9, but
80% were single house developments (mean 1.35, median 1
new housing unit per development).
Changes due to developmentOver the three financial years studied, 934 (average of 311 per
annum) housing developments from the LDD were assessed
as impacting garden land. When data from the sample are
scaled up it is calculated that these developments
affected approximately 13 ha of garden land in FY 2005-06,
12 ha of garden land in FY 2006-07 and 15 ha of garden land
in FY 2007-08, which included at least part of approximately
486, 527 and 486 garden plots in each year respectively.
Following completion, there was an average of 703 garden
plots per annum within or intersecting the areas subject to
developments. This represents an average increase of 203
garden plots per annum. This is because many developments
involved the creation of a new house, or new houses, with
associated new smaller garden plots. However, the increase
in number of plots does not necessarily mean an increase in
the area of garden green space or inform us about the quality
of those new gardens. Therefore, a key consideration in terms
of impact of housing developments is the changes that occur
to the total cover of various surfaces and habitats within the
new-build curtilage.
All land cover types within the area affected by development
underwent a change in total area. A paired Wilcoxon signed
rank test with continuity correction on raw area data in the
sample confirmed that there was a significant difference
between before and after areas of all land cover types (see
appendix 2). Before development, there was proportionately
more ‘green’ land cover (tree canopy, mixed vegetation and
lawn) than ‘hard’ features (hard surface, side passage and
building). After development, the proportion of land that was
‘green’ decreased, where ‘hard’ features increased.
There was an average loss of 6.2 ha per annum (5.4 ha in FY
2005-06, 5.7 ha in FY 2006-07, 7.6 ha in FY 2007-08) of
garden green space (tree canopy, lawn and mixed vegetation),
as a consequence of all completed developments (based
on scaled up figures and with unknown areas proportionally
distributed between known categories). This is an average
loss of 200m2 vegetation per development per annum. There
was an average increase of 6.4 ha per annum (5.7 ha in FY
2005-06, 5.8 ha in FY 2006-07 and 7.6 ha in FY 2007-08) of
‘brown space’ or ‘hard’ landscaping, including hard surfaces,
building and side passageways. This is an average gain of
210m2 of ‘hard’ landscaping and buildings per development
per annum (including 85m2 per development of hard surface
– patios, driveways etc.). After development, there were an
estimated 500 fewer mature trees per annum than before
development (a loss of 440 in FY 2005-06, 520 in FY 2006-
07 and 540 in FY 2007-08).
Box 1 Checks were performed to test if there was a difference in curtilage size between: a) developments that were analysed and those that did not pass initial checks; and b) developments from sites that were accepted for analysis in different years.
Development size was judged from the ‘residential site area’ in the LDD. An outlier and null entries were first removed.
A Wilcoxon signed rank test with continuity correction (Wilcoxon Mann-Whitney) found no significant difference in the residential site area between accepted and rejected developments, as indicated by median site areas (0.024 ha and 0.022 ha, respectively).
A Kruskal-Wallis rank sum test found no significant difference between development areas in the three years (2005 median= 0.022 ha, 2006 median = 0.023 ha, 2007 median = 0.025 ha).
The findings of these checks show that the rejection of some developments did not bias the average site size, so there is no evidence that the assessment process biased the sample available for analysis.
28
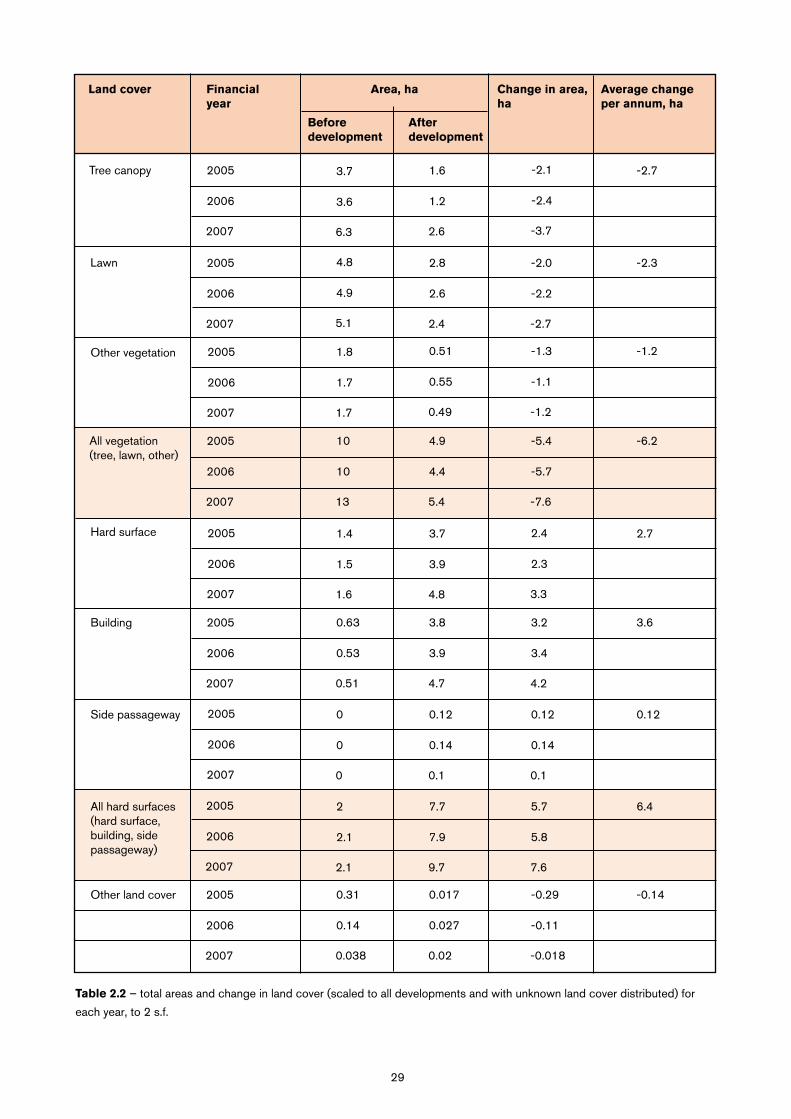
Table 2.2 – total areas and change in land cover (scaled to all developments and with unknown land cover distributed) for
each year, to 2 s.f.
Land cover Financial year
Before development
After development
Change in area, ha
Average change per annum, ha
Area, ha
Tree canopy 2005
2006
2007
2005
2006
2007
2005
2006
2007
2005
2006
2007
2005
2006
2007
2005
2006
2007
2005
2006
2007
3.7
3.6
6.3
1.6
1.2
2.6
-2.1
-2.4
-3.7
-2.7
Lawn 4.8
4.9
5.1
2.8
2.6
2.4
-2.0
-2.2
-2.7
-2.3
Other vegetation 1.8
1.7
1.7
0.51
0.55
0.49
-1.3
-1.1
-1.2
-1.2
All vegetation(tree, lawn, other)
10
10
13
4.9
4.4
5.4
-5.4
-5.7
-7.6
-6.2
Hard surface 1.4
1.5
1.6
3.7
3.9
4.8
2.4
2.3
3.3
2.7
Building 0.63
0.53
0.51
3.8
3.9
4.7
3.2
3.4
4.2
3.6
Side passageway 0
0
0
0.12
0.14
0.1
0.12
0.14
0.1
0.12
2005
2006
2007
2005
2006
2007
All hard surfaces (hard surface, building, side passageway)
2
2.1
2.1
7.7
7.9
9.7
5.7
5.8
7.6
6.4
Other land cover 0.31
0.14
0.038
0.017
0.027
0.02
-0.29
-0.11
-0.018
-0.14
29

ConclusionsThere has been an average of 311 known housing
developments completed upon private garden land per
annum between financial years 2005-06 and 2007-08. The
land subject to development is estimated to have included
at least part of an average of 500 garden plots per annum,
and, although these developments led to an overall gain of on
average 240 garden plots per annum, the amount of garden
vegetated land within the area subject to development
actually decreased significantly. The creation of new gardens
by these developments is countered by the fact that these
new plots are far smaller in size, and cover a smaller area
than that lost from the original gardens.
A loss of around 6 ha of garden green space each year and
a gain of an equivalent area of ‘hard’ land cover is not large
in the context of nearly 38 thousand hectares of garden, and
over 22 thousand hectares of garden green space that are
estimated to be present in London as a whole (see study 1
of this project report) – at this rate it would take 30 years to
lose 1% of London’s garden green space as a result of these
larger backland developments. However, on a local scale,
this impact may be significant to wildlife resources and in
terms of flood drainage and climate change adaptation. The
average (mean) gain of 85m2 per development per annum
of hard surface land cover (patios, paved pathways, drives
etc.), or 210m2 per development per annum if buildings and
side passageways (likely to be almost always hard surfaced)
are included, may represent a loss of permeability in the local
area. And this gain, coupled with the average loss of 200m2
green habitat per development per annum, gives increased
importance to surrounding ‘soft’ garden space for drainage.
The loss of vegetation in gardens also represents a potential
loss of local habitats for wildlife. The largest loss as a
consequence of development was in the amount of tree
canopy, followed closely by large losses in lawn and other
types of vegetation. Mature trees represent an important
breeding and feeding habitat for birds, bats and invertebrates
in particular and also play an important role in terms of soil
stabilisation, absorption of water, air quality and shade
provision. However, an average of 500 trees was removed
each year as a consequence of all known developments.
This means a loss of at least one tree per development (1.5
trees on average). The losses of lawn and other vegetation
taken together outweighed the loss of trees. These forms of
vegetation provide wildlife habitats and “soft” surfaces that
enable rainwater drainage, so these losses will have adverse
impacts on wildlife and hydrology.
The impact of the changes to land cover may be considerable
at a local level in terms of habitat availability and climate
change adaptation. Changes to land cover are likely to be
irreversible or long term (e.g. the loss of a mature tree) and
therefore cumulative year on year.
During the period studied gardens were considered in
the previously developed land category of planning policy
guidance.
Local authority definition of garden land and treatment
within strategic housing strategy has been shown to be
variable between authorities and regions, as is the pressure
to develop (Communities and Local Government, 2010a).
Gardens are now removed from the brownfield category
and associated development targets (Communities and
Local Government, 2010b), which should increase powers
of local authorities to assess the appropriateness of garden
developments and help to reduce regional variation. However,
pressure for housing development land continues and
may be considered greatest in the South East and London
(Communities and Local Government, 2010a) so undoubtedly
gardens will continue to be proposed for development.
Decision making relies on recognition of the importance of
garden space as a part of the total green space resource of
an urban area and of local impacts. Planning strategies which
neglect the role of gardens within estimates of green space,
particularly those in urban areas, undervalue the extent of the
resource (Davies, et al., 2009).
Study 1: Garden Land Cover shows the scale of garden
contribution to London’s green space. Housing development
impacts annually has a small impact on this in terms of
vegetation lost to hard surfaces, unlike the larger impacts
of design. This means that local considerations of impacts,
which include a large shift towards hard surfacing, are most
important. Hopefully the de-coupling of garden housing
development planning from brownfield targets should help
these local impacts to take precedence in the decision
making process.
With a move towards local decision making in planning, it is
vital that gardens are judged according to their immediate
roles for residents and wildlife but also considering their value
as part of a wider green space and landscape.
30
IntroductionThe London: Garden City? project has been able to provide
information about the scale of the capital’s garden resource,
component habitats, and threats to the garden green space
from hard surfacing of front gardens, permitted development
and the construction of new housing. Public engagement is
vital for protecting and enhancing London’s gardens for the
future and can be aided by good baseline information. An
understanding of variation within and between gardens can
help to focus campaign work.
Because neighbouring gardens often form blocks of similar
land use, garden habitats can be considered on a landscape
scale as well as at an individual garden level. The value and
role of gardens across London will vary depending on garden
plot density, proximity to other wildlife habitats and the needs
and lifestyles of the local population. For example, gardens
that densely cover an area or are in close proximity to other
green spaces can be considered as large, inter-connected
patches of wildlife habitat. On the other hand, the main
value of gardens in residential areas that are most isolated
from other green spaces may be social, providing important
contact with nature in an area that is otherwise deficient. Such
areas may be overlooked by work that focuses on areas with
large, habitat rich, blocks of garden or that relies on already
interested gardeners. It is of interest to identify areas in London
where gardens may be most important to wildlife and people,
as well as areas where gardens are scarce. Awareness of local
issues can help identify priority population areas for particular
initiatives, garden campaigning or habitat creation.
This study examines how available data sets can answer
useful questions to guide public engagement and focus
priorities geographically.
MethodsGreenspace Information for Greater London manage a
wealth of data about green space and biodiversity in London,
including habitat survey data, information about protected
sites for nature conservation, social data and climate
information. A weighted Geographical Information
System (GIS) model was therefore designed to include data
of particular interest. This included garden topography, areas
of quality wildlife habitat, climate change modelling (heat
indices), areas of deficiency in access to nature and other
socio-economic information.
The model was constructed in MapInfo Professional. 9.5. This
program allows different types of information to be displayed
and compared on the same map. Mapable information from
different sources or about different topics can be visualised
in a GIS model as ‘layers’ of overlapping data on a base map
of London. Relationships between these layers of data and
topographical information can also be visualised. The layers
that were included in the models are given in the table 3.1.
The Lower Super Output Area (LSOA) layer was used as
the basic unit to divide London and assess variation in other
topographical layers. This base layer was chosen because
each unit division is population based, representing on
average 1500 people. This allows areas with similar sized
population to be compared regarding their garden resource.
Focusing on units of population in this way is appropriate
for the purpose of the GIS to guide public engagement with
gardening for wildlife. Many other social data are also based
upon this unit, which makes interpretation simpler and future
developments more flexible.
The statistics within each LSOA were calculated – for
example, the number of garden polygons, area of garden
land, Index of Multiple Deprivation (IMD) score, area of Sites
of Importance for Nature Conservation (SINCs) etc. Within
each model, different factors are then differently weighted
according to questions about gardens and their roles. So for
example, in a model to highlight areas where gardens may
have most social value, social factors such as IMD would be
weighted more highly than wildlife factors.
Four functional models were created to address different
questions (named map 1, 2, 3 and 4) by the different
inclusion and weighting of data layers. The map concepts are
outlined on pages 34-35.
Study 3: Focusing priorities
31
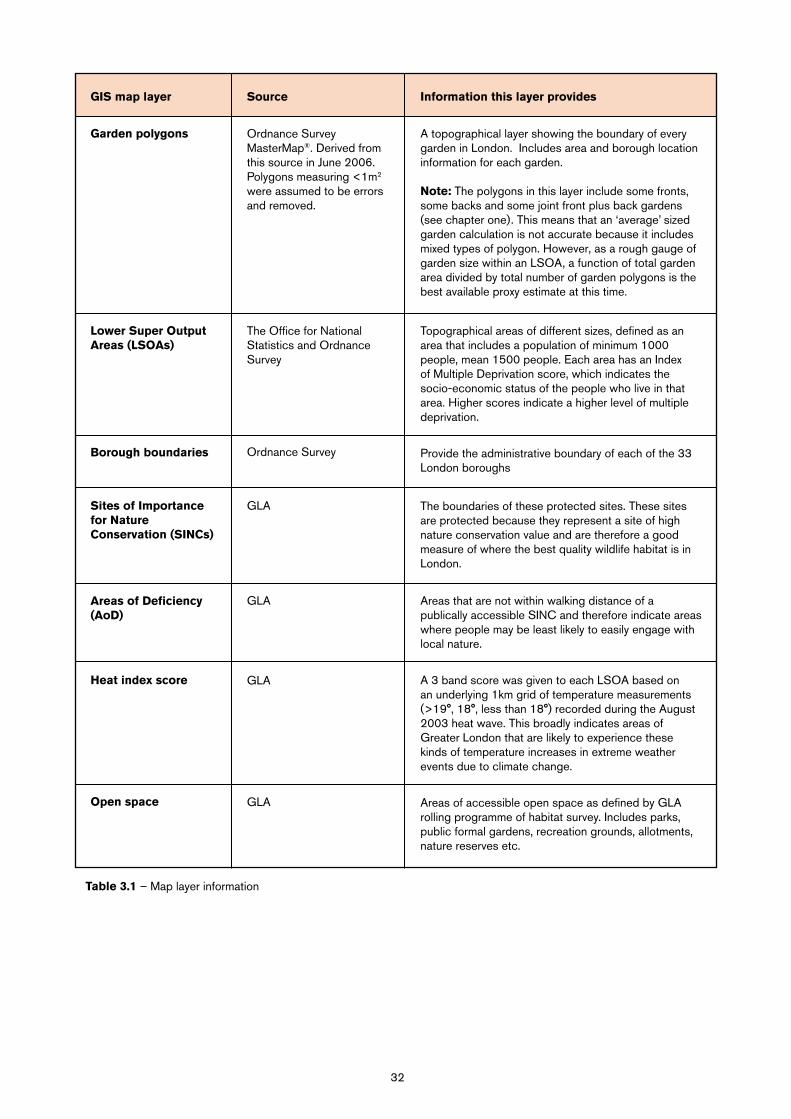
Table 3.1 – Map layer information
GIS map layer Source Information this layer provides
Garden polygons Ordnance Survey MasterMap®. Derived from this source in June 2006. Polygons measuring <1m2 were assumed to be errors and removed.
A topographical layer showing the boundary of every garden in London. Includes area and borough location information for each garden.
Note: The polygons in this layer include some fronts, some backs and some joint front plus back gardens (see chapter one). This means that an ‘average’ sized garden calculation is not accurate because it includes mixed types of polygon. However, as a rough gauge of garden size within an LSOA, a function of total garden area divided by total number of garden polygons is the best available proxy estimate at this time.
Lower Super OutputAreas (LSOAs)
The Office for National Statistics and Ordnance Survey
Topographical areas of different sizes, defined as an area that includes a population of minimum 1000 people, mean 1500 people. Each area has an Index of Multiple Deprivation score, which indicates the socio-economic status of the people who live in that area. Higher scores indicate a higher level of multiple deprivation.
Borough boundaries Ordnance Survey Provide the administrative boundary of each of the 33 London boroughs
Sites of Importance for Nature Conservation (SINCs)
GLA The boundaries of these protected sites. These sites are protected because they represent a site of high nature conservation value and are therefore a good measure of where the best quality wildlife habitat is in London.
Areas of Deficiency (AoD)
GLA Areas that are not within walking distance of a publically accessible SINC and therefore indicate areas where people may be least likely to easily engage with local nature.
Heat index score GLA A 3 band score was given to each LSOA based on an underlying 1km grid of temperature measurements (>19°, 18°, less than 18°) recorded during the August 2003 heat wave. This broadly indicates areas of Greater London that are likely to experience these kinds of temperature increases in extreme weather events due to climate change.
Open space GLA Areas of accessible open space as defined by GLA rolling programme of habitat survey. Includes parks, public formal gardens, recreation grounds, allotments, nature reserves etc.
32

This model allows users to see areas where people live in
proximity to quality wildlife habitats (i.e. SINCs), where the
area and availability of garden land per dwelling is relatively
high and the overall area of garden is relatively large.
Gardens in these LSOAs may be supplementing or extending
other local wildlife habitats.
At a landscape level the character of these areas is most
likely to include large areas of wildlife habitat and garden
land, providing the community with good access to green
space and nature. Findings in Study 1: Garden Land Cover
of this project suggest that over half of the garden land in
these LSOAs may be vegetated (depending on the types
and sizes of component gardens) – so large areas of multiple
gardens could represent an important habitat for wildlife
locally in addition to local SINCs and other green space.
We don’t know the quality or connectivity of the garden
habitats involved without surveying directly on the ground.
However, we can tentatively infer the habitat potential in the
highlighted areas of this model based on garden polygon
size. Study 1: Garden Land Cover of this project found that
habitat availability tends to be greater in larger garden plots,
and smaller garden plots often have a more significant hard
surfaced component than larger garden plots. Therefore we
assumed that neighbourhoods with typically large garden
polygons in our model are likely to have larger garden plots
with a greater variety and area of land covers and potentially
better habitat availability than other areas.
The people who live in LSOAs highlighted by this model may
be particularly interested to know about how their garden
fits in with the local landscape of habitats and protected
wildlife sites. They already have access to nature and green
space and their gardens may hold a diversity of habitats.
Therefore engagement with the wider landscape represents
an ideal mechanism for motivation. Encouraging the owners
of gardens that connect with neighbouring gardens or other
green space to view their plot as part of a wider potential
wildlife habitat may encourage further wildlife habitat
provision or the employment of environmentally-friendly
management techniques by garden owners.
This map highlights the people for whom private gardens
may be their main source contact with wildlife or semi-natural
habitats. These gardens are candidates for protection and
enhancement on the grounds of their potential social and
health benefits as well as potential value for biodiversity.
By selecting areas with relatively little open space or access
to nature sites, but numerous garden polygons, the model
highlights neighbourhoods where the most significant source
of green space and access to nature is likely to be private
gardens. Gardens here, as elsewhere, may be important
for the mental well-being of local people as well as public
engagement with nature conservation and environmental
issues. But the importance of gardens’ health and welfare
role is heightened here by the lack of other sources of
contact with green space and wildlife locally. With poor
access to public (semi-) natural green spaces, private
gardens in these areas may also be providing people here
with a resource for outdoor physical exercise that is not
available locally. Where IMD is high, economic and health
problems are at a higher than average level and therefore
increase the value or potential of these gardens as a space
for exercise and relaxation.
Even if the value of these gardens for wildlife is lower than in
other areas (garden plots may be relatively small and more
isolated from other gardens or green space) their social
value is likely to be relatively high. An emphasis of the social
and health roles of gardens and the compatibility of these
functions with the encouragement of wildlife will be a good
engagement method for people or policy makers in these
areas and encourage protection and improvement of the
resource.
Map 1 – Communities with a rich garden and open space landscape. LSOAs where:
• Therearemanygardenpolygons
• Gardenpolygonstendtobelarge
• Thereisothernear-byqualityhabitat(SINC)
• Therearerelativelylargeblocksofcontinuousgardenland
Map 2 – Where the role of gardens for health and welfare may be most significant. LSOAs where:
• Therearemanygardenplots
• Thereisnotmuchotheropenspace
• AlargeproportionoftheLSOAhaspooraccesstonature
• IMDishigh
33
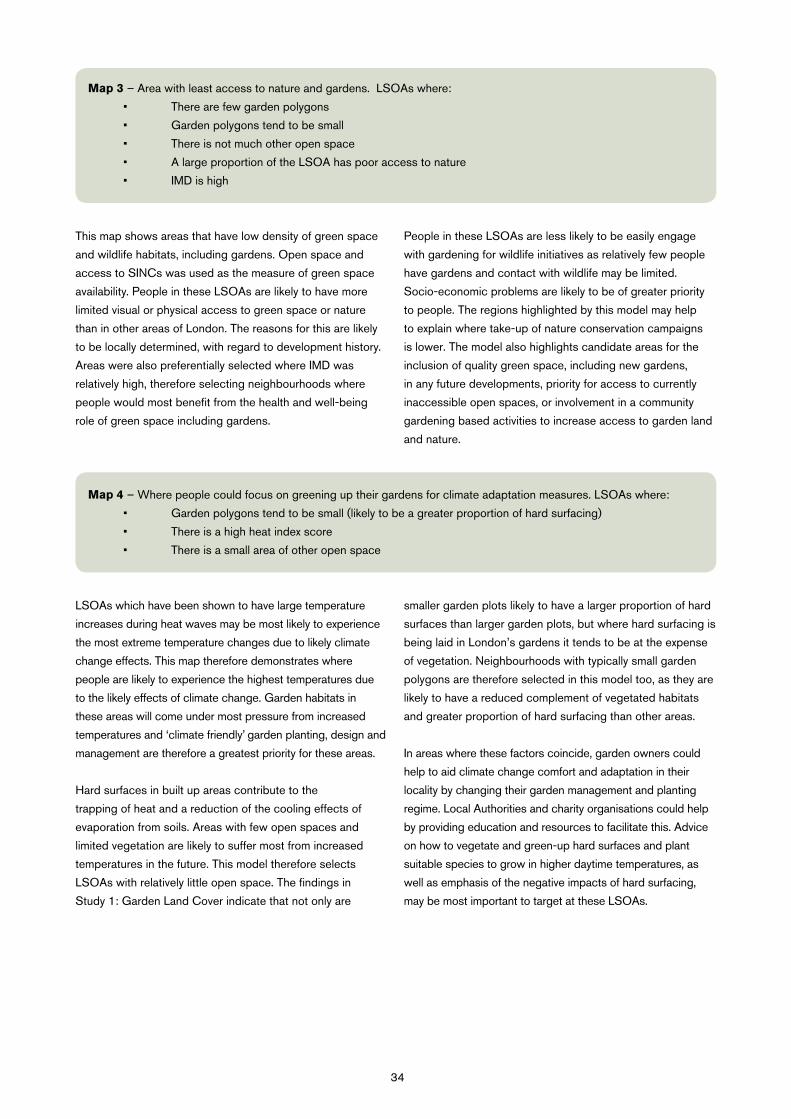
This map shows areas that have low density of green space
and wildlife habitats, including gardens. Open space and
access to SINCs was used as the measure of green space
availability. People in these LSOAs are likely to have more
limited visual or physical access to green space or nature
than in other areas of London. The reasons for this are likely
to be locally determined, with regard to development history.
Areas were also preferentially selected where IMD was
relatively high, therefore selecting neighbourhoods where
people would most benefit from the health and well-being
role of green space including gardens.
People in these LSOAs are less likely to be easily engage
with gardening for wildlife initiatives as relatively few people
have gardens and contact with wildlife may be limited.
Socio-economic problems are likely to be of greater priority
to people. The regions highlighted by this model may help
to explain where take-up of nature conservation campaigns
is lower. The model also highlights candidate areas for the
inclusion of quality green space, including new gardens,
in any future developments, priority for access to currently
inaccessible open spaces, or involvement in a community
gardening based activities to increase access to garden land
and nature.
LSOAs which have been shown to have large temperature
increases during heat waves may be most likely to experience
the most extreme temperature changes due to likely climate
change effects. This map therefore demonstrates where
people are likely to experience the highest temperatures due
to the likely effects of climate change. Garden habitats in
these areas will come under most pressure from increased
temperatures and ‘climate friendly’ garden planting, design and
management are therefore a greatest priority for these areas.
Hard surfaces in built up areas contribute to the
trapping of heat and a reduction of the cooling effects of
evaporation from soils. Areas with few open spaces and
limited vegetation are likely to suffer most from increased
temperatures in the future. This model therefore selects
LSOAs with relatively little open space. The findings in
Study 1: Garden Land Cover indicate that not only are
smaller garden plots likely to have a larger proportion of hard
surfaces than larger garden plots, but where hard surfacing is
being laid in London’s gardens it tends to be at the expense
of vegetation. Neighbourhoods with typically small garden
polygons are therefore selected in this model too, as they are
likely to have a reduced complement of vegetated habitats
and greater proportion of hard surfacing than other areas.
In areas where these factors coincide, garden owners could
help to aid climate change comfort and adaptation in their
locality by changing their garden management and planting
regime. Local Authorities and charity organisations could help
by providing education and resources to facilitate this. Advice
on how to vegetate and green-up hard surfaces and plant
suitable species to grow in higher daytime temperatures, as
well as emphasis of the negative impacts of hard surfacing,
may be most important to target at these LSOAs.
Map 3 – Area with least access to nature and gardens. LSOAs where:
• Therearefewgardenpolygons
• Gardenpolygonstendtobesmall
• Thereisnotmuchotheropenspace
• AlargeproportionoftheLSOAhaspooraccesstonature
• IMDishigh
Map 4 – Where people could focus on greening up their gardens for climate adaptation measures. LSOAs where:
• Gardenpolygonstendtobesmall(likelytobeagreaterproportionofhardsurfacing)
• Thereisahighheatindexscore
• Thereisasmallareaofotheropenspace
34
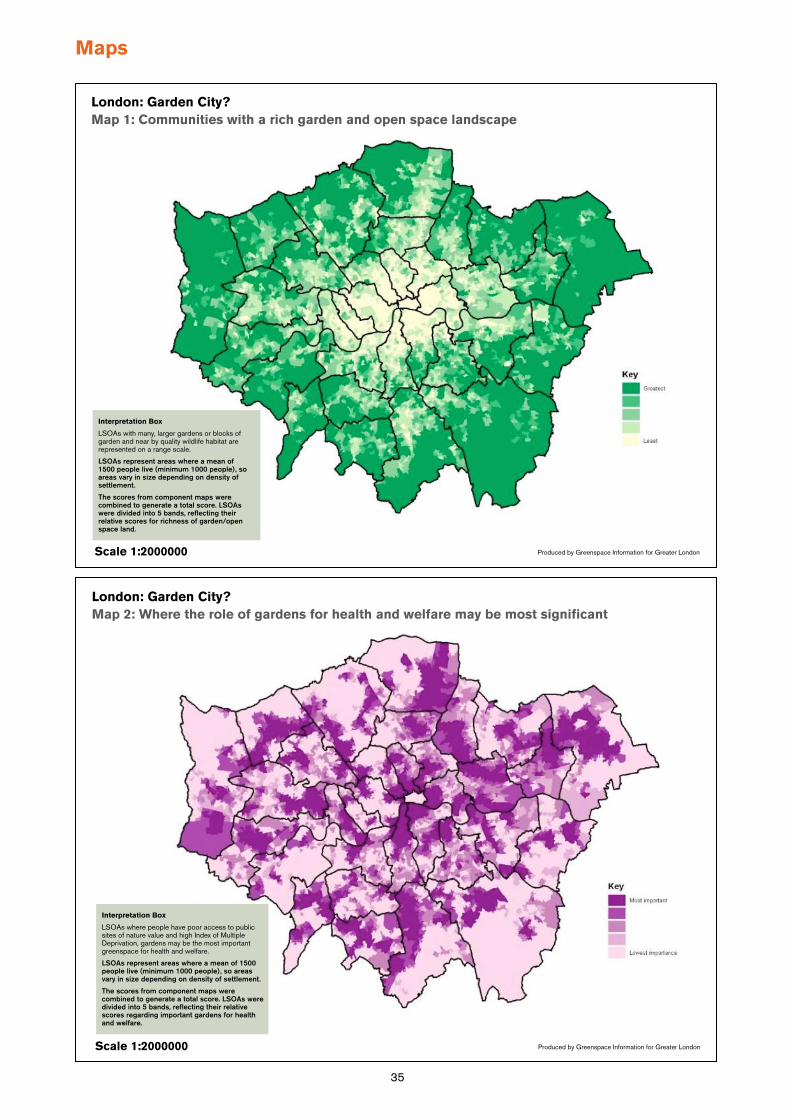
Maps
Interpretation Box
LSOAs with many, larger gardens or blocks of garden and near by quality wildlife habitat are represented on a range scale.
LSOAs represent areas where a mean of 1500 people live (minimum 1000 people), so areas vary in size depending on density of settlement.
The scores from component maps were combined to generate a total score. LSOAs were divided into 5 bands, reflecting their relative scores for richness of garden/open space land.
London: Garden City?Map 1: Communities with a rich garden and open space landscape
Scale 1:2000000 Produced by Greenspace Information for Greater London
London: Garden City?Map 2: Where the role of gardens for health and welfare may be most significant
Scale 1:2000000 Produced by Greenspace Information for Greater London
Interpretation Box
LSOAs where people have poor access to public sites of nature value and high Index of Multiple Deprivation, gardens may be the most important greenspace for health and welfare.
LSOAs represent areas where a mean of 1500 people live (minimum 1000 people), so areas vary in size depending on density of settlement.
The scores from component maps were combined to generate a total score. LSOAs were divided into 5 bands, reflecting their relative scores regarding important gardens for health and welfare.
35
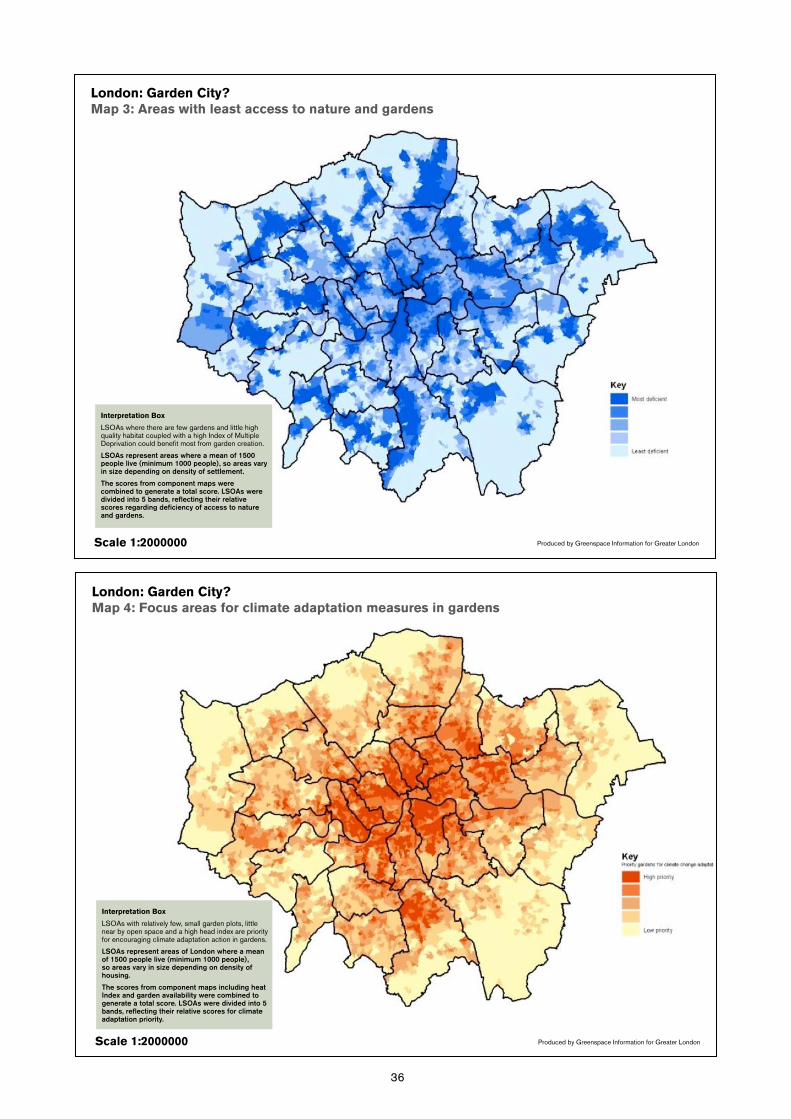
London: Garden City?Map 3: Areas with least access to nature and gardens
Scale 1:2000000 Produced by Greenspace Information for Greater London
Interpretation Box
LSOAs where there are few gardens and little high quality habitat coupled with a high Index of Multiple Deprivation could benefit most from garden creation.
LSOAs represent areas where a mean of 1500 people live (minimum 1000 people), so areas vary in size depending on density of settlement.
The scores from component maps were combined to generate a total score. LSOAs were divided into 5 bands, reflecting their relative scores regarding deficiency of access to nature and gardens.
London: Garden City?Map 4: Focus areas for climate adaptation measures in gardens
Scale 1:2000000 Produced by Greenspace Information for Greater London
Interpretation Box
LSOAs with relatively few, small garden plots, little near by open space and a high head index are priority for encouraging climate adaptation action in gardens.
LSOAs represent areas of London where a mean of 1500 people live (minimum 1000 people), so areas vary in size depending on density of housing.
The scores from component maps including heat Index and garden availability were combined to generate a total score. LSOAs were divided into 5 bands, reflecting their relative scores for climate adaptation priority.
36
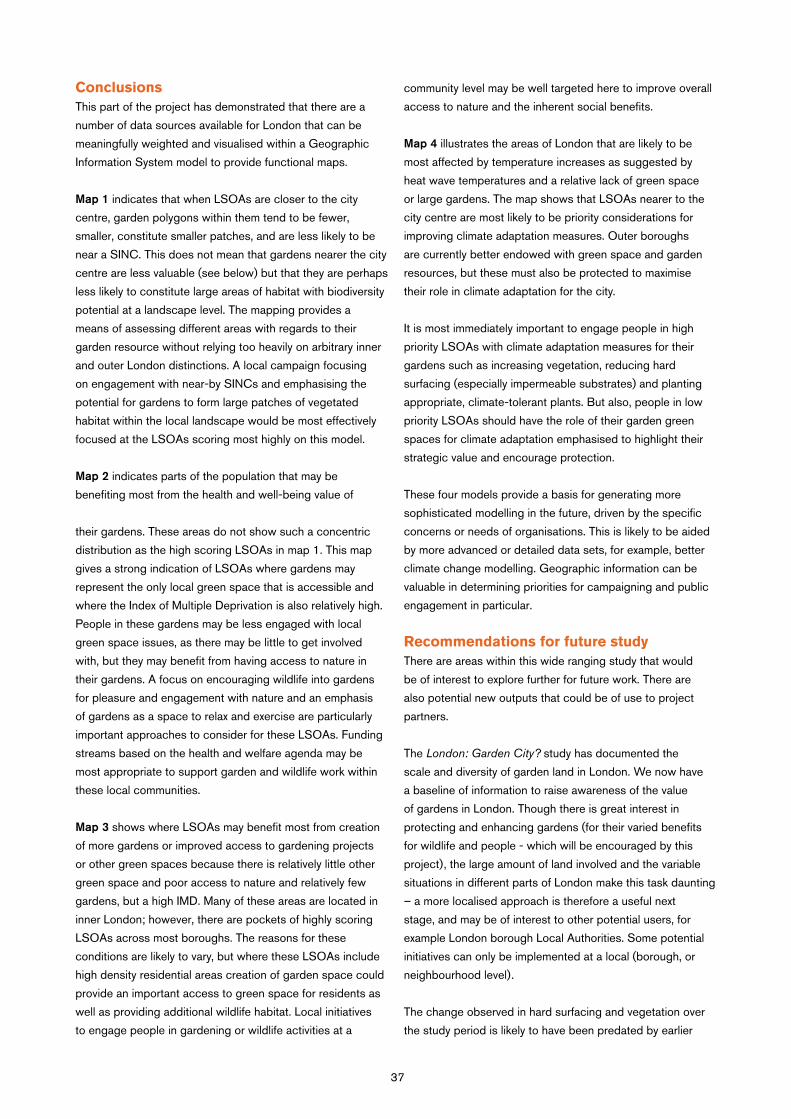
ConclusionsThis part of the project has demonstrated that there are a
number of data sources available for London that can be
meaningfully weighted and visualised within a Geographic
Information System model to provide functional maps.
Map 1 indicates that when LSOAs are closer to the city
centre, garden polygons within them tend to be fewer,
smaller, constitute smaller patches, and are less likely to be
near a SINC. This does not mean that gardens nearer the city
centre are less valuable (see below) but that they are perhaps
less likely to constitute large areas of habitat with biodiversity
potential at a landscape level. The mapping provides a
means of assessing different areas with regards to their
garden resource without relying too heavily on arbitrary inner
and outer London distinctions. A local campaign focusing
on engagement with near-by SINCs and emphasising the
potential for gardens to form large patches of vegetated
habitat within the local landscape would be most effectively
focused at the LSOAs scoring most highly on this model.
Map 2 indicates parts of the population that may be
benefiting most from the health and well-being value of
their gardens. These areas do not show such a concentric
distribution as the high scoring LSOAs in map 1. This map
gives a strong indication of LSOAs where gardens may
represent the only local green space that is accessible and
where the Index of Multiple Deprivation is also relatively high.
People in these gardens may be less engaged with local
green space issues, as there may be little to get involved
with, but they may benefit from having access to nature in
their gardens. A focus on encouraging wildlife into gardens
for pleasure and engagement with nature and an emphasis
of gardens as a space to relax and exercise are particularly
important approaches to consider for these LSOAs. Funding
streams based on the health and welfare agenda may be
most appropriate to support garden and wildlife work within
these local communities.
Map 3 shows where LSOAs may benefit most from creation
of more gardens or improved access to gardening projects
or other green spaces because there is relatively little other
green space and poor access to nature and relatively few
gardens, but a high IMD. Many of these areas are located in
inner London; however, there are pockets of highly scoring
LSOAs across most boroughs. The reasons for these
conditions are likely to vary, but where these LSOAs include
high density residential areas creation of garden space could
provide an important access to green space for residents as
well as providing additional wildlife habitat. Local initiatives
to engage people in gardening or wildlife activities at a
community level may be well targeted here to improve overall
access to nature and the inherent social benefits.
Map 4 illustrates the areas of London that are likely to be
most affected by temperature increases as suggested by
heat wave temperatures and a relative lack of green space
or large gardens. The map shows that LSOAs nearer to the
city centre are most likely to be priority considerations for
improving climate adaptation measures. Outer boroughs
are currently better endowed with green space and garden
resources, but these must also be protected to maximise
their role in climate adaptation for the city.
It is most immediately important to engage people in high
priority LSOAs with climate adaptation measures for their
gardens such as increasing vegetation, reducing hard
surfacing (especially impermeable substrates) and planting
appropriate, climate-tolerant plants. But also, people in low
priority LSOAs should have the role of their garden green
spaces for climate adaptation emphasised to highlight their
strategic value and encourage protection.
These four models provide a basis for generating more
sophisticated modelling in the future, driven by the specific
concerns or needs of organisations. This is likely to be aided
by more advanced or detailed data sets, for example, better
climate change modelling. Geographic information can be
valuable in determining priorities for campaigning and public
engagement in particular.
Recommendations for future studyThere are areas within this wide ranging study that would
be of interest to explore further for future work. There are
also potential new outputs that could be of use to project
partners.
The London: Garden City? study has documented the
scale and diversity of garden land in London. We now have
a baseline of information to raise awareness of the value
of gardens in London. Though there is great interest in
protecting and enhancing gardens (for their varied benefits
for wildlife and people - which will be encouraged by this
project), the large amount of land involved and the variable
situations in different parts of London make this task daunting
– a more localised approach is therefore a useful next
stage, and may be of interest to other potential users, for
example London borough Local Authorities. Some potential
initiatives can only be implemented at a local (borough, or
neighbourhood level).
The change observed in hard surfacing and vegetation over
the study period is likely to have been predated by earlier
37

changes, suitable photographs were unavailable to assess,
but different methods could be employed to study change
pre 1998 and its drivers. Social influences and drivers were
not considered and a correlation of people’s attitudes to
garden change would also provide insights in future work.
In particular, understanding the reasons why people are
choosing paving over vegetated land cover will be of help
to encourage best practice for wildlife and climate change
considerations.
The project (study 3) has demonstrated how it is possible to
integrate topological information about gardens with social
and environmental data sets to geographically highlight parts
of the population where certain conditions are present. This
information provides evidence of local conditions compared
with other areas of London. Further refining GIS models, in
accordance with user needs, is therefore a possible area of
future work.
This would, for example, include:
• updatingexistingdatalayersgeneratedforthisproject;
• improvingaccuracyofthegardenlayerwithnewdatasets
and/or information derived from the garden research
project (e.g. the number of front vs. back garden plots);
•exploringdifferentdivisionsofvariation;anddifferent
scoring of model variables depending on the user.
One aim of future work could be to help London boroughs to
revise their local Habitat Action Plans, which would require
a more detailed investigation of variation of the garden
resource within boroughs.
The project (study 2) was able to assess the changes to
garden land as a consequence of new built development.
However, the more detailed investigation of permitted
development of buildings on garden land has not been fully
possible (study 1 and 2). The findings from across London
have identified that outbuildings in gardens have increased
in area over time (study 1), and actually that this trend has
caused a greater loss of green space than that of new known
housing developments granted planning permission on garden
land. The use of these garden buildings is not known, though
they are likely to be for storage and leisure. A study focusing
on this issue would be of interest to bridge this gap and
understand more fully the nature of the buildings that have led
to a substantial loss of green space from London’s gardens.
38

Appendix 1.1
Master Map information
Appendix 1
Appendix 1.2Ground Truth survey study
Ground truth surveys were carried out to: a) identify suitable
categories for data collection; b) develop identification
guidelines and therefore improve accuracy of land cover
estimates at the data collection phase; and, c) identify
limitations in aerial interpretation.
MethodsGround surveys
A convenience sample of gardens (n=21) within Greater
London was generated for ground truth survey from London
Wildlife Trust volunteers. Volunteer gardens were visited
by the project officer and a volunteer during January 2008.
Gardens were digitally photographed from different angles,
and where possible, from a height. The relative proportions of
different land cover surfaces were noted and sketched onto a
base map of the MasterMap® boundary for each garden. Maps
were annotated to identity features and surfaces present.
The sample selected for ground truth survey is likely to be
biased towards people who are interested in wildlife and
gardening issues. However, this is not considered to constrain
the usefulness of the ground truth surveys, as a variety of
common garden surfaces and planting was present in these
gardens.
Not all habitats present within a garden are visible on aerial
photographs due in part to the angle of the image. Scale,
resolution, shadows that obscure detail and overhanging
features may obscure the detail of some features in gardens.
Most features are visible from the ground, therefore ground
truth survey data allows the correct identity of habitats that
are visible on aerial photographs to be established, but not
the direct comparison of area coverage.
The aerial photographs used in this study represent spring
to summer vegetation growth within gardens; however, it
was necessary to undertake ground truth surveys during
the winter when fewer plants are in leaf. This represents a
minor limitation to comparisons of aerial photographs and
ground truth habitats. Surveyors therefore used botanical and
horticultural knowledge and information from garden owners
to supplement observations where possible.
Topography Layer is a detailed, intelligent, geographic database. It contains almost half a billion features from the built
and natural landscape of Britain.
Detailed and surveyed to a high degree of accuracy, the Topography Layer is continually revised to incorporate
changes to the urban and rural environment. It consists of nine themes: land area classifications; buildings; roads,
tracks and paths; rail; water; terrain and height; heritage and antiquities; structures; and administrative boundaries.
The Topography Layer forms the foundation of OS MasterMap, and can be used in isolation or together with the
Address Layer, Integrated Transport NetworkTM (ITN) Layer and Imagery Layer, to provide a consistent, analytical or
reference framework.
Every feature within the Topography Layer has a unique common reference (a TOID®), which enables full integration
with the other layers of OS MasterMap and also the association of your own or third party data. Information can then
be shared with assurance across different business applications and organisations that have a need for large-scale
data.
http://www.ordnancesurvey.co.uk/oswebsite/support/index.html
39
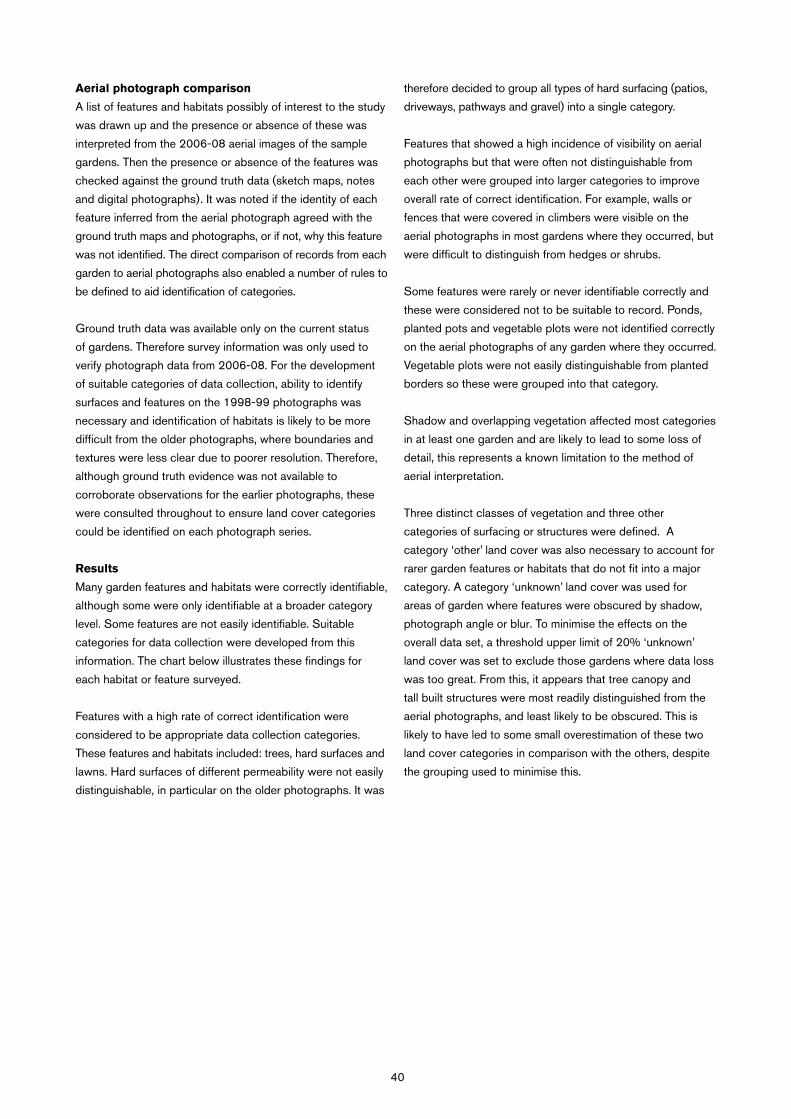
Aerial photograph comparison
A list of features and habitats possibly of interest to the study
was drawn up and the presence or absence of these was
interpreted from the 2006-08 aerial images of the sample
gardens. Then the presence or absence of the features was
checked against the ground truth data (sketch maps, notes
and digital photographs). It was noted if the identity of each
feature inferred from the aerial photograph agreed with the
ground truth maps and photographs, or if not, why this feature
was not identified. The direct comparison of records from each
garden to aerial photographs also enabled a number of rules to
be defined to aid identification of categories.
Ground truth data was available only on the current status
of gardens. Therefore survey information was only used to
verify photograph data from 2006-08. For the development
of suitable categories of data collection, ability to identify
surfaces and features on the 1998-99 photographs was
necessary and identification of habitats is likely to be more
difficult from the older photographs, where boundaries and
textures were less clear due to poorer resolution. Therefore,
although ground truth evidence was not available to
corroborate observations for the earlier photographs, these
were consulted throughout to ensure land cover categories
could be identified on each photograph series.
Results
Many garden features and habitats were correctly identifiable,
although some were only identifiable at a broader category
level. Some features are not easily identifiable. Suitable
categories for data collection were developed from this
information. The chart below illustrates these findings for
each habitat or feature surveyed.
Features with a high rate of correct identification were
considered to be appropriate data collection categories.
These features and habitats included: trees, hard surfaces and
lawns. Hard surfaces of different permeability were not easily
distinguishable, in particular on the older photographs. It was
therefore decided to group all types of hard surfacing (patios,
driveways, pathways and gravel) into a single category.
Features that showed a high incidence of visibility on aerial
photographs but that were often not distinguishable from
each other were grouped into larger categories to improve
overall rate of correct identification. For example, walls or
fences that were covered in climbers were visible on the
aerial photographs in most gardens where they occurred, but
were difficult to distinguish from hedges or shrubs.
Some features were rarely or never identifiable correctly and
these were considered not to be suitable to record. Ponds,
planted pots and vegetable plots were not identified correctly
on the aerial photographs of any garden where they occurred.
Vegetable plots were not easily distinguishable from planted
borders so these were grouped into that category.
Shadow and overlapping vegetation affected most categories
in at least one garden and are likely to lead to some loss of
detail, this represents a known limitation to the method of
aerial interpretation.
Three distinct classes of vegetation and three other
categories of surfacing or structures were defined. A
category ‘other’ land cover was also necessary to account for
rarer garden features or habitats that do not fit into a major
category. A category ‘unknown’ land cover was used for
areas of garden where features were obscured by shadow,
photograph angle or blur. To minimise the effects on the
overall data set, a threshold upper limit of 20% ‘unknown’
land cover was set to exclude those gardens where data loss
was too great. From this, it appears that tree canopy and
tall built structures were most readily distinguished from the
aerial photographs, and least likely to be obscured. This is
likely to have led to some small overestimation of these two
land cover categories in comparison with the others, despite
the grouping used to minimise this.
40
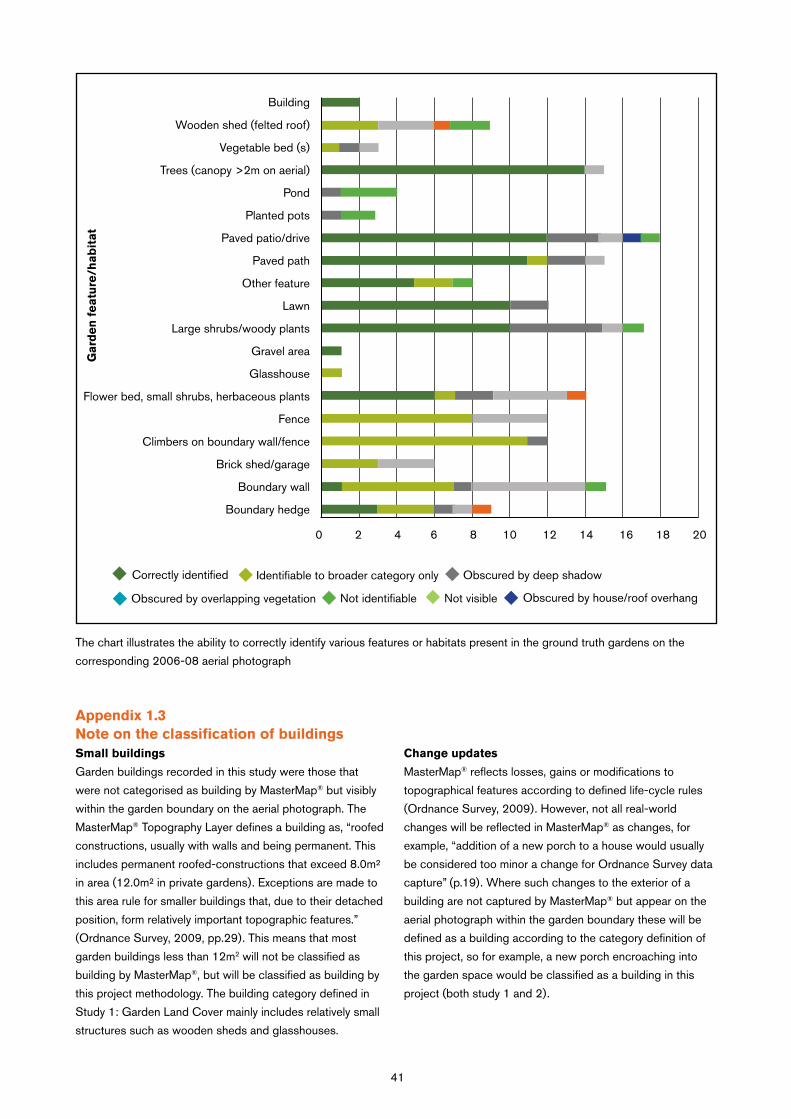
The chart illustrates the ability to correctly identify various features or habitats present in the ground truth gardens on the
corresponding 2006-08 aerial photograph
Appendix 1.3Note on the classification of buildingsSmall buildings
Garden buildings recorded in this study were those that
were not categorised as building by MasterMap® but visibly
within the garden boundary on the aerial photograph. The
MasterMap® Topography Layer defines a building as, “roofed
constructions, usually with walls and being permanent. This
includes permanent roofed-constructions that exceed 8.0m²
in area (12.0m² in private gardens). Exceptions are made to
this area rule for smaller buildings that, due to their detached
position, form relatively important topographic features.”
(Ordnance Survey, 2009, pp.29). This means that most
garden buildings less than 12m2 will not be classified as
building by MasterMap®, but will be classified as building by
this project methodology. The building category defined in
Study 1: Garden Land Cover mainly includes relatively small
structures such as wooden sheds and glasshouses.
Change updates
MasterMap® reflects losses, gains or modifications to
topographical features according to defined life-cycle rules
(Ordnance Survey, 2009). However, not all real-world
changes will be reflected in MasterMap® as changes, for
example, “addition of a new porch to a house would usually
be considered too minor a change for Ordnance Survey data
capture” (p.19). Where such changes to the exterior of a
building are not captured by MasterMap® but appear on the
aerial photograph within the garden boundary these will be
defined as a building according to the category definition of
this project, so for example, a new porch encroaching into
the garden space would be classified as a building in this
project (both study 1 and 2).
Building
Wooden shed (felted roof)
Vegetable bed (s)
Trees (canopy >2m on aerial)
Pond
Planted pots
Paved patio/drive
Paved path
Other feature
Lawn
Large shrubs/woody plants
Gravel area
Glasshouse
Flower bed, small shrubs, herbaceous plants
Fence
Climbers on boundary wall/fence
Brick shed/garage
Boundary wall
Boundary hedge
0 2 4 6 8 10 12 14 16 18 20
u u
u Obscured by overlapping vegetation
u
u u
Correctly identified
u Not visibleNot identifiable
Obscured by deep shadowIdentifiable to broader category only
Obscured by house/roof overhang
Gard
en
featu
re/h
ab
itat
41
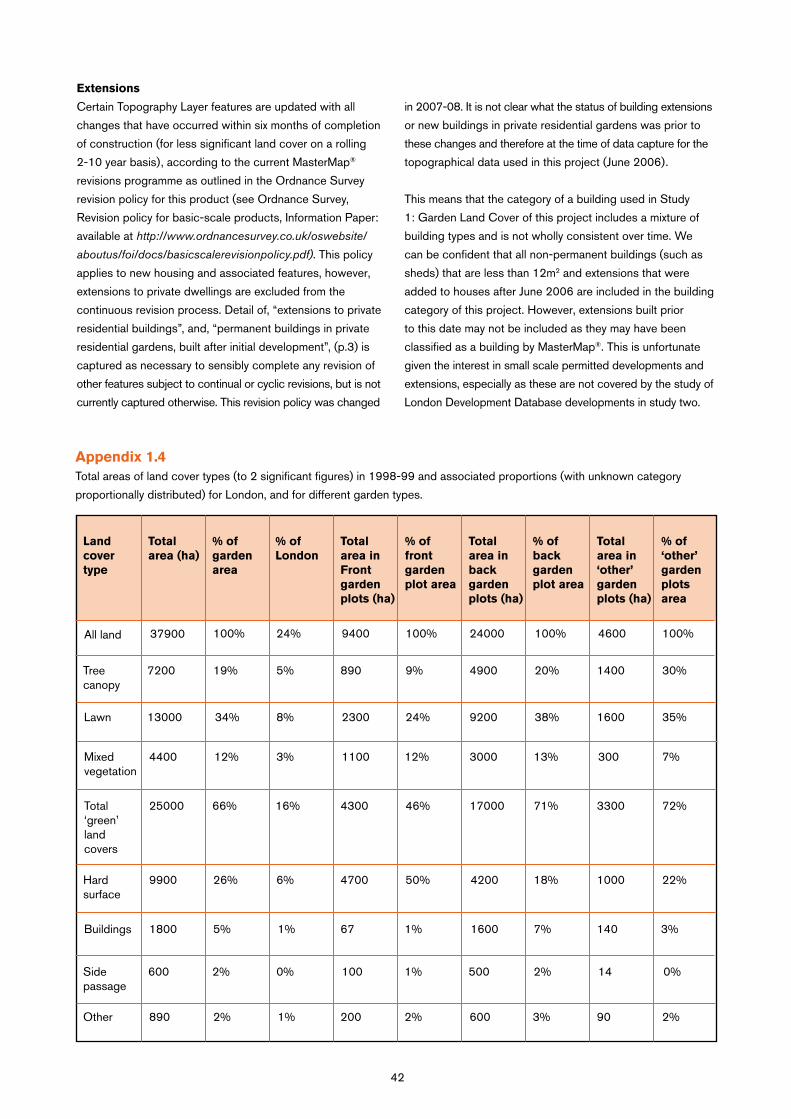
Extensions
Certain Topography Layer features are updated with all
changes that have occurred within six months of completion
of construction (for less significant land cover on a rolling
2-10 year basis), according to the current MasterMap®
revisions programme as outlined in the Ordnance Survey
revision policy for this product (see Ordnance Survey,
Revision policy for basic-scale products, Information Paper:
available at http://www.ordnancesurvey.co.uk/oswebsite/
aboutus/foi/docs/basicscalerevisionpolicy.pdf). This policy
applies to new housing and associated features, however,
extensions to private dwellings are excluded from the
continuous revision process. Detail of, “extensions to private
residential buildings”, and, “permanent buildings in private
residential gardens, built after initial development”, (p.3) is
captured as necessary to sensibly complete any revision of
other features subject to continual or cyclic revisions, but is not
currently captured otherwise. This revision policy was changed
in 2007-08. It is not clear what the status of building extensions
or new buildings in private residential gardens was prior to
these changes and therefore at the time of data capture for the
topographical data used in this project (June 2006).
This means that the category of a building used in Study
1: Garden Land Cover of this project includes a mixture of
building types and is not wholly consistent over time. We
can be confident that all non-permanent buildings (such as
sheds) that are less than 12m2 and extensions that were
added to houses after June 2006 are included in the building
category of this project. However, extensions built prior
to this date may not be included as they may have been
classified as a building by MasterMap®. This is unfortunate
given the interest in small scale permitted developments and
extensions, especially as these are not covered by the study of
London Development Database developments in study two.
Appendix 1.4
Total areas of land cover types (to 2 significant figures) in 1998-99 and associated proportions (with unknown category
proportionally distributed) for London, and for different garden types.
Land cover type
Total area (ha)
% of garden area
% of London
Total area in Front garden plots (ha)
% of front garden plot area
Total area in back garden plots (ha)
% of back garden plot area
Total area in ‘other’ garden plots (ha)
% of ‘other’ garden plots area
All land
Tree canopy
Lawn
Mixed vegetation
Total ‘green’ land covers
37900 100% 24% 9400 100% 24000 100% 4600 100%
7200 19% 5% 890 9% 4900 20% 1400 30%
13000 34% 8% 2300 24% 9200 38% 1600 35%
4400 12% 3% 1100 12% 3000 13% 300 7%
25000 66% 16% 4300 46% 17000 71% 3300 72%
Hard surface
9900 26% 6% 4700 50% 4200 18% 1000 22%
Buildings 1800 5% 1% 67 1% 1600 7% 140 3%
Side passage
600 2% 0% 100 1% 500 2% 14 0%
Other 890 2% 1% 200 2% 600 3% 90 2%
42
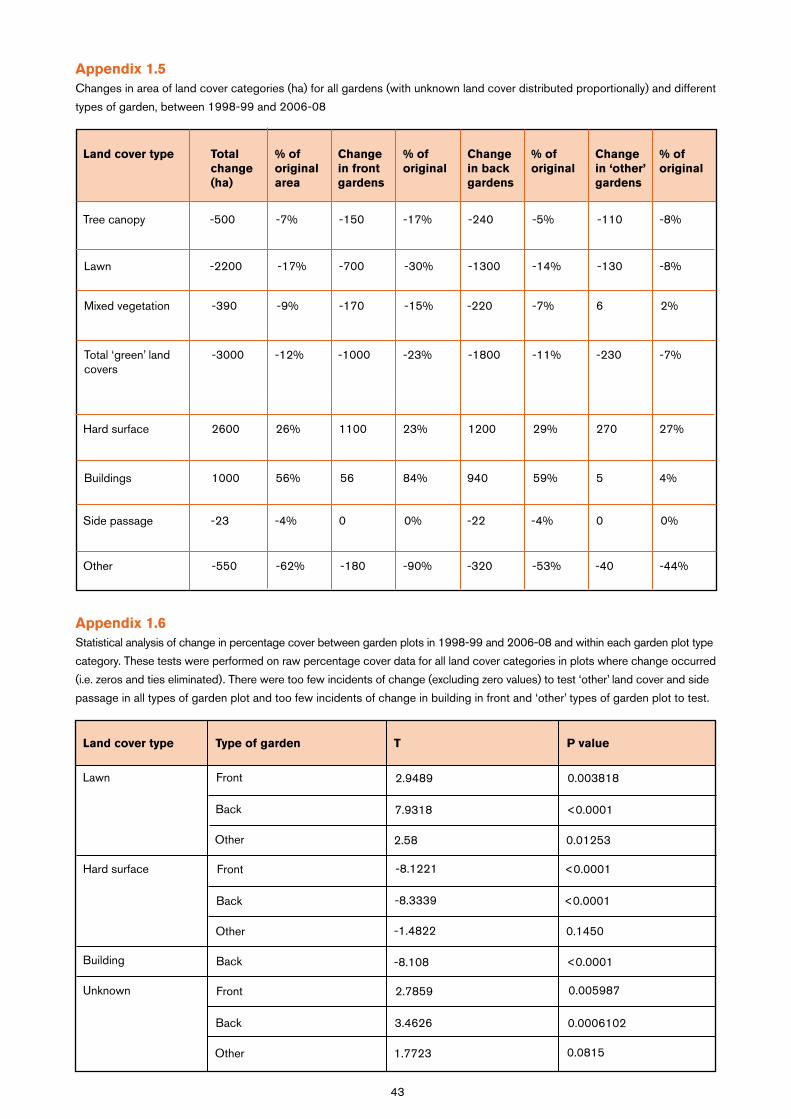
Appendix 1.5Changes in area of land cover categories (ha) for all gardens (with unknown land cover distributed proportionally) and different
types of garden, between 1998-99 and 2006-08
Land cover type Total change (ha)
% of original area
Change in front gardens
% of original
Change in back gardens
% of original
Change in ‘other’ gardens
% of original
Tree canopy
Lawn
Mixed vegetation
Total ‘green’ land covers
-500 -7% -150 -17% -240 -5% -110 -8%
-2200 -17% -700 -30% -1300 -14% -130 -8%
-390 -9% -170 -15% -220 -7% 6 2%
-3000 -12% -1000 -23% -1800 -11% -230 -7%
Hard surface 2600 26% 1100 23% 1200 29% 270 27%
Buildings 1000 56% 56 84% 940 59% 5 4%
Side passage -23 -4% 0 0% -22 -4% 0 0%
Other -550 -62% -180 -90% -320 -53% -40 -44%
Appendix 1.6Statistical analysis of change in percentage cover between garden plots in 1998-99 and 2006-08 and within each garden plot type
category. These tests were performed on raw percentage cover data for all land cover categories in plots where change occurred
(i.e. zeros and ties eliminated). There were too few incidents of change (excluding zero values) to test ‘other’ land cover and side
passage in all types of garden plot and too few incidents of change in building in front and ‘other’ types of garden plot to test.
Land cover type Type of garden T P value
Lawn Front
Back
Other
Front
Back
Other
Front
Back
Other
2.9489
7.9318
2.58
0.003818
<0.0001
0.01253
Hard surface -8.1221
-8.3339
-1.4822
<0.0001
<0.0001
0.1450
Building Back
2.7859
3.4626
1.7723
-8.108 <0.0001
0.005987
0.0006102
0.0815
Unknown
43

Appendix 1.8Total areas of land cover types in 2006-2008, with unknown areas not distributed.
Appendix 1.7Numbers of garden trees in London scaled up from average tree density observed in garden plots, and change in this number
over the study period.
All gardens 2.5
0.4
1.9
0.3
0.2
1.1
1.0
-0.03
-0.02Front gardens
0.02
-0.03
Any garden 0.2 -0.01
-0.01
0.01
-0.11
Front garden
Back gardens
Other gardens
Current (2006-08 estimate)
Total number of garden trees (millions, 2sf)
Change (since 1998-99)
Average number of garden trees per garden (2sf)
Back garden
Other garden
Land cover type
Total area (ha)
% of garden area
% of London
Total area in Front garden plots (ha)
% of front garden plot area
Total area in back garden plots (ha)
% of back garden plot area
Total area in ‘other’ garden plots (ha)
% of ‘other’ garden plots area
All land
Tree canopy
Lawn
Mixed vegetation
Total ‘green’ land covers
37900 100% 24% 9400 100% 24000 100% 4600 100%
6000 16% 4% 680 7% 4200 18% 1200 26%
9900 26% 6% 1500 16% 7000 29% 1300 28%
3600 9% 2% 850 9% 2500 10% 250 5%
20000 53% 13% 3000 32% 14000 58% 2800 61%
Hard surface
11000 29% 7% 5300 56% 4800 20% 1200 26%
Buildings 2500 7% 2% 110 1% 2300 10% 130 3%
Side passage
530 1% 0% 90 1% 430 2% 10 0%
Other 310 1% 0% 10 0% 250 1% 40 1%
44
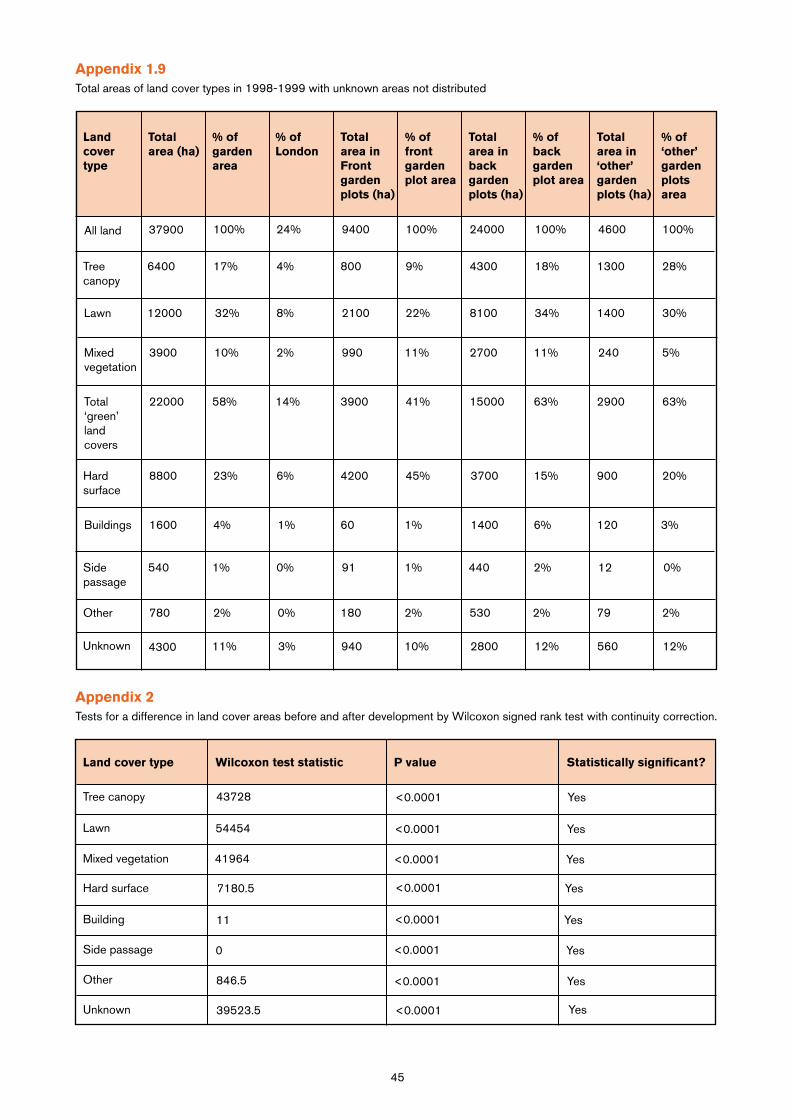
Appendix 1.9Total areas of land cover types in 1998-1999 with unknown areas not distributed
Appendix 2Tests for a difference in land cover areas before and after development by Wilcoxon signed rank test with continuity correction.
Land cover type
Total area (ha)
% of garden area
% of London
Total area in Front garden plots (ha)
% of front garden plot area
Total area in back garden plots (ha)
% of back garden plot area
Total area in ‘other’ garden plots (ha)
% of ‘other’ garden plots area
All land
Tree canopy
Lawn
Mixed vegetation
Total ‘green’ land covers
37900 100% 24% 9400 100% 24000 100% 4600 100%
6400 17% 4% 800 9% 4300 18% 1300 28%
12000 32% 8% 2100 22% 8100 34% 1400 30%
3900 10% 2% 990 11% 2700 11% 240 5%
22000 58% 14% 3900 41% 15000 63% 2900 63%
Hard surface
8800 23% 6% 4200 45% 3700 15% 900 20%
Buildings 1600 4% 1% 60 1% 1400 6% 120 3%
Side passage
540 1% 0% 91 1% 440 2% 12 0%
Other 780 2% 0% 180 2% 530 2% 79 2%
Unknown 4300 11% 3% 940 10% 2800 12% 560 12%
Land cover type Wilcoxon test statistic P value Statistically significant?
Tree canopy 43728
54454
41964
7180.5
11
0
39523.5
<0.0001
<0.0001
<0.0001
Yes
Yes
Yes
Hard surface <0.0001
<0.0001
<0.0001
Yes
Yes
Yes
Building
846.5
<0.0001
<0.0001 Yes
YesUnknown
Lawn
Mixed vegetation
Side passage
Other
45

Tests for a difference in land cover areas before and after development by Wilcoxon signed rank test with continuity correction.
Land cover type Wilcoxon test statistic P value Statistically significant?
Tree canopy 43728
54454
41964
7180.5
11
0
39523.5
<0.0001
<0.0001
<0.0001
Yes
Yes
Yes
Hard surface <0.0001
<0.0001
<0.0001
Yes
Yes
Yes
Building
846.5
<0.0001
<0.0001 Yes
YesUnknown
Lawn
Mixed vegetation
Side passage
Other
46
Appendix 2
Contingency table – A table used to compare counts of individual items (categorical data). Using probability, we can
calculate the number expected in each grid square of the contingency table if all items were evenly distributed between the
categories. A chi-squared statistic and associated p value can then inform us if the difference between observed and expected
values is significantly greater than is explained by chance alone.
Geographical Information System - This is a data base of spatial information which allows the user to visualise
relationships between data sets on a map. ‘Layers’ of data can be interrogated to answer a variety of questions.
Green space – Any vegetated land or water within or adjoining an urban area. Including: green corridors like paths, disused
railway lines, rivers and canals woods, grassed areas, parks, gardens, playing fields, children’s play areas, cemeteries
and allotments, countryside immediately adjoining a town which people can access from their homes derelict, vacant and
contaminated land which has the potential to be transformed (Greenspace Scotland)
Green infrastructure – The multifunctional, interdependent network of green spaces, waterways, wetlands and vegetated
features (e.g. green roofs) lying within the urban environment and the urban fringe, connecting to the surrounding countryside.
It provides multiple benefits for wildlife and ecosystem services for people including: flood management; urban cooling;
ecological connectivity; improving physical and mental health; green transport links (walking and cycling routes); and food
growing.
Index of Multiple Deprivation (IMD) – A ward-level index made up from six ward level ‘domain’ indices; income;
employment; health deprivation and disability; education, skills and training; housing; and geographical access to services.
Lower Super Output Area (LSOA) – Standard mapping areas used by the Office of National Statistics, LSOAs each have
1500 to 2000 residents. Four to eight LSOAs make up a council ward.
Mean – the arithmetic mean is a measure of central tendency, i.e. the intermediate value that measurements often cluster
around. It is the sum of all data values, divided by the number of data values.
Median – the median is a measure of central tendency, i.e. the intermediate value that measurements often cluster around. It
is the middle value and is found by putting all data values in order of size and selecting the middle value.
Normal distribution – when data values cluster more-or-less symmetrically around a central value in a bell-shaped
distribution.
Polygon – a topographical feature in a Geographical Information System with an enclosed boundary, for example, a garden
polygon.
Private gardens – domestic, privately owned garden plots associated with residential dwellings. Does not include public
gardens, nor those of social landlords.
Significance (statistical) – if a result is statistically significant it is unlikely to have occurred by chance alone. The usual cut
off is if an event of this magnitude would occur in less than 5% of samples of the kind being considered.
Transformed data – data values are transformed by applying a specific function to all data points, for example square root,
logarithms or inverse. The reason for transforming data is to alter the shape of the distribution so that it better meets the
assumptions of statistical tests and reduces any correlation between the mean and variance of the samples to be compared.
A common transformation is to make data more symmetrically distributed, to better approximate the Normal distribution
assumed by many statistical tests.
Glossary of terms
47

Anon., 2006. Wildlife gardening for everyone: your questions answered by the RHS and The Wildlife Trusts. Think Books, in
association with Royal Horticultural Society and The Wildlife Trusts, London.
CANNON, A., 1999. The significance of private gardens for bird conservation, Bird Conservation International, 9, pp.287-297.
CANNON, A.R., CHAMBERLAIN, D.E., TOMS, M.P., HATCHWELL, B.J. & GASTON, K.J., 2005. Trends in the use of private
gardens by wild birds in Great Britain 1995-2002, Journal of Animal Ecology, 42, pp.659-671.
COCHRAN, W.G., 1963. Sampling techniques, 2nd ed., John Wiley & Sons, Inc.
CRAWLEY, M.J., 2005. Statistics; an introduction using R, John Wiley & Sons, Inc.
COMMUNITIES AND LOCAL GOVERNMENT, 2008. Guidance on the permeable surfacing of front gardens, Communities
and Local Government Publications.
COMMUNITIES AND LOCAL GOVERNMENT, 2010a. Garden developments understanding the issues, Communities and
Local Government Publications.
COMMUNITIES AND LOCAL GOVERNMENT, 2010b. Planning Policy Statement 3: Housing (PPS3), Communities and
Local Government Publications.
DAVIES, Z.G., FULLER, R.A., LORAM, A., IRVINE, K.N., SIMS, V. and GASTON, K.J., 2009. A national scale inventory of
resource provision for biodiversity within domestic gardens, Biological Conservation, 142, pp.761-771.
DAWSON, D. & GITTINGS, T., 1990. The effect of suburban residential density on birds, London Ecology Unit.
DAWSON, D.G., 2005. How many trees are there in Greater London? Biodiversity Advice Note, Greater London Authority,
London.
EALING’S LOCAL AGENDA 21 POLLUTION & PUBLIC HEALTH PROJECT GROUP, 2005. The extent of hard surfacing of
front gardens in the London borough of Ealing, http://www.ealingfrontgardens.org.uk/page2.htm
GASTON, K.J., SMITH, R.M., THOMPSON, K. and WARREN, P.H., 2004. Gardens and wildlife: the BUGS project, British
Wildlife, 16, pp.1-9.
GASTON, K.J., SMITH, R.M., THOMPSON, K. and WARREN, P.H., 2005a. Urban domestic gardens (II): experimental tests of
methods for increasing biodiversity, Biodiversity and Conservation, 14, pp.395-413.
GASTON, K.J., WARREN, P. H., THOMPSON, K. and SMITH, R. M., 2005b. Urban domestic gardens (IV): the extent of the
resource and its associated features, Biodiversity and Conservation, 14, pp.3327-3349.
GILBERT, O.L., 1989. The ecology of urban habitats, Chapman & Hall, London.
GREATER LONDON ASSEMBLY ENVIRONMENT COMMITTEE, 2005. Crazy paving, the environmental importance of
London’s front gardens, Greater London Authority, London.
GREATER LONDON AUTHORITY, 2008. The London Climate Change Adaptation Strategy: Draft report, Greater London
Authority, London.
GRAFEN, A. and HAILS, R., 2002. Modern statistics for the life sciences, Oxford University Press.
References
48

HARRIS, S., 2002. Mammals in your garden? BBC Wildlife, 20, pp.40-43.
LORAM, A., TRATALOS, J., WARREN, P.H. and GASTON, K., 2007. Urban domestic gardens (X): the extent & structure of the
resource in five major cities, Landscape Ecology, 22, pp.601-615.
MILLER, J.R. and HOBBS, R.J.,. 2002. Conservation where people live and work, Conservation Biology, 16, pp.330-337.
NIEMELÄ, J., 1999. Ecology and urban planning, Biodiversity and Conservation, 8, pp.199-131.
ORDNANCE SURVEY, 2009. OS MasterMap® Topography layer user guide and specification, Ordnance Survey,
Southampton. (available from http://www.ordnancesurvey.co.uk/oswebsite/products/osmastermap/userguides/docs/
OSMMTopoLayerUserGuide.pdf)
OWEN, J., 1991. The ecology of a garden: the first fifteen years, Cambridge University Press, Cambridge.
SMITH, R.M., WARREN, P.H., THOMPSON, K., and GASTON, K., 2006. Urban domestic gardens (VI): environmental
correlates of invertebrate species richness, Biodiversity and Conservation, 15, pp.2415-2438.
SMITH, R.M., GASTON, K., WARREN, P.H., and THOMPSON, K., 2005. Urban domestic gardens (V): relationships between
landcover composition housing and landscape, Landscape Ecology, 20, pp.235-253.
TAHA, H., CHANG, S. and AKBARI, H., 2000. Meteorological and air quality impacts of heat island mitigation measures in
three U.S. cities, LBNL-44222. Heat Island Group, Environmental Energy Technologies Division, Lawrence Berkeley National
Laboratory, Berkeley, CA, USA.
49

London Wildlife Trust campaigns to encourage Londoners to create wildlife and climate friendly gardens. Every gardener, whether in a private garden or in a communal garden space can make a difference by taking simple actions like digging up hard surfacing and planting a good range of vegetation.
Greenspace Information for Greater London is the capital’s environmental records centre. It collates, manages and makes available detailed information on London’s wildlife, parks, nature reserves, gardens and other open spaces.
The Greater London Authority is a strategic authority with Londonwide role to design and deliver a better future for London.
Royal Society of Wildlife Trusts There are 47 local Wildlife Trusts across the whole of the UK, the Isle of Man & Alderney, working for an environment rich in wildlife for everyone. With 791,000 members, The Wildlife Trusts are the largest UK voluntary organisation, dedicated to conserving the full range of the UK’s habitats and species.
50