
From Fourier Series to Analysis of Non-stationary Signals - VIII
15
Non-stationary and Stationary Signals MATLAB project From Fourier Series to Analysis of Non-stationary Signals - VIII prof. Miroslav Vlcek December 3, 2013 prof. Miroslav Vlcek Lecture 8
Transcript of From Fourier Series to Analysis of Non-stationary Signals - VIII
Non-stationary and Stationary SignalsMATLAB project
From Fourier Series to Analysis ofNon-stationary Signals - VIII
prof. Miroslav Vlcek
December 3, 2013
prof. Miroslav Vlcek Lecture 8

Non-stationary and Stationary SignalsMATLAB project
Contents
1 Non-stationary and Stationary Signals
2 MATLAB project
prof. Miroslav Vlcek Lecture 8
Non-stationary and Stationary SignalsMATLAB project
Contents
1 Non-stationary and Stationary Signals
2 MATLAB project
prof. Miroslav Vlcek Lecture 8
Non-stationary and Stationary SignalsMATLAB project
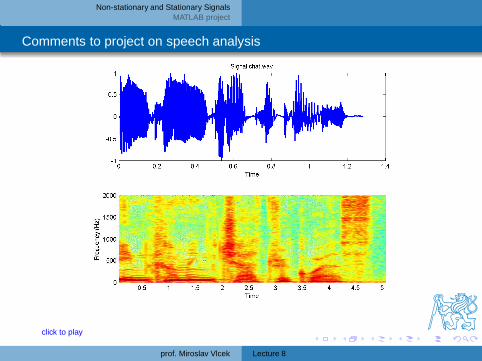
Comments to project on speech analysis
click to play
prof. Miroslav Vlcek Lecture 8
Non-stationary and Stationary SignalsMATLAB project
Comments to project on speech analysis
• Speech is non-stationary signal where properties changequite rapidly over time.
• For most phonemes the properties of the speech remaininvariant for a short period of time (≈ 5-100 ms).
• These segments are assumed to be stationary and we canuse DFT for any ≈ 5-100 ms segment.
prof. Miroslav Vlcek Lecture 8
Non-stationary and Stationary SignalsMATLAB project
Comments to project on speech analysis
• Most of speech processing is done by taking shortoverlapping windows and processing them.
• Windowing: a long signal is multiplied with a windowfunction of finite length, giving finite length weightedversion of the original signal.
prof. Miroslav Vlcek Lecture 8
Non-stationary and Stationary SignalsMATLAB project
Comments to project on speech analysis
• In speech processing the shape of the window function isnot that crucial.
• Usually some soft window like Hanning, or Hamming areused. Their sideband lobes as substantially smaller than ina rectangular window.
• In speech recognition the windows are usually overlapping10 ms each other.
prof. Miroslav Vlcek Lecture 8

Non-stationary and Stationary SignalsMATLAB project
Principle of uncertainty
• If f (t) is non-zero with a compact support, then its Fouriertransform cannot be zero on a whole interval.
• If its Fourier transform F (ω) is compactly supported, thenit cannot be zero on a time interval.
• Hence, even if the Heisenberg constraints are verified, it isimpossible to have an function in space L
2 which iscompactly supported both in the time and frequencydomains.
prof. Miroslav Vlcek Lecture 8
Non-stationary and Stationary SignalsMATLAB project
Principle of uncertainty
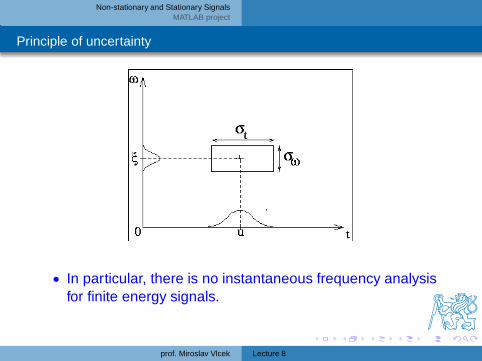
• In particular, there is no instantaneous frequency analysisfor finite energy signals.
prof. Miroslav Vlcek Lecture 8

Non-stationary and Stationary SignalsMATLAB project
MATLAB project with music scale
% J. H. McClellan, R. W. Schafer, and M. A. Yoder% Signal Processing First, ISBN 0-13-065562-7.% Prentice Hall 2003% spectrogram of a music scale% M. Vlcek, Prague, 2010% ***********************************************
prof. Miroslav Vlcek Lecture 8

Non-stationary and Stationary SignalsMATLAB project
MATLAB project with music scale
% make a scale for C majorc1=40; cis=41; d=42; dis=43; e=44; f=45;fis=46; g=47; gis=48; a=49; b=50; h=51 c2=52;keys = [ c1 d e f g a h c2 ];% key #49 is A% ***********************************************
tone C D E F G A H Cfrequency in Hz 262 294 330 349 392 440 494 523
Table: C major scale
prof. Miroslav Vlcek Lecture 8

Non-stationary and Stationary SignalsMATLAB project
MATLAB project with music scale
Fs = 4000;t0 = 0.2;tt = 0:(1/Fs):t0;y2 = [ ];for k = 1:length(keys)keynum = keys(k);%add 12 to move up 1 octavefreq(k) = 440 * (2 .∧((keynum-49)/12));% based on A=440 Hzy2 = [ y2, cos( 2*pi*freq(k)*tt - pi/2 ) ];
end
prof. Miroslav Vlcek Lecture 8
Non-stationary and Stationary SignalsMATLAB project
MATLAB project with music scale
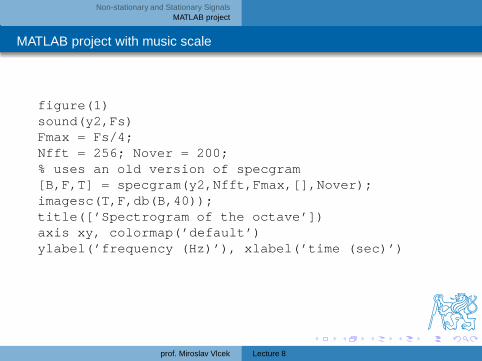
figure(1)sound(y2,Fs)Fmax = Fs/4;Nfft = 256; Nover = 200;% uses an old version of specgram[B,F,T] = specgram(y2,Nfft,Fmax,[],Nover);imagesc(T,F,db(B,40));title([’Spectrogram of the octave’])axis xy, colormap(’default’)ylabel(’frequency (Hz)’), xlabel(’time (sec)’)
prof. Miroslav Vlcek Lecture 8

Non-stationary and Stationary SignalsMATLAB project
MATLAB project music scale
0 500 1000 1500 2000 2500 3000−1
−0.5
0
0.5
1First half of the octave
Spectrogram of the octave
freq
uenc
y (H
z)
time (sec)0 0.5 1 1.5
0
500
1000
1500
2000
prof. Miroslav Vlcek Lecture 8
Non-stationary and Stationary SignalsMATLAB project
MATLAB project with music scale
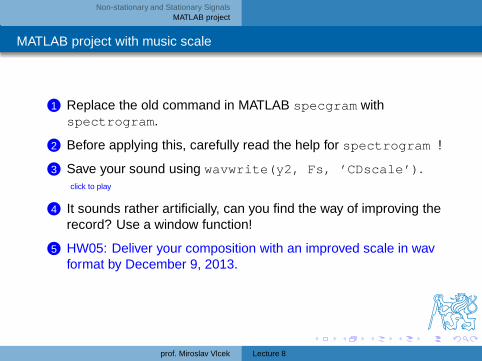
1 Replace the old command in MATLAB specgram withspectrogram.
2 Before applying this, carefully read the help for spectrogram !
3 Save your sound using wavwrite(y2, Fs, ’CDscale’).click to play
4 It sounds rather artificially, can you find the way of improving therecord? Use a window function!
5 HW05: Deliver your composition with an improved scale in wavformat by December 9, 2013.
prof. Miroslav Vlcek Lecture 8


