from Dun & Bradstreet and EduPristine - Amazon S3 · from Dun & Bradstreet and EduPristine ......
8
from Dun & Bradstreet and EduPristine Business and the governments are finding ways to make sense of all the available data. Business Analytics thus finds favor as it is the use of tools and techniques like data mining, pattern matching, data visualizations and predictive modeling to predict and optimize outcomes and derive value from the data. Equipped with this useful information, organizations can compete better in cut-throat markets both locally and globally. Dun & Bradstreet and EduPristine have partnered to deliver a joint certification program developed specifically for young graduates and professionals aspiring to pursue a career in analytics industry and are keen to enhance their technical skills with exposure to cutting-edge practices The Ideal Candidate for Business Analytics: This course is designed to equip professionals working in the fields of Finance, Marketing, Economics, Statistics, Mathematics, Computer Science, IT, Analytics, Marketing Research, or Commodity markets with the essential tools, techniques and skills to answer important business questions. There are no real skills you need to take this course, although basic mathematics and good analytical skills will be beneficial. However, the course is designed for people with minimal mathematical knowledge. © EduPristine – www.edupristine.com
Transcript of from Dun & Bradstreet and EduPristine - Amazon S3 · from Dun & Bradstreet and EduPristine ......

from Dun & Bradstreet and EduPristine
Business and the governments are finding ways to make sense of all the available data. Business Analytics thus finds favor as it is the use of tools and techniques like data mining, pattern matching, data visualizations and predictive modeling to predict and optimize outcomes and derive value from the data. Equipped with this useful information, organizations can compete better in cut-throat markets both locally and globally.
Dun & Bradstreet and EduPristine have partnered to deliver a joint certification program developed specifically for young graduates and professionals aspiring to pursue a career in analytics industry and are keen to enhance their technical skills with exposure to cutting-edge practices
The Ideal Candidate for Business Analytics: This course is designed to equip professionals working in the fields of Finance, Marketing, Economics, Statistics, Mathematics, Computer Science, IT, Analytics, Marketing Research, or Commodity markets with the essential tools, techniques and skills to answer important business questions. There are no real skills you need to take this course, although basic mathematics and good analytical skills will be beneficial. However, the course is designed for people with minimal mathematical knowledge.
© EduPristine – www.edupristine.com
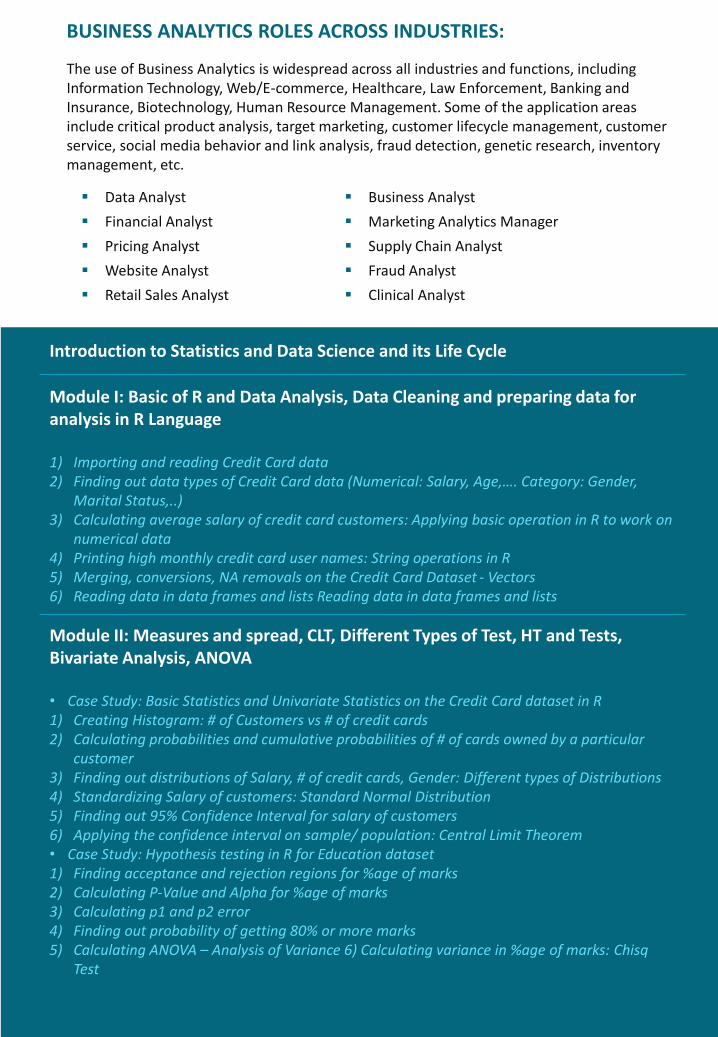
BUSINESS ANALYTICS ROLES ACROSS INDUSTRIES:
▪ Business Analyst
▪ Marketing Analytics Manager
▪ Supply Chain Analyst
▪ Fraud Analyst
▪ Clinical Analyst
▪ Data Analyst
▪ Financial Analyst
▪ Pricing Analyst
▪ Website Analyst
▪ Retail Sales Analyst
The use of Business Analytics is widespread across all industries and functions, including Information Technology, Web/E-commerce, Healthcare, Law Enforcement, Banking and Insurance, Biotechnology, Human Resource Management. Some of the application areas include critical product analysis, target marketing, customer lifecycle management, customer service, social media behavior and link analysis, fraud detection, genetic research, inventory management, etc.
Introduction to Statistics and Data Science and its Life Cycle
Module I: Basic of R and Data Analysis, Data Cleaning and preparing data for analysis in R Language
1) Importing and reading Credit Card data 2) Finding out data types of Credit Card data (Numerical: Salary, Age,…. Category: Gender,
Marital Status,..) 3) Calculating average salary of credit card customers: Applying basic operation in R to work on
numerical data 4) Printing high monthly credit card user names: String operations in R 5) Merging, conversions, NA removals on the Credit Card Dataset - Vectors 6) Reading data in data frames and lists Reading data in data frames and lists
Module II: Measures and spread, CLT, Different Types of Test, HT and Tests, Bivariate Analysis, ANOVA
• Case Study: Basic Statistics and Univariate Statistics on the Credit Card dataset in R 1) Creating Histogram: # of Customers vs # of credit cards 2) Calculating probabilities and cumulative probabilities of # of cards owned by a particular
customer 3) Finding out distributions of Salary, # of credit cards, Gender: Different types of Distributions 4) Standardizing Salary of customers: Standard Normal Distribution 5) Finding out 95% Confidence Interval for salary of customers 6) Applying the confidence interval on sample/ population: Central Limit Theorem • Case Study: Hypothesis testing in R for Education dataset 1) Finding acceptance and rejection regions for %age of marks 2) Calculating P-Value and Alpha for %age of marks 3) Calculating p1 and p2 error4) Finding out probability of getting 80% or more marks 5) Calculating ANOVA – Analysis of Variance 6) Calculating variance in %age of marks: Chisq
Test
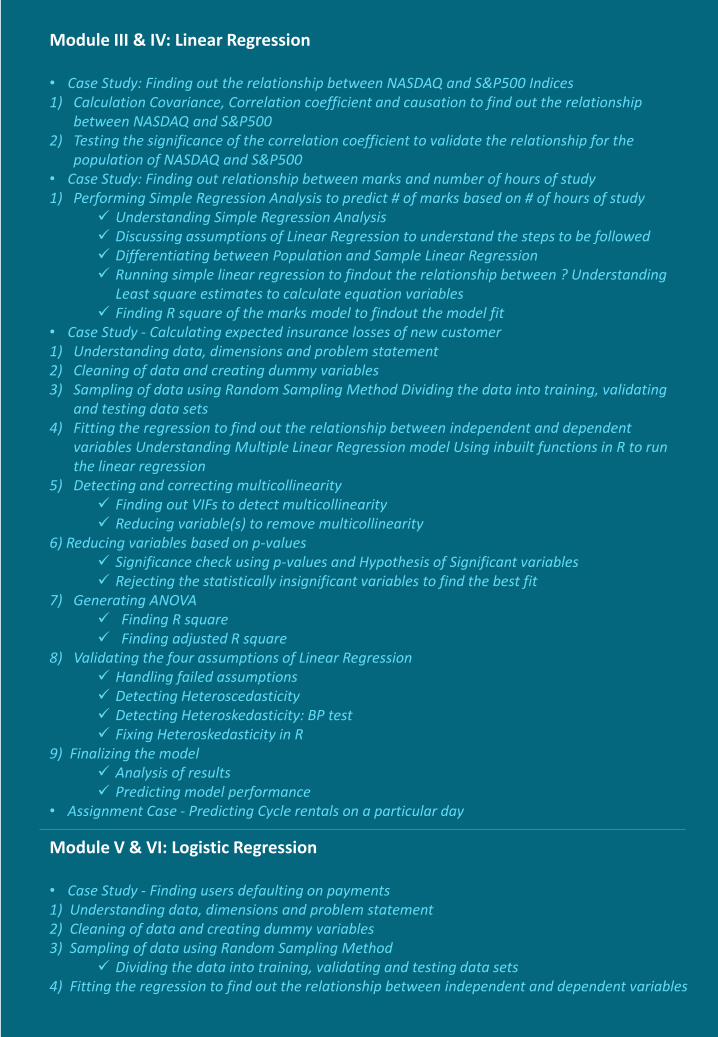
Module III & IV: Linear Regression
• Case Study: Finding out the relationship between NASDAQ and S&P500 Indices 1) Calculation Covariance, Correlation coefficient and causation to find out the relationship
between NASDAQ and S&P500 2) Testing the significance of the correlation coefficient to validate the relationship for the
population of NASDAQ and S&P500 • Case Study: Finding out relationship between marks and number of hours of study 1) Performing Simple Regression Analysis to predict # of marks based on # of hours of study
✓ Understanding Simple Regression Analysis ✓ Discussing assumptions of Linear Regression to understand the steps to be followed ✓ Differentiating between Population and Sample Linear Regression ✓ Running simple linear regression to findout the relationship between ? Understanding
Least square estimates to calculate equation variables ✓ Finding R square of the marks model to findout the model fit
• Case Study - Calculating expected insurance losses of new customer 1) Understanding data, dimensions and problem statement 2) Cleaning of data and creating dummy variables 3) Sampling of data using Random Sampling Method Dividing the data into training, validating
and testing data sets 4) Fitting the regression to find out the relationship between independent and dependent
variables Understanding Multiple Linear Regression model Using inbuilt functions in R to run the linear regression
5) Detecting and correcting multicollinearity✓ Finding out VIFs to detect multicollinearity ✓ Reducing variable(s) to remove multicollinearity
6) Reducing variables based on p-values ✓ Significance check using p-values and Hypothesis of Significant variables ✓ Rejecting the statistically insignificant variables to find the best fit
7) Generating ANOVA✓ Finding R square ✓ Finding adjusted R square
8) Validating the four assumptions of Linear Regression ✓ Handling failed assumptions ✓ Detecting Heteroscedasticity ✓ Detecting Heteroskedasticity: BP test ✓ Fixing Heteroskedasticity in R
9) Finalizing the model ✓ Analysis of results ✓ Predicting model performance
• Assignment Case - Predicting Cycle rentals on a particular day
Module V & VI: Logistic Regression
• Case Study - Finding users defaulting on payments 1) Understanding data, dimensions and problem statement 2) Cleaning of data and creating dummy variables 3) Sampling of data using Random Sampling Method
✓ Dividing the data into training, validating and testing data sets 4) Fitting the regression to find out the relationship between independent and dependent variables
✓ Using inbuilt functions in R to run the linear regression 5) Detecting and correcting multicollinearity
✓ Finding out VIFs to detect multicollinearity ✓ Reducing variable(s) to remove multicollinearity
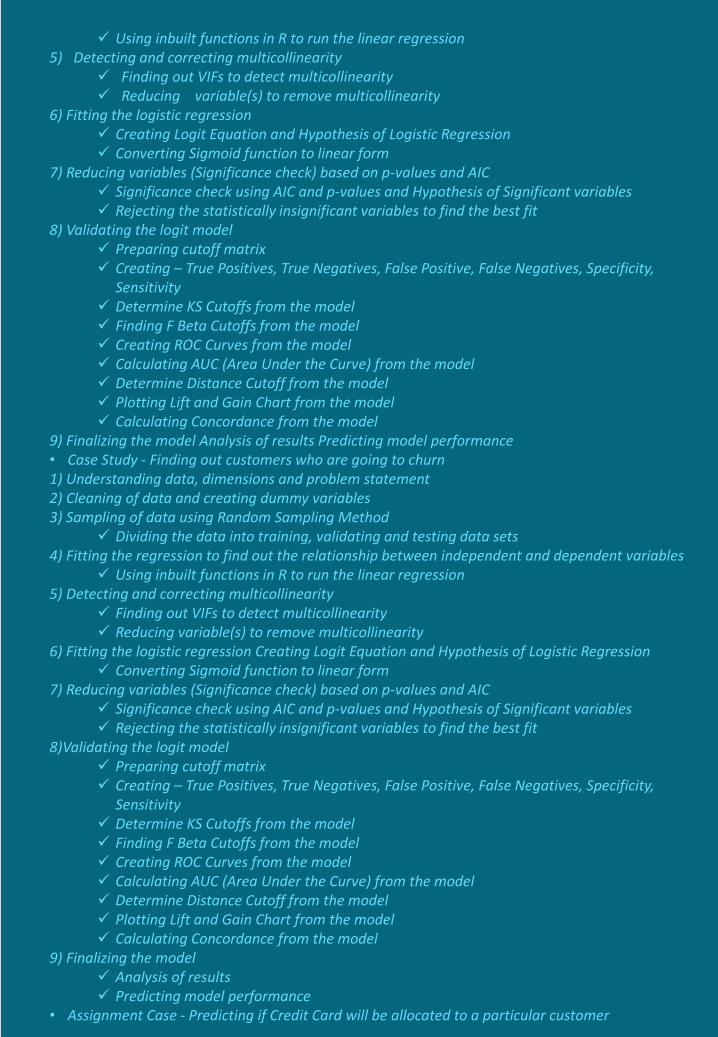
6) Fitting the logistic regression ✓ Creating Logit Equation and Hypothesis of Logistic Regression ✓ Converting Sigmoid function to linear form
7) Reducing variables (Significance check) based on p-values and AIC ✓ Significance check using AIC and p-values and Hypothesis of Significant variables ✓ Rejecting the statistically insignificant variables to find the best fit
8) Validating the logit model ✓ Preparing cutoff matrix ✓ Creating – True Positives, True Negatives, False Positive, False Negatives, Specificity,
Sensitivity ✓ Determine KS Cutoffs from the model ✓ Finding F Beta Cutoffs from the model ✓ Creating ROC Curves from the model ✓ Calculating AUC (Area Under the Curve) from the model ✓ Determine Distance Cutoff from the model ✓ Plotting Lift and Gain Chart from the model ✓ Calculating Concordance from the model
9) Finalizing the model Analysis of results Predicting model performance • Case Study - Finding out customers who are going to churn 1) Understanding data, dimensions and problem statement 2) Cleaning of data and creating dummy variables 3) Sampling of data using Random Sampling Method
✓ Dividing the data into training, validating and testing data sets 4) Fitting the regression to find out the relationship between independent and dependent variables
✓ Using inbuilt functions in R to run the linear regression 5) Detecting and correcting multicollinearity
✓ Finding out VIFs to detect multicollinearity ✓ Reducing variable(s) to remove multicollinearity
6) Fitting the logistic regression Creating Logit Equation and Hypothesis of Logistic Regression✓ Converting Sigmoid function to linear form
7) Reducing variables (Significance check) based on p-values and AIC ✓ Significance check using AIC and p-values and Hypothesis of Significant variables ✓ Rejecting the statistically insignificant variables to find the best fit
8)Validating the logit model ✓ Preparing cutoff matrix ✓ Creating – True Positives, True Negatives, False Positive, False Negatives, Specificity,
Sensitivity ✓ Determine KS Cutoffs from the model ✓ Finding F Beta Cutoffs from the model ✓ Creating ROC Curves from the model ✓ Calculating AUC (Area Under the Curve) from the model ✓ Determine Distance Cutoff from the model ✓ Plotting Lift and Gain Chart from the model ✓ Calculating Concordance from the model
9) Finalizing the model ✓ Analysis of results ✓ Predicting model performance
• Assignment Case - Predicting if Credit Card will be allocated to a particular customer
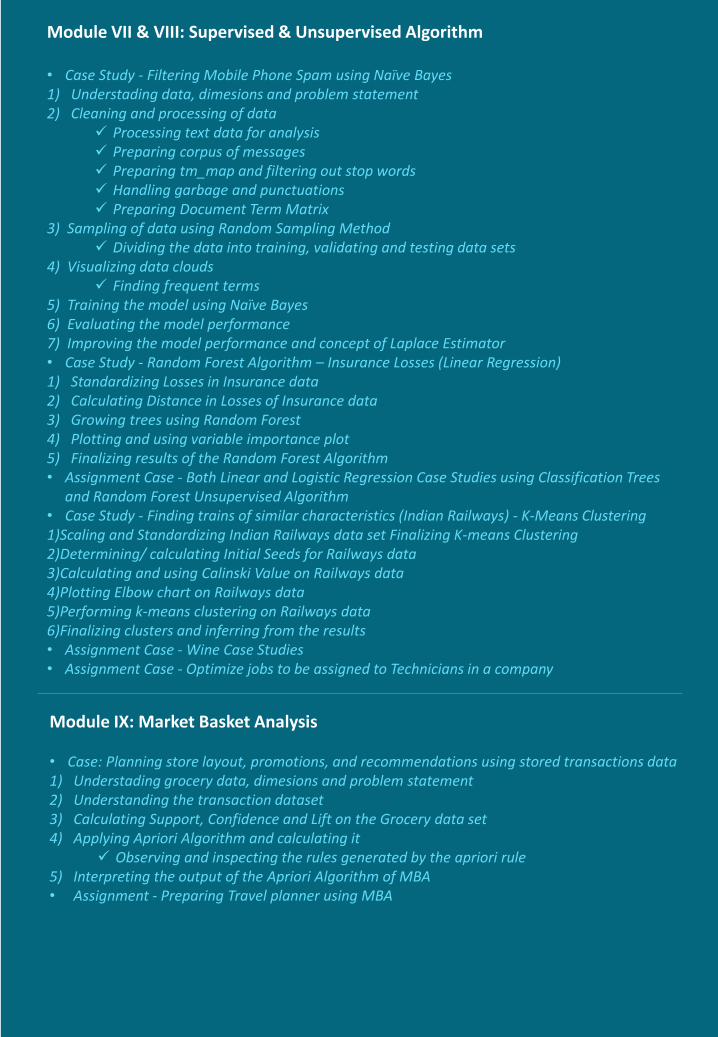
Module VII & VIII: Supervised & Unsupervised Algorithm
• Case Study - Filtering Mobile Phone Spam using Naïve Bayes 1) Understading data, dimesions and problem statement 2) Cleaning and processing of data
✓ Processing text data for analysis ✓ Preparing corpus of messages ✓ Preparing tm_map and filtering out stop words ✓ Handling garbage and punctuations ✓ Preparing Document Term Matrix
3) Sampling of data using Random Sampling Method ✓ Dividing the data into training, validating and testing data sets
4) Visualizing data clouds ✓ Finding frequent terms
5) Training the model using Naïve Bayes 6) Evaluating the model performance 7) Improving the model performance and concept of Laplace Estimator • Case Study - Random Forest Algorithm – Insurance Losses (Linear Regression) 1) Standardizing Losses in Insurance data 2) Calculating Distance in Losses of Insurance data 3) Growing trees using Random Forest 4) Plotting and using variable importance plot 5) Finalizing results of the Random Forest Algorithm • Assignment Case - Both Linear and Logistic Regression Case Studies using Classification Trees
and Random Forest Unsupervised Algorithm • Case Study - Finding trains of similar characteristics (Indian Railways) - K-Means Clustering1)Scaling and Standardizing Indian Railways data set Finalizing K-means Clustering 2)Determining/ calculating Initial Seeds for Railways data 3)Calculating and using Calinski Value on Railways data 4)Plotting Elbow chart on Railways data 5)Performing k-means clustering on Railways data 6)Finalizing clusters and inferring from the results • Assignment Case - Wine Case Studies• Assignment Case - Optimize jobs to be assigned to Technicians in a company
Module IX: Market Basket Analysis
• Case: Planning store layout, promotions, and recommendations using stored transactions data 1) Understading grocery data, dimesions and problem statement 2) Understanding the transaction dataset 3) Calculating Support, Confidence and Lift on the Grocery data set 4) Applying Apriori Algorithm and calculating it
✓ Observing and inspecting the rules generated by the apriori rule 5) Interpreting the output of the Apriori Algorithm of MBA • Assignment - Preparing Travel planner using MBA

Module X & XI: Time Series Modeling
• Case: Sales/ Demand forecast using Time series Analytics in R 1) Using Simple Moving Average (SMA) method to forecast next 12 months sale
✓ Calculating SMA using 3 and 6 months to forecast next 12 months sale ✓ Automating SMA prediction to forecast next 12 months sale by using different number
of months ✓ Calculating RMSE and MAPE to optimize the number of months for best forecast
2) Using Weighted Moving Average (WMA) method to forecast next 12 months sale ✓ Calculating WMA using 3 and 4 months to forecast next 12 months sale ✓ Automating WMA prediction with 12 months to forecast next 12 months sale by using
optimized weights ✓ Calculating RMSE and MAPE to optimize the number of months and weights for best
forecast 3) Using Single Exponential Smoothing (SES) method to forecast next 12 months sale
✓ Calculating SES using two different alpha to forecast next 12 months sale ✓ Calculating RMSE and MAPE to optimize alpha for best forecast
4) Using Double Exponential Smoothing (DES) method to forecast next 12 months sale✓ Calculating DES using two different alpha and beta to forecast next 12 months sale ✓ Calculating RMSE and MAPE to optimize alpha and beta for best forecast
5) Using Triple Exponential Smoothing (TES) method to forecast next 12 months sale ✓ Calculating TES alpha, beta and gamma to forecast next 12 months sale ✓ Calculating RMSE and MAPE to optimize alpha, beta and gamma for best forecast
6) Comparing all the above methods to findout the best for the given data set • Case: Sales/ Demand forecast using ARIMA in R 1) Differentiating time series and noise using Moving Averages (MA) and Autoregressive (AR)
processes 2) Combining AR and MA models to create ARMA models 3) Converting ARMA to ARIMA to remove trend 4) Using ARIMA Model to forecase next 12 months sale
✓ Finding out trend and seasonality effect to decide between ARMA and ARIMA models ✓ Checking stationarity assumption using Dickey Fuller Test ✓ Identifying lags to finalize normal ARIMA/ Seasonal ARIMA model ✓ Using ACFs and PACFs (Box Jenkins model)
6) Validating Model to check if residuals are normally distributed with zero mean, are uncorrelated, and have minimum variance 7) Forecasting next 12 months sale • Assignment Case - Forecasting Souvenier sales
Module XII: Ridge Regression
• Case Study: Ridge Regression with bike sharing case study and comparision with linear regression 1) Understading data, dimensions and problem statement 2) Cleaning of data and creating dummy variables 3) Sampling of data using Random Sampling Method
✓ Dividing the data into training, validating and testing data sets 4) Fitting the regression to find out the relationship between independent and dependent variables
✓ Using inbuilt functions in R to run the regression 5) Detecting and correcting multicollinearity
✓ Detecting multicollinearity ✓ Reducing variable(s) to remove multicollinearity
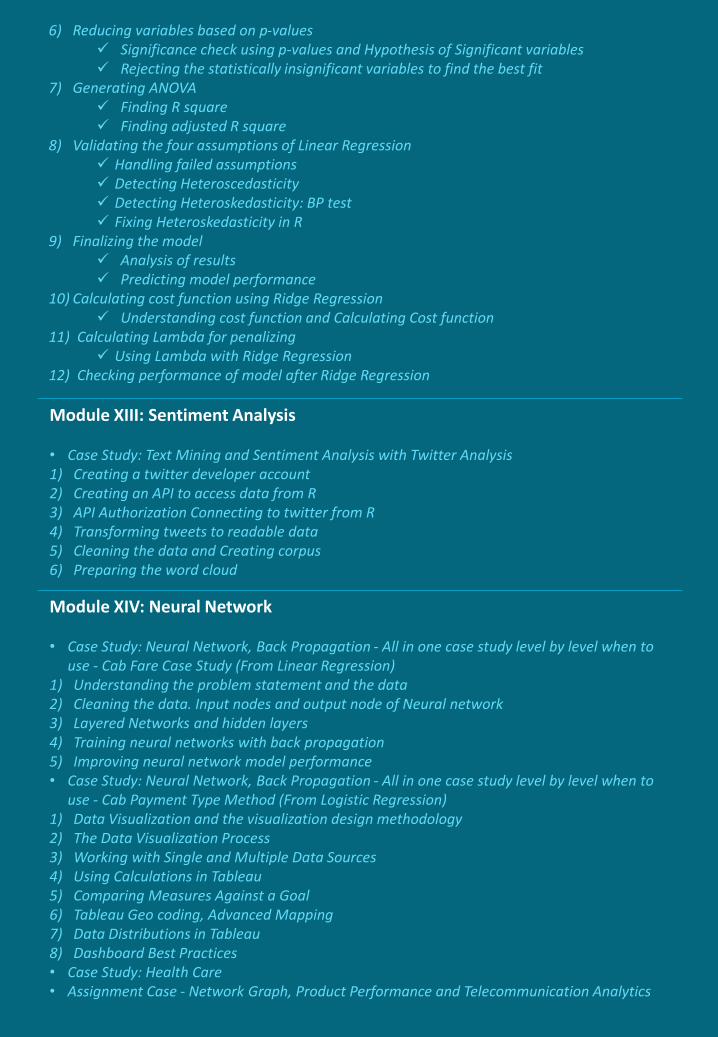
6) Reducing variables based on p-values ✓ Significance check using p-values and Hypothesis of Significant variables ✓ Rejecting the statistically insignificant variables to find the best fit
7) Generating ANOVA ✓ Finding R square ✓ Finding adjusted R square
8) Validating the four assumptions of Linear Regression ✓ Handling failed assumptions ✓ Detecting Heteroscedasticity ✓ Detecting Heteroskedasticity: BP test ✓ Fixing Heteroskedasticity in R
9) Finalizing the model ✓ Analysis of results ✓ Predicting model performance
10) Calculating cost function using Ridge Regression ✓ Understanding cost function and Calculating Cost function
11) Calculating Lambda for penalizing ✓ Using Lambda with Ridge Regression
12) Checking performance of model after Ridge Regression
Module XIII: Sentiment Analysis
• Case Study: Text Mining and Sentiment Analysis with Twitter Analysis 1) Creating a twitter developer account 2) Creating an API to access data from R 3) API Authorization Connecting to twitter from R 4) Transforming tweets to readable data 5) Cleaning the data and Creating corpus 6) Preparing the word cloud
Module XIV: Neural Network
• Case Study: Neural Network, Back Propagation - All in one case study level by level when to use - Cab Fare Case Study (From Linear Regression)
1) Understanding the problem statement and the data 2) Cleaning the data. Input nodes and output node of Neural network 3) Layered Networks and hidden layers 4) Training neural networks with back propagation 5) Improving neural network model performance • Case Study: Neural Network, Back Propagation - All in one case study level by level when to
use - Cab Payment Type Method (From Logistic Regression) 1) Data Visualization and the visualization design methodology 2) The Data Visualization Process 3) Working with Single and Multiple Data Sources 4) Using Calculations in Tableau 5) Comparing Measures Against a Goal 6) Tableau Geo coding, Advanced Mapping 7) Data Distributions in Tableau 8) Dashboard Best Practices • Case Study: Health Care • Assignment Case - Network Graph, Product Performance and Telecommunication Analytics
© EduPristine – www.edupristine.com
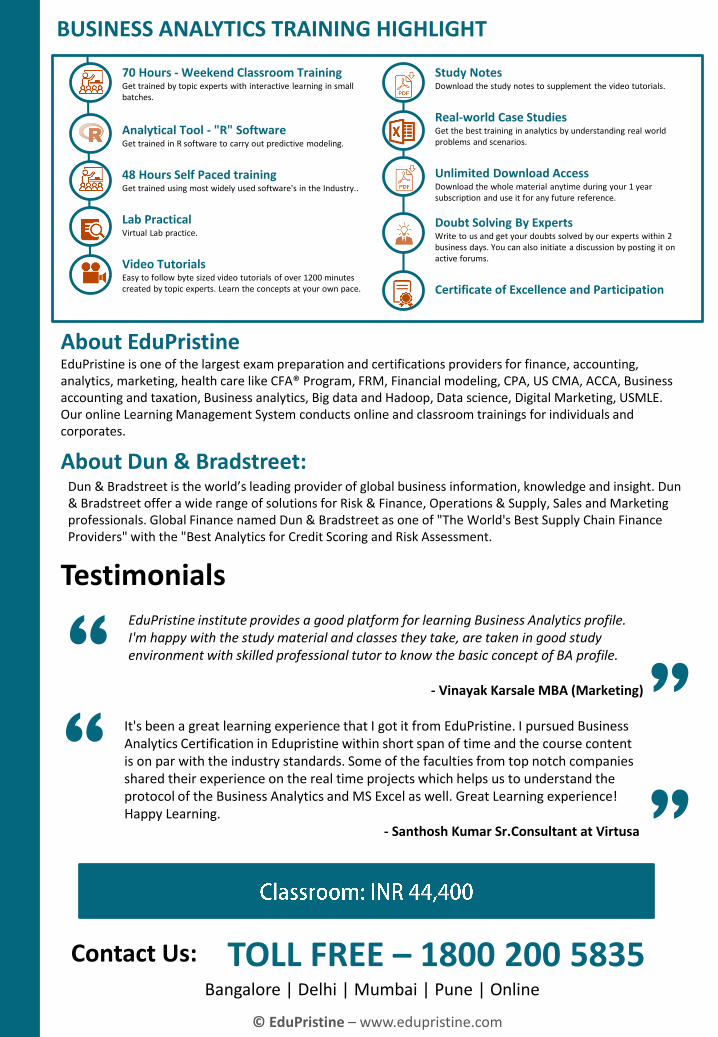
About EduPristineEduPristine is one of the largest exam preparation and certifications providers for finance, accounting, analytics, marketing, health care like CFA® Program, FRM, Financial modeling, CPA, US CMA, ACCA, Business accounting and taxation, Business analytics, Big data and Hadoop, Data science, Digital Marketing, USMLE. Our online Learning Management System conducts online and classroom trainings for individuals and corporates.
About Dun & Bradstreet:Dun & Bradstreet is the world’s leading provider of global business information, knowledge and insight. Dun & Bradstreet offer a wide range of solutions for Risk & Finance, Operations & Supply, Sales and Marketing professionals. Global Finance named Dun & Bradstreet as one of "The World's Best Supply Chain Finance Providers" with the "Best Analytics for Credit Scoring and Risk Assessment.
Contact Us: TOLL FREE – 1800 200 5835Bangalore | Delhi | Mumbai | Pune | Online
Testimonials
“EduPristine institute provides a good platform for learning Business Analytics profile. I'm happy with the study material and classes they take, are taken in good study environment with skilled professional tutor to know the basic concept of BA profile.
- Vinayak Karsale MBA (Marketing)
“
“It's been a great learning experience that I got it from EduPristine. I pursued Business Analytics Certification in Edupristine within short span of time and the course content is on par with the industry standards. Some of the faculties from top notch companies shared their experience on the real time projects which helps us to understand the protocol of the Business Analytics and MS Excel as well. Great Learning experience! Happy Learning.
- Santhosh Kumar Sr.Consultant at Virtusa
“
Study NotesDownload the study notes to supplement the video tutorials.
Real-world Case StudiesGet the best training in analytics by understanding real world problems and scenarios.
Unlimited Download AccessDownload the whole material anytime during your 1 year subscription and use it for any future reference.
Doubt Solving By ExpertsWrite to us and get your doubts solved by our experts within 2 business days. You can also initiate a discussion by posting it on active forums.
Certificate of Excellence and Participation
70 Hours - Weekend Classroom TrainingGet trained by topic experts with interactive learning in small batches.
Analytical Tool - "R" SoftwareGet trained in R software to carry out predictive modeling.
48 Hours Self Paced trainingGet trained using most widely used software's in the Industry..
Lab PracticalVirtual Lab practice.
Video TutorialsEasy to follow byte sized video tutorials of over 1200 minutes created by topic experts. Learn the concepts at your own pace.
BUSINESS ANALYTICS TRAINING HIGHLIGHT