FROG ISLAND DESIGN REPORT -...
98
PREPARED BY: KLEINSCHMIDT ASSOCIATES PREPARED FOR: NEW YORK POWER AUTHORITY FROG ISLAND DESIGN REPORT DRAFT Niagara Power Project (FERC No. 2216) ©Copyright 2010. New York Power Authority. All Rights Reserved 7/26/2010
-
Upload
hoangthien -
Category
Documents
-
view
214 -
download
0
Transcript of FROG ISLAND DESIGN REPORT -...

PREPARED BY: KLEINSCHMIDT ASSOCIATES PREPARED FOR: NEW YORK POWER AUTHORITY
FROG ISLAND DESIGN REPORT
DRAFT
Niagara Power Project (FERC No. 2216)
©Copyright 2010. New York Power Authority. All Rights Reserved
7/26/2010

FROG ISLAND DESIGN REPORT
©Copyright 2010. New York Power Authority. All Rights Reserved
For Copies of this Document
Please Contact:
Stephen M. Schoenwiesner Licensing Manager
New York Power Authority 123 Main Street
White Plains, NY 10601 (914) 287-3457

FROG ISLAND DESIGN REPORT
©Copyright 2010. New York Power Authority. All Rights Reserved II
TABLE OF CONTENTS EXECUTIVE SUMMARY ......................................................................................................... 11.0 INTRODUCTION ..................................................................................................... 1-12.0 HISTORY OF FROG ISLAND .................................................................................... 2-33.0 REVIEW OF EXISTING HABITATS ........................................................................... 3-14.0 DESIGN REQUIREMENTS AND OBJECTIVES ............................................................ 4-15.0 ENGINEERING DESIGN ........................................................................................... 5-1
5.1 HYDROLOGY AND WAVE ENVIRONMENT IN THE FROG ISLAND AREA ...... 5-15.1.1 WIND ANALYSIS ........................................................................... 5-15.1.2 WAVE HEIGHT ANALYSIS ............................................................. 5-35.1.3 WAVE RUNUP ANALYSIS .............................................................. 5-45.1.4 WATER LEVEL ANALYSIS ............................................................. 5-75.1.5 DAILY FLUCTUATION RANGES ...................................................... 5-85.1.6 STORM SURGE FLUCTUATION RANGES ......................................... 5-95.1.7 LONG-TERM FLUCTUATIONS IN WATER SURFACE ........................ 5-9
5.2 OPEN WATER HYDRAULIC MODEL ......................................................... 5-115.2.1 MODEL DESCRIPTION .................................................................. 5-115.2.2 MODEL SCENARIOS ..................................................................... 5-125.2.3 IMPACTS TO WATER LEVELS ....................................................... 5-12
5.3 ICE HYDRAULIC MODEL ......................................................................... 5-135.3.1 ICE MODEL DESCRIPTION ........................................................... 5-135.3.2 ISLAND EFFECTS ON ICE .............................................................. 5-155.3.3 ICE THICKNESS/ELEVATIONS ...................................................... 5-155.3.4 ICE LOADING FORCES ................................................................. 5-15
5.4 GEOTECHNICAL ANALYSIS ..................................................................... 5-165.4.1 SOIL BORING DATA .................................................................... 5-165.4.2 FIELD TEST PITS ......................................................................... 5-165.4.3 FOUNDATION DESIGN ................................................................. 5-17
5.5 BREAKWATER DESIGN ............................................................................ 5-175.5.1 GENERAL LAYOUT ...................................................................... 5-175.5.2 TOE DESIGN ................................................................................ 5-185.5.3 ARMOR DESIGN .......................................................................... 5-19
5.6 HABITAT ENGINEERING .......................................................................... 5-225.6.1 HABITAT WATER LEVEL RANGES ............................................... 5-225.6.2 EMERGENT WETLAND ENGINEERING .......................................... 5-245.6.3 SUBMERGED AQUATIC VEGETATION ENGINEERING ................... 5-25

FROG ISLAND DESIGN REPORT
©Copyright 2010. New York Power Authority. All Rights Reserved III
5.7 SEDIMENT ANALYSIS/FLUSHING ............................................................. 5-266.0 RISK ANALYSIS ..................................................................................................... 6-1
6.1 WAVE DAMAGE ........................................................................................ 6-16.2 ICE DAMAGE ............................................................................................. 6-26.3 HABITAT SUSTAINABILITY ........................................................................ 6-3
7.0 CONCLUSIONS ....................................................................................................... 7-18.0 ADDITIONAL RESOURCES ...................................................................................... 8-19.0 REFERENCES ......................................................................................................... 9-1
LIST OF FIGURES
FIGURE 1. LOCATION OF THE FROG ISLAND HABITAT IMPROVEMENT PROJECT, NIAGARA RIVER, ERIE COUNTY, NY ...................................................................................................... 1-2
FIGURE 2. AVERAGE AND PEAK WIND SPEEDS BY DIRECTION .................................................... 5-2
FIGURE 3. HISTORIC ANNUAL FLOWS IN NIAGARA RIVER AS COMPARED TO WATER LEVELS IN LAKE ERIE AND NIAGARA RIVER .............................................................................. 5-10
FIGURE 4. BREAKWATER DAMAGE DEVELOPMENT (ST) ........................................................... 5-20
FIGURE 5. WETLAND PLANT DISTRIBUTION AT STRAWBERRY, FROG & MOTOR ISLANDS (BASED ON OBSERVED ELEVATION) (NYPA, 2009) ............................................................... 5-23
LIST OF TABLES TABLE 1. TIMELINE OF EVENTS AND CONDITIONS AT FROG ISLAND AND SURROUNDING VICINITY
.................................................................................................................................... 2-5
TABLE 2. EXISTING NIAGARA RIVER HABITAT EVALUATIONS ................................................... 3-2
TABLE 3. STATISTICS OF WIND DATA (1948-2007) ................................................................... 5-3
TABLE 4. WAVE PROPERTIES AT VARIABLE WIND SPEEDS ........................................................ 5-4
TABLE 5. WATER LEVEL EXCEEDENCE FREQUENCIES ............................................................... 5-7
TABLE 6. ANALYSIS OF WATER LEVEL AT HUNTLEY GAGE ....................................................... 5-8
TABLE 7. OPEN WATER FLOW RATES ...................................................................................... 5-12
TABLE 8. OPEN WATER DOWNSTREAM BOUNDARY CONDITION.............................................. 5-12

FROG ISLAND DESIGN REPORT
©Copyright 2010. New York Power Authority. All Rights Reserved IV
TABLE 9. SUMMARY OF ICE MODEL SCENARIOS ...................................................................... 5-14
TABLE 10. ELEVATION RANGES FOR WETLAND COVER TYPES AT STRAWBERRY, FROG & MOTOR ISLANDS .................................................................................................................... 5-23
LIST OF APPENDICIES APPENDIX A: HISTORICAL MAP AND AERIAL PHOTOGRAPHS APPENDIX B: WAVE CALCULATIONS APPENDIX C: ROCK SIZING CALCULATIONS APPENDIX D: 2007 WETLAND PLANT MATRIX FROM NYPA (2009)
J:\1210\002\Docs\Frog Island\Design_Memos\Frog Island Compendium\Frog Island Design Compendium - draft.docx

FROG ISLAND DESIGN REPORT
©Copyright 2010. New York Power Authority. All Rights Reserved V
ACRONYM LIST
ac - acres
ASOS - Automated Surface Observation System
cfs - cubic feet per second
CGIP - Chippewa Grass Island Pool
cms - cubic meters per second
Ct - Coefficient of Transmission
El. - elevation, in feet, per U.S. Lake Surface 1935 (USLS 35) vertical datum
ESC - Ecological Standing Committee
FERC - Federal Energy Regulatory Commission
ft - feet
ft/s - feet per second
GPS - global positioning system
HIP - Habitat Improvement Project
lb/ft - pounds per linear foot
lbs/ft2
mph - miles per hour
- pounds per square foot
NOAA - National Oceanic and Atmospheric Administration
NWL - normal water level
NYPA - New York Power Authority
NYSDOT - New York State Department of Transportation
NYSOPRHP - New York State Office of Parks, Restoration, and Historic Preservation
SAV - submerged aquatic vegetation
USACE - U.S. Army Corps of Engineers
USGS - U.S. Geological Survey
USLS 35 - U.S. Lake Surface 1935 vertical datum, in feet (USLS 35 = IGLD 1985 + 1.20 feet)
WSEL - Water Surface Elevation

FROG ISLAND DESIGN REPORT
©Copyright 2010. New York Power Authority. All Rights Reserved ES- 1
The New York Power Authority (NYPA) is designing a habitat improvement project in the Upper Niagara River as a result of the relicensing of the Niagara Power Project. The Frog Island Habitat Improvement Project (HIP) is a shallow, roughly 5-acre area that is currently devoid of vegetation. Located in the shallows between Motor and Strawberry Islands, this HIP involves the creation of emergent wetland and submerged aquatic vegetation (SAV) habitat in a portion of the river that at one time supported wetlands.
EXECUTIVE SUMMARY
This report has been prepared to summarize existing knowledge of the Frog Island area, which will help establish reference conditions from which to base subsequent designs upon, and to present engineering analyses, approaches, and data for the development of the Frog Island Habitat Improvement Project. The design of Frog Island is still in the early stages and additional information obtained in the future, or different design approaches/goals, may affect the information contained in this document. All elevations in this report are in the U.S. Lake Surface Datum 1935 (USLS 35) vertical datum.
History of Frog Island
Human activities in this part of the river have alternated between periods of extensive dredge spoil disposal (1815-1910) and gravel mining (1912-1953) activities, which have quite substantially altered the shape, size, and number of islands in this complex. Historical maps prior to 1870 do not indicate a feature at the location of Frog Island, although mapping standards and accuracy at that time may have precluded documenting small islands or wetland areas in the middle of the river. Frog Island reached its largest size around 1938, with an area of approximately 4 acres. By 1951, the island’s area was greatly reduced, and by 1985, it is no longer visible in aerial photographs. Much of Frog Island’s more recent reduction in size appears to be directly related to the changing Lake Erie water levels and corresponding Niagara River flows. In 1986, U.S. Army Corps of Engineers (USACE) data indicates that both water levels and average flows had reached their historical peak. As a result of sustained high flows, wave action, and overtopping, potentially including ice action at different levels, Frog Island likely experienced significant erosion.
Review of Existing Habitats
A review of 12 nearby established habitats was conducted to help formulate design criteria that could be used as guidelines to create new habitat. This includes effects due to water levels, ice loading, wave action, wind, water quality, sunlight, etc. Several key trends were identified, including 1.) established emergent wetland habitat is only located in well protected areas and low energy environments, 2.) SAV may establish in higher energy areas, but needs to be protected from ice scour, and wave action (i.e. sufficient depth), and 3.) areas of shorter fetch / greater protection are able to support healthy SAV and emergent habitats.

FROG ISLAND DESIGN REPORT
©Copyright 2010. New York Power Authority. All Rights Reserved ES- 2
Design Requirements and Objectives
A number of specific objectives for the Frog Island HIP were identified through a series of collaborative discussions with the Ecological Standing Committee (ESC) and its members and these have been used to shape the design and approaches to the HIP. In summary, these objectives are to:
• Create a HIP that meets NYPA’s responsibilities under the FERC license for the Niagara Power Project and Settlement Agreement
• Be cost effective, maximizing total area improved with the available funds
• Balance the need for long-term structural integrity (i.e., a robust design), natural variability in habitat (i.e., seasonal changes and/or gradual transition over time), and aesthetics
• Create both submergent habitat (approx. 2-6 ft deep) and deep emergent wetland habitat (approx. 2 ft deep)
• Enhance habitat diversity, minimize adverse affects on nearby habitats or sensitive species, and minimize the establishment of non-native, invasive vegetation and woody vegetation
Engineering Design
The Frog Island area is subjected to a number of wind, wave, ice, and water level forces that need to be considered in any design scenario.
A local wind analysis shows that the highest average and peak hourly winds come from the southwest (225 degrees); however, high winds typically occur in a slightly broader range at an angle of 220 to 250 degrees relative to the Frog Island area. These directions correspond to the broadest fetch for the Frog Island area, a distance of approximately 1.25 miles, and could influence the formation of wind-driven waves. Additionally, estimates based on local wind records indicate that the highest typical and peak wind speeds one could expect to see over a 50-year period are 50 mph and 60 mph, respectively. Wind speeds over a 1-year period were only slightly lower, at 43 mph for typical speeds and at 54 mph for peak gusts.
A wave condition analysis indicates that dominant wave-approach fetch to the Frog Island area is 1.25-miles wide and consists of deeper water extending from the Canadian shore that gets shallower as the waves approach the Frog Island area. Using the wind, fetch, and depth data, a series of wave-height sensitivity analyses indicate that mean wave heights, measured from trough to crest, reach up to 2.6 ft under peak wind gust speeds of 60 mph. Since this is a total wave height, actual distance above a still water elevation is half the height, which would equate to 1.3 ft above the water surface elevation and does not include wave runup height.
Using this information, evaluation of wave runup and transmission across breakwaters, was used to help define the dimensions needed for two different breakwater options, a low-crested approach that is wider but less prominent and a high-crested approach that was narrower and more robust. The analysis indicates that low-crested breakwaters would need a reef breadth

FROG ISLAND DESIGN REPORT
©Copyright 2010. New York Power Authority. All Rights Reserved ES- 3
of approximately 30 feet, with a crest at approximately El. 567.0 ft in order to protect leeward areas from waves and ice loading over a range of water levels. This type of low-crested breakwater would need to be located on the western side of the HIP to limit wave energy generated by the long fetch. Additional protection against ice loading on the head of the island could be addressed with larger boulders. For the high-crested breakwater, wave runup heights of approximately 3.0 to 4.5 feet were estimated, which would require a breakwater crest elevation of El. 569.5 ft to El. 571.0 ft to prevent overtopping at normal pool.
Based on previous water level analysis (NYPA, 2005), normal water level (50% exceedence) is El. 566.5 ft, but there are minor daily, seasonal, and also long-term fluctuations. Storm surges have resulted in an historic high water level of El. 570.3 ft, representing a 4-foot increase over normal water surface elevations at the proposed Frog Island. Historical water levels and flows in the river were noted in the mid-1930s and mid-1960s, with the highest flows observed from approximately 1970 to the mid-1980s. Current water levels are somewhat lower, and are close to the long-term average level. Water levels have changed over time, and future changes would likely affect the design of the new Frog Island HIP. To accommodate changes in water levels, the designs should not rely solely upon specific, contemporary, elevations in anticipation of static water levels. Rather, designs should utilize features that would allow vegetation to respond over time to changes in water levels.
Computer modeling was used to help identify and evaluate potential hydraulic affects associated with the proposed instream habitat modifications. Analysis was performed using preliminary designs for the Frog Island HIP and was coordinated with Dr. Hung Tao Shen of Clarkson University, Potsdam, NY, using his 2-dimensional DynaRICE model. The results of nine scenarios, for both the existing and proposed conditions, indicate that there is little to no impact on the open water levels due to the construction of the Frog Island HIP. The model was also used to predict the potential for ice jamming in the river, as well as the effect of ice loading on the HIP. The model indicated that the construction of the HIP at the Frog Island site is not likely to increase the probability that an ice jam would form in this part of the Niagara River. The Ice model results also show that ice thickness under high-wind conditions may reach 2-3 feet at the upstream head and southeastern edge of the proposed Frog Island, which would result in ice loading forces of 47 pounds per linear foot for compressive force during peak storm events, and 75 pounds per square foot of shear stress. The potential for ice runup was evaluated, and under these conditions, there is less than half the force needed to push ice over a breakwater at normal water levels; to have ice overtopping would require a minimum of approximately 100-200 lb/ft of force on a sloped embankment.
Soil borings and shallow test pits indicate that the soil profile at the project location is generally described as silty sand, or sandy silt with trace gravel, with very little organic and clay materials. Placement of foundation and breakwater materials, as well as the redistribution of sediment to create habitat features, has the potential to compress and displace water from within the underling riverine substrate material. Considering that substrate in the “bare spot” location may have been compressed by previously placed fill material (subsequently removed during gravel mining activities), no more than 1-foot of settlement is expected with the HIP, largely during construction, and will be accounted for in the design. Rock filled marine mattress

FROG ISLAND DESIGN REPORT
©Copyright 2010. New York Power Authority. All Rights Reserved ES- 4
systems may be used to establish the breakwater foundations, with larger stones placed on top of these mats.
In order to create and maintain the desired deep emergent and SAV habitat, the outside edges of the improvement area will need to be protected with breakwaters. The structures need to be designed to help prevent wave action and reduce ice damage and scour, yet allow water to flow through to the interior habitat to enable the dynamic exchange of water and nutrients. The western side of the HIP would be subjected to the greatest forces from wind and wave conditions while the head of the island would be subjected to the greatest ice loading forces. Regardless of either high or low-crest approach, the breakwaters (both inside and outside faces) will need to be layered with armor stone to protect the smaller-diameter stone making up the core of the breakwater. This stone armor needs to have a mean diameter of 15-18 inches to protect against both wave and ice action.
Surveys of wetlands were completed at a number of locations along the Upper Niagara River in 2007 to help identify reference wetland conditions for the HIPs. These surveys were then used to develop recommended elevation ranges and planting zones for vegetation community types at Frog, Motor, and Strawberry Islands (NYPA. 2009). Recommended elevation ranges were developed for wet meadow (≥ El. 566.2 ft), shallow emergent (El. 565.2-566.2 ft), deep emergent (El. 564.0-565.2 ft), and SAV (≤El. 564.0 ft) habitat, of which, the latter two habitat types will be emphasized in the Frog Island HIP. The data used to develop these elevation ranges and planting zones are based on relatively current, and observed, water levels, however there are long-term fluctuations in water levels that could result in a shift in plant zone elevations as the plant communities respond to different “wetness” conditions. Therefore, to minimize the effects of such shifts, designs should incorporate sloped transition zones, rather than specific elevations for a single habitat type.
Risk Analysis
The Frog Island area is located in a dynamic river environment, which is subject to rapid and dramatic changes to water levels due to storm surges on Lake Erie, as well as long-term changes in both flow and water levels. There are two hazards associated with wave action at the proposed Frog Island: 1.) damage to the exterior rock armor from unit movements and dislocations, either from wave runup, or rundown, and 2.) overtopping waves plunging into the island interior, disrupting habitat, damaging sensitive wetland soils, or damaging SAV. The crest of the high-breakwaters would be approximately El. 569.0 ft, which will likely be overtopped by still-water levels on an annual basis. The crest of the low-breakwaters would be approximately El. 567.0 ft, with the crest about 0.5 ft above normal pool elevation and the breadth of the breakwater approximately 30-feet wide to achieve comparable protection to the higher breakwaters. Under high-water conditions for both approaches, where waves are more likely to enter the protected interior, the depths over the interior habitat will also be greater, which help to reduce damaging wave action since they would be less likely to contact the bottom features.
The ice model results show significant buildup of ice on the leading upstream edges of islands, including the proposed Frog Island, as ice movement is driven more by currents than

FROG ISLAND DESIGN REPORT
©Copyright 2010. New York Power Authority. All Rights Reserved ES- 5
wind and wave action. Ice thickness may reach 2 to 3 feet, and currents may push ice into the island interior if the breakwater is not of sufficient height.
The islands, shorelines, wetlands, and SAV habitat in the Upper Niagara are dynamic and have dramatically changed over time with regard to their footprints and biological and physical characteristics. These changes are in response to a disturbance regime that involves both natural and anthropogenic forces. The current design approaches should try to reproduce the function of naturally occurring reference conditions, which can be accomplished through the use of “hard” features such as rock breakwaters and geotechnical mattresses, combined with “softer” sloped vegetative surfaces to enable transitions in plant communities. These techniques should be supplemented with aggressive planting plans to speed initial establishment and stabilization of the site.
To be sustainable, the HIP will be required and expected to be able to respond to both seasonal variability and changes in long-term trends. To this end, we expect that forces such as ice, water levels, and waves will result in year-to-year changes in the vegetative community, with some subtle and some more dramatic. Such year-to-year changes are part of the HIP’s design criteria, and are even desirable in as much as they mimic both the temporal and spatial habitat diversity found in nature.
Conclusions
Improving new habitat at the proposed Frog Island requires detailed civil engineering design, involved ecological assessments, hydrologic and hydraulic engineering, and a bit of art, all working in concert together. Several different approaches are available to try to create the objective habitats, but regardless of approach, the HIP needs to address significant risk issues, achieve the set goals, be sustainable, not require excessive maintenance, and be constructible without damaging existing habitats. The information and approaches outlined in this report will be used to develop appropriate designs that will give the riverine wetland complex the best chances of successful initial establishment.

FROG ISLAND DESIGN REPORT
©Copyright 2010. New York Power Authority. All Rights Reserved 1-1
1.0 INTRODUCTION
The New York Power Authority (NYPA) is in the process of completing a series of
habitat improvement projects in the Upper Niagara River, which are required in concert with
the relicensing of the Niagara Power Project by the Federal Energy Regulatory Commission
(FERC). One of the habitat projects is the re-creation and establishment of emergent marsh
and submerged aquatic vegetation (SAV) habitat between the existing Motor and Strawberry
Islands. This area, heretofore referred to as Frog Island, is currently a shallow shoal that is
devoid of emergent vegetation or SAV, and is located within the larger Strawberry Island –
Motor Island Shallows, an area designated by the NY Department of State as a Significant
Coastal Fish and Wildlife Habitat (Figure 1). Improvements could include building the
substrate up in a portion of this area, stabilizing and protecting the project from wave and ice
action, and promoting the growth of emergent vegetation and SAV.
The goals of this design report are twofold. First, the report will summarize existing
knowledge of the Frog Island area, which will provide insight into the environmental forces
and human activities that have shaped this part of the river, as well as provide information on
historical conditions that may be used as a template or reference conditions for the habitat
improvement effort. Second, the report will summarize engineering analyses, approaches,
and data for the development of the Frog Island Habitat Improvement Project (HIP). This
report will outline various approaches and document the process used to arrive at certain
conclusions. The design of Frog Island is still in the early stages and additional information
obtained in the future, or different design approaches/goals, may affect the information
contained in this document.

Figure 1
Y:\GISMaps\MPerot\Frog_Island_Location_Figure-1.mxd 1/21/2010 2:14:17 PM
Frog IslandHabitat Improvement Project
Proposed Project Location
Niagara RiverErie County, NY
Wheatfield
AmherstGrand Island
Niagara Falls
1 inch = 1,000 feet0 500 1,000250
Feet
³Proposed Frog Island Habitat Improment Project
Motor Island
Strawberry Island
Beaver Island State Park

FROG ISLAND DESIGN REPORT
©Copyright 2010. New York Power Authority. All Rights Reserved 2-3
2.0 HISTORY OF FROG ISLAND
The following represents what appears to be the best available information
concerning the history and morphology of Frog Island in the Upper Niagara River, a small
shoal area that was formerly an island located in the Tonawanda Channel between
Strawberry Island and Motor Island in Erie County, NY. As noted by EDI (1998), the
formation of the modern Niagara River channel began after the final retreat of the Last
Wisconsin ice sheet, and at this time Strawberry Island was formed when sediments were
deposited in this part of the river. The formation/creation of this complex of islands that
includes Frog Island and its history is not exhaustively documented, but the following
narrative, and Table 1, summarizes what is currently known. Supporting maps and aerial
photographs are located in Appendix A.
Human activities in this part of the river have alternated between periods of extensive
dredge spoil disposal (1815-1910) and gravel mining (1912-1953), which have substantially
altered the shape, size, and number of islands in this complex. Names of the islands have
also changed over time, and we have used those shown on the U.S. Geological Survey
(USGS) 7.5-minute topographic maps from both 1948 and 1995, with Strawberry Island
upstream, Motor Island downstream, and the unnamed shoal area just upstream of Motor
Island referred to as Frog Island. According to a review of the historical map and aerial
photography record, an island in the area referred to as Frog Island was first indicated in the
1927 aerial photograph. Historical maps prior to 1870 do not indicate a feature at the
location of Frog Island, although mapping standards and accuracy at that time may have
precluded documenting small islands or wetland areas in the middle of the River. Frog
Island reached its largest size around 1938, with an area of approximately 4 acres. By 1951,
the island’s area was greatly reduced, and by 1985, it is no longer visible in aerial
photographs.
Several factors have likely contributed to the disappearance of Frog Island. For
example, gravel mining activities up until 1953 at the adjacent Strawberry Island may have
extended into the Frog Island area, and resulted in the removal of substrate.

FROG ISLAND DESIGN REPORT
©Copyright 2010. New York Power Authority. All Rights Reserved 2-4
Another, less obvious factor influencing the size of the island are the relative water
levels in the river during the point in time at which the size of the island was measured. For
example, aerial photographs may have been taken during either a low-flow period, where
lower water levels may have exposed a greater area of island and surrounding substrate, or
during a higher flow period that submerged a greater area. Although it is difficult to
determine actual water surface elevations at the time aerial photographs were taken, long-
term annual flow records indicate that 1927 and 1938 photographs showing the largest island
area coincide with lower-flow periods, and conversely, the 1951, 1966 and 1978 photos
coincide with higher water levels and reduced island area.
Finally, and perhaps most significantly, much of Frog Island’s more recent reduction
in size appears to be directly related to the changing Lake Erie water levels and
corresponding Niagara River flows. In 1986, U.S. Army Corps of Engineers (USACE) data
indicates that both water levels in Lake Erie and average flows in the Niagara River had
reached their historical peak. As a result of sustained high flows, wave action, overtopping,
and ice scour, Frog Island likely experienced significant erosion. These erosive forces acted
on the island mass at a time when its crest was located at or near the water surface, rather
than substantially above or below the interface, where waves and ice could more effectively
act to erode the top of the island.

FROG ISLAND DESIGN REPORT
©Copyright 2010. New York Power Authority. All Rights Reserved 2-5
TABLE 1. TIMELINE OF EVENTS AND CONDITIONS AT FROG ISLAND AND SURROUNDING VICINITY
Date Description Source Notes 12,300 yrs before present
Final retreat of Last Wisconsin ice sheet forms modern river channel; Strawberry Island formed by sediment deposition
Buehler and Calkin, 1982, in EDI, 1998 and Sault et al., 1997
1750 Earliest records indicate that settlers referred to island as Strawberry Island
Sault et al., 1997 Origin of name is unclear; perhaps because strawberries grew on island
1814 Strawberry Island used by British to stage 1814 siege on Buffalo
Sault et al., 1997
1815 Strawberry Island, Motor Island, and Grand Island purchased from Seneca Indians for $11,000; Surveyor General of New York listed Strawberry Island as a 100 acre parcel with a value of $100
Sault et al., 1997
1819 Strawberry Island grew to 138 acres due to deposition of sand, gravel, and rock excavated during construction of the Erie and Barge Canal
Sault et al., 1997
1822 Single large island in the area of Strawberry Island Map dated 1822 No discrete feature indicated in area of current Frog or Motor Islands
1873 Two large islands shown: one labeled as Strawberry island stretching from tip of Grand Island upstream to about the exit of the Black Rock Harbor, second labeled as Frog Island located in vicinity of current Motor Island
1873 International Bridge, Plan of Location Map
Several smaller islands shown in vicinity of current Frog Island, and upstream from Strawberry Island
1882 A two-story hotel built on Strawberry Island Sault et al., 1997 Included 11 acre grove of trees and canal dug through island so that ladies could enjoy the river without the swift currents
ca 1892 Hotel on Strawberry Island fell into disrepair due to popularity of larger resorts on Grand Island
Sault et al., 1997

FROG ISLAND DESIGN REPORT
©Copyright 2010. New York Power Authority. All Rights Reserved 2-6
Date Description Source Notes 1908 Strawberry Island increased in size again as excavated
material from the construction of the Black Rock Lock was placed around its periphery
Sault et al., 1997
1910 Strawberry Island somewhat reduced in size vs. 1873 map; Motor Island present with irregular shoreline and labeled as Frog Island
USGS 1910 Topo map No discrete feature indicated in area of current Frog Island
1910 Anecdotal report that the USACE began placing fill from construction of Black Rock Lock a short distance upstream of Strawberry Island.
1912 Strawberry Island, now 205 acres, sold to Border Island Gravel Company
Sault et al., 1997; Spierto et al., 2003; EDI, 1998
USACE canceled the mining permits shortly afterwards
1926 Strawberry Island reduced by 100 acres on south side by dredging
EDI, 1998
1927 Frog Island present (approx 3-4 ac) Excavation of Strawberry Island clearly evident in shape and size; Motor Island has current angular shape
Erie County aerial photo First observation of a discrete feature at current location of Frog Island
1932 Oblique aerial photo shows a portion of Frog Island area and exposed vegetation/substrate
http://www.isledegrande.com/giimages15/gi1932b+w--.jpg
1938 Aerial photo shows Frog Island at its largest point in photo history (approximately 4 ac). Image quality makes it difficult to distinguish between upland and what might be exposed substrate or vegetation
Aerial photo Water levels in Frog Island area were 1-2 feet lower than 1951, with the lowest levels ever recorded around 1934. Shallow relief around low-lying islands exposed.
1938-1941
Dredging resumed on the northwest side of Strawberry Island
Sault et al., 1997
1948 Strawberry Island reduced to 36 acres
Sault et al., 1997

FROG ISLAND DESIGN REPORT
©Copyright 2010. New York Power Authority. All Rights Reserved 2-7
Date Description Source Notes 1948 Strawberry Island approximately half that of 1910, open
water downstream in horseshoe shape, open water upstream in lagoon-like opening; Motor Island present and labeled as Motor Island
USGS Topo map Frog Island may be present as indicated by wetland symbol
1949 USACE halted dredging beyond 100 feet of Strawberry island over concerns about changes in flow and water quality; dredging later resumed, but was restricted to center of Strawberry Island
EDI, 1998; Sault et al., 1997
1950 Strawberry Island reduced to about 25 acres, with large lagoon in center of island
Sault et al., 1997 Dredging accentuated the horseshoe shape of island
1951 Aerial photos show Frog Island has almost disappeared; two separate high points shown
Aerial photo Mid to high water period, potentially submerging shallows.
1953 Buffalo Gravel Company sold Strawberry Island to Town of Tonawanda
Sault et al., 1997 Island to be used as a staging area for construction and maintenance of new water intake to be located off the shore of the island
1966 Aerial photo of Frog Island shows little change since 1951 Aerial photo 1966 water levels were slightly lower than 1951.
1966 to 1978
Aerial photos show little change at Frog Island Aerial photo Water levels continue to be several feet higher from approx. 1966 forward
1977 Navigation Chart shows Frog Island as semi-kidney shaped, similar in footprint to 1966 aerial. Motor Island labeled as such
National Oceanographic and Atmospheric Administration (NOAA) Navigation Chart
1978 Aerial photo shows conditions similar to 1977 Navigation Chart
Aerial photo Difficult to discern exposed substrate from surrounding submerged features

FROG ISLAND DESIGN REPORT
©Copyright 2010. New York Power Authority. All Rights Reserved 2-8
Date Description Source Notes 1981 Navigation Chart with few, if any, changes from 1977
version. Motor Island labeled as such NOAA Navigation Chart
May not have updated base map features since 1977
1985 Frog Island no longer visible above water in aerial photo Aerial photo Poor image quality; Highest water period on record.
1989 Strawberry Island transferred to New York State Office of Parks, Restoration, and Historic Preservation (NYSOPRHP)
Sault et al., 1997
1992 Navigation Chart showing only shoal area in vicinity of Frog Island. Motor Island labeled as Pirates Island
NOAA Navigation Chart
Base map for navigation charts updated since 1981
1992 Severe fall storms resulted in accelerated erosion along southwest shoreline of Strawberry Island; river currents in December broke through the narrow spit, entering lagoon at Strawberry Island
Sault et al., 1997
1993 Breach at Strawberry Island was more than 50 feet wide and several feet deep, and split the island in two; breach repaired by alliance of local businessmen and government agencies (Phase I restoration)
Sault et al., 1997
1995 Aerial photo does not show exposed substrate at Frog Island
Aerial photo
1995 Navigation Chart with few, if any, changes from 1992 version. Motor Island labeled as Pirates Island
NOAA Navigation Chart
May not have updated base map features since 1992
1996 New York State Department of Transportation (NYSDOT) provides some shoreline armoring and conservation plantings at Strawberry Island (Phase II)
Spierto et al., 2003
1998 NYSDEC purchases Frog Island, later known as Motor Island, and lands upstream from The Nature Conservancy
NYSDEC Deed for Motor Island
2001 Strawberry Island Phase III Erosion Control and Wetland Habitat Restoration project completed in June
Spierto et al., 2003
Present (2005)
Aerial photos do not show exposed substrate at Frog Island
NY GIS aerial

FROG ISLAND DESIGN REPORT
©Copyright 2010. New York Power Authority. All Rights Reserved 3-1
3.0 REVIEW OF EXISTING HABITATS
When attempting to re-create and develop new habitats, the best indicator of a
successful approach is to mimic established habitats near the proposed improvement site. A
review of nearby established habitats allows the formulation of design criteria which may be
used as guidelines to create new habitat that will ideally function in a similar manner. This
includes effects due to water levels, ice loading, wave action, wind, water quality, sunlight,
etc. Several key habitat locations have been inspected and surveyed in the Upper Niagara
River; Table 2 outlines some of the key components of these habitats and their differences,
which may be considered in the design of potential habitat improvements at Frog Island.
Elevations used in this report correspond to the U.S. Lake Surface 1935 (USLS 35), a
common vertical datum used by NYPA for the NPP (USLS 35 = IGLD 1985 + 1.20 feet).

FROG ISLAND DESIGN REPORT
©Copyright 2010. New York Power Authority. All Rights Reserved 3-2
TABLE 2. EXISTING NIAGARA RIVER HABITAT EVALUATIONS
Location Habitat
Type Fetch/Depths Breakwater Vegetation Additional Notes East River Marsh
Emergent Wetlands & Uplands
2,100 ft at 60 degrees (NE) but not dominant wind direction, with deep fetch.
Riprap 2 ft above NWL (normal water level)*
Phragmites on shoreline only; created marshlands behind breakwaters dominated by natives
Emergent wetlands dominated by native species in protected area behind constructed breakwaters
Strawberry Island (West Arm)
Emergent Wetlands
2.2 mi at 270 degrees (W) or 0.5 mi at 230 degrees (SW), deep fetch but shallow west of western arm 300-600 ft
Riprap 2-2.5ft above NWL, 10 feet wide.
Phragmites has established, especially along the higher wetland elevations along the breakwaters.
Back side of breakwater has well established vegetation, but limited to no vegetation at depths >15 inches.
L. Beaver Island (Interior)
Emergent Wetlands
Limited to no fetch; protected behind Island
Little Beaver Island acts as breakwater for interior wetlands
Mostly desirable native emergent marsh vegetation
Very low energy environment, low velocities and protected from ice, waves and currents.
L. Beaver Island (Outside)
Emergent Wetlands
0.9 mi from South Shallow shoal offshore
Mostly desirable native emergent marsh vegetation
Exposed, but well protected by shallow shoal
Black Rock Canal
Emergent Wetlands (at SAV Depths)
Fetch across length of Lake Erie; deep water >4ft
Sheltered by wide (~300ft) shoal and inside a bend of the 8ft high canal wall
Vegetation dominated by dense stand of invasive cattail Typha x
Deep water (>4ft); corresponds to SAV zone depths
glauca, which is only emergent species that can grow in traditional SAV zone depths.

FROG ISLAND DESIGN REPORT
©Copyright 2010. New York Power Authority. All Rights Reserved 3-3
Location Habitat
Type Fetch/Depths Breakwater Vegetation Additional Notes Grass Island
Emergent Wetlands
Short northerly fetch protected by Grand Island; deep water >4ft
Grand Island acts as breakwater for southerly winds; currents directed towards opposite side of River
Vegetation dominated by dense stand of invasive cattail sp. (Typha x
Deep water (>4ft); corresponds to SAV zone depths
glauca), which is only emergent species that can grow in traditional SAV zone depths.
Gratwick Park
SAV / Bare 0.75 mi at 180 degrees (S), deep fetch
Low profile narrow riprap, immediately deep habitat on both sides
Limited to no SAV High-energy environment, breakwaters regularly overtopped, high flushing rate, generally too deep for emergent vegetation.
Buckhorn Marsh
Emergent Wetlands
No fetch exposure; some exposure to ice and boat wakes along extreme western edge of marsh which also has some erosion.
Protected wetland habitat in Island Interior
Native bulrush and sedges on western edge; cattail and Phragmites mixed with native sedges and rushes in interior
Very low energy environment, low velocities and protected from ice, waves and currents except along western shoreline.
Cherry Farm
Emergent Wetlands
Short northerly fetch protected by Grand Island; deep water >4ft
Grand Island acts as breakwater for southerly winds; currents directed towards opposite side of River
Vegetation dominated by dense stand of invasive cattail sp. (Typha x
Deep water (>4ft); corresponds to SAV zone depths
glauca), the only emergent species that can grow in traditional SAV zone depths.
FROG ISLAND DESIGN REPORT
©Copyright 2010. New York Power Authority. All Rights Reserved 3-4
Location Habitat
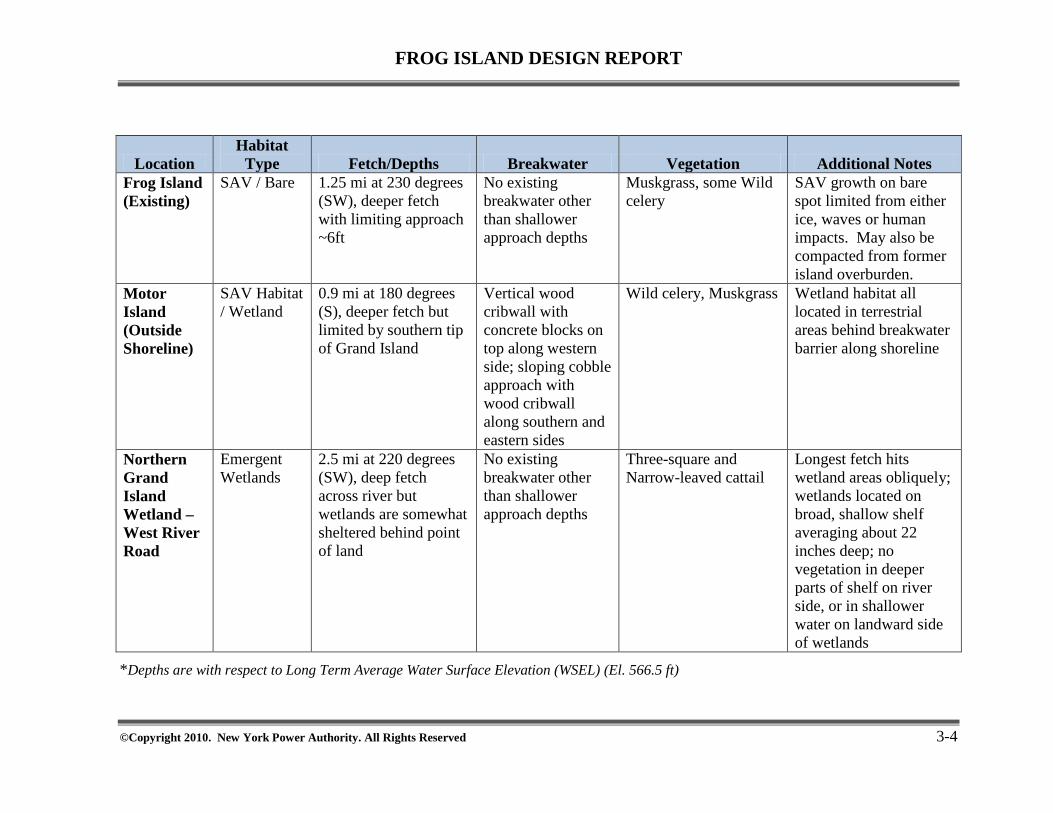
Type Fetch/Depths Breakwater Vegetation Additional Notes Frog Island (Existing)
SAV / Bare 1.25 mi at 230 degrees (SW), deeper fetch with limiting approach ~6ft
No existing breakwater other than shallower approach depths
Muskgrass, some Wild celery
SAV growth on bare spot limited from either ice, waves or human impacts. May also be compacted from former island overburden.
Motor Island (Outside Shoreline)
SAV Habitat / Wetland
0.9 mi at 180 degrees (S), deeper fetch but limited by southern tip of Grand Island
Vertical wood cribwall with concrete blocks on top along western side; sloping cobble approach with wood cribwall along southern and eastern sides
Wild celery, Muskgrass Wetland habitat all located in terrestrial areas behind breakwater barrier along shoreline
Northern Grand Island Wetland – West River Road
Emergent Wetlands
2.5 mi at 220 degrees (SW), deep fetch across river but wetlands are somewhat sheltered behind point of land
No existing breakwater other than shallower approach depths
Three-square and Narrow-leaved cattail
Longest fetch hits wetland areas obliquely; wetlands located on broad, shallow shelf averaging about 22 inches deep; no vegetation in deeper parts of shelf on river side, or in shallower water on landward side of wetlands
*Depths are with respect to Long Term Average Water Surface Elevation (WSEL) (El. 566.5 ft)

FROG ISLAND DESIGN REPORT
©Copyright 2010. New York Power Authority. All Rights Reserved 3-5
Several key trends may be identified in the above table with respect to habitat type,
location, and environment:
• Established emergent wetland habitat is only located in well protected areas
and low energy environments,
• SAV may establish in higher energy areas, but needs to be protected from ice
scour, and wave action (i.e. sufficient depth),
• Areas of shorter fetch / greater protection are able to support healthy SAV and
emergent habitats.

FROG ISLAND DESIGN REPORT
©Copyright 2010. New York Power Authority. All Rights Reserved 4-1
4.0 DESIGN REQUIREMENTS AND OBJECTIVES
A number of specific objectives for the Frog Island habitat improvement project were
identified through a series of collaborative discussions with the Ecological Standing
Committee (ESC) and its members and these have been used to shape the design and
approaches to the HIP. These objectives are:
• Create a HIP that meets NYPA’s responsibilities under the FERC license for the
Niagara Power Project and Settlement Agreement:
o NYPA will make a reasonable effort to design, build, and maintain a
sustainable island/wetland complex.
o This HIP is subject to several substantial risk factors, including risk to
structural stability of the breakwater and internal substrate, as well as the risk
of environmental conditions being too dynamic to enable the establishment, or
long-term sustainability, of the desired vegetation. These risks increase as the
robustness of the design decreases.
o To the degree obtainable, utilizing standard engineering practices:
Significant storm, wave, and ice events should be a significant
consideration in the HIP design.
The island is likely to be subject to changing environmental and
hydrologic forces over the next several decades. To the greatest extent
practical, this habitat improvement project will be designed to allow
change and maintain some desirable habitat. Monitoring will be
performed and future adjustments (e.g., cut, fill, plantings, etc.) may be
needed as part of an adaptive management process in response to changing
forces and biological utilization.

FROG ISLAND DESIGN REPORT
©Copyright 2010. New York Power Authority. All Rights Reserved 4-2
The island complex will be designed to withstand the modeled normal
average ice flow conditions as documented in work by Dr. Shen (Clarkson
University) utilizing 40-years of data.
o While the HIP goes through an initial stabilization period, minor maintenance
activities, such as replacement of dead plants, control of exotic invasive
species, and minor repairs to breakwater structures, are anticipated. After that
initial period, some adaptive management adjustments may be needed,
approximately 5 to 10 years after construction. After that time, periodic
routine maintenance of breakwater structures may be required.
• The improvements should enhance habitat transition zones and species diversity,
and minimize adverse affects on nearby habitats or sensitive species. This
includes incorporating design elements that could minimize the establishment of
non-native, invasive vegetation and woody vegetation.
• The design must be cost effective, maximizing total area improved with the
available funds.
• Designs will attempt to reach a balance between the need for long-term structural
integrity (i.e., a robust design), natural variability in habitat (i.e., seasonal changes
and/or gradual transition over time), and aesthetics with the following
characteristics:
o Low Profile – Minimize the height and exposure of breakwaters
o Flow Through / Flushing – allow for flow through, over, or around the area of
habitat
o Integrity – maintain structure and habitat integrity with minimal annual and
long-term maintenance required.
• Create submergent habitat zone (approx. 2-6 ft deep, based on current annual
average depths). Target species are:

FROG ISLAND DESIGN REPORT
©Copyright 2010. New York Power Authority. All Rights Reserved 4-3
o Wild celery, sago pondweed and other native species of submerged aquatic
plants found in the area currently, or were historically present (e.g., 1928
botanical survey)
o Centrarchids, esocids, and cyprinids
o Waterbirds
• Create deep emergent habitat zone (approx. 2 ft deep, based on annual average
depths). Target species are:
o Bulrush and other native historical emergent wetland species
o Waterbirds, crayfish, mink, turtles, otter, water snakes and other animals
o Centrarchids, esocids, and cyprinids
• Design habitat elevations to the recent record of surveyed species, which have
adapted to the current hydrologic conditions (i.e., flows, water levels).

FROG ISLAND DESIGN REPORT
©Copyright 2010. New York Power Authority. All Rights Reserved 5-1
5.0 ENGINEERING DESIGN
This section outlines the various considerations involved in the engineering design of
Frog Island to date, and how these considerations may affect the layout and sustainability of
the project. Further details, references, and calculations are available with respect to much of
the information listed below and are available for review.
5.1 Hydrology and Wave Environment in the Frog Island Area
Frog Island is subjected to a number of wind, wave, and water level forces that need
to be considered in any design scenario. As wind moves over broad expanses of water
without obstruction (i.e., fetch), it causes waves to form, and therefore wind characteristics
are a key component in determining the frequency, direction, and magnitude of wave action
against the shoreline. In turn, wave action against a shoreline is influenced by a number of
factors including, water depths, wave direction, and shoreline slope and height. Changes in
water levels, whether in response to storms, seasonal patterns, or long-term trends, also
influence shoreline condition and available habitat. The following sections analyze the
hydrology and wave environment at the Frog Island location.
5.1.1 Wind Analysis
A local wind analysis was completed using historic 2-minute wind records for the
Greater Buffalo International Airport, starting in 1948, up through 2007. The airport is
located approximately 10-miles to the east of Frog Island. This data was reviewed to
determine the average direction and magnitude of winds, along with the peak winds for each
direction. The 2-minute winds are readings taken by hand (until approximately 1996 when
Automated Surface Observation System [ASOS] was installed) by averaging the wind
readings for 2 minutes at the top of every hour. In essence, it represents a statistical sample
of the hourly winds; although the data may represent the average hourly wind if there is not a
significant variation between abutting observations. The data does not represent the highest
winds during each hour, but is rather a systematic sample of the wind speeds.

FROG ISLAND DESIGN REPORT
©Copyright 2010. New York Power Authority. All Rights Reserved 5-2
The 2-minute wind record data is summarized in a wind rose below, which shows that
the highest average and peak hourly winds come from the southwest (225 degrees); however,
the wind rose also shows that overall, high winds typically occur in a slightly broader range
at an angle of 220 to 250 degrees relative to Frog Island (Figure 2). These directions
correspond to the broadest fetch for Frog Island, a distance of approximately 1.25 miles
(Figure 1).
Additionally, statistics were compiled on this available period of record for both the
maximum 1-hour annual winds, and the maximum annual 2-minute readings.
FIGURE 2. AVERAGE AND PEAK WIND SPEEDS BY DIRECTION
0
10
20
30
40
50
60
700
10 2023
3040
45
50
60
68
70
80
90
100
110
113
120
130
135
140150
158160170
180190200
203210
220
225
230
240
248
250
260
270
280
290
293
300
310
315
320330
338340 350
Wind Speeds by Direction of Source (Degrees)
Average Wind Speed (MPH)
Max Wind Speed (MPH)

FROG ISLAND DESIGN REPORT
©Copyright 2010. New York Power Authority. All Rights Reserved 5-3
Additionally, local wind records were evaluated to estimate the highest typical
sustained and peak wind speeds one could expect to see over a 1-year period as well as over a
50-year period. These estimates were calculated using statistics compiled on the available
period of record for both the maximum 1-hour annual winds, and the maximum annual 2-
minute readings (Table 3).
TABLE 3. STATISTICS OF WIND DATA (1948-2007)
1-Year Return 50-Year Return 1-Hr Wind1 43 mph 50 mph Peak Gust Wind2 54 mph 60 mph
Although the effects of wind is not expected to directly affect the shoreline and
erosional processes in this part of the river, winds can be a significant factor in the formation
of waves, which would be expected to have a considerable affect on shoreline and erosional
processes. As such, this information on wind speed and direction was used, as noted in the
following section, as a key input variable in the analysis of the effects of wind-driven waves
in this portion of the river.
5.1.2 Wave Height Analysis
As noted above, the length of unobstructed water (fetch) is a major factor in the
development of waves. The longest fetch, out of the southwest, is approximately 1.25 miles
and is long enough to influence the formation of waves under gust conditions, which could
develop short-term peak wave heights with increased wave runup (i.e., how high the breaking
waves push up against a beach), although this is not a typical or sustained condition.
The dominant wave-approach fetch to Frog Island consists of deeper water extending
from the Canadian shore that gets shallower as the waves approach Frog Island. Depths are
on the order of 6-9 ft for a majority of the approach, but decrease around the island to 3-6 ft.
1 Two-minute reading at top of hour, assumed representative of typical, sustained winds during hour. 2 Peak gust data is only available from 1996 to present, which represents a smaller record than the hourly 2-minute winds.

FROG ISLAND DESIGN REPORT
©Copyright 2010. New York Power Authority. All Rights Reserved 5-4
For the purposes of calculating wave development and wave height, deepwater wave
equations were utilized in this analysis, which presents a worst-case scenario.
Using the wind, fetch, and depth data, a series of wave-height sensitivity analyses
were completed (Appendix B). Table 4 summarizes the sustained wind speed and resulting
wave parameters. Wave heights are measured from trough to crest, and those in the table
represent the mean wave height for the approaching fetch under the given wind speeds. Thus
the wave crest above a still water level is half the wave height. It should be noted that these
heights do not include wave runup heights on shorelines.
TABLE 4. WAVE PROPERTIES AT VARIABLE WIND SPEEDS
Sustained Wind Speed
Mean Wave Height Wave Period(s)
40 mph 0.48m (1.6 ft) 2.0 50 mph 0.63m (2.1 ft) 2.2 60 mph 0.78m (2.6 ft) 2.4
5.1.3 Wave Runup Analysis
Waves generated offshore will eventually contact the shoreline, where the wave
energy is dissipated. There are several mechanisms of this energy dissipation, but one of the
most significant is wave runup, or the ‘pushing’ of flow up onto the shoreline, higher than the
wave’s original height. The height of this runup varies depending on the shore slope,
shoreline permeability, and material roughness. The process of runup and wave cresting was
evaluated to understand the transmission of energy beyond the breakwater (e.g., velocity, and
flow rate), which can then be utilized in the design process.
For the evaluation of wave runup and transmission across breakwaters, two different
breakwater options were utilized:
• Low-Crested Breakwater – this is a low-sloped breakwater which is at or even slightly
below normal water levels that breaks up wave energy before it can be transmitted into
the area protected by the breakwater. A requirement of this design approach is to have

FROG ISLAND DESIGN REPORT
©Copyright 2010. New York Power Authority. All Rights Reserved 5-5
sufficient breadth (distance from outside edge to interior) to dissipate the energy due to
the sustained shallow zone. These breakwaters require a more substantial footprint due to
their breadth and they allow wave energy to be transmitted across the breakwater at
higher water levels, potentially exposing the areas to be protected.
• High-Crested Breakwater
– A sloped breakwater that achieves a height many feet above
the water surface may also be used as a physical barrier to the entire wave front. The
height of this type of structure is used to dissipate the runup forces and prevent excessive
flow from passing over the breakwater. Although this approach does not require as large
a footprint as a low-crested breakwater, high-crested breakwaters are typically taller and
more massive than their low-crested counterparts. A high-crested structure would also be
more effective at preventing wave or ice damage at increased water levels.
Both of these options will allow some wave transmission through and over the
breakwater, but both can be designed so energy is dissipated sufficiently to prevent major
damage to the areas they are intended to protect. In particular, determination of wave runup
height is critical in the design of breakwaters to limit overtopping waves damaging the
protected leeward areas. The size of the rock needed for the breakwaters is dependent upon
the amount of the wave energy, rather than the actual runup height. As a special note, water
surface elevations in the vicinity of the island may vary considerably due to storm surges or
seiches, but it is expected that slightly deeper water depths needed for deep emergent and
SAV habitat behind the breakwaters should result in more protection from overtopping wave
action. This is a somewhat different situation than if the protected habitat behind the
breakwater is covered by just inches of depth (shallow emergent), where waves cresting over
a breakwater would have more energy and potential to damage the protected habitat through
scouring action. As such, normal water levels where the habitat has the shallowest covering
depth of water become the critical design level to prevent wave action.
The low-crested breakwater approach was evaluated using the EM 1110-2-1100 (Part
VI), Table VI-5-15, Wave Transmission Formula for Rock Armored Low-crested,
Submerged, and Reef Breakwaters (van der Meer and d'Angremond, 1991). This approach is
used for ‘reef’ type structures, where a percentage of the wave is transmitted into the interior.

FROG ISLAND DESIGN REPORT
©Copyright 2010. New York Power Authority. All Rights Reserved 5-6
Reduction of the transmission of waves can be accomplished by either providing a greater
height above the normal pool (freeboard), or by increasing the breadth of the reef.
Calculations were performed using the wave height values, and varying the dimensions of the
low profile breakwater. In order to minimize the transmission of waves (Ct, Coefficient of
Transmission < 10%), a breakwater breadth of 25-30 feet is recommended as calculated
using the water level and wave data.
Using the information from the above analysis, low-crested breakwaters in the
vicinity of Frog Island would need a reef breadth of approximately 30 feet, with a crest at
approximately El. 567.0 ft (0.5 ft above the long-term average water level), so they could
protect leeward areas from waves and ice loading. This type of low-crested breakwater
would need to be located on the western side of the HIP to limit wave energy generated by
the long fetch. Additional protection against ice loading on the head of the island could be
addressed with the addition of larger boulders.
If a traditional high-crested breakwater is utilized, the freeboard (distance between
water level and breakwater crest) is critical to reducing the transmission of waves into
protected leeward areas. To evaluate the runup potential of the significant wave height, the
USACE Coastal Hydraulics Laboratory Technical Note, Estimating Irregular Wave Runup
on Rough, Impermeable Slopes (USACE, 2005a), was utilized for calculations.
Using the high breakwater approach, a sensitivity analysis was completed to
determine a reasonable design for wave runup. The sensitivity variables include the slope of
breakwater (i.e., 2:1 to 4:1, in 1/2ft increments) and the sustained wind speed (i.e., 40, 50 and
60 mph). For the high-crested breakwater, the worst case conditions (highest runup) occur
with the steepest breakwater slopes, which result in a wave runup between 3.3-4.7 feet over
the range of wind speeds evaluated. At lower slopes, such as 3:1, the runup range is reduced
to 2.5-3.6 feet and is minimal at a 4:1 slope with runup heights of 2.1-3.0 feet. The higher
range of sustained wind speeds is quite rare according to the data reviewed, thus the design
should focus on the 40-50 mph sustained range if a high breakwater design approach was
used for the HIP. This range results in a wave runup height of approximately 3.0 to 4.5 feet;
with an average still-water level of El. 566.5 ft in the vicinity of Frog Island, this would

FROG ISLAND DESIGN REPORT
©Copyright 2010. New York Power Authority. All Rights Reserved 5-7
require a breakwater crest elevation of El. 569.5 ft to El. 571.0 ft to prevent overtopping at
normal pool.
If breakwater elevations are too low, it would likely result in more frequent, and
greater volumes, of overtopping flows entering the protected interior of the HIP, potentially
damaging more sensitive habitat. As a precaution, the design of protected areas within the
breakwaters should allow for some wave overtopping through the use of energy dissipation
zones on the backside of the breakwaters. These areas will likely be devoid of significant
growth of aquatic vegetation.
5.1.4 Water Level Analysis
Several studies have evaluated long-term water levels along the river, and increases in
stage and flow due to wind setup in Lake Erie. Historic records and seasonal/yearly statistics
are available for water levels along the river in a water level fluctuation study (NYPA, 2005).
For the purposes of this design, most of the river stage information was obtained from
both the Frenchman’s Creek gage, located slightly upstream from Frog Island on the
Canadian shore, and the Huntley gage, situated slightly downstream along the Tonawanda
Channel on the U.S. shore. Frog Island is located roughly equidistant from these two gages,
and data from NYPA (2005, 2009) were used to develop exceedence levels, or the percentage
of each year that water levels are above the listed elevation (Table 5).
TABLE 5. WATER LEVEL EXCEEDENCE FREQUENCIES
Exceedence Level3
Strawberry Island WSEL (ft)
L. Beaver/Motor Islands WSEL (ft)
10% 567.4 567.4 50% 566.5 566.4 90% 565.7 565.6
3 Period 1991-2002, Table 4.2.1, in NYPA, 2009

FROG ISLAND DESIGN REPORT
©Copyright 2010. New York Power Authority. All Rights Reserved 5-8
5.1.5 Daily Fluctuation Ranges
Water level gages along the Niagara River provide temporal water level (stage) data
that have been reviewed extensively (NYPA, 2005). Water levels in the vicinity of Frog
Island are influenced by two primary factors. Operation of the hydroelectric projects
downstream may result in relatively small fluctuations in water levels on a daily, or even
hourly basis. In contrast, wind setup and storms on Lake Erie can result in seiche events that
cause extreme water level fluctuations that range up to a few feet of water level change in the
Niagara River. Although less frequent than the water level regulation, these storm surge
events can cause substantial impacts. Additional review of the historical data indicates that
ice does not appear to be a significant factor in the largest daily water level fluctuations.
Using hourly water level data, Table 6 provides the annual and seasonal minimum,
maximum and average water level elevations at the Huntley gage from 1991 to 2002. The
average tourist season levels (i.e., April through October) are higher than either the average
non-tourist season (i.e., November through March) or average yearly water levels. This
seasonal difference in average hourly water levels is approximately 0.33 feet (4 inches), as
indicated by the Tourist/Non-Tourist Comparison, which reflects the naturally higher spring
and summer flows (NYPA, 2005).
TABLE 6. ANALYSIS OF WATER LEVEL AT HUNTLEY GAGE (NYPA, 2005)

FROG ISLAND DESIGN REPORT
©Copyright 2010. New York Power Authority. All Rights Reserved 5-9
5.1.6 Storm Surge Fluctuation Ranges
Recent water level data from 1991 to 2002 show storm surge fluctuations in the
vicinity of Frog Island from normal pool (approximate El.566.5 ft) up to El.570.3 ft4
5.1.7 Long-Term Fluctuations in Water Surface
. This
variation represents a 4-foot increase over normal water surface elevations (WSELs) in this
part of the river; during low-water periods, this represents a range of approximately 5.5 feet.
These surges are still-water increases and do not consider wave heights or additional runup.
It is anticipated that during extreme events, the entire Frog Island complex and breakwaters
will be submerged, as will be many low-lying points along the river.
A review of the data on the historic water levels of the Great Lakes assembled by the
USACE indicates that long-term fluctuation of the average water surface elevation of Lake
Erie are mirrored by those in the Niagara River (Figure 3). These water surface elevations
also correspond to the amount of flow in the river. Historically, lower flows were noted in
the mid-1930s and mid-1960s, and the highest flows were observed from approximately
1970 to the mid-1980s. Current water levels are somewhat lower now, and are close to the
long-term average level.
As evident in Figure 3, the range of annual average flows in the Niagara River varies
over time and such changes in the future would likely affect the design of the new Frog
Island HIP. To accommodate changes in water levels, the designs should not rely solely
upon specific, contemporary, elevations in anticipation of static water levels. Rather, designs
should anticipate water level changes and utilize features that would allow vegetation to
respond over time to changes in water levels (e.g., vegetation species would “march” up and
down a slope over time according to its preference/tolerance for water). Water levels at Frog
Island were calculated using the average flow rates in a calibrated 1-dimensional hydraulic
model of the Upper Niagara River.
4 Water Level Fluctuation Report (NYPA, 2005)

FROG ISLAND DESIGN REPORT
©Copyright 2010. New York Power Authority. All Rights Reserved 5-10
570.37
571.24
575.46
573.05
565.19 565.40
567.52 567.64
566.55
564
566
568
570
572
574
576
578
580
582
0
50,000
100,000
150,000
200,000
250,000
1900
1905
1910
1915
1920
1925
1930
1935
1940
1945
1950
1955
1960
1965
1970
1975
1980
1985
1990
1995
2000
2005
Lake
Eri
e St
age
USL
S35
(ft)
Rive
r Flo
w (c
fs)
Time (Year)
Historic Annual Niagara River Flows(Source USACE)
Annual Average
Lake Erie Stage
Frog Island StageFlow
Stage
FIGURE 3. HISTORIC ANNUAL FLOWS IN NIAGARA RIVER AS COMPARED TO WATER LEVELS IN LAKE ERIE AND NIAGARA RIVER

FROG ISLAND DESIGN REPORT
©Copyright 2010. New York Power Authority. All Rights Reserved 5-11
5.2 Open Water Hydraulic Model
Computer modeling was used to help identify and evaluate potential hydraulic affects
associated with the proposed instream habitat modifications. Analysis was performed using
preliminary designs for the Frog Island HIP and was coordinated with Dr. Hung Tao Shen of
Clarkson University, Potsdam, NY, using his DynaRICE model.
5.2.1 Model Description
Dr. Shen started developing the DynaRICE model in 1997, with many updates and
improvements since then (Shen and Liu, 2001; Ji, et al. 2004; Liu and Shen, 2003). His work
has resulted in a 2-dimensional open water and ice formation/loading model to evaluate ice
jamming, specifically on the Upper Niagara River. DynaRICE allows for the analysis of
both steady state and unsteady (flood hydrograph) conditions on the Niagara River. The
model domain extends from within Lake Erie, passes downstream towards Grand Island,
includes the Chippewa and Tonawanda Channels, Navy Pool, and terminates at the Falls.
The downstream boundaries include a rating curve at the falls, and fixed withdrawals at the
intakes for both the U.S. and Canadian hydropower facilities. The upstream boundary is
Lake Erie and uses a fixed (excluding seiches) water surface. Seiches may be developed on
Lake Erie for creating these storm surges, or flood hydrographs.
The model was divided into a ‘far field’ and a ‘near field’ hydraulic model. The far
field represents the bounds as defined above, whereas the near field solely represents the
vicinity around Frog Island. This near field model allows for a greater definition of geometry
and resolution of results around the HIP project. Bathymetric data, as collected from
numerous sources, has been utilized to create a single geometry representing the channels. In
addition, the geometry defining the channel in the HIP area was updated using more recent
bathymetric surveys. Bathymetry in the vicinity of Frog Island was then modified for the
proposed conditions based on the initial high crested breakwater design approach. Finally,
the same hydrologic conditions were run through the model to compare differences between
the existing and proposed conditions.

FROG ISLAND DESIGN REPORT
©Copyright 2010. New York Power Authority. All Rights Reserved 5-12
5.2.2 Model Scenarios
For the open water conditions model, nine different steady state flows were analyzed
in the DynaRICE model. These conditions evaluated flows from the long-term average, up
to the 100-year discharge, at a series of variable Chippewa-Grass Island pool levels. These
variable pool levels evaluate the boundary condition fluctuations present, and described in
NYPA (2005). Tables 7 and 8 outline the conditions used for the flows and stages in the
open water conditions.
TABLE 7. OPEN WATER FLOW RATES
Event Discharge
(cfs) Discharge
(cms) Long Term Average 204,600 5,794 5 Year 276,200 7,821 100 Year 317,900 9,002
cfs = cubic feet per second; cms = cubic meters per second
TABLE 8. OPEN WATER DOWNSTREAM BOUNDARY CONDITION
Water Level Condition
Elevation (ft)
Low 561.24 Long Term Average 562.75 High 564.22
5.2.3 Impacts to Water Levels
The results of all nine scenarios, for both the existing and proposed conditions,
indicate that there is no impact on the open water levels due to the construction of the Frog
Island HIP. The modeled geometry utilized the ‘worst-case’ scenario in terms of a large
island footprint extending over five-acres, which was the largest improvement scenario under
consideration. If improvements with smaller footprints for Frog Island were evaluated, they
would result in a smaller difference between existing conditions and that modeled as
described above, which was essentially no effect on water levels.

FROG ISLAND DESIGN REPORT
©Copyright 2010. New York Power Authority. All Rights Reserved 5-13
5.3 Ice Hydraulic Model
Ice in the Niagara River is a yearly occurrence, coming from Lake Erie as the lake ice
breaks up in the spring, and forming locally within shallower, calm sections of the river. The
ice can form floes and ice jams that can cause significant damage to in-river structures,
substrate, and habitat. In fact, one theory is that ice scour in the shallows around Frog Island
has increased the rate of erosion of the island and prevented the establishment of SAV.
Evidence of ice scaring is visible at the base of trees lining the upstream edges of Strawberry
Island and Motor Island, indicating that ice piles up against these shorelines, damaging
vegetation and working against the shoreline.
To better understand how the creation of Frog Island HIP would affect ice movement
down the river, the DynaRICE model was employed to examine the potential for forming
damaging ice jams and the potential effect of ice on the improvement project.
5.3.1 Ice Model Description
After running the open water scenarios described in Section 5.2, the ice conditions
module was run to evaluate the potential effects on the formation of ice jams in the river and
to check potential impacts from ice on the island structures. Both synthetic and significant
historic ice events were modeled and certain parameters were varied to evaluate the
sensitivity of the model to differing environmental conditions (Table 9). Baseline reference
conditions modeled in Case 1, were used to compare the proposed projects under different
environmental conditions in Cases 2 through 6. Additionally, for Cases 7 through 11, failure
of the ice boom on Lake Erie, which has been historically observed, was modeled to factor in
supplemental ice loading conditions.

FROG ISLAND DESIGN REPORT
©Copyright 2010. New York Power Authority. All Rights Reserved 5-14
TABLE 9. SUMMARY OF ICE MODEL SCENARIOS
Case
Parameters Remarks θ Va ha Hi Q d/s HNYPA σo
degree t
mph ft ft cfs ft hrs 1*
240
30 1 561.2 80,000 571.7 5 Reference case
2** R R 564.2 R R R Effect of water level at CGIP
3** 40 R R R R R Effect of wind velocity
4** R 1.5 R R R R Lake ice thickness effect
5** R R R R 573.7 R Effect of base water level at Lake Erie
6** R R R R R 10 Wind duration effect
7a* Case 1 with assumed partial boom failures a: Failure of spans I-M b: Failure of spans N-R
Boom failure conditions 7b*
8* Feb. 1975 event without assumed partial boom failures Historical events and
boom failure conditions 9a* Feb. 1975 event with a: Failure of spans I-M b: Failure of spans N-R 9b*
10* Jan. 1992 event without assumed partial boom failures Historical events and
boom failure conditions 11a* Jan. 1992 event with a: Failure of spans I-M b: Failure of spans N-R 11b*
* Cases simulated for both existing and proposed conditions. ** Cases simulated for the proposed condition with riverine HIPs. R = Reference base case θaV
= wind direction from north [degrees] a
h = wind velocity [mph]
iH
= thickness of the ice in Lake Erie [ft] d/s
Q = Water level at CGIP [ft, USLS 35]
NYPAH
= water withdrawals at the NYPA intakes [cfs] o
σ = water level at Lake Erie [ft, USLS 35]
t = wind duration [hrs].

FROG ISLAND DESIGN REPORT
©Copyright 2010. New York Power Authority. All Rights Reserved 5-15
5.3.2 Island Effects on Ice
Analysis of the reference and proposed condition ice model runs performed by Dr.
Shen indicate that the construction of the HIP at Frog Island would not increase the
probability that an ice jam would form in this part of the Niagara River. The model does
indicate that ice would collect on the leading upstream edge of the HIP at times, but the ice
would be easily shed into the main channel without affecting the potential for ice jamming.
5.3.3 Ice Thickness/Elevations
Ice model results show that ice thickness may reach 2-3 feet at the upstream head and
southeastern edge of Frog Island. This ice thickness loading corresponds to high wind
conditions; therefore, with water levels under these conditions between El. 568 ft to 569 ft,
the top of the ice would be expected at approximately El. 570 ft to 571 ft. Under these
circumstances, ice would ground out around El. 567 ft to 568 ft.
5.3.4 Ice Loading Forces
Ice forces could act against the HIP in two primary ways. First, normal ice loading is
related to compression force, in which the water pushes a mass of ice directly into or against
a structure. Second, shear stress occurs as the ice slides over the substrate or structure, and is
a function of both the weight of the ice and the force of the water pushing against the ice.
Calculation of peak normal ice loading against the edge of a breakwater surrounding the HIP
was calculated at 47 pounds per linear foot (lb/ft) during peak storm events5. Shear stress
estimates for ice at the head of the HIP are 75 pounds per square foot (lbs/ft2). Within the lee
of the breakwater, some ice loading and shear is expected, and is estimated to be on the order
of 35 lb/ft2
The potential for ice runup was evaluated at these normal forces
, but again, this is a rare occurrence associated with higher water levels.
6
5 Head of Frog Island, Ice Model Case 11b
. It was determined
that normal force at Frog Island is less than half that needed to push ice over a breakwater at
normal water levels; to have ice overtopping would require approximately 100-200 lb/ft of
force.
6 USACE (2006),Part VI, 5-278

FROG ISLAND DESIGN REPORT
©Copyright 2010. New York Power Authority. All Rights Reserved 5-16
The breakwaters are the primary means of protecting the HIP interior, but if ice does
get past the breakwater, the interior should be shaped and graded to allow the easy passage of
ice towards the downstream end.
5.4 Geotechnical Analysis
The Niagara River in the vicinity of the Frog Island HIP has experienced extensive
modification over the last 150 years as a result of the placement and removal of excavated
materials, as noted in Section 2. In order to build a sustainable improvement project, it is
necessary to understand the physical properties of the substrate upon which the HIP would be
constructed and analyze various foundation and substrate components of the design.
5.4.1 Soil Boring Data
In September 2007, several marine borings within the center and around the perimeter
of Frog Island were completed. Borings were completed to depths of 10-16 feet below
ground surface, and included split spoon samples, blow counts and descriptions of the soil
profile. Additionally, several sieve analyses were completed at various depths from these
borings. In general, the surface was described as both silty sand or sandy silt with trace
gravel, which extended several feet below grade. Lower in the boring profiles, the material
continued to vary between silt, sand and traces of gravel.
5.4.2 Field Test Pits
Hand-dug test pits and surface bed material samples have been collected during field
visits to the Frog Island area. Test pits completed while evaluating SAV habitat in 2007
showed a mix of silty sand, sand and course sand, corresponding well with the results of the
soil borings.
Additional investigations around Motor and Strawberry Islands have also shown a
similar mix of surface materials, consisting of sandy material interspersed with a few cobbles
and some gravel. Some large cobble-sized rocks were noted in the vicinity of the western
breakwaters of Strawberry Island, but these are likely displaced armor from the breakwater,
rather than native material.

FROG ISLAND DESIGN REPORT
©Copyright 2010. New York Power Authority. All Rights Reserved 5-17
5.4.3 Foundation Design
Soils beneath the proposed footprint of the Frog Island HIP consist mostly of sands,
with very little organic and clay materials, and the geotechnical properties of these materials
must be factored into the foundation design of the HIP. Placement of foundation and
breakwater materials, as well as the redistribution of sediment to create habitat features, has
the potential to compress and displace water from within the underling riverine substrate
material. However, given that the substrate in the “bare spot” location was likely compressed
by previously placed fill material (subsequently removed during gravel mining activities) and
that the amount of material proposed to be placed into the river as part of the HIP is less than
that removed during gravel mining, substantial settlement is not anticipated. In addition, a
geotechnical analysis of soil boring and other data indicates that less than 1-foot of settlement
is expected, with most anticipated to occur during construction of the HIP.
One of the goals of the HIP is to incorporate additional SAV habitat into the design,
which will require excavating material to increase depth in these habitat areas. The designs
should attempt to balance the cut and fill of materials, and material excavated from the SAV
areas could be used to build up the core of the breakwaters and provide a diversity of interior
depths.
Rock filled marine mattress systems may be used to establish the breakwater
foundations, with larger stones placed on top of these mats. Some settlement of the core
material should be expected immediately after the placement of the mattresses and large
rocks, and settlement may be on the order of 20% within a few days after placement.
Continued long-term settlement should not be expected.
5.5 Breakwater Design
5.5.1 General Layout
In order to create and maintain the desired deep emergent and SAV habitat, the
outside edges of the improvement area will need to be protected with breakwaters. The
structures need to be designed to help prevent wave action and reduce ice damage and scour,
yet allow water to flow through to the interior habitat to enable the dynamic exchange of

FROG ISLAND DESIGN REPORT
©Copyright 2010. New York Power Authority. All Rights Reserved 5-18
water and nutrients. As noted in the earlier analysis of environmental forces, the risk from
wind, waves and ice are not uniformly distributed, rather, the western side of the HIP would
be subjected to the greatest forces from wind and wave conditions while the head of the
island would be subjected to the greatest ice loading forces.
If a high-crested breakwater option is used, and openings in the breakwaters are
utilized, the layout should be situated to help limit the direct transmission of waves to the
island interior, but still allow flows to move through. On the outside edge of the high-crested
breakwaters, a shelf should be provided just below the normal waterline. This shelf will
serve several purposes: 1.) to limit the wave action against and runup over the breakwater,
and 2.) to be a sacrificial section that will prolong the life of the breakwater.
If a low-crested breakwater option is used, openings in the breakwater are not
required because the semi-permeable breakwater would allow regular flow-through and
overtopping with varying water levels and wave action. A horseshoe shaped structure should
allow sufficient protection from wave energy, yet allow regular flushing of the island
interior. If desired, openings in the breakwater could be situated on the east side of the HIP
to provide deep-water access to interior SAV habitat without jeopardizing the integrity and
protection of the breakwaters.
For either high or low-crested approaches, the head of the island is exposed to ice
loading from upstream, and may be subject to ice being pushed partway up the riprap
breakwater slope. Breakwaters in this part of the HIP should be designed slightly higher,
using either large boulders or a higher crest to allow more protection against ice ride-up, and
help to deflect ice to either side of the island. Any openings at the head of the island should
be relatively narrow and configured to help limit ice and debris from entering the protected
interior.
5.5.2 Toe Design
Larger breakwaters typically require treatment at the toe of the structure. Toe
protection can help to prevent scour at the upstream base of the structure that would result
from wave runup/rundown on the face. Toe protection can also help support overlying layers

FROG ISLAND DESIGN REPORT
©Copyright 2010. New York Power Authority. All Rights Reserved 5-19
of stone on the structure’s face, thereby preventing stones from sliding away from the base of
the protected slope face.
Protection should be included with either of the two breakwater approaches, but does
not need to be keyed into the foundation materials. It is recommended that toe protection be
provided through the use of a stone-filled marine mattress system. Movement of armor
stones above the mattress system may migrate down onto the stone mattress toe, but
excessive erosion or disturbance of this area is not expected.
5.5.3 Armor Design
Regardless of either high or low-crest approach, the breakwaters (both inside and
outside faces) will need to be layered with armor stone. This armor stone protects the
smaller-diameter stone making up the core of the breakwater. The finer core stones help
limit wave transmission through the foundation and base of the breakwaters, which can lead
to washing out of fines within the HIP interior. This stone armor needs to be sized to protect
against both wave and ice action. The following hazards exist for stone armor, and should be
factored into the design:
• Displacement from wave runup and rundown
• Displacement from toe erosion
• Plucking of armor locked within an ice sheet during rising waters
• Displacement from ice pushed onto the shore
Overall, some damage of the breakwaters from wave action is expected, and may
require repairs, but catastrophic failure should be prevented. Design approaches allow the
determination of acceptable failure levels as a percentage of stones displaced in the average
cross-section, which determines the minimum size of required armor stone. Plucking may be
prevented if the area is not subject to freezing ice sheets, and if an area is susceptible, armor
should be roughly twice as thick as the expected ice sheet. It is not expected that the interior
of the HIP will develop significantly thick ice sheets.

FROG ISLAND DESIGN REPORT
©Copyright 2010. New York Power Authority. All Rights Reserved 5-20
A USACE Coastal Hydraulics Laboratory procedure (USACE, 2005b), developed to
make storm-related damage estimates for high crested stone-armored breakwaters, was used
to estimate the annual damage that might be expected from a single, statistically-significant
annual event (Appendix C). This damage assessment scenario is based on the assumption
that no other annual damage is incurred other than the single, modeled event. A sensitivity
analysis for damage was completed by evaluating various median stone sizes (Dn50), with a
given controlling annual event. Figure 4 shows an estimate of the possible accumulation of
damage over a period of 50-years, where damage (S) is defined as the ratio of area damaged
to the square of the mean armor diameter. Full failure may be defined at approximately a
damage level of 10-12, with intermediate damage at 6-9 and initial damage at 27
FIGURE 4. BREAKWATER DAMAGE DEVELOPMENT (S
. Using a
log scale to display damage progression, it can be seen that a mean armor diameter of 12
inches (1.0 ft) could potentially experience significant damage after 50-years, whereas
increasing this diameter to 15-18 inches (1.25 to 1.5 ft), could dramatically decrease the
degree of damage risk by two to three times.
T
)
7 USACE EM 1110-2-1100, Table VI-5-21

FROG ISLAND DESIGN REPORT
©Copyright 2010. New York Power Authority. All Rights Reserved 5-21
The breakwater armor found on the western arms of Strawberry Island may be used
for comparison to help evaluate the selection of material sizes and field conditions. These
breakwaters are exposed to a similar fetch as Frog Island, and a similar wave / water level
environment. The southernmost (first) breakwater on the western arm is a lower profile
section constructed in approximately 1996, with a crest about 24 inches above water level.
As noticed during a May 2009 visit to Strawberry Island, the rocks used in the breakwater
range from 6 to 24 inches in diameter, and appear to have been pushed back and displaced
both in-front of and behind the breakwater. A small number of stones were observed to have
been plucked out of the breakwater and located at depths of up to 30 inches, presumably by
ice or wave action, and deposited up to 10 to 15 feet away from the breakwater. Vegetation
on the back side of the breakwater had been uniformly flattened, signifying either wave
action or ice action over the top of the breakwater. Further north (downstream) breakwaters
were constructed in approximately 2001 on the western arm and consist of larger stone (18 to
30 inches), with a crest at approximately 30 inches above the water level. In this region, the
vegetation was well established and not damaged like the breakwater towards the south.
Additionally, the form of the breakwater was more distinct and appeared to vary less from
the original design than the older, more southern breakwaters. The newer, downstream
breakwaters have been in place since 2001 and have seen 7 to 8 years of wave and ice action.
Considering this information, the performance of abutting breakwaters, and the above storm-
related damage estimates, we would recommend a D50
As an additional note regarding breakwater armor design, the leading upstream edge
of Strawberry Island consists of a higher profile island with well-established vegetation and
trees. This leading edge helps to protect and shed off ice that would otherwise overtop the
island. Frog Island does not have this high profile leading edge, and is subjected to these
higher ice forces; the armor on this leading edge needs to be designed to withstand these
forces and at a height and slope to prevent excessive ice ride-up and overtopping.
of at least 15-18 inches on the
breakwaters.

FROG ISLAND DESIGN REPORT
©Copyright 2010. New York Power Authority. All Rights Reserved 5-22
5.6 Habitat Engineering
5.6.1 Habitat Water Level Ranges
Surveys of wetlands were completed at a number of locations along the Upper
Niagara River to help identify reference wetland conditions for the HIPs (NYPA. 2009).
Where key plant species were found, their location was documented by global positioning
system (GPS) units and the depth at which the species were located was surveyed and
recorded (Figure 5). These elevations were then used to develop recommended elevation
ranges and planting zones, as shown in Table 10, for vegetation community types at Frog,
Motor, and Strawberry Islands. Appendix D contains a more extensive list of native plant
species that may be found along the river in each of the listed planting zones identified in
Table 10. This information is critical in the design of optimum planting elevations for
desirable species, and may actually be used in discouraging the establishment of invasive
species by the limitation of specific elevation bands where undesirable species tend to occur.
TABLE 10. ELEVATION RANGES FOR WETLAND COVER TYPES AT STRAWBERRY, FROG &
MOTOR ISLANDS (NYPA, 2009)
Elevation Range Habitat Type Planting Zone**
566.2-Higher Elevations Wet Meadow* A 565.2-566.2 Shallow Emergent B 564.0-565.2 Deep Emergent C
Lower Elevations-564.0 Submerged Aquatic Vegetation (SAV) D
* Wet meadow habitat should be minimized as this zone is the primary habitat of invasive species ** NYPA (2009) contains a list of native plant species that may be found along the river in each of the listed planting zones
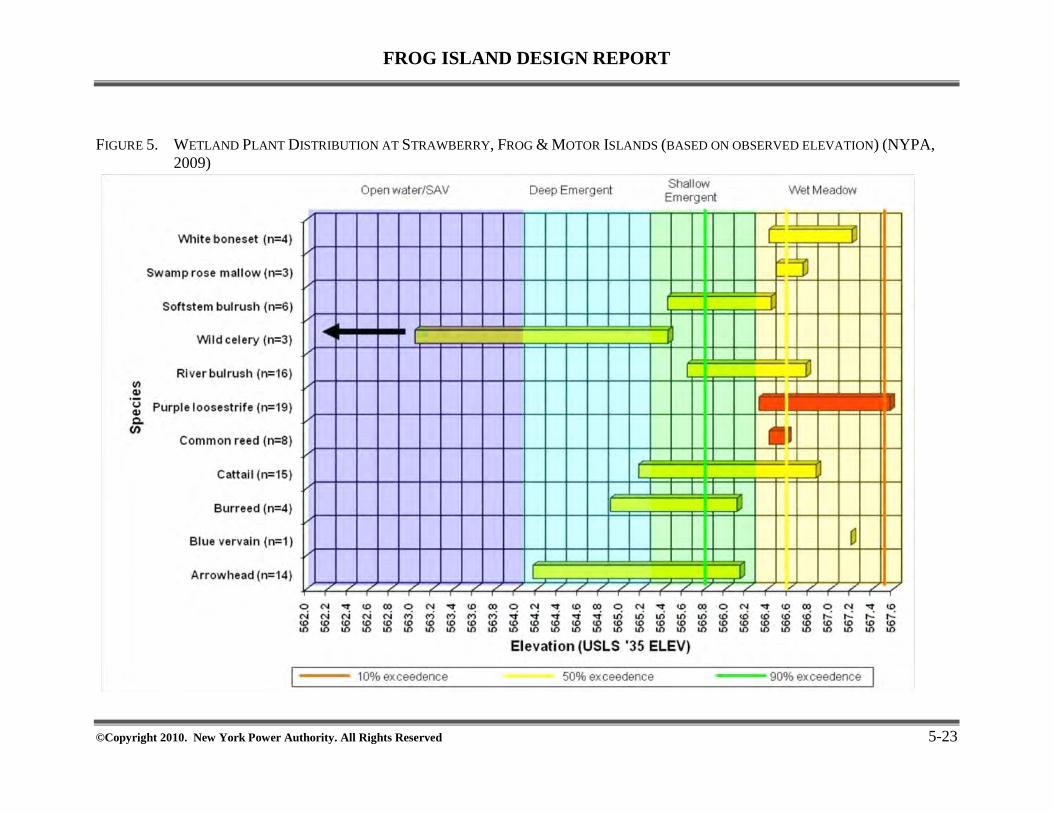
FROG ISLAND DESIGN REPORT
©Copyright 2010. New York Power Authority. All Rights Reserved 5-23
FIGURE 5. WETLAND PLANT DISTRIBUTION AT STRAWBERRY, FROG & MOTOR ISLANDS (BASED ON OBSERVED ELEVATION) (NYPA, 2009)
FROG ISLAND DESIGN REPORT
©Copyright 2010. New York Power Authority. All Rights Reserved 5-24
In general, all efforts should be made to minimize the potential habitat in the ‘Wet
Meadow’ elevation band, otherwise known as Scrub-Shrub, because invasives such as Purple
Loosestrife (and to a lesser degree Phragmites) favor this elevation band. Normal water
elevations are El. 566.5 ft, which approximately matches the lowest elevation of the Wet
Meadow zone. As noted in the design criteria, habitat in the Deep Emergent and SAV zones
should be encouraged (Table 10).
It is worth noting that the data used to develop these elevation ranges and planting
zones are based on relatively current, and observed, water levels. As noted in Section 5.1.7
and Figure 3, there are long-term fluctuations in water levels that could result in a shift in
plant zone elevations as the plant communities respond to different “wetness” conditions. To
minimize the effects of such shifts, designs should incorporate sloped transition zones, rather
than specific features for a single habitat type (e.g., a deep emergent bench), where plant
species could “march” up and down a slope to match their preferred hydrology. While this
may seem contradictory to the aforementioned statement about minimizing the Wet Meadow
zone to prevent the establishment of invasive species, this recommendation applies primarily
to the Deep Emergent and SAV zones.
5.6.2 Emergent Wetland Engineering
One of the stated design objectives for the HIP is to emphasize deep emergent
wetland habitat. To obtain this desired habitat, with either a high or low-breakwater
approach, wet meadow and shallow emergent marsh elevation zones should be relatively
narrow on the leeward side of the breakwaters to 1.) transition to deeper water that would
help to protect from rundown scour of overtopping waves, 2.) maximize the amount of
desired habitat area within the HIP, 3.) allow flow and circulation throughout the HIP, and
4.) minimize the area which could host invasive species.
The interior of either design approach should consist of a gentle slope downward
towards the middle of the HIP, which then could tie into existing grade on the downstream
side. This would allow flushing out of the HIP interior, but the slope would allow a

FROG ISLAND DESIGN REPORT
©Copyright 2010. New York Power Authority. All Rights Reserved 5-25
transition between the deep and shallow emergent zones, without achieving extensive wet-
meadow elevations.
Invasives can be partially controlled using the natural elevations of water levels and
fluctuations in the river (Table 9), which either support or inhibit the establishment of certain
plant species. Additional control methods, such as placement of inhospitable substrate (i.e.,
bare rock), using plantings (e.g., larger stock or higher densities) to encourage rapid
establishment of desirable species, and stabilizing the substrates with erosion matting during
the growth stage, can also be incorporated into designs to help limit the establishment and
proliferation of undesirable species.
5.6.3 Submerged Aquatic Vegetation Engineering
A second stated design objective for the HIP is to emphasize SAV habitat. Minimal
engineering is required for establishment of SAV, except for meeting depth ranges and
protection from damage. From the evaluation of existing SAV beds around Frog Island, the
habitat requires a minimum of 2.0-2.5 feet of depth to maintain a well-established bed. There
are a number of theories about why this depth appears to be limiting, including damage from
ice action, human foot/boat traffic, and wave action in the shallower depths. Regardless of
cause, observation of existing exposed, mid-river areas similar to Frog Island indicate that
SAV needs at least 2.0-2.5 feet of depth to become well established.
Substrates found in existing SAV beds in the River were observed to vary between a
silty sand, sand, or course sand. In particular, Wild Celery appears to prefer sand to silty
sand at depths of 2.5 to 3.0 feet8
Designs for SAV beds can be accomplished by excavating to the required depths
within the protective interior of the breakwaters. By excavating within the protection of the
breakwaters, the SAV beds would provide additional depth and habitat diversity within the
HIP that is contiguous with the Deep Emergent Marsh zone. Excavation may also help to
, with rooting depths of approximately 12 inches. Slightly
coarser sand may also be acceptable.
8 Table 3.1.1 in NYPA (2009)

FROG ISLAND DESIGN REPORT
©Copyright 2010. New York Power Authority. All Rights Reserved 5-26
“loosen” the substrate if it had been compressed under the weight of the historic fill material
placed in this part of the river. In addition, it is anticipated that the protection provided by
the breakwaters from waves and ice scour would enable SAV to establish where previously it
has been limited. The redistribution of material excavated to deepen the SAV areas could be
used beneath the breakwaters or to build up some areas within the HIP, which would provide
additional depth diversity and may help to create a balanced fill/cut volume.
5.7 Sediment Analysis/Flushing
Frog Island should be designed to allow the passage of flows through the breakwater,
to supply the interior with sediment, nutrients and flushing flows. There are no specific
minimum velocities required within the island, other than maintaining a dynamic, yet stable,
environment. Given the semi-permeable nature of the low-crested breakwaters, additional
flushing would occur as water is transmitted through or over the breakwater. Excessive
settlement and filling of the Frog Island interior is not anticipated due to the limited sediment
(i.e., bed, suspended) load in the river.
A preliminary level analysis of the impacts to sediment mobilization and transport
capacity was completed. This review was performed to determine if the altered hydraulic
properties of the river due to a small loss of available flow area from the establishment of the
island would result in a change of sediment mobilization capacity. This review showed that
there was minimal to no change in sediment mobilization capacity near the island.

FROG ISLAND DESIGN REPORT
©Copyright 2010. New York Power Authority. All Rights Reserved 6-1
6.0 RISK ANALYSIS
6.1 Wave Damage
Frog Island is located in a dynamic river environment, which is subject to rapid and
dramatic changes to water levels due to storm surges on Lake Erie, as well as long-term
changes in both flow and water levels. There are two hazards associated with wave action at
Frog Island: 1.) damage to the exterior rock armor from unit movements and dislocations,
either from wave runup, or rundown, and 2.) overtopping waves plunging into the island
interior, disrupting habitat, damaging sensitive wetland soils, or damaging SAV.
There is a potential for overtopping of Frog Island from waves during normal pool
levels (El. 566.5 ft), but the risk increases as the river stage around the island increases or as
the height of breakwaters above normal pool level decreases. Consequently, a seiche caused
by a westerly to south-westerly wind also exposes Frog Island to the greatest fetch, and the
most vulnerable conditions are a slightly elevated river stage with larger waves. Under these
conditions, the HIP area would be subject to a greater degree of overtopping of exposed
breakwater, which would then pass more waves toward the HIP interior. However, as the
river stage continues to rise, the inundation of the HIP results in greater water depths. With
greater water depth, the waves are able to move over the riverbed without inflicting
substantial damage to the submerged features. As a result, the inundation could act to protect
the breakwaters and even the interior wetlands.
The crest of the high-breakwaters would be approximately El. 569.0 ft, which will
likely be overtopped by still-water levels on an annual basis. The water level and fluctuation
report lists annual maximum water levels at Huntley and Frenchman’s Creek gages from
1991-2002 (NYPA, 2005), and the top of the proposed breakwater would have been
exceeded by these still-water levels each year except for two during this period. Wave
action, which will likely be included with increased stages, would result in more frequent
overtopping of the breakwaters. Water levels at the 5% exceedence level are El. 567.6 ft,
which allows only 1.4 feet of freeboard for runup wave action for the higher crest, compared
to normal still-water levels that allow 2.5 feet of freeboard. Overtopping is expected, and

FROG ISLAND DESIGN REPORT
©Copyright 2010. New York Power Authority. All Rights Reserved 6-2
will be considered a regular occurrence, but greater depths, as noted above, could also allow
for increased protection to the island interior.
The crest of the low breakwater would be approximately El. 567.0 ft, which is
approximately 0.5 feet above the long-term average water level. At this level, waves would
approach this shallow shelf and ground out so that they are unable to sustain their form,
which would result in a breaking wave. The length of the shallow breakwater allows this
breaking wave to runout and dissipate its energy over the shallow, armored bottom before
reaching the internal island habitat. As the water level rises due to lake level variations or
seiches, the shallow breakwater will become inundated. Under these conditions, large waves
would still ground out and dissipate energy as they pass over the breakwater. But smaller,
shallower waves would progress into the interior, where the increased depth would assist in
limiting damage to the sensitive interior habitat. The breakwater is designed to allow
protection from wave energy over a range of water levels and wave heights.
6.2 Ice Damage
It is difficult to evaluate the frequency or risk incurred from ice damage to habitat
within the interior of the HIP, and thus subjective observations are required. Ice loading on
the head of the HIP is an important issue in this part of the river, as evidenced by ice damage
to tree trunks approximately 30-inches above average water levels at the heads of both
Strawberry and Motor Islands. Early spring (May 2009) observations on the western side of
the head of Strawberry Island also identified a section of low-profile breakwater
(approximately 22 inches above WSEL), where all the vegetation had been pushed down,
and several rocks had been pushed towards the island interior. This damage was apparently
due to either direct pushing by ice blocks, or ice blocks subject to wave action.
Although it is not fully understood why, the shallow areas at Frog Island, which are
largely at a depth of 2.5 feet or less, is absent of established SAV. One theory is that the
scraping effect of ice at this shallow depth each winter limits plant growth. Regardless of
cause, SAV was not observed in any part of the Upper Niagara River that had similar depth,

FROG ISLAND DESIGN REPORT
©Copyright 2010. New York Power Authority. All Rights Reserved 6-3
fetch, and velocity conditions as Frog Island. Therefore, it is relatively certain that
unprotected habitat in this area cannot sustain SAV. It should be noted that conditions at
Frog Island are quite different than those at Strawberry Island, whose head is well protected
with trees, bushes, and a larger height of land and riprap breakwaters above normal water
levels. These features help to protect the shoreline from rideup ice, and help keep ice from
pushing over the head of Strawberry Island into the interior.
The ice model results show buildup of ice on the leading upstream edges of islands,
including the proposed Frog Island, as ice movement is driven more by currents than wind
and wave action. Based on historic data of major ice events, thickness may reach 2 to 3 feet,
and currents may push ice into the island interior if the breakwater is not of sufficient height.
With estimated shear forces of 30-75 lb/ft of force, the breakwater crests are also subject to
armor being pushed over if the height is too shallow. Ice that enters the protected interior
could potentially scour the vegetation and damage the root zones. Ice that forms in the
interior is not viewed as a threat, and may actually help protect portions of the island interior,
but large blocks pushed over the breakwater can be potentially quite damaging to the island
interior.
6.3 Habitat Sustainability
The islands, shorelines, wetlands, and SAV habitat in the Upper Niagara are dynamic
and have dramatically changed over time with regard to their footprints and biotic (plant
communities) and abiotic (topography, bathymetry, soils) characteristics. These changes are
in response to a disturbance regime that involves both natural (long-term climatic changes,
ice, seiches, wind waves, etc.) and anthropogenic (dredge disposal, gravel mining, boat
wakes, shoreline hardening, water level controls, ice booms) forces. The current design
approaches should try to reproduce the function of naturally occurring reference conditions,
which can be accomplished through the use “hard” features such as rock breakwaters and
geotechnical mattresses, combined with “softer” sloped vegetative surfaces to enable
transitions in plant communities. These techniques should be supplemented with aggressive
planting plans to speed initial establishment and stabilization of the site. These steps will

FROG ISLAND DESIGN REPORT
©Copyright 2010. New York Power Authority. All Rights Reserved 6-4
enhance the chances that the wetland complex will persist against the dynamic forces present,
while at the same time attempting not to over-design with obtrusive structural features with a
narrow range of depth tolerances that would prove to be unrealistically difficult to construct
or result in undesirable ecological effects.
The design approaches should also try to protect substrates and plants from ice and
waves. It is hoped that roots of perennial marsh species such as soft stemmed bulrush will be
able to “hide” in protected areas such as under rocks, so that even if a winter event scours the
emergent habitat, there will be live plant material remaining within the sheltered spaces to re-
colonize the marsh zone.
It is important to note that the collaboratively developed design criteria call for
creating a sustainable HIP that emphasizes deep emergent marsh and SAV habitat. To be
sustainable, the HIP will be required and expected to able to respond to both seasonal
variability and changes in long-term trends. To this end, we expect that forces such as ice,
water levels, and waves will result in year-to-year changes in the vegetative community, with
some subtle and some more dramatic. Such year-to-year changes are part of the HIP’s design
criteria, and are even desirable in as much as they mimic both the temporal and spatial
habitat diversity found in nature. We also expect that some maintenance of the breakwater
structures and interior habitats may be needed as a result of the cumulative effect of typical
conditions, or after extreme storm events. Because many of these conditions and resulting
effects cannot be accurately predicted, an adaptive management approach will be used to
respond to and address identified needs throughout the life of the project.

FROG ISLAND DESIGN REPORT
©Copyright 2010. New York Power Authority. All Rights Reserved 7-1
7.0 CONCLUSIONS
The development of new habitat in the vicinity of Frog Island requires detailed civil
engineering design, involved ecological assessments, hydrologic and hydraulic engineering,
and a bit of art all working in concert together. There are several different approaches to try
to create the objective habitats, but regardless of approach, the HIP needs to achieve the set
goals, be sustainable, not require excessive maintenance, and be constructible without
damaging existing habitats. There is some uncertainty and risk involved in development of
the Frog Island habitat because this area is dynamic in nature and severe conditions (either
from wind driven waves or ice) are expected to occur at some point in time. There is
additional uncertainty with respect to changing flows (hydrologic availability), long-term
meteorological conditions and water levels, and even new invasive species. It should be
recognized that Frog Island will be designed to be a dynamic habitat capable of adjusting to
changing conditions. The information and approaches outlined in this report will be used to
develop appropriate designs that will give the riverine wetland complex the best chances of
successful initial establishment.

FROG ISLAND DESIGN REPORT
©Copyright 2010. New York Power Authority. All Rights Reserved 8-1
8.0 ADDITIONAL RESOURCES
Design of the island and the shoreline protective structures involved extensive guidance
from the USACE’s Coastal Engineering Manual (2006). Pertinent design sections include the
following:
• Part VI Chapter 3 Site Specific Design Conditions
• Part VI Chapter 4 Materials & Construction Aspects
• Part VI Chapter 5 Fundamentals of Design, Part I
• Part VI Chapter 5 Fundamentals of Design, Part II
• Part VI Chapter 5 Fundamentals of Design, Part III
• Part VI Chapter 6 Reliability in Design
Additional guidance was developed from technical notes from the USACE Coastal
Hydraulics Laboratory (CHL), in Section III – Coastal Structures. These notes are available at:
http://chl.erdc.usace.army.mil/chetn.
• CHETN-III-64 Damage Development on Stone-Armored Breakwaters
• CHETN-III-67 Wave Momentum Flux Parameter
• CHETN-III-71 Breakwater and Revetment Armor Stability
• CHETN-III-72 Uses for Marine Mattresses in Coastal Engineering

FROG ISLAND DESIGN REPORT
©Copyright 2010. New York Power Authority. All Rights Reserved 9-1
9.0 REFERENCES
Buehler, E. J., and P. E. Calkin. 1982. Geology of the Northern Appalachian Basin Western
New York. Department of Geological Sciences, State University of New York at Buffalo. 385p.
Earth Dimensions, Inc. 1998. Geologic Study of Strawberry Island, Niagara River, Erie County, NY. Prepared for C&S Engineers, Inc.. Prepared by Earth Dimensions, Inc, Project Code 3L96. September 1998.
Ji, S., H.T. Shen, Z.Wang, H.Shen, and Q.Yue. 2004. Ice Dynamics Model with a Viscoselastic-Plastic Constitutive Law, Proc., 17th International Ice Symposium, St. Petersburg, 274-281.
Liu, L.W. and H.T. Shen. 2003. Dynamics of Ice Jam Release Surges, Proc., 17th International Ice Symposium, St. Petersburg, 244-250.
New York Power Authority. 2009. 2007 Baseline Wetland Field Assessment Report and Wetland HIP Design Recommendations. Prepared for New York Power Authority, Niagara Power Project, FERC No. 2216. Prepared by Kleinschmidt Associates, Gomez and Sullivan Engineers, P.C., and TRC Engineering, LLC. January.
New York Power Authority. 2005. Niagara River Water Level and Flow Fluctuation Study Final Report. Prepared for New York Power Authority, Niagara Power Project, FERC No. 2216. Prepared by URS Corporation, Gomez and Sullivan Engineers, P.C., and E/PRO Engineering & Environmental Consulting, LLC. August.
Sault, M., L. Matthies, J. Whitney, and J. Singer. 1997. An Erosional History of Strawberry Island, Niagara River, Tonawanda, New York. Middle States Geographer, 30:29-34.
Shen, H.T., and L.W Liu. 2001. A Two Dimensional Ice Dynamic Model for Upper Niagara River, CEE Report No. 01-08, Clarkson University, Potsdam, NY.
Spierto, T.J., S.A. Lazazzero, and P.L. Nelson. 2003. Strawberry Island Phase III Erosion Control and Wetland Habitat Restoration: A Case Study in the Successful Application of In-Lieu Fee Mitigation. University of California, Davis John Muir Institute of the Environment, Tahoe Research Group/Tahoe Environmental Research Center. http://repositories.dclib.org/jmie/terc/Spierto2003a [Accessed 9/9/2009].
U.S. Army Corps of Engineers (USACE). 2006. Coastal Engineering Manual. Engineer Manual 1110-2-1100, U.S. Army Corps of Engineers, Washington, D.C. (in 6 volumes). http://chl.erdc.usace.army.mil/cemtoc [Accessed 2/16/2010].

FROG ISLAND DESIGN REPORT
©Copyright 2010. New York Power Authority. All Rights Reserved 9-2
USACE. 2005a. Coastal Hydraulics Laboratory Technical Note CHL CHETN-III-70. Estimating Irregular Wave Runup on Rough, Impermeable Slopes. http://chl.erdc.usace.army.mil/library/publications/chetn/pdf/chetn-iii-70.pdf [Accessed 2/16/2010].
USACE. 2005b. Coastal Hydraulics Laboratory Technical Note CHL CHETN-III-64. Damage Development on Stone-Armored Breakwaters and Revetments. http://chl.erdc.usace.army.mil/library/publications/chetn/pdf/chetn-iii-64.pdf [Accessed 2/16/2010].

FROG ISLAND DESIGN REPORT
©Copyright 2010. New York Power Authority. All Rights Reserved A-1
APPENDIX A
HISTORICAL MAP AND AERIAL PHOTOGRAPHS


Morris Perot
Typewritten Text
1870
Morris Perot
Typewritten Text
Morris Perot
Typewritten Text
Morris Perot
Typewritten Text

Frog Island - 1902
First evidence of unique shape on downstream end of Strawberry Is
Is shape from dredge spoil dumping from the east channel or wasmaterial removed to cause shape?
Below average water year

Frog Island - 1910
Doubled to 200 acres since 1820 from dredge spoils from Erie Canal and Black Rock Lock
Strawberry Island had a two-story hotel, and a small canal was constructed through the island for fishing
Below average water year

Frog Island - 1917
7 years later –similar shape and size
First evidence that Frog Island is renamed “Motor Is”
Average water year

Frog Island - 1923
6 years after 1917, upper tip of Strawberry seems to be missing
Below average water year

Frog Island - 1927
First aerial
Sand and gravel mining mid-1920s to 1953
Below average water year

Morris Perot
Typewritten Text
1932
Morris Perot
Typewritten Text
Morris Perot
Typewritten Text

Frog Island – 1934
More changes to Strawberry Is – particularly at the upper tip
Historic low water year
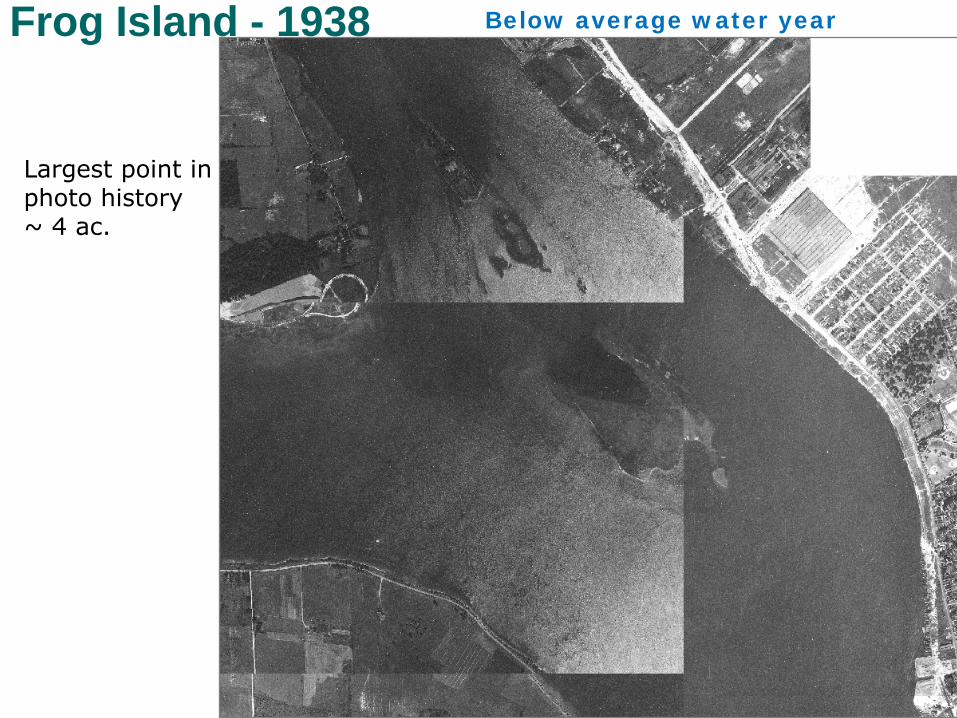
Frog Island - 1938
Largest point in photo history ~ 4 ac.
Below average water year

Frog Island - 1948 Average water year

Frog Island - 1951
Photo -1954
Average water year

Frog Island - 1959 Below average water year

Frog Island - 1966 Low water year

Frog Island - 1972
Still visible above water?
Above average water year

Frog Island - 1977 Historic high water year
Erosional processes appear to be evident

Frog Island - 1978 Above average water year


Frog Island - 1985 Above average water year


Frog Island - 1989 Above average water year


Morris Perot
Typewritten Text
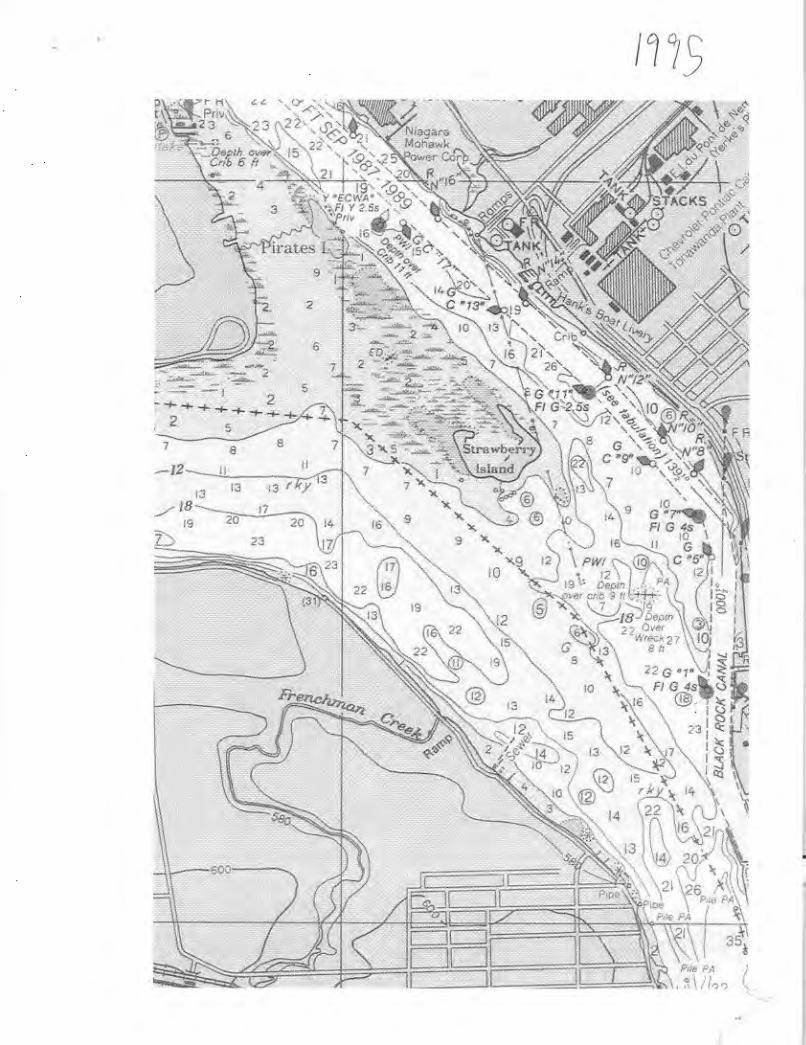

Frog Island - 2002 Below average water year
Frog Island no longer exposed during low water periods – erosion?

Frog Island - 2005 Average water year

Frog Island – 2006-2007
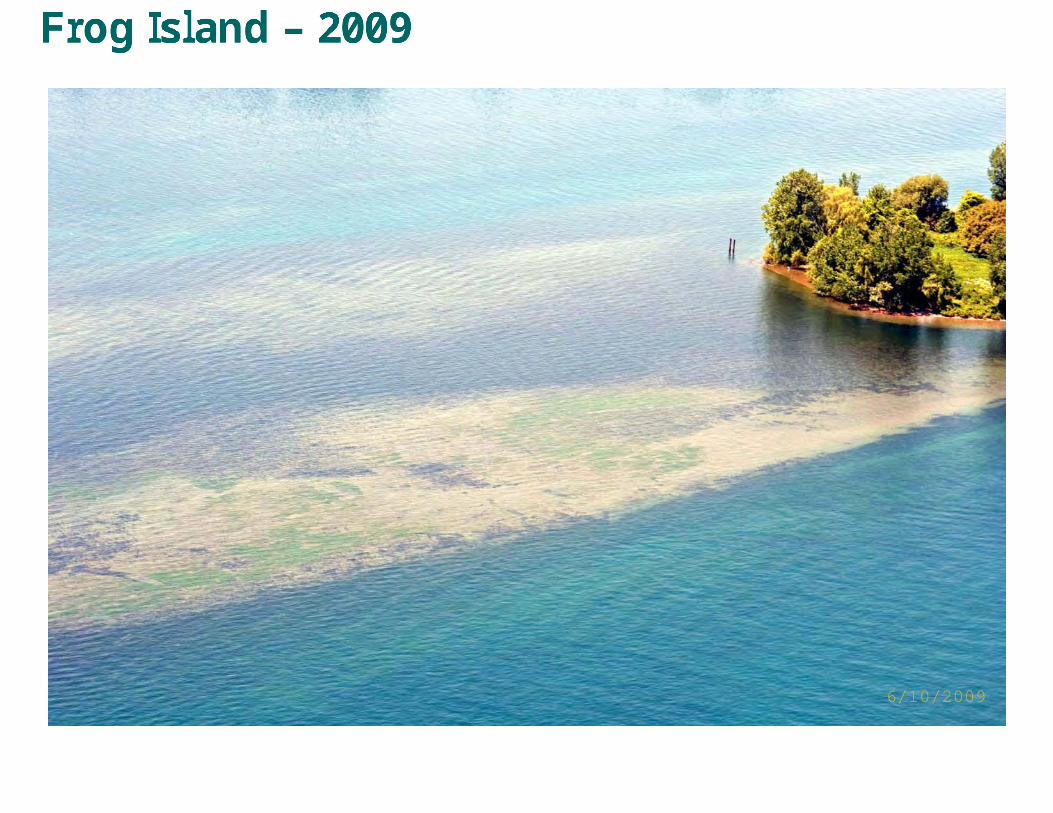
6/10/2009
mperot
Text Box
Frog Island – 2009

FROG ISLAND DESIGN REPORT
©Copyright 2010. New York Power Authority. All Rights Reserved B-1
APPENDIX B
WAVE CALCULATIONS

Page 1 of 3
MEMORANDUM
TO:
Design Team
FROM:
Jonathan Quebbeman, Kleinschmidt
DATE:
March, 2009
RE: Frog Island Wave Height and Runup Reference: EM1110-2-1100 Part II, Chapter 2, Coastal Engineering Manual (CEM) “Meteorology & Wave Climate” Check required wind duration:
X = Wind Fetch (km) = 2.4km or 2400m (SW direction) U10 or u = 10m wind speed = 40mph = 18 m/s g = gravity = 9.81 m/s2 T(x,u)=2503 seconds = ~42 minutes *Wind speed assumed for sample calculations Therefore: *One-hour winds would be fetch limited, one-mile (minute) winds would not. *Use one-hour wind values Estimate Friction Velocity (u*)
U10 = 18 m/s CD = .00173
Therefore: u*=0.7487 m/s Estimate Zeroth-Moment Significant Wave Height (Hmo)
Solve for Hmo Hmo = 0.48m = 1.6 ft
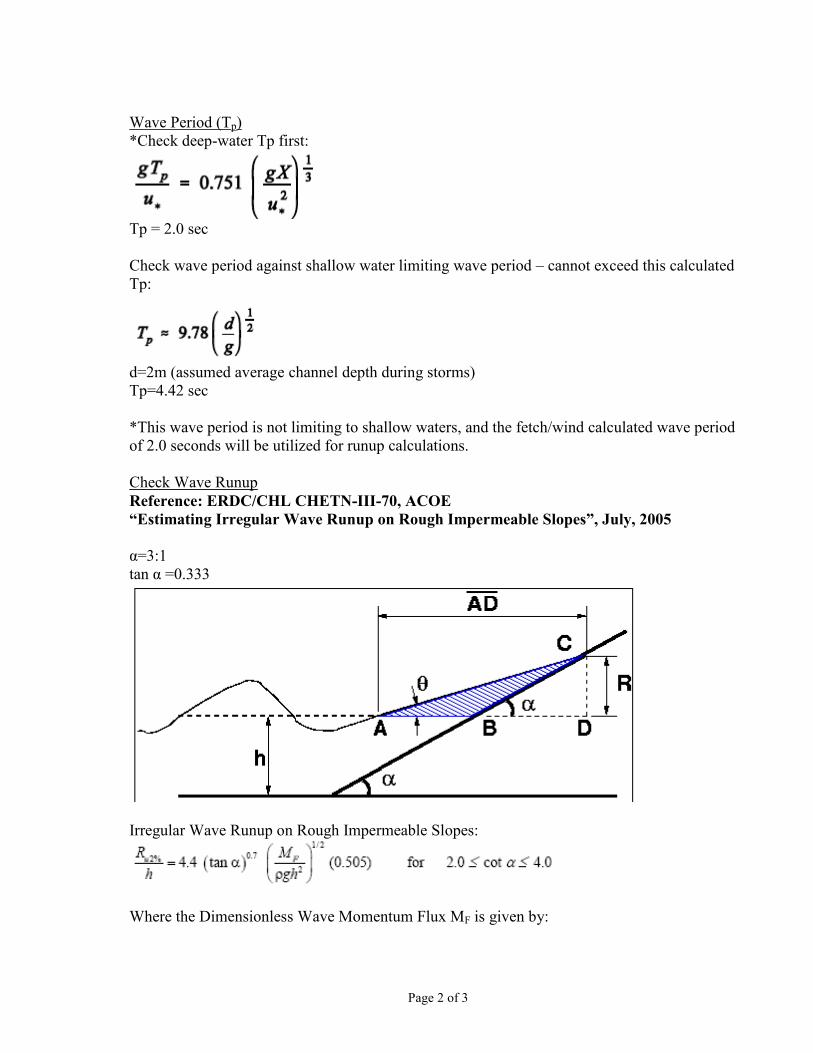
Page 2 of 3
Wave Period (Tp) *Check deep-water Tp first:
Tp = 2.0 sec Check wave period against shallow water limiting wave period – cannot exceed this calculated Tp:
d=2m (assumed average channel depth during storms) Tp=4.42 sec *This wave period is not limiting to shallow waters, and the fetch/wind calculated wave period of 2.0 seconds will be utilized for runup calculations. Check Wave Runup Reference: ERDC/CHL CHETN-III-70, ACOE “Estimating Irregular Wave Runup on Rough Impermeable Slopes”, July, 2005 α=3:1 tan α =0.333
Irregular Wave Runup on Rough Impermeable Slopes:
Where the Dimensionless Wave Momentum Flux MF is given by:

Page 3 of 3
H=Wave Height = 0.48m h=Depth = ~2m A0=0.0355 A1=0.3145 T = 2.0 sec
= .0905 Therefore:
= 4.4(0.333)^0.7(0.0905)^0.5(0.505) = 0.310 Or: Ru2%=0.620m (2.0ft) Checked by: MCS 4-1-09

FROG ISLAND DESIGN REPORT
©Copyright 2010. New York Power Authority. All Rights Reserved C-1
APPENDIX C
ROCK SIZING CALCULATIONS

May 8, 2009 Frog Island Design Memo, NYPA (#1210-002) Re: Design of Rock Slope Material Sizing, Open Water Waves Source: EM1110-2-1100 Part VI, Chapter 5, Part I From Table VI-5-23, find ξm and ξmc:
Where: tan α = 0.5 P = 0.1 (Table VI-5-11 for mostly impermeable core) sm = Hs/Lom (Wave Steepness) Hs = 0.6m (Previously Determined) Lom = 7m (Previously Determined) Therefore: ξm = 1.71 ξmc = 3.57 Since ξm < ξmc, they are considered plunging waves.
For rock slopes, at 2:1, allow for initial damage of S=2 according to the table below:
Nz = 7500 (maximum value for number of waves, equilibrium damage)
= 1.47 (Stability Number) Where: Δ = (SGrock – 1) = (2.65-1) Thus, Dn50 = 0.25m (0.8 ft) Use Dn50 minimum of 10 inches (poorly graded) By: JAQ, 5-8-09 / Checked by: MCS, 5-8-09
Notes: -Does not consider Ice Loading -Ho assumed equal to Hs

FROG ISLAND DESIGN REPORT
©Copyright 2010. New York Power Authority. All Rights Reserved D-1
APPENDIX D
WETLAND PLANT MATRIX FROM NYPA (2009)

Common Name Scientific NameGrowth Habit Preferred Hydrologic Regime
Marsh Zone
Soil Texture Tolerance (USDA)
Erosion Control
Potential
High Wildlife Value
Benefitting Wildlife Species
American Water Plantain Alisma subcordatum H Regular to Permanent Inundation B,C F, M WFSpeckled Alder Alnus incana S Regular Saturation to Irregular Inundation A F, M, C Yes Yes MB, WF, MMSwamp Milkweed Asclepias incarnata H Irregular to Regular Inundation A F, M MMBluejoint Grass Calamagrostis canadensis G Regular Saturation to Irregeular Inundation A F, M YesFringed Sedge Carex crinita G Regular Saturation to Irregeular Inundation A F, M WF, MB, MMHairy Sedge Carex lacustris G Regular Saturation A, B F, M WF, MB, MMShallow Sedge Carex lurida G Regular Saturation to Irregeular Inundation A F, M, C WF, MB, MMTussock Sedge Carex stricta G Regular Saturation to Intermittent Inundation A, B F, M, C WF, MB, MMFox Sedge Carex vulpinoidea G Regular Saturation to Irregeular Inundation A, B F, M Yes WF, MB, MMCoontail Ceratophyllum demersum H Permant Inundation C, D F, M, C MMSilky Dogwood Cornus amomum S Irregular to Regular Inundation A F, M, C Yes Yes WF, MB, MMGray Dogwood Cornus racemosa S Seasonal Inundation A F, M Yes Yes WF, MB, MMRed Osier Dogwood Cornus sericea S Seasonal Inundation A F, M Yes WF, MB, MMYellow Nutsedge Cyperus esculentus G Irregular to Regular Inundation A, B F, M, C Yes WF, MB, MMSpotted Joe-pye Weed Eupatoriadelphus maculatus H Regular Saturation A MBWhite Boneset Eupatorium perfoliatum H Regular Saturation A MMSwamp Rose Mallow Hibiscus moscheutos H Irregular to Regular Inundation A F, M HBSoft Rush Juncus effusus G Seasonal Inundation A, B F, M, C Yes WF, MB, MM, FHBugleweed Lycopus uniflorus H Irregular to Regular Inundation AWhite Water Lilly Nymphaea odorata H Permant Inundation C, D WF, MMMarsh Knotweed Polygonum hydropiperoides H Regular to Permanent Inundation A, B F, M WF, MBPennsylvania Smartweed Polygonum pensylvanicum H Regular to Permanent Inundation A, B F, M, C Yes Yes WF, MB, MMPickerel Weed Pontederia cordata H Regular to Permanent Inundation C F, M, C WF, MMPondweeds Potamogeton spp. H Permant Inundation C, D WF, MB, MMSwamp Dock Rumex verticillatus H Regular to Permanent Inundation A WF, MB, MMArrowhead Sagittaria latifolia H Regular to Permanent Inundation B, C,D F, M WF, MMBlack Willow Salix nigra T Irregular to Regular Inundation A F, M, C Yes Yes MB, MMRiver Bulrush Schoenoplectus fluviatilis G Regular Inundation A, B F, M Yes Yes WF, MB, MM, FHThree-square Schoenoplectus pungens G Regular to Permanent Inundation B, C F, M, C Yes Yes WF, MB, MM, FHSoft-stemmed Bulrush Schoenoplectus tabernaemontani G Regular to Permanent Inundation B, C F, M, C Yes Yes WF, MB, MM, FHDark Green Bulrush Scirpus atrovirens G Regular to Permanent Inundation A, B F, M Yes Yes WF, MB, MMWoolgrass Scirpus cyperinus G Regular to Irregular Inundation A, B F, M, C Yes Yes WF, MB, MM, FHGiant Burreed Sparganium eurycarpum H Regular to Permanent Inundation B, C F, M, C WF, MMFreshwater Cordgrass Spartina pectinata G Regular to Permanent Inundation A, B M, C Yes WF, MBBroad-leaf Cattail* Typha latifolia H Irregular to Regular Inundation A, B, C F, M, C Yes WF, MM, FHWild Celery Vallisneria americana H Permant Inundation C,D F, M, C WF, MM, FHBlue Vervain Verbena hastata H Irregular Innundation A WF, MB, MMArrowwood Viburnum dentatum S Seasonal Inundation A F, M, C Yes Yes MB, MM
Buttonbush Cephalanthus occidentalis S Irregular to Permanent Inundated A, B F, M, C Yes Yes WF, MB, MMCreeping Spikerush Eleocharis palustris G Regular or Permanent Saturation A F, C Yes WF, MB, MMBlue Flag Iris versicolor H Regular or Permanent Inundation A,B WF, MB, MMTorreyi's Rush Juncus torreyi G Irregular to Seasonal Inundation or Saturation A M, C WF, MB, MM, FHCardinal Flower Lobelia cardinalis H Regular or Permanent Saturation A M HBLizard Tail Saururus cernuus H Regular to Permanent Inundation A, B WFHard-Stem Bulrush Schoenoplectus acutus G Regular to Permanently Inundation B, C F, M Yes Yes WF, MB, MM, FHMarsh Zones (Based on Survey elevation): Wildlife Species: Soil Texture: Growth Habit A (Wet Meadow) WF = Waterfowl C=Coarse G = Graminoid B (Shallow Emergent) MB = Marsh Birds M=Medium H = Herbaceous C (Deep Emergent) MM = Mammals F=Fine S = Shrub D (Submerged Aquatic Vegetation-SAV) FH = Fish T = Tree
HB = Hummingbird*Do not include in planting plan since this species may readily colonize on it's own
Other Plants not Observed in Study Area, but Known to Historically Exist Within the Project Area
Wetland Species Observed in the Vicinity of the HIPs