Friends of the Earth Middle East - EcoPeace Middle...
34
Friends of the Earth Middle East An Economic Analysis of Policy Options for Water Conservation in Israel Gadi Rosenthal and Dr. David Katz, Kivun Consulting EcoPeace / Friends of the Earth Middle East Amman, Bethlehem, Tel Aviv www.foeme.org Supported by the United States Agency for International Development (USAID), the Goldman Fund, the Global Nature Fund/ Ursula Merz Foundation and the Green Environment Fund. July 2010
Transcript of Friends of the Earth Middle East - EcoPeace Middle...

Friends of the Earth Middle East
An Economic Analysis of Policy Options for Water Conservation in Israel
Gadi Rosenthal and Dr. David Katz, Kivun Consulting
EcoPeace / Friends of the Earth Middle EastAmman, Bethlehem, Tel Avivwww.foeme.org
Supported by the United States Agency for International Development (USAID), the Goldman Fund, the Global Nature Fund/ Ursula Merz Foundation and the Green Environment Fund.
July 2010

EcoPeace / Friends of the Earth Middle East (FoEME) is a unique organization at the forefront of the environmental peacemaking movement. As a tri-lateral organization that brings together Jordanian, Palestinian, and Israeli environmentalists, our primary objective is the promotion of cooperative efforts to protect our shared environmental heritage. In so doing, we seek to advance both sustainable regional development and the creation of necessary conditions for lasting peace in our region. FoEME has offices in Amman, Bethlehem, and Tel-Aviv. FoEME is a member of Friends of the Earth International, the largest grassroots environmental organization in the world.
For more information on FoEME or to download any of our publications please visit: www.foeme.org
Amman OfficeMunqeth Mehyar, Jordanian DirectorPO Box 840252 - Amman, Jordan, 11181Tel: 962 6 5866602/3Fax: 962 6 5866604Email: [email protected]
Bethlehem OfficeNader Khateeb, Palestinian DirectorPO Box 421 – Bethlehem, PalestineTel: 972 2 2747948Fax: 972 2 2745968Email: [email protected]
Tel Aviv OfficeGidon Bromberg, Israeli Director8 Negev Street, Third Floor – Tel Aviv, 66186 IsraelTel: 972 3 5605383Fax: 972 3 5604693Email: [email protected]
© All Rights Reserved. No part of this publication may be reproduced, stored in retrieval system or transmitted in any form or by any means, mechanical, photocopying, recording, or otherwise, for commercial use without prior permission by EcoPeace/ Friends of the Earth Middle East. The text can be used for educational and research purposes with full accreditation to EcoPeace/ Friends of the Earth Middle East.
Cover Photo: © Eddie Gerald/ FoEME

Note of Gratitude
FoEME would like to recognize and thank the United States Agency for International Development (USAID), the Richard and Rhoda Goldman Fund, the Global Nature Fund/ Ursula Merz Foundation and the Green Environment Fund for their support of this project.
Additional thanks are due to the many international, regional and local experts for their participation in our National and Regional Advisory Committee Meetings.
The views expressed are those of EcoPeace/ FoEME and do not necessarily represent the views of our expert team, project advisors, participants in the project's National and Regional Advisory Committee meetings or our funders.
FoEME Jordan River Rehabilitation Project Team:Elizabeth Ya'ari, Israeli Project CoordinatorBaha Afaneh, Jordanian Project CoordinatorMansour Bader, Palestinian Project CoordinatorGidon Bromberg, Israeli Director Nader Khateeb, Palestinian Director Munqeth Mehyar, Jordanian Director Mira Edelstein, Resource DevelopmentChava Haber, Financial Management
Graphic Design, Maps and Layout: Yehuda Hofshi, Visual Communication Department of Bezalel Academy of Art and Design, Jerusalem
Israeli National and Regional Advisory Committee Meeting Participants:Shimon Anisfeld, Senior Lecturer and Research Scientist in Water Resources and Environmental Chemistry, School of Forestry and Environmental Studies, Yale University, USAYouval Arbel, Deputy Director, FoEMERamon Ben Ari, Director, Lower Jordan River Drainage AuthorityRaanan Boral, Environmental ConsultantSarit Caspi, Adam Teva v'Din, NGOYaron Ergas, Ministry of TourismSarig Gafny, Head of the Department for Marine Environment Sciences, Ruppin Academic CenterHillel Glassman, Director, Stream Monitoring Department, Nature Parks AuthorityDaniel Hillel, Professor, Columbia University, USAMordechai Karin, Lower Jordan River Drainage AuthorityUri Mingelgrin, Institute of Soil, Water and Environmental Sciences, Ministry of AgricultureMoshe Perlmutter, Water Coordinator, Society of Protection of Nature of Israel, NGO Dror Pezner, Water and Streams Protection Division, Ministry of EnvironmentEran Shostak, Water and Sewage Association, Water AuthorityJanna Shub, Graduate Student, School of Forestry and Environmental Studies, Yale University, USAYishay Sorek, Advisor to Minister, Ministry of Regional Cooperation Dalia Tal, Zalul, NGOAlon Zask, Director, Protection Water and Streams Division, Ministry of Environment
4
Contents
1 Introduction ............................................................................................................................... 72 Current Freshwater Balances in Israel ....................................................................................... 9
2.1 Current Supply and Demand .............................................................................................. 92.2 Future Water Balances ..................................................................................................... 102.3 Water Pricing and Shadow Values ................................................................................... 12
3 Overview of Existing Policies & Regulations Governing Water in Israel ................................... 154 Potential for Water Conservation in the Domestic and Municipal Sector ................................. 17
4.1 Composition of Domestic and Municipal Water Consumption ......................................... 174.2 Awareness-Raising for Urban Water Demand Management ........................................... 184.3 Changes in Plant Types in Parks & Gardens ................................................................... 194.5 Decentralized Rainwater Collection and Storage ............................................................ 204.4 Reduction in Leakages and Associated Water Losses ..................................................... 204.6 Grey Water ...................................................................................................................... 214.7 Summary of Domestic and Municipal Water Conservation Options ................................. 23
5 Potential for Water Conservation in the Agricultural Sector ..................................................... 255.1 Composition of Agricultural Water Consumption .............................................................. 255.2 Effects of Water Price Increases on Freshwater Consumption ........................................ 265.3 Effect of International Trade Barriers on Agricultural Water Consumption ........................ 27
6 Reduced Water Losses from Reservoirs ................................................................................. 297 Summary and Conclusions ..................................................................................................... 318 References .............................................................................................................................. 33
5

6

The following analysis attempts to identify opportunities to conserve freshwater within Israel. It estimates the water savings from a range of different policies. The water savings identified from each individual policy can be considered as a "wedge" or piece of a pie towards a given conservation goal. This methodology of identifying conservation wedges has been developed by researchers at Princeton University in the context of greenhouse gas reduction and has been employed by numerous academic, government, private sector, and non-governmental researchers.1
Because water within Israel is managed at a national level, integrating surface and groundwater, this study does not limit itself to the waters of the Jordan River Basin, but rather, addresses all possible opportunities for freshwater conservation within Israel. While the ultimate goal of Friends of the Earth Middle East (FoEME), the organization sponsoring the research, is to identify wedges available for water conservation in order to facilitate the rehabilitation of the Lower Jordan River system, the study itself merely identifies the opportunities for conservation, given certain policy and cost constraints. Should such conservation measures be implemented, the ultimate use of the water saved is, of course, a matter for policy-makers to decide.
The study proceeds as follows: First, a brief overview of Israel's current water resources is provided, including a review of supplies, consumption, and pricing. This is followed by a presentation of anticipated future changes in supply and demand, especially as a result of climate change. A review of major legislation affecting water policies is then presented. The subsequent sections identify opportunities for conservation in the domestic and commercial sectors, the agricultural sector, and from upgrading and improving the national water storage and delivery infrastructure. A summary of findings and conclusions are offered in the final section.
The study attempts to estimate the costs of each water-saving measure, when possible. In many cases, estimates of either the amount of water to be conserved or the cost of the conservation measure are uncertain. In such cases best estimates are given, often with a range of potential reasonable values. The study primarily addresses demand management measures, as these have already been identified as
1 Pacala and Socolow (2004); Mui et al (2007); Nicols et al (2009); http://cmi.princeton.edu/wedges; http://www.wri.org/project/climate-wedges
1 Introduction
7

representing the cheapest, technologically easiest, and most environmentally beneficial means of living within a strict water budget.2 However, this study also identifies supply augmentation measures that would result in more efficient use of available water resources. Estimates are based on available data, literature reviews, and interviews with experts in their respective fields. The study concludes with a summary of the findings, a discussion of study limitations and a discussion of implications of the study's findings for policy.
2 See for example, IWA 2005.
8

2 Current Freshwater Balances in Israel
2.1 Current Supply and Demand
Past estimates of Israel’s average renewable rainfall are in the range of 1500-1800 million cubic meters (mcm) per year. Rainfall is highly stochastic with high year-to-year variance, and so actual rainfall in any given year may be several hundred mcm more or less than the range indicated. Moreover, as will be discussed more in detail later, many experts believe that the 1500-1800 mcm figure is an over-estimate, and that annual rainfall is on a downward trend.3
Israel has been consuming water at or beyond renewable rates since the 1970s. Growing demand, especially for household (and urban commercial) use, has put increasing pressure on the nation’s water supplies. Israel has responded by cutting allocations to agriculture and by pioneering several methods for increasing the technological efficiency of use in the agricultural sector, including drip irrigation and development of salt tolerant crops, and by augmenting supplies via reuse of treated sewage and construction of desalination plants. Indeed, Israel is a world leader in these fields. Water consumption by sector is detailed in Table 1. As can be seen, the share of freshwater consumed by the agricultural sector has declined significantly, mirroring the increase in the domestic sector, which is now the largest consumer of freshwater in Israel. Absolute consumption of water by agriculture has remained relatively constant; however, with decreases in freshwater allocations being compensated for by treated sewage and by saline water. Beginning in 2007, Israel also began major desalination projects. As of February 2010, Israel is set to desalinate 270-300 mcm per year, or roughly one-third of the household consumption. Desalination is expected to produce 650-750 mcm by 2020.4
3 IWA, 2009.4 Dreizen et al, 2008; IWA website, http://www.water.gov.il.
9
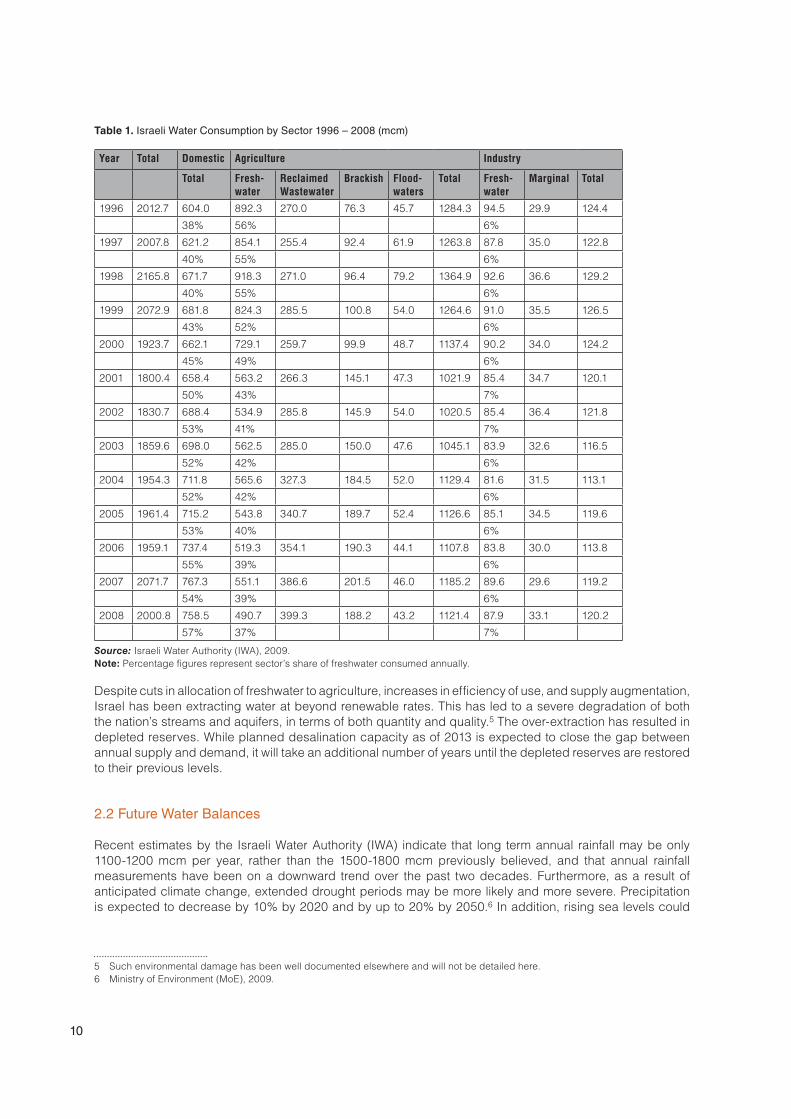
Table 1. Israeli Water Consumption by Sector 1996 – 2008 (mcm)
Year Total Domestic Agriculture Industry
Total Fresh-water
Reclaimed Wastewater
Brackish Flood-waters
Total Fresh-water
Marginal Total
1996 2012.7 604.0 892.3 270.0 76.3 45.7 1284.3 94.5 29.9 124.4
38% 56% 6%
1997 2007.8 621.2 854.1 255.4 92.4 61.9 1263.8 87.8 35.0 122.8
40% 55% 6%
1998 2165.8 671.7 918.3 271.0 96.4 79.2 1364.9 92.6 36.6 129.2
40% 55% 6%
1999 2072.9 681.8 824.3 285.5 100.8 54.0 1264.6 91.0 35.5 126.5
43% 52% 6%
2000 1923.7 662.1 729.1 259.7 99.9 48.7 1137.4 90.2 34.0 124.2
45% 49% 6%
2001 1800.4 658.4 563.2 266.3 145.1 47.3 1021.9 85.4 34.7 120.1
50% 43% 7%
2002 1830.7 688.4 534.9 285.8 145.9 54.0 1020.5 85.4 36.4 121.8
53% 41% 7%
2003 1859.6 698.0 562.5 285.0 150.0 47.6 1045.1 83.9 32.6 116.5
52% 42% 6%
2004 1954.3 711.8 565.6 327.3 184.5 52.0 1129.4 81.6 31.5 113.1
52% 42% 6%
2005 1961.4 715.2 543.8 340.7 189.7 52.4 1126.6 85.1 34.5 119.6
53% 40% 6%
2006 1959.1 737.4 519.3 354.1 190.3 44.1 1107.8 83.8 30.0 113.8
55% 39% 6%
2007 2071.7 767.3 551.1 386.6 201.5 46.0 1185.2 89.6 29.6 119.2
54% 39% 6%
2008 2000.8 758.5 490.7 399.3 188.2 43.2 1121.4 87.9 33.1 120.2
57% 37% 7%
Source: Israeli Water Authority (IWA), 2009.Note: Percentage figures represent sector’s share of freshwater consumed annually.
Despite cuts in allocation of freshwater to agriculture, increases in efficiency of use, and supply augmentation, Israel has been extracting water at beyond renewable rates. This has led to a severe degradation of both the nation’s streams and aquifers, in terms of both quantity and quality.5 The over-extraction has resulted in depleted reserves. While planned desalination capacity as of 2013 is expected to close the gap between annual supply and demand, it will take an additional number of years until the depleted reserves are restored to their previous levels.
2.2 Future Water Balances
Recent estimates by the Israeli Water Authority (IWA) indicate that long term annual rainfall may be only 1100-1200 mcm per year, rather than the 1500-1800 mcm previously believed, and that annual rainfall measurements have been on a downward trend over the past two decades. Furthermore, as a result of anticipated climate change, extended drought periods may be more likely and more severe. Precipitation is expected to decrease by 10% by 2020 and by up to 20% by 2050.6 In addition, rising sea levels could
5 Such environmental damage has been well documented elsewhere and will not be detailed here. 6 Ministry of Environment (MoE), 2009.
10
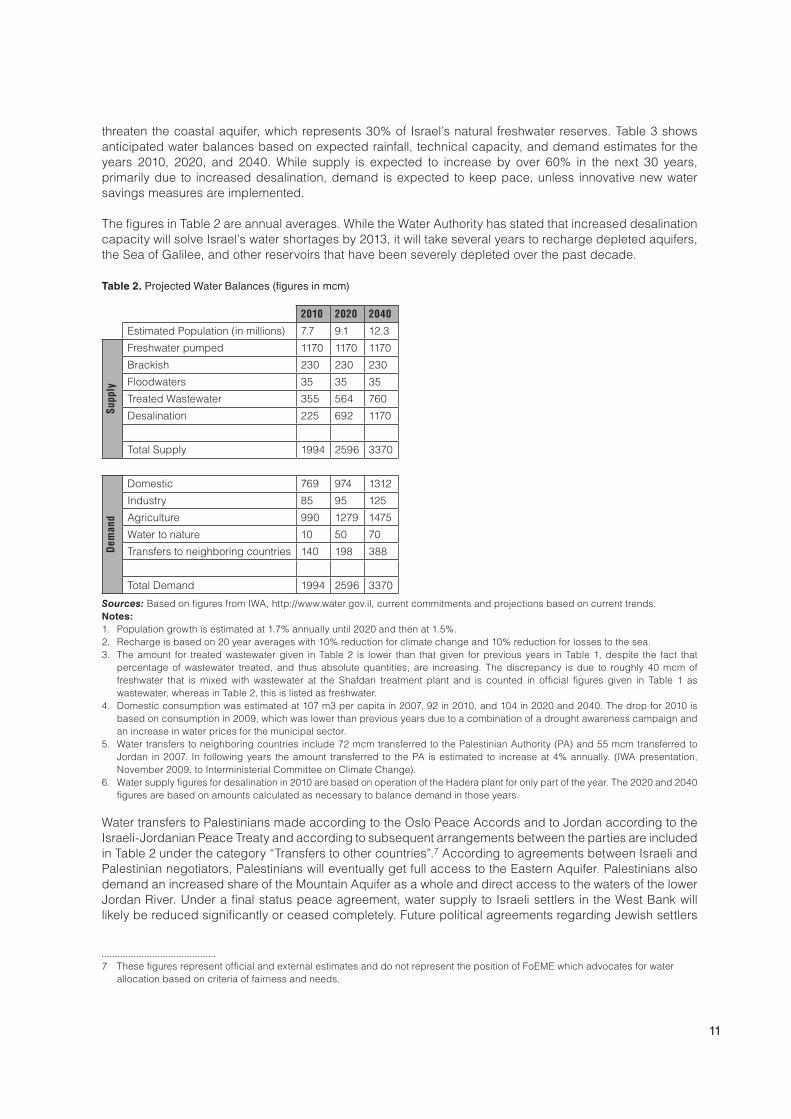
threaten the coastal aquifer, which represents 30% of Israel’s natural freshwater reserves. Table 3 shows anticipated water balances based on expected rainfall, technical capacity, and demand estimates for the years 2010, 2020, and 2040. While supply is expected to increase by over 60% in the next 30 years, primarily due to increased desalination, demand is expected to keep pace, unless innovative new water savings measures are implemented.
The figures in Table 2 are annual averages. While the Water Authority has stated that increased desalination capacity will solve Israel’s water shortages by 2013, it will take several years to recharge depleted aquifers, the Sea of Galilee, and other reservoirs that have been severely depleted over the past decade.
Table 2. Projected Water Balances (figures in mcm)
2010 2020 2040
Estimated Population (in millions) 7.7 9.1 12.3
Supp
ly
Freshwater pumped 1170 1170 1170
Brackish 230 230 230
Floodwaters 35 35 35
Treated Wastewater 355 564 760
Desalination 225 692 1170
Total Supply 1994 2596 3370
Dem
and
Domestic 769 974 1312
Industry 85 95 125
Agriculture 990 1279 1475
Water to nature 10 50 70
Transfers to neighboring countries 140 198 388
Total Demand 1994 2596 3370
Sources: Based on figures from IWA, http://www.water.gov.il, current commitments and projections based on current trends.Notes: 1. Population growth is estimated at 1.7% annually until 2020 and then at 1.5%.2. Recharge is based on 20 year averages with 10% reduction for climate change and 10% reduction for losses to the sea.3. The amount for treated wastewater given in Table 2 is lower than that given for previous years in Table 1, despite the fact that
percentage of wastewater treated, and thus absolute quantities, are increasing. The discrepancy is due to roughly 40 mcm of freshwater that is mixed with wastewater at the Shafdan treatment plant and is counted in official figures given in Table 1 as wastewater, whereas in Table 2, this is listed as freshwater.
4. Domestic consumption was estimated at 107 m3 per capita in 2007, 92 in 2010, and 104 in 2020 and 2040. The drop for 2010 is based on consumption in 2009, which was lower than previous years due to a combination of a drought awareness campaign and an increase in water prices for the municipal sector.
5. Water transfers to neighboring countries include 72 mcm transferred to the Palestinian Authority (PA) and 55 mcm transferred to Jordan in 2007. In following years the amount transferred to the PA is estimated to increase at 4% annually. (IWA presentation, November 2009, to Interministerial Committee on Climate Change).
6. Water supply figures for desalination in 2010 are based on operation of the Hadera plant for only part of the year. The 2020 and 2040 figures are based on amounts calculated as necessary to balance demand in those years.
Water transfers to Palestinians made according to the Oslo Peace Accords and to Jordan according to the Israeli-Jordanian Peace Treaty and according to subsequent arrangements between the parties are included in Table 2 under the category “Transfers to other countries”.7 According to agreements between Israeli and Palestinian negotiators, Palestinians will eventually get full access to the Eastern Aquifer. Palestinians also demand an increased share of the Mountain Aquifer as a whole and direct access to the waters of the lower Jordan River. Under a final status peace agreement, water supply to Israeli settlers in the West Bank will likely be reduced significantly or ceased completely. Future political agreements regarding Jewish settlers
7 These figures represent official and external estimates and do not represent the position of FoEME which advocates for water allocation based on criteria of fairness and needs.
11

are unlikely to make a difference in terms of Israel’s internal overall water demand however, as any reduction in their water consumption from sources in the West Bank would be replaced by increased consumption within Israel proper. Thus, the net effect on Israeli water consumption would likely be marginal.
2.3 Water Pricing and Shadow Values
Although water in the agricultural and industrial sectors is allocated by the government, consumption of water in all three primary sectors (agriculture, industrial, and domestic) is a function of price. For all sectors, however, the price of water is determined by regulatory bodies, and thus, is not reflective of its true market value or shadow price. The cost of desalination can be seen as representative of the marginal cost of additional water production. This is estimated at $0.56 per cubic meter. Actual costs are dependent on energy prices, and would likely increase should some type of carbon tax be implemented or should there be some spike in energy prices for other reasons.
In order to calculate the shadow value of freshwater, one needs to take into account environmental externalities associated with desalination as well. There are three primary environmental externalities associated with desalination: 1) emissions from energy consumption (primarily emissions of CO2, SO2, NOx, and particulate matter), 2) expropriation and exploitation of coastal land; and 3) damage to the marine environment from seawater intake and brine discharge. The cost of environmental damage due to energy-related emissions and shore-land expropriation are estimated at roughly $0.19 and $0.06-0.10 per cubic meter respectively.8 While several environmental impacts of desalination on the marine environment have been identified, their effects on the ecosystem and on ecosystem services are still not well understood. Therefore, no cost estimates are available. Thus, the $0.19 per cubic meter assessment of the value of the external costs associated with desalination should be viewed as a conservative, lower-bound estimated. Added to the cost of the desalination process itself, this places the shadow price of water at $0.88- 0.92 per cubic meter (see Table 3).
In evaluating the costs of use of desalination as a potential replacement for freshwater delivered via the National Water Carrier (NWC), the nation’s primary water delivery system, it is necessary to consider the relative costs of water delivery as well. Pumping and transport of water demand significant energy.9 Located closer to major population centers, desalination benefits from reduced delivery costs compared to the NWC. Should policy determine that less water be pumped into the NWC and kept in the Jordan River system, one would also need to subtract the saved delivery costs and the avoided externality costs from delivery via the NWC. In such a case, the adjusted shadow price of freshwater would be $0.65-0.69 (see Table 3).
8 These figures were based on a carbon price of $30 per ton. For a more detailed explanation of these costs, see the notes in Table 3 below. For a more detailed explanation of calculations of externalities associated with desalination in Israel in general, see Becker 2004 or Pareto 2008.
9 Pumping and treatment costs for water mean that transfer of water from the Kinneret (Sea of Galilee) to the southern coastal areas is only slightly cheaper (roughly $0.10 per cubic meter) than desalination. Actual differences in price depend on distance from the Kinneret and, given the mix of surface and groundwater, the relative share of Kinneret water consumed.
12
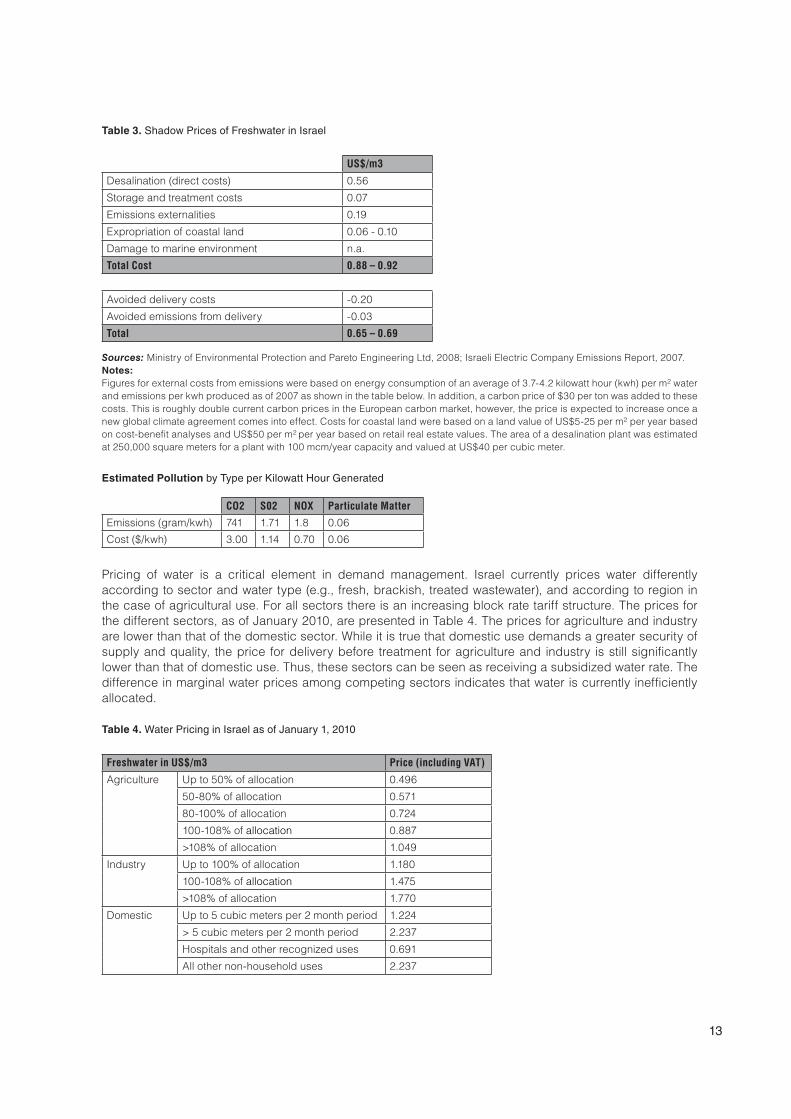
Table 3. Shadow Prices of Freshwater in Israel
US$/m3
Desalination (direct costs) 0.56
Storage and treatment costs 0.07
Emissions externalities 0.19
Expropriation of coastal land 0.06 - 0.10
Damage to marine environment n.a.
Total Cost 0.88 – 0.92
Avoided delivery costs -0.20
Avoided emissions from delivery -0.03
Total 0.65 – 0.69
Sources: Ministry of Environmental Protection and Pareto Engineering Ltd, 2008; Israeli Electric Company Emissions Report, 2007.Notes: Figures for external costs from emissions were based on energy consumption of an average of 3.7-4.2 kilowatt hour (kwh) per m2 water and emissions per kwh produced as of 2007 as shown in the table below. In addition, a carbon price of $30 per ton was added to these costs. This is roughly double current carbon prices in the European carbon market, however, the price is expected to increase once a new global climate agreement comes into effect. Costs for coastal land were based on a land value of US$5-25 per m2 per year based on cost-benefit analyses and US$50 per m2 per year based on retail real estate values. The area of a desalination plant was estimated at 250,000 square meters for a plant with 100 mcm/year capacity and valued at US$40 per cubic meter.
Estimated Pollution by Type per Kilowatt Hour Generated
CO2 S02 NOX Particulate Matter
Emissions (gram/kwh) 741 1.71 1.8 0.06
Cost ($/kwh) 3.00 1.14 0.70 0.06
Pricing of water is a critical element in demand management. Israel currently prices water differently according to sector and water type (e.g., fresh, brackish, treated wastewater), and according to region in the case of agricultural use. For all sectors there is an increasing block rate tariff structure. The prices for the different sectors, as of January 2010, are presented in Table 4. The prices for agriculture and industry are lower than that of the domestic sector. While it is true that domestic use demands a greater security of supply and quality, the price for delivery before treatment for agriculture and industry is still significantly lower than that of domestic use. Thus, these sectors can be seen as receiving a subsidized water rate. The difference in marginal water prices among competing sectors indicates that water is currently inefficiently allocated.
Table 4. Water Pricing in Israel as of January 1, 2010
Freshwater in US$/m3 Price (including VAT)
Agriculture Up to 50% of allocation 0.496
50-80% of allocation 0.571
80-100% of allocation 0.724
100-108% of allocation 0.887
>108% of allocation 1.049
Industry Up to 100% of allocation 1.180
100-108% of allocation 1.475
>108% of allocation 1.770
Domestic Up to 5 cubic meters per 2 month period 1.224
> 5 cubic meters per 2 month period 2.237
Hospitals and other recognized uses 0.691
All other non-household uses 2.237
13

Treated Wastewater & Brackish Water Price (including VAT)
Treated Sewage
Up to 100% of allocation 0.226
100-108% of allocation 0.282
>108% of allocation 0.338
Brackish Up to 100% of allocation 0.300
100-108% of allocation 0.375
>108% of allocation 0.450
Source: IWA 2010 http://www.water.gov.il/NR/rdonlyres/20F7141C-EF2F-4F41-A952-45EF3196649A/0/TarifaiMaim250310.pdfNotes: 1. The prices listed above include the cost of delivery only and do not include wastewater treatment costs. 2. Prices as of January 1, 2010 using the interbank exchange rate on this day. These prices are updated regularly, and their dollar value
varies with fluctuations in currency exchange rates. As such, they are presented in this document primarily for illustrative purposes in order to demonstrate the relative differences in sector prices.
3. Prices for agriculture can vary by region. The prices listed above are representative of typical costs. 4. The prices for treated sewage are for wastewater treated to quality necessary for unrestricted use. Wastewater for limited uses is
slightly cheaper, while higher quality wastewater from the Shafdan treatment center is slightly more expensive.
In 2009, the Israeli Water Authority (IWA) announced plans to raise prices to reflect actual production costs (not including environmental externalities). These included a policy to significantly raise the tariff rate on marginal consumption, i.e., on the third of a three block tariff, affecting consumption beyond 16 cubic meters per month per household.10 In addition, it called for a broader reform of prices to be implemented beginning in 2010.11 Although deemed necessary for limiting consumption by both the Head of the IWA and by an outside advisory panel, both policies encountered significant popular and political resistance by politicians and by the State Comptroller, who claimed that such reforms placed an unfair burden on poorer populations.12
Initial experience from the first reform, popularly dubbed the “drought tax”, indicated that it was effective in lowering consumption patterns by up to 20% from the previous year.13 Lowered consumption was evident even among those who were not affected by the increase in the marginal tariff rate, indicating that reduction was caused in part through the public awareness campaign and pressure on municipalities to cut use. Also surveys indicate that many, possibly most, people are unaware of their water consumption,14 and therefore were likely reacting to fears of price increases based on high profile coverage in news reports. As a result of the political protest, the drought tax was temporarily suspended and the future of both price policies is uncertain.
10 This is a representative figure. Actual amounts are adjusted per number of residents per household.11 The prices for domestic use provided in Table 5 are after the general reform. They do not include the drought tax, which was
frozen as of the time of publication of this report.12 State Comptroller Report, 2009. The National Committee of Inquiry Regarding the Management of the Water Economy in Israel,
2009.13 Hovel, 2010.14 According to a study reported by Peled (2009) 65% of Israelis did not know how much water they consume, and 77% did not
know how much they will pay for water.
14

3 Overview of Existing Policies & Regulations Governing Water in Israel
Several laws and regulations currently govern Israeli water management. Regulatory oversight is split among several governmental ministries and agencies, leading to overlapping jurisdiction and institutional conflicts of interest in national water management. Several powers were centralized in a Water Authority in 2008 in order to minimize the fractured nature of the water regulatory framework; however, problems of coordination of regulatory oversight still exist in Israel and inhibit efficient water management.
The primary legislation governing Israeli water management is summarized below:
− The Water Law of 1959 is the most significant piece of legislation overseeing water management in Israel. The law declares all water property of the government and mandates that the government manage these waters for the public good. It establishes a water commission (now part of the Water Authority) that is responsible for allocations of water among competing sectors and for pricing of water. Additionally, it has the responsibility of protecting the natural sources of water. According to the law, water can be allocated only to recognized objectives. Currently, the agricultural and industrial sectors receive water allocations, while the domestic sector has largely unrestricted access to water. A 2004 amendment to the Water Law added environmental and aesthetic causes to the list of legitimate objectives. Prior to this period streams and other aquatic ecosystems tended to be allocated only what little was left over after other uses received their allocations. The change, while significant from a legal perspective, has yet to result in substantial increases in allocation to environmental flows. − The Streams and Springs Authorities Law allows the government (now the Minister of the Environment, after consultation with local authorities and the Minister of the Interior) to establish a regulatory authority for a particular river or other water source. Such authorities are empowered to undertake steps to protect and conserve the stream and its banks, to abate nuisances and prevent pollution. River Authorities have been created for the Yarkon and Kishon Rivers. The Jordan River does not have an individual authority to oversee its management. − The Drainage and Flood Prevention Law creates Drainage Authorities for specific streams. A Lower Jordan River Drainage Basin (LJRDB) exists under the mandate of this law. While the primary function of drainage authorities has been channelization of streams and ensuring proper drainage of agricultural runoff, the LJRDB lists as its official objectives protection of water quality from pollution and planning and protection of water sources including environmental values. − The Local Authorities Sewage Law requires local authorities to maintain sewage systems. Successive regulation pursuant to this law has detailed standards for minimum treatment levels.
15
− The Public Health Ordinance grants the Ministry of Health oversight of drinking water standards. Rules promulgated under the Public Health Ordinance dictate standards for treatment and reuse of wastewater for agricultural products. − The Water and Sewage Association Law, passed in 2001, calls for the privatization of municipal water delivery and wastewater treatment.
National Planning Outlines #34 and #35, national statutory planning guidelines, call for integrated land and water management in general and specifically call for the development of a master plan for each river and major stream. A statutory agency, the River Restoration Administration, was created by the Ministry of Environment and the Jewish National Fund (KKL) in 1993 to promote and oversee the rehabilitation of Israel’s streams. The Lower Jordan River Drainage Authority with responsibility from the Sea of Galilee to the Bezeq Stream on the Green Line has created a Lower Jordan River Management Committee who under the auspices of the Ministry of Environment has issued Terms of Reference for the preparation of a master plan for the river’s rehabilitation. The master plan is expected to be completed by 2011.
Several other laws and regulations also impact water use, water quality, or other aspects of river management, which are not detailed above. These include those regulating solid waste, public health, business licensing and zoning, and others.
16

4 Potential for Water Conservation in the Domestic and Municipal Sector
4.1 Composition of Domestic and Municipal Water Consumption
As mentioned above, domestic and municipal water consumption now represents the largest consumer of freshwater in Israel. For the 2005-2007 period, water consumption for household use amounted to roughly 66 cubic meters per capita (Table 5). Of this, toilet flushing and showering represent the largest individual uses, accounting for 35% each of household use. Household consumption represents over 62% of urban water consumption. Other urban water uses, such as irrigation of public parks and gardens, commercial and other non-residential urban uses, account for an additional 31 cubic meters per capita, or roughly 29% of urban use. Water losses from leakage in the urban sector account for an additional 10-15% of water delivered. (Figures for water losses are debated, and are believed to be highly variable across municipalities.15)
Table 5. Domestic and Municipal Water Consumption by Use
Uses % liters/cap/day m3/cap/year
Toilet Flushing 35% 60 21
Drinking, cooking, and dishwashing 20% 30 12
Bathing 35% 60 21
Laundry and cleaning 5% 8 3
Home gardening 5% 8 3
Total Household 100% 166 66
Municipal gardening 17
Commercial and other non-domestic urban uses 9
Leakage and losses 16
Miscellaneous 5
Total Domestic and Municipal 107
Source: IWA website, http:www.water.gov.il.Note: Based on 2005-2007 figures
15 Eilon, 2009.
17

Several options exist for reducing water consumption and for improving efficiency of water used in the domestic and municipal sector. Options explored in this study include awareness raising, alterations to types of plants in gardens and parks, reduction in water losses due to leakages, rainwater collection, and reuse of grey-water (water recycled within the household). Each option will be discussed separately below.
As mentioned above, price reforms are also an integral component in any plan for water management. Given both the government’s stated commitment to pricing water such that it reflects actual supply costs and to implement the polluter pays principle, it is clear that higher prices are necessary. Conducting an actual estimate of elasticity of demand for urban water in order to calculate the water savings and economic cost of various water pricing reforms is beyond the scope of this study. As such, water pricing measures are not listed among the policy options investigated. It should be noted, however, that while domestic and municipal sector water demand is generally relatively inelastic, it is not completely so. In fact, several studies of urban water demand from around the world have showed that elasticities tend to range from -0.3 to -0.8, meaning that a 10% rise in prices would result in a 3%-8% decline in consumption.16 One study on water demand in Jerusalem indicated that elasticity may be low, as low as -0.18.17 However, demand is still responsive to pricing, and it is clear that price reform should be considered as an essential part of any and all other policies to reduce water consumption.
4.2 Awareness-Raising for Urban Water Demand Management
In response to the current drought, the IWA has, for the past several years, run campaigns designed to raise public awareness regarding the need for water conservation. These campaigns included use of celebrities in television, radio, newsprint, and billboard ads, classroom learning units in schools, distribution of materials for posting in workplaces and public buildings, and more. The campaigns are believed to have had some success in lowering consumption. Other campaigns such as distribution of water-saving filters (“chaschamim”) to be placed in faucets are planned at a relatively low cost, but have yet to be implemented.
In terms of savings potential, three scenarios were explored. These are listed as low, moderate, and high conservation potential. A breakdown of the assumptions behind the different scenarios and the amount of water assumed to be conserved under each is offered in Table 6. Over the course of 2009, Israel has demonstrated that the high range scenario is indeed feasible, as a nearly 20% reduction in overall domestic use has already taken place through a combination of awareness raising and pricing.18 Whether this reduction is sustainable over the long term and whether further reductions will be as easily achieved are open questions, as the campaign was calling for temporary sacrifice to avert a drought. However, the initial results are at least encouraging. Other countries have examples of reductions of rates exceeding 40% due largely to awareness raising campaigns. In such cases, initial levels of per capita water use were higher than in Israel making the percentage reductions easier.
It is important to note that decreased consumption brings with it decreased costs, making these options desirable from both an environmental and economic perspective. Decreased demand will reduce the need for desalination saving the treatment, delivery, and externality costs. This is not all a net benefit, however, because decreased consumption will also reduce the amount of sewage available for reuse. Furthermore, the sewage that is produced will have a higher concentration of contaminants, and thus, will likely need additional treatment. Thus, the opportunity costs of decreased sewage need to be subtracted from the benefits of avoided desalination costs. Assuming that an awareness raising campaign would cost roughly US$10 million, the cost per cubic meter conserved would be between US$0.07-0.13. When considering avoided desalination, delivery, and sewage treatment costs, this puts the cost at roughly 10% that of desalinated water.
16 See, for example, Bauman et al, 1998; Dalhuisen et al, 2003; Fredrick et al, 1996; Olmstead, 2007. 17 Dahan and Nisan, 2007.18 Hovel, 2010.
18
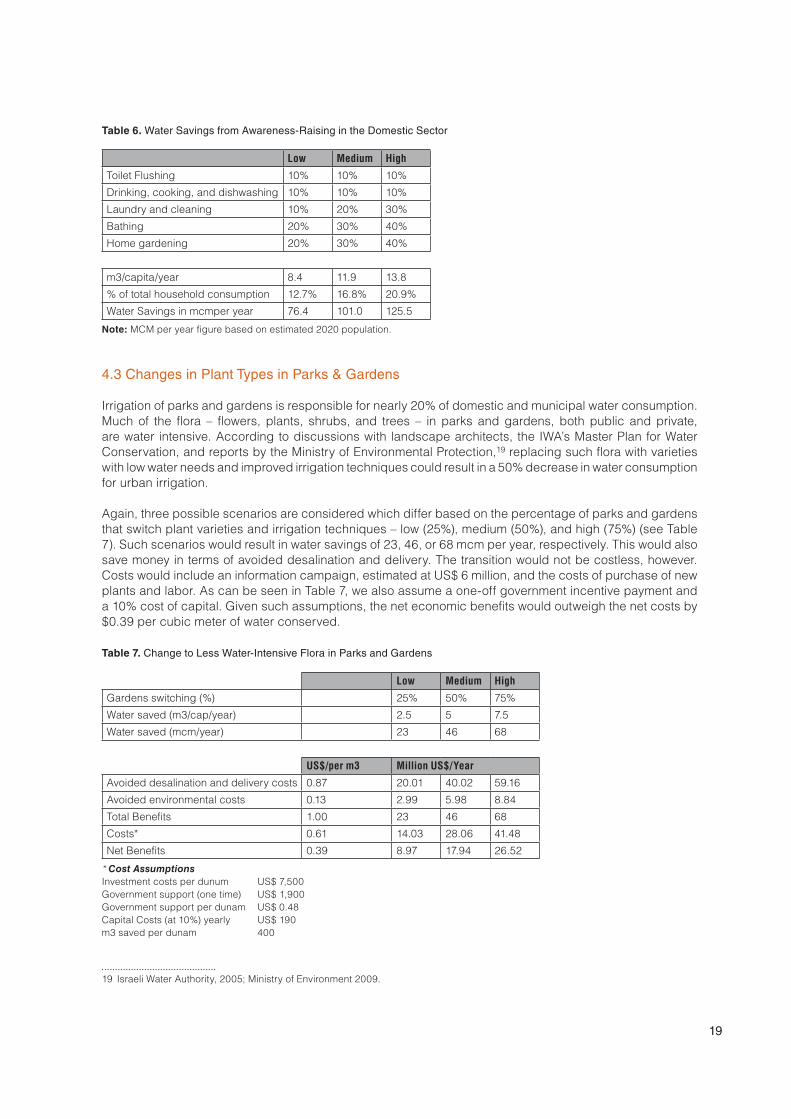
Table 6. Water Savings from Awareness-Raising in the Domestic Sector
Low Medium High
Toilet Flushing 10% 10% 10%
Drinking, cooking, and dishwashing 10% 10% 10%
Laundry and cleaning 10% 20% 30%
Bathing 20% 30% 40%
Home gardening 20% 30% 40%
m3/capita/year 8.4 11.9 13.8
% of total household consumption 12.7% 16.8% 20.9%
Water Savings in mcmper year 76.4 101.0 125.5
Note: MCM per year figure based on estimated 2020 population.
4.3 Changes in Plant Types in Parks & Gardens
Irrigation of parks and gardens is responsible for nearly 20% of domestic and municipal water consumption. Much of the flora – flowers, plants, shrubs, and trees – in parks and gardens, both public and private, are water intensive. According to discussions with landscape architects, the IWA’s Master Plan for Water Conservation, and reports by the Ministry of Environmental Protection,19 replacing such flora with varieties with low water needs and improved irrigation techniques could result in a 50% decrease in water consumption for urban irrigation.
Again, three possible scenarios are considered which differ based on the percentage of parks and gardens that switch plant varieties and irrigation techniques – low (25%), medium (50%), and high (75%) (see Table 7). Such scenarios would result in water savings of 23, 46, or 68 mcm per year, respectively. This would also save money in terms of avoided desalination and delivery. The transition would not be costless, however. Costs would include an information campaign, estimated at US$ 6 million, and the costs of purchase of new plants and labor. As can be seen in Table 7, we also assume a one-off government incentive payment and a 10% cost of capital. Given such assumptions, the net economic benefits would outweigh the net costs by $0.39 per cubic meter of water conserved.
Table 7. Change to Less Water-Intensive Flora in Parks and Gardens
Low Medium High
Gardens switching (%) 25% 50% 75%
Water saved (m3/cap/year) 2.5 5 7.5
Water saved (mcm/year) 23 46 68
US$/per m3 Million US$/Year
Avoided desalination and delivery costs 0.87 20.01 40.02 59.16
Avoided environmental costs 0.13 2.99 5.98 8.84
Total Benefits 1.00 23 46 68
Costs* 0.61 14.03 28.06 41.48
Net Benefits 0.39 8.97 17.94 26.52
* Cost Assumptions Investment costs per dunum US$ 7,500Government support (one time) US$ 1,900Government support per dunam US$ 0.48 Capital Costs (at 10%) yearly US$ 190m3 saved per dunam 400
19 Israeli Water Authority, 2005; Ministry of Environment 2009.
19

4.4 Reduction in Leakages and Associated Water Losses
Water losses in delivery, measured as water pumped into the delivery system minus metered water consumed at the final destination, accounts for 10-15% of domestic water consumption.20 Most of this is due to leakages in the system, although some portion may be attributed to illegal connections and other non-metered uses. Such a percentage of water losses is not considered high by international standards. Many urban areas in both developing and industrialized countries have water loss rates double or triple that found in Israel. This is especially common in cities with aging infrastructure. Still, the rate of water losses can be reduced in Israel.
In the three scenarios considered, water losses are reduced by 20%, 35%, and 50%. These result in water savings of 29, 51, or 73 mcm per year, respectively (see Table 8). Cost savings from reduced leakage were calculated at $1.05 per cubic meter conserved (in line with the assumptions made for the previous two conservation options). The cost of upgrading infrastructure is estimated at $0.30 - $0.60. Thus, such measures would result in a net cost savings of $0.45 - $0.75 per cubic meter.
Table 8. Reduction of Leakage and Water Losses
Low Medium High
Losses reduced (%) 20% 35% 50%
Water saved (m3/cap/year) 3.2 5.6 8
Water saved (mcm/year) 29 51 73
US$/per m3 Million US$/Year
Costs (roughly) 0.30-0.60 8.7-17.4 15.3-30.6 21.90-43.80
Benefits (avoided costs) 1.05 30.45-60.9 53.55-107.10 76.65-153.30
Net Benefits 0.45-0.75 13.05-52.2 22.95-91.80 32.85-131.40
Note: Benefits do not include environmental impacts.
4.5 Decentralized Rainwater Collection and Storage
According to some reports up to 100 mcm of water is lost due to uncaptured stormwater runoff in urban areas in Israel.21 Capture of runoff in urban areas requires both infrastructure and areas for storage. Given that large storm events that generate large amounts of runoff are infrequent, that appropriate areas for storage are not always available in built environments, and the opportunity cost of land in urban areas is often quite high, many believe that large-scale urban stormwater retention facilities in Israel are still not economically justified.22 That said, the Jewish National Fund (KKL) is developing a pilot project for urban stormwater capture,23 the results of which are still unknown. As such projects are uncertain and are already incorporated into government estimates of future available supplies, they are not considered further here.
Rather than large-scale centralized stormwater retention systems, in many countries, rainwater is collected using rooftop or garden systems. In Israel such systems would be most valuable in the coastal regions for capture of water that would otherwise flow into the sea unutilized. To date, the Ministry of Health has not approved the use of such rooftop collection systems. We undertake an estimate of the potential water savings under the assumption that approval will not be an issue. There is no available data on how much water could be captured with decentralized rooftop collection systems, and it should be noted that not all water that would be stored by such systems would represent a net savings of water, as some of this would have gone towards recharging groundwater. Furthermore, it should be noted that not all buildings are appropriate for such storage systems.
20 Eilon, 2009 21 Shmueli, 2008A.22 Shmueli, 2008B.23 Shmueli, 2008A; Ministry of Environment, 2009.
20

Assuming that all new buildings are required to be built in such a manner as to collect rainwater and that a share of existing buildings are equipped with rainwater collection systems, it is calculated that between 4 and 13 mcm could be conserved per year by 2020 and that 15 to 24 mcm could be conserved by 2040 (see Table 9). Assuming roughly 350 millimeters (mm) of rainfall captured yearly,24 new buildings added to the existing housing stock at a rate of 1.4% yearly, and initial investments of $3000 per structure, net costs of such a policy are anticipated to outweigh net cost savings by roughly $1.55 per cubic meter. This does not include any costs that would be necessary to treat the water or the costs of any hazards or nuisances that might occur, such as mosquito breeding, damage to rooftops, etc. As the amount of potential water conserved is relatively small and costs are relatively high, such a decentralized rooftop collection system does not seem to be an efficient means of large-scale water conservation in Israel, although it may be efficient for certain households. Several households have, in fact, installed such systems, which has both a direct water conservation value as well as an educational value to stress the capacity of individual action.
Table 9. Rainwater Collection and Storage
Low Medium High
New buildings 100% 100% 100%
Existing buildings 0 10% 30%
Water saved by 2020 (mcm/year) 4 7 13
Water saved by 2040 (mcm/year) 15 18 24
US$/per m3 Million US$/Year (2020 / 2040)
Avoided desalination and delivery costs 0.87 3.48 / 13.05 6.09 / 15.66 11.31 / 20.88
Avoided environmental costs 0.13 0.52 / 1.95 0.91 / 2.34 1.69 / 3.12
Total benefits 1.00 4.00 / 15.00 7.00 / 18.00 13.00 / 24.00
Costs 2.14 8.56 / 32.10 14.98 / 38.52 27.82 / 51.36
Net Costs 1.14 4.56 / 17.10 7.98 / 20.52 14.82 / 27.36
4.6 Grey Water
Reuse of water within a household – so called grey water – is another possibility for water conservation. Such systems recycle water from uses such as bathing and cooking to uses such as toilet flushing and gardening, which do not need water of drinking quality. Such systems not only offer potential water savings for households, but also reduce the need for sewage transport and treatment, and save the associated direct and environmental costs.
As opposed to reuse of treated sewage, for which Israel is a world leader, little progress has been made on grey water systems in Israel. Several reasons account for this relative lack of adoption of grey water in Israel:
− Household grey water systems require new separate piping, storage facilities, and new building codes which demand both infrastructure and administrative costs; − The Ministry of Health has not approved widespread use of grey water, although there is considerable public pressure to do so, including a private Member’s bill submitted to Knesset; − Reuse of grey water for gardening and irrigation would likely have a negative effect on soil quality and on groundwater quality; − Although less sewage would be produced, the sewage that is sent would be of worse quality (more concentrated), increasing the cost of treatment, which would offset some of the savings from reduced quantities delivered;
24 Not all rainfall, which averages 500-600 mm in the coastal areas, could be captured.
21
Currently most household wastewater is reused in agriculture. By reducing total quantities of sewage produced, grey water systems would save households the costs of water delivery and treatment, but would reduce the amount of sewage available for treatment and reuse by farmers.
Several systems for grey water reuse exist. This study examines two such systems:
− A system in which grey water is used within the household itself by channeling water from showers and sinks into toilets so that no freshwater is used for toilet flushing. − A system in which grey water is used to irrigate gardens.
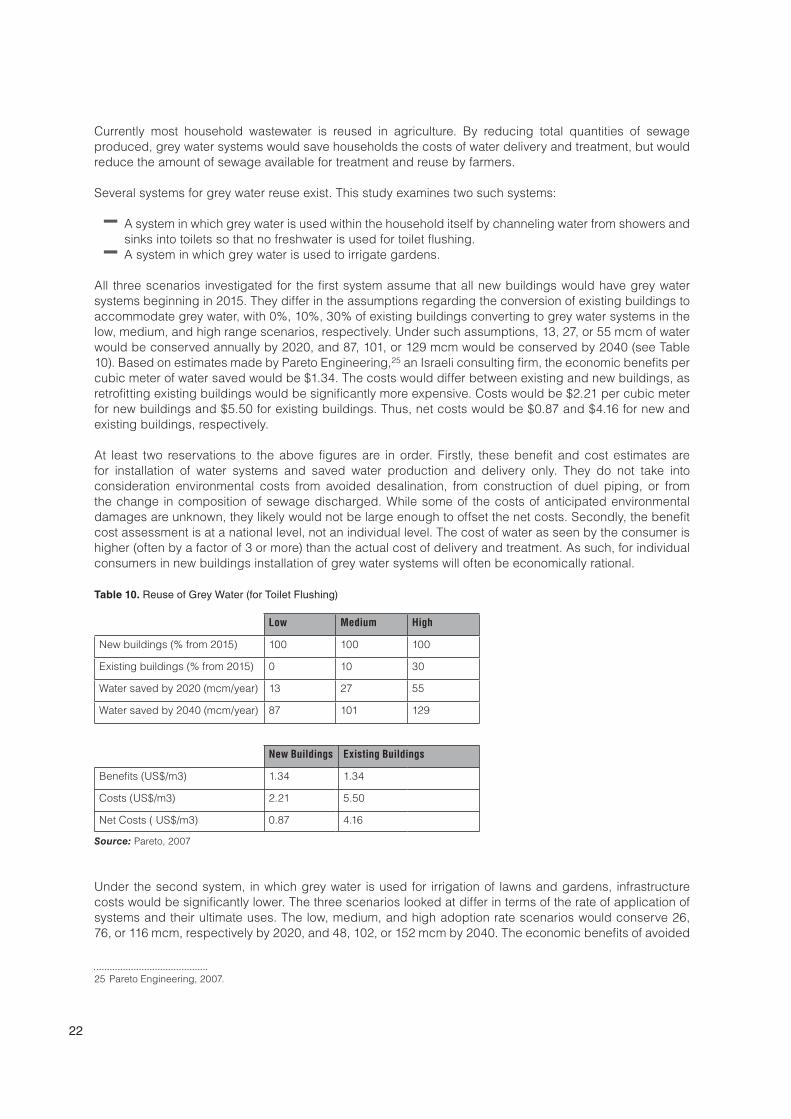
All three scenarios investigated for the first system assume that all new buildings would have grey water systems beginning in 2015. They differ in the assumptions regarding the conversion of existing buildings to accommodate grey water, with 0%, 10%, 30% of existing buildings converting to grey water systems in the low, medium, and high range scenarios, respectively. Under such assumptions, 13, 27, or 55 mcm of water would be conserved annually by 2020, and 87, 101, or 129 mcm would be conserved by 2040 (see Table 10). Based on estimates made by Pareto Engineering,25 an Israeli consulting firm, the economic benefits per cubic meter of water saved would be $1.34. The costs would differ between existing and new buildings, as retrofitting existing buildings would be significantly more expensive. Costs would be $2.21 per cubic meter for new buildings and $5.50 for existing buildings. Thus, net costs would be $0.87 and $4.16 for new and existing buildings, respectively.
At least two reservations to the above figures are in order. Firstly, these benefit and cost estimates are for installation of water systems and saved water production and delivery only. They do not take into consideration environmental costs from avoided desalination, from construction of duel piping, or from the change in composition of sewage discharged. While some of the costs of anticipated environmental damages are unknown, they likely would not be large enough to offset the net costs. Secondly, the benefit cost assessment is at a national level, not an individual level. The cost of water as seen by the consumer is higher (often by a factor of 3 or more) than the actual cost of delivery and treatment. As such, for individual consumers in new buildings installation of grey water systems will often be economically rational.
Table 10. Reuse of Grey Water (for Toilet Flushing)
Low Medium High
New buildings (% from 2015) 100 100 100
Existing buildings (% from 2015) 0 10 30
Water saved by 2020 (mcm/year) 13 27 55
Water saved by 2040 (mcm/year) 87 101 129
New Buildings Existing Buildings
Benefits (US$/m3) 1.34 1.34
Costs (US$/m3) 2.21 5.50
Net Costs ( US$/m3) 0.87 4.16
Source: Pareto, 2007
Under the second system, in which grey water is used for irrigation of lawns and gardens, infrastructure costs would be significantly lower. The three scenarios looked at differ in terms of the rate of application of systems and their ultimate uses. The low, medium, and high adoption rate scenarios would conserve 26, 76, or 116 mcm, respectively by 2020, and 48, 102, or 152 mcm by 2040. The economic benefits of avoided
25 Pareto Engineering, 2007.
22

water delivery would be roughly $0.87 per cubic meter. The costs differ based on whether public or private gardens were being irrigated (see Table 11). Net costs for grey water for irrigation are estimated at $1.26 and $0.45 per cubic meter for private and public gardens respectively. Again, such costs do not include environmental costs, which in this case would also include possible soil contamination and degradation of groundwater quality.
Table 11. Reuse of Grey Water (for Irrigation of Parks and Gardens)
Low Medium High
Public parks irrigated (%) 25 50 75
Private gardens irrigated (%) 0 15 35
Water saved by 2020 (mcm/year) 36 76 118
Water saved by 2040 (mcm/year) 48 102 156
Public Parks Private Gardens
Benefits (US$/m3) 0.87 0.87
Costs (US$/m3) 1.32 2.13
Net Costs (US$/m3) 0.45 1.26
Source: Pareto, 2007
4.7 Summary of Domestic and Municipal Water Conservation Options
Of the six options examined, three appear to offer genuine cost savings: awareness raising, change in plants and gardening techniques, and water loss reductions. Thus, these should be prioritized for implementation as they offer both environmental and economic benefits. Together they would conserve up to 267 mcm per year, or up to one third of total anticipated domestic and municipal consumption. Rainwater catchment and storage and grey water systems demonstrated water conservation potential but were relatively expensive options, with costs higher than that of desalination. The potential water savings and costs per cubic meter saved are summarized in Table 12.
Table 12. Summary of Potential Water Conservation in Domestic and Municipal Sector
Cost Grouping Policy Wedge Water Conserved by 2020 (mcm/year) Cost (US$/m3)
Low Medium High Gross Net
Low Cost Awareness Raising 76 101 126 0.12 -1.22
Moderate Cost Water-conserving Plants 23 46 68 0.61 -0.39
Reduced Water Losses 29 51 73 0.45 -0.6
High Cost Rooftop Rainwater Collection
4 7 13 2.14 1.14
Grey water Use (Toilets) 13 27 55 2.21 1.34
Grey water Use (Irrigation) 36 76 116 1.32 0.45
23

24

5 Potential for Water Conservation in the Agricultural Sector
5.1 Composition of Agricultural Water Consumption
Though its share of national freshwater resources has declined steadily over the past two decades, including its use of reclaimed wastewater and brackish water, agriculture is still the largest water consuming sector in Israel. Agriculture accounts for nearly 40% of freshwater consumption in Israel and over 50% of total water consumption (see Table 1). In contrast, it contributes only roughly 1-2% to national Gross Domestic Product (GDP) and employment (CBS, 2009).
Table 13 provides water consumption figures for the agricultural sector by crop type for 2007. Citrus and other orchard crops make up nearly half of all freshwater and total water consumption, and vegetable crops account for nearly another quarter. Table 14 also indicates whether the crops are primarily for domestic consumption or for export.
Table 13. Agricultural Water Consumption by Crop Type (2007)
Water Type
Freshwater Brackish Reclaimed Wastewater
Other (Stormwater)
Total
Crop Type Primary Market*
Citrus 1 28 5 145 0 178
Other Orchard Crops 1-0 262 10 50 29 351
Feedstock 0 46 0 20 0 66
Nuts and Cotton 1 25 0 64 35 124
Vegetables 1 139 76 60 0 275
Flowers 1 41 5 5 0 51
Livestock 0 35 0 0 0 35
Aquaculture 0 11 49 0 45 106
Total 587 145 345 109 1186
Sources: Israeli Water Authority, 2009 and Ministry of Agriculture, 2009* Note: 0 = domestic, 1 = export Figures based on 2007 consumption, updated with current values of sewage.
25

5.2 Effects of Water Price Increases on Freshwater Consumption
In general, the price of fresh water for agriculture covers the cost of pumping and delivery. As such, it is higher than the price of water to agriculture in most of the world. However, it is still below market rates in Israel, at less than half the price of desalinated water. As such, it can still be viewed as subsidized. Because of below market pricing of freshwater in agriculture there are opportunities for relatively low-cost water savings in this sector.
Agriculture produces numerous environmental impacts, both positive (e.g., preservation of open spaces which face continuous development threats) and negative (e.g., soil erosion, dispersion of pesticides into the soil and water). To the extent that they produce positive externalities, agriculture warrants government assistance, but this support need not be given via water subsidies. This is especially true of agriculture that does not provide such benefits, e.g., greenhouse agriculture, for which water use differs little than industrial uses.
Similarly, agriculture also provides food security to the country, and thus, it can be argued that it is providing a national service. However, such a rationale is not valid for export crops or non-edible crops such as cotton. To the extent that it is valid, the question is whether the contribution to food security outweighs the depletion of water reserves and associated environmental damages.
Comparing the price for water by crop type, which differs by region, with a baseline of the cost of desalinated water (adjusted to account for delivery costs), it is possible to estimate the relative amount of water that could be saved and thus, desalination avoided. Table 14 shows this data, along with an estimation of the relative profitability of each crop. In interpreting the data, several comments are in order. Firstly, much of the crops are already planned to be irrigated primarily by reclaimed wastewater in the near future. Secondly, prices for the crops, especially more profitable orchard crops like apples, can be volatile. Changes in their relatively profitability would make cuts in water supply less justifiable economically. Thirdly, one can assume that at least some of the water savings from less profitable crops would be rechanneled into more profitable crops, and thus, stay within agriculture. Lastly, high-end crops would continue to be grown, and in such cases, price rises would simply be a transfer of money from farmers to water suppliers.
Costs of price rises in the agricultural sector include the loss in profits to farmers, the loss of sunk costs in infrastructure, the effect of any long-term unemployment in the sector, and the loss of environmental services in terms of preservation of open space and provision of habitat.26 Unemployment is generally not considered as a cost in most economic models, which assume full employment. However, if price rises force farmers to leave agriculture and these farmers do not find employment in other sectors, the price rises would have a social cost. Furthermore, it is likely that any price increases to farmers would be accompanied by government compensation, at least for a period of several years. These costs would obviously reduce the economic benefits of water savings. On the other hand, much of agricultural work is done by foreign laborers. Any reduction in societal costs due to declines in the number of foreign labors due to declines in agricultural production, would therefore add economic benefits. No attempt to quantify such costs has been undertaken, however.
26 In strictly environmental terms, loss of these environmental benefits would be partially offset by the avoided environmental damage from desalination. It should be noted too, that vegetables and flowers which are generally grown in greenhouses that involve high sunk capital costs, are generally less sensitive to price increases. These crops, however, also provide less environmental benefits in terms of preservation of open space and therefore are less justified in receiving water at low prices.
26

Table 14. Estimate of Price Increases on Agricultural Freshwater Consumption
Crop Type Primary Market*
Freshwater(mcm/yr)
Primary Growing Location
2009 Price (US$/m3)
Profitability Reduction in Demand (mcm/year)
Citrus 1 28 Golan, Hula, Jezreel Valley
0.18 Moderate 18
Other Orchard Crops 1-0 262 Golan, Galilee, Jordan Valley
0.18-0.35 Moderate 40
Animal Feed 0 46 Hula, Jordan Valley
0.18 Moderate 0
Nuts and Cotton 1 25 Hula, Jordan Valley
0.18 Moderate 15
Vegetables 1 139 Center, South 0.35 Moderate-High 50
Flowers 1 41 Center, South 0.35 Moderate-High 15
Livestock & Aquaculture 0 46 Broadly distributed
0.35 High 0
Total 587 138
* Note: 0 = domestic, 1 = export
5.3 Effect of International Trade Barriers on Agricultural Water Consumption
In addition to changes in the price of water, changes in levels of international trade barriers, both tariff and non-tariff, can affect water demand in the agricultural sector. Currently, trade barriers protecting local industry exist in the dairy industry, which is nearly completely protected from exports (with the exception of minor imports required by the World Trade Organization (WTO) and bilateral trade agreements), and to some degree in the fruit and vegetable sector, depending on the crop, the local price, and the growing season. Domestic banana production benefits from phyto-sanitary regulations which serve as non-tariff barriers. Most other agricultural production is not seen as likely to be affected by removal of trade barriers. 27
Removal of trade protection such as quotas for dairy products would primarily affect the demand for powdered milk, not fresh dairy products. Removal of such barriers could make related production facilities for up to half of current production redundant. The estimated water savings from such measures is 30 mcm per year, nearly two thirds of the freshwater use in this sector (see Table 15). Bananas are water-intensive crops, grown in Israel primarily in the Jordan River basin and, but for the trade barriers, would likely not be competitive vis-à-vis robust and high quality international supplies. Removal or relaxation of the phyto-sanitary restrictions would result in water savings of up to 15 mcm per year, or roughly three-fourths of the freshwater consumption dedicated to banana production.
In the case of both dairy and bananas, the effects on the market would likely be dramatic, and one can expect fierce political resistance to removal of current protections. If such barriers were to be removed, it is likely that farmers would be awarded compensation. The economic benefits of removal of such trade barriers would be largely contingent on the scale of compensation, and thus, no estimates are made herein.
27 Meat (primarily beef, lamb, and poultry) production would likely not be affected by international trade policies, for several reasons, including concerns over freshness, demand primarily for kosher meats, and the fact that imports for frozen meats already face little restrictions. Also, Israeli tastes have become accustomed to local varieties of fruits and vegetables, meaning that they may not be completely substitutable with foreign imports. This study focuses on dairy and bananas as the agricultural commodities most threatened by trade liberalization.
27

Table 15. Effect of Removal of Trade Barriers on Agricultural Freshwater Consumption
Product Type Measure Current Water Consumption (mcm/year)
Reduction in Water Demand (mcm/year)
Milk powder Removal of protection for milk powder 46 30
Bananas Removal of phyto-sanitary regulations protecting bananas
20 15
Total 66 45
Sources: Israeli Water Authority, 2009; Ministry of Agriculture, 2009.
28

6 Reduced Water Losses from Reservoirs
Because of high temperatures, considerable amounts of Israel’s annual rainfall evaporate before they are utilized. For instance, according to estimates, roughly 280 mcm evaporates per year annually from the Kinneret (Sea of Galilee) alone.28 This compares to 380 mcm that is pumped annually from the Sea into the national water system. There are also indications that temperatures have been rising and evaporation increasing in the region over the last 30 years, and that these changes may be indicative of future trends due to long term climate change.29 Reducing water losses due to evaporation from exposed surface water reservoirs represents another possible option for conservation.
In terms of fresh water, we estimate that covering the reservoir at Beit Netufa could conserve up to 25 mcm per year. Other freshwater reservoirs could add additional supplies. Given the relatively paucity of natural wetlands in the region, covering natural reservoirs would, however, have undesirable environmental impacts in terms of reducing available freshwater habitat. Therefore such policies should be evaluated critically. The major opportunity for water savings from covering of reservoirs is likely to be from covering of treated sewage reservoirs. In 2008, Israel produced nearly 400 mcm of treated sewage. This amount is expected to increase to 564 mcm by 2020 and 760 mcm by 2030. Evaporation from these reservoirs is estimated at 12-15%. In this analysis we assume that covering the reservoirs will reduce evaporation by 60-75%, that is, it will save 10% of the total amount of water used (see Table 16).
Several methods for reducing such losses exist, ranging from coagulating powders to simple plastic or material covers to covering with solar panels. At this stage, only the powders and plastic and material covers are technologically and economically feasible. Should the solar panels become feasible, this would generate energy that would offset the costs. It is estimated that current methods for covering reservoirs would cost roughly US$1.25-1.50 per dunam per year. This would result in water savings of US$0.007 per cubic meter saved, making such methods extremely cost effective.
Several problems exist with implementing measures limiting evaporation losses from reservoirs. From a technical perspective, there are problems with covering of reservoirs, for instance, development of algae on the interior of the coverings and coverings blowing away or becoming detached. Several more advanced
28 Feitelson, Gazit, Fischhendler, 2005.29 Kafle and Bruins, 2009.
29

systems are available which claim to be more reliable and sturdy, which maintain water quality. Some of these, e.g. companies such as Aquate and Hexa-cover, are equipped with solar panels. Although these systems have higher upfront costs than simpler covers, they claim to offer returns through energy produced.
As in the case of freshwater, covering treated wastewater reservoirs also would involve a loss of habitat and water for wildlife. The costs of these losses of ecological services are not included in the estimates in this study and should be evaluated on a case by case basis.
Table 16. Reduced Evaporation from Reservoirs
Water Source / Year 2010 2020 2030
Freshwater (mcm) 25 25 25
Treated Wastewater (mcm) 40 56 76
Total (mcm) 65 81 101
Cost (US$) 400,000 530,000 660,000
30

7 Summary and Conclusions
In sum, a broad range of policy options, or wedges, exist to reduce water demand or augment supply. These options vary greatly in terms of cost per cubic meter of water conserved, and in terms of political feasibility. Political feasibility is a function of economic costs, likely opposition by negatively affected stakeholders, and of the technological ease of implementation.
A simple summation of the water conservation options provided in this paper produces potential water savings of roughly 800 mcm per year. This is likely to be an over-estimate, as certain options overlap or partially crowd out others. Moreover, certain options may be undesirable from an environmental or social perspective, such as covering of freshwater reservoirs. In order to compensate for potential overlap between options and to eliminate options that are undesirable, adjusted figures are given which are 15% lower than the unadjusted figures. From these adjusted figures, over 690 mcm of freshwater per year was identified as being potentially available for conservation (see Table 17). Of this, over 500 mcm can potentially be conserved at costs less than the marginal cost of water, i.e., the cost of desalination. An additional 150+ mcm of water per year can be conserved with current technology, but at costs that make it uncompetitive with desalination. Implementing the cost-effective measures would make unnecessary three large desalination plants, or alternatively, would free up water that could be returned to the natural flows of rivers. This amount represents nearly half of the natural flow of the Lower Jordan River.
The economic feasibility of the options shown was based on current prices. Changes in future prices of technologies, commodities, and externalities are likely to change the relative profitability of water saving options. Options such as grey water systems in new buildings, while not cheaper than desalinated water, are likely to be economically rational for individual domestic consumers who face much higher costs than those used for the basis of this analysis, and so, may see increased popularity. It should also be noted that other options for conservation exist that have not been fully explored in this study, for instance, replacement of impervious surfaces with more pervious materials, reclamation of contaminated groundwater, the replacement of water-cooled air-conditioners with air-cooled systems, and many others. By necessity this study had to limit its focus to options for which available data was available. As such, it should be seen as an initial estimate, which can be the basis for future studies. Future studies may identify more cost-effective methods for reducing water demand and/or augmenting supplies. Even with its limited focus, however, this study was able to identify numerous cost-effective options for water conservation at scales that would allow for significant stream restoration and/or reduction in the need for desalination.
31

Table 17. Summary of Policy Wedges Examined
Policy Wedge Water Conserved by 2020 (mcm/year) Cost Effectiveness (US$/m3)
Feasibility 1-Low 5-High
Low Medium High
Supp
ly
Reduced water losses from leakages 29 51 73 0.45 4-5
Reduced water losses from reservoirs 65 81 101 0.007 4-5
Rooftop rainwater collection 4 7 13 2.14 1-2
Dem
and
Awareness raising 76 101 126 0.10 4-5
Change in plants used in gardens 23 46 68 0.61 4-5
Price increases or reduced allocations in agricultural sector
70 138 200 0.30 3
Grey water use (irrigation) 36 76 118 1.32 1-2
Grey water use (toilets) 13 27 55 2.21 1
Removal of trade restrictions 30 45 60 High 1
Una
djus
ted Total - net cost less than desalination 293 462 628
Total - net cost more than desalination 53 110 186
Total 346 572 814
Adju
sted Total - net cost less than desalination 249 393 534
Total - net cost more than desalination 45 94 158
Total 294 486 692
Note: The figures for total water saved in the last three rows of the table have been reduced by 15% from the figures above to adjust for likely double-counting, as each option’s water saving potential was evaluated in isolation, and for options whose environmental desirability or technical feasibility is questionable, such as covering freshwater reservoirs.
32

8 References
Ayalon, O. 2009. Enlarging water supply in Israel by reducing water losses and sewage leakage – Final Report. Shmuel Neaman Institute.
Baumann, D. D., J. Boland, et al. 1998. Urban water demand management and planning. New York, McGraw-Hill.
Becker, N. 2004. Initial estimates of costs of externalities from desalination and comparative analysis of desalination options” in Whose Water Is It? Privatization of Water and Sewage Services, Seawater Desalination, and Public Participation. Friends of the Earth Middle East. Tel Aviv.
Central Bureau of Statistics (CBS). 2009. Statistical Yearbook for Israel 2009. Central Bureau of Statistics, Israel. Jerusalem.
Dahan, M. and U. Nisan. 2007. “Unintended consequences of increasing block tariffs pricing policy in urban water.” Water Resources Research 43(3 - W03402).
Dalhuisen, J. M., R. J. G. M. Florax, et al. 2003. “Price and income elasticities of residential water demand: A meta-analysis “ Land Economics 79(2): 292-308.
Eilon, A. 2009. Increasing Israel’s water supply by reducing and preventing water leaks sewage- Final Report. Submitted to the water crisis investigation committee in the water sector. The Samuel Neaman Institute. Haifa.
Feitelson, Eran; Gazit, Tsafrir and Fischhendler, Itay. 2005. The Role of “Red Lines” in Safeguarding the Sea of Galilee (Lake Kinneret). The Jerusalem Institute for Israel Studies. Jerusalem.
Fredrick, K., T. VandenBerg, et al. 1996. Economic Values of Freshwater in the United States. Washington, D.C., Resources for the Future.
Hovel, R. “The tax did what he was supposed to do: Water consumption decreased by 20% in 2009”. Calcalist. January 19, 2010
33

Israel Water Authority (IWA). 2009. Master Plan for Water Conservation
Israel Water Authority (IWA). 2009. Water Consumption by Use 1996-2008
http://www.water.gov.il/NR/rdonlyres/48BEAAA2-3516-4308-869C-5743F8154591/0/Seker2008Matarot.pdf
Kafle, H., & Bruins, H.. (2009). Climatic trends in Israel 1970-2002: warmer and increasing aridity inland. Climatic Change 96(1-2): 63-77.
Ministry of Environment (MOE). 2009. “Tackling Israel’s Water Crisis”, Israel Environment Bulletin, Vol. 35. September.
Mui, S., J. Alson, J., B. Ellies, and D. Ganss. 2007. A Wedge Analysis of the U.S. Transportation Sector. Transportation and Climate Division Office of Transportation and Air Quality, U.S. Environmental Protection Agency.
Nichols, C., L. Phares, P. Dipietro and T. van Leeuwen. 2009. “Analysis of GHG Abatement Opportunities under America’s Climate Security Act of 2007” Energy Procedia 1(1): 4249-4256.
Olmstead, S. M., W. Michael Hanemann, et al. 2007. “Water demand under alternative price structures.” 54(2): 181-198.
Pacala, S. and R. Socolow. 2004. “Stabilization Wedges: Solving the Climate Problem for the Next 50 Years with Current Technologies.” Science 305 (5686): 968-972.
Pareto Engineering, 2007. Cost-benefit analysis of gray water reclamation projects in Israel.
Peled, M. 2009. “Survey: 77% of the public do not know how much they are going to pay for water”. Calcalist. December 30, 2009
Shmueli, A. 2008A. “A new Israeli development will save the unused rain water”. Ynet article. December 24, 2008.
Shmueli. A. 2008B. “To use the storm waters for agriculture? ‘It’s not worth it’ “. Ynet article. September 9, 2008
The State commission of inquiry on water crisis (Israel). 2009. The committee’s position regarding decisions on savings, levy consumption tax and water rates. December 15, 2009. Downloaded from: http://elyon1.court.gov.il/heb/mayim/Hodaot/01_01.pdf
The State Comptroller (Israel). 2009. An opinion about the water pricing. Jerusalem.
34