Frictional and Interface Frictional Characteristics of ...Technology Guwahati, Guwahati, India 2 CE...
9
ORIGINAL ARTICLE Frictional and Interface Frictional Characteristics of Multi-layer Cover System Materials and Its Impact on Overall Stability S. K. Yamsani 1 • S. Sreedeep 1 • R. R. Rakesh 2 Received: 17 May 2016 / Accepted: 16 July 2016 / Published online: 6 August 2016 Ó Springer International Publishing Switzerland 2016 Abstract The municipal and hazardous landfills nearing its design capacity need to be isolated from the atmosphere using multi-layered cover system (MLCS). These MLCS constitutes different layers of soil and geosynthetics with widely varying properties. Each of these layers fulfil specific requirements by acting as a surface protection, drainage, separation, filtration and hydraulic barrier layers of MLCS. Failure of these MLCS leads to waste–atmo- sphere interaction and results in extremely hazardous sit- uation to biosphere. The stability of MLCS significantly depends on the shear strength characteristics of materials used viz., the internal frictional characteristics of individual soil materials and interface frictional characteristics of soil–soil or soil–geotextile combination. In view of this, frictional characteristics of four type of soils, four soil– geotextile interfaces and one soil–soil interface was determined using direct shear and modified direct shear testing methods. The modification of geomembrane used in barrier layer was also attempted, for improving its interface shear characteristics. The usefulness of the above param- eters and the influence of its variability on the slope sta- bility of MLCS of a near surface low level radio-active waste disposal facility (NSDF) is demonstrated in this study. Keywords Interface shear Á Soil Á Geotextile Á Modified direct shear test Á Multi layered cover system (MLCS) Á Stability Introduction Engineered landfills are mandatory for the safe disposal of hazardous and non-hazardous municipal wastes [1]. Liners and covers form the main components of landfill system, which isolates the waste components from the surrounding subsurface and atmosphere. The engineered covers are mandatory for isolating the harmful effects of non-engi- neered and indiscriminate surface waste dump yards which are quite common in developing countries like India [2, 3]. In general, the purpose of the cover is to minimize the impact of variations in surface atmospheric conditions like high temperatures and heavy rainfall on contained wastes. Due to these cyclic variations in weather a lot of fatigue load is transferred to the cover materials. For this reason, a combination of various soil and geosynthetics layers are used as multi layered cover system (MLCS) [4]. The MLCS is constructed with an appropriate slope to drain out rain water easily and quickly. The choice of slope angle is governed by the workability requirement and available land area. Frictional and interface frictional characteristics are the important parameters governing the stability of sloped MLCS [5–8]. Moreover, it is presumed that interface layers (the plane between two different types of materials) are the weakest planes more prone to slip or failure due to the lack of proper interaction [9–11]. Failure at Kettleman hill & S. Sreedeep [email protected] S. K. Yamsani [email protected] R. R. Rakesh [email protected] 1 Department of Civil Engineering, Indian Institute of Technology Guwahati, Guwahati, India 2 CE & QAS/Nuclear Recycle Group, Bhabha Atomic Research Centre, Mumbai, India 123 Int. J. of Geosynth. and Ground Eng. (2016) 2:23 DOI 10.1007/s40891-016-0063-5
Transcript of Frictional and Interface Frictional Characteristics of ...Technology Guwahati, Guwahati, India 2 CE...
ORIGINAL ARTICLE
Frictional and Interface Frictional Characteristics of Multi-layerCover System Materials and Its Impact on Overall Stability
S. K. Yamsani1 • S. Sreedeep1 • R. R. Rakesh2
Received: 17 May 2016 / Accepted: 16 July 2016 / Published online: 6 August 2016
� Springer International Publishing Switzerland 2016
Abstract The municipal and hazardous landfills nearing
its design capacity need to be isolated from the atmosphere
using multi-layered cover system (MLCS). These MLCS
constitutes different layers of soil and geosynthetics with
widely varying properties. Each of these layers fulfil
specific requirements by acting as a surface protection,
drainage, separation, filtration and hydraulic barrier layers
of MLCS. Failure of these MLCS leads to waste–atmo-
sphere interaction and results in extremely hazardous sit-
uation to biosphere. The stability of MLCS significantly
depends on the shear strength characteristics of materials
used viz., the internal frictional characteristics of individual
soil materials and interface frictional characteristics of
soil–soil or soil–geotextile combination. In view of this,
frictional characteristics of four type of soils, four soil–
geotextile interfaces and one soil–soil interface was
determined using direct shear and modified direct shear
testing methods. The modification of geomembrane used in
barrier layer was also attempted, for improving its interface
shear characteristics. The usefulness of the above param-
eters and the influence of its variability on the slope sta-
bility of MLCS of a near surface low level radio-active
waste disposal facility (NSDF) is demonstrated in this
study.
Keywords Interface shear � Soil � Geotextile � Modified
direct shear test � Multi layered cover system (MLCS) �Stability
Introduction
Engineered landfills are mandatory for the safe disposal of
hazardous and non-hazardous municipal wastes [1]. Liners
and covers form the main components of landfill system,
which isolates the waste components from the surrounding
subsurface and atmosphere. The engineered covers are
mandatory for isolating the harmful effects of non-engi-
neered and indiscriminate surface waste dump yards which
are quite common in developing countries like India [2, 3].
In general, the purpose of the cover is to minimize the
impact of variations in surface atmospheric conditions like
high temperatures and heavy rainfall on contained wastes.
Due to these cyclic variations in weather a lot of fatigue
load is transferred to the cover materials. For this reason, a
combination of various soil and geosynthetics layers are
used as multi layered cover system (MLCS) [4]. The
MLCS is constructed with an appropriate slope to drain out
rain water easily and quickly. The choice of slope angle is
governed by the workability requirement and available
land area.
Frictional and interface frictional characteristics are the
important parameters governing the stability of sloped
MLCS [5–8]. Moreover, it is presumed that interface layers
(the plane between two different types of materials) are the
weakest planes more prone to slip or failure due to the lack
of proper interaction [9–11]. Failure at Kettleman hill
& S. Sreedeep
S. K. Yamsani
R. R. Rakesh
1 Department of Civil Engineering, Indian Institute of
Technology Guwahati, Guwahati, India
2 CE & QAS/Nuclear Recycle Group, Bhabha Atomic
Research Centre, Mumbai, India
123
Int. J. of Geosynth. and Ground Eng. (2016) 2:23
DOI 10.1007/s40891-016-0063-5

landfill and others signifies the importance of interface
frictional characteristics in interpreting stability of MLCS
[12–14]. This makes it important to investigate the fric-
tional and interface frictional characteristics of various
materials used in MLCS construction and to determine its
effect on slope stability.
Site reconnaissance explains that most of the MLCS
failed at their initial stages immediately after the con-
struction or sometimes during construction phase [15, 16],
mainly due to the weak friction and interface friction
characteristics of materials used in construction of MLCS.
Therefore, the present study attempts to understand the role
of shear and interfacial shear strength of materials on the
overall stability of sloped MLCS. The effect of climatic
variations with time and impact of rainfall on the stability
of MLCS has not been considered in this study.
MLCS Configuration
MLCS essentially consists of a surface layer for protecting
the hydraulic barrier below from the undesirable climatic
changes and other anthropogenic factors. Immediately
below the surface layer is the drainage layer for collecting
the infiltrated rain water and routing it outside the MLCS
for minimizing hydraulic head over the hydraulic barrier. A
nonwoven or a composite geotextile is provided as a sep-
arator to resist internal erosion (piping of fines) at the
interface of surface layer and drainage layer. Below the
drainage layer a low permeable thick clay barrier is pro-
vided to resist further infiltration. In some cases, an addi-
tional geomembrane or geocomposite clay liner is provided
for further safety. In such scenario, a thin layer of sand is
laid over geomembrane to protect from puncture due to
sharp particles in drainage layer. Finally, a foundation layer
is made at the bottom of all these layers using well com-
pacted local soils to take care of the differential settlements
of MLCS (due to waste degradation). There are numerous
alternate configurations of MLCS adopted depending on
the type of waste isolated and the local site scenario
[17, 18]. A typical configuration of MLCS considered in
this study is presented in Fig. 1 with detailed description of
different layers and their interfaces.
Materials
As shown in Fig. 1, a locally available moderately perme-
able red soil was proposed as surface protection layer with
its permeability (k) less than 10-7 m/s. A high permeable
(k & 10-5 m/s) fine gravel was used as drainage layer, a
well permeable composite geotextile material was used for
filtration and protection of surface layer from piping, a
composite geomembrane material having low permeability
(k\ 10-12 m/s) is used as an additional barrier, a fine–
medium sand was provided below drainage layer material
for protecting geomembrane from gravels, a thick layer of
low permeable (k\ 10-12 m/s) bentonite clay is used as a
barrier to restrict water flow and locally available fill
material is included as the foundation layer. The foundation
material in this study is made of same soil used in surface
layer. The materials used in this study were conforming to
the recommendations of USEPA [19] as MLCS. For pro-
viding adequate shear resistance, low permeable smooth
high density polyethylene (HDPE) geomembranes were
sandwiched between two thin geo-nets to form composite
geomembrane [20]. Fine sand and geo-net layers above
geomembrane also helps in transmitting surface infiltration,
thereby reducing hydraulic head [4].
The geotechnical characterisation of selected materials
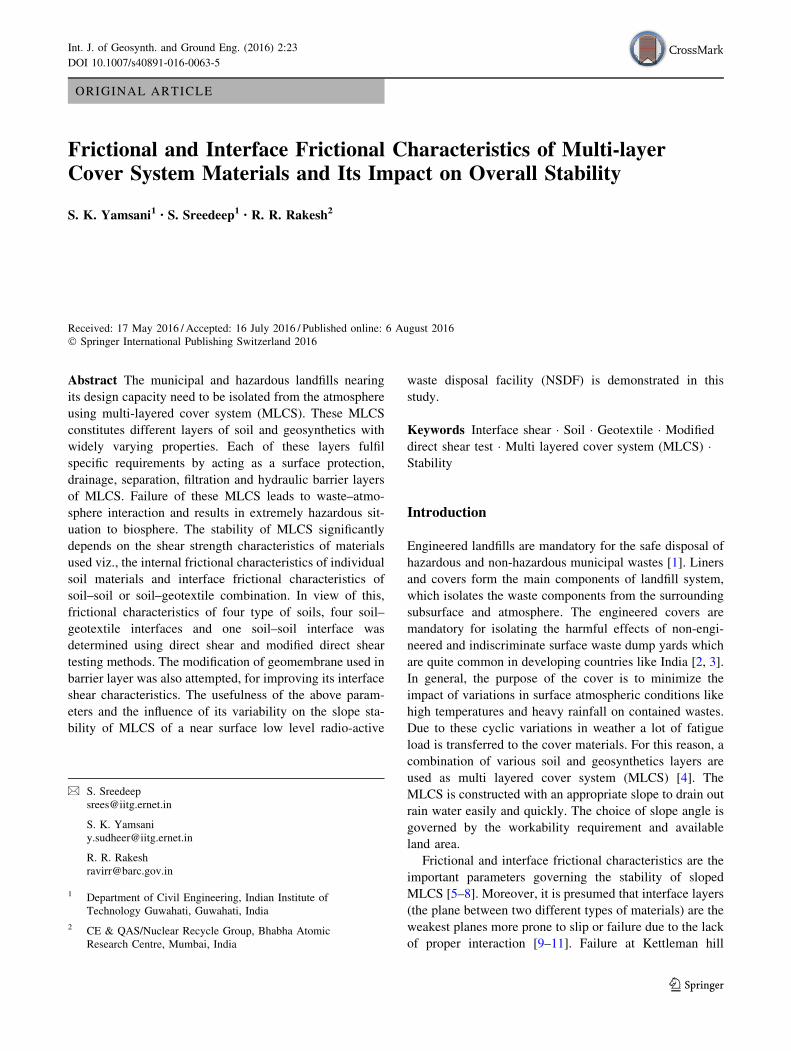
are summarised in Table 1. The grab tensile strength of
various geotextiles, HDPE geomembrane and geonet col-
lected from local sources were tested as per ASTM D 4632
[21] recommendations and corresponding results are
depicted in Fig. 2. The composite geotextile and composite
geomembrane (geomembrane sandwiched between two
geo-nets) with maximum tensile strength satisfying the
strength recommendations of AASHTO M288 are selected
for their use in filter and barrier layers of MLCS, respec-
tively [4]. The basic properties of selected geosynthetics
are summarised in Table 2.
Methodology
For determining the shear characteristics of soil materials,
a 6 cm 9 6 cm small direct shear box was employed while
a 30 cm 9 30 cm large direct shear box was used to
determine the shear characteristics of gravels and interface
shear characteristics as recommended by IS 2720 Part-39
[22] and ASTM D 3080 [23], respectively. The strain rates
of shear tests were varied over a wide range based on the
permeability of materials for ensuring proper dissipation of
excess pore pressures as per the recommendations of
[23, 24]. Direct shear test is a robust device for quickly
evaluating the shear characteristics of given soil material
[25–27]. Also direct shear test can be easily modified to
determine interface shear characteristics, replacing one half
with different material. It helps in better representation of
field condition, with its predefined failure surface. Several
studies reported in the past have used modified direct shear
test to determine interface shear tests of various soil–soil or
soil–geotextile or geotextile–geotextile interface shear
characteristics [28–30].
All the shear tests were conducted after prior saturation
of the soil compacted at optimum moisture content and
23 Page 2 of 9 Int. J. of Geosynth. and Ground Eng. (2016) 2:23
123

maximum dry density. The SS and GS are compacted at
their corresponding maximum relative density. For SS and
GS the shearing started after 1 h of loading (as they don’t
under go much consolidation) while in soils it was sheared
after loading for 24 h. In the case of BS, wetting beyond 3
days caused uncontrolled swelling, leading to protrusion of
swollen BS from predefined failure plane. Hence BS was
sheared after 3-day saturation considering it to be worst
possible field scenario resulting in undrained shear char-
acteristics. Duncan [31] suggested to consider the soils
having permeability more than 10-6 m/s (e.g., for SS and
GS) as drained materials while soil having permeability
less than 10-9 m/s (e.g., BS) as undrained.
In determining interface shear characteristics of soil–soil
interface, one half of the direct shear box was filled with
one type of soil and the other half with another. While
Fig. 1 Typical configuration of
MLCS
Table 1 Geotechnical characterisation of selected soil materials
Material properties Red soil (RS) Bentonite (BS) Gravel (GS) Sand (SS)
Atterberg limits (%)
Specific gravity 2.69 2.72 2.57 2.67
Hygroscopic water content 5.45 11.57 1.5 2.4
Liquid limit 44 395 – –
Plastic limit 22 39 – –
Shrinkage limit 19 11 – –
Plasticity index 22 356 – –
Particle size distribution (%)
Coarse sand (2.00–4.75 mm) 22.00 – Passing 12.5 mm and retained on 10 mm 1.30
Medium sand (0.425–2.00 mm) 33.64 – 68.7
Fine sand (0.075–0.425 mm) 28.04 4.4 29.72
Silt (0.002–0.075 mm) 9.83 38.77 0.28
Clay (\0.002 mm) 6.65 56.83 –
Compaction characteristics
USCS classification (ASTM D2487-98) SM CH GP SP
Maximum dry density (g/cm3) 1.7 1.33 Cohesion less soils
Optimum moisture content (%) 18.44 32
Minimum density (g/cm3) Cohesive soils 1.341 1.486
Maximum density (g/cm3) 1.4 1.67
Saturated hydraulic conductivity (m/s) 3 9 10-8 1 9 10-12 1 9 10-4 3 9 10-6
Int. J. of Geosynth. and Ground Eng. (2016) 2:23 Page 3 of 9 23
123
determining interface shear characteristics of soil–geotex-
tile interface, geotextile was rigidly fixed to lower half of
the direct shear box and in the other half soil was filled at
desired compaction state. Geotextile was wrapped to a
wooden box which fits perfectly into the modified direct
shear [7, 8].
Limit equilibrium method (LEM) and finite element
method (FEM) are commonly adopted in evaluating sta-
bility of earthen structures [32]. Due to the lack of stress–
strain consideration in LEM, researchers suggest to adopt
FEM for stability analysis [31, 33]. Nevertheless, FEM also
have some limitations like convergence issue in using
nonlinear soil models, defining appropriate Poisson’s ratio
and hence researchers suggest to use LEM stability anal-
ysis along with FEM stresses for attaining reliable results
[33]. The stresses calculated by FEM is used for the
determination of factor of safety (FOS) using LEM. For
this purpose, the numerical modelling was performed using
Geostudio, one of the most common tool used in
geotechnical practice [34–37]. In this study, Sigma-W
module of Geostudio was used to determine stresses. The
materials are specified at the density and water content
values listed in Table 1, the elasticity characteristics of
soils are defined according to the soil classification
described in Table 1 [38–40]. These stresses were incor-
porated in Morgenstern–Price LEM for attaining FOS in
Slope-W module of Geostudio [41]. For additional com-
parison and gaining more confidence of final FOS, stability
analysis using stresses calculated by LEM is also adopted.
The effect of rainfall and seepage was not considered in
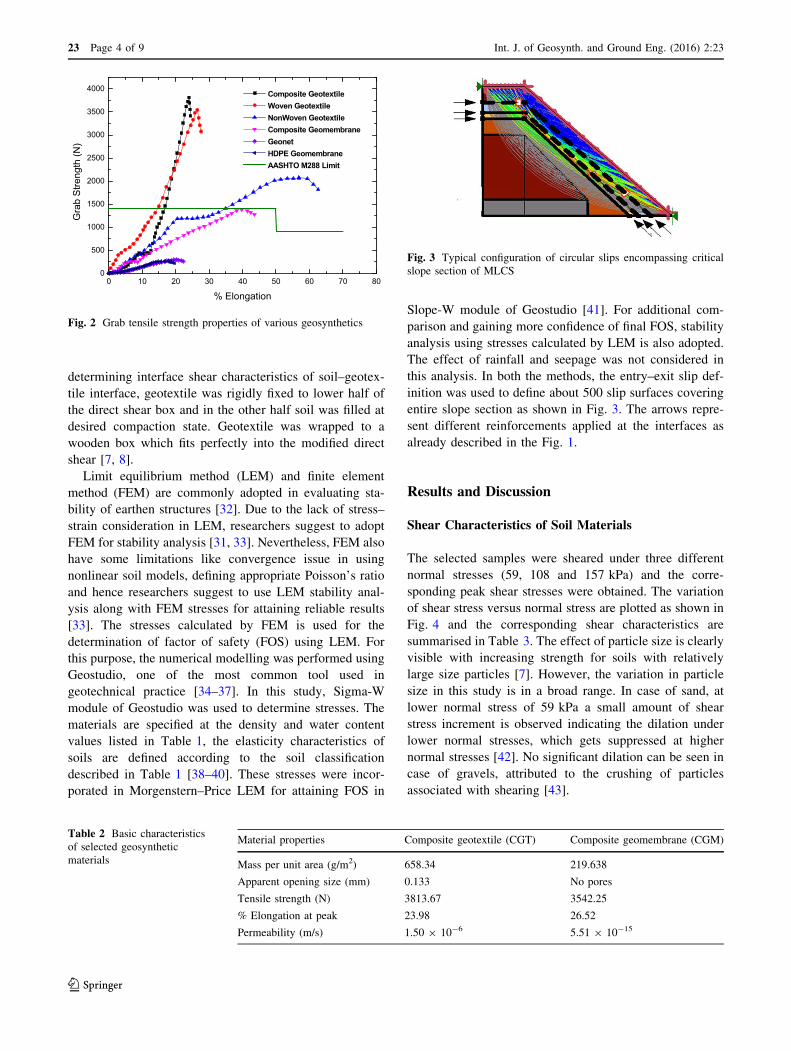
this analysis. In both the methods, the entry–exit slip def-
inition was used to define about 500 slip surfaces covering
entire slope section as shown in Fig. 3. The arrows repre-
sent different reinforcements applied at the interfaces as
already described in the Fig. 1.
Results and Discussion
Shear Characteristics of Soil Materials
The selected samples were sheared under three different
normal stresses (59, 108 and 157 kPa) and the corre-
sponding peak shear stresses were obtained. The variation
of shear stress versus normal stress are plotted as shown in
Fig. 4 and the corresponding shear characteristics are
summarised in Table 3. The effect of particle size is clearly
visible with increasing strength for soils with relatively
large size particles [7]. However, the variation in particle
size in this study is in a broad range. In case of sand, at
lower normal stress of 59 kPa a small amount of shear
stress increment is observed indicating the dilation under
lower normal stresses, which gets suppressed at higher
normal stresses [42]. No significant dilation can be seen in
case of gravels, attributed to the crushing of particles
associated with shearing [43].
0 10 20 30 40 50 60 70 800
500
1000
1500
2000
2500
3000
3500
4000G
rab
Stre
ngth
(N)
% Elongation
Composite Geotextile Woven Geotextile NonWoven Geotextile Composite Geomembrane Geonet HDPE Geomembrane AASHTO M288 Limit
Fig. 2 Grab tensile strength properties of various geosynthetics
Fig. 3 Typical configuration of circular slips encompassing critical
slope section of MLCS
Table 2 Basic characteristics
of selected geosynthetic
materials
Material properties Composite geotextile (CGT) Composite geomembrane (CGM)
Mass per unit area (g/m2) 658.34 219.638
Apparent opening size (mm) 0.133 No pores
Tensile strength (N) 3813.67 3542.25
% Elongation at peak 23.98 26.52
Permeability (m/s) 1.50 9 10-6 5.51 9 10-15
23 Page 4 of 9 Int. J. of Geosynth. and Ground Eng. (2016) 2:23
123
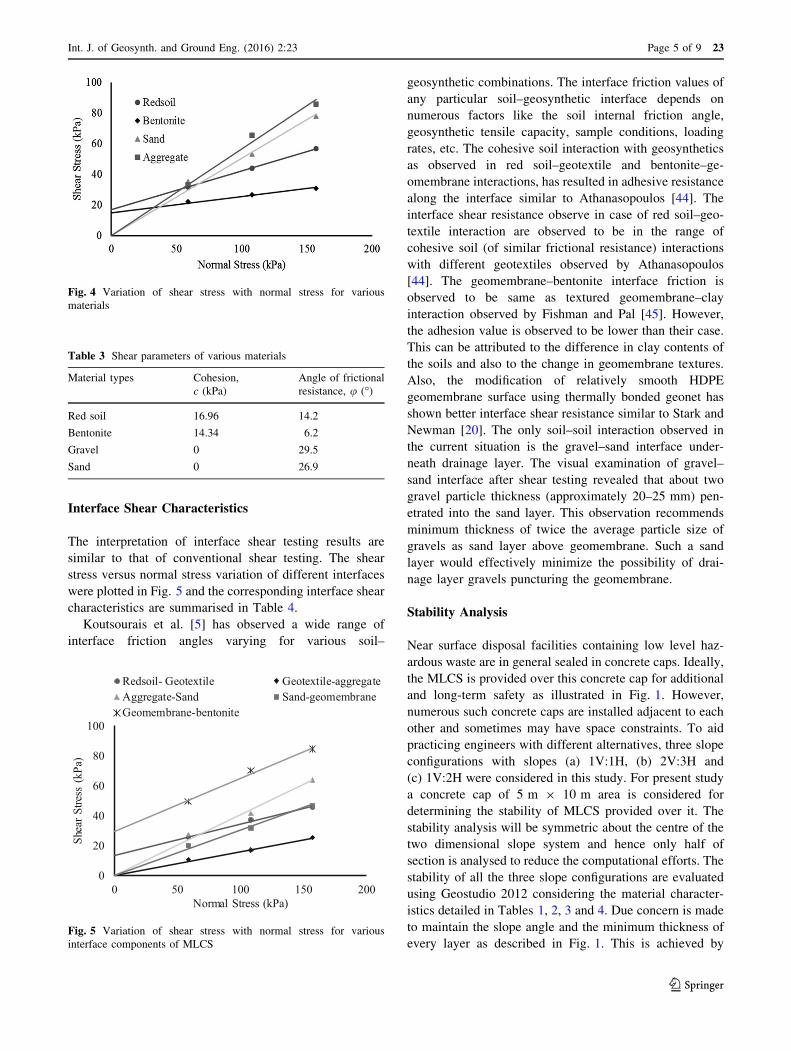
Interface Shear Characteristics
The interpretation of interface shear testing results are
similar to that of conventional shear testing. The shear
stress versus normal stress variation of different interfaces
were plotted in Fig. 5 and the corresponding interface shear
characteristics are summarised in Table 4.
Koutsourais et al. [5] has observed a wide range of
interface friction angles varying for various soil–
geosynthetic combinations. The interface friction values of
any particular soil–geosynthetic interface depends on
numerous factors like the soil internal friction angle,
geosynthetic tensile capacity, sample conditions, loading
rates, etc. The cohesive soil interaction with geosynthetics
as observed in red soil–geotextile and bentonite–ge-
omembrane interactions, has resulted in adhesive resistance
along the interface similar to Athanasopoulos [44]. The
interface shear resistance observe in case of red soil–geo-
textile interaction are observed to be in the range of
cohesive soil (of similar frictional resistance) interactions
with different geotextiles observed by Athanasopoulos
[44]. The geomembrane–bentonite interface friction is
observed to be same as textured geomembrane–clay
interaction observed by Fishman and Pal [45]. However,
the adhesion value is observed to be lower than their case.
This can be attributed to the difference in clay contents of
the soils and also to the change in geomembrane textures.
Also, the modification of relatively smooth HDPE
geomembrane surface using thermally bonded geonet has
shown better interface shear resistance similar to Stark and
Newman [20]. The only soil–soil interaction observed in
the current situation is the gravel–sand interface under-
neath drainage layer. The visual examination of gravel–
sand interface after shear testing revealed that about two
gravel particle thickness (approximately 20–25 mm) pen-
etrated into the sand layer. This observation recommends
minimum thickness of twice the average particle size of
gravels as sand layer above geomembrane. Such a sand
layer would effectively minimize the possibility of drai-
nage layer gravels puncturing the geomembrane.
Stability Analysis
Near surface disposal facilities containing low level haz-
ardous waste are in general sealed in concrete caps. Ideally,
the MLCS is provided over this concrete cap for additional
and long-term safety as illustrated in Fig. 1. However,
numerous such concrete caps are installed adjacent to each
other and sometimes may have space constraints. To aid
practicing engineers with different alternatives, three slope
configurations with slopes (a) 1V:1H, (b) 2V:3H and
(c) 1V:2H were considered in this study. For present study
a concrete cap of 5 m 9 10 m area is considered for
determining the stability of MLCS provided over it. The
stability analysis will be symmetric about the centre of the
two dimensional slope system and hence only half of
section is analysed to reduce the computational efforts. The
stability of all the three slope configurations are evaluated
using Geostudio 2012 considering the material character-
istics detailed in Tables 1, 2, 3 and 4. Due concern is made
to maintain the slope angle and the minimum thickness of
every layer as described in Fig. 1. This is achieved by
Fig. 4 Variation of shear stress with normal stress for various
materials
0
20
40
60
80
100
0 50 100 150 200
Shea
r Stre
ss (
kPa)
Normal Stress (kPa)
Redsoil- Geotextile Geotextile-aggregateAggregate-Sand Sand-geomembraneGeomembrane-bentonite
Fig. 5 Variation of shear stress with normal stress for various
interface components of MLCS
Table 3 Shear parameters of various materials
Material types Cohesion,
c (kPa)
Angle of frictional
resistance, u (�)
Red soil 16.96 14.2
Bentonite 14.34 6.2
Gravel 0 29.5
Sand 0 26.9
Int. J. of Geosynth. and Ground Eng. (2016) 2:23 Page 5 of 9 23
123
considering tapered layers with increasing width in the
base for lower slope angles. Moreover, increase in base
width of individual layers of MLCS would increase the
overall stability of the system [4].
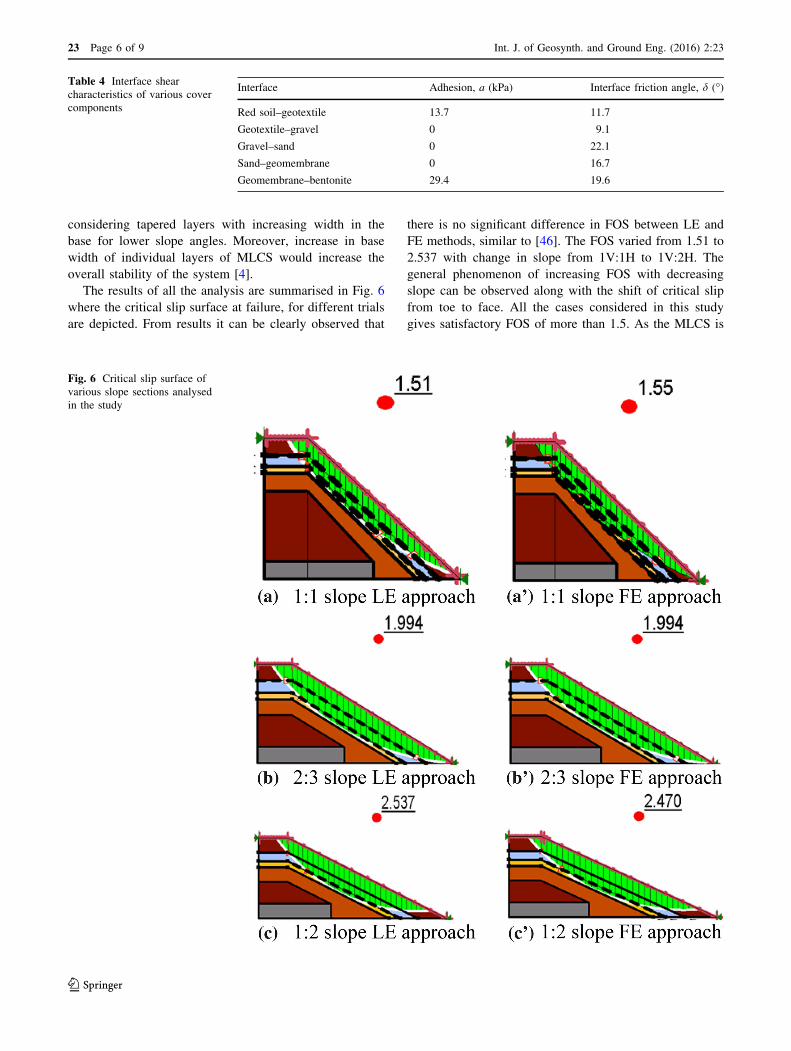
The results of all the analysis are summarised in Fig. 6
where the critical slip surface at failure, for different trials
are depicted. From results it can be clearly observed that
there is no significant difference in FOS between LE and
FE methods, similar to [46]. The FOS varied from 1.51 to
2.537 with change in slope from 1V:1H to 1V:2H. The
general phenomenon of increasing FOS with decreasing
slope can be observed along with the shift of critical slip
from toe to face. All the cases considered in this study
gives satisfactory FOS of more than 1.5. As the MLCS is
Table 4 Interface shear
characteristics of various cover
components
Interface Adhesion, a (kPa) Interface friction angle, d (�)
Red soil–geotextile 13.7 11.7
Geotextile–gravel 0 9.1
Gravel–sand 0 22.1
Sand–geomembrane 0 16.7
Geomembrane–bentonite 29.4 19.6
Fig. 6 Critical slip surface of
various slope sections analysed
in the study
23 Page 6 of 9 Int. J. of Geosynth. and Ground Eng. (2016) 2:23
123
expected to safely protect low level hazardous waste dis-
posal facility for long duration of time, a higher FOS of 2.5
as attained in 1V:2H slope can be considered the best
alternative.
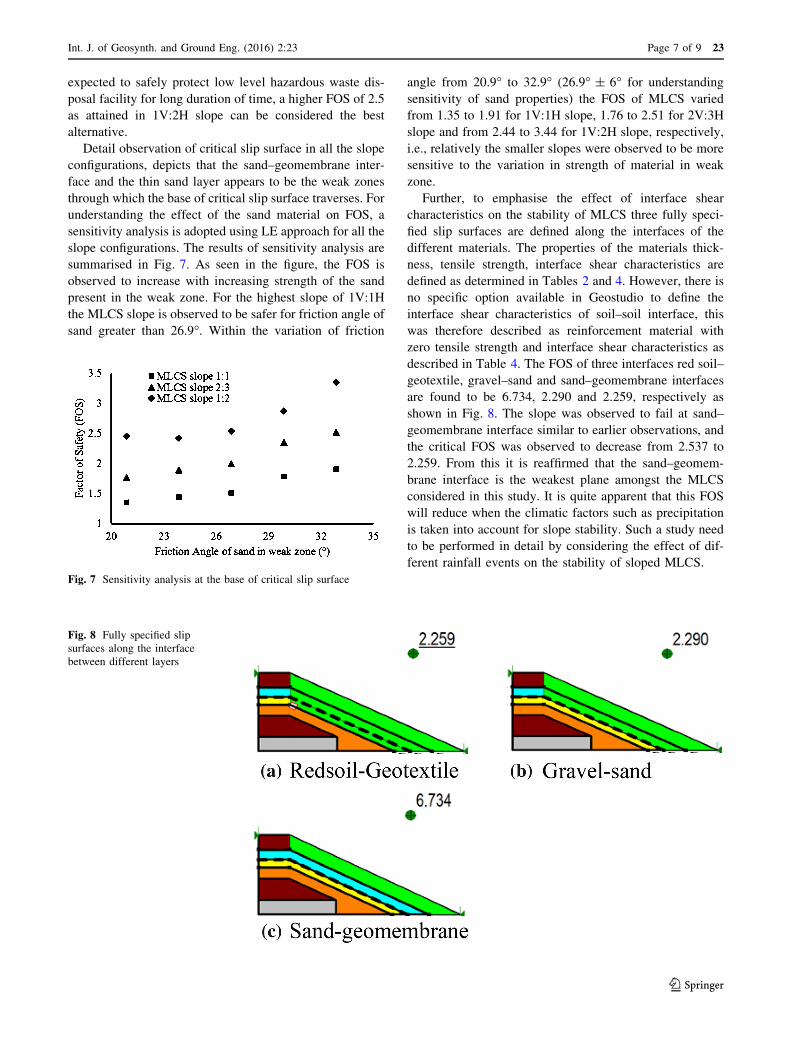
Detail observation of critical slip surface in all the slope
configurations, depicts that the sand–geomembrane inter-
face and the thin sand layer appears to be the weak zones
through which the base of critical slip surface traverses. For
understanding the effect of the sand material on FOS, a
sensitivity analysis is adopted using LE approach for all the
slope configurations. The results of sensitivity analysis are
summarised in Fig. 7. As seen in the figure, the FOS is
observed to increase with increasing strength of the sand
present in the weak zone. For the highest slope of 1V:1H
the MLCS slope is observed to be safer for friction angle of
sand greater than 26.9�. Within the variation of friction
angle from 20.9� to 32.9� (26.9� ± 6� for understanding
sensitivity of sand properties) the FOS of MLCS varied
from 1.35 to 1.91 for 1V:1H slope, 1.76 to 2.51 for 2V:3H
slope and from 2.44 to 3.44 for 1V:2H slope, respectively,
i.e., relatively the smaller slopes were observed to be more
sensitive to the variation in strength of material in weak
zone.
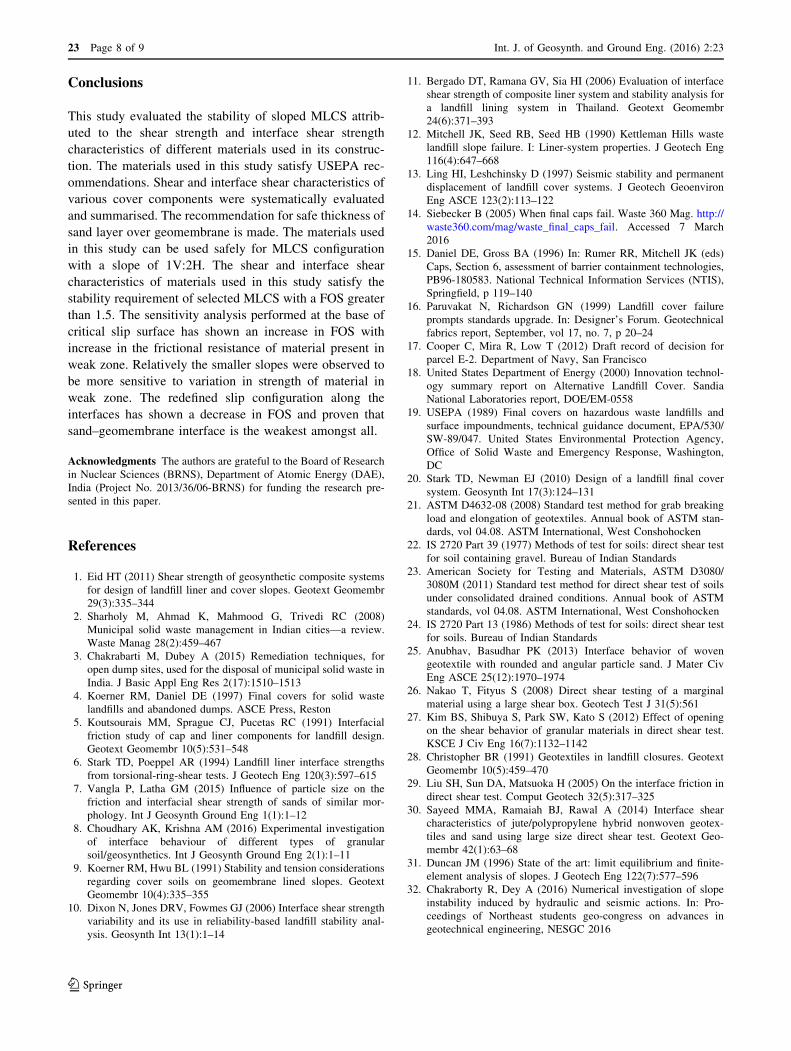
Further, to emphasise the effect of interface shear
characteristics on the stability of MLCS three fully speci-
fied slip surfaces are defined along the interfaces of the
different materials. The properties of the materials thick-
ness, tensile strength, interface shear characteristics are
defined as determined in Tables 2 and 4. However, there is
no specific option available in Geostudio to define the
interface shear characteristics of soil–soil interface, this
was therefore described as reinforcement material with
zero tensile strength and interface shear characteristics as
described in Table 4. The FOS of three interfaces red soil–
geotextile, gravel–sand and sand–geomembrane interfaces
are found to be 6.734, 2.290 and 2.259, respectively as
shown in Fig. 8. The slope was observed to fail at sand–
geomembrane interface similar to earlier observations, and
the critical FOS was observed to decrease from 2.537 to
2.259. From this it is reaffirmed that the sand–geomem-
brane interface is the weakest plane amongst the MLCS
considered in this study. It is quite apparent that this FOS
will reduce when the climatic factors such as precipitation
is taken into account for slope stability. Such a study need
to be performed in detail by considering the effect of dif-
ferent rainfall events on the stability of sloped MLCS.
Fig. 7 Sensitivity analysis at the base of critical slip surface
Fig. 8 Fully specified slip
surfaces along the interface
between different layers
Int. J. of Geosynth. and Ground Eng. (2016) 2:23 Page 7 of 9 23
123
Conclusions
This study evaluated the stability of sloped MLCS attrib-
uted to the shear strength and interface shear strength
characteristics of different materials used in its construc-
tion. The materials used in this study satisfy USEPA rec-
ommendations. Shear and interface shear characteristics of
various cover components were systematically evaluated
and summarised. The recommendation for safe thickness of
sand layer over geomembrane is made. The materials used
in this study can be used safely for MLCS configuration
with a slope of 1V:2H. The shear and interface shear
characteristics of materials used in this study satisfy the
stability requirement of selected MLCS with a FOS greater
than 1.5. The sensitivity analysis performed at the base of
critical slip surface has shown an increase in FOS with
increase in the frictional resistance of material present in
weak zone. Relatively the smaller slopes were observed to
be more sensitive to variation in strength of material in
weak zone. The redefined slip configuration along the
interfaces has shown a decrease in FOS and proven that
sand–geomembrane interface is the weakest amongst all.
Acknowledgments The authors are grateful to the Board of Research
in Nuclear Sciences (BRNS), Department of Atomic Energy (DAE),
India (Project No. 2013/36/06-BRNS) for funding the research pre-
sented in this paper.
References
1. Eid HT (2011) Shear strength of geosynthetic composite systems
for design of landfill liner and cover slopes. Geotext Geomembr
29(3):335–344
2. Sharholy M, Ahmad K, Mahmood G, Trivedi RC (2008)
Municipal solid waste management in Indian cities—a review.
Waste Manag 28(2):459–467
3. Chakrabarti M, Dubey A (2015) Remediation techniques, for
open dump sites, used for the disposal of municipal solid waste in
India. J Basic Appl Eng Res 2(17):1510–1513
4. Koerner RM, Daniel DE (1997) Final covers for solid waste
landfills and abandoned dumps. ASCE Press, Reston
5. Koutsourais MM, Sprague CJ, Pucetas RC (1991) Interfacial
friction study of cap and liner components for landfill design.
Geotext Geomembr 10(5):531–548
6. Stark TD, Poeppel AR (1994) Landfill liner interface strengths
from torsional-ring-shear tests. J Geotech Eng 120(3):597–615
7. Vangla P, Latha GM (2015) Influence of particle size on the
friction and interfacial shear strength of sands of similar mor-
phology. Int J Geosynth Ground Eng 1(1):1–12
8. Choudhary AK, Krishna AM (2016) Experimental investigation
of interface behaviour of different types of granular
soil/geosynthetics. Int J Geosynth Ground Eng 2(1):1–11
9. Koerner RM, Hwu BL (1991) Stability and tension considerations
regarding cover soils on geomembrane lined slopes. Geotext
Geomembr 10(4):335–355
10. Dixon N, Jones DRV, Fowmes GJ (2006) Interface shear strength
variability and its use in reliability-based landfill stability anal-
ysis. Geosynth Int 13(1):1–14
11. Bergado DT, Ramana GV, Sia HI (2006) Evaluation of interface
shear strength of composite liner system and stability analysis for
a landfill lining system in Thailand. Geotext Geomembr
24(6):371–393
12. Mitchell JK, Seed RB, Seed HB (1990) Kettleman Hills waste
landfill slope failure. I: Liner-system properties. J Geotech Eng
116(4):647–668
13. Ling HI, Leshchinsky D (1997) Seismic stability and permanent
displacement of landfill cover systems. J Geotech Geoenviron
Eng ASCE 123(2):113–122
14. Siebecker B (2005) When final caps fail. Waste 360 Mag. http://
waste360.com/mag/waste_final_caps_fail. Accessed 7 March
2016
15. Daniel DE, Gross BA (1996) In: Rumer RR, Mitchell JK (eds)
Caps, Section 6, assessment of barrier containment technologies,
PB96-180583. National Technical Information Services (NTIS),
Springfield, p 119–140
16. Paruvakat N, Richardson GN (1999) Landfill cover failure
prompts standards upgrade. In: Designer’s Forum. Geotechnical
fabrics report, September, vol 17, no. 7, p 20–24
17. Cooper C, Mira R, Low T (2012) Draft record of decision for
parcel E-2. Department of Navy, San Francisco
18. United States Department of Energy (2000) Innovation technol-
ogy summary report on Alternative Landfill Cover. Sandia
National Laboratories report, DOE/EM-0558
19. USEPA (1989) Final covers on hazardous waste landfills and
surface impoundments, technical guidance document, EPA/530/
SW-89/047. United States Environmental Protection Agency,
Office of Solid Waste and Emergency Response, Washington,
DC
20. Stark TD, Newman EJ (2010) Design of a landfill final cover
system. Geosynth Int 17(3):124–131
21. ASTM D4632-08 (2008) Standard test method for grab breaking
load and elongation of geotextiles. Annual book of ASTM stan-
dards, vol 04.08. ASTM International, West Conshohocken
22. IS 2720 Part 39 (1977) Methods of test for soils: direct shear test
for soil containing gravel. Bureau of Indian Standards
23. American Society for Testing and Materials, ASTM D3080/
3080M (2011) Standard test method for direct shear test of soils
under consolidated drained conditions. Annual book of ASTM
standards, vol 04.08. ASTM International, West Conshohocken
24. IS 2720 Part 13 (1986) Methods of test for soils: direct shear test
for soils. Bureau of Indian Standards
25. Anubhav, Basudhar PK (2013) Interface behavior of woven
geotextile with rounded and angular particle sand. J Mater Civ
Eng ASCE 25(12):1970–1974
26. Nakao T, Fityus S (2008) Direct shear testing of a marginal
material using a large shear box. Geotech Test J 31(5):561
27. Kim BS, Shibuya S, Park SW, Kato S (2012) Effect of opening
on the shear behavior of granular materials in direct shear test.
KSCE J Civ Eng 16(7):1132–1142
28. Christopher BR (1991) Geotextiles in landfill closures. Geotext
Geomembr 10(5):459–470
29. Liu SH, Sun DA, Matsuoka H (2005) On the interface friction in
direct shear test. Comput Geotech 32(5):317–325
30. Sayeed MMA, Ramaiah BJ, Rawal A (2014) Interface shear
characteristics of jute/polypropylene hybrid nonwoven geotex-
tiles and sand using large size direct shear test. Geotext Geo-
membr 42(1):63–68
31. Duncan JM (1996) State of the art: limit equilibrium and finite-
element analysis of slopes. J Geotech Eng 122(7):577–596
32. Chakraborty R, Dey A (2016) Numerical investigation of slope
instability induced by hydraulic and seismic actions. In: Pro-
ceedings of Northeast students geo-congress on advances in
geotechnical engineering, NESGC 2016
23 Page 8 of 9 Int. J. of Geosynth. and Ground Eng. (2016) 2:23
123
33. Krahn J (2003) The 2001 RM Hardy Lecture: the limits of limit
equilibrium analyses. Can Geotech J 40(3):643–660
34. Gharabaghi B, Singh MK, Inkratas C, Fleming IR, McBean E
(2008) Comparison of slope stability in two Brazilian municipal
landfills. Waste Manag 28(9):1509–1517
35. Collins BD, Sitar N (2010) Stability of steep slopes in cemented
sands. J Geotech Geoenviron Eng ASCE 137(1):43–51
36. Turer D, Turer A (2010) A simplified approach for slope stability
analysis of uncontrolled waste dumps. Waste Manag Res 29(2):
146–156
37. Harris SJ, Orense RP, Itoh K (2012) Back analyses of rainfall-
induced slope failure in Northland Allochthon formation. Land-
slides 9(3):349–356
38. Arora KR (1987) Soil mechanics and foundation engineering.
Standard Publishers Distributors, Delhi
39. Potts DM, Zdravkovic L, Zdravkovi L (2001) Finite element
analysis in geotechnical engineering: application, vol 2. Thomas
Telford Publications, London
40. Head KH, Epps R (1986) Manual of soil laboratory testing, vol 3.
Pentech Press, London, pp 798–869
41. Geoslope International (2012) Geostudio: user’s guide for Sigma-
W and Slope-W, version 8.0. Geoslope International, Calgary
42. Houlsby GT (1991) How the dilatancy of soils affects their
behaviour. University of Oxford, Department of Engineering
Science, Oxford, pp 27–30
43. Arslan H, Baykal G, Sture S (2009) Analysis of the influence of
crushing on the behavior of granular materials under shear.
Granul Matter 11(2):87–97
44. Athanasopoulos GA (1996) Results of direct shear tests on geo-
textile reinforced cohesive soil. Geotext Geomembr
14(11):619–644
45. Fishman KL, Pal S (1994) Further study of geomembrane/cohe-
sive soil interface shear behavior. Geotext Geomembr
13(9):571–590
46. Krishna AP (2006) Slope stability analysis by limit equilibrium
and finite element methods. Doctoral Thesis, Norwegian
University of Science and Technology (NTNU)
Int. J. of Geosynth. and Ground Eng. (2016) 2:23 Page 9 of 9 23
123