FRESNO COUNTY DEPARTMENT OF AGRICULTURE Ag/2011 Crop & Livestock Report.pdf · County of Fresno...
39
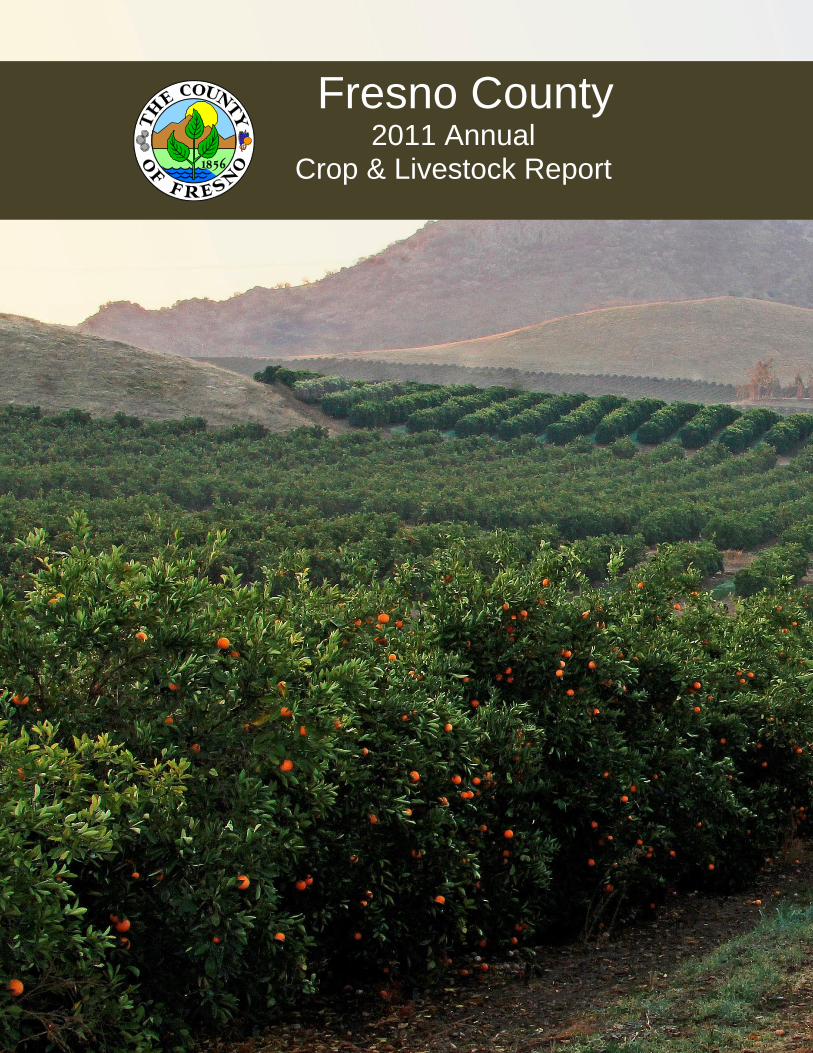
Fresno County 2011 Annual Crop & Livestock Report
Transcript of FRESNO COUNTY DEPARTMENT OF AGRICULTURE Ag/2011 Crop & Livestock Report.pdf · County of Fresno...
Fresno County 2011 Annual
Crop & Livestock Report
Fresno County 2011 Annual
Crop & Livestock Report

Cover photo courtesy of Ed Williams CDFA County/State Liaison
County of Fresno DEPARTMENT OF AGRICULTURE
CAROL N. HAFNER AGRICULTURAL COMMISSIONER/
SEALER OF WEIGHTS & MEASURES
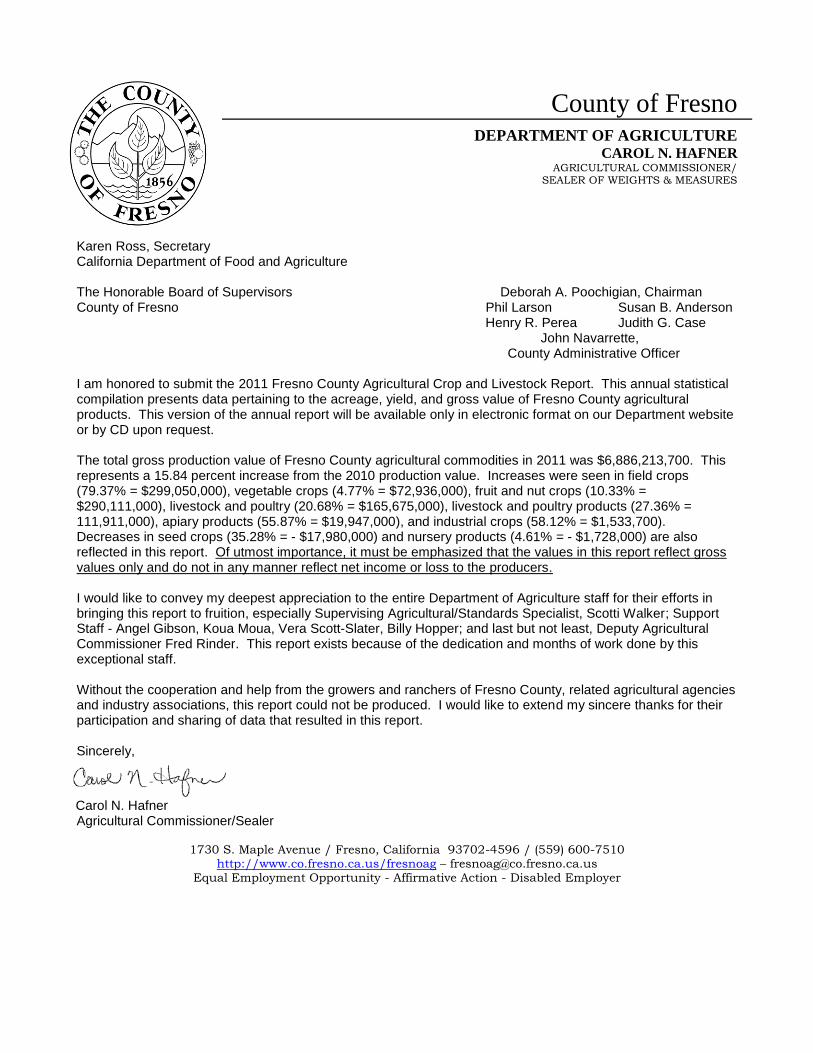
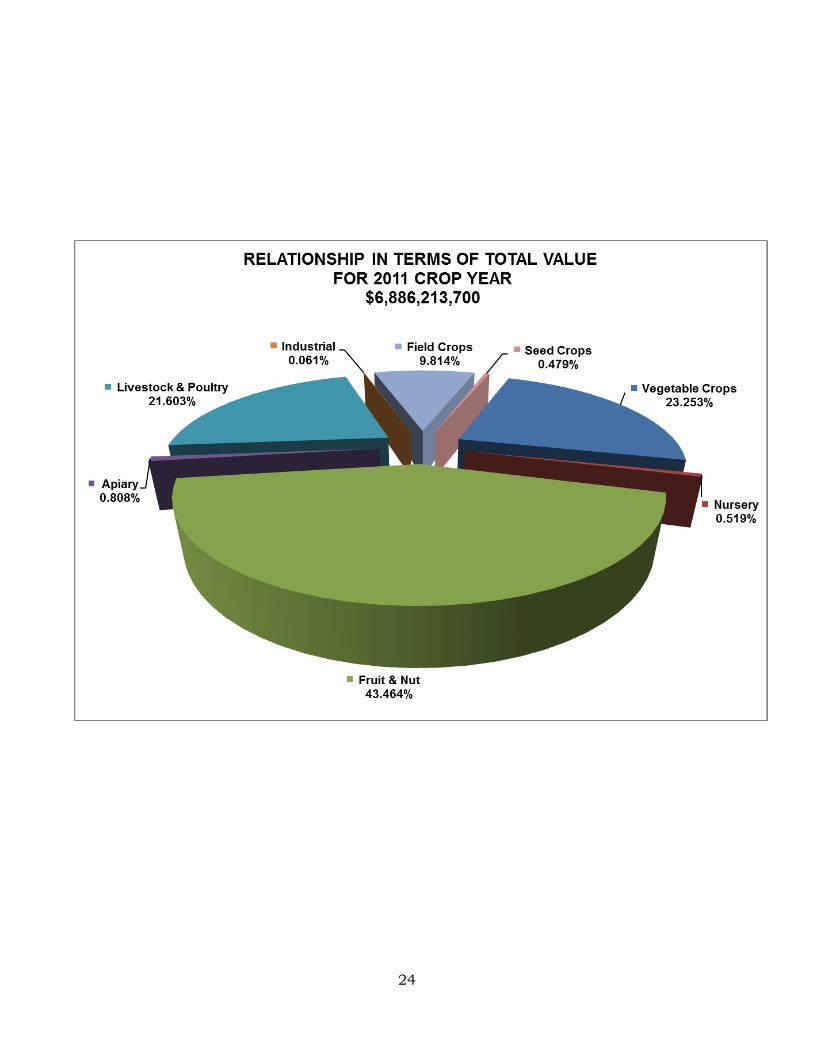
Karen Ross, Secretary California Department of Food and Agriculture The Honorable Board of Supervisors Deborah A. Poochigian, Chairman County of Fresno Phil Larson Susan B. Anderson Henry R. Perea Judith G. Case John Navarrette, County Administrative Officer I am honored to submit the 2011 Fresno County Agricultural Crop and Livestock Report. This annual statistical compilation presents data pertaining to the acreage, yield, and gross value of Fresno County agricultural products. This version of the annual report will be available only in electronic format on our Department website or by CD upon request. The total gross production value of Fresno County agricultural commodities in 2011 was $6,886,213,700. This represents a 15.84 percent increase from the 2010 production value. Increases were seen in field crops (79.37% = $299,050,000), vegetable crops (4.77% = $72,936,000), fruit and nut crops (10.33% = $290,111,000), livestock and poultry (20.68% = $165,675,000), livestock and poultry products (27.36% = 111,911,000), apiary products (55.87% = $19,947,000), and industrial crops (58.12% = $1,533,700). Decreases in seed crops (35.28% = - $17,980,000) and nursery products (4.61% = - $1,728,000) are also reflected in this report. Of utmost importance, it must be emphasized that the values in this report reflect gross values only and do not in any manner reflect net income or loss to the producers. I would like to convey my deepest appreciation to the entire Department of Agriculture staff for their efforts in bringing this report to fruition, especially Supervising Agricultural/Standards Specialist, Scotti Walker; Support Staff - Angel Gibson, Koua Moua, Vera Scott-Slater, Billy Hopper; and last but not least, Deputy Agricultural Commissioner Fred Rinder. This report exists because of the dedication and months of work done by this exceptional staff. Without the cooperation and help from the growers and ranchers of Fresno County, related agricultural agencies and industry associations, this report could not be produced. I would like to extend my sincere thanks for their participation and sharing of data that resulted in this report. Sincerely,
Carol N. Hafner
Agricultural Commissioner/Sealer
1730 S. Maple Avenue / Fresno, California 93702-4596 / (559) 600-7510
http://www.co.fresno.ca.us/fresnoag – [email protected] Equal Employment Opportunity - Affirmative Action - Disabled Employer
ii
FRESNO COUNTY DEPARTMENT OF AGRICULTURE
Vision, Mission and Values
VISION Promoting agriculture and a fair marketplace through equal enforcement of laws for the protection of society and the environment. MISSION We are committed to:
Promoting Fresno County agriculture
Fostering public confidence by assuring a fair and equitable marketplace
Protecting environmental quality through the sound application of pesticide and worker safety regulations
Preserving agricultural land use for future generations
Minimizing the pest risk pathways of exotic and harmful pests VALUES In fulfilling our mission, we commit to:
Individual and collective responsibility, integrity and accountability of our actions
Using common sense
Treating people with respect, consistency and fairness
Promoting collaboration and teamwork by encouraging and supporting innovation
Fostering successful partnerships that are consistent with our mission
Taking pride in our work
iii
“The fight to save family farms isn’t just about farmers. It’s about making sure that there is a safe and healthy
food supply for all of us. It’s about jobs, from Main Street to Wall Street. It’s about a better America.”
Willie Nelson
American country singer and Farm Aid organizer
iv
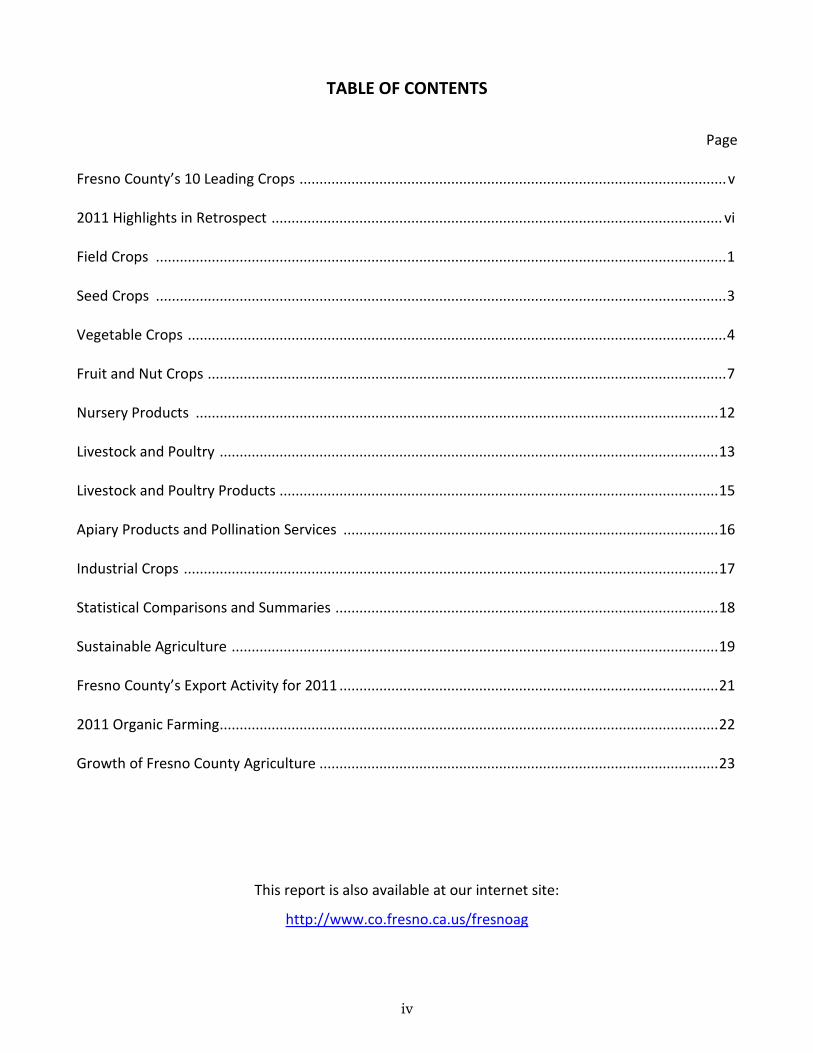
TABLE OF CONTENTS
Page
Fresno County’s 10 Leading Crops ........................................................................................................... v
2011 Highlights in Retrospect ................................................................................................................. vi
Field Crops ............................................................................................................................................... 1
Seed Crops ............................................................................................................................................... 3
Vegetable Crops ....................................................................................................................................... 4
Fruit and Nut Crops .................................................................................................................................. 7
Nursery Products ................................................................................................................................... 12
Livestock and Poultry ............................................................................................................................. 13
Livestock and Poultry Products .............................................................................................................. 15
Apiary Products and Pollination Services .............................................................................................. 16
Industrial Crops ...................................................................................................................................... 17
Statistical Comparisons and Summaries ................................................................................................ 18
Sustainable Agriculture .......................................................................................................................... 19
Fresno County’s Export Activity for 2011 ............................................................................................... 21
2011 Organic Farming ............................................................................................................................. 22
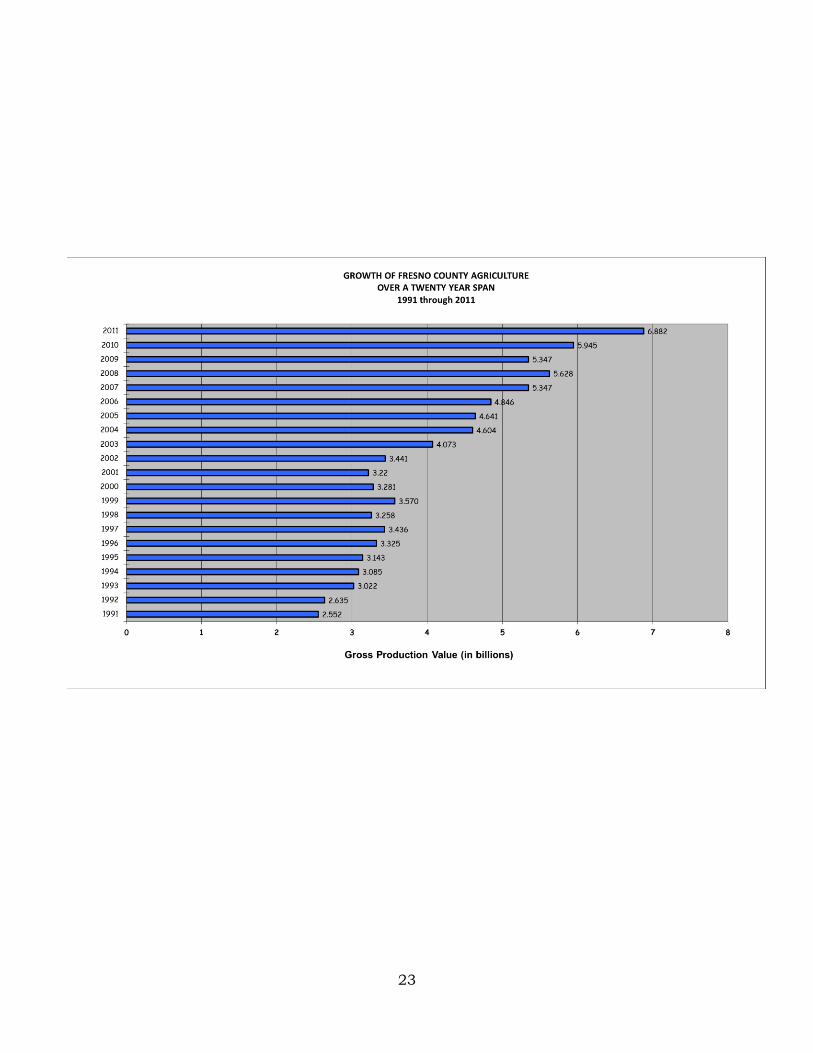
Growth of Fresno County Agriculture .................................................................................................... 23
This report is also available at our internet site:
http://www.co.fresno.ca.us/fresnoag
v
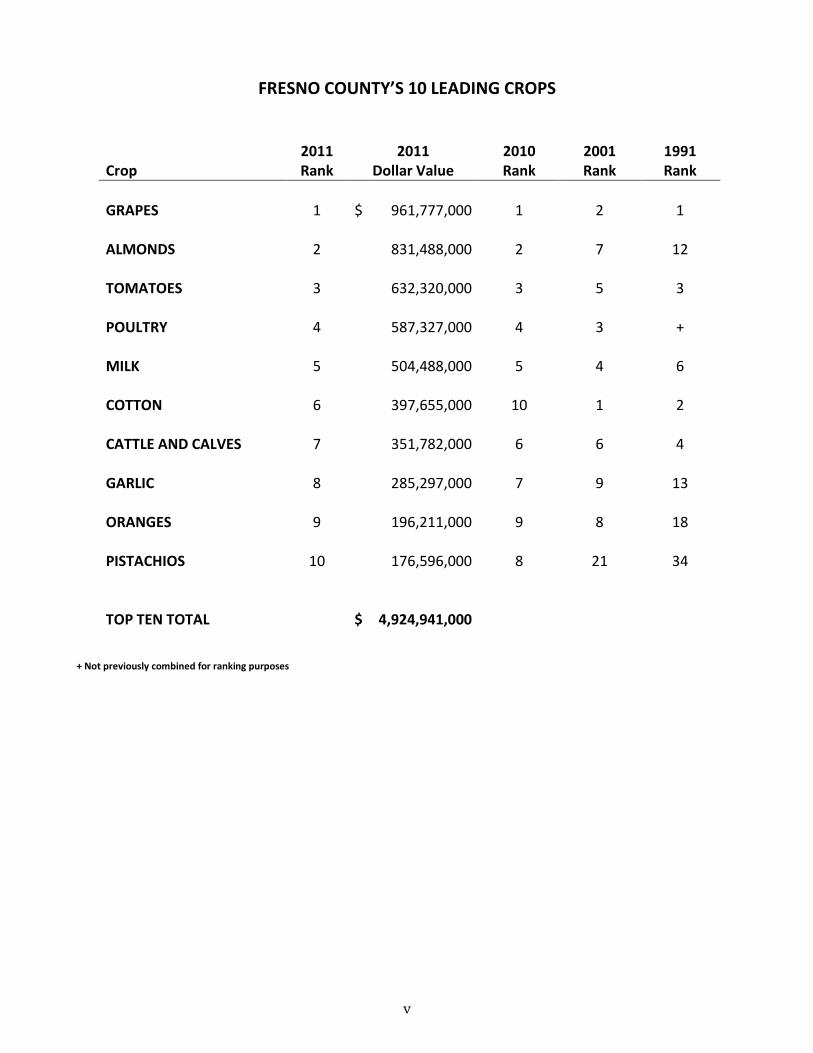
FRESNO COUNTY’S 10 LEADING CROPS
Crop
2011 Rank
2011 Dollar Value
2010 Rank
2001 Rank
1991 Rank
GRAPES
1
$
961,777,000
1
2
1
ALMONDS
2
831,488,000
2
7
12
TOMATOES
3
632,320,000
3
5
3
POULTRY
4
587,327,000
4
3
+
MILK
5
504,488,000
5
4
6
COTTON
6
397,655,000
10
1
2
CATTLE AND CALVES
7
351,782,000
6
6
4
GARLIC
8
285,297,000
7
9
13
ORANGES
9
196,211,000
9
8
18
PISTACHIOS
10
176,596,000
8
21
34
TOP TEN TOTAL
$
4,924,941,000
+ Not previously combined for ranking purposes
vi
2011 HIGHLIGHTS IN RETROSPECT
January: Dryland and small grain fields emerged well as growers applied herbicides and fertilizer when weather permitted. Alfalfa hay and seed growers removed fall growth with herbicides, top burning, or mowing back to the crown. Cotton plowdown was approximately 80-85 percent complete respectively in Firebaugh and Selma. The Ag Commissioner was granted a variance for cotton districts 3 and 4 until the end of the month. Vineyards were pruned, trellises and posts repaired, and cuttings shredded. Orchards received dormant oil treatments and cultivation while dead almond trees were cut for firewood. New acreage was fumigated and planted. Harvesting of winter vegetables was in full swing as winter rotational vegetables were planted. Due to wet soil conditions, onion growers reported a two-week delay in planting. Spring lettuce, fall garlic, garbanzo beans, and safflower were growing well. Blueberries and raspberries arrived from Oregon and Michigan for transplanting. Citrus growers continued to apply fungicide treatments as needed. Lemons, grapefruit, navel oranges, pummelos, tangelos, and tangerines were harvested, packed, and exported. Early January storms improved rangeland conditions; as sheep and cattle grazed retired farmland and semi-dormant alfalfa hay fields. Lambs born in the fall grazed in foggy fields. Out-of-state honey bees were brought in for overwintering along the Interstate 5 corridor in western Fresno County. Hives were also placed in blueberry, almond, and plum orchards for pollination. February: Small grain crops grew well with growers applying herbicide and fertilizer as weather permitted. Alfalfa and alfalfa seed fields were starting to show new growth; but hay production was dormant. Cotton beds were treated with herbicides; some growers reported a shortage of certain varieties of seed for planting. Grapevine pruning and tying continued; brush was windrowed and shredded. Early varieties of stone fruit were in bloom; as fungicides and pre-emergent herbicides were applied to re-planted and pruned orchards. Soil fumigations were underway where there had been crop and/or orchard changes. Sweet corn and processing tomato growers began seeding new fields. Harvesting of asparagus, broccoli, winter vegetables, lemons, grapefruit, mandarins, navel oranges, tangelos, and tangerines were on-going. Garlic, onion, lettuce, and strawberries were emerging and showing good signs of growth. Blueberry and raspberry transplants arrived from Oregon and Michigan for planting. Rangeland conditions were good. Sheep and cattle grazed retired farmland and semi-dormant alfalfa fields. Beehives (local and out-of-state) were placed in/around almond, blueberry, pear, and plum orchards for pollination; however, bee activity was slow due to cooler weather. March: Small grain fields including wheat, barley, oats, and forage mixes continued to mature and head-out. Alfalfa, alfalfa seed, garbanzo beans, safflower, and seed onions all showed good growth. First spring cuttings and windrowing had begun. Due to good yields and prices for cotton the preceding year, more growers prepared their fields by applying herbicides for weed control on cotton beds. Almond and stone fruit bloom was complete. Almond orchards were pruned and sprayed for fungus control. Walnut orchards were dormant. Pistachios, pomegranates, cherries, and prunes grew well; as soil fumigations were underway where there had been crop and/or orchard changes. Grapevines leafed
vii
March continued: out and growers applied fungicides, herbicides, and fertilizers to combat pests like the mealy bug. Cover crops continued to grow well; and in some cases, had been mowed and disced. Broccoli, asparagus, and spring lettuce was harvested; while growers of sweet corn and processing tomatoes were seeding new fields. Garlic, onions, carrots and winter vegetables continued steady growth. Blueberries grown in western Fresno County greenhouses were harvested; but blueberries and strawberries on the eastside were blooming and barely setting fruit. It should be noted that cold, wet weather had significantly delayed planting and development of spring and summer crops. Navel oranges, grapefruit, lemons, and tangerines continued to be harvested, packed, amd treated with fungicides. A few growers netted their seedless mandarin orchards in preparation of bloom. Rangeland conditions improved after a series of storms promoting new grass growth. Sheep and cattle grazed retired farmland and alfalfa hay fields. Bees originally placed in blueberry, pear, plum, cherry, and almond orchards were either moved to citrus or transported out-of-state. April: Dryland grain, wheat, barley and oats were maturing rapidly, headed out and drying down. Wheat and winter forage were harvested for silage and livestock feed. Alfalfa was cut for hay; as seed alfalfa growers mowed back early spring foliage to encourage uniform growth. Fields along the San Joaquin River reported flooding with possible later damage. Cotton, cantaloupe, field corn, honeydew and safflower plantings emerged well; with some early melons showing signs of damage after an unexpected drop in temperature. Field activity of weeding with herbicides, by hand crews or cultivation, pre-irrigation, soil fumigation and bed shaping was on-going. Almonds, apples, apricots, cherries, grapes, jujubes, nectarines, peaches, persimmons, pistachios, plums, pomegranates, prunes, brown turkey figs, walnuts, and garbanzo beans were all growing well. Stone fruits were thinned and treated to control mildew. Grapes were suckered, thinned, and tied; in addition to receiving fungicide, herbicide, insecticide, and sulfur treatments. Harvesting of spring broccoli, leafy vegetables, snow/sugar snap peas, onions, head lettuce, garlic, blueberries, strawberries, and hot-housed herbs were in full swing. There were a number of crops whose growth was slowed by the cooler, damp weather: onions, garlic, sweet corn and transplanted bell peppers/ tomatoes. Citrus Bloom was declared for all districts. New citrus bed preparation continued and foliar nutrients were applied to oranges. Tangerines and mandarins were netted to reduce pollination. Bees were moved from almond, pear, and plum orchards; and placed in citrus groves for honey production. Ranchers grazed cattle and sheared sheep on rangeland, retired farmland, alfalfa, and idle fields. May: Grain fields were mature and harvest had begun. Winter forage was chopped for livestock feed with harvested fields being disced and cultivated for replanting. Rice fields were fertilized flooded and seeded; earlier planted fields emerged with good stands. Seed alfalfa, safflower and cotton grew well. Mustard seed and garbanzo beans were harvested. Stone fruit, almonds, and pistachios were treated with fungicides and showed good growth as the trees and vines leafed out. Grapes shoots and bunches were thinned, vines tied, and sulfur applied to control mildew. Irrigation continued in vineyards as cover crops were mowed and disced. Apples, pomegranates, figs, and jujubes were growing well. There was an overall delay in spring/summer crop development as a result of rainy, cold weather; and crop loss reported during cherry tree harvest due to hail damage. On the other hand, cool temperatures prolonged the harvest of some winter vegetables such as broccoli, cauliflower, and cabbage. Spring crops of onions and garlic were treated with herbicides and

viii
May continued: insecticides. Carrots, bell peppers, and lettuce seed showed good growth. Harvests of cucumbers, fava and green beans, beets, the choys, chards, and kales, daikon, herbs, green and red onions, spinach, sugar snap and snow peas, squash, mustards, turnips, and hot housed tomatoes continued. Watermelon, cantaloupe and honeydews were planted and some were already flowering; subsequent fields continued to be planted. Field activities included weeding with herbicides, hand crews or cultivation, pre-irrigation, soil fumigation, and shaping of beds. Local strawberries and blueberries were harvested and sold at roadside stands. Boysenberries and blackberries were blooming. Petal fall was declared for all districts. Citrus fruit started to form in orchards and olive trees had begun to bloom. Netting was removed from tangerine and mandarin trees; as growers continued to plant seedless tangerines. Bees were placed in onion seed fields, citrus groves for honey production, and staged around melon and squash plantings in preparation for the season. Cattle and sheared sheep grazed rangelands and idle fields. June: Harvest of small grain crops like barley, oats, and wheat had begun; non-irrigated dryland grain growers reported light yields in spite of ample rain. Winter forage harvest around some dairies was complete and re-planted with corn for silage. Rice grew well and was treated with herbicides for weed control. Growers continued their summer-long cycle of cutting, windrowing, raking, and baling for the production of alfalfa and tall wheatgrass hay. Seed alfalfa fields were in full bloom and being treated for lygus, aphid, and other insect pressure. Cotton growers continued to cultivate, irrigate and apply miticide and/or fungicide treatments. Garbanzo beans dried down in preparation for harvest. Almond crops continued to mature and produce heavy yields; some growers were waiting for hull split (which was running about a week late) to treat for mites. Discing, irrigation and application of herbicides on the berms was ongoing. Grapes and pistachios continued to grow nicely. Stone fruits were harvested with some growers thinning nectarines and peaches due to their small size. Pomegranates and jujubes were in bloom and setting fruit. Persimmons and figs were sizing. Harvest of onions, garlic, sweet corn, and leafy vegetables had begun. Bell peppers, tomatoes, and cucumbers were maturing and showing color. Most melon crops were delayed due to unseasonably cool temperatures. Field activities included weed removal with herbicides, hand crews or cultivation, pre-irrigation, soil fumigation, and bed shaping. The blueberry, boysenberry, and strawberry harvests were extended through July. Netting was removed from mandarin and tangerine groves; as harvest of grapefruit, tangelos, oranges and lemons continued. Bees were moved from citrus areas and placed in alfalfa, melon and squash fields for pollination. Sheep and cattle grazed idle fields, rangeland grasses, and harvested grain fields. July: Harvest of small grain crops continued; with fields being disced and prepared for fall planting afterward. Winter forage was chopped for livestock feed. Rice and seed alfalfa fields received aerial herbicide applications. Alfalfa for hay production continued to be cut, windrowed and baled. Sudan grass and silage corn grew well. Safflower fields were in full bloom and drying down. The harvest of garbanzo beans and stevia began; while seed lettuce continued to bolt, branch out, and form heads. Cotton plantings were blooming and making good development as growers finished side dressing by ground application with systemic insecticide control. Apples, grapes, nectarines, peaches, plums, pomegranates, pistachios, and walnuts grew well as the trees and vines pushed out their summer canopy of leaves producing fruits and nuts. Orchard and vineyard operators continued to treat crops
ix
July continued: to control fungus, mold, mildew, mites, and weeds. Brown turkey figs, jujubes, and persimmons sized well. Harvest continued for apriums, Asian pears, nectarines, peaches, plums, and pluots. Frequent rains and moisture caused problems for onion growers who reported 30-40% crop loss; and cooler temperatures delayed harvest and lowered quality of some melons. Garlic, bell peppers, fresh market tomatoes, onion seed, sweet corn, and summer vegetables continued to be harvested; but asparagus, carrots, and cucumbers were complete in most areas. Preparation of subsequent fields and field activities such as- weed removal, pre-irrigations, and bed shaping- were ongoing. Strawberry harvest was winding down and blueberries were complete. Citrus fruit developed well with treatment to control scale and ground preparation for new groves. Late navels and Valencia oranges, tangelos, grapefruit, and lemons were packed and exported. Rangeland grasses and harvested fields were grazed by sheep and cattle. Bees were placed in squash plantings, alfalfa, and melon fields for pollination. August: Barley and wheat harvest was complete; but, straw continued to be baled. Harvest of small grain crops was ongoing as fields were disced and prepared for fall planting. Seed alfalfa, safflower, Sudan grass and corn for silage continued to mature. Cotton was in bloom and setting bolls as miticide and fungicide treatments were applied to control lygus, spider mites, and whiteflies. Harvest was in full swing for sorghum, stevia, garbanzo beans, cantaloupes, honeydew, and watermelons. Some almonds, grapes, and tree fruit were 7 to 14 days behind schedule. Early variety almonds such as nonpareil were shaken from trees and windrowed. Herbicide berm sprays, insecticide, miticide, and fungicide treatments continued. Walnuts, apples, persimmons, pomegranates, carrots and raisin grapes were all growing nicely. Harvest of juice and wine grapes continued; as flame seedless finished up and growers cut canes of dried-on-vine (DOV) raisin grapes. The harvesting of Asian pears, melons, nectarines, peaches, plums, pluots, and strawberries continued. Onions appeared poor in quality initially, but improved significantly as the month progressed. Fresh market/processing tomatoes, bell peppers, garlic, seed lettuce, summer vegetables and sweet corn for human consumption were all harvested. Growers continued to prepare subsequent fields for planting. Field activities included: pre-irrigation, soil fumigation, shaping of beds, and removing weeds with herbicides, hand crews, or cultivation. Strawberries were fumigated and blueberry bushes pruned. Valencia oranges within the County and coastal lemons were packed. Sheep and cattle grazed grain and idle fields. Beehives remained in/around fall melon and squash fields for pollination. September: Wheat and other small grain crops had been harvested; and fields disced and prepared for fall planting. Rice was behind schedule due to unseasonably cool weather. Alfalfa and Sudan grass hay fields were being cut, windrowed, raked and baled. Cotton fields continued to bloom and set bolls; as others were being prepared for defoliation. Almonds, pistachios, walnuts, sorghum for seed, and corn for silage were harvested with good yields; but, garlic and onions were complete. Raisin grape harvest was 96 percent complete. Late season table grapes were covered with plastic; terraced vineyard drives re-leveled; and vines irrigated. The harvest of stone fruits, sweet corn, carrots, processing cucumbers, summer and leafy vegetables, brown turkey figs, apples, watermelon, cantaloupe, honeydew and mixed melons continued. Fall broccoli and fall lettuce grew nicely. Fields planted earlier were fertilized and showed good stand development. Pesticide applications were ongoing to control scale in citrus orchards. Valencia oranges and lemons were harvested and packed. Rangeland conditions were dry. Sheep and cattle continued to graze crop stubble and idle fields.
x
September continued: Bees remained in late melon and squash fields for pollination. October: The harvest of wheat and other small grain crops was complete. Rice straw was bundled and fields disced to prepare for fall planting. Alfalfa growers continued cutting, windrowing, raking, and bailing for alfalfa hay. Sudan grass grew well. Cotton defoliation continued as harvest began with reports of good yields. A heavy rainstorm passed through early in the month causing delays in harvest of a number of crops and extra turning of almonds that were on the ground. After the rain, the weather warmed up with a slight breeze. This allowed the affected crops to recover; mitigating any damage. Pistachios, almonds, walnuts, pomegranates, brown turkey figs, jujubes, Asian pears, persimmons, and grapes were all harvested. Late season table grapes were covered with plastic to protect them from rain; and DOV raisins were not yet ready for harvest. Stone fruits were picked and packed; but at a much slower pace toward month’s end. Harvest of broccoli, lettuce, sweet corn, processing onions and tomatoes, carrots, bell peppers, cucumbers, summer vegetables and fresh market tomatoes was in full swing. Strawberries were sold at roadside stands. Valencia oranges, lemons, and olives continued to be harvested. Sheep and cattle grazed on harvested crop stubble and small grain fields. Bees were moved to wintering locations. November: Early planted wheat, Sudan grass, and sorghum were growing nicely as some growers chose aerial seeding of barley and wheat. Rice straw was bundled and burned; as alfalfa hay growers made their last cutting for the year. Silage corn, cotton, almond, pistachio, walnut, raisin, kiwi, peach, nectarine, and plum harvests were essentially done for the season. Jujubes, persimmons, pomegranates, and table grape harvest was ongoing. Stone fruit and grape growers pruned and treated for weeds. Cover crops were emerging in vineyards. Garlic, sweet corn, tomato, and summer vegetable harvest was complete; while broccoli, lettuce, olives, and winter vegetables like beets, bittermelon, herbs, kales, daikon, and greens were ongoing. New citrus orchards were planted as navel oranges sized and broke color. Sheep and cattle grazed crop stubble and small grain fields. Bees remained in overwintering locations. December: December started with a major wind event; fortunately, widespread damage was not reported. Planning for next season was well underway with the preparation of rice beds and planting of wheat, barley, oats, and forage mixes. Cotton harvest was complete with only a few Firebaugh District fields out-of-compliance with pink bollworm plowdown requirements. New alfalfa fields were seeded; while alfalfa hay production remained in a semi-dormant state. Field activities included irrigation, cultivation, and the application of fertilizers/herbicides. Garbanzo beans and stevia were growing nicely. Harvest was complete for grapes, persimmons, pomegranates, and lettuce. Growers were busy pruning, shredding brush, tying vines, fertilizing, and applying herbicides/fungicides/insecticides. Early planted onion and garlic fields were germinating. Harvest of broccoli, winter vegetables, grapefruit, lemons, mandarins, navel oranges, pummelos, and tangerines continued. Fungicide sprays were applied and new citrus groves planted. During freezing temperatures, navel orange growers ran water and wind machines to minimize damage. Rangeland conditions were very dry. Sheep and lambs grazed small grain and alfalfa fields. Honey bees arrived from out-of-state for pollination and were placed-in central distribution areas along Interstate 5 in western Fresno County.
xi
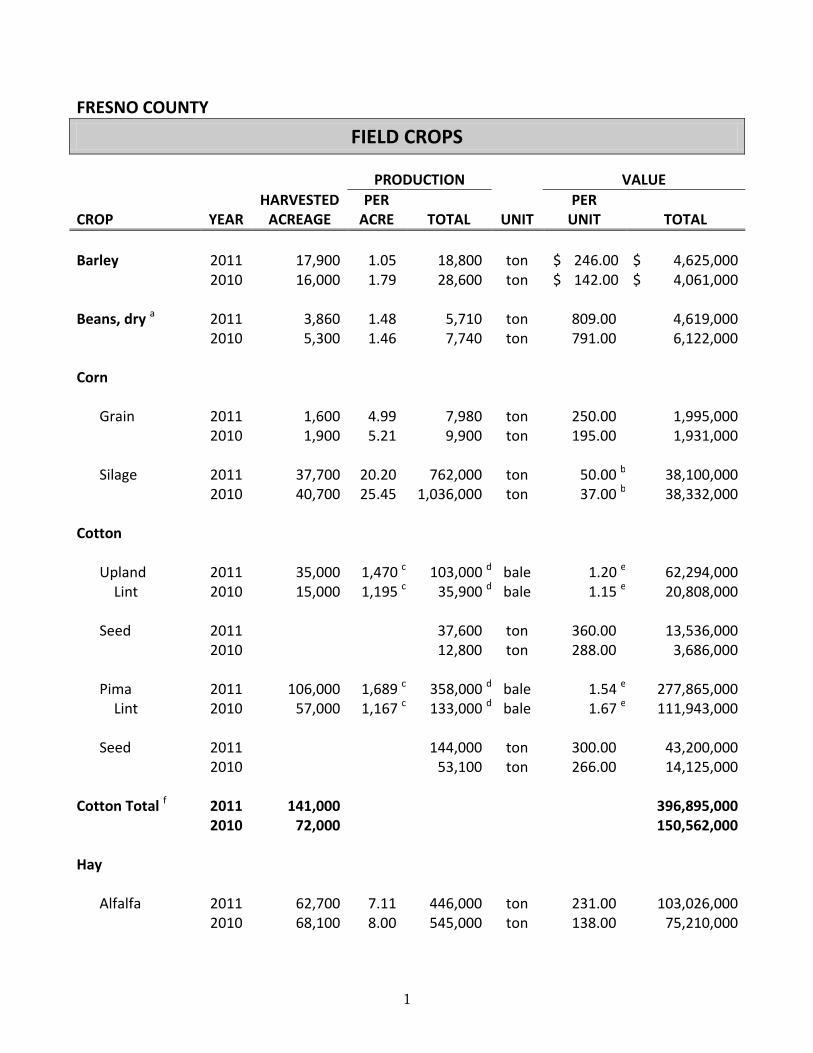
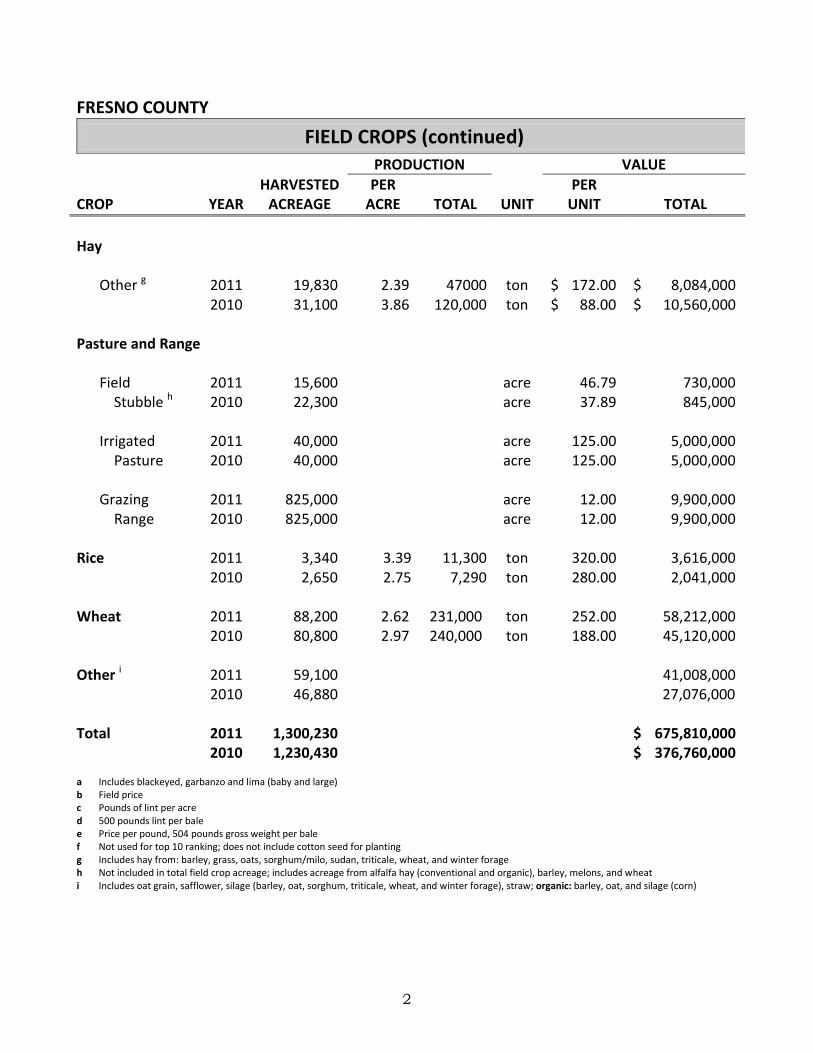
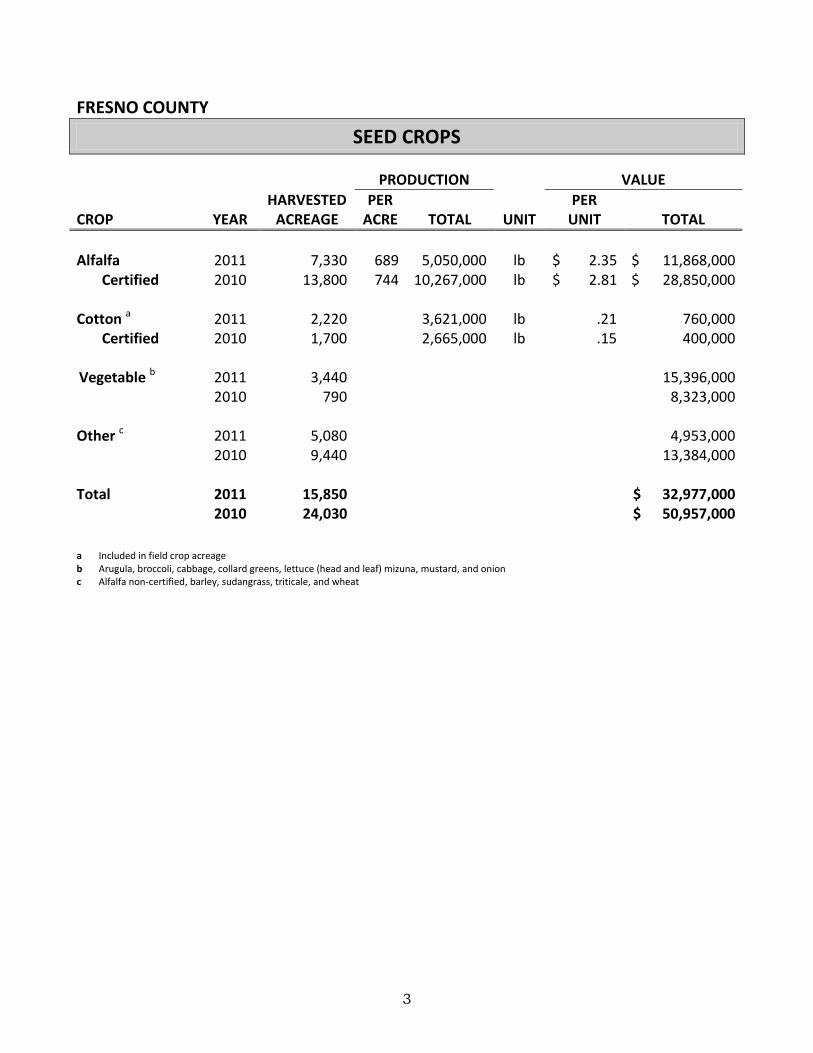
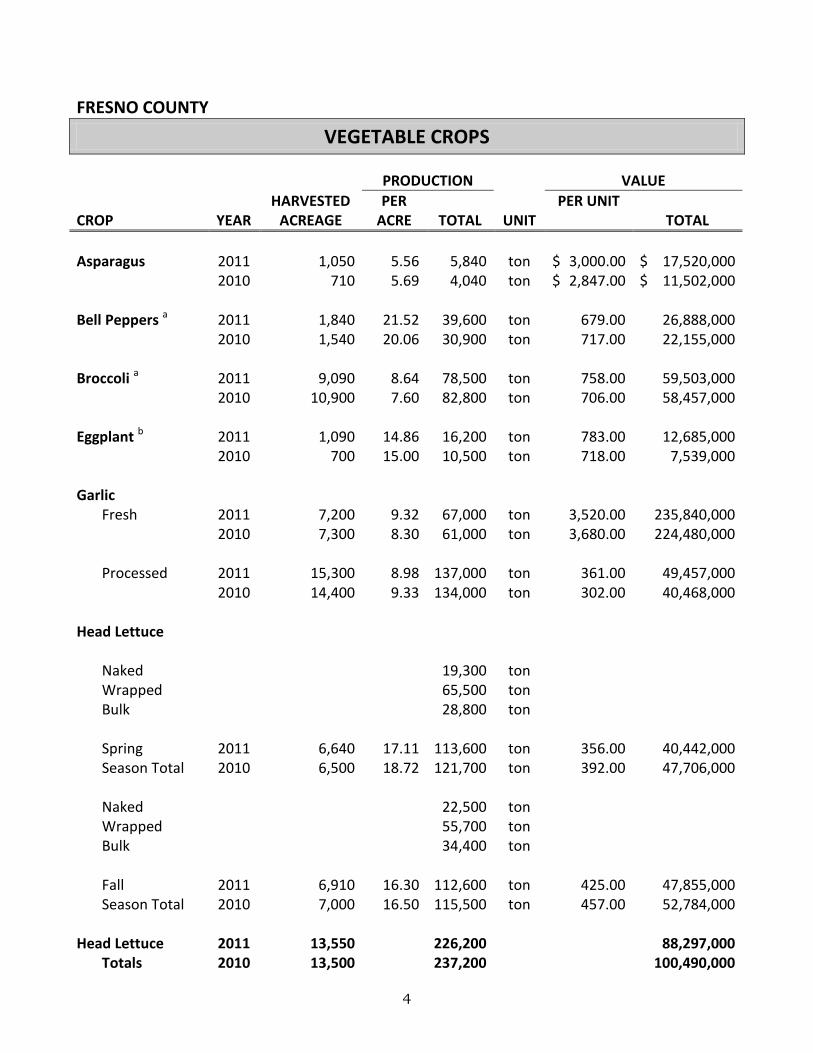
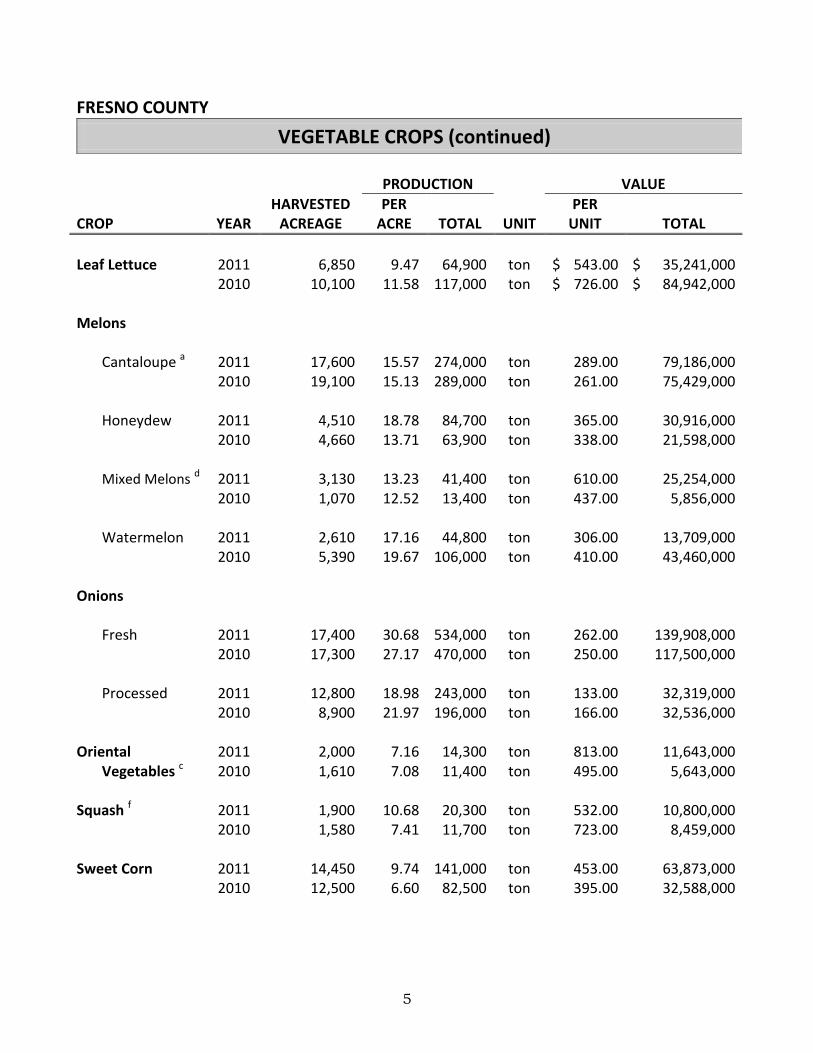
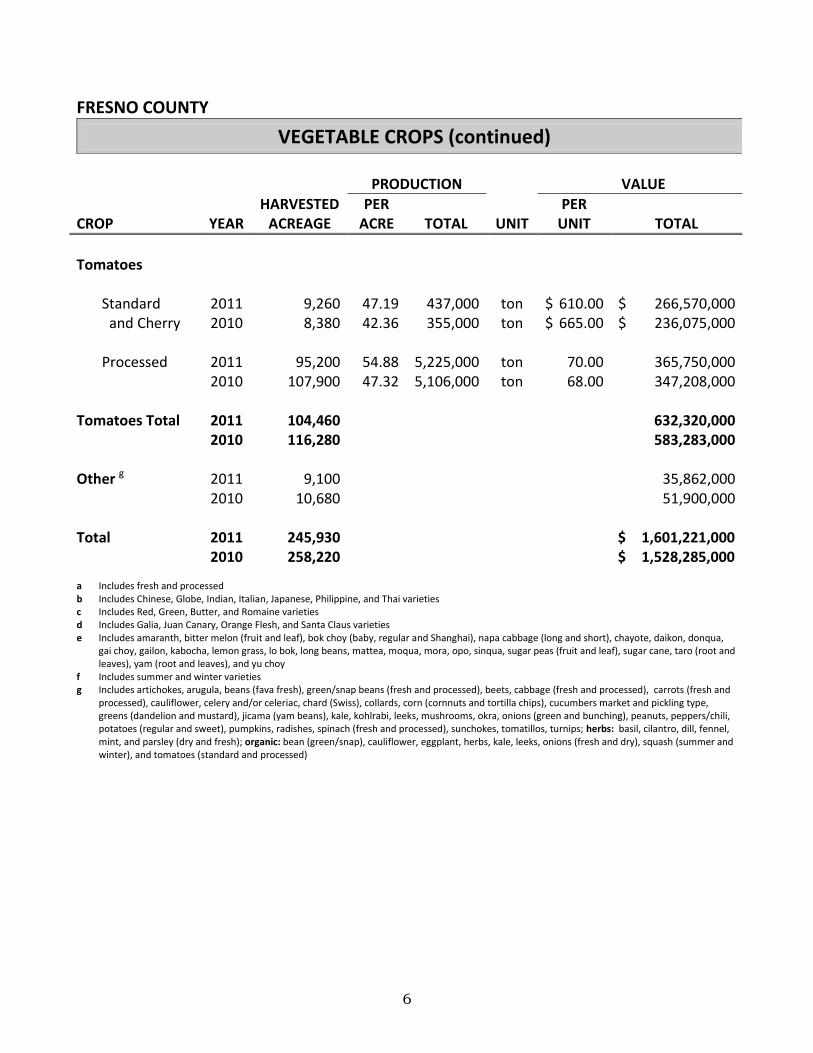
FIELD CROPS: The total gross returns for field crops increased by $299,050,000, from $376,760,000 to $675,810,000, or 79.37 percent from 2010. Upland cotton acreage increased from 15,000 acres to 35,000 acres, and Pima acreage increased from 57,000 to 106,000 acres. The total value for all cotton was $396,895,000, an increase of $246,333,000, or 163.61 percent from 2010. Dry beans decreased in total value by 24.55 percent due to a decrease in acreage. Grazing pasture was unchanged for a total value of $9,900,000. The total value of barley increased to $4,625,000, or 13.89 percent, due to an increase in acreage of 1,900 acres. SEED CROPS: Total gross returns for all seed crops decreased by 35.28 percent in 2011, this was a decrease of $17,980,000 from 2010 values. The value of alfalfa seed decreased by 58.86 percent or $16,982,000, due to an acreage decrease of 6,470. The value of certified cotton seed experienced an increase of 90.0 percent due to an increase in total acreage, production and price. Vegetable seed increased in total value by 84.98 percent while the other category decreased by 62.99 percent. VEGETABLE CROPS: The total value for all vegetable crops was $1,601,221,000 in 2011. Fresh garlic acreage decreased to 7,200 acres, while the total value increased 5.06 percent to $235,840,000, mainly due to the increase in production per acre. Leaf lettuce acreage decreased to 6,850 acres and the revenue decreased by 58.51 percent to $35,241,000. Broccoli acreage decreased to 9,090, however, the total value increased to $59,503,000 or, 1.79 percent. Tomato acreage decreased to 104,460 acres, or 10.17 percent, but the total value increased to $632,320,000, or 8.41 percent, mainly due to an increase in production per acre. Cantaloupe experienced an increase of 4.98 percent in value despite a 7.85 percent decrease in harvested acreage. Fresh onion acreage increased to 17,400, with the value also increasing 19.07 percent to $139,908,000 due to an increase in the price per ton along with an increase in production per acre. FRUIT AND NUT CROPS: Fruit and nut crops increased in total value by 10.73 percent, or $290,111,000, from $2,702,906,000 in 2010 to $2,993,017,000 in 2011. Since 2002 grapes have remained number one on the county’s top ten crop list. The total value for grapes was $961,777,000 up $141,477,000 or 17.25 percent from 2010. Almond meats price per ton increased again this year to $3,496 and increase of 2.25 percent. Pistachios decreased by $45,884,000, or 20.62 percent to $176,596,000, resulting from a decrease in yield and price per ton. Being reported separately for the first time tangerine/mandarin had a value of $166,050,000. However, the total value for oranges decreased by 5.25 percent to $196,211,000. Nectarines increased in value by $4,069,000, or 2.96 percent from 2010 due to an increase in production per acre. The total value for pomegranates decreased by 28.07 percent to $22,420,000. The total value for peaches decreased by $35,589,000, or 25.55 percent. The value for olives canned decreased to $3,045,000, due to a reduction in yield to 2.41 tons per acre for 2011 compared to a yield of 7.89 in 2010.
xii
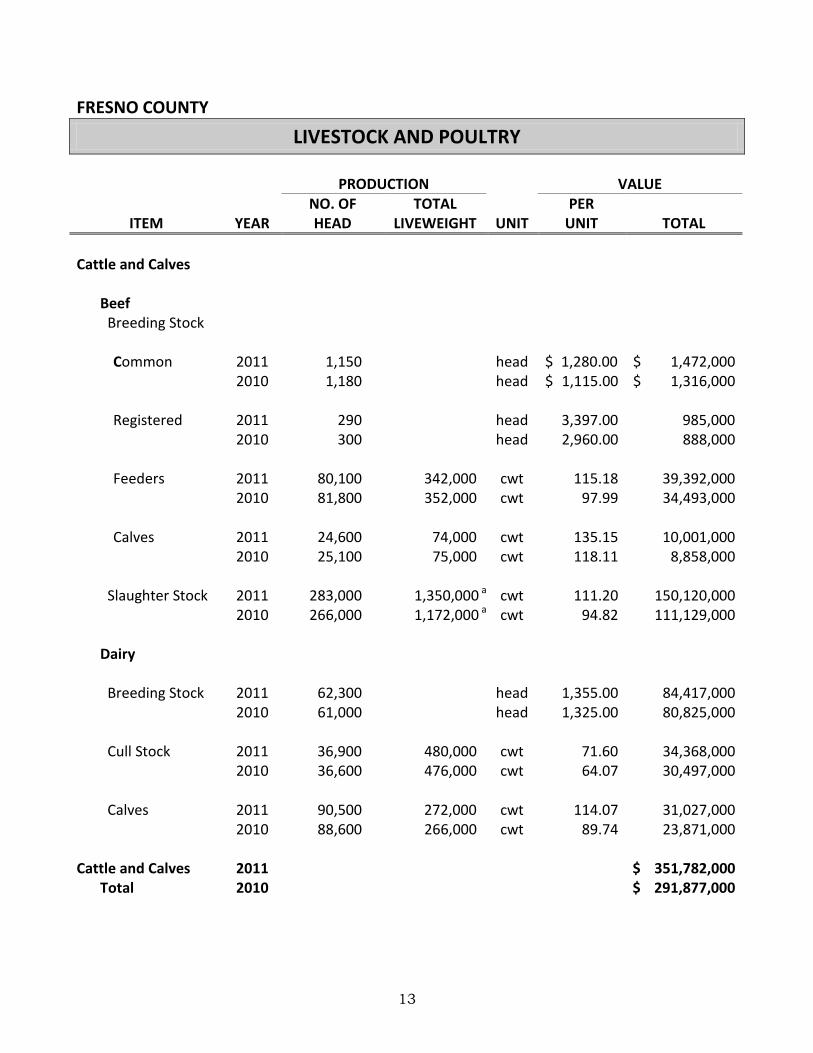
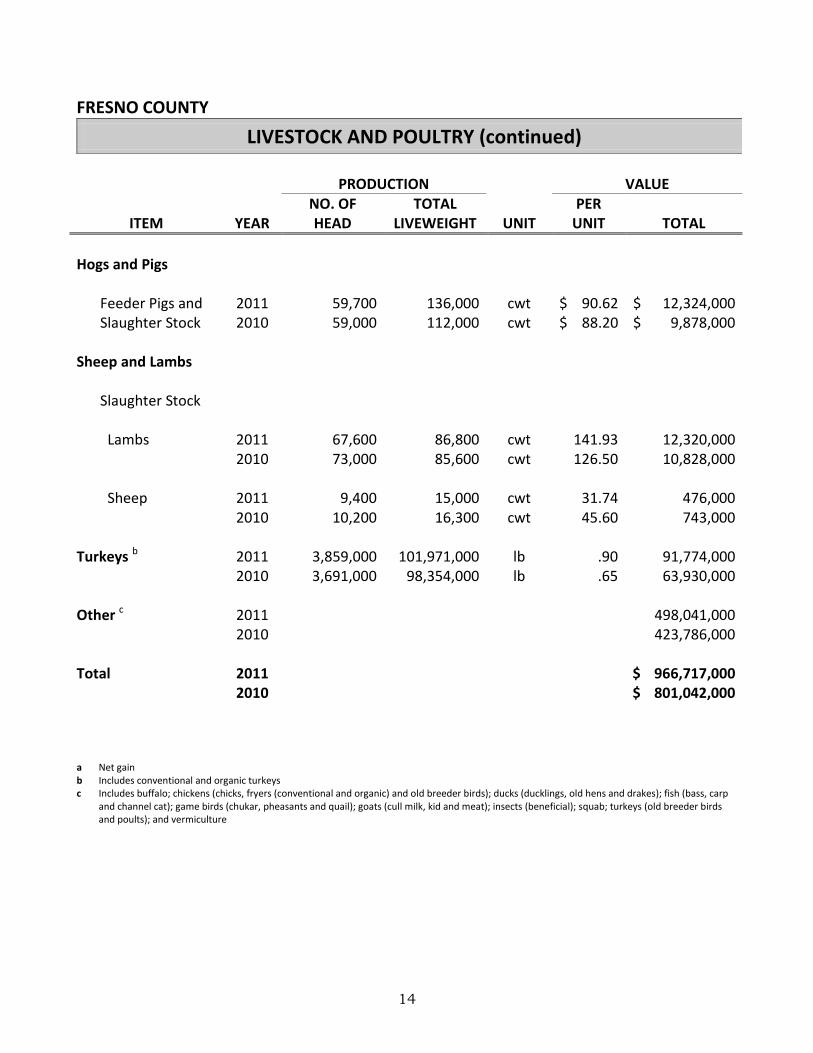
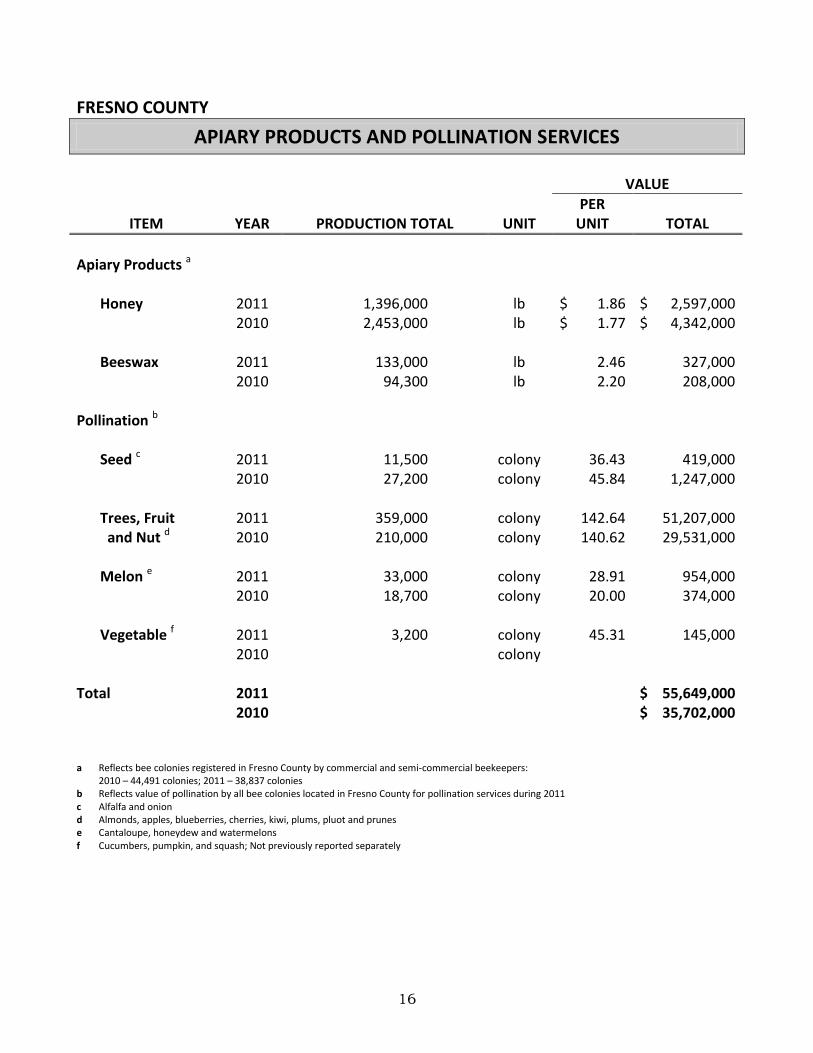
NURSERY: Nursery product sales decreased 4.61 percent, or $1,728,000 in 2011 to $35,750,000 from 37,478,000. While herbaceous and ornamental trees and shrubs increased in total value, the other category, which includes bareroot fruit trees, Christmas trees, citrus (budwood and trees), grapes (rooting and cuttings), vegetable transplants, and turf, decreased in value by 21.73 percent, or $5,991,000. LIVESTOCK AND POULTRY: The total gross returns for livestock and poultry for 2011 was $966,717,000, which is an increase of 20.68 percent from the 2010 total of $801,042,000. Cattle and calves increased in value by 20.52 percent or $59,905,000 from the 2010 value due to increases in the price paid per hundred weights. The value of slaughter stock increased by 35.09 percent to $150,120,000, due to an increase in total live weight sold, coupled with an increase in the price. The value of hogs and pigs increased slightly due to an increase in the number of hogs sold. The total value for lambs increased by 13.78 percent due to an increase in the lamb price, even though the number of head sold decreased. The total value of turkeys increased to $91,774,000, or 43.55 percent, due to an increase in the price per pound and the number of head sold. The other livestock category, which includes buffalo, chickens, ducks, fish, game birds, goats, beneficial insects, squab, old turkey breeders and poults, and vermiculture increased in value in 2011 by $74,255,000, reversing the last two years trend of decreasing value. LIVESTOCK AND POULTRY PRODUCTS: The total value for livestock and poultry products increased by $111,911,000 or 27.36 percent, to $520,900,000. Manure increased in value by 3.11 percent from $3,959,000 in 2010 to $4,082,000 in 2011. The only crop in this category to decrease in value was manufacturing milk, which decreased in value by 47.71 percent in 2011. The value of market milk increased by $112,087,000, or 28.63 percent, due to increases in both production and price. Prices for both market and manufacturing milk increased this year to 18.66 for market, and $18.63 for manufacturing. The price per dozen for hatching egg production increased this year by 2.54 percent, increasing the value to $11,659,000. APIARY PRODUCTS AND POLLINATION SERVICES: Gross returns from apiary and pollination services were up in 2011. The value represents an increase of 55.87 percent, or $19,947,000. Pollination for seed crops dropped in value by $828,000. The value of honey decreased by 40.19 percent to $2,597,000. However, beeswax increased in value to $327,000, or 57.21 percent. INDUSTRIAL CROPS: Industrial crop values increased $1,533,700, or 58.12 percent over 2010. Firewood decreased the number of cords sold and the value dropped by 96.22 percent, while the other category, which includes fence posts, green compost, and wood chips for biomass and landscaping, showed an increase of 114.75 percent. Timber saw an increase in value of 82.35 percent to a value of $1,632,000.
1
FRESNO COUNTY
FIELD CROPS
PRODUCTION VALUE
CROP
YEAR
HARVESTED ACREAGE
PER ACRE
TOTAL
UNIT
PER UNIT
TOTAL
Barley 2011
2010 17,900 16,000
1.05 1.79
18,800 28,600
ton ton
$ $
246.00 142.00
$ $
4,625,000 4,061,000
Beans, dry a 2011 3,860 1.48 5,710 ton 809.00 4,619,000 2010 5,300 1.46 7,740 ton 791.00 6,122,000 Corn Grain 2011 1,600 4.99 7,980 ton 250.00 1,995,000 2010 1,900 5.21 9,900 ton 195.00 1,931,000 Silage 2011 37,700 20.20 762,000 ton 50.00 b 38,100,000 2010 40,700 25.45 1,036,000 ton 37.00 b 38,332,000 Cotton Upland 2011 35,000 1,470 c 103,000 d bale 1.20 e 62,294,000 Lint 2010 15,000 1,195 c 35,900 d bale 1.15 e 20,808,000 Seed 2011 37,600 ton 360.00 13,536,000 2010 12,800 ton 288.00 3,686,000 Pima 2011 106,000 1,689 c 358,000 d bale 1.54 e 277,865,000 Lint 2010 57,000 1,167 c 133,000 d bale 1.67 e 111,943,000 Seed 2011 144,000 ton 300.00 43,200,000 2010 53,100 ton 266.00 14,125,000 Cotton Total f 2011 141,000 396,895,000 2010 72,000 150,562,000 Hay Alfalfa 2011 62,700 7.11 446,000 ton 231.00 103,026,000 2010 68,100 8.00 545,000 ton 138.00 75,210,000
2
FRESNO COUNTY
FIELD CROPS (continued)
PRODUCTION VALUE
CROP
YEAR
HARVESTED ACREAGE
PER ACRE
TOTAL
UNIT
PER UNIT
TOTAL
Hay Other g 2011 19,830 2.39 47000 ton $ 172.00 $ 8,084,000 2010 31,100 3.86 120,000 ton $ 88.00 $ 10,560,000 Pasture and Range Field 2011 15,600 acre 46.79 730,000 Stubble h 2010 22,300 acre 37.89 845,000 Irrigated 2011 40,000 acre 125.00 5,000,000 Pasture 2010 40,000 acre 125.00 5,000,000 Grazing 2011 825,000 acre 12.00 9,900,000 Range 2010 825,000 acre 12.00 9,900,000 Rice 2011 3,340 3.39 11,300 ton 320.00 3,616,000 2010 2,650 2.75 7,290 ton 280.00 2,041,000
Wheat 2011 88,200 2.62 231,000 ton 252.00 58,212,000 2010 80,800 2.97 240,000 ton 188.00 45,120,000 Other i 2011 59,100 41,008,000 2010 46,880 27,076,000 Total 2011 1,300,230 $ 675,810,000 2010 1,230,430 $ 376,760,000 a Includes blackeyed, garbanzo and lima (baby and large) b Field price c Pounds of lint per acre d 500 pounds lint per bale e Price per pound, 504 pounds gross weight per bale f Not used for top 10 ranking; does not include cotton seed for planting g Includes hay from: barley, grass, oats, sorghum/milo, sudan, triticale, wheat, and winter forage h Not included in total field crop acreage; includes acreage from alfalfa hay (conventional and organic), barley, melons, and wheat i Includes oat grain, safflower, silage (barley, oat, sorghum, triticale, wheat, and winter forage), straw; organic: barley, oat, and silage (corn)
3
FRESNO COUNTY
SEED CROPS
PRODUCTION VALUE
CROP
YEAR
HARVESTED ACREAGE
PER ACRE
TOTAL
UNIT
PER UNIT
TOTAL
Alfalfa 2011 7,330 689 5,050,000 lb $ 2.35 $ 11,868,000 Certified 2010 13,800 744 10,267,000 lb $ 2.81 $ 28,850,000 Cotton a 2011 2,220 3,621,000 lb .21 760,000 Certified 2010 1,700 2,665,000 lb .15 400,000
Vegetable b 2011 3,440 15,396,000 2010 790 8,323,000 Other c 2011 5,080 4,953,000 2010 9,440 13,384,000 Total 2011 15,850 $ 32,977,000 2010 24,030 $ 50,957,000 a Included in field crop acreage b Arugula, broccoli, cabbage, collard greens, lettuce (head and leaf) mizuna, mustard, and onion c Alfalfa non-certified, barley, sudangrass, triticale, and wheat
4
FRESNO COUNTY
VEGETABLE CROPS
PRODUCTION VALUE
CROP
YEAR
HARVESTED ACREAGE
PER ACRE
TOTAL
UNIT
PER UNIT TOTAL
Asparagus 2011 1,050 5.56 5,840 ton $ 3,000.00 $ 17,520,000 2010 710 5.69 4,040 ton $ 2,847.00 $ 11,502,000 Bell Peppers a 2011 1,840 21.52 39,600 ton 679.00 26,888,000 2010 1,540 20.06 30,900 ton 717.00 22,155,000 Broccoli a 2011 9,090 8.64 78,500 ton 758.00 59,503,000 2010 10,900 7.60 82,800 ton 706.00 58,457,000 Eggplant b 2011 1,090 14.86 16,200 ton 783.00 12,685,000 2010 700 15.00 10,500 ton 718.00 7,539,000 Garlic Fresh 2011 7,200 9.32 67,000 ton 3,520.00 235,840,000 2010 7,300 8.30 61,000 ton 3,680.00 224,480,000 Processed 2011 15,300 8.98 137,000 ton 361.00 49,457,000 2010 14,400 9.33 134,000 ton 302.00 40,468,000 Head Lettuce Naked 19,300 ton Wrapped 65,500 ton Bulk 28,800 ton Spring 2011 6,640 17.11 113,600 ton 356.00 40,442,000 Season Total 2010 6,500 18.72 121,700 ton 392.00 47,706,000 Naked 22,500 ton Wrapped 55,700 ton Bulk 34,400 ton Fall 2011 6,910 16.30 112,600 ton 425.00 47,855,000 Season Total 2010 7,000 16.50 115,500 ton 457.00 52,784,000 Head Lettuce 2011 13,550 226,200 88,297,000 Totals 2010 13,500 237,200 100,490,000
5
FRESNO COUNTY
VEGETABLE CROPS (continued)
PRODUCTION VALUE
CROP
YEAR
HARVESTED ACREAGE
PER ACRE
TOTAL
UNIT
PER UNIT
TOTAL
Leaf Lettuce 2011 6,850 9.47 64,900 ton $ 543.00 $ 35,241,000 2010 10,100 11.58 117,000 ton $ 726.00 $ 84,942,000 Melons Cantaloupe a 2011 17,600 15.57 274,000 ton 289.00 79,186,000 2010 19,100 15.13 289,000 ton 261.00 75,429,000 Honeydew 2011 4,510 18.78 84,700 ton 365.00 30,916,000 2010 4,660 13.71 63,900 ton 338.00 21,598,000 Mixed Melons d 2011 3,130 13.23 41,400 ton 610.00 25,254,000 2010 1,070 12.52 13,400 ton 437.00 5,856,000 Watermelon 2011 2,610 17.16 44,800 ton 306.00 13,709,000 2010 5,390 19.67 106,000 ton 410.00 43,460,000 Onions Fresh 2011 17,400 30.68 534,000 ton 262.00 139,908,000 2010 17,300 27.17 470,000 ton 250.00 117,500,000 Processed 2011 12,800 18.98 243,000 ton 133.00 32,319,000 2010 8,900 21.97 196,000 ton 166.00 32,536,000 Oriental 2011 2,000 7.16 14,300 ton 813.00 11,643,000 Vegetables c 2010 1,610 7.08 11,400 ton 495.00 5,643,000 Squash f 2011 1,900 10.68 20,300 ton 532.00 10,800,000 2010 1,580 7.41 11,700 ton 723.00 8,459,000 Sweet Corn 2011 14,450 9.74 141,000 ton 453.00 63,873,000 2010 12,500 6.60 82,500 ton 395.00 32,588,000
6
FRESNO COUNTY
VEGETABLE CROPS (continued)
PRODUCTION VALUE
CROP
YEAR
HARVESTED ACREAGE
PER ACRE
TOTAL
UNIT
PER UNIT
TOTAL
Tomatoes Standard 2011 9,260 47.19 437,000 ton $ 610.00 $ 266,570,000 and Cherry 2010 8,380 42.36 355,000 ton $ 665.00 $ 236,075,000 Processed 2011 95,200 54.88 5,225,000 ton 70.00 365,750,000 2010 107,900 47.32 5,106,000 ton 68.00 347,208,000 Tomatoes Total 2011 104,460 632,320,000 2010 116,280 583,283,000 Other g 2011 9,100 35,862,000
2010 10,680 51,900,000 Total 2011 245,930 $ 1,601,221,000 2010 258,220 $ 1,528,285,000 a Includes fresh and processed b Includes Chinese, Globe, Indian, Italian, Japanese, Philippine, and Thai varieties c Includes Red, Green, Butter, and Romaine varieties d Includes Galia, Juan Canary, Orange Flesh, and Santa Claus varieties e Includes amaranth, bitter melon (fruit and leaf), bok choy (baby, regular and Shanghai), napa cabbage (long and short), chayote, daikon, donqua,
gai choy, gailon, kabocha, lemon grass, lo bok, long beans, mattea, moqua, mora, opo, sinqua, sugar peas (fruit and leaf), sugar cane, taro (root and leaves), yam (root and leaves), and yu choy
f Includes summer and winter varieties g Includes artichokes, arugula, beans (fava fresh), green/snap beans (fresh and processed), beets, cabbage (fresh and processed), carrots (fresh and
processed), cauliflower, celery and/or celeriac, chard (Swiss), collards, corn (cornnuts and tortilla chips), cucumbers market and pickling type, greens (dandelion and mustard), jicama (yam beans), kale, kohlrabi, leeks, mushrooms, okra, onions (green and bunching), peanuts, peppers/chili, potatoes (regular and sweet), pumpkins, radishes, spinach (fresh and processed), sunchokes, tomatillos, turnips; herbs: basil, cilantro, dill, fennel, mint, and parsley (dry and fresh); organic: bean (green/snap), cauliflower, eggplant, herbs, kale, leeks, onions (fresh and dry), squash (summer and winter), and tomatoes (standard and processed)

7
FRESNO COUNTY
FRUIT AND NUT CROPS PRODUCTION VALUE
CROP
YEAR
HARVESTED ACREAGE
PER ACRE
TOTAL
UNIT
PER UNIT
TOTAL
Almonds a 2011 150,008 1.47 221,000 ton $ 3,496.00 $ 772,616,000 2010 137,930 1.23 170,000 ton $ 3,419.00 $ 581,230,000 Almonds Hulls 2011 446,000 ton 132.00 58,872,000 2010 374,000 ton 101.00 37,774,000 Apples a 2011 663 21.95 2010 711 20.83 Fresh 2011 11,900 ton 937.00 11,150,000 2010 12,300 ton 825.00 10,148,000 Processed 2011 2,650 ton 90.00 239,000 2010 2,510 ton 324.00 813,000 Apricots a 2011 1,705 4.27 7,280 ton 1,159.00 8,438,000 2010 1,576 5.58 8,800 ton 1,390.00 12,232,000 Cherries 2011 3,173 3.10 9,840 ton 3,245.00 31,931,000 2010 3,367 5.56 18,700 ton 4,062.00 75,959,000 Citrus 2011 2,276 15.00 Lemons 2010 2,130 6.85 Fresh 2011 34,100 ton 900.00 30,690,000 2010 14,600 ton 975.00 14,235,000 Oranges Navel a 2011 21,112 15.57 2010 29,085 11.95 Fresh 2011 262,000 ton 644.00 168,728,000 2010 287,000 ton 625.00 179,375,000 Processed 2011 67,100 ton 77.00 5,167,000 2010 60,500 ton 20.00 1,210,000

8
FRESNO COUNTY
FRUIT AND NUT CROPS (continued)
PRODUCTION VALUE
CROP
YEAR
HARVESTED ACREAGE
PER ACRE
TOTAL
UNIT
PER UNIT
TOTAL
Oranges, continued Valencia 2011 2,613 19.87 2010 3,633 15.33 Fresh 2011 37,900 ton $ 543.00 $ 20,580,000 2010 43,300 ton $ 587.00 $ 25,417,000 Processed 2011 14,000 ton 124.00 1,736,000 2010 12,900 ton 84.00 1,084,000 Oranges Total 2011 23,725 196,211,000 2010 32,751 207,086,000 Tangerine/ 2011 7,488 18.00 Mandarin 2010c Fresh 2011 135,000 ton 1,230.00 166,050,000 2010c Citrus, other a, b
2011 1,250 11.00 2010 7,919 12.75 Fresh 2011 13,800 ton 1,111.00 15,332,000 2010 101,000 ton 1,120.00 121,200,000 Grapes Raisin 2011 165,654 10.35 Varieties a 2010 137,644 10.47 Canned 2011 5,570 ton 275.00 1,532,000 2010 8,500 ton 203.00 1,726,000
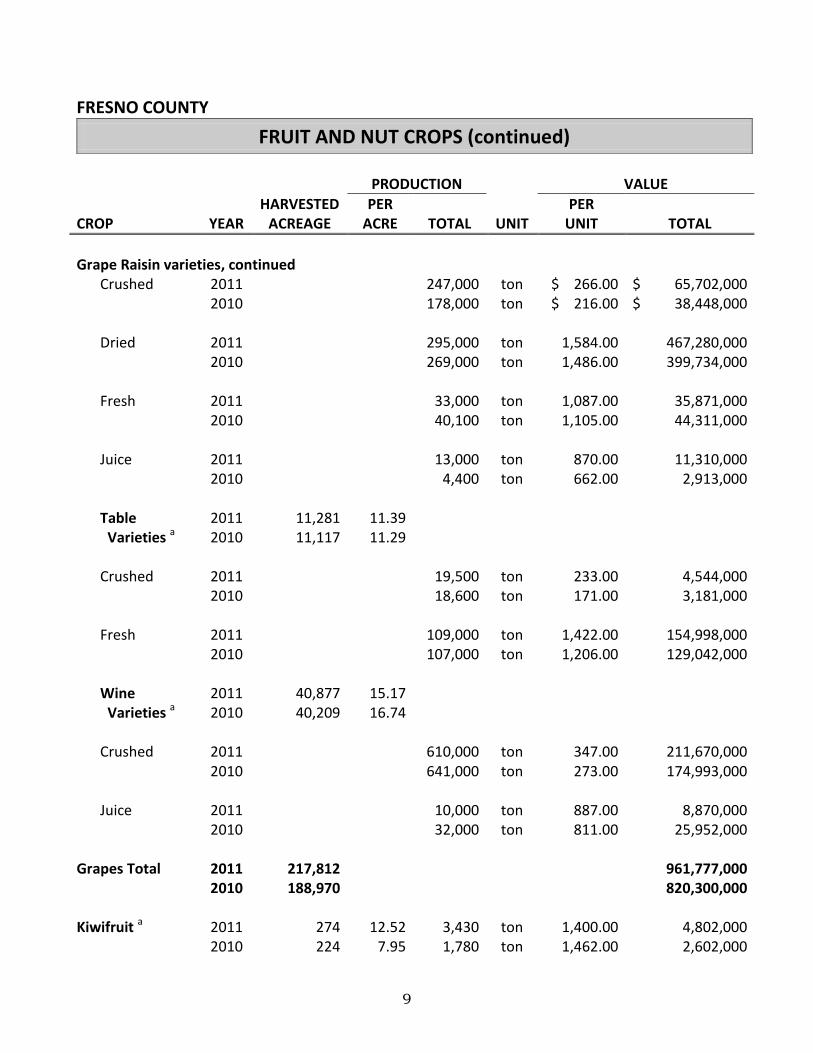
9
FRESNO COUNTY
FRUIT AND NUT CROPS (continued)
PRODUCTION
VALUE
CROP
YEAR
HARVESTED ACREAGE
PER ACRE
TOTAL
UNIT
PER UNIT
TOTAL
Grape Raisin varieties, continued Crushed 2011 247,000 ton $ 266.00 $ 65,702,000 2010 178,000 ton $ 216.00 $ 38,448,000 Dried 2011 295,000 ton 1,584.00 467,280,000 2010 269,000 ton 1,486.00 399,734,000 Fresh 2011 33,000 ton 1,087.00 35,871,000 2010 40,100 ton 1,105.00 44,311,000 Juice 2011 13,000 ton 870.00 11,310,000 2010 4,400 ton 662.00 2,913,000 Table 2011 11,281 11.39 Varieties a 2010 11,117 11.29 Crushed 2011 19,500 ton 233.00 4,544,000 2010 18,600 ton 171.00 3,181,000 Fresh 2011 109,000 ton 1,422.00 154,998,000 2010 107,000 ton 1,206.00 129,042,000 Wine 2011 40,877 15.17 Varieties a 2010 40,209 16.74 Crushed 2011 610,000 ton 347.00 211,670,000 2010 641,000 ton 273.00 174,993,000 Juice 2011 10,000 ton 887.00 8,870,000 2010 32,000 ton 811.00 25,952,000 Grapes Total 2011 217,812 961,777,000 2010 188,970 820,300,000 Kiwifruit a 2011 274 12.52 3,430 ton 1,400.00 4,802,000 2010 224 7.95 1,780 ton 1,462.00 2,602,000
10
FRESNO COUNTY
FRUIT AND NUT CROPS (continued)
PRODUCTION VALUE
CROP
YEAR
HARVESTED ACREAGE
PER ACRE
TOTAL
UNIT
PER UNIT
TOTAL
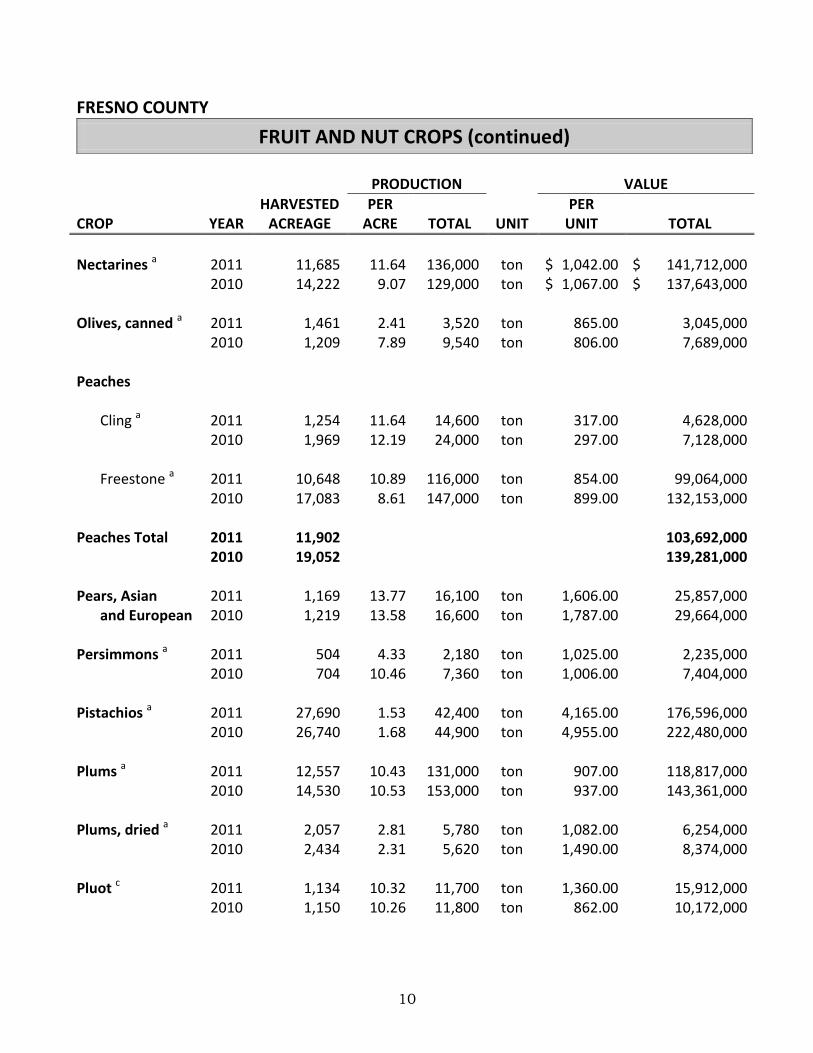
Nectarines a 2011 11,685 11.64 136,000 ton $ 1,042.00 $ 141,712,000 2010 14,222 9.07 129,000 ton $ 1,067.00 $ 137,643,000 Olives, canned a 2011 1,461 2.41 3,520 ton 865.00 3,045,000 2010 1,209 7.89 9,540 ton 806.00 7,689,000 Peaches Cling a 2011 1,254 11.64 14,600 ton 317.00 4,628,000 2010 1,969 12.19 24,000 ton 297.00 7,128,000 Freestone a 2011 10,648 10.89 116,000 ton 854.00 99,064,000 2010 17,083 8.61 147,000 ton 899.00 132,153,000 Peaches Total 2011 11,902 103,692,000 2010 19,052 139,281,000 Pears, Asian 2011 1,169 13.77 16,100 ton 1,606.00 25,857,000 and European 2010 1,219 13.58 16,600 ton 1,787.00 29,664,000 Persimmons a 2011 504 4.33 2,180 ton 1,025.00 2,235,000 2010 704 10.46 7,360 ton 1,006.00 7,404,000 Pistachios a 2011 27,690 1.53 42,400 ton 4,165.00 176,596,000 2010 26,740 1.68 44,900 ton 4,955.00 222,480,000 Plums a 2011 12,557 10.43 131,000 ton 907.00 118,817,000 2010 14,530 10.53 153,000 ton 937.00 143,361,000
Plums, dried a 2011 2,057 2.81 5,780 ton 1,082.00 6,254,000 2010 2,434 2.31 5,620 ton 1,490.00 8,374,000 Pluot c 2011 1,134 10.32 11,700 ton 1,360.00 15,912,000 2010 1,150 10.26 11,800 ton 862.00 10,172,000
11
FRESNO COUNTY
FRUIT AND NUT CROPS (continued)
PRODUCTION VALUE
CROP
YEAR
HARVESTED ACREAGE
PER ACRE
TOTAL
UNIT
PER UNIT
TOTAL
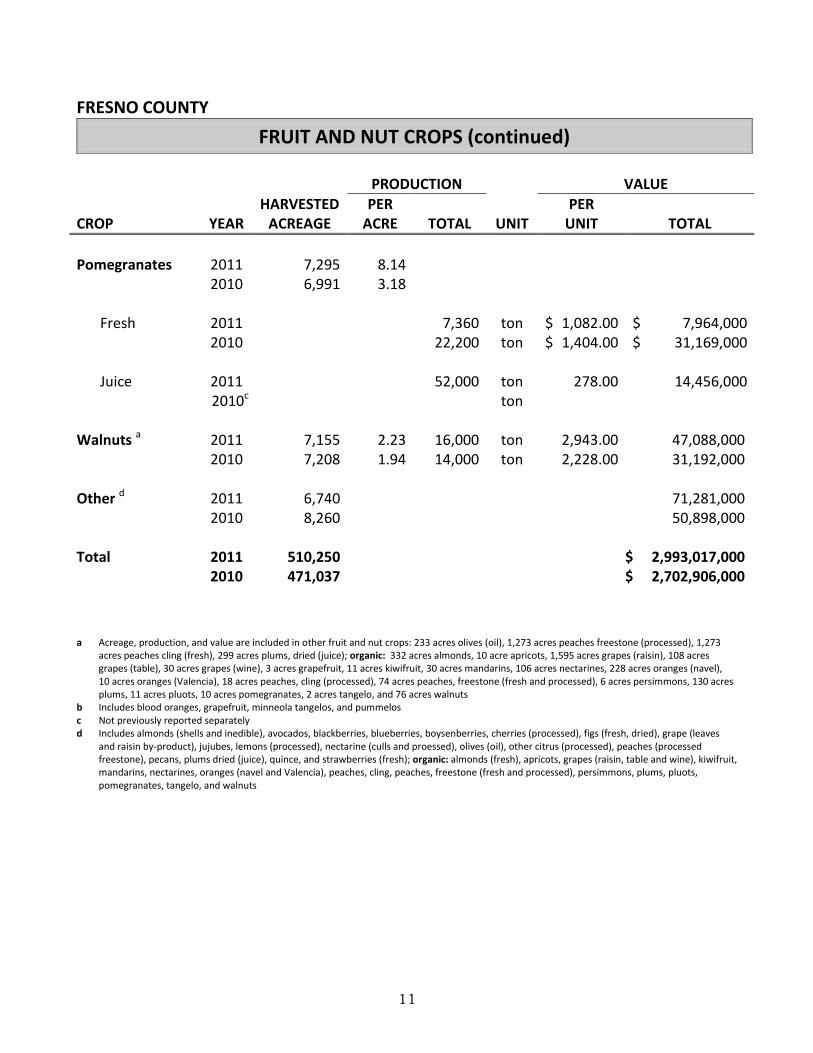
Pomegranates 2011 7,295 8.14 2010 6,991 3.18 Fresh 2011 7,360 ton $ 1,082.00 $ 7,964,000 2010 22,200 ton $ 1,404.00 $ 31,169,000 Juice 2011 52,000 ton 278.00 14,456,000 2010c ton Walnuts a 2011 7,155 2.23 16,000 ton 2,943.00 47,088,000 2010 7,208 1.94 14,000 ton 2,228.00 31,192,000 Other d 2011 6,740 71,281,000
2010 8,260 50,898,000 Total 2011 510,250 $ 2,993,017,000 2010 471,037 $ 2,702,906,000 a Acreage, production, and value are included in other fruit and nut crops: 233 acres olives (oil), 1,273 acres peaches freestone (processed), 1,273
acres peaches cling (fresh), 299 acres plums, dried (juice); organic: 332 acres almonds, 10 acre apricots, 1,595 acres grapes (raisin), 108 acres grapes (table), 30 acres grapes (wine), 3 acres grapefruit, 11 acres kiwifruit, 30 acres mandarins, 106 acres nectarines, 228 acres oranges (navel), 10 acres oranges (Valencia), 18 acres peaches, cling (processed), 74 acres peaches, freestone (fresh and processed), 6 acres persimmons, 130 acres plums, 11 acres pluots, 10 acres pomegranates, 2 acres tangelo, and 76 acres walnuts
b Includes blood oranges, grapefruit, minneola tangelos, and pummelos c Not previously reported separately d Includes almonds (shells and inedible), avocados, blackberries, blueberries, boysenberries, cherries (processed), figs (fresh, dried), grape (leaves
and raisin by-product), jujubes, lemons (processed), nectarine (culls and proessed), olives (oil), other citrus (processed), peaches (processed freestone), pecans, plums dried (juice), quince, and strawberries (fresh); organic: almonds (fresh), apricots, grapes (raisin, table and wine), kiwifruit, mandarins, nectarines, oranges (navel and Valencia), peaches, cling, peaches, freestone (fresh and processed), persimmons, plums, pluots, pomegranates, tangelo, and walnuts
12
FRESNO COUNTY
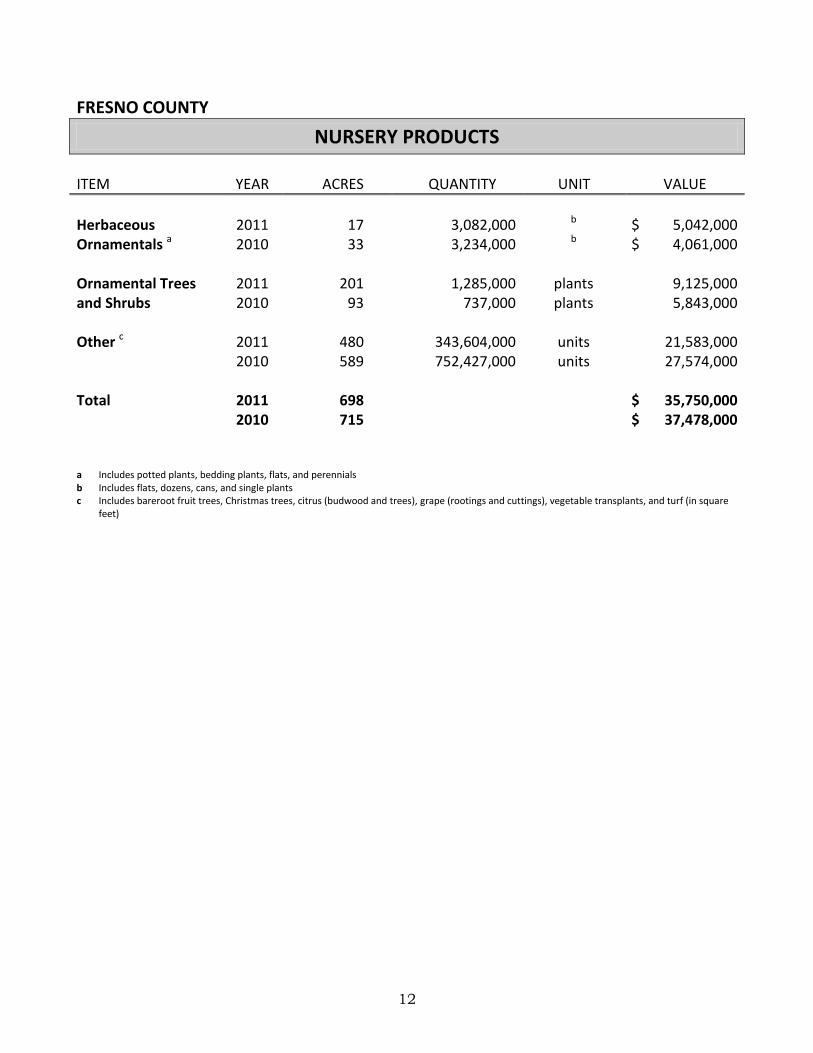
NURSERY PRODUCTS ITEM YEAR ACRES QUANTITY UNIT VALUE
Herbaceous 2011 17 3,082,000 b
$ 5,042,000 Ornamentals a 2010 33 3,234,000 b
$ 4,061,000 Ornamental Trees 2011 201 1,285,000 plants 9,125,000 and Shrubs 2010 93 737,000 plants 5,843,000 Other c 2011 480 343,604,000 units 21,583,000 2010 589 752,427,000 units 27,574,000 Total 2011 698 $ 35,750,000 2010 715 $ 37,478,000 a Includes potted plants, bedding plants, flats, and perennials b Includes flats, dozens, cans, and single plants c Includes bareroot fruit trees, Christmas trees, citrus (budwood and trees), grape (rootings and cuttings), vegetable transplants, and turf (in square
feet)
13
FRESNO COUNTY
LIVESTOCK AND POULTRY PRODUCTION VALUE
ITEM
YEAR
NO. OF HEAD
TOTAL LIVEWEIGHT
UNIT
PER UNIT
TOTAL
Cattle and Calves Beef Breeding Stock Common 2011 1,150 head $ 1,280.00 $ 1,472,000 2010 1,180 head $ 1,115.00 $ 1,316,000 Registered 2011 290 head 3,397.00 985,000 2010 300 head 2,960.00 888,000 Feeders 2011 80,100 342,000 cwt 115.18 39,392,000 2010 81,800 352,000 cwt 97.99 34,493,000 Calves 2011 24,600 74,000 cwt 135.15 10,001,000 2010 25,100 75,000 cwt 118.11 8,858,000 Slaughter Stock 2011 283,000 1,350,000 a cwt 111.20 150,120,000 2010 266,000 1,172,000 a cwt 94.82 111,129,000 Dairy Breeding Stock 2011 62,300 head 1,355.00 84,417,000 2010 61,000 head 1,325.00 80,825,000 Cull Stock 2011 36,900 480,000 cwt 71.60 34,368,000 2010 36,600 476,000 cwt 64.07 30,497,000 Calves 2011 90,500 272,000 cwt 114.07 31,027,000 2010 88,600 266,000 cwt 89.74 23,871,000 Cattle and Calves 2011 $ 351,782,000 Total 2010 $ 291,877,000
14
FRESNO COUNTY
LIVESTOCK AND POULTRY (continued)
PRODUCTION VALUE
ITEM
YEAR
NO. OF HEAD
TOTAL LIVEWEIGHT
UNIT
PER UNIT
TOTAL
Hogs and Pigs Feeder Pigs and 2011 59,700 136,000 cwt $ 90.62 $ 12,324,000 Slaughter Stock 2010 59,000 112,000 cwt $ 88.20 $ 9,878,000 Sheep and Lambs Slaughter Stock Lambs 2011 67,600 86,800 cwt 141.93 12,320,000 2010 73,000 85,600 cwt 126.50 10,828,000 Sheep 2011 9,400 15,000 cwt 31.74 476,000 2010 10,200 16,300 cwt 45.60 743,000 Turkeys b 2011 3,859,000 101,971,000 lb .90 91,774,000 2010 3,691,000 98,354,000 lb .65 63,930,000 Other c 2011 498,041,000 2010 423,786,000 Total 2011 $ 966,717,000 2010 $ 801,042,000 a Net gain b Includes conventional and organic turkeys c Includes buffalo; chickens (chicks, fryers (conventional and organic) and old breeder birds); ducks (ducklings, old hens and drakes); fish (bass, carp
and channel cat); game birds (chukar, pheasants and quail); goats (cull milk, kid and meat); insects (beneficial); squab; turkeys (old breeder birds and poults); and vermiculture

15
FRESNO COUNTY
LIVESTOCK AND POULTRY PRODUCTS VALUE
ITEM
YEAR PRODUCTION
UNIT
PER UNIT
TOTAL
Manure a 2011 725,000 ton $ 5.63 $ 4,082,000 2010 707,000 ton $ 5.60 $ 3,959,000 Milk Manufacturing 2011 50,900 cwt 18.63 948,000 2010 124,000 cwt 14.62 1,813,000 Market b 2011 26,985,000 cwt 18.66 503,540,000 2010 26,325,000 cwt 14.87 391,453,000 Wool 2011 469,000 lb 1.43 671,000 2010 510,000 lb 1.28 653,000 Eggs Hatching c 2011 1,443,000 dozen 8.08 11,659,000 2010 1,410,000 dozen 7.88 11,111,000 Total 2011 $ 520,900,000 2010 $ 408,989,000 a Includes cow and poultry manure b Includes cow milk (conventional and organic) and goat milk c Includes balut, chicken, duck, and turkey
16
FRESNO COUNTY
APIARY PRODUCTS AND POLLINATION SERVICES VALUE
ITEM
YEAR PRODUCTION TOTAL
UNIT
PER UNIT
TOTAL
Apiary Products a Honey 2011 1,396,000 lb $ 1.86 $ 2,597,000 2010 2,453,000 lb $ 1.77 $ 4,342,000 Beeswax 2011 133,000 lb 2.46 327,000 2010 94,300 lb 2.20 208,000 Pollination b Seed c 2011 11,500 colony 36.43 419,000 2010 27,200 colony 45.84 1,247,000 Trees, Fruit 2011 359,000 colony 142.64 51,207,000 and Nut d 2010 210,000 colony 140.62 29,531,000 Melon e 2011 33,000 colony 28.91 954,000 2010 18,700 colony 20.00 374,000 Vegetable f 2011 3,200 colony 45.31 145,000 2010 colony Total 2011 $ 55,649,000 2010 $ 35,702,000 a Reflects bee colonies registered in Fresno County by commercial and semi-commercial beekeepers: 2010 – 44,491 colonies; 2011 – 38,837 colonies b Reflects value of pollination by all bee colonies located in Fresno County for pollination services during 2011 c Alfalfa and onion d Almonds, apples, blueberries, cherries, kiwi, plums, pluot and prunes e Cantaloupe, honeydew and watermelons f Cucumbers, pumpkin, and squash; Not previously reported separately

17
FRESNO COUNTY
INDUSTRIAL CROPS CROP YEAR PRODUCTION UNIT VALUE
Timber a 2011 353,216,000 board feet $ 1,632,000 2010 14,384,000 board feet $ 895,000 Firewood 2011 2,171 cord 21,700 2010 5,595 cord 571,000 Other b 2011 2,519,000 2010 1,173,000 Total 2011 $ 4,172,700 2010 $ 2,639,000 a Includes government and non-government properties b Includes fence posts, green compost and wood chips for biomass and landscaping
18
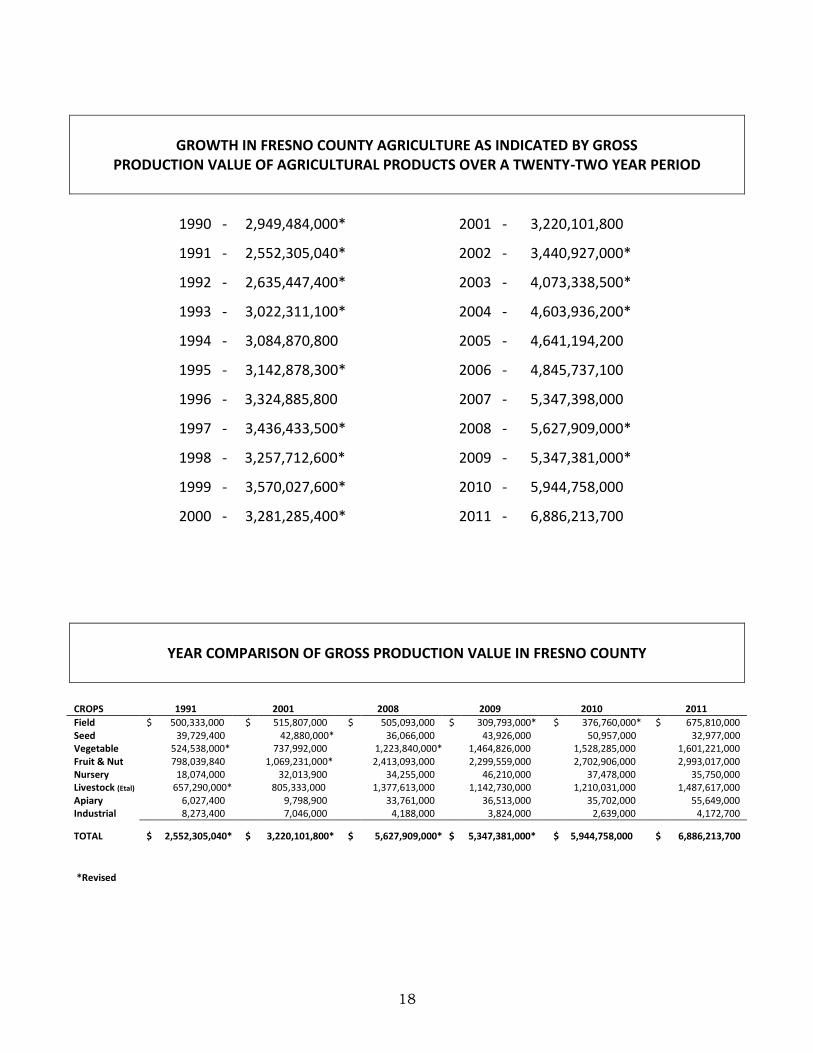
GROWTH IN FRESNO COUNTY AGRICULTURE AS INDICATED BY GROSS
PRODUCTION VALUE OF AGRICULTURAL PRODUCTS OVER A TWENTY-TWO YEAR PERIOD
1990 - 2,949,484,000* 2001 - 3,220,101,800
1991 - 2,552,305,040* 2002 - 3,440,927,000*
1992 - 2,635,447,400* 2003 - 4,073,338,500*
1993 - 3,022,311,100* 2004 - 4,603,936,200*
1994 - 3,084,870,800 2005 - 4,641,194,200
1995 - 3,142,878,300* 2006 - 4,845,737,100
1996 - 3,324,885,800 2007 - 5,347,398,000
1997 - 3,436,433,500* 2008 - 5,627,909,000*
1998 - 3,257,712,600* 2009 - 5,347,381,000*
1999 - 3,570,027,600* 2010 - 5,944,758,000
2000 - 3,281,285,400* 2011 - 6,886,213,700
YEAR COMPARISON OF GROSS PRODUCTION VALUE IN FRESNO COUNTY
CROPS 1991 2001 2008 2009 2010 2011
Field $ 500,333,000 $ 515,807,000 $ 505,093,000 $ 309,793,000* $ 376,760,000* $ 675,810,000 Seed 39,729,400 42,880,000* 36,066,000 43,926,000 50,957,000 32,977,000 Vegetable 524,538,000* 737,992,000 1,223,840,000* 1,464,826,000 1,528,285,000 1,601,221,000 Fruit & Nut 798,039,840 1,069,231,000* 2,413,093,000 2,299,559,000 2,702,906,000 2,993,017,000 Nursery 18,074,000 32,013,900 34,255,000 46,210,000 37,478,000 35,750,000 Livestock (Etal) 657,290,000* 805,333,000 1,377,613,000 1,142,730,000 1,210,031,000 1,487,617,000 Apiary 6,027,400 9,798,900 33,761,000 36,513,000 35,702,000 55,649,000 Industrial 8,273,400 7,046,000 4,188,000 3,824,000 2,639,000 4,172,700
TOTAL $ 2,552,305,040* $ 3,220,101,800* $ 5,627,909,000* $ 5,347,381,000* $ 5,944,758,000 $ 6,886,213,700
*Revised
19
FRESNO COUNTY
SUSTAINABLE AGRICULTURE
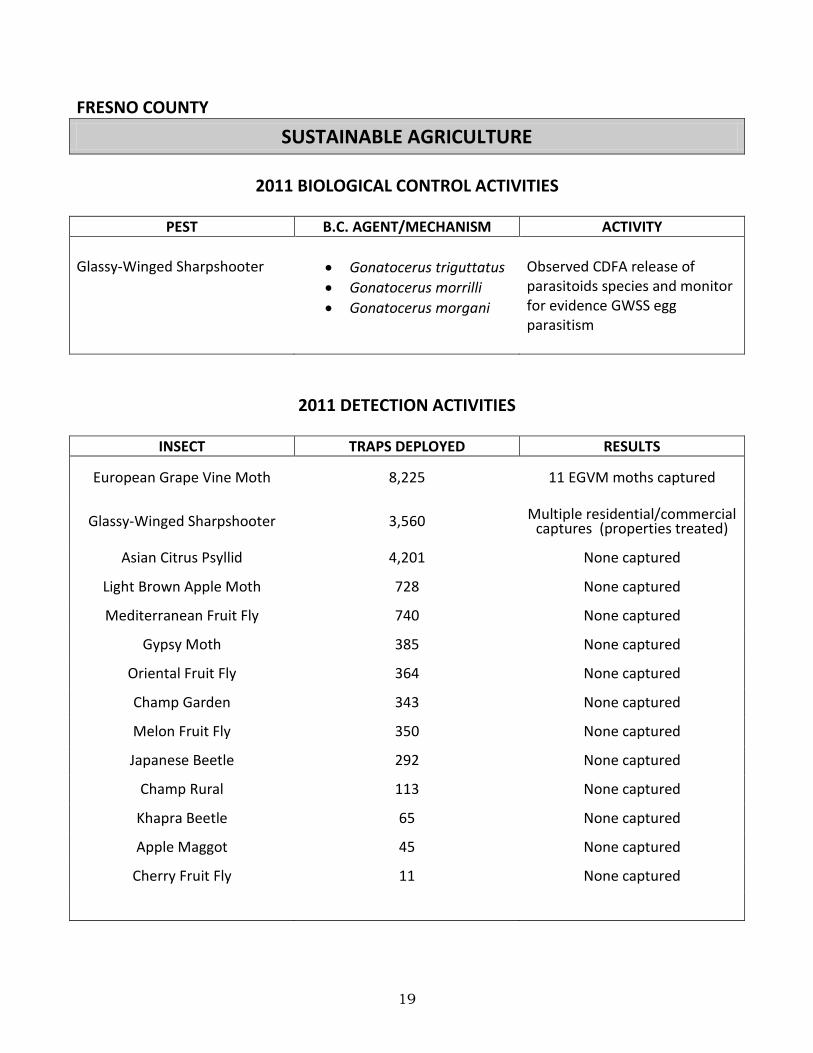
2011 BIOLOGICAL CONTROL ACTIVITIES
PEST B.C. AGENT/MECHANISM ACTIVITY
Glassy-Winged Sharpshooter
Gonatocerus triguttatus
Gonatocerus morrilli
Gonatocerus morgani
Observed CDFA release of parasitoids species and monitor for evidence GWSS egg parasitism
2011 DETECTION ACTIVITIES
INSECT TRAPS DEPLOYED RESULTS
European Grape Vine Moth
8,225
11 EGVM moths captured
Glassy-Winged Sharpshooter
3,560
Multiple residential/commercial captures (properties treated)
Asian Citrus Psyllid 4,201 None captured
Light Brown Apple Moth 728 None captured
Mediterranean Fruit Fly 740 None captured
Gypsy Moth 385 None captured
Oriental Fruit Fly 364 None captured
Champ Garden 343 None captured
Melon Fruit Fly 350 None captured
Japanese Beetle 292 None captured
Champ Rural 113 None captured
Khapra Beetle 65 None captured
Apple Maggot 45 None captured
Cherry Fruit Fly 11 None captured
20
FRESNO COUNTY
SUSTAINABLE AGRICULTURE (continued)
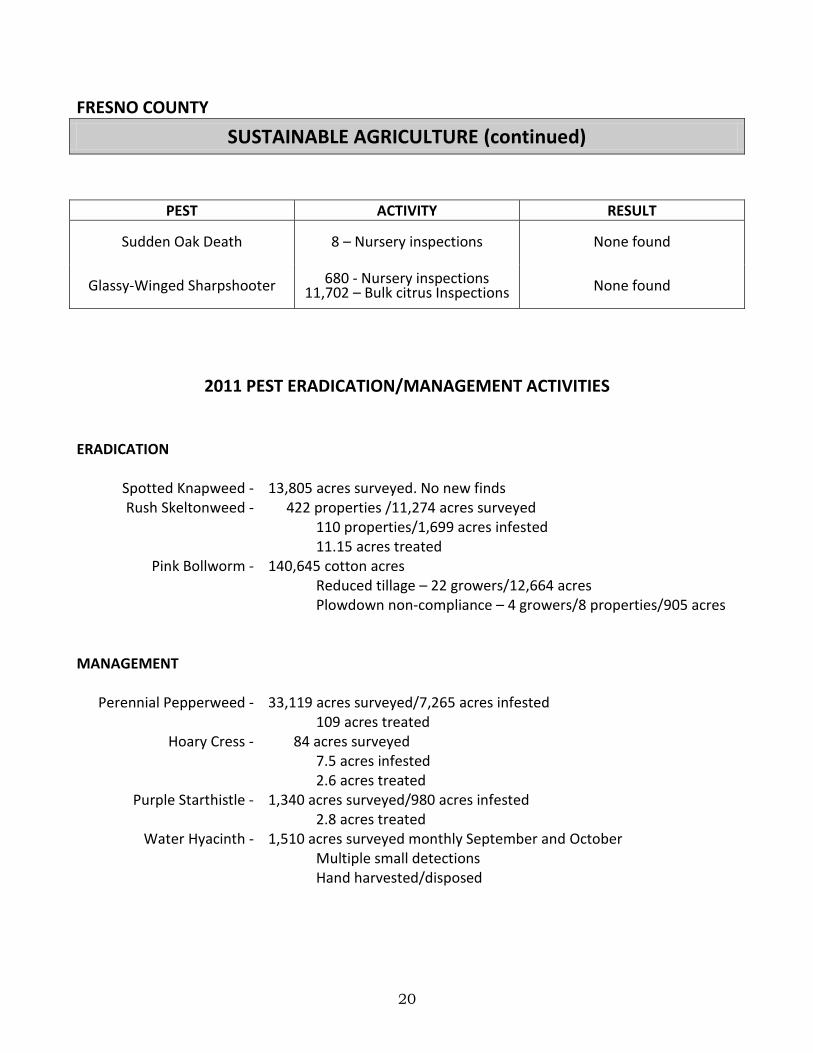
PEST ACTIVITY RESULT
Sudden Oak Death 8 – Nursery inspections None found
Glassy-Winged Sharpshooter 680 - Nursery inspections 11,702 – Bulk citrus Inspections None found
2011 PEST ERADICATION/MANAGEMENT ACTIVITIES
ERADICATION
Spotted Knapweed - 13,805 acres surveyed. No new finds
Rush Skeltonweed - 422 properties /11,274 acres surveyed 110 properties/1,699 acres infested 11.15 acres treated
Pink Bollworm - 140,645 cotton acres Reduced tillage – 22 growers/12,664 acres Plowdown non-compliance – 4 growers/8 properties/905 acres
MANAGEMENT
Perennial Pepperweed - 33,119 acres surveyed/7,265 acres infested 109 acres treated
Hoary Cress -
84 acres surveyed 7.5 acres infested 2.6 acres treated
Purple Starthistle -
1,340 acres surveyed/980 acres infested 2.8 acres treated
Water Hyacinth - 1,510 acres surveyed monthly September and October Multiple small detections Hand harvested/disposed
21
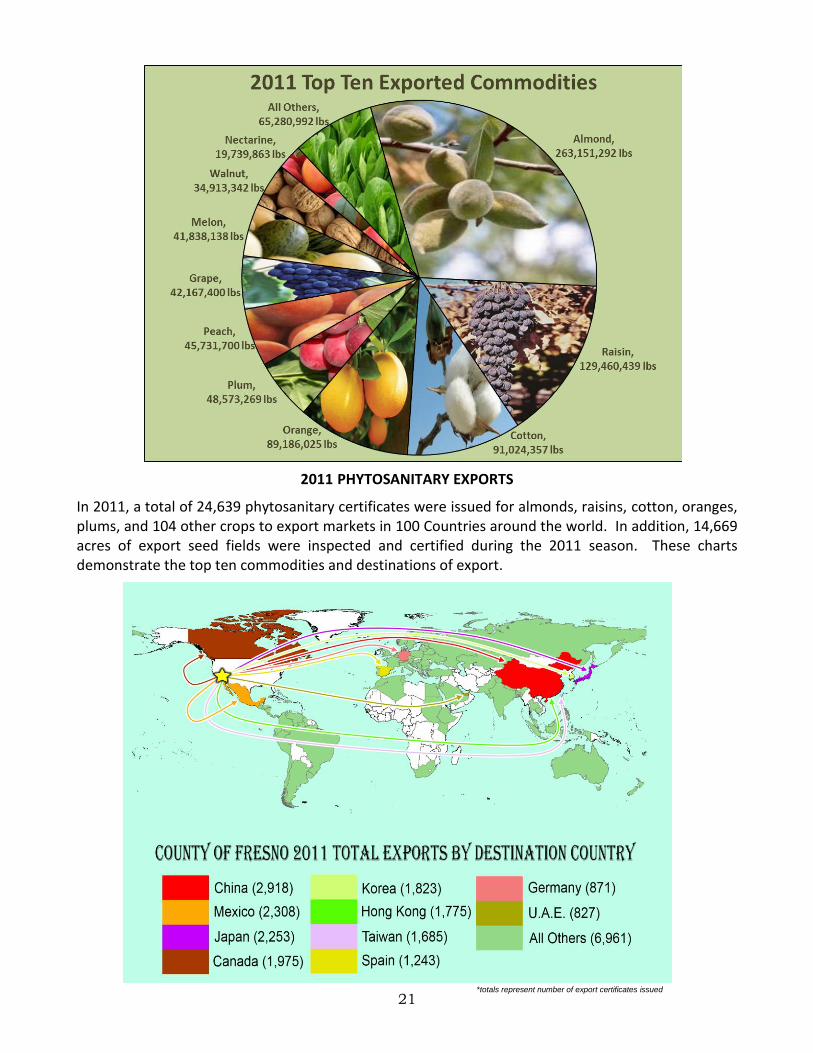
2011 PHYTOSANITARY EXPORTS
In 2011, a total of 24,639 phytosanitary certificates were issued for almonds, raisins, cotton, oranges, plums, and 104 other crops to export markets in 100 Countries around the world. In addition, 14,669 acres of export seed fields were inspected and certified during the 2011 season. These charts demonstrate the top ten commodities and destinations of export.
*totals represent number of export certificates issued
22
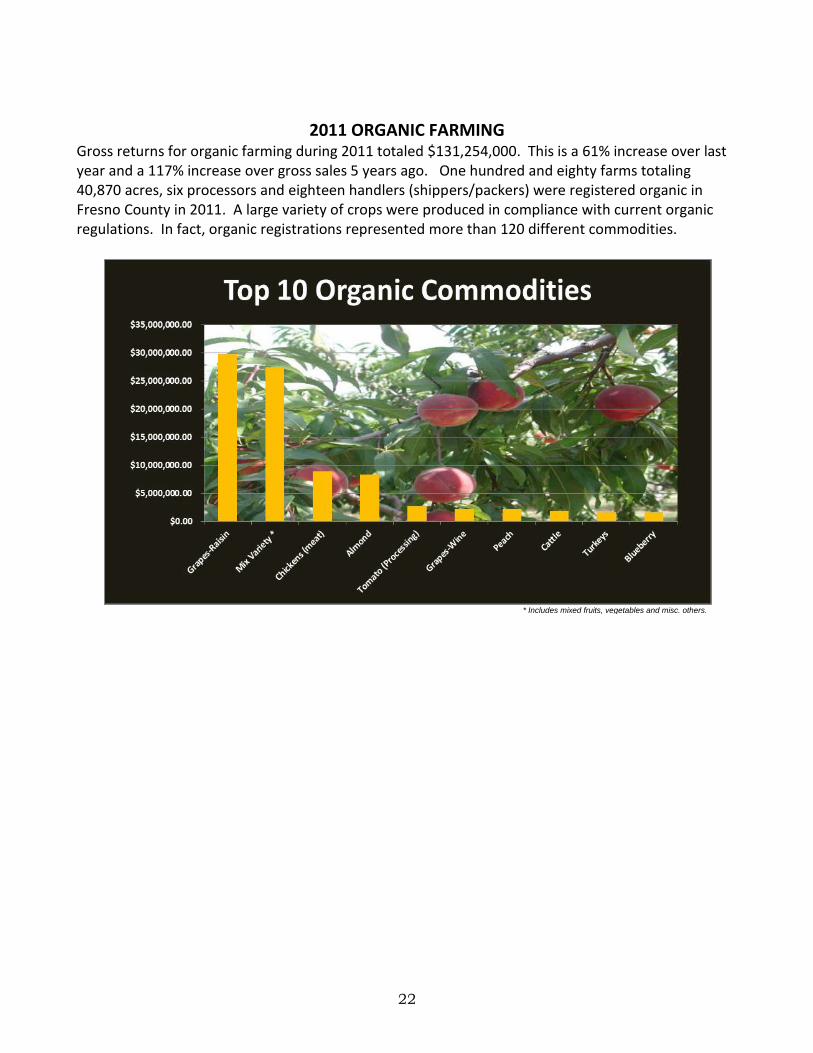
* Includes mixed fruits, vegetables and misc. others.
2011 ORGANIC FARMING
Gross returns for organic farming during 2011 totaled $131,254,000. This is a 61% increase over last year and a 117% increase over gross sales 5 years ago. One hundred and eighty farms totaling 40,870 acres, six processors and eighteen handlers (shippers/packers) were registered organic in Fresno County in 2011. A large variety of crops were produced in compliance with current organic regulations. In fact, organic registrations represented more than 120 different commodities.
23
24
25