Frequency-resolved noise figure measurements of...
12
Frequency-resolved noise figure measurements of phase (in)sensitive fiber optical parametric amplifiers R. Malik, 1 * A. Kumpera, 1 A. Lorences-Riesgo, 1 P. A. Andrekson, 1 and M. Karlsson 1 1 Fibre Optic Communication Research Centre (FORCE), Photonics Laboratory, Dept. of Microtechnology and Nanoscience, Chalmers University of Technology, Gothenburg 41296, Sweden * [email protected] Abstract: We measure the frequency-resolved noise figure of fiber optical parametric amplifiers both in phase-insensitive and phase-sensitive modes in the frequency range from 0.03 to 3 GHz. We also measure the variation in noise figure due to the degradation in pump optical signal to noise ratio and also as a function of the input signal powers. Noise figure degradation due to stimulated Brillouin scattering is observed. ©2014 Optical Society of America OCIS codes: (060.2320) Fiber optics amplifiers and oscillators; (190.4970) Parametric oscillators and amplifiers; (190.4380) Nonlinear optics, four-wave mixing. References and links 1. C. E. Shannon, “Communication in the presence of noise,” Proc. Inst. Radio Eng. 37(1), 10–21 (1949). 2. E. Desurvire, Erbium-Doped Fiber Amplifiers: Principles and Applications (John Wiley & Sons, 1994). 3. C. M. Caves, “Quantum limits on noise in linear amplifiers,” Phys. Rev. D Part. Fields 26(8), 1817–1839 (1982). 4. D. J. Lovering, J. A. Levenson, P. Vidakovic, J. Webjörn, and P. S. Russell, “Noiseless optical amplification in quasi-phase-matched bulk lithium niobate,” Opt. Lett. 21(18), 1439–1441 (1996). 5. B. J. Puttnam, D. Mazroa, S. Shinada, and N. Wada, “Phase-squeezing properties of non-degenerate PSAs using PPLN waveguides,” Opt. Express 19(26), B131–B139 (2011). 6. Z. Tong, C. Lundström, C. J. McKinstrie, P. A. Andrekson, M. Karlsson, and A. Bogris, “Ultralow noise broadband phase-sensitive optical amplifiers, and their applications,” IEEE J. Sel. Top. Quantum Electron. 18(2), 1016–1032 (2012). 7. R. Tang, P. S. Devgan, V. S. Grigoryan, P. Kumar, and M. Vasilyev, “In-line phase-sensitive amplification of multi-channel CW signals based on frequency nondegenerate four-wave-mixing in fiber,” Opt. Express 16(12), 9046–9053 (2008). 8. Z. Tong, C. Lundström, P. A. Andrekson, C. J. McKinstrie, M. Karlsson, D. J. Blessing, E. Tipsuwannakul, B. J. Puttnam, H. Toda, and L. Grüner-Nielsen, “Towards ultrasensitive optical links enabled by low-noise phase sensitive amplifiers,” Nat. Photonics 5(7), 430–436 (2011). 9. Z. Tong, A. O. J. Wiberg, E. Myslivets, B. P. P. Kuo, N. Alic, and S. Radic, “Broadband parametric multicasting via four-mode phase-sensitive interaction,” Opt. Express 20(17), 19363–19373 (2012). 10. J. Kakande, R. Slavík, F. Parmigiani, A. Bogris, D. Syvridis, L. Grüner-Nielsen, R. Phelan, P. Petropoulos, and D. J. Richardson, “Multilevel quantization of optical phase in a novel coherent parametric mixer architecture,” Nat. Photonics 5(12), 748–752 (2011). 11. D. M. Baney, P. Gallion, and R. S. Tucker, “Theory and measurement techniques for the noise figure of optical amplifiers,” Opt. Fiber Technol. 6(2), 122–154 (2000). 12. M. Movassaghi, M. K. Jackson, V. M. Smith, and W. J. Hallam, “Noise figure of erbium-doped fiber amplifiers in saturated operation,” J. Lightwave Technol. 16(5), 1461 (1998). 13. D. M. Baney and R. L. Jungerman, “Novel method for optical amplifier noise figure characterization using the electrical technique,” in Optical Amplifiers and Their Applications: From the Topical Meeting Optical Amplifiers and Their Applications 16, July 21–23 (1997). 14. Z. Tong, A. Bogris, M. Karlsson, and P. A. Andrekson, “Full characterization of the signal and idler noise figure spectra in single-pumped fiber optical parametric amplifiers,” Opt. Express 18(3), 2884–2893 (2010). 15. C. Lundström, R. Malik, L. Gruner-Nielsen, B. Corcoran, S. L. I. Olsson, M. Karlsson, and P. A. Andrekson, “Fiber optic parametric amplifier with 10-dB net gain without pump dithering,” Photon. Tech. Lett. 25(3), 234– 237 (2013). 16. Z. Tong, C. Lundström, M. Karlsson, M. Vasilyev, and P. A. Andrekson, “Noise performance of a frequency nondegenerate phase-sensitive amplifier with unequalized inputs,” Opt. Lett. 36(5), 722–724 (2011). 17. P. Kylemark, M. Karlsson, and P. A. Andrekson, “Gain and wavelength dependence of the noise figure in fiber optical parametric amplification,” Photon. Tech. Lett. 18(11), 1255–1257 (2006). #222759 - $15.00 USD Received 11 Sep 2014; revised 20 Oct 2014; accepted 24 Oct 2014; published 3 Nov 2014 (C) 2014 OSA 17 November 2014 | Vol. 22, No. 23 | DOI:10.1364/OE.22.027821 | OPTICS EXPRESS 27821
-
Upload
truongkhanh -
Category
Documents
-
view
236 -
download
3
Transcript of Frequency-resolved noise figure measurements of...

Frequency-resolved noise figure measurements of phase (in)sensitive fiber optical parametric
amplifiers R. Malik,1* A. Kumpera,1 A. Lorences-Riesgo,1 P. A. Andrekson,1 and M. Karlsson1 1Fibre Optic Communication Research Centre (FORCE), Photonics Laboratory, Dept. of Microtechnology and
Nanoscience, Chalmers University of Technology, Gothenburg 41296, Sweden *[email protected]
Abstract: We measure the frequency-resolved noise figure of fiber optical parametric amplifiers both in phase-insensitive and phase-sensitive modes in the frequency range from 0.03 to 3 GHz. We also measure the variation in noise figure due to the degradation in pump optical signal to noise ratio and also as a function of the input signal powers. Noise figure degradation due to stimulated Brillouin scattering is observed.
©2014 Optical Society of America
OCIS codes: (060.2320) Fiber optics amplifiers and oscillators; (190.4970) Parametric oscillators and amplifiers; (190.4380) Nonlinear optics, four-wave mixing.
References and links 1. C. E. Shannon, “Communication in the presence of noise,” Proc. Inst. Radio Eng. 37(1), 10–21 (1949). 2. E. Desurvire, Erbium-Doped Fiber Amplifiers: Principles and Applications (John Wiley & Sons, 1994). 3. C. M. Caves, “Quantum limits on noise in linear amplifiers,” Phys. Rev. D Part. Fields 26(8), 1817–1839 (1982). 4. D. J. Lovering, J. A. Levenson, P. Vidakovic, J. Webjörn, and P. S. Russell, “Noiseless optical amplification in
quasi-phase-matched bulk lithium niobate,” Opt. Lett. 21(18), 1439–1441 (1996). 5. B. J. Puttnam, D. Mazroa, S. Shinada, and N. Wada, “Phase-squeezing properties of non-degenerate PSAs using
PPLN waveguides,” Opt. Express 19(26), B131–B139 (2011). 6. Z. Tong, C. Lundström, C. J. McKinstrie, P. A. Andrekson, M. Karlsson, and A. Bogris, “Ultralow noise
broadband phase-sensitive optical amplifiers, and their applications,” IEEE J. Sel. Top. Quantum Electron. 18(2), 1016–1032 (2012).
7. R. Tang, P. S. Devgan, V. S. Grigoryan, P. Kumar, and M. Vasilyev, “In-line phase-sensitive amplification of multi-channel CW signals based on frequency nondegenerate four-wave-mixing in fiber,” Opt. Express 16(12), 9046–9053 (2008).
8. Z. Tong, C. Lundström, P. A. Andrekson, C. J. McKinstrie, M. Karlsson, D. J. Blessing, E. Tipsuwannakul, B. J. Puttnam, H. Toda, and L. Grüner-Nielsen, “Towards ultrasensitive optical links enabled by low-noise phase sensitive amplifiers,” Nat. Photonics 5(7), 430–436 (2011).
9. Z. Tong, A. O. J. Wiberg, E. Myslivets, B. P. P. Kuo, N. Alic, and S. Radic, “Broadband parametric multicasting via four-mode phase-sensitive interaction,” Opt. Express 20(17), 19363–19373 (2012).
10. J. Kakande, R. Slavík, F. Parmigiani, A. Bogris, D. Syvridis, L. Grüner-Nielsen, R. Phelan, P. Petropoulos, and D. J. Richardson, “Multilevel quantization of optical phase in a novel coherent parametric mixer architecture,” Nat. Photonics 5(12), 748–752 (2011).
11. D. M. Baney, P. Gallion, and R. S. Tucker, “Theory and measurement techniques for the noise figure of optical amplifiers,” Opt. Fiber Technol. 6(2), 122–154 (2000).
12. M. Movassaghi, M. K. Jackson, V. M. Smith, and W. J. Hallam, “Noise figure of erbium-doped fiber amplifiers in saturated operation,” J. Lightwave Technol. 16(5), 1461 (1998).
13. D. M. Baney and R. L. Jungerman, “Novel method for optical amplifier noise figure characterization using the electrical technique,” in Optical Amplifiers and Their Applications: From the Topical Meeting Optical Amplifiers and Their Applications 16, July 21–23 (1997).
14. Z. Tong, A. Bogris, M. Karlsson, and P. A. Andrekson, “Full characterization of the signal and idler noise figure spectra in single-pumped fiber optical parametric amplifiers,” Opt. Express 18(3), 2884–2893 (2010).
15. C. Lundström, R. Malik, L. Gruner-Nielsen, B. Corcoran, S. L. I. Olsson, M. Karlsson, and P. A. Andrekson, “Fiber optic parametric amplifier with 10-dB net gain without pump dithering,” Photon. Tech. Lett. 25(3), 234–237 (2013).
16. Z. Tong, C. Lundström, M. Karlsson, M. Vasilyev, and P. A. Andrekson, “Noise performance of a frequency nondegenerate phase-sensitive amplifier with unequalized inputs,” Opt. Lett. 36(5), 722–724 (2011).
17. P. Kylemark, M. Karlsson, and P. A. Andrekson, “Gain and wavelength dependence of the noise figure in fiber optical parametric amplification,” Photon. Tech. Lett. 18(11), 1255–1257 (2006).
#222759 - $15.00 USD Received 11 Sep 2014; revised 20 Oct 2014; accepted 24 Oct 2014; published 3 Nov 2014(C) 2014 OSA 17 November 2014 | Vol. 22, No. 23 | DOI:10.1364/OE.22.027821 | OPTICS EXPRESS 27821
18. Z. Tong, A. Bogris, C. Lundström, C. J. McKinstrie, M. Vasilyev, M. Karlsson, and P. A. Andrekson, “Modeling and measurement of the noise figure of a cascaded non-degenerate phase-sensitive parametric amplifier,” Opt. Express 18(14), 14820–14835 (2010).
19. B. Corcoran, S. L. I. Olsson, C. Lundström, M. Karlsson, and P. Andrekson, “Phase-sensitive optical pre-amplifier implemented in an 80km DQPSK link,” In Optical Fiber Communication Conference, pp. PDP5A Optical Society of America, (2012).
20. A. Takada and W. Imajuku, “In-line optical phase-sensitive amplifier employing pump laser injection locked to input signal light,” Electron. Lett. 34(3), 274–276 (1998).
21. S. L. Olsson, B. Corcoran, C. Lundström, E. Tipsuwannakul, S. Sygletos, A. D. Ellis, Z. Tong, M. Karlsson, and P. Andrekson, “Optical injection-locking-based pump recovery for phase-sensitively amplified links,” In Optical Fiber Communication Conference, pp. OW3C. Optical Society of America, (2012).
22. R. Malik, S. Olsson, P. A. Andrekson, C. Lundström, and M. Karlsson, “Record-high sensitivity receiver using phase sensitive fiber optical parametric amplification,” in Optical Fiber Communication Conference, pp. Th2A–54. Optical Society of America, (2014).
1. Introduction
Noise figure (NF) of an optical amplifier is a critical parameter. Optical amplifiers with low NF are highly sought after components in an optical communication link [1]. All commercially available optical amplifiers such as Erbium-doped fiber amplifiers (EDFAs), semiconductor amplifiers, Raman amplifiers etc., however, cannot provide NF below 3dB under high gain regime, a limit set by quantum mechanics [2]. To break this barrier of 3-dB NF a lot of research effort has been placed on the so-called phase-sensitive amplifiers (PSAs). PSAs can ideally provide a 0 dB NF implying no degradation of signal to noise ratio (SNR) of the signal [3]. In order to operate optical amplifier in phase sensitive mode all of its input waves should be phase and frequency locked to each other. PSAs have been realized both in second-order (χ2) and third-order (χ3) nonlinear media [4–6]. Generally, in χ3 media, PSAs can be constructed by cascading two fiber optical parametric amplifiers (FOPAs) [7]. Such a scheme is known as copier-PSA scheme, where the first FOPA creates phase-and frequency-locked waves and second FOPA then performs as a PSA. Using such architecture a record-low NF of 1.1 dB was reported [8]. However, this architecture requires a lumped loss between copier and PSA as the noise from copier is correlated due to phase dependent nature of the parametric gain. In this study we use an optical frequency comb (OFC) to provide phase-locked and frequency-locked waves. Such architectures have previously been studied for signal multicasting and for all-optical signal processing [9, 10].
Techniques for measuring NF both in optical and electrical domain exist, however measurements in electrical domain offers more complete evaluation of the optical amplifier noise [11]. Spectrally resolved NF measurements in the electrical domain were performed with EDFAs in late 90s [12, 13], however no such study has been done with FOPAs thus far. Recently NF study on FOPA was reported but it was carried out for one electrical frequency [14]. Such studies with FOPAs are important as noise sources due to the pump transferred noise (PTN), stimulated Brillouin scattering (SBS), etc. can only be detected in the electrical domain. Frequency-resolved NF measurements in the electrical domain are generally hindered by phase modulation of the pump that is in general necessary to suppress SBS. The phase modulation of the pump transfers onto the signal as an amplitude modulation in FOPA, more severely in a PSA.
In this study we use strained highly nonlinear fibers (HNLFs) to suppress SBS [15] and work without the need for phase modulation on the pump, and we report, for the first time, frequency-resolved NF measurements for FOPA both in phase-insensitive (PI) and phase-sensitive (PS) modes. We also present the impact of critical parameters such as pump power, pump OSNR, and signal input power on the NF. The results show that in order to get a low NF for wide range of signal input powers, a pump OSNR better than 55 dB is required. The results also show that the effect of SBS is significant at low frequencies.
#222759 - $15.00 USD Received 11 Sep 2014; revised 20 Oct 2014; accepted 24 Oct 2014; published 3 Nov 2014(C) 2014 OSA 17 November 2014 | Vol. 22, No. 23 | DOI:10.1364/OE.22.027821 | OPTICS EXPRESS 27822
2. Experimental measurements
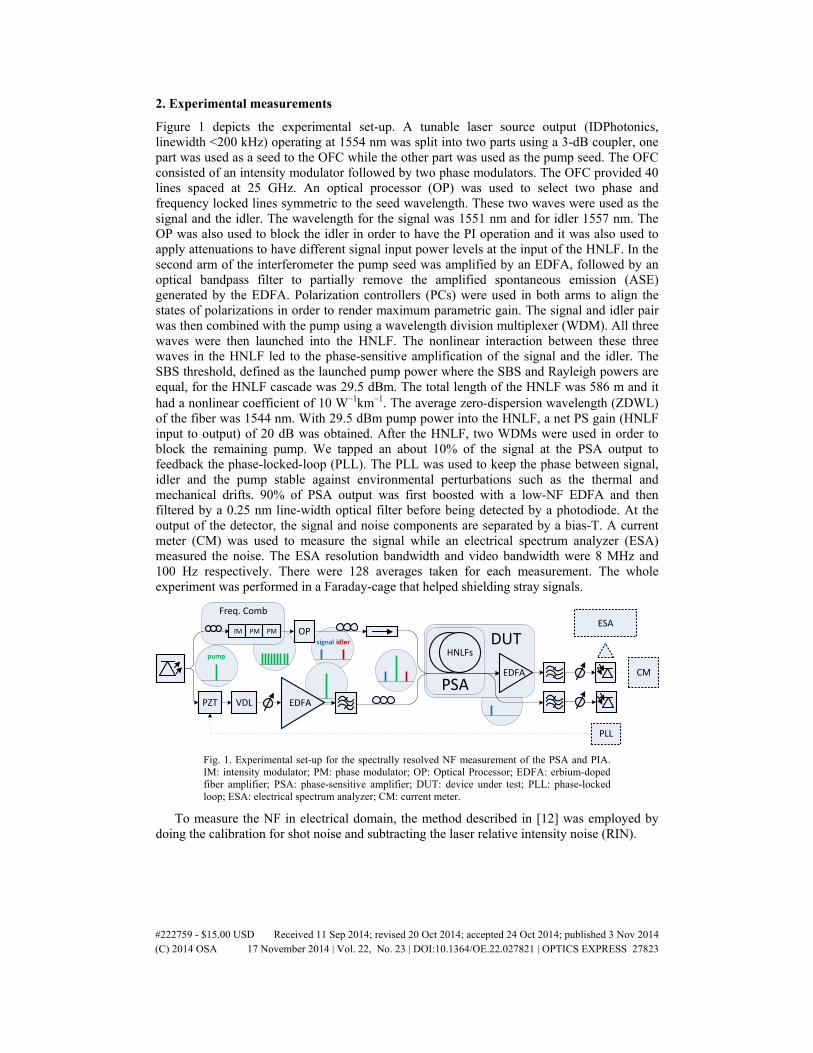
Figure 1 depicts the experimental set-up. A tunable laser source output (IDPhotonics, linewidth <200 kHz) operating at 1554 nm was split into two parts using a 3-dB coupler, one part was used as a seed to the OFC while the other part was used as the pump seed. The OFC consisted of an intensity modulator followed by two phase modulators. The OFC provided 40 lines spaced at 25 GHz. An optical processor (OP) was used to select two phase and frequency locked lines symmetric to the seed wavelength. These two waves were used as the signal and the idler. The wavelength for the signal was 1551 nm and for idler 1557 nm. The OP was also used to block the idler in order to have the PI operation and it was also used to apply attenuations to have different signal input power levels at the input of the HNLF. In the second arm of the interferometer the pump seed was amplified by an EDFA, followed by an optical bandpass filter to partially remove the amplified spontaneous emission (ASE) generated by the EDFA. Polarization controllers (PCs) were used in both arms to align the states of polarizations in order to render maximum parametric gain. The signal and idler pair was then combined with the pump using a wavelength division multiplexer (WDM). All three waves were then launched into the HNLF. The nonlinear interaction between these three waves in the HNLF led to the phase-sensitive amplification of the signal and the idler. The SBS threshold, defined as the launched pump power where the SBS and Rayleigh powers are equal, for the HNLF cascade was 29.5 dBm. The total length of the HNLF was 586 m and it had a nonlinear coefficient of 10 W−1km−1. The average zero-dispersion wavelength (ZDWL) of the fiber was 1544 nm. With 29.5 dBm pump power into the HNLF, a net PS gain (HNLF input to output) of 20 dB was obtained. After the HNLF, two WDMs were used in order to block the remaining pump. We tapped an about 10% of the signal at the PSA output to feedback the phase-locked-loop (PLL). The PLL was used to keep the phase between signal, idler and the pump stable against environmental perturbations such as the thermal and mechanical drifts. 90% of PSA output was first boosted with a low-NF EDFA and then filtered by a 0.25 nm line-width optical filter before being detected by a photodiode. At the output of the detector, the signal and noise components are separated by a bias-T. A current meter (CM) was used to measure the signal while an electrical spectrum analyzer (ESA) measured the noise. The ESA resolution bandwidth and video bandwidth were 8 MHz and 100 Hz respectively. There were 128 averages taken for each measurement. The whole experiment was performed in a Faraday-cage that helped shielding stray signals.
signal idler
pump
OP
PZT VDL
HNLFs
EDFA
IM PM PM
EDFA
ESA
CM
PLL
PSA
Freq. Comb
DUT
Fig. 1. Experimental set-up for the spectrally resolved NF measurement of the PSA and PIA. IM: intensity modulator; PM: phase modulator; OP: Optical Processor; EDFA: erbium-doped fiber amplifier; PSA: phase-sensitive amplifier; DUT: device under test; PLL: phase-locked loop; ESA: electrical spectrum analyzer; CM: current meter.
To measure the NF in electrical domain, the method described in [12] was employed by doing the calibration for shot noise and subtracting the laser relative intensity noise (RIN).
#222759 - $15.00 USD Received 11 Sep 2014; revised 20 Oct 2014; accepted 24 Oct 2014; published 3 Nov 2014(C) 2014 OSA 17 November 2014 | Vol. 22, No. 23 | DOI:10.1364/OE.22.027821 | OPTICS EXPRESS 27823
2.1 Frequency-resolved noise-figure measurements
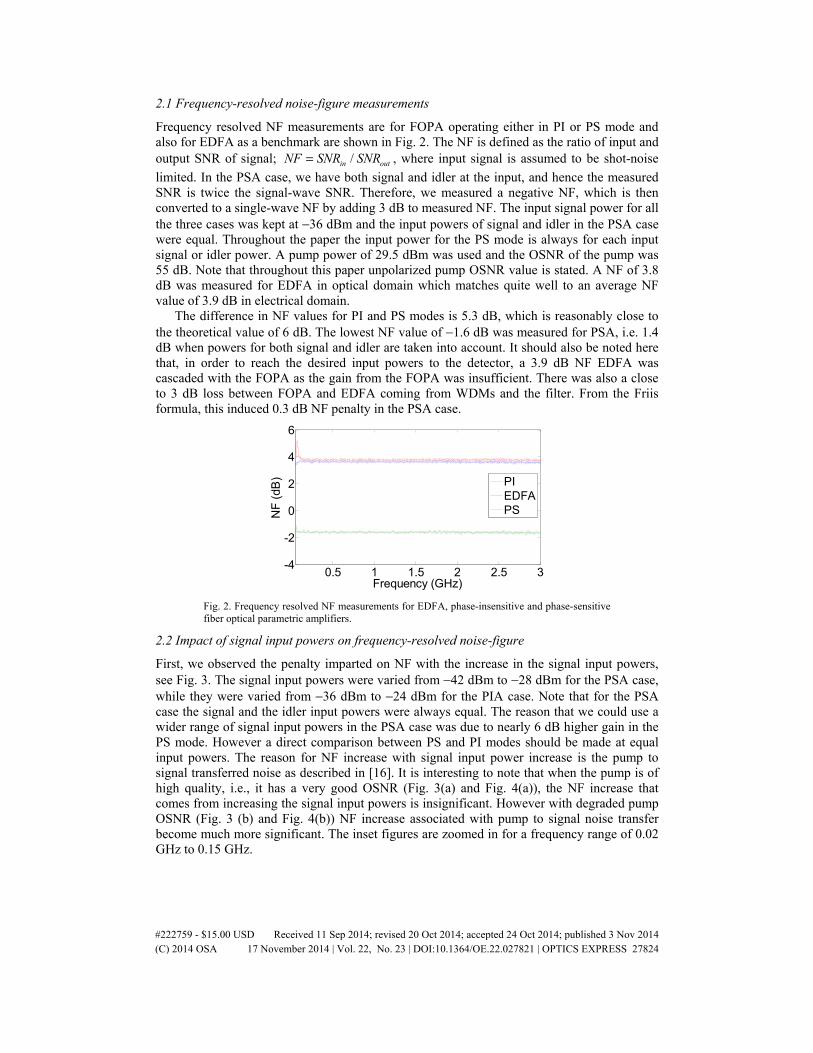
Frequency resolved NF measurements are for FOPA operating either in PI or PS mode and also for EDFA as a benchmark are shown in Fig. 2. The NF is defined as the ratio of input and output SNR of signal; /in outNF SNR SNR= , where input signal is assumed to be shot-noise
limited. In the PSA case, we have both signal and idler at the input, and hence the measured SNR is twice the signal-wave SNR. Therefore, we measured a negative NF, which is then converted to a single-wave NF by adding 3 dB to measured NF. The input signal power for all the three cases was kept at −36 dBm and the input powers of signal and idler in the PSA case were equal. Throughout the paper the input power for the PS mode is always for each input signal or idler power. A pump power of 29.5 dBm was used and the OSNR of the pump was 55 dB. Note that throughout this paper unpolarized pump OSNR value is stated. A NF of 3.8 dB was measured for EDFA in optical domain which matches quite well to an average NF value of 3.9 dB in electrical domain.
The difference in NF values for PI and PS modes is 5.3 dB, which is reasonably close to the theoretical value of 6 dB. The lowest NF value of −1.6 dB was measured for PSA, i.e. 1.4 dB when powers for both signal and idler are taken into account. It should also be noted here that, in order to reach the desired input powers to the detector, a 3.9 dB NF EDFA was cascaded with the FOPA as the gain from the FOPA was insufficient. There was also a close to 3 dB loss between FOPA and EDFA coming from WDMs and the filter. From the Friis formula, this induced 0.3 dB NF penalty in the PSA case.
0.5 1 1.5 2 2.5 3-4
-2
0
2
4
6
Frequency (GHz)
NF
(dB
)
PIEDFAPS
Fig. 2. Frequency resolved NF measurements for EDFA, phase-insensitive and phase-sensitive fiber optical parametric amplifiers.
2.2 Impact of signal input powers on frequency-resolved noise-figure
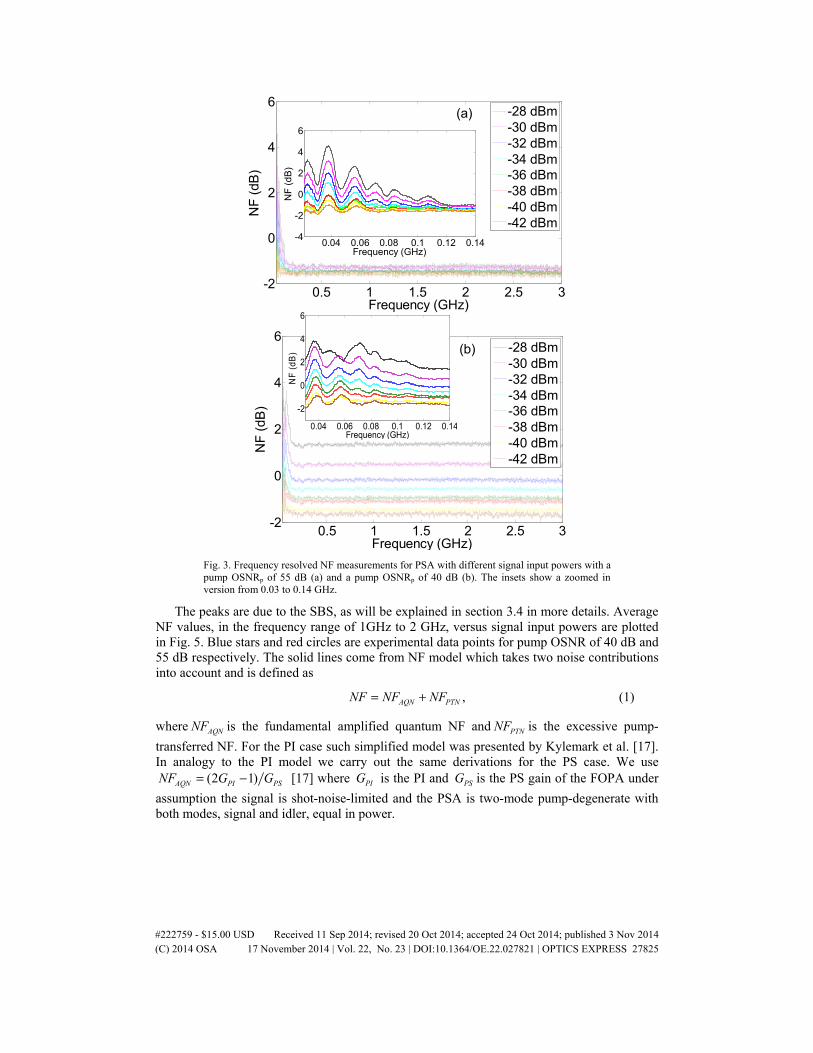
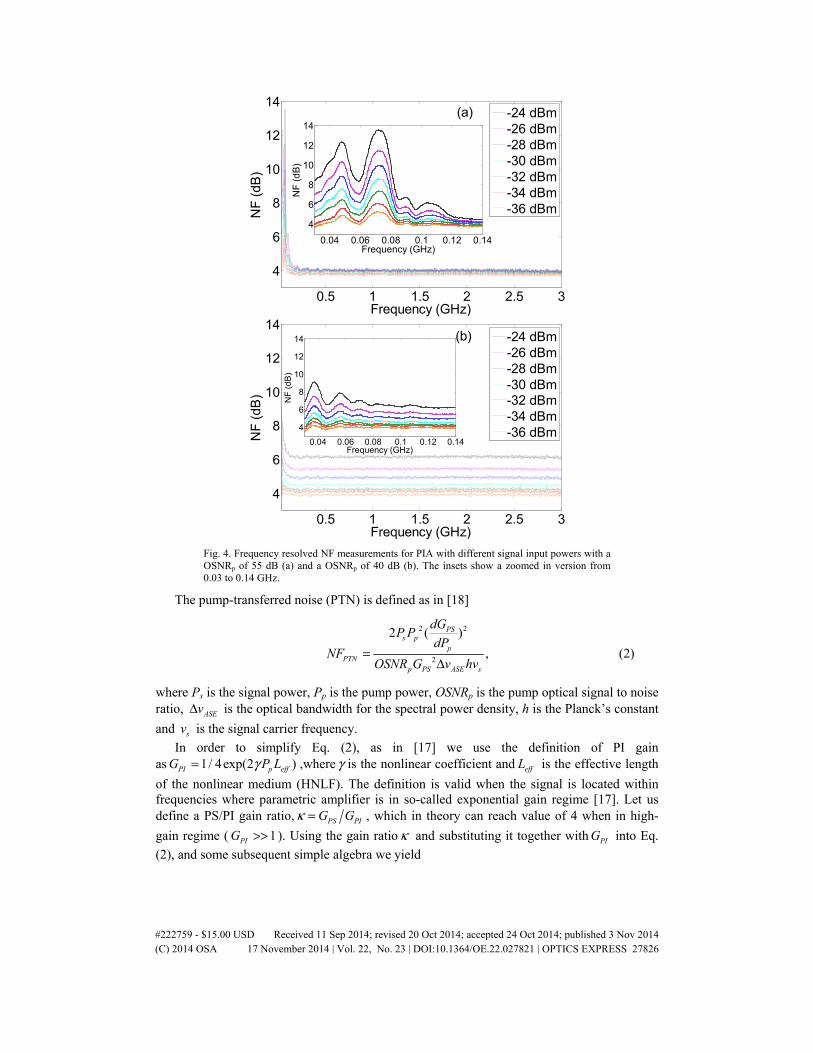
First, we observed the penalty imparted on NF with the increase in the signal input powers, see Fig. 3. The signal input powers were varied from −42 dBm to −28 dBm for the PSA case, while they were varied from −36 dBm to −24 dBm for the PIA case. Note that for the PSA case the signal and the idler input powers were always equal. The reason that we could use a wider range of signal input powers in the PSA case was due to nearly 6 dB higher gain in the PS mode. However a direct comparison between PS and PI modes should be made at equal input powers. The reason for NF increase with signal input power increase is the pump to signal transferred noise as described in [16]. It is interesting to note that when the pump is of high quality, i.e., it has a very good OSNR (Fig. 3(a) and Fig. 4(a)), the NF increase that comes from increasing the signal input powers is insignificant. However with degraded pump OSNR (Fig. 3 (b) and Fig. 4(b)) NF increase associated with pump to signal noise transfer become much more significant. The inset figures are zoomed in for a frequency range of 0.02 GHz to 0.15 GHz.
#222759 - $15.00 USD Received 11 Sep 2014; revised 20 Oct 2014; accepted 24 Oct 2014; published 3 Nov 2014(C) 2014 OSA 17 November 2014 | Vol. 22, No. 23 | DOI:10.1364/OE.22.027821 | OPTICS EXPRESS 27824
0.5 1 1.5 2 2.5 3-2
0
2
4
6
NF
(dB
)
Frequency (GHz)
-28 dBm-30 dBm-32 dBm-34 dBm-36 dBm-38 dBm-40 dBm-42 dBm
(a)
0.04 0.06 0.08 0.1 0.12 0.14-4
-2
0
2
4
6
NF
(dB
)
Frequency (GHz)
0.5 1 1.5 2 2.5 3-2
0
2
4
6
Frequency (GHz)
NF
(dB
)
-28 dBm-30 dBm-32 dBm-34 dBm-36 dBm-38 dBm-40 dBm-42 dBm
(b)
0.04 0.06 0.08 0.1 0.12 0.14
-2
0
2
4
6
Frequency (GHz)
NF
(dB
)
Fig. 3. Frequency resolved NF measurements for PSA with different signal input powers with a pump OSNRp of 55 dB (a) and a pump OSNRp of 40 dB (b). The insets show a zoomed in version from 0.03 to 0.14 GHz.
The peaks are due to the SBS, as will be explained in section 3.4 in more details. Average NF values, in the frequency range of 1GHz to 2 GHz, versus signal input powers are plotted in Fig. 5. Blue stars and red circles are experimental data points for pump OSNR of 40 dB and 55 dB respectively. The solid lines come from NF model which takes two noise contributions into account and is defined as
,AQN PTNNF NF NF= + (1)
where AQNNF is the fundamental amplified quantum NF and PTNNF is the excessive pump-
transferred NF. For the PI case such simplified model was presented by Kylemark et al. [17]. In analogy to the PI model we carry out the same derivations for the PS case. We use
(2 1)AQN PI PSNF G G= − [17] where PIG is the PI and PSG is the PS gain of the FOPA under
assumption the signal is shot-noise-limited and the PSA is two-mode pump-degenerate with both modes, signal and idler, equal in power.
#222759 - $15.00 USD Received 11 Sep 2014; revised 20 Oct 2014; accepted 24 Oct 2014; published 3 Nov 2014(C) 2014 OSA 17 November 2014 | Vol. 22, No. 23 | DOI:10.1364/OE.22.027821 | OPTICS EXPRESS 27825
0.5 1 1.5 2 2.5 3
4
6
8
10
12
14
Frequency (GHz)
NF
(dB
)
-24 dBm-26 dBm-28 dBm-30 dBm-32 dBm-34 dBm-36 dBm
(a)
0.04 0.06 0.08 0.1 0.12 0.144
6
8
10
12
14
Frequency (GHz)
NF
(dB)
0.5 1 1.5 2 2.5 3
4
6
8
10
12
14
Frequency (GHz)
NF
(dB
)
-24 dBm-26 dBm-28 dBm-30 dBm-32 dBm-34 dBm-36 dBm
(b)
0.04 0.06 0.08 0.1 0.12 0.14
4
6
8
10
12
14
Frequency (GHz)
NF
(dB)
Fig. 4. Frequency resolved NF measurements for PIA with different signal input powers with a OSNRp of 55 dB (a) and a OSNRp of 40 dB (b). The insets show a zoomed in version from 0.03 to 0.14 GHz.
The pump-transferred noise (PTN) is defined as in [18]
2 2
2
2 ( )
,
PSs p
pPTN
p PS ASE s
dGP P
dPNF
OSNR G v hv=
Δ (2)
where Ps is the signal power, Pp is the pump power, OSNRp is the pump optical signal to noise ratio, ASEvΔ is the optical bandwidth for the spectral power density, h is the Planck’s constant
and sv is the signal carrier frequency.
In order to simplify Eq. (2), as in [17] we use the definition of PI gain as 1/ 4exp(2 )PI p effG P Lγ= ,where γ is the nonlinear coefficient and effL is the effective length
of the nonlinear medium (HNLF). The definition is valid when the signal is located within frequencies where parametric amplifier is in so-called exponential gain regime [17]. Let us define a PS/PI gain ratio, PS PIG Gκ = , which in theory can reach value of 4 when in high-
gain regime ( 1PIG >> ). Using the gain ratioκ and substituting it together with PIG into Eq.
(2), and some subsequent simple algebra we yield
#222759 - $15.00 USD Received 11 Sep 2014; revised 20 Oct 2014; accepted 24 Oct 2014; published 3 Nov 2014(C) 2014 OSA 17 November 2014 | Vol. 22, No. 23 | DOI:10.1364/OE.22.027821 | OPTICS EXPRESS 27826
-42 -40 -38 -36 -34 -32 -30 -28-3
-2
-1
0
1
2
Signal input powers (dBm)
Spe
ctra
lly a
vera
ged
NF
(dB)
55 dB40 dB
PSA
-36 -34 -32 -30 -28 -26 -243
4
5
6
7
Signal input powers (dBm)
Spe
ctra
lly a
vera
ged
NF
(dB)
55 dB40 dB
PIA
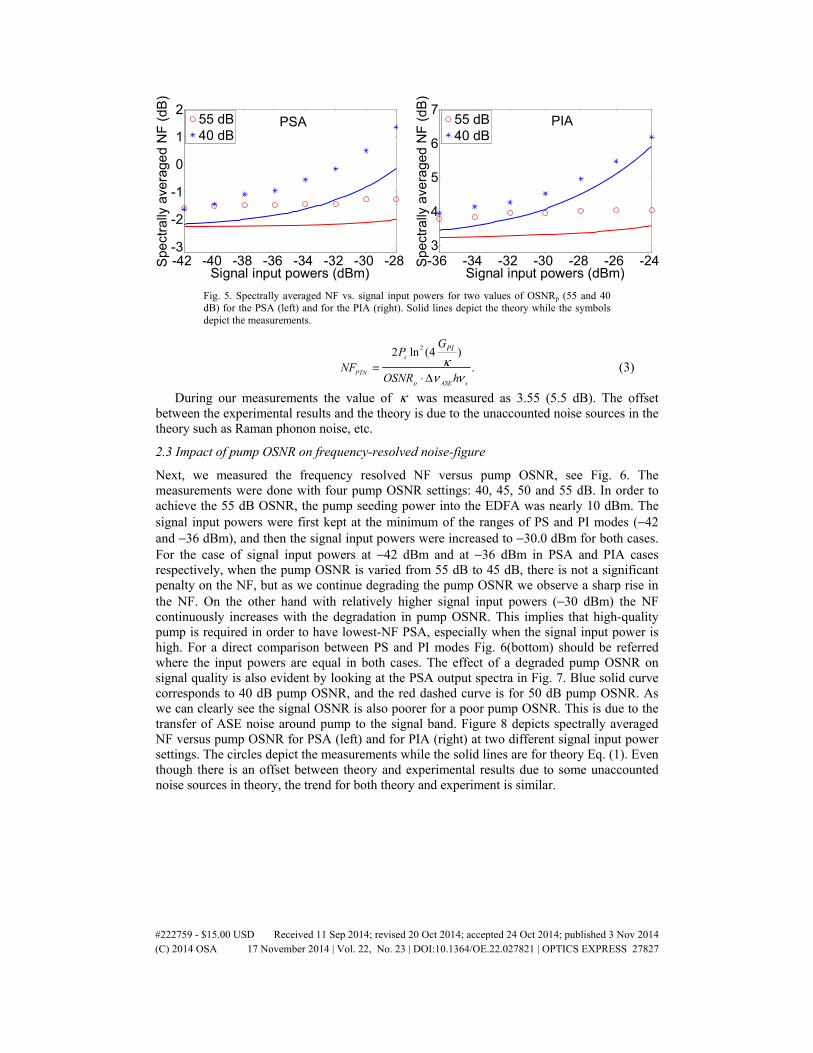
Fig. 5. Spectrally averaged NF vs. signal input powers for two values of OSNRp (55 and 40 dB) for the PSA (left) and for the PIA (right). Solid lines depict the theory while the symbols depict the measurements.
22 l 4(n ).
s
PTN
p ASE s
PIGP
NFOSNR h
κν ν
=⋅ Δ
(3)
During our measurements the value of κ was measured as 3.55 (5.5 dB). The offset between the experimental results and the theory is due to the unaccounted noise sources in the theory such as Raman phonon noise, etc.
2.3 Impact of pump OSNR on frequency-resolved noise-figure
Next, we measured the frequency resolved NF versus pump OSNR, see Fig. 6. The measurements were done with four pump OSNR settings: 40, 45, 50 and 55 dB. In order to achieve the 55 dB OSNR, the pump seeding power into the EDFA was nearly 10 dBm. The signal input powers were first kept at the minimum of the ranges of PS and PI modes (−42 and −36 dBm), and then the signal input powers were increased to −30.0 dBm for both cases. For the case of signal input powers at −42 dBm and at −36 dBm in PSA and PIA cases respectively, when the pump OSNR is varied from 55 dB to 45 dB, there is not a significant penalty on the NF, but as we continue degrading the pump OSNR we observe a sharp rise in the NF. On the other hand with relatively higher signal input powers (−30 dBm) the NF continuously increases with the degradation in pump OSNR. This implies that high-quality pump is required in order to have lowest-NF PSA, especially when the signal input power is high. For a direct comparison between PS and PI modes Fig. 6(bottom) should be referred where the input powers are equal in both cases. The effect of a degraded pump OSNR on signal quality is also evident by looking at the PSA output spectra in Fig. 7. Blue solid curve corresponds to 40 dB pump OSNR, and the red dashed curve is for 50 dB pump OSNR. As we can clearly see the signal OSNR is also poorer for a poor pump OSNR. This is due to the transfer of ASE noise around pump to the signal band. Figure 8 depicts spectrally averaged NF versus pump OSNR for PSA (left) and for PIA (right) at two different signal input power settings. The circles depict the measurements while the solid lines are for theory Eq. (1). Even though there is an offset between theory and experimental results due to some unaccounted noise sources in theory, the trend for both theory and experiment is similar.
#222759 - $15.00 USD Received 11 Sep 2014; revised 20 Oct 2014; accepted 24 Oct 2014; published 3 Nov 2014(C) 2014 OSA 17 November 2014 | Vol. 22, No. 23 | DOI:10.1364/OE.22.027821 | OPTICS EXPRESS 27827

0.5 1 1.5 2 2.5 3-4
-2
0
2
4
6
Frequency (GHz)
NF
(dB
)
40 dB45 dB50 dB55 dB
PIA
PSA Ps = -42.0 dBm
Ps = -36.0 dBm
0.5 1 1.5 2 2.5 3-4
-2
0
2
4
6
8
10
Frequency (GHz)
NF
(dB
)
40 dB45 dB50 dB55 dB
Ps = -30 dBm
PIA
PSA
Fig. 6. Frequency-resolved NF for OSNRp = 40, 45, 50, and 55 dB at different signal input power settings. The top figure is for −36 dBm, and −42 dBm signal input powers for PIA and PSA case respectively, while the bottom figure for −30.0 dBm signal input power for both PS and PI modes.
1550 1552 1554 1556 1558-70
-60
-50
-40
-30
-20
-10
0
10
Wavelength (nm)
Rel
ativ
e sp
ectra
pow
er (a
.u.)
40 dB50 dB
Fig. 7. PS FOPA output spectra for 40 dB (blue solid curve), and 50 dB (red dashed curve) OSNRp.
#222759 - $15.00 USD Received 11 Sep 2014; revised 20 Oct 2014; accepted 24 Oct 2014; published 3 Nov 2014(C) 2014 OSA 17 November 2014 | Vol. 22, No. 23 | DOI:10.1364/OE.22.027821 | OPTICS EXPRESS 27828
40 45 50 553
4
5
6
7
Pump OSNRp (dB)Spec
trally
ave
rage
d N
F (d
B)
Ps = -30 Ps = -36
PIA
40 45 50 55
-2
0
2
4
6
Pump OSNRp (dB)Spec
trally
ave
rage
d N
F (d
B)
Ps =-30 Ps =-42
PSA
Fig. 8. Spectrally averaged NF vs. OSNRp for two values of Ps. Solid lines depict the theory while the symbols depict the measurements. Left figure depicts the PSA case while the right one depicts the PIA case.
2.4 Impact of SBS on frequency-resolved noise-figure
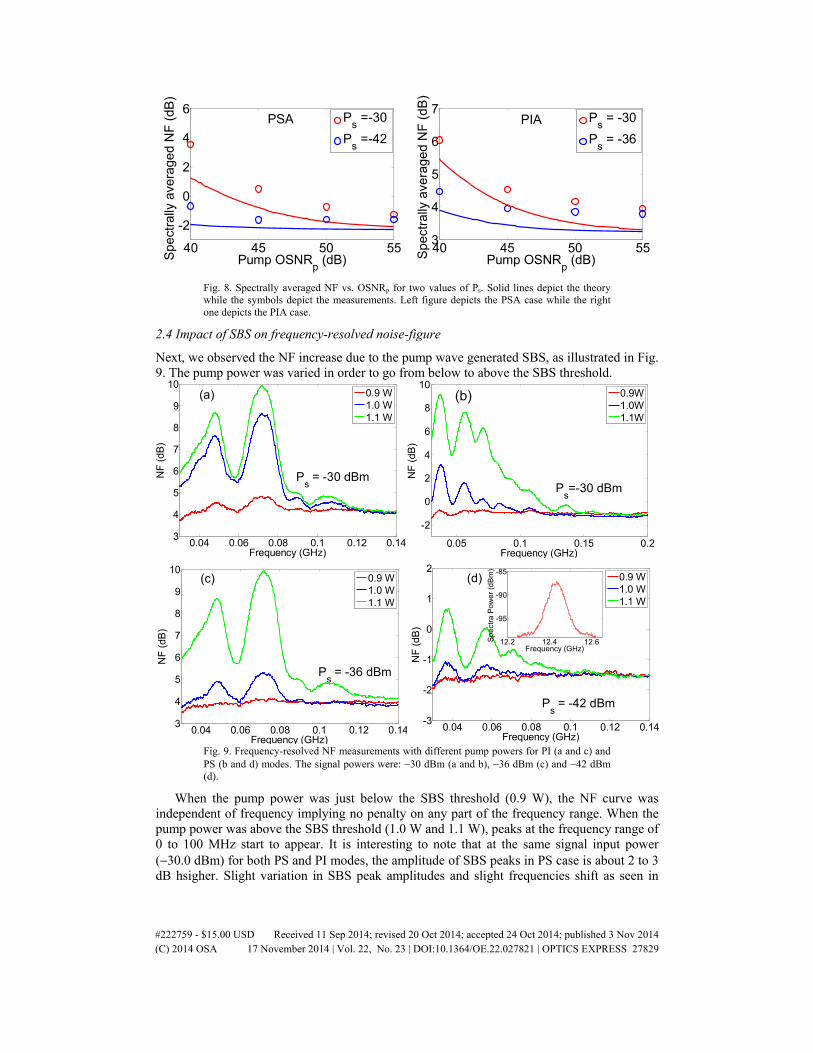
Next, we observed the NF increase due to the pump wave generated SBS, as illustrated in Fig. 9. The pump power was varied in order to go from below to above the SBS threshold.
0.05 0.1 0.15 0.2
-2
0
2
4
6
8
10
Frequency (GHz)
NF
(dB
)
0.9W1.0W1.1W
(b)
Ps=-30 dBm
0.04 0.06 0.08 0.1 0.12 0.143
4
5
6
7
8
9
10
Frequency (GHz)
NF
(dB
)
0.9 W1.0 W1.1 W
(a)
Ps = -30 dBm
0.04 0.06 0.08 0.1 0.12 0.143
4
5
6
7
8
9
10
NF
(dB
)
Frequency (GHz)
0.9 W1.0 W1.1 W
Ps = -36 dBm
(c)
0.04 0.06 0.08 0.1 0.12 0.14-3
-2
-1
0
1
2
Frequency (GHz)
NF
(dB
)
0.9 W1.0 W1.1 W
Ps = -42 dBm
(d)
12.2 12.4 12.6
-95
-90
-85
Frequency (GHz)
Spe
ctra
Pow
er (d
Bm
)
Fig. 9. Frequency-resolved NF measurements with different pump powers for PI (a and c) and PS (b and d) modes. The signal powers were: −30 dBm (a and b), −36 dBm (c) and −42 dBm (d).
When the pump power was just below the SBS threshold (0.9 W), the NF curve was independent of frequency implying no penalty on any part of the frequency range. When the pump power was above the SBS threshold (1.0 W and 1.1 W), peaks at the frequency range of 0 to 100 MHz start to appear. It is interesting to note that at the same signal input power (−30.0 dBm) for both PS and PI modes, the amplitude of SBS peaks in PS case is about 2 to 3 dB hsigher. Slight variation in SBS peak amplitudes and slight frequencies shift as seen in
#222759 - $15.00 USD Received 11 Sep 2014; revised 20 Oct 2014; accepted 24 Oct 2014; published 3 Nov 2014(C) 2014 OSA 17 November 2014 | Vol. 22, No. 23 | DOI:10.1364/OE.22.027821 | OPTICS EXPRESS 27829
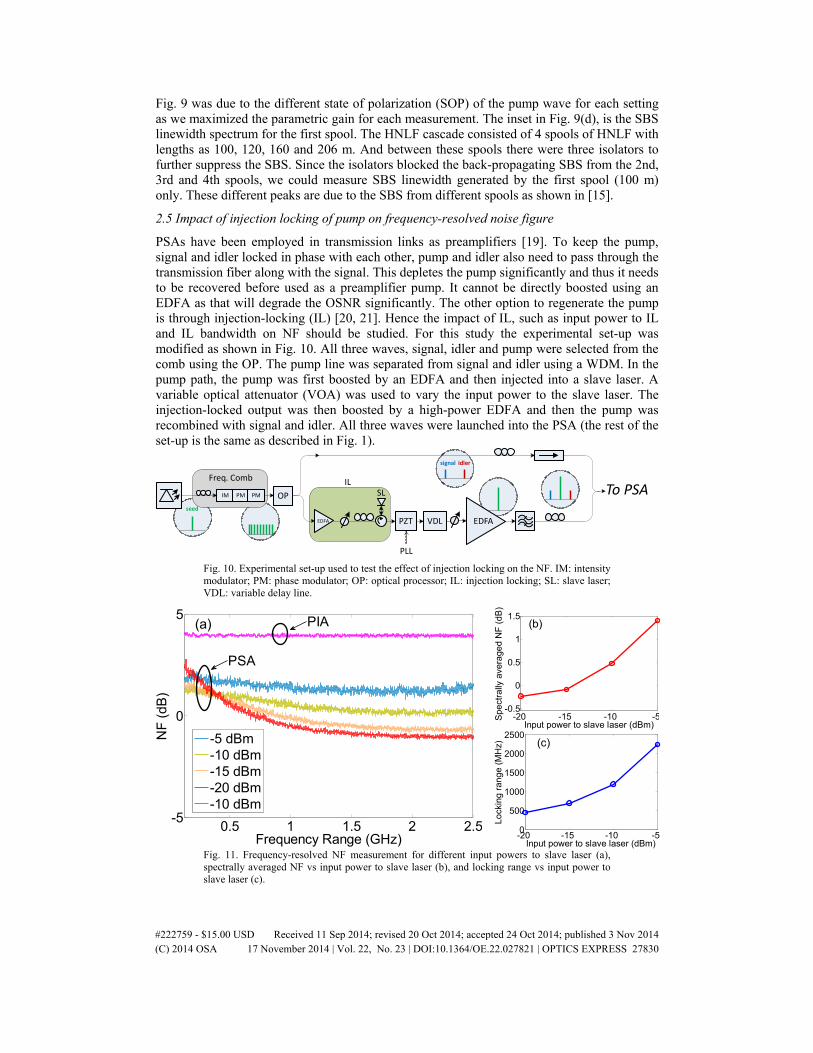
Fig. 9 was due to the different state of polarization (SOP) of the pump wave for each setting as we maximized the parametric gain for each measurement. The inset in Fig. 9(d), is the SBS linewidth spectrum for the first spool. The HNLF cascade consisted of 4 spools of HNLF with lengths as 100, 120, 160 and 206 m. And between these spools there were three isolators to further suppress the SBS. Since the isolators blocked the back-propagating SBS from the 2nd, 3rd and 4th spools, we could measure SBS linewidth generated by the first spool (100 m) only. These different peaks are due to the SBS from different spools as shown in [15].
2.5 Impact of injection locking of pump on frequency-resolved noise figure
PSAs have been employed in transmission links as preamplifiers [19]. To keep the pump, signal and idler locked in phase with each other, pump and idler also need to pass through the transmission fiber along with the signal. This depletes the pump significantly and thus it needs to be recovered before used as a preamplifier pump. It cannot be directly boosted using an EDFA as that will degrade the OSNR significantly. The other option to regenerate the pump is through injection-locking (IL) [20, 21]. Hence the impact of IL, such as input power to IL and IL bandwidth on NF should be studied. For this study the experimental set-up was modified as shown in Fig. 10. All three waves, signal, idler and pump were selected from the comb using the OP. The pump line was separated from signal and idler using a WDM. In the pump path, the pump was first boosted by an EDFA and then injected into a slave laser. A variable optical attenuator (VOA) was used to vary the input power to the slave laser. The injection-locked output was then boosted by a high-power EDFA and then the pump was recombined with signal and idler. All three waves were launched into the PSA (the rest of the set-up is the same as described in Fig. 1).
seed
signal idler
OP
PZT VDL
IM PM PM
EDFA
Freq. Comb IL
PLL
EDFA
To PSASL
Fig. 10. Experimental set-up used to test the effect of injection locking on the NF. IM: intensity modulator; PM: phase modulator; OP: optical processor; IL: injection locking; SL: slave laser; VDL: variable delay line.
-20 -15 -10 -50
500
1000
1500
2000
2500
Input power to slave laser (dBm)
Lock
ing
rang
e (M
Hz) (c)
-20 -15 -10 -5-0.5
0
0.5
1
1.5
Input power to slave laser (dBm)
Spe
ctra
lly a
vera
ged
NF
(dB
)
(b)
0.5 1 1.5 2 2.5-5
0
5
Frequency Range (GHz)
NF
(dB
)
-5 dBm-10 dBm-15 dBm-20 dBm-10 dBm
PSA
PIA(a)
Fig. 11. Frequency-resolved NF measurement for different input powers to slave laser (a), spectrally averaged NF vs input power to slave laser (b), and locking range vs input power to slave laser (c).
#222759 - $15.00 USD Received 11 Sep 2014; revised 20 Oct 2014; accepted 24 Oct 2014; published 3 Nov 2014(C) 2014 OSA 17 November 2014 | Vol. 22, No. 23 | DOI:10.1364/OE.22.027821 | OPTICS EXPRESS 27830
The input power to the slave laser was varied in order to have different locking ranges and for each setting, frequency-resolved NF measurements were taken, see Fig. 11. The signal input power for these measurements was kept as −26 dBm, and pump power was 29.2 dBm which was quite below the SBS threshold. The pump OSNR was kept at its maximum possible, i.e., 55 dB. For the PSA case we set the input power levels to the slave laser as: −5, −10, −15 and −20 dBm and for the PIA case we set the input power to −10 dBm. For the PSA case, as we varied the input power to the slave laser by adjusting the VOA, the shape of the frequency-resolved NF curve changed. On the other hand, the NF curve for the PIA case was independent of the input power level to the slave laser. For PI case the NF curve corresponding to only one power to slave laser is shown as curves at different input powers overlaid each other. We believe the reason for this as follows: as the input power to IL is increased, its locking range is also increased (Fig. 11(c)). The broader the slave laser locking range, the more phase noise from EDFA passes through. Therefore with higher input powers to the slave laser, the NF increases for a wider range of frequencies. Also, NF increase at frequencies below 0.5 GHz stems from the fact that additional phase noise is generated depending on the drift of both the master and the slave laser which is related to their linewidths. We confirmed this by measuring the phase noise of the output signal from the IL. Figure 11(b) shows spectrally averaged NF variation with input powers to slave laser. The spectrally averaged NF decreases with the decrease in input power. However if we go much further down with injected power, locking becomes unstable.
3. Discussion
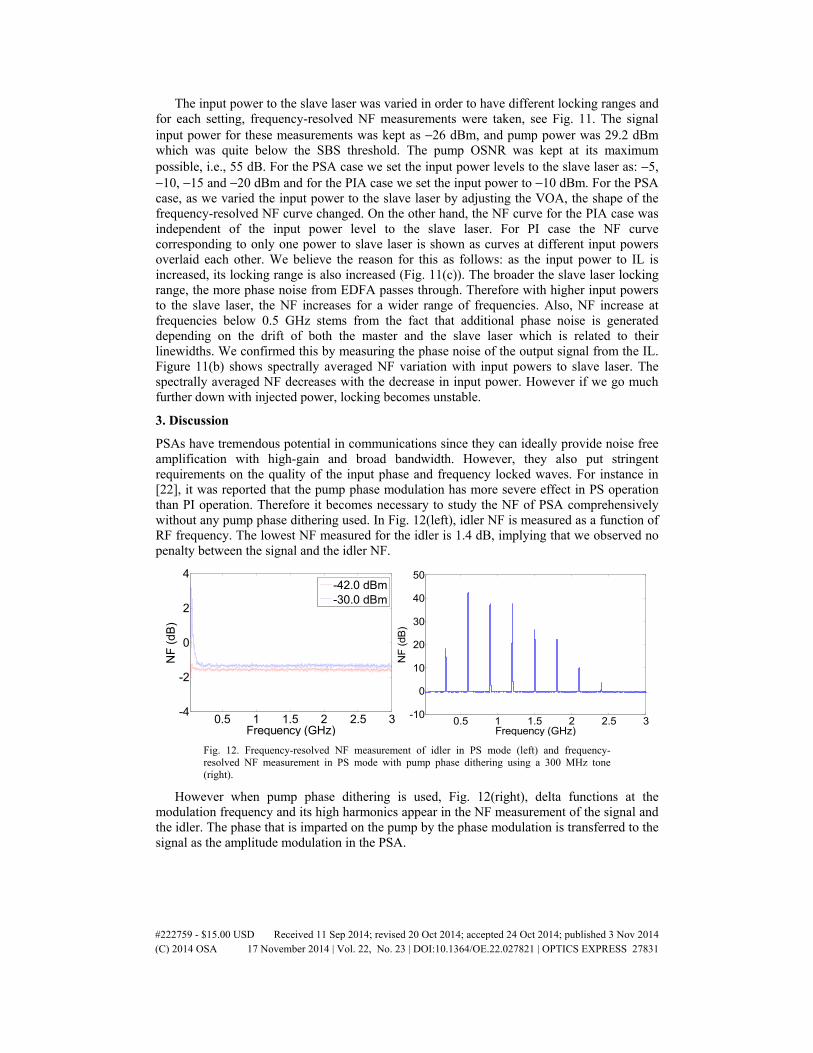
PSAs have tremendous potential in communications since they can ideally provide noise free amplification with high-gain and broad bandwidth. However, they also put stringent requirements on the quality of the input phase and frequency locked waves. For instance in [22], it was reported that the pump phase modulation has more severe effect in PS operation than PI operation. Therefore it becomes necessary to study the NF of PSA comprehensively without any pump phase dithering used. In Fig. 12(left), idler NF is measured as a function of RF frequency. The lowest NF measured for the idler is 1.4 dB, implying that we observed no penalty between the signal and the idler NF.
0.5 1 1.5 2 2.5 3-4
-2
0
2
4
Frequency (GHz)
NF
(dB
)
-42.0 dBm-30.0 dBm
0.5 1 1.5 2 2.5 3-10
0
10
20
30
40
50
Frequency (GHz)
NF
(dB
)
Fig. 12. Frequency-resolved NF measurement of idler in PS mode (left) and frequency-resolved NF measurement in PS mode with pump phase dithering using a 300 MHz tone (right).
However when pump phase dithering is used, Fig. 12(right), delta functions at the modulation frequency and its high harmonics appear in the NF measurement of the signal and the idler. The phase that is imparted on the pump by the phase modulation is transferred to the signal as the amplitude modulation in the PSA.
#222759 - $15.00 USD Received 11 Sep 2014; revised 20 Oct 2014; accepted 24 Oct 2014; published 3 Nov 2014(C) 2014 OSA 17 November 2014 | Vol. 22, No. 23 | DOI:10.1364/OE.22.027821 | OPTICS EXPRESS 27831
4. Conclusion
In this work, frequency-resolved NF measurements of FOPAs both in PI and PS modes are carried out, for the first time to the authors’ best knowledge. These measurements are performed in the frequency range from 0.03 to 3 GHz. For pump powers below SBS threshold, the NF is found to be independent of frequency. However as the pump goes above SBS threshold, sharp peaks start to appear from 0.03 to 0.1 GHz. NF variation with signal input powers is also recorded and it matches reasonably with the theory. Effects of IL locking range on NF of PSA is also presented.
Acknowledgments
This work is supported by the Swedish Research Council, by the European Research Council under grant agreement ERC-2011-AdG - 291618 PSOPA and by the K.A. Wallenberg Foundation. The authors would like to acknowledge S. Olsson for useful discussions on injection-locking.
#222759 - $15.00 USD Received 11 Sep 2014; revised 20 Oct 2014; accepted 24 Oct 2014; published 3 Nov 2014(C) 2014 OSA 17 November 2014 | Vol. 22, No. 23 | DOI:10.1364/OE.22.027821 | OPTICS EXPRESS 27832