FREMANTLE PORT INNER HARBOUR AND CHANNEL DEEPENING · 2017-02-10 · fremantle port inner harbour...
197
FREMANTLE PORT INNER HARBOUR AND CHANNEL DEEPENING – RECLAMATION AT ROUS HEAD AND OFFSHORE PLACEMENT OF DREDGED MATERIAL PUBLIC ENVIRONMENT REVIEW SUPPLEMENT AND RESPONSE TO SUBMISSIONS Rev 2 13 May 2009
Transcript of FREMANTLE PORT INNER HARBOUR AND CHANNEL DEEPENING · 2017-02-10 · fremantle port inner harbour...

FREMANTLE PORT INNER HARBOUR AND CHANNEL DEEPENING – RECLAMATION AT ROUS HEAD AND OFFSHORE PLACEMENT OF DREDGED MATERIAL
PUBLIC ENVIRONMENT REVIEW SUPPLEMENT AND RESPONSE TO SUBMISSIONS
Rev 2 13 May 2009


The SKM logo trade mark is a registered trade mark of Sinclair Knight Merz Pty Ltd.
FREMANTLE PORT INNER HARBOUR AND CHANNEL DEEPENING - RECLAMATION AT ROUS HEAD AND OFFSHORE PLACEMENT OF DREDGED MATERIAL PUBLIC ENVIRONMENT REVIEW SUPPLEMENT AND RESPONSE TO SUBMISSIONS
Rev 2 13 May 2009
Sinclair Knight Merz 7th Floor, Durack Centre 263 Adelaide Terrace PO Box H615 Perth WA 6001 Australia Tel: +61 8 9268 4400 Fax: +61 8 9268 4488 Web: www.skmconsulting.com COPYRIGHT: The concepts and information contained in this document are the property of Sinclair Knight Merz Pty Ltd. Use or copying of this document in whole or in part without the written permission of Sinclair Knight Merz constitutes an infringement of copyright.
LIMITATION: This report has been prepared on behalf of and for the exclusive use of Sinclair Knight Merz Pty Ltd’s Client, and is subject to and issued in connection with the provisions of the agreement between Sinclair Knight Merz and its Client. Sinclair Knight Merz accepts no liability or responsibility whatsoever for or in respect of any use of or reliance upon this report by any third party.

Fremantle Ports Fremantle Port Inner Harbour and Channel Deepening
Public Environmental Review Supplement and Response to Submissions
SINCLAIR KNIGHT MERZ I:\WVES\Projects\WV03196\Deliverables\09_PERResponse\09_20090513\FremantlePER_PERSupplement_WV03196_Rev2.doc PAGE i
Contents
1. Introduction 1 1.1. Purpose of Document 1 1.2. Project Design Status 1 1.3. Post PER Submission Regulatory Consultation 2 1.4. Structure of Document 2
2. Sediment Plume Re-modelling 3
3. Summary of Key Amendments to DSDMP 11
4. Response to Submissions 13 4.1. Department of Environment and Conservation Marine Ecosystem Branch 14 4.2. WA Department of Environment and Conservation 77 4.3. WA Department of Fisheries 86
5. References 88
Appendix A Assessment of Sediment Contamination – Supporting Information for Responses to DEC MEB 1.6, 1.7 and 1.8 92
Appendix B Benthic Habitat Impact 104
Appendix C Peer Review on Light Attenuation Report 116
Appendix D Spoil Ground Stability Modelling Study 120
Appendix E Hydrodynamic Modelling Verification 121

Fremantle Ports Fremantle Port Inner Harbour and Channel Deepening Public Environmental Review Supplement and Response to Submissions
SINCLAIR KNIGHT MERZ
PAGE ii I:\WVES\Projects\WV03196\Deliverables\09_PERResponse\09_20090513\FremantlePER_PERSupplement_WV03196_Rev2.doc
List of Figures
Figure 1 Predicted TSS Plume Contours for 95% of the time and Potential Visible Plume at any given Time. Starting in November 5
Figure 2 Predicted TSS Plume Contours for 95% of the time and Potential Visible Plume at any given Time. Starting in January 6
Figure 3 Predicted TSS Plume Contours for 50% of the time and Potential Visible Plume at any given Time. Starting in November 7
Figure 4 Predicted TSS Plume Contours for 50% of the time and Potential Visible Plume at any given Time. Starting in January 8
Figure 5 Predicted Cumulative Sediment Load. Starting in November 9
Figure 6 Predicted Cumulative Sediment Load. Starting in January 10
Figure 7 Proposed Spoil Ground and Bathymetry 18
Figure 8 Location of Ecological Protection Areas 32
Figure 9 Rous Head Reclamation Area Monitoring Location in 2003 37
Figure 10 Arsenic Concentrations of Water Samples Taken from the Rous Head Reclamation Area 2003 37
Figure 11 Current Speed Exceedance Profile Plot 27 February 2007 to 29th March 2007 40
Figure 12 Current Speed Exceedance Profile Plot 31 January to 27 February 2007 41
Figure 13 Location of AMC Dredging Monitoring Sites 49
Figure 14 Conceptual Illustration of BPPH Zones of Potential Impact, Effect and Influence 55
Figure 15 Potential Benthic Primary Producer Habitat Loss – Dredging Commencing in November 61
Figure 16 Potential Benthic Primary Producer Habitat Loss – Dredging Commencing in January 62
Figure 17 Mean and Standard Deviation of TBT in Mussels at Defined Sampling Areas over the Duration of MQMP Monitoring 83
Figure 18 PER Inner Harbour, Rous Head and Entrance Channel Sediment Sampling Sites 93
Figure 19 Relationship Between Light Attenuation and Seagrass Compensation Depth 105
Figure 20 Calibration Chamber Setup 106

Fremantle Ports Fremantle Port Inner Harbour and Channel Deepening
Public Environmental Review Supplement and Response to Submissions
SINCLAIR KNIGHT MERZ
I:\WVES\Projects\WV03196\Deliverables\09_PERResponse\09_20090513\FremantlePER_PERSupplement_WV03196_Rev2.doc PAGE iii
Figure 21 Overall Relationship Between TSS and Light Attenuation (LAC) 108
Figure 22 Conceptual Illustration of BPPH Zones of Potential Impact, Effect and Influence 112

Fremantle Ports Fremantle Port Inner Harbour and Channel Deepening Public Environmental Review Supplement and Response to Submissions
SINCLAIR KNIGHT MERZ
PAGE iv I:\WVES\Projects\WV03196\Deliverables\09_PERResponse\09_20090513\FremantlePER_PERSupplement_WV03196_Rev2.doc
List of Tables
Table 1 Summary of Key Updates to DSDMP 11
Table 2: Public and Government Submissions on the Draft PER 13
Table 3 Wave Induced Near-Bed Velocities for the Two Wave Events 21
Table 4 Distance From the Proposed Disposal Area Boundary to Sensitive Habitats 22
Table 5 Perth’s Coastal Waters Environmental Values (EV) and Environmental Quality Objectives (EQO) with Corresponding DSDMP Management Strategies. 34
Table 6 Threshold Comparison between PER and PER Supplement 52
Table 7 Revised BPPH Loss Calculations 57
Table 8 Indicative Light Attenuation (m-1) Trigger Values based on 10% MLR Light Attenuation for Seagrasses 65
Table 9 Indicative Light Attenuation (m-1) Trigger Values based on 20% MLR Light Attenuation for Corals 66
Table 10: Number of Sampling Sites to be Used at Each of the Regions and Zones 68
Table 11 Potential Impacts on Whales Resulting from Dredging and Offshore Disposal Activities 78
Table 12 Results for Mercury in Sediment and Elutriate Samples 97
Table 13 Results for TBT (Normalised to 1% TOC) in Sediment and Elutriate Samples 99
Table 14 Threshold Levels for Light Attenuation and TSS 110
Table 15 Summary of BPPH Impact Calculations 113
Fremantle Ports Fremantle Port Inner Harbour and Channel Deepening
Public Environmental Review Supplement and Response to Submissions
SINCLAIR KNIGHT MERZ I:\WVES\Projects\WV03196\Deliverables\09_PERResponse\09_20090513\FremantlePER_PERSupplement_WV03196_Rev2.doc PAGE v
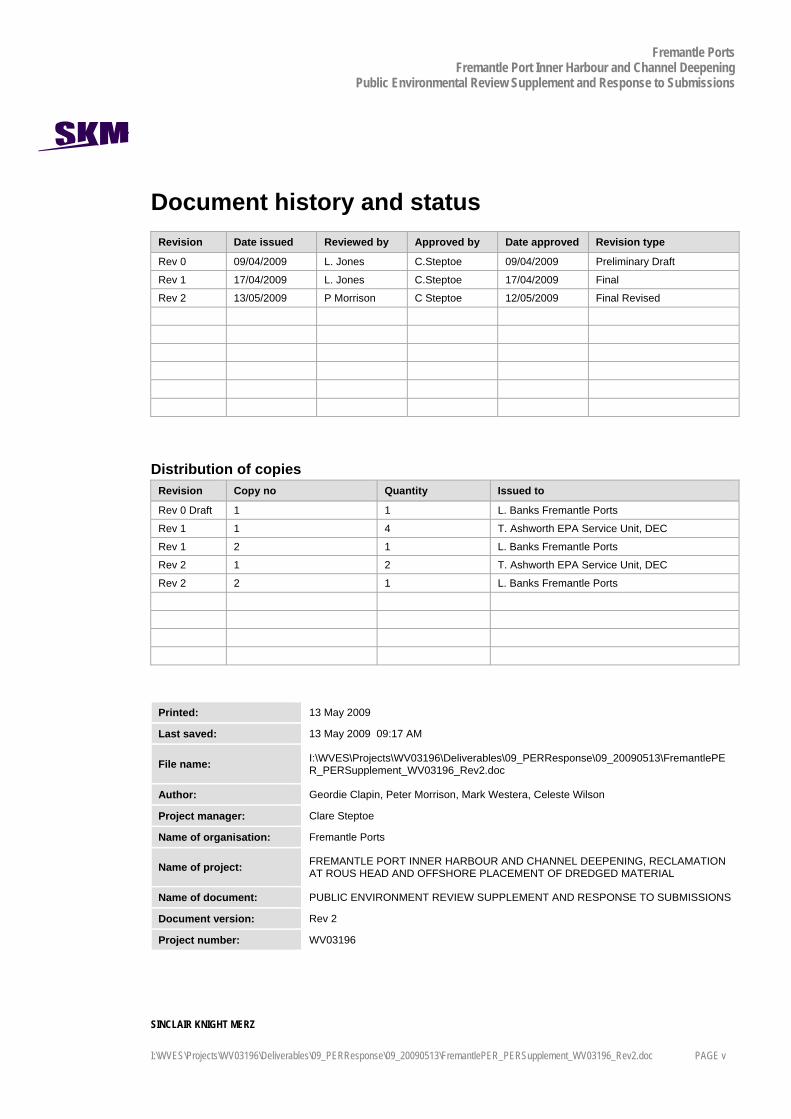
Document history and status Revision Date issued Reviewed by Approved by Date approved Revision type
Rev 0 09/04/2009 L. Jones C.Steptoe 09/04/2009 Preliminary Draft
Rev 1 17/04/2009 L. Jones C.Steptoe 17/04/2009 Final
Rev 2 13/05/2009 P Morrison C Steptoe 12/05/2009 Final Revised
Distribution of copies Revision Copy no Quantity Issued to
Rev 0 Draft 1 1 L. Banks Fremantle Ports
Rev 1 1 4 T. Ashworth EPA Service Unit, DEC
Rev 1 2 1 L. Banks Fremantle Ports
Rev 2 1 2 T. Ashworth EPA Service Unit, DEC
Rev 2 2 1 L. Banks Fremantle Ports
Printed: 13 May 2009
Last saved: 13 May 2009 09:17 AM
File name: I:\WVES\Projects\WV03196\Deliverables\09_PERResponse\09_20090513\FremantlePER_PERSupplement_WV03196_Rev2.doc
Author: Geordie Clapin, Peter Morrison, Mark Westera, Celeste Wilson
Project manager: Clare Steptoe
Name of organisation: Fremantle Ports
Name of project: FREMANTLE PORT INNER HARBOUR AND CHANNEL DEEPENING, RECLAMATION AT ROUS HEAD AND OFFSHORE PLACEMENT OF DREDGED MATERIAL
Name of document: PUBLIC ENVIRONMENT REVIEW SUPPLEMENT AND RESPONSE TO SUBMISSIONS
Document version: Rev 2
Project number: WV03196


Fremantle Ports Fremantle Port Inner Harbour and Channel Deepening
Public Environmental Review Supplement and Response to Submissions
SINCLAIR KNIGHT MERZ PAGE 1 I:\WVES\Projects\WV03196\Deliverables\09_PERResponse\09_20090513\Frema
1. Introduction 1.1. Purpose of Document
Fremantle Ports is seeking to deepen the Deep Water Channel, Entrance Channel and Inner Harbour to allow 14m draft ships to use the Fremantle Inner Harbour, and reclaim an area of seabed at Rous Head. This project is referred to as the ‘Inner Harbour and Channel Deepening Project’.
The purpose of this document is to respond to public and government submissions on the Fremantle Port Inner Harbour and Channel Deepening, Reclamation at Rous Head and Offshore Placement of Dredged Material Public Environmental Review (PER). The PER was published by Fremantle Ports, as Proponent of the proposed project, for public review for a period of six weeks from 19th January 2009 through to 3rd March 2009.
A total of eleven submissions were received during and following the public review period and the Environmental Protection Agency Service Unit (EPASU) has advised that four of these submissions require responses on environmental matters. Furthermore, it is noted that issues to be addressed are focused on the predicted and/or potential impacts of the dredging activities and subsequent monitoring.
This document provides Fremantle Port’s formal response to environmental issues raised during the public review period. Furthermore, it provides an update on any project design changes that have been made during the intervening period between PER submission in January 2009 and April 2009. The document is supported by an updated Dredge Spoil Disposal and Management Plan (DSDMP) Revision 4 which addresses a number of the issues raised during the public review.
This document (PER Supplement / Response to Submissions) together with the updated DSDMP (Rev 5) and the PER comprise the Final PER and is provided to the Western Australian Environmental Protection Authority (EPA) for assessment in accordance with the Environmental Impact Assessment (Part IV Division 1) Administrative Procedures 2002 (EPA, 2002).
1.2. Project Design Status
The Proponent advises that there have not been any significant modifications to the design of the dredging, reclamation and spoil disposal activities that were described and assessed in the PER.
As with many development proposals, there is a critical timeframe for the Inner Harbour dredging project. It is currently proposed that, subject to receiving EPA and Ministerial approval, construction of the seawall would commence immediately and dredging would commence in November 2009. Extensive investigation has determined that, from an environmental and safety

Fremantle Ports Fremantle Port Inner Harbour and Channel Deepening Public Environmental Review Supplement and Response to Submissions
SINCLAIR KNIGHT MERZ PAGE 2 I:\WVES\Projects\WV03196\Deliverables\09_PERResponse\09_20090513\FremantlePER_PERSupplement_WV03196_Rev2.doc
aspect, the most suitable period to undertake the proposed dredging program is in the period November to May. The construction of the seawall at Rous Head is essential to that timeframe, noting that dredging needs to commence in November 2009.
1.3. Post PER Submission Regulatory Consultation
Following receipt of the public and regulatory comments on the PER, the Proponent has undertaken the following meetings with regulatory agencies to seek further clarification and engagement on certain issues:
Meetings with the Environmental Protection Authority Services Unit (EAPSU) and Department of Environment and Conservation Marine Ecosystem Branch (DEC MEB) on 12th and 17th March 2009; and
Various phone conservations and emails with Department of Environment and Conservation Marine Ecosystem Branch between 17th March 2009 and the date of submission of the PER response.
1.4. Structure of Document
The PER Supplement and Response to Submissions consists of the following sections:
Section 2 – describes additional sediment plume dispersion modelling undertaken to support responses outlined in Section 4 of this document and the updated DSDMP (Rev 5).
Section 3 – provides a summary of significant amendments made to the DSDMP and Benthic Primary Producer Habitat (BPPH) Assessment that have been undertaken to respond to comments raised by the public and government in Section 4.
Section 4 – includes a list of public and government submissions, comments and the Proponent’s responses.
Section 5 – outlines additional references to support this document.

Fremantle Ports Fremantle Port Inner Harbour and Channel Deepening
Public Environmental Review Supplement and Response to Submissions
SINCLAIR KNIGHT MERZ PAGE 3 I:\WVES\Projects\WV03196\Deliverables\09_PERResponse\09_20090513\Frema
2. Sediment Plume Re-modelling Sediment plume re-modelling has been undertaken to address the following issues raised by the Department of Environment and Conservation Marine Ecosystem Branch (DEC MEB):
1.13 Section 6.4.4.2 discusses the sediment plume modelling predictions and the model outputs are shown visually in Figures 6-7 to 6-12. The discussion is restricted to considering effects of the plume on benthic habitat and does not consider effects in the context of the broader environmental value of ecological health or in the context of the more social environmental value of recreation and aesthetics. The metropolitan beaches are heavily used over the spring, summer and autumn periods and modelling suggests that there will be visible plumes extending at least to City Beach for 50% of the time, but that turbid patches of up to 30 mg/L may reach Cottesloe from time to time. It is noted that background TSS is closer to 2 mg/L so these plumes would be >10x background and highly visible. The Proponent should plot the TSS contours for the furthest extent of the plume predicted for 5% of the time (ie. 1 in 20 days) to give a better indication of how far the sediment plume may travel over these shorter periods in time (worst case), although because the modelled TSS outputs are averaged, they will not capture these short term excursions very well.
1.14 In Figures 6-7 to 6-12 the modelled TSS contours are mapped for the dredging and disposal locations. For the offshore disposal site the spoil will be dumped over the entire area of the proposed area, yet the TSS contours are centred around the middle of the disposal site. The same thing is apparent in the modelled sedimentation loading in Figures 6-15 – 6-17. This suggests that the modelling has not modelled sediment disposal across the entire 150 ha proposed disposal site, but only at a central location. If this is true, then the modelling outputs for TSS, sedimentation and zones of impact, effect and influence on BPPH will be incorrect. The Proponent should clarify the model input parameters and show that they properly reflect the actual dredging and disposal program.
1.15 The modelled TSS contours around the outer channel for a January start (Figures 6-7 and 6-8) and a November start (Figures 6-11 and 6-12) show a smaller visible plume contour in the 50% of the time output than for the 95% of the time output. This is opposite to what would be expected and needs to be explained.
1.16 The modelled TSS contours are incomplete within the Swan River estuary. 1.17 The modelled sedimentation loading (Figures 6-15 to 6-17) shows sedimentation occurring over dry land north
and south of the inner harbour. This raises into question the approach used for modelling and the accuracy of the sedimentation outputs and needs explanation.
1.22 As already discussed in comment 14 above, the modelled areas of effect and influence on BPPH appear to be centred around the middle of the offshore disposal site and, if so, may not reflect the effects of the actual spoil disposal operation where spoil will be deposited over the entire 150 ha disposal site.
The following aspects of the re-modelling are noted for transparency and clarity:
1) The TSS plume has been re-modelled for 2mg/L at anytime in daylight hours that last for more than three hours to show the extent of the potential visible plume over the duration of the dredging and dredge spoil disposal program.
2) The disposal of spoil within the proposed offshore spoil ground has been re-modelled for TSS and sedimentation with the sediment disposal events spread evenly in a grid over the entire spoil disposal area rather than the deepest part of the spoil ground as was previously proposed and assessed in the PER. It is noted that the outputs for the revised spoil disposal over the entire disposal area have been used as part of the Benthic Primary Producer Habitat (BPPH) Assessment that is further discussed in the response to Issues 1.20 and 1.21.

Fremantle Ports Fremantle Port Inner Harbour and Channel Deepening Public Environmental Review Supplement and Response to Submissions
SINCLAIR KNIGHT MERZ PAGE 4 I:\WVES\Projects\WV03196\Deliverables\09_PERResponse\09_20090513\FremantlePER_PERSupplement_WV03196_Rev2.doc
3) The model coastline has been updated to more accurately represent the shoreline in the Swan River Estuary and around the land north and south of the Inner Harbour to resolve the issues raised by DEC.
4) The TSS values for January and November in the 95% scenario (Figures 6-7 and 6-11 of the PER) have been re-modelled and the revised figures are shown in Figure 1 and Figure 2 of this PER Supplement.
5) The TSS values for January and November in the 50% scenario (Figures 6-8 and 6-12 of the PER) have been re-modelled and the revised figures are shown in Figure 3 and Figure 4 of this PER Supplement.
6) In recognition that the approvals process will not be completed in time to commence dredging in September, this scenario has not been remodelled.
The following modelling scenarios were run:
1) TSS at 95% of the time, dredging starting in November (Figure 1).
2) TSS at 95% of the time, dredging starting in January (Figure 2).
3) TSS at 50% of the time, dredging starting in November (Figure 3).
4) TSS at 50% of the time, dredging starting in January (Figure 4).
5) Cumulative sediment load, dredging starting in November (Figure 5).
6) Cumulative sediment load, dredging starting in January (Figure 6).
7) TSS for 2 mg/L at anytime in daylight hours that last for more than 3 hours dredging starting in November (Figure 1 and Figure 3).
8) TSS for 2 mg/L at anytime in daylight hours that last for more than 3 hours dredging starting in January (Figure 2 and Figure 4).

Fremantle Ports Fremantle Port Inner Harbour and Channel Deepening
Public Environmental Review Supplement and Response to Submissions
SINCLAIR KNIGHT MERZ PAGE 5 I:\WVES\Projects\WV03196\Deliverables\09_PERResponse\09_20090513\Frema
Figure 1 Predicted TSS Plume Contours for 95% of the time and Potential Visible Plume
at any given Time. Starting in November

Fremantle Ports Fremantle Port Inner Harbour and Channel Deepening Public Environmental Review Supplement and Response to Submissions
SINCLAIR KNIGHT MERZ PAGE 6 I:\WVES\Projects\WV03196\Deliverables\09_PERResponse\09_20090513\FremantlePER_PERSupplement_WV03196_Rev2.doc
Figure 2 Predicted TSS Plume Contours for 95% of the time and Potential Visible Plume
at any given Time. Starting in January

Fremantle Ports Fremantle Port Inner Harbour and Channel Deepening
Public Environmental Review Supplement and Response to Submissions
SINCLAIR KNIGHT MERZ PAGE 7 I:\WVES\Projects\WV03196\Deliverables\09_PERResponse\09_20090513\Frema
Figure 3 Predicted TSS Plume Contours for 50% of the time and Potential Visible Plume
at any given Time. Starting in November

Fremantle Ports Fremantle Port Inner Harbour and Channel Deepening Public Environmental Review Supplement and Response to Submissions
SINCLAIR KNIGHT MERZ PAGE 8 I:\WVES\Projects\WV03196\Deliverables\09_PERResponse\09_20090513\FremantlePER_PERSupplement_WV03196_Rev2.doc
Figure 4 Predicted TSS Plume Contours for 50% of the time and Potential Visible Plume
at any given Time. Starting in January

Fremantle Ports Fremantle Port Inner Harbour and Channel Deepening
Public Environmental Review Supplement and Response to Submissions
SINCLAIR KNIGHT MERZ PAGE 9 I:\WVES\Projects\WV03196\Deliverables\09_PERResponse\09_20090513\Frema
Figure 5 Predicted Cumulative Sediment Load Starting in November

Fremantle Ports Fremantle Port Inner Harbour and Channel Deepening Public Environmental Review Supplement and Response to Submissions
SINCLAIR KNIGHT MERZ PAGE 10 I:\WVES\Projects\WV03196\Deliverables\09_PERResponse\09_20090513\FremantlePER_PERSupplement_WV03196_Rev2.doc
Figure 6 Predicted Cumulative Sediment Load Starting in January

Fremantle Ports Fremantle Port Inner Harbour and Channel Deepening
Public Environmental Review Supplement and Response to Submissions
SINCLAIR KNIGHT MERZ PAGE 11 I:\WVES\Projects\WV03196\Deliverables\09_PERResponse\09_20090513\Frema
3. Summary of Key Amendments to DSDMP The DSDMP (Rev 3) presented in the PER has undergone significant revision to better reflect the level of environmental management and monitoring that will be required to minimise potential impacts on the receiving environment. Table 1 below presents a summary of amendments and revisions made to the DSDMP. The revised DSDMP (Rev 5) is presented as a stand-alone supporting document to the PER.
Table 1 Summary of Key Updates to DSDMP
DSDMP Section Existing Section
New Section
Summary of Revision
Executive Summary Has been compiled Introduction Has been expanded to include further detail on legislative
requirements and reference to relevant State and Commonwealth Legislation and Guidelines (including Perth Coastal Waters Environmental Values and Objectives).
Project Description Has been revised and expanded to include up-to-date and relevant detail on all aspects of dredging works.
Existing Environment Has been expanded to include the location and environmental objectives of reserves, marine parks and ecological protection levels in the vicinity of the project area. This section now also refers to the Perth Coastal Waters Environmental Values and Objectives, and how these values and objectives will be met by the DSDMP. The section entitled Existing Environment has also been revised to include more detail on metocean conditions, such as tides, wind, waves, currents and bathymetry that may affect dredging and environmental impacts.
Risk Assessment and Performance Objectives
A section has been added that describes the risk-based approach used in development of the DSDMP. Key risks are identified and associated performance objectives for management of these risks are described. Key performance objectives have been included for each management element.
Environmental Management
The layout has been revised to improve ease of reading for the user and interpretation.
Key Performance Objectives and Key Performance Indicators
Has been revised to better reflect management commitments.
Management Strategies Significant revisions have been made to the following management measures: i) Water Quality, Sedimentation and Indirect Impacts to BPPH; ii) Direct Impacts to BPPH; and iii) Marine Fauna, with minor revisions to other management measures.
Monitoring Programs This section has been expanded to describe all Water Quality and BPPH monitoring programs, including seagrass monitoring, and coral monitoring at Hall Bank.

Fremantle Ports Fremantle Port Inner Harbour and Channel Deepening Public Environmental Review Supplement and Response to Submissions
SINCLAIR KNIGHT MERZ PAGE 12 I:\WVES\Projects\WV03196\Deliverables\09_PERResponse\09_20090513\FremantlePER_PERSupplement_WV03196_Rev2.doc
This page has been intentionally left blank

Fremantle Ports Fremantle Port Inner Harbour and Channel Deepening
Public Environmental Review Supplement and Response to Submissions
SINCLAIR KNIGHT MERZ PAGE 13 I:\WVES\Projects\WV03196\Deliverables\09_PERResponse\09_20090513\Frema
4. Response to Submissions A total of eleven submissions have been received on the PER for the proposed Inner Harbour and Channel Deepening, Reclamation at Rous Head and Offshore Placement of Dredged Material Project (Table 2). The EPASU advised at the meeting of 17th March 2009 that only four submissions require responses on environmental matters, being those submissions received from:
Department of Environment and Conservation Marine Ecosystem Branch;
Department of Environment and Conservation;
Swan River Trust; and
Department of Fisheries.
This section contains Fremantle Ports' formal response to the issues raised in the four submissions listed above. Fremantle Ports will respond separately to the remaining submissions which deal with non-environmental matters.
Table 2: Public and Government Submissions on the Draft PER
No. Submission Response Reference No.
1 WA Department of Environment and Conservation Marine Ecosystem Branch
DEC MEB 1.1 – 1.42
2 WA Department of Environment and Conservation DEC 2.1, DEC 2.2, DEC 2.33, 3 Swan River Trust SWT 3.1, SWT 3.2, SWT 3.3, SWT 3.4,
SWT 3.5, SWT 3.6, SWT 3.7 4 WA Department of Fisheries DOF 4.1, DOF 4.2, DOF 4.3 5 Alchimie Pty Ltd Fremantle Ports to respond separately 6 WA Port Operations Task Force Fremantle Ports to respond separately 7 Chamber of Commerce and Industry, WA Fremantle Ports to respond separately
8 BP Refinery, Kwinana Fremantle Ports to respond separately 9 ANL Container Lines Fremantle Ports to respond separately 10 Southwest Group Fremantle Ports to respond separately 11 RecFishWest Fremantle Ports to respond separately

Fremantle Ports Fremantle Port Inner Harbour and Channel Deepening Public Environmental Review Supplement and Response to Submissions
SINCLAIR KNIGHT MERZ PAGE 14 I:\WVES\Projects\WV03196\Deliverables\09_PERResponse\09_20090513\FremantlePER_PERSupplement_WV03196_Rev2.doc
4.1. Department of Environment and Conservation Marine Ecosystem Branch
Selection of a New Spoil Ground DEC MEB Issue 1.1
A new offshore spoil ground is proposed for disposal of dredge spoil from the outer channel, but is also anticipated to be the disposal site for future dredging operations in the port area. This disposal site was apparently identified through a detailed site selection study, but it appears that the study did not include any of the eight known spoil disposal sites that already exist around the entrance to Fremantle port. If these were considered, then it has not been stated in the documentation. The Proponent has therefore failed to justify why a new spoil disposal site is required.
Proponent’s Response to DEC MEB Issue 1.1
The DEC MEB states that eight spoil disposal sites already exist around the entrance to Fremantle Port and that the Proponent has failed to justify why a new spoil disposal site is required.
The Proponent disagrees that any existing spoil disposal sites are available for use around the entrance to Fremantle Port. Furthermore five of the sites referred to by the DEC MEB are located within Owen Anchorage and Cockburn Sound and are not considered suitable for dredge spoil placement for the proposed program due to these sites being located in areas of high environmental value and the distance from the dredging locations being too great.
The Proponent has a strong history of beneficially re-using dredge material and as a result there is currently no active offshore spoil ground for disposal of dredge spoil within the waters of Fremantle Ports. The last offshore disposal of dredged spoil occurred in the 1970s and even as early as the 1950s dredge material was used for reclamation and beach renourishment purposes. For more than a decade dredged material, when assessed to be suitable, has also been provided to Cockburn Cement for re-use. As a result of these practices an offshore spoil ground has not been required by Fremantle Ports since the 1970s, however for the current proposal the volume of dredging is such that not all of the material can be used for reclamation purposes, nor is it suitable for beach renourishment or re-use by Cockburn Cement. As a consequence a spoil disposal area is required for up to 1.45 million m3 of clean dredged material.
The eight previous sites have not been used for more than 30 years. During the era that these sites were used there was little or no consideration given to environmental issues in selecting their location. In a contemporary context, five of the previous sites are located in Owen Anchorage and Cockburn Sound within the Cockburn Sound Management Area, two are positioned in inshore areas in close proximity to the Fremantle Fishing Boat harbour and recreational boating facilities and the final site is located directly adjacent to Success Bank. Furthermore, since each of the
Fremantle Ports Fremantle Port Inner Harbour and Channel Deepening
Public Environmental Review Supplement and Response to Submissions
SINCLAIR KNIGHT MERZ PAGE 15 I:\WVES\Projects\WV03196\Deliverables\09_PERResponse\09_20090513\Frema
previous spoil grounds was only used once between 1952 and 1974 and have subsequently been undisturbed since that time, it is anticipated that these spoil grounds will have rehabilitated during the intervening period.
In recognition that an active offshore spoil ground does not exist within Fremantle Ports, a Strategic Dredging Workshop was held in December 2004 (SKM 2006). The objectives of the workshop were to:
identify and prioritise available options for dredge material re-use and relocation;
determine possible synergies between the proposed Inner and Outer Harbour dredging projects; and
determine further work required.
During the workshop, numerous options were considered for the reuse and relocation of dredge material generated from the Inner Harbour, including a newly created spoil ground. Subsequently selection criteria consistent with the process recommended in the National Ocean Spoil Disposal Guidelines for Dredged Materials (NODGDM) were adopted to select a suitable offshore spoil ground location as follows:
proximity to the proposed dredging areas;
to have capacity for current and future dredging programs;
to be situated such that its use would result in minimal environmental impact; and
to be situated in an area of low environmental value or to be already impacted by human activity.
The established of the proposed dredge spoil disposal site in the Gage Roads anchorage area is justified on the following grounds:
1) The proposed site is in close proximity to dredge areas in the Entrance Channel, Inner Harbour and Deep Water Channel. [Of the eight previous sites, only Spoil Grounds 1, E and G have similar proximity to the Entrance Channel an Inner Harbour dredge areas, but are significantly further away from the Deep Water Channel.]
2) The proposed site has the capacity for current and future dredging programs. The entire site could receive in the order of 14 million m3
of dredged material without impacting on navigation depths. [Of the eight previous sites, only Spoil Grounds 3, C and D are located in sufficient water depths to receive large volumes of dredged material without impacting on navigable depths, however these are the sites most distant from the dredge locations.]
3) The proposed site is situated such that its use would result in minimal environmental impact, in so far as:
Fremantle Ports Fremantle Port Inner Harbour and Channel Deepening Public Environmental Review Supplement and Response to Submissions
SINCLAIR KNIGHT MERZ PAGE 16 I:\WVES\Projects\WV03196\Deliverables\09_PERResponse\09_20090513\FremantlePER_PERSupplement_WV03196_Rev2.doc
the site is stable and not subject to strong currents or wave action;
the closest seagrass habitat is at least 2km to the south;
the closest coral habitat is at least 3km to the east; and
the closest limestone reef habitat is 3.3km to the west.
[Of the eight previous sites, only Spoil Grounds C is located similarly in proximity to adjacent sensitive habitats, however this site is the most distant from the dredge locations and is located within Cockburn Sound.]
4) The proposed site is situated in an area of low environmental value already impacted by human activity in so far as the seabed has been highly disturbed by ship’s anchors and the sediments in the area, whilst below the NODGDM screening levels, are not pristine.
[Of the eight previous sites, five are located in the high environmental value areas of Owen Anchorage and Cockburn Sound and two are located in high environmental value inshore areas in close proximity to the Fremantle Fishing Boat Harbour and recreational boating facilities. While the DEC suggests that the previous disposal sites have already been impacted by human activity, each of the previous spoil grounds was only used once between 1952 and 1974 and have since been undisturbed. Is therefore anticipated that these spoil grounds will have rehabilitated during the intervening period.]
In summary, by adopting the process recommended in the National Ocean Spoil Disposal Guidelines for Dredged Materials for selecting a suitable offshore spoil ground, none of the eight previous spoil grounds identified in the PER are considered suitable for the proposed dredging program for various reasons, including:
Being located in or near areas of high environmental value;
Environmental considerations including seagrass habitat at the site and the proximity to seagrass beds or reef structures;
Anticipated recovery/ rehabilitation from previous human impact;
Distance from the project area;
Proximity to navigation paths for shipping and recreational vessels; or
Capacity constraints.
DEC MEB Issue 1.2
The proposed new offshore spoil ground is also the Gage Roads ship anchorage area (see Figure 2-2, PER and Figure 2 of Appendix A). The sediments in this area are regularly re-worked through anchor and anchor chain disturbance. As a result the site could only be suitable for disposal of sediments clear of any contamination. The EPA should be cognisant of this fact should it approve the proposed disposal site.

Fremantle Ports Fremantle Port Inner Harbour and Channel Deepening
Public Environmental Review Supplement and Response to Submissions
SINCLAIR KNIGHT MERZ PAGE 17 I:\WVES\Projects\WV03196\Deliverables\09_PERResponse\09_20090513\Frema
Proponent’s Response to DEC MEB Issue 1.2 The Proponent acknowledges that the proposed new offshore spoil ground is in the Gage Roads ship anchorage area. The location of this spoil ground was selected in part for this very reason as the seabed in the area has been, and continues to be, disturbed by ship’s anchors; and the sediments in the area, whilst below the NODGDM screening level, are not pristine. Notwithstanding this, such disturbances occur locally as a direct result of anchor drop and recovery, and anchor chain drag, and the overall seabed in the anchorage area is stable, with minimal changes evidenced in navigable depths over past decades.
Sediment sampling has demonstrated that dredged material from all areas to be dredged is suitable for unconfined offshore disposal under the NODGDM Guidelines. Notwithstanding this, the Proponent has agreed to the DEC MEB’s request to place surface material from the Inner Harbour, where some contaminants exceeded NODGDM screening levels in sediments, into reclamation at Rous Head. Consequently all materials to be disposed to the offshore spoil disposal area will be clear of any contaminants.
DEC MEB Issue 1.3
In Section 4.5.1.6 it is stated that eight sites were investigated for BPPH within the proposed spoil disposal area and it is concluded that the area is devoid of benthic flora apart from a few small patches of Halophila. In fact only one of these sites is within the proposed spoil disposal area and it could be argued that this is insufficient to determine BPPH within a 150 ha area. In Appendix A of Appendix E there are descriptions of diver assessments undertaken at seven additional sites within the disposal area. Three of the seven sites were assessed as having live Posidonia seagrass present, and nine of the ten sites adjacent to the northern or eastern boundary of the spoil ground were assessed as having live Posidonia seagrass present. This suggests that the Proponent’s conclusion is incorrect.
Proponent’s Response to DEC MEB Issue 1.3 The Proponents selection of the proposed spoil disposal area was undertaken in several stages and the process undertaken was consistent with the National Ocean Disposal Guidelines for Dredged Material (NODGDM).
An initial site selection study was undertaken to identify a suitable offshore disposal area to accommodate the current and future dredging programs. Field investigations were then undertaken to determine characteristics of potential sites. At the conclusion of the field investigations, the proposed offshore disposal area was reduced in size and shifted north-east into deeper water (Figure 7) to facilitate disposal of dredge spoil to the deepest part of the proposed disposal site, with the intention of targeting both the least sensitive area of habitat and the most stable location for sediment retention. Finally, because the dredging program does not require the full capacity of

Fremantle Ports Fremantle Port Inner Harbour and Channel Deepening Public Environmental Review Supplement and Response to Submissions
SINCLAIR KNIGHT MERZ PAGE 18 I:\WVES\Projects\WV03196\Deliverables\09_PERResponse\09_20090513\FremantlePER_PERSupplement_WV03196_Rev2.doc
Figure 7 Proposed Spoil Ground and Bathymetry Note: Red dotted line indicates original study area. Shaded portion is proposed offshore disposal area.

Fremantle Ports Fremantle Port Inner Harbour and Channel Deepening
Public Environmental Review Supplement and Response to Submissions
SINCLAIR KNIGHT MERZ PAGE 19 I:\WVES\Projects\WV03196\Deliverables\09_PERResponse\09_20090513\Frema
the proposed spoil ground, a smaller area was selected in the northern section to receive dredged material from the current program only, which was the subject of the PER.
The eight diver surveys were done within the original proposed spoil ground boundaries which spanned an area approximately three times that of the currently proposed spoil disposal ground in the PER (Figure 3-1, Appendix E of the PER). At each of these eight locations, measures were made of seagrass species and cover. Photographs of these sites were included in the PER and show little or no BPPH in this larger area.
Consequently only one diver survey site remained within the boundaries of the smaller spoil disposal area specific to the current dredging program. To improve understanding of the benthic cover, and build on data from the one remaining site, drop video survey was used to ascertain the benthic cover within the reduced spoil ground. Live seagrass was identified from these drop videos in areas of 18m and deeper which is generally beyond the known depth limit of seagrass distribution in the area.
Seagrasses have a depth limit of distribution based on the light available for photosynthesis. In the region north of Success Bank (4 km south of the spoil ground), the depth limit of the seagrass meadow (Posidonia sinuosa) has been shown to be approximately 15m, with areas at 20m being sparsely vegetated, course sandy slope (Masini, et al., 1995). Other studies have shown that seagrasses in metropolitan waters only grow to depth limits of approximately 12 m (Lavery and Westera, 2005). It is therefore suspected that the seagrass recorded in drop video in deeper waters of the proposed spoil ground may represent accumulations of recently detached wrack material that was misidentified as live seagrass.
Where necessary, additional seagrass surveys using towed video will be undertaken to establish baseline conditions at monitoring sites.
The Proponent has reflected the additional baseline seagrass surveys as part of the Seagrass Management Plan in the revised DSDMP (Rev 5).
In summary, the Proponent confirms that the sites sampled by divers during the initial long term disposal ground investigation were devoid of seagrass. The PER however also shows that seagrass habitat has been mapped within the currently proposed spoil ground. It is and always has been the intention of the Proponent to dispose of dredge spoil to the deepest part of the Gage Roads disposal site with the intention of targeting both the least sensitive area of habitat and the most stable location for sediment retention. The Proponent selected the entire anchorage area for investigation to secure a long term disposal site for the current proposal and for future maintenance dredging disposal of spoil. It was acknowledged in the PER that drop video sampling was used to ground

Fremantle Ports Fremantle Port Inner Harbour and Channel Deepening Public Environmental Review Supplement and Response to Submissions
SINCLAIR KNIGHT MERZ PAGE 20 I:\WVES\Projects\WV03196\Deliverables\09_PERResponse\09_20090513\FremantlePER_PERSupplement_WV03196_Rev2.doc
truth seagrass habitat mapping within the region and that approximately 25 hectares of patchy seagrass beds (BPPH) will be effected or lost within the spoil ground.
DEC MEB Issue 1.4
There have been no studies undertaken to determine the long-term stability of any dredge material placed in the proposed new spoil ground. The two arguments provided to suggest that the dredge spoil would not be remobilised are: an observation by divers that there were no sand ripples apparent at the time of their site visit; and that the proposed disposal site includes a shallow depression (1-2m below the surrounding sea bed of Owen Anchorage) that contains finer sediments than the sand banks. These arguments are superficial and do not provide evidence of stability. Given that spoil will be deposited across the 150 ha disposal area up to 3 m thick, a thorough assessment of long-term spoil stability needs to be undertaken. This assessment should include the effects of water currents, storms, ship anchoring and propeller wash on the dumped dredge spoil. There should also be follow up surveys undertaken over subsequent years to confirm that the spoil has remained in place at the disposal site.
Proponent’s Response to DEC MEB Issue 1.4 The material proposed for offshore disposal comprises coarse sand and crushed limestone (Section 4.4.6.4, Figure 4-20 and page 4-44 of the PER). These materials are coarser than the seabed material that currently exists in the offshore disposal area and will be placed at deeper depths from which they will be dredged, therefore the Proponent contends that the seabed in the offshore disposal area will remain stable other than for localised disturbances caused directly by anchor drop and recovery and anchor chain drag, as is currently the case.
This assertion has been verified by modelling studies conducted by MP Rogers and Associates (Appendix D of this document). These studies included:
complete wave modelling of a moderate swell event and a severe storm event to determine wave conditions in the project areas.
estimate near-bed orbital velocities in the Deep Water Channel and the Proposed Spoil ground; and
estimates of the potential for sediment movement in the Deep Water Channel and the Proposed Spoil ground.
As validation of the modelling, measured waves at Fremantle Ports’ Deep Water Channel buoy compared well with output from the two modelled wave events. This wave buoy is very close to the area of interest and reinforces the validity of the 2GWAVE model used for this study. The swell and severe storm event were run for the existing bathymetry and again for a bathymetry including placement of a 3m layer of fill in the dredge spoil ground. This allowed any modifications to wave

Fremantle Ports Fremantle Port Inner Harbour and Channel Deepening
Public Environmental Review Supplement and Response to Submissions
SINCLAIR KNIGHT MERZ PAGE 21 I:\WVES\Projects\WV03196\Deliverables\09_PERResponse\09_20090513\Frema
conditions from the placement of the fill to be incorporated into estimates of wave induced currents.
Linear wave theory was used to estimate the near-bed wave induced orbital currents. Field work has assessed linear wave theory to overestimate orbital currents, which in the context of this study provides an over estimate of the predicted sediment movement. According to Steedman Science & Engineering (1992), orbital currents inferred using linear wave theory from parameters derived from the wave spectrum (Hs and Tz) are generally greater than their true value due to the directional spread in the wave climate. The greater the directional spread, the greater the orbital velocities tend to be over estimated. In strongly directional storm waves and swell, linear theory is believed to overestimate near-bed orbital currents by approximately 10%, while in confused sea-states this typically ranges up to 25% (Steedman Science & Engineering 1992).
The wave induced near-bed velocities were estimated for two wave events at the Deepwater Channel and the Proposed Spoil Ground as shown in (Table 3).
Table 3 Wave Induced Near-Bed Velocities for the Two Wave Events
In both events, orbital velocities were calculated to be significantly greater at the Deep Water Channel than at the proposed Spoil Ground location.
The orbital velocities generated by the different wave conditions were used to estimate the magnitude of sediment transport in the Deep Water Channel and at the Proposed Spoil Ground. The results of the modelling indicated that there was zero transport under the moderate swell event and minor sediment transport under a severe storm event at the Proposed Spoil Ground. Comparatively, the estimated sediment transport at the Proposed Spoil Ground was found to be significantly less than at the existing Deep Water Channel location.
Sediment movement in the Deep Water Channel was predicted to be approximately 190 m3/day during a severe storm. To put this rate in context, peak movement rates of approximately 2,500 m3/day have been estimated on Success Bank during the severe storm event (MRA 2007c). Maintenance dredging is only required in Success Channel every three to four years, when between 10,000 m3 and 20,000 m3 of material is removed on each occasion. The modelling in Deep Water Channel indicates sediment movement 8% of that on Success Bank, which is reflected by the fact

Fremantle Ports Fremantle Port Inner Harbour and Channel Deepening Public Environmental Review Supplement and Response to Submissions
SINCLAIR KNIGHT MERZ PAGE 22 I:\WVES\Projects\WV03196\Deliverables\09_PERResponse\09_20090513\FremantlePER_PERSupplement_WV03196_Rev2.doc
that maintenance dredging has never been required since the channel was first opened more than thirty years ago.
Sediment transport rates up to 45 m3/day were predicted in the proposed spoil disposal sites in the severe storm, which is 23% of that in the Deep Water Channel and 0.2% of that on Success Bank. It is therefore concluded that the proposed spoil ground will be stable in the long term, even under severe storm events.
The DEC has also requested follow up surveys to be undertaken over subsequent years to confirm that the spoil has remained in place at the disposal site. Notwithstanding that modelling indicates that the spoil ground will be stable in the long term, even under severe storm events, the Proponent commits to undertaking annual surveys of the spoil ground for two years after completion of spoil disposal activities. An additional survey of the spoil ground will also be undertaken in the event of a severe storm event exceeding a one in five year ARI within the two year period.
DEC MEB Issue 1.5
Table 4-13 gives distances from the proposed spoil ground to nearby sensitive habitats, but does not include the seagrass meadows adjacent to the disposal area or the Cottesloe Fish Habitat Protection Area.
Proponent’s Response to DEC MEB Issue 1.5 The information shown in Table 4-13 of the PER has been updated (Table 4) to show the distance and bearing to the seagrass meadows adjacent to the disposal area and the Cottesloe Fish Habitat Protection Area. The revisions are highlighted by asterisk.
Table 4 Distance From the Proposed Disposal Area Boundary to Sensitive Habitats
Location Distance (km) Bearing
Straggler Rocks 3.4 234º SW Reef between Straggler Rocks and Champion Rock 4.6 270º W Champion Rock 5.4 270º W Success Bank northern seagrass meadows (12 m contour) 2.0 180º S Mewstone Island 4.3 184º S Rowboat Rock 4.4 180º S Hall Bank 3.0 90º E Marmion Marine Park 15.4 7º N Shoalwater Islands Marine Park 26.4 175º S Seagrass meadows adjacent to disposal area* 0.0 - Cottesloe Fish Habitat Protection Area* 5.8 90º E
*revisions / additions

Fremantle Ports Fremantle Port Inner Harbour and Channel Deepening
Public Environmental Review Supplement and Response to Submissions
SINCLAIR KNIGHT MERZ PAGE 23 I:\WVES\Projects\WV03196\Deliverables\09_PERResponse\09_20090513\Frema
Assessment of sediment contamination DEC MEB Issue 1.6
Levels of TBT, organochlorine pesticides, polycyclic aromatic hydrocarbons and mercury in the inner harbour samples exceeded the NODGDM screening levels triggering elutriate testing to assess potential dissolution of contaminants from the sediments into the surrounding water through the dredging process (Section 4.4.6.2). However, the Proponent has not provided, in either the PER or Appendix B, the raw data to show which sites exceeded the screening levels. While elutriate testing was undertaken, and the Proponent has confirmed that mercury was included in the testing even though not stated in the PER, it is not clear whether the ten samples taken for elutriate testing included any of the sites with elevated contaminant concentrations or at what depths they were sampled to. The latter issue is particularly relevant to mercury as it was detected at very high concentrations in some of the 50 – 100 cm deep samples. Contamination by the organics was ubiquitous throughout the sediment profile. (A recent response from SKM suggests that none of the sites with elevated mercury levels were re-sampled for elutriate testing. This throws into doubt the representativeness of the elutriate testing results for assessing the suitability of the inner harbour sediments for reclamation at Rous Head.) Sites contaminated with mercury should be re-sampled for elutriate testing.
Proponent’s Response to DEC MEB Issue 1.6 The Proponent did not provide raw data in the PER or Appendix B in order to reduce the size of the PER document and make it more readable for public consumption; however as stated in PER Appendix B Section 6.1.1 the Proponent committed to providing raw data to anyone who requested it. Following meetings with the EPASU and DEC MEB on 12th and 17th March 2009, clarification of which sites have exceeded screening levels was provided and this information is summarised in Appendix A of this document.
In summary, the ten Inner Harbour sites re-sampled for elutriate testing included both the sites with elevated mercury levels above the EIL (Sites IH 1 and IH 15). Samples for elutriates were taken to the same depth of sediment as was taken during the initial sampling and therefore did include the same depth (50cm to refusal) where elevated levels were initially recorded. The only difference being that samples for elutriation included the entire depth of the sediment core sample rather than being split into surface and deeper sediments. It is concluded the locations and depth of sampling was appropriate for the intended removal of this sediment by dredging and the subsequent disposal to land reclamation. Results of the elutriation testing have demonstrated that dredging of this material is unlikely to release any contamination of mercury into the water column or in tail water discharge.
It is concluded that this sampling was sufficiently representative to adequately assess contamination of the sediments and that elutriation has subsequently demonstrated that dredging of

Fremantle Ports Fremantle Port Inner Harbour and Channel Deepening Public Environmental Review Supplement and Response to Submissions
SINCLAIR KNIGHT MERZ PAGE 24 I:\WVES\Projects\WV03196\Deliverables\09_PERResponse\09_20090513\FremantlePER_PERSupplement_WV03196_Rev2.doc
this material is unlikely to release significant levels of mercury into the water column or in tail water discharge. There is therefore no need for any further re-sampling of this sediment for mercury.
The reader is also referred to Appendix A of this document for further supporting information.
DEC MEB Issue 1.7
Levels of TBT and PAHs in the Entrance Channel sediments exceeded the screening levels, but again the Proponent has not indicated which sites exceeded the screening levels and put this into context with the sites re-sampled for elutriate testing (Section 4.4.6.3 and Appendix C).
Proponent’s Response to DEC MEB Issue 1.7 The reader is referred to Appendix A of this document for clarification of which sites have exceeded screening levels and which sites were re-sampled. See also response to DEC MEB Issue 1.6.
Re-sampling in the Entrance Channel was conducted at eight out of the original eleven sites including sites where elevated levels of TBT and PAHs were initially recorded. Results of the elutriation testing have demonstrated that dredging of this material is unlikely to release significant levels of TBT or PAHs into the water column or in tail water discharge.
This sampling has covered the majority of sites and is considered to be sufficiently representative to adequately assess the suitability of these sediments for reclamation at Rous Head. Elutriation testing has subsequently shown a low potential for release of TBT or PAHs during the dredging or reclamation. There is therefore no need for any further re-sampling of this sediment.
DEC MEB Issue 1.8
Elutriate testing of the Entrance Channel samples appears to have only been done for TBT and PAHs. Given the elevated arsenic concentrations picked up in the elutriates from the Inner Harbour sites, arsenic concentrations should also have been determined in the elutriates from the Entrance Channel samples. Samples from the Entrance Channel could be taken for testing arsenic concentrations in elutriate waters at the same time the Inner Harbour sediments are re-sampled.
Proponent’s Response to DEC MEB Issue 1.8 Elutriate testing of the Entrance Channel and Inner Harbour sediments focussed on the contaminants of concern based on levels that exceeded NODGDM screening levels in the initial testing. Entrance Channel samples showed that the contaminants of concern were TBT and PAHs and therefore the elutriate testing of the Entrance Channel was carried out for these contaminants

Fremantle Ports Fremantle Port Inner Harbour and Channel Deepening
Public Environmental Review Supplement and Response to Submissions
SINCLAIR KNIGHT MERZ PAGE 25 I:\WVES\Projects\WV03196\Deliverables\09_PERResponse\09_20090513\Frema
and did not include arsenic. Elevated levels of arsenic only became apparent as a result of the elutriate testing of the Inner Harbour sediments.
The Proponent did not believe that testing arsenic concentrations in elutriate waters at the same time as the Inner Harbour sediments was necessary at the time given that arsenic levels initially measured in sediment were lower in the Entrance Channel sediments compared to the Inner Harbour sediments (EC 2.2mg/kg arsenic and IH 4.0mg/kg arsenic 95%UCL).
The reader is also referred to Appendix A of this document for further supporting information.
DEC MEB Issue 1.9
In Section 4.4.6.4 the Proponent suggests that four sites have been sampled for the proposed dredge spoil disposal site. In fact only one site has been sampled from the disposal site, the other seven sampling sites fall outside the proposed boundaries (eg. Compare tables 2-1 and 2-2 of appendix C and see figures 2-4 and 4-3).
Proponent’s Response to DEC MEB Issue 1.9 As indicated in its response to Issue 1.3, the selection of the proposed spoil disposal area was undertaken in several stages and the process undertaken was consistent with the National Ocean Disposal Guidelines for Dredged Material (NODGDM).
Eight diver surveys were done within the original proposed spoil ground boundaries which spanned an area approximately three times that of the currently proposed spoil disposal ground in the PER (Figure 3-1, Appendix E of the PER). The sea dumping guidelines do not specify the number of sampling sites but rather suggest that the sites should be sufficient to adequately characterise the area for spoil disposal. In typical cases five to six locations are surveyed. In this case eight locations were selected for analysis.
Subsequent to the initial site selection study, the proposed offshore spoil ground was reduced in size and relocated further to the north-east to exclude shallower areas and better capture the deeper bathymetry of the region based on available information at the time.
Because the dredging program does not require the full capacity of the proposed spoil ground a smaller area was selected in the northern section, which is the subject of the PER. The subsequent shifting of the offshore spoil ground boundaries and the use of a sub-region for spoil disposal for the proposed dredging program means that only one of the original eight sampling location now lies within the designated area for disposal, however this does not mean that the area has not been adequately sampled. The entire offshore disposal area is what was characterised and as such is representative of the region for disposal. Once the spoil ground has been characterised and deemed suitable for disposal, it is considered unnecessary to further sub-sample smaller areas based on a

Fremantle Ports Fremantle Port Inner Harbour and Channel Deepening Public Environmental Review Supplement and Response to Submissions
SINCLAIR KNIGHT MERZ PAGE 26 I:\WVES\Projects\WV03196\Deliverables\09_PERResponse\09_20090513\FremantlePER_PERSupplement_WV03196_Rev2.doc
reduced disposal footprint. The entire offshore disposal area or any sub-section of it is considered acceptable for disposal.
Since no contamination was detected in any of these samples, the Proponent considers that there is no justification to further sample the proposed spoil disposal location within the spoil ground. These sampling results will be further subject to assessment under the sea dumping application submitted to DEWHA. The Proponent will conduct further sampling if required by DEWHA as part of the Commonwealth sea dumping approval process.
DEC MEB Issue 1.10
The EPA has been progressively applying an environmental quality management framework to the States coastal waters based on the National Water Quality Management Strategy Report 4 Australian and New Zealand Guidelines for Fresh and Marine Water Quality (ANZECC & ARMCANZ, 2000) and recommended through State Water Quality Management Strategy Report 6. This framework involves establishing the broad environmental values to be protected in the relevant waters and then to establish the environmental quality objectives (or measurable management targets) to be achieved, including the level of ecological protection to be achieved. These broad management goals represent the community’s aspirations for the area and should be established through a process of community consultation. The EPA has already established its position with respect to Perth’s metropolitan coastal waters through the document Perth’s Coastal Waters Environmental Values and Objectives (EPA 2000). The environmental values that the EPA considers should be protected in the area affected by the Fremantle Port Inner Harbour and Channel Deepening project are:
(a) Ecosystem health;
(b) Fishing and Aquaculture;
(c) Recreation and Aesthetics; and
(d) Industrial water supply
(Environmental quality criteria (i.e. water or sediment quality guidelines) are used as the performance indicators for determining whether the environmental quality objectives are achieved.) The EPA expects the proponent to discuss this project in the context of the environmental values and environmental quality objectives to be achieved for Perth’s coastal waters and to highlight those areas where the proponent has been unable to ensure the objectives will be met. The proponent should provide additional information to the EPA so that it can assess this proposal within the context of its environmental quality management framework.

Fremantle Ports Fremantle Port Inner Harbour and Channel Deepening
Public Environmental Review Supplement and Response to Submissions
SINCLAIR KNIGHT MERZ PAGE 27 I:\WVES\Projects\WV03196\Deliverables\09_PERResponse\09_20090513\Frema
Proponent’s Response to DEC MEB Issue 1.10 The Perth Coastal Waters Environmental Values and Objectives Working Document (EPA 2000) provides a framework aimed at protecting Perth’s coastal waters from the effects of pollution. This framework was based on the ANZECC and ARMCANZ (1994) guidelines and was developed in consultation with the community and stakeholders. It is noted that this was developed for long-term monitoring of chronic impacts, whereas any impact of light reduction from dredging and spoil disposal operations expected from this project are likely to be acute.
The DEC MEB contends that the environmental values that should be protected in the area affected by the Fremantle Port Inner Harbour and Channel Deepening project are:
Ecosystem Health: EQO 1 Maintenance of ecosystem integrity (naturally diverse and healthy ecosystems)
Fishing and Aquaculture: EQO 2 Maintenance of aquatic life for human consumption (seafood safe to eat)
Recreation and Aesthetics: EQO 3 Maintenance of primary contact recreation values (waters safe for swimming) EQO 4 Maintenance of secondary contact recreation values (waters safe for boating) EQO 5 Maintenance of aesthetic values (pleasant, attractive environment)
Industrial Water Supply: EQO 6 Maintenance of industrial water supply values (water suitable for industry use)
The environmental values relevant to this Project include Ecosystem Health, Fishing, Recreation and Aesthetics. There will not be aquaculture activities undertaken within the vicinity of project activities during dredging and disposal activities and the only industrial water supply intake within the vicinity of proposed project is located within the Rous Head Harbour, which has a moderate protection level and is not predicted to be adversely impacted.
Perth’s Coastal Waters Environmental Values and Objectives Working Document (EPA 2000) recognises three levels of protection of ecosystem integrity (‘High’, ‘Moderate’ and ‘Low’) within Perth’s coastal waters. Following the guidance of the Environmental Quality Criteria Reference Document for Cockburn Sound (2003-2004) (EPA 2005) these protection levels are defined as the following:
High protection: To allow small changes in the quality of water, sediment or biota (e.g. Small changes in contaminant concentrations with no resultant detectable changes beyond natural variation* in the diversity of species and biological communities, ecosystem processes and abundance/biomass of marine life).

Fremantle Ports Fremantle Port Inner Harbour and Channel Deepening Public Environmental Review Supplement and Response to Submissions
SINCLAIR KNIGHT MERZ PAGE 28 I:\WVES\Projects\WV03196\Deliverables\09_PERResponse\09_20090513\FremantlePER_PERSupplement_WV03196_Rev2.doc
Moderate protection: To allow moderate changes in the quality of water, sediment and biota (e.g. moderate changes in contaminant concentrations that cause small changes beyond natural variation in ecosystem processes and abundance/biomass of marine life, but no detectable changes from the natural diversity of species and biological communities).
Low protection: To allow for large changes in the quality of water, sediment and biota (e.g. large changes in contaminant concentrations causing large changes beyond natural variation in the natural diversity of species and biological communities, rates of ecosystem processes and abundance/biomass of marine life, but which do not result in bioaccumulation/biomagnification in near-by high ecological protection areas).
* Detectable change beyond natural variation nominally defined by the median of a test site parameter being outside the 20th and 80th percentiles of the measured distribution of that parameter from a suitable reference site.
The framework identifies the existing Fremantle Harbours, including the Rous Head harbour and Small Vessels harbour as having a Moderate level of protection (E3). The framework does not however, provide a level of protection for the Fremantle Inner Harbour. The Inner Harbour is considered to be ‘highly disturbed’ using the guidance criteria of ANZECC/ARMCANZ (2000), and has therefore been assumed to fall within a Moderate level of protection. A Moderate level of protection for the Inner Harbour was also used and accepted during maintenance dredging carried out by Fremantle Ports in 2003 (SKM 2003).
The majority of the waters surrounding Fremantle Port including Gage Roads, Owen Anchorage and waters north and offshore from Fremantle have been allocated a High level of protection (E2) (Figure 8).
The Environmental Quality Criteria Reference Document for Cockburn Sound (2003-2004) (EPA 2005) also provides guidance on the establishment of Ecological Quality Criteria (EQC) in Perth’s coastal waters. There are two main types of EQC that were adopted for Cockburn Sound (EPA 2005), which were also consistent with ANZECC/ARMCANZ (2000) guidelines. These EQCs will also be adopted for this Project, and are as follows:
Environmental Quality Guidelines (EQG) – these include thresholds such as the 95% and 99% levels of species protection guideline level for toxicants in water; the ANZECC/ ARMCANZ (2000) ISQG-low guideline trigger levels for toxicants in sediments; or the 80th or 95th percentile of data for selected physical and chemical stressors for impact versus suitable reference sites.
The Proponent acknowledges that a high level of protection applies for marine areas directly outside the harbour and outside the proposed reclamation area. The appropriate guideline for

Fremantle Ports Fremantle Port Inner Harbour and Channel Deepening
Public Environmental Review Supplement and Response to Submissions
SINCLAIR KNIGHT MERZ PAGE 29 I:\WVES\Projects\WV03196\Deliverables\09_PERResponse\09_20090513\Frema
toxicants in water outside the silt curtain at the discharge from the reclamation area will thus be the ANZECC/ARMCANZ (2000) trigger levels for protection of 99% of species.
If the EQG is not met, then a more detailed assessment against the EQS is required; and
Environmental Quality Standards (EQS) – threshold or numerical values that indicate a level beyond which there is a significant risk that the associated EQO has not been achieved and a management response is triggered. Such a response would include identification of source of exceedance and management/reduction of the stressor (e.g. contaminant load).
The value of primary contact recreation relates directly to “waters used for primary contact activities such as swimming, bathing and other direct water contact activities”. The guideline states that these waters should be “free from faecal contamination, pathogenic organisms and other hazards (e.g. poor visibility or toxic chemicals) to protect the health and safety of the user” (ANZECC/ ARMCANZ (2000) page 5-3). In this respect, the project is not expected to have an effect on any of these factors (faecal contamination, pathogenic organisms and other hazards) to the extent where health and safety of the user will be impacted. The dredging and return water discharge will not produce or release faecal contamination or pathogenic organisms. Toxicants in the sediment, and potentially released from the return water discharge, have been thoroughly investigated and are discussed in PER (SKM 2009a) and the PER Supplement (SKM 2009b) in relation to the ANZECC/ARMCANZ (2000) trigger levels for protection of 99% of species. The potential release of arsenic in return water has been discussed as a contaminant of concern for marine organisms; however, the levels are far below the guideline level (50 µg/L) for recreational purposes as given in ANZECC/ARMCANZ (2000, Table 5.2.3 page 5-9).
The impact to users of the swimming beaches to the north of the project are expected to be the presence of turbid water patches and not toxicants or pathogens. The Proponent acknowledges that turbidity from dredging and from reclamation return water may affect areas used for swimming, snorkelling and diving on beaches in the vicinity of the project.
The PER (SKM 2009a) identified predicted short term loss of visual amenity as patches of turbid water may be seen Bathers Beach, south of the harbour and as far north as Cottesloe; however, this is expected to be short term and spatially restricted (PER Section 6.4.4.2 page 6-14 and 6-15).
Additional modelling presented in this document has predicted that TSS levels will have the greatest impact on visual amenity at the Port Beach directly north of Rous Head reclamation. At this location TSS levels are predicted to reach 2 to 5 mg/L TSS during the November dredging scenario and up to 10 to 20 mg/L during the January scenario.
At Bathers Beach to the south of the harbour the modelling has predicted that TSS levels could reach 2 to 5 mg/L TSS during the November scenario and up to 5 to 10 mg/L during the January scenario. At Cottesloe the modelling has predicted that TSS levels will reach 2 to 5 mg/L during

Fremantle Ports Fremantle Port Inner Harbour and Channel Deepening Public Environmental Review Supplement and Response to Submissions
SINCLAIR KNIGHT MERZ PAGE 30 I:\WVES\Projects\WV03196\Deliverables\09_PERResponse\09_20090513\FremantlePER_PERSupplement_WV03196_Rev2.doc
the January scenario and approximately 2 mg/L during the November scenario. These results indicate that visual amenity is likely to be compromised particularly at the closest beaches, Port Beach and Bathers Beach, during the project. At Cottesloe beach there are likely to be short term reductions in visual amenity with periods of turbid water and an overall slight reduction in water clarity at times during the dredging activities. This is not expected to be a long term impact and is very unlikely to continue once dredging and discharge has ceased.
Recreational diving at the North Mole may be compromised by reduced visibility during the project however, for safety reasons, this area will be closed off to divers during the dredging and reclamation activities.
It should be noted that this modelling was conducted with no inclusion of mitigation measures such as a silt curtain to reduce TSS levels at the discharge point and it is therefore expected that the actual impacts will be greatly reduced from what was modelled. The guideline for visual clarity will be measured using Secchi disc depth in the plume from the Rous Head return water discharge to monitor the extent of the area impacted by the discharge. The reader is also referred to issue 1.13 for details of additional proposed management measures for recreation and aesthetics.
Recreational contact will be affected within the area directly impacted by dredging and reclamation activities, and adjacent to the reclamation return water discharge pipes. Boat anchoring, fishing, diving and swimming are currently prohibited in the areas to be dredged, i.e. in the Inner Harbour, Entrance Channel and Deepwater Channel, and for safety reasons 200 m exclusion zones will be declared around the proposed offshore disposal area and the reclamation area during the construction period.
Based on monitoring of previous maintenance dredging programs water quality is predicted to return to background levels at the boundary of the silt curtain which will extend to approximately 75 m beyond the discharge point. Therefore it is expected that beyond 75 m from the discharge point (outside the silt curtain) the environmental quality objectives for primary contact will be achieved. However, as discussed above this will be within the 200 m exclusion zones to be declared around the reclamation area during the construction period for safety reasons.
The Perth Coastal Waters framework identifies the area surrounding the Rous Head reclamation where the silt curtain is located as having High level of protection (E2). It is anticipated that the level of protection within the silt curtain is likely to be ‘moderate’ during reclamation activities and will return to ‘high’ on completion of the works. Figure 9 illustrates the location of the silt curtain. Monitoring within the silt curtain will be undertaken to ascertain when the area returns to the ‘high’ level of protection.

Fremantle Ports Fremantle Port Inner Harbour and Channel Deepening
Public Environmental Review Supplement and Response to Submissions
SINCLAIR KNIGHT MERZ PAGE 31 I:\WVES\Projects\WV03196\Deliverables\09_PERResponse\09_20090513\Frema
The management strategies presented in Section 6 of the revised DSDMP (Rev 5) have been developed to ensure that the dredging, disposal and land reclamation works are undertaken in a manner consistent with the LEPs, EVs, EQOs and EQCs of Perth’s Coastal Waters as determined by EPA in consultation with the community and stakeholders. The relevant EVs, EQOs and EQCs for the Fremantle Port area are outlined in Table 5 in this document, along with the management strategies that will be applied in this Project to meet these objectives and reference to sections of the DSDMP where these are described.

Fremantle Ports Fremantle Port Inner Harbour and Channel Deepening Public Environmental Review Supplement and Response to Submissions
SINCLAIR KNIGHT MERZ PAGE 32 I:\WVES\Projects\WV03196\Deliverables\09_PERResponse\09_20090513\FremantlePER_PERSupplement_WV03196_Rev2.doc
Figure 8 Location of Ecological Protection Areas

Fremantle Ports Fremantle Port Inner Harbour and Channel Deepening
Public Environmental Review Supplement and Response to Submissions
SINCLAIR KNIGHT MERZ PAGE 33 I:\WVES\Projects\WV03196\Deliverables\09_PERResponse\09_20090513\Frema
Figure 9 Location of Rous Head Silt Curtain

Fremantle Ports Fremantle Port Inner Harbour and Channel Deepening
Public Environmental Review Supplement and Response to Submissions
SINCLAIR KNIGHT MERZ I:\WVES\Projects\WV03196\Deliverables\09_PERResponse\09_20090513\FremantlePER_PERSupplement_WV03196_Rev2.doc PAGE 34
Table 5 Perth’s Coastal Waters Environmental Values (EV) and Environmental Quality Objectives (EQO) with Corresponding DSDMP Management Strategies.
Environmental Value (EV) (from EPA 2000)
Environmental Quality Objectives (EQO) (from EPA 2000)
DSDMP Management Strategies DSDMP Sections
Ecosystem Health EQO1: Maintenance of Ecosystem integrity
Ecosystem integrity, considered in terms of structure and function, will be maintained throughout Perth’s coastal waters. The level of protection of ecosystem integrity shall be high (E2) throughout Perth’s coastal waters, except in areas designated E3 (moderate protection) and E4 (low protection).
Management strategy 1 – Water Quality, Sedimentation and Indirect Impacts to BPPH
Management strategy 2 – Direct Impacts to BPPH Management strategy 3 – Marine Fauna Management strategy 4 – Introduced Marine Pests Management strategy 5 – Contaminated Sediments and
PASS Management strategy 6 – Hydrocarbon Spills
6.1
6.2
6.3
6.4
6.5
6.6
Fishing and Aquaculture EQO2: Maintenance of aquatic life for human consumption.
Seafood will be safe for human consumption when collected or grown in all of Perth’s coastal waters except areas designated S2
Management strategy 1 – Water Quality, Sedimentation and Indirect Impacts to BPPH
Management strategy 5 –Contaminated Sediments and PASS
Management strategy 6 – Hydrocarbon Spills
6.1
6.5
6.6
Recreation and Aesthetics EQO3: Maintenance of primary contact recreation values
Primary contact recreation (eg. swimming) is safe in all of Perth’s coastal waters except areas designated S3
Management strategy 1 – Water Quality, Sedimentation and Indirect Impacts to BPPH
Management strategy 5 – Contaminated Sediments and PASS
Management strategy 6 – Hydrocarbon Spills.
6.1
6.5
6.6
EQO4: Maintenance of secondary contact recreation values
Secondary contact recreation (e.g. boating) is safe in all of Perth’s coastal waters except areas designated S4
Management strategy 1 – Water Quality, Sedimentation and Indirect Impacts to BPPH
6.1

Fremantle Ports Fremantle Port Inner Harbour and Channel Deepening
Public Environmental Review Supplement and Response to Submissions
SINCLAIR KNIGHT MERZ PAGE 35 I:\WVES\Projects\WV03196\Deliverables\09_PERResponse\09_20090513\FremantlePER_PERSupplement_WV03196_Rev2.doc
Environmental Value (EV) (from EPA 2000)
Environmental Quality Objectives (EQO) (from EPA 2000)
DSDMP Management Strategies DSDMP Sections
EQO5: Maintenance of aesthetic values
The aesthetic values of Perth’s coastal waters will be protected except in those areas designated S5
Management strategy 1 – Water Quality, Sedimentation and Indirect Impacts to BPPH
6.1
Industrial Water Supply EQO6: Maintenance of industrial water supply values
Perth’s coastal waters will be of suitable quality for industrial water supply purposes except in areas designated S6
Management strategy 1 – Water Quality, Sedimentation and Indirect Impacts to BPPH
6.1
Fremantle Ports Fremantle Port Inner Harbour and Channel Deepening Public Environmental Review Supplement and Response to Submissions
SINCLAIR KNIGHT MERZ PAGE 36 I:\WVES\Projects\WV03196\Deliverables\09_PERResponse\09_20090513\FremantlePER_PERSupplement_WV03196_Rev2.doc
DEC MEB Issue 1.11
Section 6.4.4.5 discusses the likely arsenic concentration in the tailwater discharge from the Rous Head reclamation site. A dilution of 3.6x is required to achieve the low reliability trigger value of 4.5 µg/L and it is suggested that this will be readily achieved through appropriate management. The management strategies to be employed to achieve this dilution are not described and therefore it is anticipated that the high levels of arsenic will be discharged to the coastal waters and dilution within these receiving waters will be the main mechanism to meet the trigger value. This suggests that a high level of ecological protection may not be met in the receiving waters in the vicinity of the tail water discharge and therefore the Proponent must clearly delineate the area where the environmental quality objectives will not be met. (Please note that background concentrations of arsenic in coastal seawater is approximately 1.9 µg/L, just as measured in the inner harbour.)
Proponent’s Response to DEC MEB Issue 1.11 The Proponent acknowledges that a high level of ecological protection is appropriate in the receiving waters outside the Rous Head reclamation area. Water quality, including concentration of arsenic was monitored at the reclamation area during the Fremantle Inner Harbour maintenance dredging conducted in 2003 (Figure 10). Analysis of sediment samples taken from the Inner Harbour before dredging started recorded arsenic concentrations ranging from 0.5 to 5.4mg/kg and the elutriate concentrations of arsenic ranged from 1 to 30 µg/L. Water quality sampling of the reclamation area during spoil disposal of the Inner Harbour dredge sediment showed that outside the silt curtain (OSC) arsenic levels had returned to background concentrations (Figure 11). Arsenic concentrations within the containment pond did not exceed 2.2 µg/L which is only slightly above the background concentrations of seawater (approximately 1.9 µg/L).

Fremantle Ports Fremantle Port Inner Harbour and Channel Deepening
Public Environmental Review Supplement and Response to Submissions
SINCLAIR KNIGHT MERZ I:\WVES\Projects\WV03196\Deliverables\09_PERResponse\09_20090513\FremantlePER_PERSupplement_WV03196_Rev2.doc PAGE 37
Figure 10 Rous Head Reclamation Area Monitoring Location in 2003
Figure 11 Arsenic Concentrations of Water Samples Taken from the Rous Head Reclamation Area 2003
Ref South
OSC
CP
DA
Ref North

Fremantle Ports Fremantle Port Inner Harbour and Channel Deepening Public Environmental Review Supplement and Response to Submissions
SINCLAIR KNIGHT MERZ PAGE 38 I:\WVES\Projects\WV03196\Deliverables\09_PERResponse\09_20090513\FremantlePER_PERSupplement_WV03196_Rev2.doc
The proposed silt curtain is similar to that used in the maintenance dredging and will extend to approximately 75 m beyond the discharge point. Based on the previous monitoring, the sediment to be dredged from the inner harbour during the proposed program (where arsenic concentrations ranged from 3.5 to 6.7 mg/kg and elutriate arsenic concentrations ranged from 3.1 to 26.1 µg/L) is predicted to also reach background levels outside the silt curtain. Therefore it is expected that beyond 75 m from the discharge point (outside the silt curtain) the environmental quality objectives will be achieved.
Sediment Plume Modelling Predictions DEC MEB Issue 1.12
It is stated in Section 6.3.5 that validation of the SWAN and GCOM3D models gave very good agreement between predicted and actual observations but the validation for the GCOM3D model only considered surface currents and not currents deeper in the water column. Surface currents tend to be mainly wind driven but they may not be the main determinant of sediment plume dispersion, particularly given that the highest concentrations of suspended sediment will be near the bottom of the water column. Validation must include currents deeper down the water column.
Proponent’s Response to DEC MEB Issue 1.12 Hydrodynamic Modelling Verification has been undertaken and the results of the verification presented within Appendix E. The report was prepared by GEMS and describes the method and results used to compare measured currents with predicted currents. The measured and predicted currents at surface (2 m) and seabed (17 m) are presented as examples and are in good agreement for both west-east and south-north directions. The results in the validation report demonstrate that the numerical model used to predict currents in the project area are reliably being represented.
As part of the validation process for the GCOM3D model both surface currents and currents across the full depth of the water column were measured (Fugro 2007). An RDCP600 current meter was deployed 2 m above the seabed in a water depth of 22 m in a location within the spoil ground area between 31st January 2007 and 27th February 2007. To accommodate shipping movements in the Gage Roads anchorage, the current meter was moved on 27 February 2007 to a new location within the spoil ground area with a water depth of 21.0 m and remained in this location until 29th March 2007. To prevent the build up of marine fouling, divers were employed to clean the meters every week and consequently the current meter gave 100% operational data return.
The current meter recorded a maximum current speed of 0.27 m/s at 3.0 m below LAT on 8th February 2007 at 17:01 PM in its initial location. Mean current speeds varied between 0.08m/s near the surface to 0.05 m/s near the seabed. Following its relocation the recorded maximum was 0.31m/s at, 2.0 m below LAT on 27 March 2007 at 17:31PM. Mean current speeds at the new location varied between 0.09 m/s near the surface and 0.06m/s near the bed. Figure 12 and Figure
Fremantle Ports Fremantle Port Inner Harbour and Channel Deepening
Public Environmental Review Supplement and Response to Submissions
SINCLAIR KNIGHT MERZ I:\WVES\Projects\WV03196\Deliverables\09_PERResponse\09_20090513\FremantlePER_PERSupplement_WV03196_Rev2.doc PAGE 39
13 show the measured currents through the water column over the two time periods. These indicate that the surface currents and the seabed currents are similar in magnitude at both sites.
Accordingly the Proponent considers that the validation of the SWAN and GCOM3D included both surface currents and currents deeper down the water column, and given that the models gave very good agreement between predicted and actual observations, there is no justification to undertake further validation.
The sediment plume model was validated using current data measured from the surface to the seabed in the vicinity of the offshore spoil disposal area, in the Inner Harbour (near to the railway bridge); PER Section 3.5 of Appendix G (SKM 2009a) states that “Data on both the currents in the lower reaches of the Swan River and in the open ocean, at the proposed spoil ground, were obtained for comparison with the ocean model predictions used in this study.” The offshore currents were measured using an ADCP at a site referred to as “CM1” in PER Appendix G (SKM 2009a) and this data was supplemented by surface currents measured by drifter tracking (see Appendix G Section 5.1 – Field Measurements).
The model was validated against full depth currents is stated in Appendix G Section 5.3.1; “GCOM3D was run for the period of measurements at CM1 producing half-hourly currents at each vertical level”.
The Proponent acknowledges that there is no discussion of current direction or similarity of modelled bottom currents with actual bottom currents; however, Figures 5-8 to 5-11 show good agreement obtained between GCOM3D predictions and measured data at CM1 for current speed and direction and the west-east and south-north components of the current, at 2 metres below the surface.

Fremantle Ports Fremantle Port Inner Harbour and Channel Deepening Public Environmental Review Supplement and Response to Submissions
SINCLAIR KNIGHT MERZ PAGE 40 I:\WVES\Projects\WV03196\Deliverables\09_PERResponse\09_20090513\FremantlePER_PERSupplement_WV03196_Rev2.doc
Figure 12 Current Speed Exceedance Profile Plot 27 February 2007 to 29th March 2007

Fremantle Ports Fremantle Port Inner Harbour and Channel Deepening
Public Environmental Review Supplement and Response to Submissions
SINCLAIR KNIGHT MERZ I:\WVES\Projects\WV03196\Deliverables\09_PERResponse\09_20090513\FremantlePER_PERSupplement_WV03196_Rev2.doc PAGE 41
Figure 13 Current Speed Exceedance Profile Plot 31 January to 27 February 2007

Fremantle Ports Fremantle Port Inner Harbour and Channel Deepening Public Environmental Review Supplement and Response to Submissions
SINCLAIR KNIGHT MERZ PAGE 42 I:\WVES\Projects\WV03196\Deliverables\09_PERResponse\09_20090513\FremantlePER_PERSupplement_WV03196_Rev2.doc
DEC MEB Issue 1.13
Section 6.4.4.2 discusses the sediment plume modelling predictions and the model outputs are shown visually in Figures 6-7 to 6-12. The discussion is restricted to considering effects of the plume on benthic habitat and does not consider effects in the context of the broader environmental value of ecological health or in the context of the more social environmental value of recreation and aesthetics. The metropolitan beaches are heavily used over the spring, summer and autumn periods and modelling suggests that there will be visible plumes extending at least to City Beach for 50% of the time, but that turbid patches of up to 30 mg/L may reach Cottesloe from time to time. It is noted that background TSS is closer to 2 mg/L so these plumes would be >10x background and highly visible. The Proponent should plot the TSS contours for the furthest extent of the plume predicted for 5% of the time (ie. 1 in 20 days) to give a better indication of how far the sediment plume may travel over these shorter periods in time (worst case), although because the modelled TSS outputs are averaged, they will not capture these short term excursions very well.
Proponent’s Response to DEC MEB Issue 1.13 Benthic communities (BPPH) are the most sensitive habitat likely to be effected by the plume.
The DSDMP has been updated to address the broader context of environmental values of ecological health. A map has been produced showing the different levels of environmental protection based on the process outlined in the Environmental Protection Authority (2000) “Perth Coastal Waters - Environmental Values and Objectives” document. This identifies zones where the Proponent may not meet the EQC values and additional text has been added to discuss the broader context of ecological health. The reader is referred to the response for Issue 1.10.
The Proponent acknowledges that social environmental value of recreation and aesthetics may be affected for a short duration of the dredging by a visible plume. The Proponent has remodelled the sediment plumes to address the following issues raised by DEC: 1.13-1.17 and 1.22. Outputs of the remodelling are provided in plots within Section 2 of this document and include TSS plumes for 2mg/L at anytime in daylight hours that last for more than 3 hours to show the extent of the potential visible plume over the duration of the dredging and dredge spoil disposal program.
Short term peaks in TSS have also been modelled at key locations and are presented in the GEMS report for each of the three scenarios (PER Appendix G, pages 42, 45 and 48).
The Proponent acknowledges that the worst-case scenario predicted by sediment plume dispersion modelling would entail discrete plumes with temporary visible excursions as far north as Scarborough Beach. As stated in issues 1.20 & 1.21 the modelling has been undertaken assuming uncontrolled discharge of return water and as such the predicted extent of plume dispersion provide a worst case scenario. In reality, the settling of material in the reclamation area, the use of a

Fremantle Ports Fremantle Port Inner Harbour and Channel Deepening
Public Environmental Review Supplement and Response to Submissions
SINCLAIR KNIGHT MERZ I:\WVES\Projects\WV03196\Deliverables\09_PERResponse\09_20090513\FremantlePER_PERSupplement_WV03196_Rev2.doc PAGE 43
geotextile lined sea wall and deployment of silt curtains around the discharge point will significantly reduce the turbidity and plume dispersion resulting from the works.
The Proponent also notes that a similar scale dredging program was undertaken over a six month period commencing in January 1989 when approximately 1.8 Mm3 of dredge material was placed into reclamation at Rous Head. Monitoring of plumes by aerial photography at the time demonstrated that the extent of the dredge plume was limited to several hundred metres from the reclamation area (see Fig 6.1 of the PER).
Notwithstanding, plume modelling indicates that the major cause of elevated turbidity along beaches from Fremantle to Scarborough is likely to be from the discharge of turbid water from the proposed Rous Head reclamation area. Plume dispersion modelling was based on a scenario of ‘no additional management measures’ in place for the discharge of water from Rous Head. However, several measures/processes will further reduce turbidity in discharge water and potential impacts to visual amenity, including:
A robust silt curtain will be deployed at the Rous Head discharge point;
A geotextile layer will be used inside the bund wall that will allow some filtering of excess water through the bund wall and dispersion through a wide area, enhancing mixing and flushing;
A regulated weir box will be used to optimise settlement of fines from the discharge water;
Settling ponds may be created within the reclamation area to further reduce fines in discharged water; and
An additional silt curtain will be deployed within the reclamation area if water quality triggers are exceeded (and these exceedances are attributable to the discharge of water from Rous Head).
While there will be no health risks due to public use of waters within an area of visible plume, there may be a risk of impact to visual amenity and recreational use (snorkelling and diving) along beaches from Fremantle to Scarborough due to elevated turbidity. The following management procedures will be implemented:
1) A 200 m exclusion zone declared around the reclamation area during the construction period for safety reasons.
2) Public notices will be issued prior to commencement of dredging and reclamations activities (e.g. newspaper notices) stating:
a description of the dredging works and their purpose;
the duration of the dredging works;
that no health risks are posed by the reduction in water clarity; and

Fremantle Ports Fremantle Port Inner Harbour and Channel Deepening Public Environmental Review Supplement and Response to Submissions
SINCLAIR KNIGHT MERZ PAGE 44 I:\WVES\Projects\WV03196\Deliverables\09_PERResponse\09_20090513\FremantlePER_PERSupplement_WV03196_Rev2.doc
the process for the public to make formal complaints about issues associated with the dredging works.
3) A complaints system shall be implemented to receive and respond to formal complaints, including confirmation of public complaints with site inspections at beaches where visual amenity and recreational values were stated to be impacted.
4) Management response measures to be implemented where visual amenity and recreational impacts are deemed attributable to the dredging and disposal activities, will be:
Implementation of physical control measures, e.g. use of weir box to optimise fines dispersion, deployment of additional silt curtain within reclamation area, additional settling ponds;
Temporary relocation of the dredge to an area where dredging causes less impact to visual amenity and recreational use values;
Minimisation of return water discharge at Rous Head during peak recreation periods (e.g. daylight hours on weekends & public holidays); and
Further public consultation to provide reassurance that the impact is temporary and that it presents no environmental or human health risk.
DEC MEB Issue 1.14
In Figures 6-7 to 6-12 the modelled TSS contours are mapped for the dredging and disposal locations. For the offshore disposal site the spoil will be dumped over the entire area of the proposed area, yet the TSS contours are centred around the middle of the disposal site. The same thing is apparent in the modelled sedimentation loading in Figures 6-15 – 6-17. This suggests that the modelling has not modelled sediment disposal across the entire 150 ha proposed disposal site, but only at a central location. If this is true, then the modelling outputs for TSS, sedimentation and zones of impact, effect and influence on BPPH will be incorrect. The Proponent should clarify the model input parameters and show that they properly reflect the actual dredging and disposal program.
Proponent’s Response to DEC MEB Issue 1.14 Dredge logs and spoil disposal plots were developed to simulate the most likely spoil disposal pattern based on the information available at the time. The intention of the dumping pattern was to simulate dumping in the deepest portion of the disposal ground and this is what was presented in the modelling within the PER.
The Proponent has undertaken re-modelling of offshore disposal of spoil, with the sediment disposal events spread evenly in a grid over the entire spoil disposal area rather than the deepest part of the spoil ground. The results of this remodelling are presented within Section 2 of this
Fremantle Ports Fremantle Port Inner Harbour and Channel Deepening
Public Environmental Review Supplement and Response to Submissions
SINCLAIR KNIGHT MERZ I:\WVES\Projects\WV03196\Deliverables\09_PERResponse\09_20090513\FremantlePER_PERSupplement_WV03196_Rev2.doc PAGE 45
document. The revised modelling shows no predicted TSS plume contours over the disposal area. This is because the spoil ground dumping comprises episodic events and the resulting TSS values (at 95%, 50% and 5%) are negligible, as a result of the plume from one dumping exercise dispersing before the next dumping occurs.
The plots showing impact on BPPH (Figure 16 and Figure 17) have been modified to take into account habitat loss due to depositional effects. Areas where predicted sedimentation is greater than 5,000 g/m2 have been assigned as Zone of Effect, areas where predicted sedimentation is greater than the 50,000 g/m2 contour have been assigned as Zone of Loss. The calculations of BPPH loss (Table 7) have been updated to reflect this predicted habitat impact.
At the northern boundary of the proposed disposal area the sedimentation contour is equivalent to 200,000 g/m2. This value equates to 11.8 cm of material being deposited using the specific gravity of 1.8 g/cm. The contour of 50,000 g/m2 equates to 2.8 cm of material being deposited. To account for the impact of sedimentation the 50,000 g/m2 contour has been used to predict loss of seagrass. Sedimentation of 5,000 g/m2 equates to 0.28 cm of material, and has been used to predict effect on seagrass. These predictions of loss and effect are a conservative over-estimation of the actual impact, seagrass in the area has shoot lengths in excess of 11.8 cm and would be capable of continuing to grow and survive these levels of deposition.
DEC MEB Issue 1.15
The modelled TSS contours around the outer channel for a January start (Figures 6-7 and 6-8) and a November start (Figures 6-11 and 6-12) show a smaller visible plume contour in the 50% of the time output than for the 95% of the time output. This is opposite to what would be expected and needs to be explained.
Proponent’s Response to DEC MEB Issue 1.15 The Proponent notes that the January and November TSS plumes showed a smaller visible plume contour in the 50% of the time output than for the 95% of the time output. The remodelling undertaken to address DEC MEB issues 1.13-1.17 and DEC MEB issue 1.22 has resulted in updated TSS plume maps presented in Section 2 of this document that do not have this issue.
DEC MEB Response to Issue 1.15
The proponent suggests that the remodelling has addressed this issue, but there are no modelled outputs for ‘50% of the time’. The proponent should be asked for the predicted TSS contours for the ‘50% of the time’ scenario.

Fremantle Ports Fremantle Port Inner Harbour and Channel Deepening Public Environmental Review Supplement and Response to Submissions
SINCLAIR KNIGHT MERZ PAGE 46 I:\WVES\Projects\WV03196\Deliverables\09_PERResponse\09_20090513\FremantlePER_PERSupplement_WV03196_Rev2.doc
Proponent’s Response to DEC MEB Issue 1.15 A series of plots were modelled where the TSS concentrations during daylight hours were present 95% of the time and for concentrations 50% of the time. The former is considered the most likely scenario, and the latter the worst case scenario. The best case scenario is that only direct loss of BPPH would occur in the dredging and disposal footprints.
The 95% plot is smaller than the 50% plot because the hourly outputs at each location have been interrogated such that a greater number of occurrence are required to satisfy the 95% criterion rather than 50%. It is recognised that the 50% plots are a median and do reflect the average conditions at any given location; however, there are a greater number of situations where the intensity is less than the target intensity intended to predict an effect. The 50% plot has a greater degree of variability around the mean and thus the plot is enlarged as a result of this.
The 95% of the time scenario is the most likely case because it best represents the research which has been undertaken in shading experiments on seagrass. Shading experiments are run with a given light reduction, for a set period of time, without removal of the shade cloths. As such, the threshold levels derived from these experiments are based on a continual given light intensity (100% of the time) for a period of time in the order of 3–5 months. The 95% of the time is a more conservative approximation of the continual conditions allowing for a slightly enlarged prediction zone.
The best research analysis would incorporate frequency of exposure, light intensity and exposure duration data, but so far no such research exists. Current shading experiments apply a given intensity of light (or rather reduction in light due to shading) for a given duration in months but do not remove the shade cloths, thus do not provide frequency predictions.
In addition to this, reductions in turbidity and consequential improvements in the light climate that result from changes in plume direction cannot be factored into this assessment. Notwithstanding, these changes will take place and the seagrass will benefit from the improved water quality, this add another degree of conservatism into the impact assessment.
The model has been made more conservative through limiting the modelling to periods when dumping or dredging events take place to minimise the effect of averaging predicted turbidity levels. The threshold levels chosen have a degree of conservatism built in as does the modelling. In addition to this the modelling does not take into account management measures intended to reduce the release and distribution of turbidity. For instance, at Rous Head the geotextile liner of the sea wall will contain a significant proportion of the turbidity within the reclamation area and the silt curtain surrounding the discharge are will further contain the turbidity to the marine environment immediately outside of the reclamation area. These measures will significantly reduce the intensity of turbidity making the modelled levels closer to a worst case scenario and as such an over estimate.

Fremantle Ports Fremantle Port Inner Harbour and Channel Deepening
Public Environmental Review Supplement and Response to Submissions
SINCLAIR KNIGHT MERZ I:\WVES\Projects\WV03196\Deliverables\09_PERResponse\09_20090513\FremantlePER_PERSupplement_WV03196_Rev2.doc PAGE 47
DEC MEB Issue 1.16
The modelled TSS contours are incomplete within the Swan River estuary.
Proponent’s Response to DEC MEB Issue 1.16 The coastline in the Swan River Estuary has been updated to resolve this issue and was included in the remodelling to address issues 1.13-1.17 and 1.22. Updated TSS plume maps are provided in Section 2 of this document.
DEC MEB Issue 1.17
The modelled sedimentation loading (Figures 6-15 to 6-17) shows sedimentation occurring over dry land north and south of the inner harbour. This raises into question the approach used for modelling and the accuracy of the sedimentation outputs and needs explanation.
Proponent’s Response to DEC MEB Issue 1.17 The Proponent notes that initial model grid also did not accurately represent the coastline north and south of the Inner Harbour; however, this does not detract from the accuracy of the sedimentation outputs in the wider area of the model. As discussed in issue 1.12 above the models gave very good agreement between predicted and actual observations. Furthermore the model used to model TSS has been validated against field data on previous projects and found to show very good agreement between predicted and actual observations of TSS. The model has been updated to better represent coastline for the remodelling to address issues 1.13-1.17 and 1.22. Updated TSS plume maps are provided in Section 2 of this document
DEC MEB Issue 1.18
The AMC dredging monitoring results are used in Section 6.4.4.3 to provide input parameters to the Rous Head discharge modelling and to suggest that the discharge is unlikely to cause significant elevations in TSS levels in the surrounding environment. The locations of the monitoring sites plotted in Figure 6-14 should be provided in a map to further illustrate the point being made.
Proponent’s Response to DEC MEB Issue 1.18
Refer to Figure 14 for locations of the AMC dredging monitoring sites. The results of the AMC dredge and outfall monitoring were used as the input for the TSS levels that might be expected in the discharge water from the Rous Head reclamation area. Samples taken at the discharge point and within the settlement pond were used as a basis to estimate approximately 30 mg/l TSS at the discharge point.

Fremantle Ports Fremantle Port Inner Harbour and Channel Deepening Public Environmental Review Supplement and Response to Submissions
SINCLAIR KNIGHT MERZ PAGE 48 I:\WVES\Projects\WV03196\Deliverables\09_PERResponse\09_20090513\FremantlePER_PERSupplement_WV03196_Rev2.doc
Figure 6-14 in the PER was used to indicate that samples taken at monitoring sites approximately 700m from the discharge point and over 2km remained at levels below approximately 5mg/l TSS and were similar to levels at sites over 4km distant throughout the period of dredging and discharge from reclamation.

Fremantle Ports Fremantle Port Inner Harbour and Channel Deepening
Public Environmental Review Supplement and Response to Submissions
SINCLAIR KNIGHT MERZ I:\WVES\Projects\WV03196\Deliverables\09_PERResponse\09_20090513\FremantlePER_PERSupplement_WV03196_Rev2.doc PAGE 49
Figure 14 Location of AMC Dredging Monitoring Sites

Fremantle Ports Fremantle Port Inner Harbour and Channel Deepening Public Environmental Review Supplement and Response to Submissions
SINCLAIR KNIGHT MERZ PAGE 50 I:\WVES\Projects\WV03196\Deliverables\09_PERResponse\09_20090513\FremantlePER_PERSupplement_WV03196_Rev2.doc
BPPH Assessment DEC MEB Issue 1.19
The modelled sedimentation loading in Figures 6-15 to 6-17 show that seagrasses north of the disposal site are predicted to experience some degree of smothering with up to a 30 mm thick layer of sediment. The impact of this sediment load is then dismissed as a major contributing factor to seagrass loss in the area without any technical justification. The Proponent needs to support this position with well justified and technically sound arguments. Firstly, it is highly likely that smaller seagrasses such as Halophila and Heterozostera may be buried, and secondly seagrasses in this area are at their depth limit and hence any reduction in light caused by suspended sediment plumes or through physical covering of the leaves by sediment will have significant effects and could lead to mortality if experienced over an extended period.
Proponent’s Response to DEC MEB Issue 1.19 The Proponent acknowledges that sediment loading to the north of the disposal site may potentially result in sediment falling out of suspension onto seagrass meadows from spoil disposal activities. Calculations based on the modelling indicate that in the worst case scenario (50,000 g/m2 in Figure 6-15 in the PER) sediment load would result in an increase of 30mm on the seagrasses up to approximately 300m north of the spoil ground, where seagrass is shown on the map. This is predicted to be the total amount of sediment that might fall out of suspension over the twenty weeks of spoil disposal.
Cabaço (2008) summarised experiments on the burial response of seagrasses to different levels of sedimentation. In an experiment on Posidonia sinuosa and Posidonia australis shoots were buried to 100, 150, 200 and 300 mm. A burial of 154 mm in P. sinuosa and 195 mm for P. australis caused 50% mortality. At the maximum burial (300 mm) total loss did not occur for either species.
Coupland (1997) conducted a study over eight weeks to measure the response of Amphibolis griffithii to short term burial by sediment. Amphibolis griffithii did not appear to exhibit a short term response to burial by sediment. There was no response to sedimentation to a level of 120mm or 160mm with no significant difference in the total amount of biomass. Coupland noted that A. griffithii had the potential to respond to sediment movement, evident in its structure and suggested it may respond to environmental changes, such as variation in sediment height, over longer time frames than the eight week study period. Leaf clusters on Amphibolis species are borne on the end of long vertical shoots and prevent burial of leaf meristem.
Halophila ovalis and Zostera marina (the latter similar in morphology to Heterozostera) were also included in the review by Cabaço (2008). Halophila ovalis suffered 100% mortality with 20mm of sedimentation. Zostera marina required 40mm of sedimentation to cause 50% mortality and 120mm sedimentation to cause 100% mortality. Halophila and Heterozostera are both coloniser

Fremantle Ports Fremantle Port Inner Harbour and Channel Deepening
Public Environmental Review Supplement and Response to Submissions
SINCLAIR KNIGHT MERZ I:\WVES\Projects\WV03196\Deliverables\09_PERResponse\09_20090513\FremantlePER_PERSupplement_WV03196_Rev2.doc PAGE 51
seagrass species and have less ecological function than climax genera such as Posidonia and Amphibolis that are more tolerant to sedimentation.
Based on the available literature, the 30 mm sedimentation that the model predicts up to 300m north of the spoil ground is 15–20% less than that required to cause 50% mortality to Posidonia or Amphibolis and will not cause long term impact to these species. There may however be short term impacts on Heterozostera and Halophila species within 300 m of the spoil ground. However, Heterozostera and Halophila are colonising genera that are removed by winter storms and recover during summer (Kirkman and Kirkman, 2000). Halophila has also been shown to be a rapid coloniser by Rasheed (2004). Given the small amount of sedimentation predicted over the twenty week timeframe the risk of burial by sediment is considered negligible. In instances where coloniser species are impacted by burial, this will occur immediately prior to the winter storms in which they are likely to be removed anyway and these species are likely to recover during the following summer months.
DEC MEB Issue 1.20
The development of thresholds for determining potential effects on seagrass is discussed in Section 6.5.4.3.2 and thresholds determined. The framework for applying the thresholds is not simple to understand, however, the thresholds appear to be based on reduced percentages of the estimated minimum light requirement for Posidonia sinuosa to survive. Unfortunately there does not appear to be a supportable rationale for the selected thresholds. The MEB is currently formulating its response, but is concerned that implementation of the thresholds may potentially result in mortality of seagrass in the predicted area of effect and in the area of influence, particularly in deep waters where seagrasses are already at or near their minimum light requirements. Recent seagrass shading experiments conducted on meadows well within their light tolerance limits on the west coast of WA indicate that recovery of seagrass shoot density after prolonged shading (>3 months) is only slight to nonexistent over the preceding 12 months.
Proponent’s Response to DEC MEB Issue 1.20 Refer to response to DEC MEB Issue 1.21 below.
DEC MEB Issue 1.21
In the PER the Proponent has undertaken the assessment of BPPH in accordance with EPA Guidance Statement 29, however the Proponent has incorrectly considered all benthic primary producers as a single combined category rather than considering seagrass, macro-algae and coral separately. For the Perth metropolitan coastal waters the benthic primary producer habitat has been comprehensively mapped and is broken down into macro-algae, seagrass and coral. Where the distributions of different types of benthic primary producer can be easily identified the EPA

Fremantle Ports Fremantle Port Inner Harbour and Channel Deepening Public Environmental Review Supplement and Response to Submissions
SINCLAIR KNIGHT MERZ PAGE 52 I:\WVES\Projects\WV03196\Deliverables\09_PERResponse\09_20090513\FremantlePER_PERSupplement_WV03196_Rev2.doc
expects the Proponent to undertake the assessment of BPPH loss on each type of benthic primary producer separately.
Proponent’s Response to DEC MEB Issues 1.20 and 1.21 The original water quality thresholds used for determining potential effects on seagrass as presented in the PER have subsequently been revised as a result of meetings with the DEC MEB on 12th and 17th March 2009 and subsequent phone and email conversations.
The previous thresholds used a minimum light requirement (MLR) of 8.5% of incident light reaching the seabed. This was determined to be appropriate because the seagrasses were healthy and had a very low epiphyte load on their leaves. Discussions with the DEC raised the issue that 10% of incident light was in their opinion considered to be more relevant to the seagrasses (Posidonia and Amphibolis) in the study area and would provide a greater level of conservatism in the impact assessment.
In addition, the decrease in the minimum light requirement that would lead to either an effect on the seagrasses or their loss was deemed unacceptable by the DEC. Instead of 30% of MLR leading to a measureable effect and 1% leading to loss the DEC considered that the MLR should be the threshold for effect and 30% for loss. These values are based on more recent seagrass studies published by Dr Paul Lavery of Edith Cowan University (Lavery, et al. 2006 and Collier 2006).
Consequently the threshold levels were recalculated based on these recommendations and form a more conservative prediction of seagrass impacts.
The changes in Table 6 have been made to the thresholds originally presented in the PER:
Table 6 Threshold Comparison between PER and PER Supplement
Threshold Details Originally Presented in PER Revised in PER Supplement
Light attenuation for Posidonia and Amphibolis integrated with depth.
Minimum light requirements (MLRs) of 8.5%
Minimum light requirements (MLRs) of 10%
TSS in the water column Based on 95% of the time including downtime (i.e. dredging or dumping) included.
Based on 95% of the time with downtime (i.e. no dredging or dumping) removed.
Zone of Permanent Loss 0–1% of MLR 0–30% of MLR Zone of Effect 1–30% of MLR 30–100% of MLR Zone of Influence 30%--100% of MLR 100% of MLR - 2mg/L (modelled).
Figure 15 illustrates the use of trigger values in conjunction with the modelling to establish areas of Potential Impact (Threshold 1, Permanent Loss) Zone of Potential Effect (Threshold 2, short term impact but no long term loss) and the Zone of Potential Influence (Threshold 3, increased

Fremantle Ports Fremantle Port Inner Harbour and Channel Deepening
Public Environmental Review Supplement and Response to Submissions
SINCLAIR KNIGHT MERZ I:\WVES\Projects\WV03196\Deliverables\09_PERResponse\09_20090513\FremantlePER_PERSupplement_WV03196_Rev2.doc PAGE 53
turbidity but no short term impact or long term loss). The modelling output for loss of light caused by increased TSS has been used to predict these three zones based on the threshold values for each seasonal scenario. These zones have then been used with the BPPH mapping to calculate the area of habitat affected by each zone for each scenario.
A description of how the zone boundaries were generated is provided in Appendix B.

Fremantle Ports Fremantle Port Inner Harbour and Channel Deepening Public Environmental Review Supplement and Response to Submissions
SINCLAIR KNIGHT MERZ PAGE 54 I:\WVES\Projects\WV03196\Deliverables\09_PERResponse\09_20090513\FremantlePER_PERSupplement_WV03196_Rev2.doc
This page has been intentionally left blank

Fremantle Ports Fremantle Port Inner Harbour and Channel Deepening
Public Environmental Review Supplement and Response to Submissions
SINCLAIR KNIGHT MERZ I:\WVES\Projects\WV03196\Deliverables\09_PERResponse\09_20090513\FremantlePER_PERSupplement_WV03196_Rev2.doc PAGE 55
Area of Potential Impact Area of Potential Effect Area of Potential Influence
• Project Footprint plus predicted impact area
• Smothering of existing biota • Long-term alteration to benthos • Potential permanent loss of
habitat
• High turbidity • Reduced light levels below those
required by seagrasses for long-term health and survival
• Short-term impact on seagrass survival and growth rates predicted
• No long-term impact on seagrass survival and growth predicted
• Some increase in turbidity • Some reduction in light intensity but light levels
above minimum requirements for seagrasses • No short-term or long-term impact on seagrass
survival and growth predicted
Figure 15 Conceptual Illustration of BPPH Zones of Potential Impact, Effect and Influence
Seagrass Threshold 2 MLR for 95% of daylight hours over the
dredge/disposal period
Seagrass Threshold 1 30% of the MLR for 95% of daylight hours over the dredge/disposal period
Seagrass Threshold 3 2 mg/L during daylight hours for a 3 hour period during dredging/disposal

Fremantle Ports Fremantle Port Inner Harbour and Channel Deepening Public Environmental Review Supplement and Response to Submissions
SINCLAIR KNIGHT MERZ
PAGE 56 I:\WVES\Projects\WV03196\Deliverables\09_PERResponse\09_20090513\FremantlePER_PERSupplement_WV03196_Rev2.doc
This page has been intentionally left blank

Fremantle Ports Fremantle Port Inner Harbour and Channel Deepening
Public Environmental Review Supplement and Response to Submissions
SINCLAIR KNIGHT MERZ I:\WVES\Projects\WV03196\Deliverables\09_PERResponse\09_20090513\FremantlePER_PERSupplement_WV03196_Rev2.doc
As a result of the changes to the modelling, inclusion of effect of sedimentation load, and the updates to the seagrass thresholds the BPPH impacts have been recalculated in Table 7 and mapped in Figure 16 and Figure 17.
Table 7 Revised BPPH Loss Calculations
BPPH Loss Calculations
BPPH Management Unit (MU) Gage RoadsCategory E
Deep Water Channel
Category D
Coastal Unit Category C
November January
Total Size of Management Unit (ha) 6825 10521 6411
Types of Benthic Primary Producer Habitat
Dominant seagrass with macroalgae and coral
Macroalgae on limestone pavement, occasional seagrass
Dominant seagrass with macroalgae on
limestone pavement
Historical Area of BPPH (ha) 1108 1532 642
Current Area of BPPH (ha) 1050 1532 642
Total Estimated Historic BPPH Loss (ha and (%)) 58.0 5.2% 0.0 0.0% 0.0 0.0%
Potential Permanent Loss due to Project (ha and (%)) 99.0 8.9% 69.0 6.2% 22.0 1.4% 0.0 0.0%
Potential Permanent Loss due to Project (ha and (%)) Direct Impact 25.0 2.3% 25.0 2.3% 22.0 1.4% 0.0 0.0%
Potential Permanent Loss due to Project (ha and (%)) Indirect Impact 74.0 6.7% 44.0 4.0% 0.0 0.0% 0.0 0.0%
Potential Permanent Loss due to Project (ha and (%)) Seagrass 99.0 8.9% 69.0 6.2% 11.0 0.7% 0.0 0.0%
Estimated Historic BPPH Loss (ha and (%)) Seagrass 47.0 4.2% 47.0 4.2% 0.0 0.0% 0.0 0.0%
Potential Total Cumulative Loss Seagrass (Historical + this Project) (ha)
146.0 13.1% 116.0 8.4% 11.0 0.7% 0.0 0.0%
Potential Permanent Loss due to Project (ha and (%)) Macroalgae 0.0 0.0% 0.0 0.0% 11.0 0.7% 0.0 0.0%
Estimated Historic BPPH Loss (ha and (%)) Macroalgae 11.0 1.0% 11.0 1.0% 0.0 0.0% 0.0 0.0%
Potential Total Cumulative Loss Macroalgae (Historical + this Project) (ha)
11.0 1.0% 11.0 1.0% 11.0 0.7% 0.0 0.0%
Potential Permanent Direct Loss due to Project (ha and (%)) Coral 0.0 0.0% 0.0 0.0% 0.0 0.0% 0.0 0.0%
Estimated Historic BPPH Loss (ha and (%)) Coral 0.0 0.0% 0.0 0.0% 0.0 0.0% 0.0 0.0%

Fremantle Ports Fremantle Port Inner Harbour and Channel Deepening Public Environmental Review Supplement and Response to Submissions
SINCLAIR KNIGHT MERZ PAGE 58 I:\WVES\Projects\WV03196\Deliverables\09_PERResponse\09_20090513\FremantlePER_PERSupplement_WV03196_Rev2.doc
BPPH Loss Calculations
BPPH Management Unit (MU) Gage RoadsCategory E
Deep Water Channel
Category D
Coastal Unit Category C
November January Potential Total Cumulative Loss Coral (Historical + this Project) (ha)
0.0 0.0% 0.0 0.0% 0.0 0.0% 0.0 0.0%
Potential Total Cumulative Loss (Historical + this Project) (ha) 157.0 14.2% 127.0 11.5% 22.0 1.4% 0.0 0.0%
EPA Category and Loss Threshold (2004b) E 10% D 5% C 2%
Cumulative loss of BPPH loss in the Gage Roads management unit is estimated to be potentially between 11.5% and 14%, depending on the timing of the dredging. In the worst case, with dredging commencing in November, the potential BPPH loss from the proposal is estimated to be 99 ha seagrass habitat which is 8.9% of the total estimated historical seagrass BPPH in the management unit. This is comprised of 25 ha (2.3%) of direct loss in the proposed dredging, disposal and reclamation areas and 74 ha (6.7%) of indirect loss outside of the dredging, disposal and reclamation footprint. Theses indirect losses are primarily due to predicted turbidity affects resulting from dredging in the Inner Harbour and discharge from the Rous Head Reclamation area. Using the worst case scenario combined with an estimated historical loss of BPPH of 58 ha, the potential cumulative loss of BPPH in the management unit is 157 ha which represents a cumulative loss of 14.2% of the total estimated historical seagrass BPPH in the management unit.
The changes to the coastline resulting in loss of BPPH began as far back as 1897 with the opening of the Inner Harbour. It is therefore not feasible to obtain baseline habitat mapping or aerial photographs to accurately assess the historical area of BPPH or the habitat types lost. A worst case historical loss of 58ha was estimated within the Gage Roads Management Unit due to historical coastline changes in the PER (SKM 2009a). Further to this, analysis of existing BPPH coverage north and south of the historical loss estimated that it is likely that 47 ha (81%) of the historical loss was seagrass and 11 ha (19%) of the loss was macroalgae.
Modelling of sediment plumes has predicted that some indirect loss of BPPH, as a result of increased TSS levels, will occur outside the zones defined as the dredging footprint, spoil disposal ground and reclamation area. This predicted loss is based on a conservative estimate of the minimum light requirements for seagrasses found in the project area. Much of this loss is predicted for discharge from return water at the Rous Head reclamation area and, as it is not possible to quantify accurately the effect of management of turbidity, this was modelled as uncontrolled discharge of return water and as such the potential losses predict a worst case scenario.

Fremantle Ports Fremantle Port Inner Harbour and Channel Deepening
Public Environmental Review Supplement and Response to Submissions
SINCLAIR KNIGHT MERZ I:\WVES\Projects\WV03196\Deliverables\09_PERResponse\09_20090513\FremantlePER_PERSupplement_WV03196_Rev2.doc
The calculations of cumulative loss of BPPH in the Gage Road management unit for this project are conservative predictions and are likely to overestimate the true loss values. This is a deliberate attempt to be conservative and apply a precautionary principle at each stage of the impact assessment process. The proponent therefore considers that the true loss of BPPH within the Gage Roads management unit will be less than the 10% cumulative loss threshold given in EPA Guidance Statement 29, Benthic Primary Producer Habitat Protection.
The Proponent notes that, given the difficulty in reliable measurement of the area of some BPPHs and given the difficulty in determining the ecological significance of their loss, cumulative loss thresholds will not be considered as rigid limits and that the acceptability of BPPH loss will be based primarily on the overall risk to the ecosystem integrity within a defined management unit if a proposal were to be implemented. In cases where a proposal, if implemented, would pose little or no risk to the ecosystem and is consistent with the primary use of an area determined by Government or a relevant statutory management body then the EPA may consider exceedance of a cumulative loss threshold to be acceptable. In this context all historical losses in the Gage Roads management unit have been as a result of Government decisions to develop port and boating facilities in the management unit and the current proposal is consistent with this primary use of the area. Furthermore, given the conservative predictions of BPHH loss that are likely to overestimate the true loss values the Proponent considers the potential loss of BPPH does not pose a substantial risk to ecosystem integrity within the management unit.
As stated in Issue 1.13 the modelling has been undertaken assuming uncontrolled discharge of return water and as such the predicted extent of plume dispersion provides a worst case scenario. In reality, the settling of material in the reclamation area, the use of a geotextile lined sea wall and deployment of silt curtains around the discharge point will significantly reduce the turbidity and plume dispersion resulting from the works.
The Proponent also notes that a similar scale dredging program was undertaken over a six month period in 1989 when approximately 1.8Mm3 of dredge material was placed into reclamation at Rous Head. Similar impacts from proposed reclamation works are to be expected and recent habitat mapping in the Rous Head area shows benthic primary producer habitat exists within 100 m of the previous reclamation area. Monitoring of plumes by aerial photography during the 1989 dredging demonstrated that the extent of the dredge plume was limited to several hundred metres from the reclamation area and it is pertinent to note that mapping of BPPH as part of the PER investigations show seagrass habitat to exist in closer proximity to the previous reclamation area than the predicted zone of loss for the current proposal.
For the above reasons the proponent considers that the actual BPPH losses will be significantly less than predicted and that the predicted loss of each type of benthic primary producer will be less than the cumulative loss thresholds for BPPH from EPA Guidance Statement 29 in all management

Fremantle Ports Fremantle Port Inner Harbour and Channel Deepening Public Environmental Review Supplement and Response to Submissions
SINCLAIR KNIGHT MERZ PAGE 60 I:\WVES\Projects\WV03196\Deliverables\09_PERResponse\09_20090513\FremantlePER_PERSupplement_WV03196_Rev2.doc
units. Notwithstanding, the Proponent will undertake post dredging habitat mapping in the areas of predicted indirect loss to compare to pre-dredge conditions to verify the resultant loss of BPPH caused by the dredging and disposal activities. The Proponent maintains that the predicted loss is a conservative over-estimation, modelled on an unmanaged outfall and actual losses will not exceed the thresholds.
The predicted BPPH loss in the Deep Water Channel Management Unit is confined to the 22 ha of BPPH in the dredging footprint comprised of approximately 11 ha of seagrass and 11 ha of macroalgae habitat or 1.4% of the total BPPH in that area, which is well below the cumulative threshold criteria for the management unit. In respect of each BPPH type found in the management unit, it is predicted that 0.7% of seagrass habitat and 0.7% of macroalgae habitat may be lost. All of the potential losses within this management unit are from the direct impact of dredging the Deep Water Channel.
There is no predicted loss of BPPH in the Coastal Management Unit located north of Rous Head, which includes the Cottesloe Fish Habitat Protection Area.
Documentation of Light Attenuation and Turbidity, Calculation of Threshold Levels and a full breakdown of Predicted Turbidity Impacts are detailed within Appendix B of this document.

Fremantle Ports Fremantle Port Inner Harbour and Channel Deepening
Public Environmental Review Supplement and Response to Submissions
SINCLAIR KNIGHT MERZ I:\WVES\Projects\WV03196\Deliverables\09_PERResponse\09_20090513\FremantlePER_PERSupplement_WV03196_Rev2.doc
Figure 16 Potential Benthic Primary Producer Habitat Loss – Dredging Commencing in November

Fremantle Ports Fremantle Port Inner Harbour and Channel Deepening Public Environmental Review Supplement and Response to Submissions
SINCLAIR KNIGHT MERZ PAGE 62 I:\WVES\Projects\WV03196\Deliverables\09_PERResponse\09_20090513\FremantlePER_PERSupplement_WV03196_Rev2.doc
Figure 17 Potential Benthic Primary Producer Habitat Loss – Dredging Commencing in January

Fremantle Ports Fremantle Port Inner Harbour and Channel Deepening
Public Environmental Review Supplement and Response to Submissions
SINCLAIR KNIGHT MERZ I:\WVES\Projects\WV03196\Deliverables\09_PERResponse\09_20090513\FremantlePER_PERSupplement_WV03196_Rev2.doc
DEC MEB Issue 1.22 As already discussed in comment 14 above, the modelled areas of effect and influence on BPPH appear to be centred around the middle of the offshore disposal site and, if so, may not reflect the effects of the actual spoil disposal operation where spoil will be deposited over the entire 150 ha disposal site.
Proponent’s Response to DEC MEB Issue 1.22 The reader is referred to response to DEC MEB Issue 1.14.
Management of potential impacts DEC MEB Issue 1.23
A major deficiency in section 6.4.5.1 is that there is no water quality monitoring program proposed and no water quality triggers described for the protection of benthic primary producers or for ensuring that the environmental values are protected throughout the area. The only reference to water quality thresholds is under the ‘Seagrass Monitoring’ discussion and this refers to Section 5.5. of Appendix H. The only water quality thresholds referred to in the skeleton water quality monitoring program described in Appendix H is for contaminants and nutrients discharged in tail water from the Rous Head reclamation and is unrelated to seagrass monitoring.
Proponent’s Response to DEC MEB Issue 1.23 A Water Quality Monitoring Program containing water quality triggers has developed thresholds within the revised DSDMP (Rev 5).
The water quality monitoring schedule will be incorporated in three parts:
Part One includes before and after surveys of water quality that align with the seagrass and coral monitoring and is used to set triggers for monitoring of seagrass and coral health;
Part Two outlines the monitoring at the Rous Head weir box outlet; and
Part Three involves obtaining water quality data from the Swan River Trust and Department of Water from the Swan River.
Part One
Pre-dredge survey of water quality parameters will be taken from each of the seagrass and coral health monitoring locations (except for those in the zone of loss) and will be correlated with estimates of seagrass and coral health. This survey will occur at least one month before dredging commences and will incorporate the following: Two light loggers will be deployed to obtain continual (30 minute) light measurements. One logger will be placed one meter from the bottom and the other placed five metres from the surface where depth allows. At shallower sites the

Fremantle Ports Fremantle Port Inner Harbour and Channel Deepening Public Environmental Review Supplement and Response to Submissions
SINCLAIR KNIGHT MERZ PAGE 64 I:\WVES\Projects\WV03196\Deliverables\09_PERResponse\09_20090513\FremantlePER_PERSupplement_WV03196_Rev2.doc
loggers will be set at the maximum distance achievable. The difference in light measurements between each logger will determine the light attenuation coefficient of that site.
Total Suspended Solids (TSS) measures the weight of water borne particles. Measurement of TSS is achieved by collecting a known volume of water and filtering it through a pre-weighed filter. The filter is dried and the increase in weight is the TSS measured in mg/L. As the majority of the dredge plume will be sediment and therefore inorganic, filters will be ashed to determine the organic and inorganic fractions. At the two coral locations, temperature loggers will also be installed to negate any loss of corals related to temperature.
During the dredging phase, light attenuation will be measured by loggers every 30 minutes; Total Suspended Solids (TSS) based on loss on ignition (LOI) methods will be measured weekly; and temperature will be measured by loggers every 30 minutes at the two coral locations.
The post dredge survey will include water quality parameters taken from each of the seagrass and coral health monitoring locations (except for those in the zone of loss) and will be correlated with estimates of seagrass and coral health (light attenuation, TSS/LOI and temperature at the coral sites). This survey will take place within two months of dredging concluding.
Part Two
Water quality monitoring will be initiated at the weir box outlet at Rous Head within two days of commencement of seawater discharge from the outlet. The reactive monitoring conducted at Rous Head has been devised on a risk based assessment of the type of contaminants found in the sediments of the Port area. From the elutriation and ecotoxicity tests, arsenic was the only contaminant that exceeded background concentrations. Lead, nickel and zinc were not above background but were above the detection limit. Therefore it was decided that all four contaminants should be examined in the reactive water quality monitoring at Rous Head. This monitoring will start within two days of the seawater discharge through the weir box and continue on a weekly basis until discharge ceases. Samples will be taken at four sites along a transect at increasing distance from the initial impact site. The transect will follow the approximate trajectory of the plume and therefore will be dynamic. The following parameters will be monitored: Dissolved metals (arsenic, lead, nickel and zinc) on a weekly basis; TSS/LOI on a weekly basis; and dissolved oxygen and temperature on a weekly basis.
Part Three
Part three includes obtaining water quality data from the Swan River Trust and the Department of Water. The Swan River Trust samples ten sites in the Swan River on a fortnightly basis for a number of parameters. The focus for the dredging program will be data on the light quality including measurements of turbidity, total suspended solids and secchi depth.

Fremantle Ports Fremantle Port Inner Harbour and Channel Deepening
Public Environmental Review Supplement and Response to Submissions
SINCLAIR KNIGHT MERZ I:\WVES\Projects\WV03196\Deliverables\09_PERResponse\09_20090513\FremantlePER_PERSupplement_WV03196_Rev2.doc
Triggers
Light attenuation based on the minimum light requirement (MLR) will be used as a trigger to further monitoring of both coral and seagrass health. Threshold values are based on a 10% MLR for seagrasses and a 20% MLR for corals both derived from the literature and with a conservative margin. Reductions in light (as an increase in the light attenuation coefficient) will trigger intermediate seagrass or coral monitoring (in addition to the before and after monitoring). The results of these will then direct management responses as outlined in Decision Tree charts in the revised DSDMP (Rev 5). These trigger values are based on a stepwise percentage increase above the MLR (see Table 8 and Table 9). The values in bold indicate where monitoring of seagrasses would be initiated as the level corresponds to the next impact zone. For instance, a 50% increase in light attenuation in the Zone of Influence equates to the threshold for the Zone of Loss where seagrass impact (reduction in shoot density) would be predicted. The triggers are calculated for one metre depth intervals, once the exact depth of the monitoring sites is known, specific values will be assigned. The coral trigger values are based on the same principle but a higher MLR is used based on the literature. It is intended to monitor the corals on the top of Hall Bank, thus the values associated with the depth interval of 6m have been highlighted in Table 9.
Table 8 Indicative Light Attenuation (m-1) Trigger Values based on 10% MLR Light Attenuation for Seagrasses
Water Depth (m)
Zone of Influence Zone of Effect Zone of Loss
MLR Threshold LAC
Triggers based on % increase in LAC Loss Threshold LAC 30% 40% 50% 60%
1 1.000 1.300 1.400 1.500 1.600 1.523 2 0.500 0.650 0.700 0.750 0.800 0.761 3 0.333 0.433 0.467 0.500 0.533 0.508 4 0.250 0.325 0.350 0.375 0.400 0.381 5 0.200 0.260 0.280 0.300 0.320 0.305 6 0.167 0.217 0.233 0.250 0.267 0.254 7 0.143 0.186 0.200 0.214 0.229 0.218 8 0.125 0.163 0.175 0.188 0.200 0.190 9 0.111 0.144 0.156 0.167 0.178 0.169
10 0.100 0.130 0.140 0.150 0.160 0.152 11 0.091 0.118 0.127 0.136 0.145 0.138 12 0.083 0.108 0.117 0.125 0.133 0.127 13 0.077 0.100 0.108 0.115 0.123 0.117 14 0.071 0.093 0.100 0.107 0.114 0.109 15 0.067 0.087 0.093 0.100 0.107 0.102 16 0.063 0.081 0.088 0.094 0.100 0.095 17 0.059 0.076 0.082 0.088 0.094 0.090 18 0.056 0.072 0.078 0.083 0.089 0.085

Fremantle Ports Fremantle Port Inner Harbour and Channel Deepening Public Environmental Review Supplement and Response to Submissions
SINCLAIR KNIGHT MERZ PAGE 66 I:\WVES\Projects\WV03196\Deliverables\09_PERResponse\09_20090513\FremantlePER_PERSupplement_WV03196_Rev2.doc
Table 9 Indicative Light Attenuation (m-1) Trigger Values based on 20% MLR Light Attenuation for Corals
Water Depth (m)
Zone of Influence Zone of Effect Zone of Loss
MLR Threshold
LAC
Triggers based on % increase in LAC Loss Threshold
LAC 10% 25% 50% 75%
1 0.699 0.769 0.874 1.048 1.223 1.097
2 0.349 0.384 0.437 0.524 0.612 0.548
3 0.233 0.256 0.291 0.349 0.408 0.366
4 0.175 0.192 0.218 0.262 0.306 0.274
5 0.140 0.154 0.175 0.210 0.245 0.219
6 0.116 0.128 0.146 0.175 0.204 0.183
7 0.100 0.110 0.125 0.150 0.175 0.157
8 0.087 0.096 0.109 0.131 0.153 0.137
9 0.078 0.085 0.097 0.116 0.136 0.122
10 0.070 0.077 0.087 0.105 0.122 0.110
11 0.064 0.070 0.079 0.095 0.111 0.100
12 0.058 0.064 0.073 0.087 0.102 0.091
DEC MEB Issue 1.24
A general outline of a seagrass monitoring program is described in Section 6.4.5.1, but there is no discussion of a monitoring program for the unique coral community at Hall Bank or for macroalgae. Sediment plume modelling provides a guide to where the plume may go and its intensity, but is not definitive. Because of the unique nature of the Halls Bank coral community in particular, and its location in the centre of the dredging and spoil disposal program, it is essential that FPA expands its monitoring program to include Hall Bank to confirm that there has been no impact from its harbour deepening program. This monitoring program will need to include water quality and the coral community itself.
Proponent’s Response to DEC MEB Issue 1.24 Sediment plume modelling predicts that the Halls Bank coral community would be located well outside of the Zone of Loss and Zone of Effect of the dredging and spoil disposal program. The Proponent notes DEC MEB’s comment that sediment plume modelling provides a guide to where the plume may go and its intensity, but is not definitive, however the Proponent also notes that a similar scale of dredging program was undertaken in 1989 when approximately 1.8 million m3 of

Fremantle Ports Fremantle Port Inner Harbour and Channel Deepening
Public Environmental Review Supplement and Response to Submissions
SINCLAIR KNIGHT MERZ I:\WVES\Projects\WV03196\Deliverables\09_PERResponse\09_20090513\FremantlePER_PERSupplement_WV03196_Rev2.doc
dredge material was placed into reclamation at Rous Head over a six month period. Monitoring of plumes by aerial photography at the time demonstrated that the extent of the dredge plume was limited to several hundred metres and did not extend to Hall Bank at any time (refer to Figure 6.1 of the PER). While it not possible to categorically state that these previous dredging and reclamation activities had no impact on corals at Hall Bank, it is pertinent to note that the corals continue to exist at this location.
Notwithstanding the above, the Proponent has revised the DSDMP (Rev 5) to include water quality and coral health monitoring to confirm that there has been no impact from its harbour deepening program.
A full description of the coral monitoring is given in Section 7 of the revised DSDMP (Rev 5).
DEC MEB Issue 1.25
There will need to be sufficient impact location monitoring sites and reference monitoring sites for each dredging and disposal location (one or two sites will not be sufficient).
Proponent’s Response to DEC MEB Issue 1.25 Additional impact location monitoring sites and reference monitoring sites have been included within the Water Quality Monitoring Program, Seagrass Monitoring Program and Coral Monitoring Program within the revised DSDMP (Rev 5).
A total of twenty-six sites are proposed for inclusion in the seagrass health monitoring programme, two sites are proposed in the coral health monitoring program. This would include duplicate sites in each of the zones at each region (Deep Water Channel, Offshore Disposal Area, Rous Head, north of the Harbour Entrance and South of the Harbour Entrance) and at reference sites (Table 10). There would be four shallow and four deep water reference sites that would be comparable with the depths of any potentially impacted locations.
The level of site replication proposed compares favourably with other recent monitoring programs including:
approximately 30 seagrass monitoring sites for the Cockburn Sound Environmental Protection Policy (Lavery and Westera, 2005; Cockburn Sound Management Council, 2007);
27 sites used in the monitoring the effects of the Geraldton Port dredging project (Westera, et al., 2007), and
22 sites used in a recent study on seagrasses in Geographe Bay (Barnes, et al., 2008).

Fremantle Ports Fremantle Port Inner Harbour and Channel Deepening Public Environmental Review Supplement and Response to Submissions
SINCLAIR KNIGHT MERZ PAGE 68 I:\WVES\Projects\WV03196\Deliverables\09_PERResponse\09_20090513\FremantlePER_PERSupplement_WV03196_Rev2.doc
Table 10: Number of Sampling Sites to be Used at Each of the Regions and Zones
Zone of Loss (ZoL)
Zone of Effect (ZoE)
Zone of Influence (ZoI)
Seagrass and WQ monitoring sites
Deep Water Channel - 2 2
Offshore Disposal Area - 2 2
Rous Head and North Harbour Entrance 2 2 2
South Harbour Entrance - 2 2
Coral health and WQ monitoring sites
Hall Bank - - 2 Note: It is proposed that 4 reference sites will be located in shallow water and 4 in deeper water with depths to be comparable to the monitoring sites; additional water quality sites will be located near the Rous Head weir box (see Section 7.2 of the DSDMP); there are no comparable reference sites available for the corals at Hall Bank. See Section 7.2 of the DSDMP for discussion of why ZoL sites are included within the Rous Head region only.
The twenty-eight site locations are presented in Section 7.2 of the revised DSDMP (Rev 5).
DEC MEB Issue 1.26
The only management trigger proposed for evaluating the results of seagrass monitoring in Section 6.4.5.1 is for a 50% reduction in shoot density to trigger an additional post dredging seagrass monitoring event. Firstly, a 50% reduction in shoot density is significant and, under certain circumstances, could constitute permanent loss and is not acceptable. Its adoption for management does not appear to have any basis and without justification its use cannot be supported. Shoot density measurements have been validated as a measure of health in Posidonia sinuosa seagrass meadows and suitable environmental quality guidelines have already been developed for monitoring the health of this species in Cockburn Sound, Warnbro Sound and Jurien Bay. The FPA should be encouraged to incorporate these guidelines and approaches into the FPA seagrass monitoring program for this project. Secondly, management actions need to be identified that will be implemented to minimise further impacts in the event that seagrass shoot density guideline triggers are not met. It should also be noted that in WA seagrass shoot density measurements have only been validated for monitoring the health of Posidonia sinuosa meadows.
Proponent’s Response to DEC MEB Issue 1.26 The Proponent has amended the management triggers following discussions with the DEC MEB and these are presented in Section 6 of the revised DSDMP (Rev 5).

Fremantle Ports Fremantle Port Inner Harbour and Channel Deepening
Public Environmental Review Supplement and Response to Submissions
SINCLAIR KNIGHT MERZ I:\WVES\Projects\WV03196\Deliverables\09_PERResponse\09_20090513\FremantlePER_PERSupplement_WV03196_Rev2.doc
The updated triggers and management actions that have been developed for this project are based on water quality exceedences in light attenuation that trigger seagrass shoot density counts and consequent management actions.
A before-after-control-impact (BACI) monitoring design is proposed which includes measures of benthic cover and a broad range of seagrass characteristics and is detailed in Section 7 of the revised DSDMP (Rev 5). Triggers for additional monitoring (during the dredging) will be based on exceedences in light attenuation that will trigger seagrass shoot density counts and coral monitoring. Light loggers will be deployed and downloaded weekly from combined seagrass (or coral) and water quality monitoring sites. A fourteen day rolling median will be used to trigger seagrass shoot density counts and additional coral photographic surveys. Management actions have been identified that will be implemented to minimise further impacts in the event that seagrass shoot density, or coral health, guideline triggers are not met.
Seagrass shoot density data from Cockburn Sound, Warnbro Sound and Jurien regions will be compared with data collected during seagrass monitoring. Seagrass data from other monitoring on the Western Australian coast will also be used for regional comparisons. The reader is referred to Section 7 of the revised DSDMP (Rev 5) for further details on the proposed Seagrass Monitoring Program.
DEC MEB Issue 1.27
Section 6.4.5.1 also outlines management actions that will be implemented under four different management levels, but there is no discussion explaining what these management levels are or what triggers their implementation. However, in Appendix H (Dredging and Spoil Disposal Management Plan) these are explained further in Figure 5-1. The triggers for each successive management level are based on reductions in seagrass shoot density. This approach has dredging activity continuing until seagrass shoot density has been reduced by > 50 % in the zone of influence and >80% in the zone of effect. These triggers are unacceptable. The zone of influence is where there may be slight perturbations in environmental quality beyond natural background, but their duration and intensity are not sufficient to cause detectable effects on biota or habitat. The zone of effect is the area where environmental quality perturbations beyond background may be predicted to cause sub-lethal effects on benthic biota, but no mortality or long term damage (see Section 6.5.4.3.1 of the PER for definition).
Proponent’s Response to DEC MEB Issue 1.27 The Seagrass Monitoring Program has been enhanced within the revised DSDMP (Rev 5). The design to be implemented is a Before After Control Impact Paired (BACIP) design. Monitoring sites will be located in three management zones based on the plume modelling: Zone of Loss (ZoL), Zone of Effect (ZoE) and Zone of Influence (ZoI). Monitoring will focus on the dominant

Fremantle Ports Fremantle Port Inner Harbour and Channel Deepening Public Environmental Review Supplement and Response to Submissions
SINCLAIR KNIGHT MERZ PAGE 70 I:\WVES\Projects\WV03196\Deliverables\09_PERResponse\09_20090513\FremantlePER_PERSupplement_WV03196_Rev2.doc
meadow forming seagrasses at each of the three regions of dredge influence (Spoil Ground, Deep Water Channel and Inner Harbour / Rous Head) and will be determined in the initial survey. These are likely to include Posidonia sinuosa, P. coriacea, Amphibolis antarctica, and A. griffithii that are prevalent in the temperate region of Western Australia. A full survey of water quality and seagrass characteristics would be conducted during two surveys (before and after dredging operations) to determine baselines of water quality and assess the any potential impact on seagrass health. Water quality sampling will be done weekly (see comment on Issue 1.23). The trigger values have changed in consultation with DEC and are based on changes in the light attenuation coefficient which will trigger management actions. Actions include changing dredging and disposal procedures to minimise the formation and dispersal of dredge plumes. Exceedance of thresholds also triggers intermediate monitoring of seagrasses or coral (i.e. in addition to the before and after monitoring).
If seagrass and / or coral health are impacted, further management actions will be implemented with a stop dredging response as the final management action. Full details of these procedures have been incorporated into the DSDMP (decision trees, trigger values). The trigger values were chosen based on the work of McMahon and Lavery (2008) and Collier (2006) and the potential for seagrasses to recover after an impact and also incorporate a conservative margin.
In the event that there are impacts greater than predicted, further surveys would be undertaken at relevant impact and reference sites twelve months after completion, and each twelve months thereafter until recovery is evident or for a five year period, whichever is the sooner.
The sampling design and techniques for seagrass health monitoring build on previous knowledge from a number of studies on the Western Australian coast. These include post-dredging monitoring of seagrass recovery in the Geraldton region (Westera, et al., 2007; Babcock, et al., 2008), a benchmark survey of seagrasses at Geographe Bay (Barnes, et al., 2008), assessments of seagrass health in the Perth metropolitan and Jurien regions (Lavery and Westera, 1998) and experimental studies on the effects of light limitation on Posidonia (Gordon, et al., 1994; Masini, et al., 1995; Collier, 2006) and Amphibolis (McMahon and Lavery, 2008).
Particular seagrass measures include: seagrass shoot density and height; seagrass leaves per shoot / cluster; seagrass above ground biomass; epiphyte biomass; and benthic cover from video transects.
Analyses will be used to test for differences in seagrass measures between times (before and after the dredging operation) and among zones [loss (ZoL), effect (ZoE), influence (ZoI) and reference sites]. Regional comparisons may also be appropriate (e.g. comparing seagrass measures between the Spoil Disposal Ground and the Deep Water Channel region) but will depend on the species present and depths being comparable. If there are no statistical differences among such regions the data may be pooled to increase statistical power. Data on shoot density, shoot height, seagrass

Fremantle Ports Fremantle Port Inner Harbour and Channel Deepening
Public Environmental Review Supplement and Response to Submissions
SINCLAIR KNIGHT MERZ I:\WVES\Projects\WV03196\Deliverables\09_PERResponse\09_20090513\FremantlePER_PERSupplement_WV03196_Rev2.doc
above ground biomass, leaf biomass, leaves per shoot or cluster, epiphyte biomass and the percent cover of climax seagrass species will be compared using univariate analyses. Data on the percent cover and composition of seagrasses, algae and other benthic types will be compared using multivariate analyses (multidimensional scaling, ANOSIM and SIMPER using the PRIMER statistical package).
DEC MEB Issue 1.28
Throughout this report the cumulative loss thresholds for BPPH from EPA Guidance Statement 29 are referred to as ‘allowable cumulative loss thresholds’ (eg. Section 6). These thresholds are guidelines that if exceeded trigger a more detailed examination of potential effects of loss of the BPPH. They are not standards that are not ‘allowed’ to be exceeded.
Proponent’s Response to DEC MEB Issue 1.28 The Proponent acknowledges that the terminology “allowable cumulative loss thresholds” is not in line with the Guidance statement. In all instances where the term “allowable cumulative loss thresholds” is written it should be read as “cumulative loss thresholds”.
The Proponent acknowledges that these thresholds will not be considered as rigid limits, but that cumulative loss thresholds will be used by the EPA as indicative of potential non-acceptability of the proposal. However, the Proponent also notes that in management units impacted by the proposal, limited or moderate damage/loss of BPPH and/or their associated BPP communities may be acceptable to the EPA where there are no feasible alternatives to avoid damage/loss and/or where proposals are consistent with use of the management unit that is consistent with a State Government decision.
DEC MEB Issue 1.29
Section 3.3.2. Only one of the spoil ground sample and seabed characterisation site (FPA2) is contained in the proposed spoil disposal area, not four sites.
Proponent’s Response to DEC MEB Issue 1.29 The reader is referred to response to DEC MEB Issues 1.3 and 1.9.
DEC MEB Issue 1.30
As already discussed above, the selected seagrass thresholds are likely to result in mortality of seagrass beyond the seagrass loss zone. Considerably more discussion is required around these thresholds.

Fremantle Ports Fremantle Port Inner Harbour and Channel Deepening Public Environmental Review Supplement and Response to Submissions
SINCLAIR KNIGHT MERZ PAGE 72 I:\WVES\Projects\WV03196\Deliverables\09_PERResponse\09_20090513\FremantlePER_PERSupplement_WV03196_Rev2.doc
Proponent’s Response to DEC MEB Issue 1.30 The reader is referred to response to DEC MEB Issue 1.20.
DEC MEB Issue 1.31
BPPH loss calculations should be undertaken for seagrasses, macroalgae and coral separately. This is already discussed in 21 above.
Proponent’s Response to DEC MEB Issue 1.31 The reader is referred to response to DEC MEB Issue 1.21.
Appendix H Draft Dredging and Spoil Disposal Management Plan (DDSDMP) DEC MEB Issue 1.32
This management plan is only a framework and does not contain the detail normally expected of a management plan.
Proponent’s Response to DEC MEB Issue 1.32 The PER was prepared in accordance the Proponent’s Environmental Scoping Document (Rev 6, January 2008) and EPA’s Guidelines for Preparing a Public Environmental Review/ Environmental Review and Management Programme (Version 5, 2008). Section 7.14 of the ESD stated a draft DSDMP would be provided with the PER to indicate the management framework. Furthermore the EPA’s guidelines only require a description of the environmental management system to be included in the environmental review documentation, unless the level of assessment is ERMP, at which time the EPA expects the proponent to prepare an EMP/ DSDMP for public review at the same time as the environmental review document. The level of assessment for the current proposal is not ERMP.
Notwithstanding, the draft DSDMP has been revised to include more detail. All sections have undergone revision, with expansion on detail where necessary, to provide the EMP rather than a framework. The key amendments have been made to the DSDMP are detailed within Section 3:
DEC MEB Issue 1.33
The DDSDMP does not acknowledge the EPA’s environmental quality management framework for the Perth metropolitan waters and set objectives to achieve the designated environmental values.

Fremantle Ports Fremantle Port Inner Harbour and Channel Deepening
Public Environmental Review Supplement and Response to Submissions
SINCLAIR KNIGHT MERZ I:\WVES\Projects\WV03196\Deliverables\09_PERResponse\09_20090513\FremantlePER_PERSupplement_WV03196_Rev2.doc
Proponent’s Response to DEC MEB Issue 1.33 EPA’s environmental quality management framework has been acknowledged with set objectives in the revised DSDMP (Rev 5) as per response to Issue 1.10.
DEC MEB Issue 1.34
The key performance indicators for maintaining water quality, sedimentation and benthic primary producer habitat are deficient (Section 4.1.4). The first KPI should be “Zero exceedance of predicted BPPH loss”. An additional KPI is “the environmental quality objectives and levels of ecological protection designated by the EPA should be met.”
Proponent’s Response to DEC MEB Issue 1.34 The Proponent notes the DEC MEB’s comment with respect to KPIs. Additional KPIs have been added to Section 5 and 6 of the DSDMP that include reference to “zero exceedance of BPPH loss beyond the project footprint and the Zone of Effect predicted by sediment plume dispersion modelling”. A tiered management system will be used to limit the chance risk of any impact to BPPH beyond that which is predicted to occur.
With regard to the addition of a KPI to state that “environmental quality objectives and levels of ecological protection designated by the EPA should be met” – this would not be fully achievable within the proposed project activity footprint and within the Zone of Effect predicted by sediment plume modelling. However, similar to the KPI above, the KPI for ‘maintaining environmental quality objectives and levels of ecological protection designated by the EPA’ will refer to “maintenance of environmental quality objectives and levels of ecological protection outside areas of exceedance predicted by sediment dispersion modelling”.
DEC MEB Issue 1.35
Given the discussions above, MEB does not agree that the risk of significant loss of seagrass outside the spoil ground boundary is low (Section 4.5.3).
Proponent’s Response to DEC MEB Issue 1.35 Additional modelling of the disposal events over the Proposed Spoil Ground has been undertaken. The disposal events have been modelled with disposal occurring over the entire Proposed Spoil Ground rather than the deepest section. As a result of the remodelling and the changes to the thresholds the TSS Plume Contour plots, Sediment Load plots and the BPPH habitat loss calculations have been updated. As a result of this the risks of seagrass loss have been reassessed and appropriate trigger values been incorporated into the revised DSDMP (Rev 5).
DEC MEB Issue 1.36

Fremantle Ports Fremantle Port Inner Harbour and Channel Deepening Public Environmental Review Supplement and Response to Submissions
SINCLAIR KNIGHT MERZ PAGE 74 I:\WVES\Projects\WV03196\Deliverables\09_PERResponse\09_20090513\FremantlePER_PERSupplement_WV03196_Rev2.doc
The key performance indicator for the offshore spoil ground (section 4.5.4) should be expanded to read “All material placed in designated spoil ground and demonstrated to remain within the boundaries of the spoil ground”. The following should also be included “No loss of BPPH outside the spoil ground boundary.”
Proponent’s Response to DEC MEB Issue 1.36 The Proponent notes that the sediment plume modelling shows that sedimentation will occur up to 300m north of the spoil ground boundary and therefore considers that a KPI of “All material placed in the designated spoil ground and demonstrated to remain within the boundaries of the spoil ground” is not achievable. Therefore, the KPI for offshore disposal will be that “all disposal activities will occur within the boundaries of the spoil ground”; similarly, the KPI for loss of BPPH from this disposal is “zero loss of BPPH beyond that predicted by the sediment dispersion modelling”.
DEC MEB Issue 1.37
Section 4.5.6 should include seagrass monitoring and in Section 4.5.7 DEC should be included in the reporting in relation to seagrass monitoring results and spoil ground stability.
Proponent’s Response to DEC MEB Issue 1.37 The revised DSDMP (Rev 5) Section 7 has been updated with details of the seagrass and coral monitoring programmes.
The DEC has also requested follow up surveys to be undertaken over subsequent years to confirm that the spoil has remained in place at the proposed spoil disposal area. Notwithstanding that modelling indicates that the proposed spoil disposal area will be stable in the long term, even under severe storm events, the Proponent commits to undertaking annual surveys of the spoil disposal area for two years after completion of spoil disposal activities. An additional survey of the spoil disposal area for will also be undertaken in the event of a severe storm event exceeding a one in five year ARI within the two year period. The DEC will be provided with results of this monitoring.
DEC MEB Issue 1.38
As already discussed, the Seagrass Health Monitoring and Reporting process (Section 5.2) is not acceptable and needs a substantial re-think.
Proponent’s Response to DEC MEB Issue 1.38 The Seagrass Monitoring Program has been updated in the revised DSDMP (Rev 5) as per response to DEC MEB Issue 1.27.

Fremantle Ports Fremantle Port Inner Harbour and Channel Deepening
Public Environmental Review Supplement and Response to Submissions
SINCLAIR KNIGHT MERZ I:\WVES\Projects\WV03196\Deliverables\09_PERResponse\09_20090513\FremantlePER_PERSupplement_WV03196_Rev2.doc
DEC MEB Issue 1.39
The Water Quality Monitoring Program (Section 5.6.1) is incomplete. Monitoring should ensure that the designated Environmental Quality Objectives are met. There would also be value in having a water quality trigger(s) that initiates management action to avoid seagrass mortality beyond the agreed zone of loss. Management triggers based on reductions in seagrass shoot density are too late to be effective. If there has been a reduction in shoot density then the damage has already occurred.
Proponent’s Response to DEC MEB Issue 1.39 The Water Quality Monitoring Program has been updated in the revised DSDMP (Rev 5) as per response to DEC MEB Issue 1.23 and 1.25 and meets the designated Environmental Quality Objectives and documents water quality triggers.
DEC MEB Issue 1.40
The water quality monitoring sites in Figure 5-2 are not acceptable as depicted. For example:
(a) reference sites must be located well away from potential effects of the dredging and spoil disposal program (the modelled boundaries only provide general guidance and may not be correct);
(b) contingency reference sites may be required in the event that the selected reference sites become impacted by the sediment plumes;
(c) a larger number of impact sites will require monitoring (eg. Consider the different zones, protection of Hall Bank coral community, Cottesloe Fish Habitat Protection Area)
(d) monitoring for the environmental value “Recreation and Aesthetics”.
Proponent’s Response to DEC MEB Issue 1.40 The Water Quality Monitoring Program has been updated in the revised DSDMP (Rev 5) as per response to DEC MEB Issue 1.23 and 1.25 and meets the designated Environmental Quality Objectives and documents water quality triggers.
DEC MEB Issue 1.41
Table 5-2 will need to be revised in light of any changes resulting from comments received on the PER. It is also noted that the Spoil Ground Bathymetry report is stated in the table to be within 2 months of completion of disposal activities, but in Section 4.5.7 it is within 2 months of the final

Fremantle Ports Fremantle Port Inner Harbour and Channel Deepening Public Environmental Review Supplement and Response to Submissions
SINCLAIR KNIGHT MERZ PAGE 76 I:\WVES\Projects\WV03196\Deliverables\09_PERResponse\09_20090513\FremantlePER_PERSupplement_WV03196_Rev2.doc
bathymetric survey being undertaken (which is 12 months after completion of all disposal activities).
Proponent’s Response to DEC MEB Issue 1.41 Table 5-2 of the DSDMP has been updated within Section 8 of the revised DSDMP (Rev 5) to respond to comments on the PER.
The Proponent confirms that the final bathymetric survey will be undertaken on completion of the disposal activities and the Spoil Ground Bathymetry report will be finalised within two months of completion of the disposal activities.
Furthermore, as stated in response to Issue 1.4, the Proponent will undertake annual surveys of the spoil ground for two years after completion of spoil disposal activities. An additional survey of the spoil ground will also be undertaken in the event of a severe storm event exceeding a one in five year ARI within two years of completion of the disposal activities.

Fremantle Ports Fremantle Port Inner Harbour and Channel Deepening
Public Environmental Review Supplement and Response to Submissions
SINCLAIR KNIGHT MERZ I:\WVES\Projects\WV03196\Deliverables\09_PERResponse\09_20090513\FremantlePER_PERSupplement_WV03196_Rev2.doc
4.2. WA Department of Environment and Conservation
DEC Issue 2.1:
Issue: Timing of dredging of Deep Water Channel and spoil disposal in the offshore disposal area could potentially impact on Humpback whales.
Recommendation
1) The dredging timetables presented in scenario 3, and to a lesser extent, scenario 2, on p2-31 would minimise potential impacts on Humpback whales.
2) The dredging timetable presented on p 2-31 for scenario 1 is not recommended. If dredging is to commence in September, then it is preferable that no dredging should occur in the Deep Water Channel nor any spoil disposal occur at the offshore disposal area between September and November. If any dredging operations are to occur between September and November, then these should be confined to dredging of the inner harbour and entrance channel with spoil disposal within the reclamation area at Rous Head.
Discussion:
The PER outlines on p 2-30 that dredging will begin in September 2009 subject to the availability of suitable dredges. The offshore coastal waters between Fremantle and Rottnest Island are used intensively by Humpback whales during their southern migration.
The peak of activity occurs between September and November with humpback whales generally present in this area from mid-August to mid-December.
DEC considers that deep water dredging and dredge spoil disposal could impact on Humpback whales. If dredging is to commence in September, then no dredging should be planned to occur in the Deep Water Channel nor any spoil disposal occur at the offshore disposal area between September and November. If any dredging operations are to occur between September and November, then these should be confined to dredging of the inner harbour and entrance channel with spoil disposal within the reclamation area at Rous Head. Given that dredging of the Deep Water Channel is predicted to take only two weeks and that over half of the total dredge spoil created is proposed to be disposed of at the reclamation are at Rous Head, this should be manageable in the overall program. If the Proponent believes that this is not manageable then dredging operations should be delayed and the timetables presented in either scenarios 2 and 3 presented on p 2-31 adopted instead.
It is noted that on p 6-71 that the Proponent has received advice from the Commonwealth Department of the Environment, Water, Heritage and the Arts regarding the potential impacts on Humpback whales. The PER, however, does not include the advice received from DEC on the draft

Fremantle Ports Fremantle Port Inner Harbour and Channel Deepening Public Environmental Review Supplement and Response to Submissions
SINCLAIR KNIGHT MERZ PAGE 78 I:\WVES\Projects\WV03196\Deliverables\09_PERResponse\09_20090513\FremantlePER_PERSupplement_WV03196_Rev2.doc
PER and in a subsequent meeting to discuss DEC’s comments on the draft PER. In DEC’s comments on the draft PER it was recommended that dredging of the Deep Water Channel should not occur during the southern migration of Humpback whales. In a subsequent meeting with the Proponent it was also recommended that spoil disposal should not occur at the offshore disposal area during this time. This advice is not discussed in the PER.
Proponent’s Response to DEC Issue 2.1 The Proponent acknowledges advice provided by DEC regarding potential impacts on Humpback whales from dredging in the Deep Water Channel and offshore disposal.
The spoil ground location is outside the known whale aggregation area and, although it is acknowledged that whales may move into this area during the peak southward migration season, the dumping of spoil can be managed if whales are observed to be in the area to reduce contact with the disposal plume. Furthermore dredge vessels are very slow moving, particularly in comparison to the numerous vessel movements (e.g. ferries) regularly occurring throughout the area and all year round.
The Proponent notes that dredging and offshore disposal activities have occurred for several years in the more sensitive whale migration areas of North West Australia without any reported incidents of injury, harm or impact on whales.
The Proponent has undertaken a preliminary risk assessment of potential impacts on whales resulting from the dredging and offshore disposal activities (Table 11):
Table 11 Potential Impacts on Whales Resulting from Dredging and Offshore Disposal Activities
It is the Proponent’s position that potential impacts to whales during sensitive periods (including September and November) can be managed via the implementation of a Whale Management Plan. Humpback whale southern migration occurs between October and November with a peak in mid- October (Jenner et al., 2001). In the event that dredging of the Deep Water Channel or offshore disposal occurs during this period a Whale Management Plan will be implemented. Details of the Whale Management Plan were provided in the DSDMP (Rev 3) Section 4.2 Management Strategy 2 – Marine Mammals p41. Whale management is also discussed in the PER on p6-74, and 6-76.

Fremantle Ports Fremantle Port Inner Harbour and Channel Deepening
Public Environmental Review Supplement and Response to Submissions
SINCLAIR KNIGHT MERZ I:\WVES\Projects\WV03196\Deliverables\09_PERResponse\09_20090513\FremantlePER_PERSupplement_WV03196_Rev2.doc
Key actions of the whale management plan are given below.
Prior to commencement of dredging activities, all crew will receive training from a qualified person. This training will include details of procedures to be followed in the event of whale sighting, injury or death. All sightings of whales will be recorded;
Whale observation and response procedures, including the application of a 300m exclusion zone from the dredge, will be implemented if dredging in the Deep Water Channel occurs during peak southern migration periods for humpback whales. A lookout will be maintained for whales when dredging and while the dredge sails between the dredging area and spoil ground.
In the event that a whale is sighted within the 300m exclusion zone, vessels speeds and direction will be adjusted to avoid impacting on the observed individual (within the safety constraints of the vessel);
The dredge pump will be stopped as soon as possible after completion of dredging. Where practical and within the requirements of the dredging operations, the drag head will not be lifted more than 4m above the seabed until the dredge pump is stopped;
Dredging and/or disposal activities will not resume until 15 minutes after whales have cleared the 300m exclusion zone from the dredge; and
Any impacts will be documented to record location, time, tide conditions, weather conditions, number of individuals involved, corrective action undertaken and preventative action proposed for ongoing dredging to reduce risks.
The Proponent is of the opinion that these measures will ensure that the risk of impacts to Humpback whales during the whale migration period will be very low. There is no need to exclude dredging in the Deep Water Channel, offshore spoil disposal between September and November, or confine dredging operations between September and November to the Inner Harbour and entrance channel with spoil disposal within the reclamation area at Rous Head.
DEC Issue 2.2
Issue: The Dredging and Spoil Disposal management Plan (DSDMP) is inadequate in addressing impacts on whales.
Recommendation
The DSDMP requires revision and expansion to properly address potential impacts on whales.
Discussion

Fremantle Ports Fremantle Port Inner Harbour and Channel Deepening Public Environmental Review Supplement and Response to Submissions
SINCLAIR KNIGHT MERZ PAGE 80 I:\WVES\Projects\WV03196\Deliverables\09_PERResponse\09_20090513\FremantlePER_PERSupplement_WV03196_Rev2.doc
The DSDMP (Appendix H. pp 42) outlines that a Whale Management Plan will be implemented if dredging occurs during the migration period for Humpback whales. The key actions of this management plan as outlined in the DSDMP are inadequate and do not provide sufficient detail on procedures to minimise impacts on whales. This should include procedures for marine mammal observation before the start-up of the dredge and before spoil disposal offshore, as well as procedures if a whale moves within a specified distance during dredging.
It is noted that this advice was provided in DEC’s comments on the draft PER and has not been adopted in the PER.
Proponent’s Response to DEC Issue 2.2 The Proponent acknowledges that advice was previously provided by the DEC regarding the Whale Management Plan. The Proponent also notes that the PER was prepared in accordance the Environmental Scoping Document (Rev 6, January 2008) which stated that a draft DSDMP would be provided with the PER to indicate the management framework.
Notwithstanding this the DSDMP has been revised and expanded to fully address potential impacts on whales. The reader is also referred to response to Issue 2.1 above.
DEC Issue 2.3
Issue:
Potential impacts on coral community at Hall Bank.
Recommendation:
A monitoring program should be developed and implemented to monitor potential impacts on corals at Hall Bank.
Discussion:
Hall Bank contains a regionally significant coral community. It is highly unusual to have such a high coral cover of species of the family Favidae in temperate waters. While the sediment plume modelling does not predict that Hall Bank will be impacted, these models are only predictions. Previous dredging operations such as the Geraldton port have demonstrated that dredge plumes do not always act as predicted. It is appropriate therefore that a monitoring program be developed and implemented to monitor potential impacts on corals at Hall Bank. This program should include appropriate triggers and management responses in the event that impacts are detected.

Fremantle Ports Fremantle Port Inner Harbour and Channel Deepening
Public Environmental Review Supplement and Response to Submissions
SINCLAIR KNIGHT MERZ I:\WVES\Projects\WV03196\Deliverables\09_PERResponse\09_20090513\FremantlePER_PERSupplement_WV03196_Rev2.doc
Proponent’s Response to DEC Issue 2.3 The Proponent notes this comment, which is similar to comments made by the DEC MEB and the reader is referred to response to DEC MEB Issue 1.24 for additional information on the proposed Coral Monitoring Program. This is also outlined in further detail in the revised DSDMP (Rev 5).
The Proponent also notes that a similar scale dredging program was undertaken in 1989 when approximately 1.8 million m3 of dredge material was placed into reclamation at Rous Head over a six month period. Monitoring of plumes by aerial photography at the time demonstrated that the extent of the dredge plume was limited to several hundred metres and did not extend to Hall Bank at any time (refer to Fig 6.1 of the PER). While it not possible to categorically state that these previous dredging and reclamation activities had no impact on corals at Hall Bank, it is pertinent to note that the corals continue to exist at this location.
SWT Issue 3.1
The primary concern of the Trust is the lack of water quality monitoring sites in the Swan Estuary upstream of Fremantle Harbour as part of the Dredging and Spoil Disposal Management Plan (DSDMP). Despite modelling predictions suggesting little impact of dredging activities in this area, two sampling sites upstream towards the Leeuwin boat ramp is prudent and is in line with the Proponent’s subscription to the Precautionary Principle.
Proponent’s Response to SWT Issue 3.1 Water quality data is collected by the Department of Water at a number of locations in the Swan River estuary on a fortnightly basis. As part of this program, the Department of Water also undertakes in-situ profiling of water quality parameters on behalf of the Proponent at the entrance to the Inner Harbour, upstream of the Inner Harbour near the railway bridge and at an upstream reference location located at Blackwall Reach (4km upstream from Inner Harbour and 2km from the Leeuwin Boat Ramp). The primary objective of this monitoring is to inform the Proponent of potential influences of the Inner Harbour on estuarine environmental conditions and vice-versa. This monitoring has been ongoing since 2001, and provides an excellent baseline for water and sediment quality in this region of the Swan Estuary.
The Proponent considers it unnecessary to include additional sites in the Swan Estuary upstream of Fremantle Harbour as part of the DSDMP over and above the sites already monitored by the Department of Water. The existing sites provide significant baseline data and the temporal data from the existing sites will have greater value than additional spatial data. In addition, light conditions and turbidity in the Swan River vary considerably on a daily basis and baseline temporal data is required to detect changes in detecting changes in water quality triggered by the dredging. Water quality parameters concentrating on water clarity will be the most beneficial to the dredging program, including total suspended solids, turbidity and secchi depth. The median TSS/secchi

Fremantle Ports Fremantle Port Inner Harbour and Channel Deepening Public Environmental Review Supplement and Response to Submissions
SINCLAIR KNIGHT MERZ PAGE 82 I:\WVES\Projects\WV03196\Deliverables\09_PERResponse\09_20090513\FremantlePER_PERSupplement_WV03196_Rev2.doc
depth/turbidity can be compared to 80th percentile of the background data at the relevant sites to determine if the values exceed the predicted values over the period of dredging. Reference sites will include those sites further upstream.
SWT Issue 3.2
Given tributyltin (TBT) has biological impacts at concentrations ~1 ng.Sn / L and levels of TBT in the water column reached 6 ng.Sn /L during the last harbour deepening, the Trust would like to see the environmental monitoring include biotic indices (e.g. gastropod imposex).
Proponent’s Response to SWT Issue 3.2 Some sediment samples collected from sites within the Fremantle Inner Harbour exceeded guidelines and subsequent testing of the bioavailability was undertaken by elutriate analysis. Elutriate testing of sediments was undertaken to evaluate the environmental risk of these concentrations that may occur during proposed dredging and disposal activities. All test data returned tributyltin water quality concentrations of <0.005µg Sn/L. As such, the risk of environmental impact on water quality of the Inner Harbour and its surrounds due to sediment tributyltin concentrations is considered to be negligible, and in turn, the risk of an impact to the biology, particularly imposex is considered very low.
As part of its Marine Quality Monitoring Program (MQMP), the Proponent has undertaken biannual mussel surveys, involving analysis of mussel tissue for contaminants, including TBT (refer to Figure 18). TBT concentrations in the areas to be dredged were within the range of 12ng/g to 20ng/g (Oceanica, 2008). According to Page and Widows (1991), TBT concentrations of less than 36ng/g produce no significant observable effect in adult mussels; all results were below this level. More importantly, since this monitoring commenced in 2001, the mean concentrations of TBT in mussels in the Inner Harbour has declined from a maximum of 300ng/g recorded in September 2002 to the current levels of less than 36ng/g.

Fremantle Ports Fremantle Port Inner Harbour and Channel Deepening
Public Environmental Review Supplement and Response to Submissions
SINCLAIR KNIGHT MERZ I:\WVES\Projects\WV03196\Deliverables\09_PERResponse\09_20090513\FremantlePER_PERSupplement_WV03196_Rev2.doc
Figure 18 Mean and Standard Deviation of TBT in Mussels at Defined Sampling Areas over the Duration of MQMP Monitoring
The Proponent therefore considers that an imposex monitoring program will not be necessary due to these very low potential for sediment tributyltin concentrations to become available for molluscs either up river or offshore of the Inner Harbour.
SWT Issue 3.3
Currently the DSDMP reporting schedule for water quality results is once monthly. Given the sensitivity of the area the Trust suggests immediate reporting of these results on a weekly basis as a project requirement.
Proponent’s Response to SWT Issue 3.3 The revised DSDMP (Rev 5) incorporates a detailed Water Quality Monitoring Program. Water quality monitoring will be conducted at seagrass and coral sites on a weekly basis and reported as fourteen day rolling medians each fortnight. Water quality monitoring at the weir box outlet at Rous Head will require samples to be tested at a NATA accredited laboratory, which will take approximately two weeks for analysis and therefore will not be available within a week for reporting. Reporting on a weekly basis is not considered feasible however reports would be provided on a fortnightly basis.

Fremantle Ports Fremantle Port Inner Harbour and Channel Deepening Public Environmental Review Supplement and Response to Submissions
SINCLAIR KNIGHT MERZ PAGE 84 I:\WVES\Projects\WV03196\Deliverables\09_PERResponse\09_20090513\FremantlePER_PERSupplement_WV03196_Rev2.doc
Additional reporting is scheduled if water quality analysis triggers intermediate monitoring responses.
SWT Issue 3.4
The Trust is concerned that the zone of potential impact ends abruptly at the end upstream border of the harbour, with no indication of zones of potential effect of influence. This again suggests limited consideration of the upstream impact of the project by the Proponents. There is the potential, particularly throughout Spring, for a subsurface plume to extend upstream in the denser marine waters as they push up into the estuary with decreased freshwater flow. The Trust queries whether this has been considered in model algorithms.
Proponent’s Response to SWT Issue 3.4 The zone of potential impact ending at the upstream border of the harbour is the edge of the dredging footprint and delineates the area of habitat loss due to dredging. The plume modelling predicts turbidity further upstream at levels that do not trigger the thresholds used to delineate the zones of potential effect or influence.
The effect of denser marine waters and freshwater flow are considered in the model algorithms. The denser marine waters are unlikely to be able to push a subsurface plume past the step change in the river depth that occurs downstream of the rail bridge. Further upstream the river flow is dominated by the freshwater flow.
The Proponent has recalculated the potential impacts using more conservative thresholds in response to issues 1.13-1.17, 1.20 and 1.22, the predicted TSS values and potential BPPH impact are mapped in Section 2 and Section 4 Issue 1.20 and 1.21 in this document. The remodelling does not show a zone of potential effect upstream of the dredging footprint. The zone of potential influence now represents the extent of visible plumes that are predicted at any time over the dredging activity during daylight hours lasting for greater than three hours and this visible plume is present upstream of the dredging footprint. The model shows that there are parts of the Swan River within the zone of influence (visible plume) but the extent of this zone does not impact on the Swan River protection areas of Alfred Cove, Pelican Point or Milyu.
SWT Issue 3.5
Modelling of these effects was validated against data collected by GPS drogues and acoustic doppler current profilers in February to April. This data seems pertinent to dredging scenario 3 only and therefore modelled plumes for other scenarios should be considered with some reservation.

Fremantle Ports Fremantle Port Inner Harbour and Channel Deepening
Public Environmental Review Supplement and Response to Submissions
SINCLAIR KNIGHT MERZ I:\WVES\Projects\WV03196\Deliverables\09_PERResponse\09_20090513\FremantlePER_PERSupplement_WV03196_Rev2.doc
Proponent’s Response to SWT Issue 3.5 In additional to the data collected by GPS drogues and acoustic doppler current profilers in February to April, the model was also validated using two continuous years of tide, wind and wave data and twelve months of current data (measured at the railway bridge at the upstream end of Fremantle Harbour). The data was collected by GPS drogues and acoustic doppler current profilers in February to April to validate the prediction of offshore currents. The model was able to use this data to demonstrate that both swell and sea conditions within the region were well-represented by the model.
There are no reasons why the data validation between February and April is not representative for data from other months in the year and the dredging start dates in September and November.
SWT Issue 3.6
Contingency plans for catastrophic equipment failure (e.g. burst spoil pipe) were not evident in the Public Environmental Review. Do management plans cater for responses to such events?
Proponent’s Response to SWT Issue 3.6 Section 6.4.5.1 of the PER and Section 6.1.2 of the revised DSDMP (Rev 5) address pipeline management issues including:
well maintained floating pipelines will be used to minimise leakage of turbid water during pumping of material to the reclamation area;
pipeline flow controls and inline monitoring will be utilised;
any leaks will be repaired as soon as practicable; and
pumping will stop as soon as any major ruptures are identified (within the operational constraints of the equipment).
The risk of a spoil pipe bursting is exceedingly rare as the pipe pressure is monitored using on-board pressure gauges and valves. In the event of a burst spoil line, pumping of dredge spoil would stop until the pipeline was repaired, or replaced, whichever the case may be. Each vessel has an onboard Emergency Response Plan and Spill Response Plan that is SOPEP (Shipboard Oil Pollution Emergency Program) compliant.
“Catastrophic” events beyond the control of the dredge contractor would result in implementation of Fremantle Port’s Incident Management Plan.
SWT Issue 3.7
It has been seen in the past that dredging and spoil plumes can travel for kilometres. Considering the volumes of spoil the Trust would like to see the use of a secondary control measure, beyond the

Fremantle Ports Fremantle Port Inner Harbour and Channel Deepening Public Environmental Review Supplement and Response to Submissions
SINCLAIR KNIGHT MERZ PAGE 86 I:\WVES\Projects\WV03196\Deliverables\09_PERResponse\09_20090513\FremantlePER_PERSupplement_WV03196_Rev2.doc
use of a weir box, to control discharge rates. With the intense schedule the silt curtain at Rous Head is likely to become clogged, resulting in overflow and increased turbidity in the surrounding environment. The Trust seeks confirmation that a second, full-sized curtain will be on hand and deployed prior to cleaning and upkeep of the primary curtain.
Proponent’s Response to SWT Issue 3.7 A silt curtain was used as part of the 2003 maintenance dredging at Rous Head and was effective, as water quality outside the silt curtain was not recorded above guideline levels. A secondary silt curtain was not required and the primary curtain did not become clogged.
For this program an impervious silt curtain will be deployed around the dewatering discharge point for the Rous Head reclamation. The design of this silt curtain is intended to achieve settling of sediments in the water column and to guide the flow of turbid water towards the seabed. With this design, it is irrelevant if the silt curtain becomes clogged and as such, a secondary full sized silt curtain is considered unnecessary.
Notwithstanding, if water quality monitoring outside the silt curtain exceeds management triggers a number of management options have been indentified within the revised DSDMP (Rev 5) Water Monitoring Program including the deployment of a secondary silt curtain internal to the settlement pond.
4.3. WA Department of Fisheries
DoF Issue 4.1
The areas proposed for dredging activities are not highly utilised for commercial fishing and although a significant amount of recreational fishing is undertaken, disruption is to be expected at times around a major port. Any interaction between this project’s proposed activities and fishing activity has been briefly but adequately addressed in Section 4.6.7 of the PER.
Proponent’s Response to DoF 4.1 The Proponent acknowledges this comment.
DoF Issue 4.2
A more significant concern to the Department is any direct impact or disruption to the movement of fish through this area into the Swan River as part of their breeding and migration cycle. Dredging induced turbidity and loss of benthic primary producer habitat are the main threats to these fish stocks and supporting species and unfortunately this is inevitable to some degree. However, the Department is satisfied that efforts have been made to reduce turbidity and the loss of seagrass as much as possible, including site selection of spoil site and proposed monitoring and management

Fremantle Ports Fremantle Port Inner Harbour and Channel Deepening
Public Environmental Review Supplement and Response to Submissions
SINCLAIR KNIGHT MERZ I:\WVES\Projects\WV03196\Deliverables\09_PERResponse\09_20090513\FremantlePER_PERSupplement_WV03196_Rev2.doc
measures, as outlines in Section 6.4.5.1 and in more detail in Appendix H. The plume modelling in Section 6.4.4.1 indicate elevated turbidity through dredging activities which is unlikely to have adverse impacts on the established coral communities at Hall Bank.
Proponent’s Response to DoF 4.2 The Proponent acknowledges this comment.
DoF Issue 4.3
With regards to the issue of introduced marine species, the Department of Fisheries should be consulted about the wording for the Ministerial environmental conditions with respect to applying appropriate biosecurity provisions related to any dredge, equipment and support vessels that are required for the project. As a general principal the vessels and equipment should be free of any potentially invasive biofouling. However, application of an appropriate risk assessment is required in order to determine the appropriate inspection and certification requirements.
Proponent’s Response to DoF 4.3 The Proponent acknowledges the Department’s request to be consulted regarding the wording of the Ministerial conditions, but is unable to influence this. The Proponent acknowledges the requirement to manage the risk of Introduced Marine Species and this is addressed in Section 6.4 of the revised DSDMP (Rev 5).
The Proponents approach to managing the risk of Introduced Marine Species is consistent with the National System for the Prevention and Management of Marine Pest Incursions. Specifically the Proponent has based its procedures on the draft biofouling management guidance document for non-trading vessels (including dredgers), Biofouling Management Guidance for Non-Trading Vessels (DoAFF 2008).

Fremantle Ports Fremantle Port Inner Harbour and Channel Deepening Public Environmental Review Supplement and Response to Submissions
SINCLAIR KNIGHT MERZ PAGE 88 I:\WVES\Projects\WV03196\Deliverables\09_PERResponse\09_20090513\FremantlePER_PERSupplement_WV03196_Rev2.doc
5. References Agriculture and Resource Management Council of Australia and New Zealand and the Australian
and New Zealand Environment and Conservation Council, 1994. National Water Quality Management Strategy, Policies and Principles - a reference document. Agriculture and Resource Management Council of Australia and New Zealand and the Australian and New Zealand Environment and Conservation Council, Canberra, ACT.
Barnes, P.B., Westera, M.B., Kendrick, G.A., Cambridge, M., 2008. Establishing benchmarks of seagrass communities and water quality in Geographe Bay, Western Australia. Project CM.01b. . University of Western Australia, School of Plant Biology, Perth, pp. 113.
Batiuk, R.A., Bergstrom, P., Kemp, M., Koch, E., Murray, L., Stevenson, J.C., Bartleson, R., Carter, V., Rybicki, N.B., Landwehr, J.M., Gallegos, C., Karrh, L., Naylor, M., Wilcox, D., Moore, K.A., Ailstock, S. and Teichberg, M. 2000. Chesapeake Bay submerged aquatic vegetation water quality and habitat based requirements and restoration targets: A second technical synthesis. CBP/TRS 245/ 00 EPA 903-R-00-014. U.S. EPA Chesapeake Program, Annapolis, Maryland.
Cabaço, S., Santos, R., Duarte, C.M., 2008. The impact of sediment burial and erosion on seagrasses: A review. Estuarine, Coastal and Shelf Science 79, 354-366.
Cockburn Sound Management Council, 2007. Cockburn Sound Environmental Quality Monitoring Program 2006/07. CSMC, Perth.
Collier, C.J. 2006. Characterising responses of the seagrass Posidonia sinuosa to changes in light availability. PhD Thesis. Faculty of Computing, Health and Science, Edith Cowan University.
Coupland, G., 1997. Rhizome and shoot structure, growth and response to sediment burial in Amphibolis griffithii (Black) Den hartog, Department of Botany. University of Western Australia, pp. 69.
Department of Agriculture, Fisheries and Forestry. 2008. Draft National biofouling management guidelines for non-trading vessels.
Gordon, D.M., Grey, K.A., Chase, S.C. and Simpson, C.J. 1994. Changes to the structure and productivity of a Posidonia sinuosa meadow during and after imposed shading. Aquatic Botany 47:265–275.

Fremantle Ports Fremantle Port Inner Harbour and Channel Deepening
Public Environmental Review Supplement and Response to Submissions
SINCLAIR KNIGHT MERZ I:\WVES\Projects\WV03196\Deliverables\09_PERResponse\09_20090513\FremantlePER_PERSupplement_WV03196_Rev2.doc
Environmental Protection Authority, 2000. Perth Coastal Waters - Environmental Values and Objectives. The position of the EPA - a working document. EPA, Perth, WA, pp. 26.
Environmental Protection Authority. 2002. Environmental Impact Assessment (Part IV Division 1) Administrative Procedures 2002.
Environmental Protection Authority, 2005. Environmental Quality Criteria Reference document for Cockburn Sound (2003 – 2004). A supporting document to the State Environmental (Cockburn Sound) Policy 2005. Environmental Protection Authority, December 2004.
Erftemeijer, P.L.A. and Lewis, R.R.R. .2006. Environmental impacts of dredging on seagrasses: A review. Marine Pollution Bulletin 52:1553–1572.
Fugro, 2007. Fremantle Ports Outer Harbour Marine Studies Programme, Oceanographic Measurements Summer 2007, 31 January 2007 to 29 March 2007.
Gordon, D.M., Grey, K.A., Chase, S.C., Simpson, C.J., 1994. Changes to the structure and productivity of a Posidonia sinuosa meadow during and after imposed shading. Aquat. Bot. 47, 265-275.
In-Situ Marine Optics. 2007. In-Lab determinations of light attenuation versus TSS and TSS versus NTU for a variety of sediment core samples. Prepared for Sinclair Knight Merz on behalf of Fremantle Ports.
Jenner K C S, Jenner M-N M & McCabe K A 2001. Geographical and temporal movements of Humpback whales in Western Australian waters. APPEA 38: 692-707.
Kirkman, H., Kirkman, J., 2000. Long-term seagrass meadow monitoring near Perth, Western Australia. Aquat. Bot. 67, 319-322.
Lavery, P., Westera, M., 1998. The environmental significance of seagrasses on Success Bank, Western Australia: Data report. Edith Cowan University, Perth.
Lavery, P., Westera, M., 2005. A Survey of Selected Seagrass Meadows in the Fremantle - Warnbro Sound Region 2005. Edith Cowan University, Centre for Ecosystem Management, Perth.
Lavery, P. , Babcock, R., Masini, R. and McMahon, K. 2006. Ecophysiology of Benthic Primary Producers. Pp 154–168. In: Keesing J.K. and Heine, J.N. (Eds). Strategic Research Fund for linkages program 260p.

Fremantle Ports Fremantle Port Inner Harbour and Channel Deepening Public Environmental Review Supplement and Response to Submissions
SINCLAIR KNIGHT MERZ PAGE 90 I:\WVES\Projects\WV03196\Deliverables\09_PERResponse\09_20090513\FremantlePER_PERSupplement_WV03196_Rev2.doc
Masini, R.J., Burt, J.S., Simpson, C.J., 1995. Light and Posidonia seagrass meadows in the temperate coastal waters of Western Australia. Department of Environmental Protection, Perth, pp. 17.
McMahon, K., Lavery, P., 2008. The responses of Amphibolis griffithii to reduced light availability. A report on the outcomes of the SRFME Collaborative Research Project: Ecophysiology of benthic primary producers. Edith Cowan University, Perth, pp. 151.
M P Rogers & Associates Pty Ltd (MRA) , 2007. Stage 1 and 2 Dredging Wave Modelling, R212 Rev 0. Prepared for Cockburn Cement Ltd, Perth Western Australia.
Oceanica, 2008. Fremantle Ports Marine Quality Monitoring Programme, Annual Report 2007-08.
Page, D. S. and Widdows, J. 1991, Temporal and spatial variation in levels of alkytins in mussel tissues: A toxicological interpretation of field data. Marine Environmental Research 32, 113-129.
Sinclair Knight and Merz (SKM) 2003. Fremantle Ports Inner Harbour Maintenance Dredging 2003 - Final Monitoring Report.
Sinclair Knight and Merz (SKM) 2006. Fremantle Ports – Long Term Dredging Strategy: Site Identification for an Ocean Disposal Area. Report prepared by SKM for Fremantle Ports.
Rasheed, M.A., 2004. Recovery and succession in a multi-species tropical seagrass meadow following experimental disturbance: the role of sexual and asexual reproduction. Journal of Experimental Marine Biology and Ecology 310, 13-45.
Steedman Science & Engineering, 1992. Technical Note No. 150, Wave Kinematics - Measurement,Modelling and Application, Steedman Science & Engineering, Perth, Australia.
Westera, M., Babcock, R., Fearns, P., 2007. Post dredging recovery of seagrass in the Geraldton region - I. Recovery and Impact. CSIRO Marine Research, Perth, Western Australia, pp. 47.
Westphalen, G., Collings, G., Wear, R., Fernandes, M., Bryars, S. and Chesire, A. 2004. A review of seagrass loss on the Adelaide metropolitan coastline. Adelaide Coastal Waters Study, technical report No. 2, August 2004.

Fremantle Ports Fremantle Port Inner Harbour and Channel Deepening
Public Environmental Review Supplement and Response to Submissions
SINCLAIR KNIGHT MERZ I:\WVES\Projects\WV03196\Deliverables\09_PERResponse\09_20090513\FremantlePER_PERSupplement_WV03196_Rev2.doc
This page has been intentionally left blank

Fremantle Ports Fremantle Port Inner Harbour and Channel Deepening Public Environmental Review Supplement and Response to Submissions
SINCLAIR KNIGHT MERZ PAGE 92 I:\WVES\Projects\WV03196\Deliverables\09_PERResponse\09_20090513\FremantlePER_PERSupplement_WV03196_Rev2.doc
Appendix A Assessment of Sediment Contamination – Supporting Information for Responses to DEC MEB 1.6, 1.7 and 1.8
A.1 Sampling methods and re-sampling for elutriate testing During the initial sampling, surface sediments (0 – 50cm sediment depth) were collected from 25 sites within the Inner Harbour and 10 sites from the Entrance Channel. Where possible, samples were also collected from deeper sediment (reported as 50 – 100cm). However, the core could not be taken to the full 100cm depth at any sites and the depth achieved was in most cases 70cm.
Sediment samples were collected by divers using 1m long polycarbonate cores. The cores were pushed into the sediment by the diver and, where required, tapped in further using a hammer. The depth of the core sample was dependant on the composition of material in the deeper sediment and the core in all cases penetrated until it hit harder underlying material and refused to be forced any deeper by the diver (this was termed refusal depth).
Since this material is to be removed from the Inner Harbour and Entrance Channel by dredge and placed in land reclamation by pumping of slurry there exists a risk that any soluble contaminants may be released into the water and thereby returned to the marine environment either during the dredging or in the water returned from de-watering of the reclamation area. The next appropriate step in the testing hierarchy was considered to be testing of elutriate samples to give an indication of the bioavailable (soluble) fraction that might be expected in the return water from the reclamation.
Sediments in the area to be sampled were generally comprised of a thin layer of sandy sediment overlying rocky substrate. Samples were taken to 50cm in most instances due to refusal; however, at some sites penetration to 60 to 80cm was possible. The same core sampling equipment, method and divers were used during the initial sediment sampling at the same sites and therefore it is assumed that sediment was sampled to the same relative depth for the elutriate sampling as was initially sampled.
The major difference with the elutriate sampling was that at each site, the entire depth of the core sample from surface sediment to the deepest depth of penetration possible (0 to refusal) was bulked into one combined depth sample rather than split.
The Fremantle Port Authority and dredging contractors have estimated that in this area of sandy sediments the dredge is likely to take between 60 to 80cm and possibly as deep as 1m sediment depth on each cut and this material will be thoroughly mixed as it is pumped into the hopper. It is
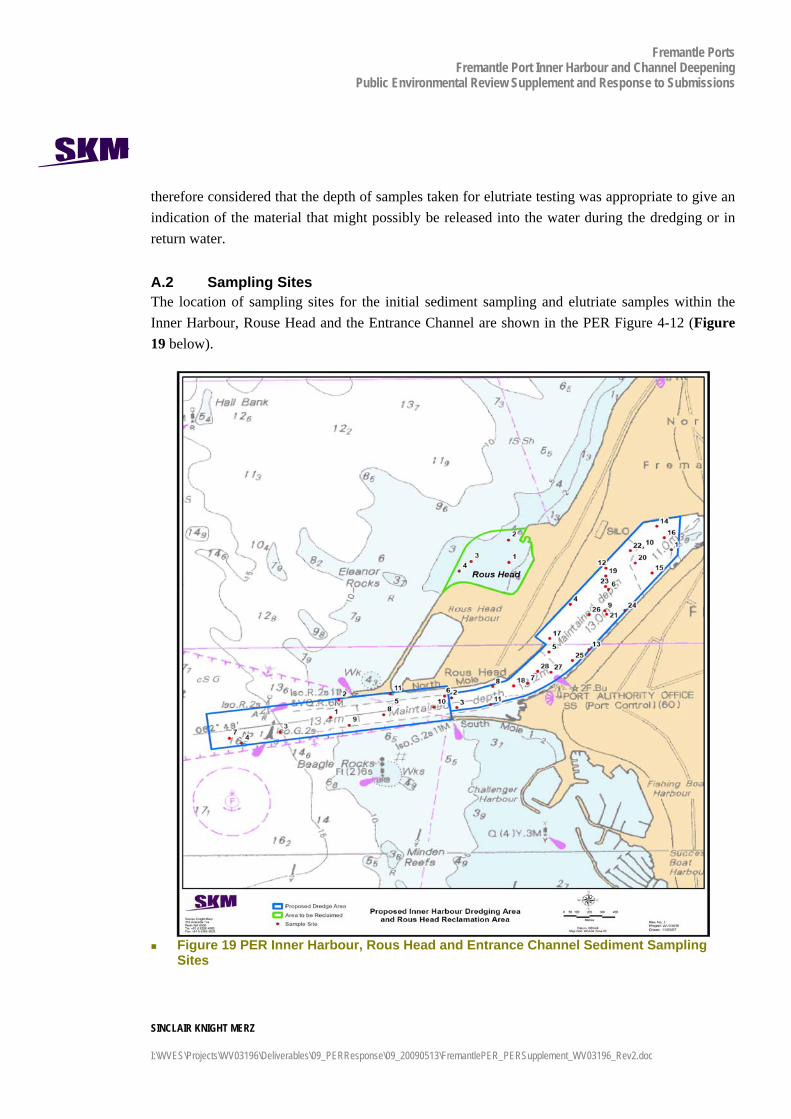
Fremantle Ports Fremantle Port Inner Harbour and Channel Deepening
Public Environmental Review Supplement and Response to Submissions
SINCLAIR KNIGHT MERZ I:\WVES\Projects\WV03196\Deliverables\09_PERResponse\09_20090513\FremantlePER_PERSupplement_WV03196_Rev2.doc
therefore considered that the depth of samples taken for elutriate testing was appropriate to give an indication of the material that might possibly be released into the water during the dredging or in return water.
A.2 Sampling Sites The location of sampling sites for the initial sediment sampling and elutriate samples within the Inner Harbour, Rouse Head and the Entrance Channel are shown in the PER Figure 4-12 (Figure 19 below).
Figure 19 PER Inner Harbour, Rous Head and Entrance Channel Sediment Sampling
Sites

Fremantle Ports Fremantle Port Inner Harbour and Channel Deepening Public Environmental Review Supplement and Response to Submissions
SINCLAIR KNIGHT MERZ PAGE 94 I:\WVES\Projects\WV03196\Deliverables\09_PERResponse\09_20090513\FremantlePER_PERSupplement_WV03196_Rev2.doc
This figure supersedes Figure 5 in PER Appendix B page 19 (Figure 5- Location of Sediment Sample Sites within the Inner Fremantle Harbour).
A.3 Explanation of Raw Data and Testing of Sites that Exceeded the Guidelines. Preparation of Results for Comparison to the NODGDM Guidelines.
Results for sediment sampling were reported in the PER as the 95% Upper Confidence Limit (95% UCL) data for assessment against NODGDM screening levels as per the recommendations of the NODGDM guidelines (Page 38).
Values from laboratory results that were less than the PQL (Practical Quantitation Limit) were reported as half the PQL. This was used for all results where the values were less than the laboratory PQL or LOR (limit of reporting). This provides a further level of conservatism as some parameters such as PAH in some cases were at levels below the PQL and were treated as having half the PQL and requiring to be further investigated during elutriate testing.
Organic contaminants such as PAH, Pesticides and TBT were normalised to 1 per cent total organic carbon (TOC). Normalisation is only appropriate over the TOC range 0.2–10 per cent (equates to multiplication factors of 5 times–0.1 times, respectively). Outside this range the applicable end value was used (e.g. for less than 0.2 per cent TOC, 5 times the TBT value measured was used). (NODGDM Page 37). This normalisation is only relevant to sediments disposed to the marine environment as it relates to toxicological effects. This would not be the case for land disposal and as such the normalisation with TOC is not applicable for comparison to the Contaminated Sites EILs (ecological investigation levels).
As the material will be disposed to land reclamation, the appropriate PQL (or LOR) levels used for laboratory analyses were set to allow comparison to the EILs which in some cases have resulted in the PQL being higher than the level appropriate for comparison to the NODGDM screening levels (which are generally much lower than the EILs). Despite this discrepancy, the PQLs used are appropriate for assessment of contamination against the Contaminated Sites EILs and for the intended use of the material as land reclamation fill.
A.3.1 Metals and Metalloids - Entrance Channel Levels of all metals tested in all samples from Entrance Channel sediments were below the respective NODGDM screening levels and EILs. Therefore none of the metals were considered contaminants of concern when elutriate testing was conducted on Entrance Channel sediments and accordingly were not included in the testing.
A.3.2 Metals and Metalloids - Inner Harbour Antimony from Inner Harbour sediments was below the PQL for the analysis method of 5mg/kg in all samples therefore, it is accordingly reported as 2.5mg/kg (half the PQL) in all samples.

Fremantle Ports Fremantle Port Inner Harbour and Channel Deepening
Public Environmental Review Supplement and Response to Submissions
SINCLAIR KNIGHT MERZ I:\WVES\Projects\WV03196\Deliverables\09_PERResponse\09_20090513\FremantlePER_PERSupplement_WV03196_Rev2.doc
Although this is above the NODGDM screening level (2mg/kg), it is well below the maximum of 25mg/kg and the EIL of 20mg/kg. Nonetheless, although antimony was not considered a contaminant of concern, it was still included in the elutriate testing.
Levels of all other metals (with the exception of mercury) in all samples from Inner Harbour sediments were below the respective NODGDM screening levels and EILs. Potential contaminants of concern are discussed further below.
A.3.3 Potential Contaminants of Concern - Arsenic Levels of arsenic from Inner Harbour sediments ranged from 2.5 to 6.7mg/kg which is well below the NODGDM screening level of 20mg/kg; hence arsenic was not considered a contaminant of concern. Despite these low levels of arsenic in the sediment, the elutriation testing of Inner Harbour samples has shown arsenic to be readily mobilised during the elutriation process and arsenic was subsequently included as a contaminant of concern in respect to water quality. Further discussion of arsenic was provided in the PER Appendix B Section 7.1.2.
Levels of arsenic in the Entrance Channel sediments ranged from 0.6mg/kg (a lower PQL of 0.1 mg/kg was used for samples initially intended for offshore disposal) to 3.2mg/kg. This is well below the NODGDM screening level and was not considered a contaminant of concern when the elutriation testing was conducted. Arsenic was not tested in the elutriation samples from the Entrance Channel. Given that the arsenic levels in the Inner Harbour samples were higher initially, it is reasonable to assume that any elutriate arsenic levels from the Entrance Channel sediments would be relatively lower than those of the Inner Harbour. This sediment material will be dredged and placed in the same reclamation area as for the Inner Harbour and management of arsenic levels in return water will be based on the higher results from the Inner Harbour elutriate testing.
A.3.4 Potential Contaminants of Concern - Mercury During the initial sampling, mercury was tested in 25 Inner Harbour sediment samples (surface sediments 0 – 50cm) and found to be below the EIL of 1 mg/kg in all 25 samples. However, under the NODGDM guidelines levels, at several sites were above the screening level of 0.15mg/kg (see Table 12, highlighted with an asterisk). Mercury was also tested in nine Inner Harbour deeper sediment samples (50 – 100cm or to core refusal depth) and found to be below the EIL of 1mg/kg in all but two samples (site IH1 and IH15) which exceeded the EIL (see Table 12, highlighted using a hash) and therefore required further testing.
Mercury was included in the further testing of elutriate samples from ten Inner Harbour sites. Table 12 shows the match-up of the sites that were initially tested and found to be above the NODGDM screening level (highlighted with an asterisk) and in particular the two sites that exceeded the EIL (highlighted with a hash). These two sites (IH1 and IH15) were both re-sampled for elutriate testing to the same depth of sediment as was initially sampled (to refusal depth where

Fremantle Ports Fremantle Port Inner Harbour and Channel Deepening Public Environmental Review Supplement and Response to Submissions
SINCLAIR KNIGHT MERZ PAGE 96 I:\WVES\Projects\WV03196\Deliverables\09_PERResponse\09_20090513\FremantlePER_PERSupplement_WV03196_Rev2.doc
the core could not be forced any deeper) and at the same location where the highest mercury levels were initially recorded.
Mercury in elutriate samples was analysed to ultra low levels, 0.1 µg/L Limit of Reporting (LOR) using FIMS. Mercury levels in all elutriate samples from the 10 Inner Harbour sites were below the 0.1 µg/L LOR (Table 12).

Fremantle Ports Fremantle Port Inner Harbour and Channel Deepening
Public Environmental Review Supplement and Response to Submissions
SINCLAIR KNIGHT MERZ I:\WVES\Projects\WV03196\Deliverables\09_PERResponse\09_20090513\FremantlePER_PERSupplement_WV03196_Rev2.doc
Table 12 Results for Mercury in Sediment and Elutriate Samples
Inner Harbour surface (0 to 50 cm)
Inner Harbour deeper (50 cm to refusal)
Re-sampled for elutriate testing (0 to refusal)
Site Mercury in sedimentmg/kg (0.1 PQL)
Site Mercury in sediment mg/kg (0.1 PQL)
Site Mercury in elutriate µg/L (0.1 PQL)
IH1 0.18* IH1 1.28# IH 1 <0.1
IH2 0.05 IH 2 <0.1
IH3 0.05 IH 3 <0.1
IH4 0.05 IH 4 <0.1
IH5 0.10
IH6 0.05 IH6 0.05
IH7 0.15* IH 7 <0.1
IH8 0.05
IH10 0.05
IH11 0.05 IH 11 <0.1
IH12 0.05
IH13 0.10
IH14 0.05 IH14 0.05 IH 14 <0.1
IH15 0.60* IH15 2.20# IH 15 <0.1
IH16 0.05
IH17 0.05 IH17 0.05
IH18 0.05
IH19 0.20*
IH20 0.05 IH 20 <0.1
IH21 0.05
IH22 0.05 IH22 0.05
IH23 0.13 IH23 0.40*
IH24 0.40* IH24 0.10
IH25 0.05 IH25 0.05 IH 25 <0.1
IH26 0.05
IH sites 95%UCL
(0 – 50 cm) 0.2
IH sites 95%UCL
(50 cm – refusal) 0.9
IH sites Elutriates
(0 to refusal) <0.1
NOTE: exceedances of NODGDM screening level marked with an asterix (*) and exceedances of NODGDM maximum levels. marked with a hash (#)
A.3.5 Other metals in Inner Harbour elutriate samples Levels of cadmium, chromium, mercury and silver were all below the respective laboratory reporting limits and are therefore not considered contaminants of concern.

Fremantle Ports Fremantle Port Inner Harbour and Channel Deepening Public Environmental Review Supplement and Response to Submissions
SINCLAIR KNIGHT MERZ PAGE 98 I:\WVES\Projects\WV03196\Deliverables\09_PERResponse\09_20090513\FremantlePER_PERSupplement_WV03196_Rev2.doc
Antimony was recorded in all samples at levels well below the ANZECC/ARMCANZ (2000) low reliability trigger level.
Zinc was recorded in one elutriate sample at 8µg/L which is above the ANZECC/ARMCANZ (2000) 99% species protection trigger level of 7µg/L. However, zinc was also recorded in the background seawater sample used for the elutriation process at this same level of 8µg/L.
Copper was recorded in one sample at 2µg/L which is above the ANZECC/ARMCANZ (2000) 99% species protection trigger level of 0.3µg/L. However, copper was also recorded in the background seawater sample used for the elutriation process at 1µg/L. Copper was below the laboratory reporting level of < 1µg/L in all other elutriate samples (nine Inner Harbour sites). .
A.3.6 Organotins Concentrations of TBT (normalised to 1% TOC) reported in the PER as the 95% UCL of all Inner Harbour sites exceeded the NODGDM screening level but not the maximum level. The NODGDM guidelines recommend the use of 95% UCL for comparison to the guideline levels as a method of determining whether the contaminant is to be considered as a contaminant of concern and warrant further investigation. It was therefore appropriate to use the 95% UCL for this comparison rather than the individual results at each site.
Individual sites showed considerable variation in TBT (normalised to 1% TOC) levels ranging from 0.3 to 311.7µg Sn/kg in the Inner Harbour and 0.9 to 23.6µg Sn/kg in the Entrance Channel sites (see Table 13). The primary source of TBT in the Inner Harbour is most likely to be from antifouling paint lost from ships during contact with the wharf. This is likely to remain in the sediment as paint flakes and result in a highly patchy distribution of TBT in the sediment samples. Elutriate testing of Inner Harbour and Entrance Channel sediments was analysed to very low PQL of 0.005 µg Sn/L and showed that TBT was below detection levels in all samples. Although this testing did not include re-sampling of sites IH18 and IH26 where the highest TBT levels were recorded (Table 13), testing was conducted on sites with a range of TBT values to be representative of the 95% UCL values and include above and below the 95% UCL. Sites for re-sampling (for elutriates) were also chosen to include a range of other contaminants such as mercury and PAH so sites were not selected based solely on TBT levels.
Notwithstanding this, TBT levels were initially shown to be very variable and, as this material will all be dredged and thoroughly mixed as it is disposed to the reclamation, it is reasonable to conclude that the elutriation results give an indication that TBT is unlikely to become a contaminant of concern in the return water from the dredging or reclamation.
The individual levels of TBT expressed as tin (there is not an EIL for TBT) did not exceed the EIL guidelines for tin.

Fremantle Ports Fremantle Port Inner Harbour and Channel Deepening
Public Environmental Review Supplement and Response to Submissions
SINCLAIR KNIGHT MERZ I:\WVES\Projects\WV03196\Deliverables\09_PERResponse\09_20090513\FremantlePER_PERSupplement_WV03196_Rev2.doc
Table 13 Results for TBT (Normalised to 1% TOC) in Sediment and Elutriate Samples
Inner Harbour surface (0 to 50 cm)
Inner Harbour deeper (50 cm to refusal)
Re-sampled for elutriate testing (0 to refusal)
Site TBT in sediment µg Sn/kg (0.1 PQL)
Site TBT in sediment µg Sn/kg (0.1 PQL)
Site TBT in elutriate µgSn/L (0.005 PQL)
IH1 47.5* IH1 7.5* IH 1 <0.005
IH2 8.0* IH 2 <0.005
IH3 9.6* IH 3 <0.005
IH4 77.6# IH 4 <0.005
IH5 17.7*
IH6 12.7* IH6 15.6*
IH7 23.3* IH 7 <0.005
IH8 12.4*
IH10 47.5*
IH11 71.5# IH 11 <0.005
IH12 46.3*
IH13 21.7*
IH14 14.9* IH14 24.7* IH 14 <0.005
IH15 3.5 IH15 1.3 IH 15 <0.005
IH16 3.0
IH17 0.3 IH17 0.4
IH18 311.7#
IH19 14.7*
IH20 54.8* IH 20 <0.005
IH21 5.0
IH22 5.0
IH23 8.0* IH22 1.3
IH24 33.5* IH23 65.6*
IH25 18.5* IH24 31.8* IH 25 <0.005
IH26 135.7#
95%UCL
IH sites (0 – 50 cm) 66.5
95%UCL
IH sites (50 cm – refusal)
30.0
Elutriates
<0.005
EC1 1.3 EC1 <0.005
EC2 1.3
EC3 1.3 EC3 <0.005
EC4 0.9 EC4 <0.005
EC5 9.8* EC5 <0.005

Fremantle Ports Fremantle Port Inner Harbour and Channel Deepening Public Environmental Review Supplement and Response to Submissions
SINCLAIR KNIGHT MERZ PAGE 100 I:\WVES\Projects\WV03196\Deliverables\09_PERResponse\09_20090513\FremantlePER_PERSupplement_WV03196_Rev2.doc
Inner Harbour surface (0 to 50 cm)
Inner Harbour deeper (50 cm to refusal)
Re-sampled for elutriate testing (0 to refusal)
Site TBT in sediment µg Sn/kg (0.1 PQL)
Site TBT in sediment µg Sn/kg (0.1 PQL)
Site TBT in elutriate µgSn/L (0.005 PQL)
EC6 5.9* EC6 <0.005
EC7 0.5 EC7 0.6 EC7 <0.005
EC8 6.1*
EC9 1.3 EC9 <0.005
EC10 23.6* EC10 <0.005
EC11 1.1
95%UCL
EC sites (0 – 50 cm)
8.6
95%UCL
EC sites (50 cm – refusal)
0.6
Elutriates
<0.005
NOTE: These data are normalised to 1% TOC, exceedances of NODGDM screening level marked with an asterix (*) and exceedances of NODGDM maximum levels marked with a hash (#)
A.3.7 Pesticides - Inner Harbour The PER Appendix B (Land Disposal SAP Report Section 6.4) reported that a number of organochlorine pesticides in Inner Harbour sediments exceeded the NODGDM maximum levels by varying orders of magnitude. These exceedances, therefore, required the testing of elutriates.
However, all the results for organochlorine pesticide levels from Inner Harbour sediments were below the laboratory reporting level and in all cases have been reported as half the PQL. These results were then normalized to 1% TOC in order to compare against the NODGDM guidelines. The PQL or levels of reporting chosen for these analyses were appropriate for comparison to the Contaminated Sites EILs however, in most cases the levels reported as half the PQL are above the NODGDM maximum levels. These results are consequently not appropriate for comparison to the NODGDM guidelines. Despite this, the PQLs are appropriate for comparison to the Contaminated Sites EILs and all pesticide results were below these levels.
Subsequent testing of Inner Harbour elutriate samples to ultra-trace levels demonstrated that all organochlorine and organophosphorus pesticides were below the detection levels. It is therefore concluded that in the Inner Harbour, sediments are not contaminated by levels of pesticides above the EILs or sufficient to cause any release to the water column during dredging or in return water from the land reclamation.
A.3.8 Pesticides - Entrance Channel The PER Appendix C (SAP Report Ocean Disposal, Section 4.5) reported pesticides to lower PQLs which were appropriate for comparison to the NODGDM guidelines. Lower PQLs were used for

Fremantle Ports Fremantle Port Inner Harbour and Channel Deepening
Public Environmental Review Supplement and Response to Submissions
SINCLAIR KNIGHT MERZ I:\WVES\Projects\WV03196\Deliverables\09_PERResponse\09_20090513\FremantlePER_PERSupplement_WV03196_Rev2.doc
testing of the Entrance Channel sediments because this material was originally intended for disposal offshore and required comparison to the NDGDM guidelines.
There were no pesticides detected in the Entrance Channel sediments and these sediments are accordingly considered to be uncontaminated. Subsequent elutriate testing of Entrance Channel sediments did not include pesticides.
A.3.9 Total Petroleum Hydrocarbons (TPH) The PER Appendix B (Land Disposal SAP Report Section 6.5) reported that none of the individual or summed TPH levels in surface and subsurface sediments exceeded the EIL guidelines for land disposal. Concentrations of normalised total petroleum hydrocarbons could not be compared to the NODGDM because there are no screening or maximum levels for these contaminants.
A.3.10 Polycyclic Aromatic Hydrocarbons (PAHs) The PER Appendix B (Land Disposal SAP Report, Section 6.6) reported that most concentrations of normalised total PAHs in surface and subsurface sediments exceeded the NODGDM maximum levels. These exceedances, therefore, required the testing of elutriates. The PQL or levels of reporting chosen for analyses of PAHs, were appropriate for comparison to the Contaminated Sites EILs. However, in most cases the levels were below the PQL and reported as half the PQL but are above the NODGDM screening and maximum levels. These results are consequently not appropriate for comparison to the NODGDM guidelines.
Despite this, the PQLs are considered appropriate for comparison to the Contaminated Sites EILs. None of the individual PAH levels in surface or subsurface sediments exceeded the EIL guidelines for land disposal. These sediments are considered to be uncontaminated by PAHs.
Lower PQLs were used for testing of the Entrance Channel sediments because this material was originally intended for disposal offshore and required comparison to the NODGDM guidelines. Although some PAH levels in Entrance Channel sediments exceeded the NODGDM screening levels, none of the PAHs exceeded the EILs. Levels of one PAH, Anthracene (normalized to 1% TOC) and the combined total levels of High Molecular Weight PAHs both just exceeded the NODGDM maximum levels in sediment from one site EC7 where a sample was possible in deeper sediment (50 cm to refusal). However, the non-normalised levels of these were below the EIL and this site was re-sampled to the same sediment depth for elutriate testing.
Re-sampling for elutriate testing was conducted on eight out of the eleven Entrance Channel sites, including the sites (EC4, EC5, EC6 and EC7) where PAHs above screening were previously recorded.

Fremantle Ports Fremantle Port Inner Harbour and Channel Deepening Public Environmental Review Supplement and Response to Submissions
SINCLAIR KNIGHT MERZ PAGE 102 I:\WVES\Projects\WV03196\Deliverables\09_PERResponse\09_20090513\FremantlePER_PERSupplement_WV03196_Rev2.doc
Elutriate testing of Inner Harbour and Entrance Channel sediments with low level analysis of PAHs showed all results were below detection indicating that there are not sufficient levels of PAHs to cause contamination or release to the water column during dredging or in return water from the land reclamation.
A.3.11 Other parameters not discussed in the PER PCB was tested in sediments from the Inner Harbour, Entrance Channel, Deep Water Channel and Rous Head and found to be below the laboratory reporting limit of 2.5µg/kg in all samples.
Phenolic compounds and BTEX were also tested in all samples from the Inner Harbour and Rous Head sediments and found to be below the respective laboratory reporting limits in all samples.
A.4 Conclusion It is concluded that the initial sampling along with re-sampling (for elutriate testing) is sufficiently representative to adequately assess contamination of these sediments and classify them as suitable for the intended method of disposal to the Rous Head reclamation. Elutriation testing has subsequently demonstrated that dredging of this material and disposal to reclamation at Rous Head is unlikely to release significant levels of contamination into the water column or in tail water discharge.
The monitoring programme has been adequately informed by these results and will address the contaminants of concern. There is therefore no need for any further re-sampling of this sediment prior to the dredging project commencing.

Fremantle Ports Fremantle Port Inner Harbour and Channel Deepening
Public Environmental Review Supplement and Response to Submissions
SINCLAIR KNIGHT MERZ I:\WVES\Projects\WV03196\Deliverables\09_PERResponse\09_20090513\FremantlePER_PERSupplement_WV03196_Rev2.doc
This page has been intentionally left blank

Fremantle Ports Fremantle Port Inner Harbour and Channel Deepening Public Environmental Review Supplement and Response to Submissions
SINCLAIR KNIGHT MERZ PAGE 104 I:\WVES\Projects\WV03196\Deliverables\09_PERResponse\09_20090513\FremantlePER_PERSupplement_WV03196_Rev2.doc
Appendix B Benthic Habitat Impact This appendix details the key methodologies used to calculate Benthic Habitat Impact detailed within Section 4 Issues 1.20 and 1.21. The following is detailed within this appendix:
the relationship between light attenuation and turbidity;
the relationship between light attenuation and Total Suspended Solids;
the methodology to calculate Threshold Levels;
the Threshold Levels used to calculate Benthic Habitat Impact; and
a summary of BPPH impact calculations.
Light Attenuation and Turbidity Light intensity is attenuated by water and increasing water depth reduces the amount of light available to seagrasses. Attenuation is increased by turbidity resulting in a further reduction in light reaching the seabed. The relationship between light extinction and water depth is defined by the Beer-Lambert Law for water which is shown below.
)(1)(0I
ILnz
PARK zd = Beer-Lambert Law equation
where: I0 is the incident light Iz is the light at depth z z is the water depth or vertical distance between I0 and Iz The light extinction coefficient (Kd) is then expressed as a log10 relationship to represent the light attenuation coefficient (LAC) thus the equation becomes:
)(1)(0
10 II
Logz
PARAC z=
The minimum light requirement or compensation depth for a given species is therefore dependent upon the water depth as shown in Figure 20.
Relationship of Light Attenuation and Total Suspended Solids In order to assess the potential impact of dredging turbidity on seagrass a relationship is required that links turbidity (TSS mg/L) in the numerical modelling with light attenuation (LAC). The very low naturally TSS levels often provide a poor relationship with LAC for the purposes of dredge plume prediction because the material comprising the TSS is very different. Light absorption by

Fremantle Ports Fremantle Port Inner Harbour and Channel Deepening
Public Environmental Review Supplement and Response to Submissions
SINCLAIR KNIGHT MERZ I:\WVES\Projects\WV03196\Deliverables\09_PERResponse\09_20090513\FremantlePER_PERSupplement_WV03196_Rev2.doc
phytoplankton and other organic material does not reflect that of fine sediment released into the water column by a dredge.
The relationship between dredge related TSS and LAC is very site specific as it is dependent upon the sediment properties such as particle size and settling rate. Settling rate is also dependent upon the shape of the sediment particles and their density. The best data for determining a relationship between TSS and LAC is gathered during a dredging program at the proposed location.
0
5
10
15
20
25
30
0.0 0.1 0.2 0.3 0.4 0.5 0.6
Depth (m)
Light attenuation coefficient (m-1)
Posidonia australis
Halophylla ovalis
Amphibolis griffithii
Posidonia sinuosa
Posidonia coriacea
Posidonia angustifolia
Heterozostera tasmanica
Background
Figure 20 Relationship Between Light Attenuation and Seagrass Compensation Depth
Source: Modified from Masini et al. (1995), Westphalen et al. (2004), Collier (2006) and Lavery et al. (2006). Note: Background is derived from measurements in Gage Roads as part of this study. A few Ports in Western Australia have undertaken such data gathering during recent capital dredging events; however, this data is not applicable to Fremantle due to the very different sediment characteristics. No such data was available which is specific for the Port of Fremantle.
At present there are no NATA certified tests or equipment that can derive a relationship between TSS and LAC. For this reason, a purpose-built calibration facility (Figure 21) consisting of a 300L sample volume, a voltage regulated fixed diffuse light source and a height-adjustable submerged light sensor was used to measure the decay of light in the sample volume for different types and

Fremantle Ports Fremantle Port Inner Harbour and Channel Deepening Public Environmental Review Supplement and Response to Submissions
SINCLAIR KNIGHT MERZ PAGE 106 I:\WVES\Projects\WV03196\Deliverables\09_PERResponse\09_20090513\FremantlePER_PERSupplement_WV03196_Rev2.doc
concentrations of sediment (In-Situ Marine Optics 2007). All internal surfaces within the tank were coated in matt black paint to minimise light scattering. The light source consisted of a 50 Watt halogen lamp and a 3mm PTFE disc covering the aperture to produce a diffuse light source. A two horsepower Davey water pump was used to circulate the water within the tank setup. The water pipe end was positioned 0.75m above the light source which ensured there was enough water flow to remove any settling sediment which may cover the light source optical aperture. A black lid was placed over the tank cylinder to block out any external light from entering inside the tank.
The tank was filled with tap water, and the water pump and light source was turned on. A ten minute warm up time was used to reduce the influence of air bubbles and to stabilise the light source. The irradiance spectrum of the tap water medium (blank) was measured with a HOBI Labs, Hydrorad II planar irradiance sensor, for lamp-to-sensor distances of 84, 119, 159, 245, 344, 451 and 619 mm (all ± 2 mm). A ‘blank’ water sample was taken by dipping a 5 L HDPE bottle in the centre of the tank cylinder.
Height Adjustable Sensor
Water Pump
Diffuse Lamp
S
2.5 m
φ = 0.85 m
Figure 21 Calibration Chamber Setup
Source: In-Situ Marine Optics (2007).
Sediment for the testing was obtained from six core samples collected at Fremantle along the trajectory of the proposed harbour and channel dredging. The dry sediment from one of the six samples was added to a bucket of water and mixed into a thick paste. A small amount of this paste was then added to the tap water and irradiance measurements, for the same lamp-to-sensor distances as for the blank, were acquired. After each addition of sediment, five minutes was allowed to maintain optical homogeneity by rapidly cycling sediment through the system with the

Fremantle Ports Fremantle Port Inner Harbour and Channel Deepening
Public Environmental Review Supplement and Response to Submissions
SINCLAIR KNIGHT MERZ I:\WVES\Projects\WV03196\Deliverables\09_PERResponse\09_20090513\FremantlePER_PERSupplement_WV03196_Rev2.doc
water pump. For each of the sediment concentrations measured triplicate water samples were drawn from the centre of the chamber. This procedure was repeated for the five remaining samples.
The water samples were stored overnight in 1 L HDPE bottles and then filtered under low vacuum pressure (<7.5 in Hg) onto pre-weighed 0.5µm nominal (47mm Advantec GF/F GC 50). Filter funnels were rinsed with Milli-Q water during the final stages of each sample volume filtration. Filters were dried overnight at 70º Celsius before the initial and final weights to remove the weight of moisture deposited on the filters not attributable to the sample sediment concentration. The mass difference of each filter was divided by the volume of the sediment sample concentrated onto the filter to determine the mass concentration of sediment.
Hyperspectral Irradiance data was measured for the range of sensor–lamp distances (z) described earlier. This data was converted to a PAR measurement by integrating the data over the PAR wavelength region (400–700 nm) as shown in Equation 1 below.
∫=nm
nmd dzEzPAR
400
700
),()( λλ (Equation 1)
The PAR measurements were then normalised to the PAR measurement of tap water blank (see Equation 2). This was required in order to correct the data for the combined effects of the 1/R
2 intensity drop-off and the unique light–sensor–tank geometry.
)()()(
dim
zPARzPARzPAR TapWater
entSe
= (Equation 2)
The light extinction coefficient, Kd(PAR), for each sediment concentration and sediment type was calculated by rearranging the Beer-Lambert Law equation as shown in Equation 3 below.
⎥⎦
⎤⎢⎣
⎡−=
)0()(ln1)(
PARzPAR
zPARK d (Equation 3)
where PAR(z) represents the tap water-normalised PAR at a distance z from the initial PAR(0) measurement.
The mean and standard deviation of Kd(PAR) for each sediment concentration and sediment type was determined from the calculations for the various lamp-sensor distances profiled within the tank. The extinction coefficient for each sediment concentration and sample was then regressed with the average blank-corrected total suspended solids value determined from the water sample triplicate measurements.

Fremantle Ports Fremantle Port Inner Harbour and Channel Deepening Public Environmental Review Supplement and Response to Submissions
SINCLAIR KNIGHT MERZ PAGE 108 I:\WVES\Projects\WV03196\Deliverables\09_PERResponse\09_20090513\FremantlePER_PERSupplement_WV03196_Rev2.doc
The light extinction coefficient was then expressed as the light attenuation coefficient (LAC) by converting the relationship from natural log (ln) to log based 10 (log10).
The relationship between TSS and LAC is presented in Figure 22. The regression line indicates a significant (P<0.001) correlation (R2) of 0.831 between TSS and LAC with a slope of 0.0179. These data have been used to calculate threshold levels and fed into the numerical modelling of the dredging and disposal program to predict the effect on light climate and subsequent impact on seagrasses in the area.
y = 0.0179xR2 = 0.831
-0.5
0.0
0.5
1.0
0 10 20 30 40
Light Attenuation (PAR) (m
-1)
Total Suspended Solids (mg/L)
Figure 22 Overall Relationship Between TSS and Light Attenuation (LAC)
Calculation of Threshold Levels The calculation of threshold values involves the determination of light attenuation to reduce the incident light to the minimum light requirement (MLR) of seagrass species at one metre water depth intervals. There are a number of species present in the area where turbidity plumes will be generated, for instance, Posidonia sinuosa, Amphibolis griffithii, Posidonia coriacea, Posidonia angustifolia and Heterozostera tasmanica. To simplify the impact assessment process and to make it more conservative the species requiring the most light (highest MLR) was chosen. In this instance Posidonia sinuosa with a moderate level of epiphyte load and Amphibolis griffithii with an MLR of 10% was chosen.

Fremantle Ports Fremantle Port Inner Harbour and Channel Deepening
Public Environmental Review Supplement and Response to Submissions
SINCLAIR KNIGHT MERZ I:\WVES\Projects\WV03196\Deliverables\09_PERResponse\09_20090513\FremantlePER_PERSupplement_WV03196_Rev2.doc
Several studies have shown that the MLR of a seagrass species is dependent upon its epiphyte loading (Gordon et al. 1994; Masini et al. 1995 and Collier 2006). For instance, Posidonia sinuosa has a MLR ranging from 8.5–14% for low–high epiphyte loading (Masini et al. 1995). The seagrasses in the study area have been investigated during the peak period of epiphyte loading (spring–autumn) and the loading was found to be low but could potentially be higher thus the MLR of 10% was used. This value approximates that of Amphibolis griffithii thus a single MLR of 10% would be representative of the dominant climax seagrass species found in the study area.
The depth interval range is required to account for the fact that seagrass grows in coastal sub-tidal waters of Fremantle down to approximately 18m. These light attenuation values then need to be represented by turbidity levels in mg/L of TSS so that they can be applied to the modelled data.
The method used to calculate these threshold levels is as follows:
1) The light attenuation for a seagrass species that would lead to an impact on the seagrass (zone of effect) by reducing density in the short-term with recovery to normal levels in time, Threshold level 2 was based on the MLR during the dredging program as any light level below the MLR can affect the health of a seagrass species.
It is important to note that research studies effectively excluded incident light through artificial shading but the action and ultimate influence of dredge plumes are inherently stochastic, both temporally and spatially. Thus light limitation events resulting from dredging and disposal are highly unlikely to be as constant as the experimental manipulations. Therefore, the benthos will receive intermittent incident light during the campaign along with continued scattered light that is highly likely to realise a better outcome in reality when compared to the simulated results. As a result, the threshold values derived from using these data area inherently conservative and a reduced impact and subsequent rapid recovery is anticipated. The threshold value is an average for daylight hours for a 4 month period of dredging for each species in a given water depth and are provided in Table 14.
The light attenuation for a seagrass species that could reduce the light climate such that the Benthic Primary Producers (BPPs) would be completely lost (zone of loss), Threshold level 1 was based on 30% of the MLR during the dredging program. The threshold value is an average for daylight hours for a 4 month period of dredging for seagrasses in a given water depth and are provided in Table 14.
2) The numerical model used to predict turbidity plumes deals with the distribution and concentration of particles within the water column. The light attenuation (LAC) values for seagrasses for each threshold level was converted to total suspended solids (TSS) levels in mg/L in order to link the predicted water quality to levels that will impact on seagrasses. The relationship between light attenuation and TSS was based on laboratory results using sediment from the proposed dredging area as discussed earlier. The following relationship was used:

Fremantle Ports Fremantle Port Inner Harbour and Channel Deepening Public Environmental Review Supplement and Response to Submissions
SINCLAIR KNIGHT MERZ PAGE 110 I:\WVES\Projects\WV03196\Deliverables\09_PERResponse\09_20090513\FremantlePER_PERSupplement_WV03196_Rev2.doc
0179.0LACTSS = (R2 = 0.831, P<0.0001)
3) The numerical modelling overlays added turbidity to the system and does not take into account ambient (background) conditions. An ambient TSS level of 2.0mg/L has been derived from data gathered during baseline studies in the study area. The background turbidity (TSS) has been factored into the threshold levels (subtracted from) used to predict the zones of permanent loss and temporary loss/damage. This means that the modelled impact zones accounts for background by having lower threshold levels.
Table 14 Threshold Levels for Light Attenuation and TSS
Water depth (m) Zone of Effect Zone of Loss
LAC (m-1) TSS (mg/L)* LAC (m-1) TSS (mg/L)*
1 1.000 54 1.523 83 2 0.500 26 0.761 41 3 0.333 17 0.508 26 4 0.250 12 0.381 19 5 0.200 9 0.305 15 6 0.167 7 0.254 12 7 0.143 6 0.218 10 8 0.125 5 0.190 9 9 0.111 4 0.169 7
10 0.100 4 0.152 7 11 0.091 3 0.138 6 12 0.083 3 0.127 5 13 0.077 2 0.117 5 14 0.071 2 0.109 4 15 0.067 2 0.102 4 16 0.063 1 0.095 3 17 0.059 1 0.090 3 18 0.056 1 0.085 3
* Threshold includes the subtraction of ambient TSS of 2.0mg/L indicative of normal conditions in the region.
Calculation of Predicted Loss, Effect and Influence Zones from Predicted TSS To calculate the predicted habitat loss zones 40m resolution bathymetry data over the project area was reprocessed to assign TSS threshold values (Table 14 of the PER Supplement) against all depths in the dataset for both the Zone of Effect scenario and the Zone of Loss scenario.
Using ESRI ArcGIS software, the bathymetry threshold dataset was analysed against the datasets of predicted TSS values to test whether at a given location the predicted TSS value was greater

Fremantle Ports Fremantle Port Inner Harbour and Channel Deepening
Public Environmental Review Supplement and Response to Submissions
SINCLAIR KNIGHT MERZ I:\WVES\Projects\WV03196\Deliverables\09_PERResponse\09_20090513\FremantlePER_PERSupplement_WV03196_Rev2.doc
than the TSS threshold value assigned to the depth at that location. If the TSS value was greater than the TSS Zone of Effect threshold value for that depth then the data was assigned as the Zone of Effect, if the TSS value was greater than the TSS Zone of Loss threshold value for that depth then the data was assigned as the Zone of Loss. The Zone of Influence was modelled separately and was the area where TSS was 2mg/L at anytime in daylight hours for more than three hours.
This process was repeated for each of the dredging start times (January and November).
Predicted turbidity impacts Figure 23 shows the rationale of the trigger values used in conjunction with the modelling to establish areas of Potential Impact (Threshold 1, Permanent Loss) Zone of Potential Effect (Threshold 2, short term impact but no long term loss) and the Zone of Potential Influence (Threshold 3, Increased turbidity but no short term impact or long term loss). The modelling output for loss of light caused by increased TSS has been used to predict these three zones based on the threshold values for each seasonal scenario. These zones have then been used with the BPPH mapping to calculate the area of habitat affected by each zone for each scenario (
Table 15). Figure 16 and Figure 17 presents the results of each predicted zones of Impact, Effect and Influence for each modelling scenario in relation to the BPPH Management Units.

Fremantle Ports Fremantle Port Inner Harbour and Channel Deepening
Public Environmental Review Supplement and Response to Submissions
SINCLAIR KNIGHT MERZ I:\WVES\Projects\WV03196\Deliverables\09_PERResponse\09_20090513\FremantlePER_PERSupplement_WV03196_Rev2.doc PAGE 112
Area of Potential Impact Area of Potential Effect Area of Potential Influence
• Project Footprint plus predicted impact area
• Smothering of existing biota • Long-term alteration to benthos • Potential permanent loss of
habitat
• High turbidity • Reduced light levels below those
required by seagrasses for long-term health and survival
• Short-term impact on seagrass survival and growth rates predicted
• No long-term impact on seagrass survival and growth predicted
• Some increase in turbidity • Some reduction in light intensity but light levels
above minimum requirements for seagrasses • No short-term or long-term impact on seagrass
survival and growth predicted
Figure 23 Conceptual Illustration of BPPH Zones of Potential Impact, Effect and Influence
Seagrass Threshold 2
MLR for 95% of daylight hours over the
Seagrass Threshold 1
30% of the MLR for 95% of daylight
Seagrass Threshold 3
2 mg/L during daylight hours for a 3

Fremantle Ports Fremantle Port Inner Harbour and Channel Deepening
Public Environmental Review Supplement and Response to Submissions
SINCLAIR KNIGHT MERZ I:\WVES\Projects\WV03196\Deliverables\09_PERResponse\09_20090513\FremantlePER_PERSupplement_WV03196_Rev2.doc PAGE 113
Table 15 Summary of BPPH Impact Calculations
Management Unit Habitat
Total habitat area within
management unit (ha)
Historical Loss ha
(loss as % of total habitat in
management unit)
Zone of Potential Impact/Loss ha
(BPPH loss as % of total habitat in management
unit)
Zone of Potential Effect
ha
Zone of Potential Influence
ha
January November January November January November
Coastal Unit
Coral 0 0 0 0 0 0 0 0
Macroalgae 573 0 0 0 0 0 258 257
Seagrass 69 0 0 0 0 4 32 42
Wrack 0 0 0 0 0 0 0 0
Sand 5475 0 0 99 60 89 3368 3361
Other 275 0 0 0 0 0 32 53
Total BPPH 642 0 0 0 0 4 290 299
Deep Water Channel
Coral 0 0 0 0 0 0 0 0
Macroalgae 1154 0 11 (0.9%) 11 (0.9%) 19 17 1002 1063
Seagrass 378 0 11 (2.9%) 11 (2.9%) 21 21 344 347
Wrack 0 0 0 0 0 0 0 0
Sand 4586 0 130 130 33 28 4182 4245
Other 4396 0 0 0 0 0 2808 2749
Total BPPH 1532 0 22 (1.4%) 22 (1.4%) 40 38 1346 1410
Gage Roads
Coral 3 0 0 0 0 0 3 3
Macroalgae 33 11 (1%) 0 0 7 4 26 29
Seagrass 1014 47 (4.2%) 69 (6.8%) 99 (9.8%) 107 62 690 581
Wrack 144 0 4 3 2 1 138 69
Sand 5481 0 372 478 413 307 4571 4199
Other 0 0 0 0 0 0 0 0

Fremantle Ports Fremantle Port Inner Harbour and Channel Deepening Public Environmental Review Supplement and Response to Submissions
SINCLAIR KNIGHT MERZ
PAGE 114 I:\WVES\Projects\WV03196\Deliverables\09_PERResponse\09_20090513\FremantlePER_PERSupplement_WV03196_Rev2.doc
Management Unit Habitat
Total habitat area within
management unit (ha)
Historical Loss ha
(loss as % of total habitat in
management unit)
Zone of Potential Impact/Loss ha
(BPPH loss as % of total habitat in management
unit)
Zone of Potential Effect
ha
Zone of Potential Influence
ha
Total BPPH 1108 58 (5.2%) 69 (6.8%) 99 (9.8%) 114 66 719 613
Owen Anchorage
Coral Unspecified 0 0 0 0 0 0 0
Macroalgae Unspecified 0 0 0 0 0 0 0
Seagrass Unspecified 0 0 0 0 0 110 81
Wrack Unspecified 0 0 0 0 0 1 1
Sand Unspecified 0 0 0 0 0 146 133
Other Unspecified 0 0 0 0 0 0 0
Total BPPH Unspecified 0 0 0 0 0 110 81
Outer Limits
Coral Unspecified 0 0 0 0 0 0 0
Macroalgae Unspecified 0 0 0 0 0 0 0
Seagrass Unspecified 0 0 0 0 0 0 0
Wrack Unspecified 0 0 0 0 0 0 0
Sand Unspecified 0 0 0 0 0 1099 530
Other Unspecified 0 0 0 0 0 0 0
Total BPPH Unspecified 0 0 0 0 0 0 0 Note: BPPH Area includes coral, macroalgae and seagrass only. Other includes area undefined or too deep to classify in the habitat mapping.
Fremantle Ports Fremantle Port Inner Harbour and Channel Deepening
Public Environmental Review Supplement and Response to Submissions
SINCLAIR KNIGHT MERZ I:\WVES\Projects\WV03196\Deliverables\09_PERResponse\09_20090513\FremantlePER_PERSupplement_WV03196_Rev2.doc PAGE 115
This page has been intentionally left blank

Fremantle Ports Fremantle Port Inner Harbour and Channel Deepening Public Environmental Review Supplement and Response to Submissions
SINCLAIR KNIGHT MERZ
I:\WVES\Projects\WV03196\Deliverables\09_PERResponse\09_20090513\FremantlePER_PERSupplement_WV03196_Rev2.doc
Appendix C Peer Review on Light Attenuation Report

Fremantle Ports Fremantle Port Inner Harbour and Channel Deepening
Public Environmental Review Supplement and Response to Submissions
SINCLAIR KNIGHT MERZ
I:\WVES\Projects\WV03196\Deliverables\09_PERResponse\09_20090513\FremantlePER_PERSupplement_WV03196_Rev2.doc PAGE 157
This page has been intentionally left blank

Fremantle Ports Fremantle Port Inner Harbour and Channel Deepening Public Environmental Review Supplement and Response to Submissions
SINCLAIR KNIGHT MERZ
I:\WVES\Projects\WV03196\Deliverables\09_PERResponse\09_20090513\FremantlePER_PERSupplement_WV03196_Rev2.doc

Fremantle Ports Fremantle Port Inner Harbour and Channel Deepening
Public Environmental Review Supplement and Response to Submissions
SINCLAIR KNIGHT MERZ
I:\WVES\Projects\WV03196\Deliverables\09_PERResponse\09_20090513\FremantlePER_PERSupplement_WV03196_Rev2.doc PAGE 157

Fremantle Ports Fremantle Port Inner Harbour and Channel Deepening Public Environmental Review Supplement and Response to Submissions
SINCLAIR KNIGHT MERZ
I:\WVES\Projects\WV03196\Deliverables\09_PERResponse\09_20090513\FremantlePER_PERSupplement_WV03196_Rev2.doc
Appendix D Spoil Ground Stability Modelling Study

marinas boat harbours canals breakwaters seawalls jetties dredging beaches climate change
m p rogers & associates pl ABN 14 062 681 252 consulting engineers specialising in coastal, port and marine projects
Form 001 12/02/07 Unit 2, 133 Main Street Osborne Park WA 6017, Australia e: [email protected] t: +61 8 9444 4045 f: +61 8 9444 4341 Our reference: J769:TSH/BJTS:Letter 09046 Rev 0 Enquiries: Trent Hunt, direct line: 9444 4286
9 April 2009
Mr Lyle Banks Fremantle Ports PO BOX 95 FREMANTLE WA 6959
Dear Lyle
DREDGE SPOIL GROUND STABILITY – WAVE INDUCED CURRENTS
As requested we have investigated the wave induced near-bed currents at several locations in the deep channel and proposed dredge spoil grounds for the channel deepening as part of the Inner Harbour development. Investigation of the potential for sediment movement in these areas was also investigated.
Wave induced currents were estimated from wave modelling at the Deep Water Channel and proposed spoil grounds for a moderate swell and severe storm event. Peak orbital currents in the order of 30 to 60 cm/s were calculated for the locations. The greatest currents were calculated for the Deep Water Channel location for both modelled events.
Sediment transport at the three locations was estimated for the swell and severe storm events. The investigations suggested that under moderate swell conditions there was no sediment transport at either the Deep Water Channel or the spoil grounds. Some minor sediment transport was estimated at the Deep Water Channel under the severe storm event and smaller transport rates on the spoil grounds.
Subsequently, sediment movement on either of the proposed spoil grounds is estimated to be very low and less than the existing case at the Deep Water Channel.
We trust this meets your requirements but please do not hesitate to contact us if you have any queries or wish to discuss any aspects of this letter report.
Yours sincerely
for and on behalf of m p rogers & associates pl

09046 Rev 0
April 2009
Fremantle Ports
Deep Water Channel Deepening - Dredge Spoil Ground Stability
Job J769, Letter Report 09046 Rev 0 Record of Document Revisions
Rev Purpose of Document Prepared Reviewed Approved Date
A Draft for MRA review B Smith T Hunt M Rogers 9/04/09
0 Issued for Client use B Smith T Hunt M Rogers 9/04/09
m p rogers & associates pl waves currents tides flood levels water quality siltation erosion rivers beaches estuaries climate change t: +618 9444 4045 f: +618 9444 4341 e: [email protected] Unit 2, 133 Main Street, Osborne Park WA 6017, AUSTRALIA

m p rogers & associates pl Job J769, Deep Water Channel Deepening - Dredge Spoil Ground Stability Letter 09046 Rev 0, Page 3
Limitations of this Document This document has been prepared for use by the Client in accordance with the agreement between the Client and M P Rogers & Associates Pty Ltd. This agreement includes constraints on the scope, budget and time available for the services. The consulting services and this document have been completed with the degree of skill, care and diligence normally exercised by members of the engineering profession performing services of a similar nature. No other warranty, expressed or implied, is made as to the accuracy of the data and professional advice included. This document has not been prepared for use by parties other than the Client and its consulting advisers. It may not contain sufficient information for the purposes of other parties or for other uses.
M P Rogers & Associates takes no responsibility for the completeness or form of any subsequent copies of this document. Copying this document without the permission of the Client or M P Rogers & Associates Pty Ltd is not permitted.

m p rogers & associates pl Job J769, Deep Water Channel Deepening - Dredge Spoil Ground Stability Letter 09046 Rev 0, Page 4
Table of Contents 1. Introduction 8
2. Wave Modelling 10
2.1 2GWave Model 10
2.2 Model Inputs 10
2.3 Modelled Events 12
2.4 Model Results 15
3. Seabed Stability 21
3.1 Wave Induced Near-Bed Velocities 21
3.2 Van Rijn Method of Sediment Movement 30
4. Summary and Conclusions 35
5. References 36

m p rogers & associates pl Job J769, Deep Water Channel Deepening - Dredge Spoil Ground Stability Letter 09046 Rev 0, Page 5
Table of Figures Figure 1.1 – Project Location (SKM 2009) 9
Figure 2.1 – Wave Model Grid Extent 11
Figure 2.2 – Time History of Swell Event at South-west Rottnest 13
Figure 2.3 – Time History of Severe Storm Event at South-west Rottnest 14
Figure 2.4 – Spatial Plot of Wave Conditions During Swell Event 15
Figure 2.5 – Swell Time History at Deep Water Channel Buoy 16
Figure 2.6 – Spatial Plot of Wave Conditions During Severe Storm Event 17
Figure 2.7 – Severe Storm Time History at Deep Water Channel Buoy 18
Figure 2.8 – Spatial Plot of Swell Wave Conditions Post Dredge Spoil Placement 19
Figure 2.9 – Spatial Plot of Severe Storm Wave Conditions Post Dredge Spoil Placement 20
Figure 3.1 – Spatial Plot of Peak Near-Bed Orbital Velocity During the Swell Event 23
Figure 3.2 – Spatial Plot of Peak Near-Bed Orbital Velocity During the Swell Event – Post Dredge Spoil Placement 24
Figure 3.3 – Time History of Peak Near-Bed Orbital Velocity During the Swell Event 25
Figure 3.4 – Spatial Plot of Peak Near-Bed Orbital Velocity During the Severe Storm Event 26
Figure 3.5 – Spatial Plot of Peak Near-Bed Orbital Velocity During the Severe Storm Event – Post Dredge Spoil Placement 27
Figure 3.6 – Time History of Peak Near-Bed Orbital Velocity During the Severe Storm Event 28
Figure 3.7 – Predicted Sediment Transport During Swell Event 32
m p rogers & associates pl Job J769, Deep Water Channel Deepening - Dredge Spoil Ground Stability Letter 09046 Rev 0, Page 6
Figure 3.8 – Predicted Sediment Transport During Severe Storm Event 33

m p rogers & associates pl Job J769, Deep Water Channel Deepening - Dredge Spoil Ground Stability Letter 09046 Rev 0, Page 7
Table of Tables Table 2.1 Modelled Wave Events 12
Table 3.1 Summary of Peak Near-Bed Orbital Velocities 29
Table 3.2 Sources of Information Used in the van Rijn Method 31
Table 3.2 Summary of Peak van Rijn Sediment Movement Rates 34

m p rogers & associates pl Job J769, Deep Water Channel Deepening - Dredge Spoil Ground Stability Letter 09046 Rev 0, Page 8
1. Introduction Fremantle Ports are proposing to deepen sections of the Deep Water Channel as part of a project to allow ships with draft of 14 m to utilise the Fremantle Inner Harbour. The project also includes deepening of the Inner Harbour and Entrance Channel and reclamation of an area of seabed at Rous Head. The various aspects of the project are presented in Figure 1.1, reproduced from the PER document (SKM 2009).
The dredged material from the deepening of the Deep Water Channel is proposed to be disposed of in a spoil ground in Gage Roads. Advice from Fremantle Ports (FP) is that the material will be placed up to 3 m thick on the sea bed of the spoil ground area.
The Department of Environment and Conservation (DEC) have queried the long-term stability of the dredge material when placed in the spoil ground. To assist in determining the stability, FP engaged specialist coastal engineers M P Rogers & Associates Pty Ltd (MRA) to estimate the wave induced currents in the Deep Water Channel and dredge spoil grounds and investigate the potential for movement of sediment in these areas. Specifically, MRA were requested to:
• Complete wave modelling of a moderate swell and severe storm event to determine wave conditions in the project areas.
• Estimate near-bed orbital velocities in the Deep Water Channel, the Proposed Spoil ground and an Alternative Spoil ground.
• Estimate the potential for sediment movement at depth using van Rijn formulas.
This report presents the results of these investigations.

m p rogers & associates pl Job J769, Deep Water Channel Deepening - Dredge Spoil Ground Stability Letter 09046 Rev 0, Page 9
Figure 1.1 – Project Location (SKM 2009)
Deep Water Channel
Proposed Spoil Ground
Alternative Spoil Ground
Fremantle Inner Harbour

m p rogers & associates pl Job J769, Deep Water Channel Deepening - Dredge Spoil Ground Stability Letter 09046 Rev 0, Page 10
2. Wave Modelling 2.1 2GWave Model MRA has developed a sophisticated wave model capable of properly modelling the changes in wave conditions as they travel from deep water to the shore. This model is called 2GWAVE and is a modified version of Prof Ian Young’s ADFA1 model. The modifications to ADFA1 ensure that 2GWAVE properly accounts for the complex changes in wave conditions caused by reefs, banks, seagrass meadows, nearshore bathymetry and atmospheric input. The physical processes explicitly modelled include:
• spectral wave refraction and shoaling;
• spectral wave generation by wind;
• spectral wave dissipation by turbulence in the bottom boundary layer;
• spectral wave dissipation by white-capping;
• spectral wave dissipation by depth limited breaking; and
• non linear wave / wave interactions.
The model is described in detail by MRA (1995) and has previously been calibrated and validated using comprehensive directional wave measurements south-west of Rottnest Island, on Success Bank, in Owen Anchorage and in Cockburn Sound (MRA 1995, 2007a, 2007b). The validation of MRA (2007a) was peer reviewed by Prof Ian Young and found to be “an adequate tool for the prediction of changes in the nearshore wave climate resulting from the effects of dredging.” The model is therefore considered validated and appropriate for this study.
The study area for this project is the same as that validated and used in MRA (2007b). The validated model was used to estimate the nearshore wave climate near Deep Water Channel.
2.2 Model Inputs 2.2.1 Grids MRA have a coarse model grid covering the area from Rockingham in the south to North Beach in the north and offshore to the 100 m contour. This coarse grid is at 1,000 m resolution and has previously been validated against wave measurements from the Deep Water Channel buoy. The coarse grid covers the area of interest with adequate resolution over the Deep Water Channel and disposal grounds. The extent of the grid is presented in Figure 2.1.
The model requires three types of grid files to be input - bathymetry, bed codes and friction factors. General bathymetry over the coarse grid is shown in Figure 2.1. The model was run for 2 separate bathymetry cases – one with the existing case to estimate conditions at Deep Water Channel and one with a 3 m layer added to the disposal grounds to estimate wave conditions in these areas. This will enable any changes to wave conditions due to the shallowing of the seabed to be included.
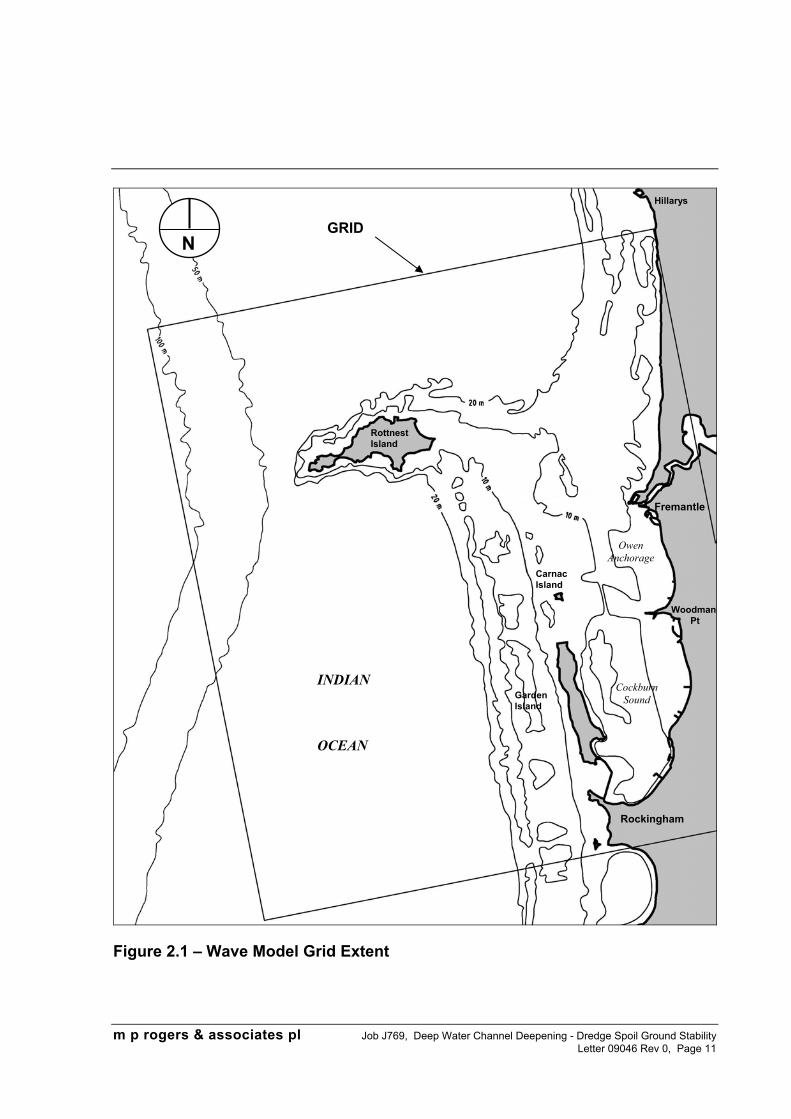
m p rogers & associates pl Job J769, Deep Water Channel Deepening - Dredge Spoil Ground Stability Letter 09046 Rev 0, Page 11
Figure 2.1 – Wave Model Grid Extent
Rottnest Island
Fremantle
Rockingham
Hillarys
Woodman Pt
INDIAN
OCEAN
N GRID
Cockburn Sound
Owen Anchorage
Garden Island
Carnac Island

m p rogers & associates pl Job J769, Deep Water Channel Deepening - Dredge Spoil Ground Stability Letter 09046 Rev 0, Page 12
The bed codes are used to specify grid boundaries, areas of land, input points and detailed output locations. A number of output locations were selected around the Deep Water Channel and the spoil disposal ground.
Three different friction factors are used for the different seabed types of sand, seagrass and reef. MRA (2007b) validated the wave model for the Port Beach area using measurements from the Deep Water Channel buoy. The same friction factors were used for this work.
2.2.2 Wave Input To calculate wave conditions over the model domain, 2GWAVE requires a time series input of directional wave spectra along the boundaries of the grid. For the model runs in this study, wave measurements taken from the Waverider buoy deployed south-west of Rottnest during 1994/1995 were used. The buoy was located in a water depth of approximately 48 m. Detailed discussion of this measurement programme and the events is provided in MRA (1995).
2.2.3 Wind Input Wind speed and directions from Rottnest Island and Fremantle were used to predict locally generated seas within the model boundaries. This wind data was corrected and scaled for height and location of the measurement instruments.
2.3 Modelled Events MRA have previously estimated wave induced currents throughout Owen Anchorage and Cockburn Sound (MRA 1996). This work indicated that the greatest near-bed currents were generated under periods of moderate swell or in severe storms.
For this study a period of moderate winter swell and a severe winter storm were therefore selected to model. Details of these events are provided in Table 2.1.
Table 2.1 Modelled Wave Events
Event Date Max Wind Speed
Wind Direction
South-west Rottnest
Hs (m) Tp (s) Tz (s) Dir (°)
Winter Swell 28 -29/09/94
21 kph variable 2.1 - 3.7 12.9 – 14.8
8.5 – 10.0
W - WSW
Severe Storm 11 -13/07/95
75 kph N – SW 1.9 - 7.4 6.3 – 14.9
5.2 – 9.0
NW - SW
Plots of the time history of offshore wave conditions for the 2 events are presented in Figures 2.2 and 2.3. Both the swell event and severe storm event were run with the existing bathymetry and with the 3 m layer of fill added to the dredge spoil grounds.

m p rogers & associates pl Job J769, Deep Water Channel Deepening - Dredge Spoil Ground Stability Letter 09046 Rev 0, Page 13
Figure 2.2 – Time History of Swell Event at South-west Rottnest

m p rogers & associates pl Job J769, Deep Water Channel Deepening - Dredge Spoil Ground Stability Letter 09046 Rev 0, Page 14
Figure 2.3 – Time History of Severe Storm Event at South-west Rottnest

m p rogers & associates pl Job J769, Deep Water Channel Deepening - Dredge Spoil Ground Stability Letter 09046 Rev 0, Page 15
2.4 Model Results 2.4.1 Swell Event The modelled swell event reaches approximately 4.5 m in significant wave height offshore, with peak period generally between 14 and 16 s. This type of event may be experienced for around 50 days of the year.
A spatial plot of the wave conditions across the grid during the swell event are presented in Figure 2.4. The figure indicates that the wave height is generally attenuated across the offshore reefs and decreases to around 2 m near the Deep Water Channel.
Figure 2.4 – Spatial Plot of Wave Conditions During Swell Event
Figure 2.5 presents a comparison of measured and modelled wave heights at the Cottesloe Deep Water Channel wave buoy. This buoy is non-directional and no comparison can be made of direction. However the comparison of significant wave height and period indicates the model is representing wave conditions in the area of interest well.
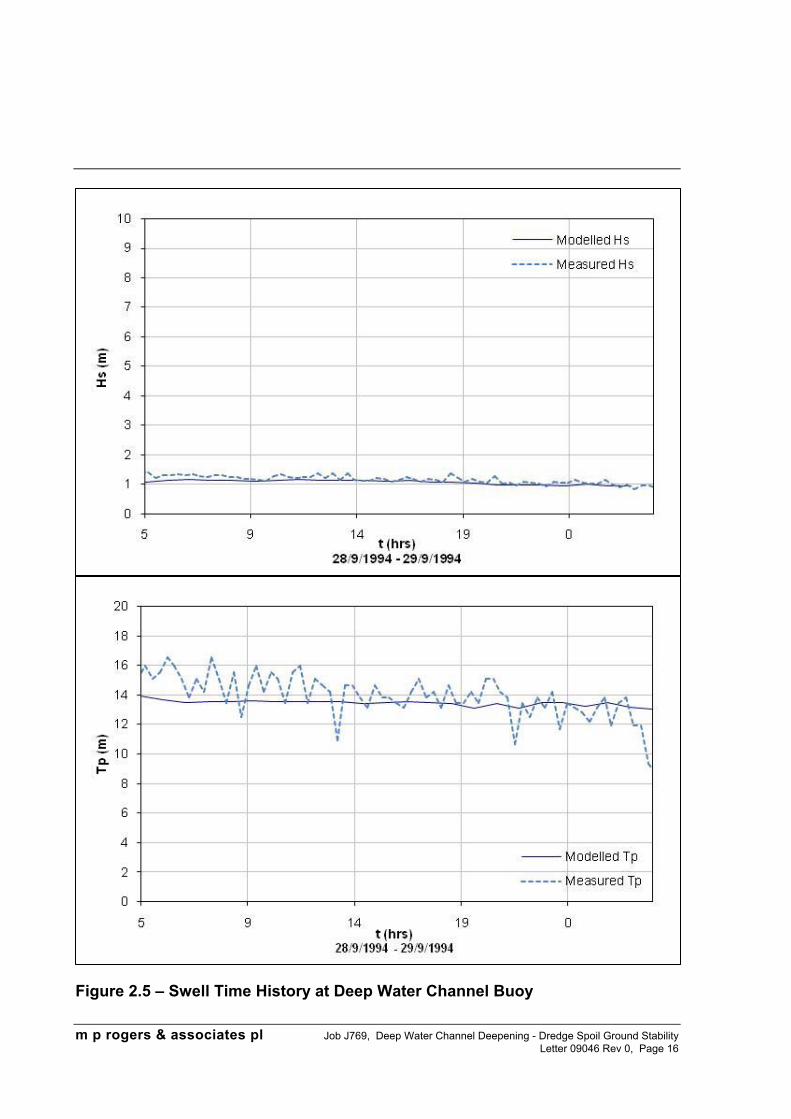
m p rogers & associates pl Job J769, Deep Water Channel Deepening - Dredge Spoil Ground Stability Letter 09046 Rev 0, Page 16
Figure 2.5 – Swell Time History at Deep Water Channel Buoy

m p rogers & associates pl Job J769, Deep Water Channel Deepening - Dredge Spoil Ground Stability Letter 09046 Rev 0, Page 17
2.4.2 Severe Storm Event The modelled severe storm event simulates a storm which swings from north-west, through west to south-west over approximately 40 hours. The significant wave height reaches nearly 8 m offshore and is reduced to approximately 4 m at the Cottesloe Deep Channel buoy. This is a large storm event which may be experienced on average once or twice a year.
A spatial plot of the wave conditions across the model domain during the storm is presented in Figure 2.6. The winds at this time are from the north-west.
Figure 2.6 – Spatial Plot of Wave Conditions During Severe Storm Event
Figure 2.7 presents a comparison of the measured and modelled wave heights at the Cottesloe Deep Water Channel wave buoy. Again the comparison indicates that the model is representing measured conditions well.

m p rogers & associates pl Job J769, Deep Water Channel Deepening - Dredge Spoil Ground Stability Letter 09046 Rev 0, Page 18
Figure 2.7 – Severe Storm Time History at Deep Water Channel Buoy

m p rogers & associates pl Job J769, Deep Water Channel Deepening - Dredge Spoil Ground Stability Letter 09046 Rev 0, Page 19
2.4.3 Post Dredge Spoil Placement Model Runs The swell and severe storm event were run again for a bathymetry including placement of a 3 m layer of fill in the dredge spoil grounds. This allows any modifications to wave conditions from the placement of the fill to be incorporated into estimates of wave induced currents. The shallowing of the dredge spoil ground was the only modification made to these runs.
Spatial plots from the swell and severe storm events for the changed bathymetry are presented in Figures 2.8 and 2.9. They indicate there is minimal noticeable change in wave conditions caused by the shallowing of the dredge spoil area.
Figure 2.8 – Spatial Plot of Swell Wave Conditions Post Dredge Spoil Placement

m p rogers & associates pl Job J769, Deep Water Channel Deepening - Dredge Spoil Ground Stability Letter 09046 Rev 0, Page 20
Figure 2.9 – Spatial Plot of Severe Storm Wave Conditions Post Dredge Spoil Placement

m p rogers & associates pl Job J769, Deep Water Channel Deepening - Dredge Spoil Ground Stability Letter 09046 Rev 0, Page 21
3. Seabed Stability 3.1 Wave Induced Near-Bed Velocities Linear wave theory was used to estimate the near-bed wave induced orbital currents because its formulation is relatively simple and its accuracy has been assessed by field work. According to Steedman Science & Engineering (1992), orbital currents inferred using linear wave theory from parameters derived from the wave spectrum (Hs and Tz) are generally greater than their true value due to the directional spread in the wave climate. The greater the directional spread, the less accurate (more overestimated) the linear theory estimates. In strongly directional storm waves and swell, linear theory is believed to overestimate near-bed orbital currents by approximately 10 %, while in confused sea-states this typically ranges up to 25 % (Steedman Science & Engineering 1992).
According to linear theory (CERC 1977), the horizontal component of the wave induced orbital currents of a monochromatic sinusoidal wave is given by:
( )[ ] )cos()sinh(
cosh),,( tkxkd
dzkTHtzxu σπ
−+
= [3.1]
where: H : wave height (m),
T : wave period (sec),
d : depth (m),
x : horizontal ordinate (m) in the direction of wave propagation,
z : vertical ordinate (m) positive up and zero at SWL,
kL
=2π : wavenumber (m-1), and
σ π=
2T
: frequency (Hz).
Equation 3.1 gives the variation of the horizontal orbital currents in time and space (both vertically and horizontally). The peak value of the orbital current at some distance R above a point on the sea bed is given by:
$cosh( )sinh( )
u HT
RkkdR =
π [3.2]
Equations 3.1 and 3.2 apply to a sinusoidal wave form of single height, frequency and direction. Such a simplistic description is rarely sufficient for oceanic wave climates. The most accurate description of such wave climates is a directional wave spectrum. This information is provided by the 2GWave model at every grid point, at any time step in the

m p rogers & associates pl Job J769, Deep Water Channel Deepening - Dredge Spoil Ground Stability Letter 09046 Rev 0, Page 22
simulation. Summary parameters of a directional spectrum can be calculated, as follows (Goda 1985):
H ms = 4 0 0. [3.3]
T mmz = 0
2 [3.4]
m f E f d dfii=
∞
∫ ∫0 0
2πθ θ( , ) [3.5]
where: Hs is a spectral estimate of the significant wave height (defined in the time domain as the mean height of the highest one third of waves) which approximates the visual estimate of the wave height of a sea state as judged by an experienced observer,
Tz is a spectral estimate of the mean zero up-crossing period (a time domain definition - individual waves are defined by up-crossings of the water level with respect to the still water level), and
E f( , )θ is the directional power spectrum of the wave climate, f denoting the frequency domain and θ the direction domain.
Using Hs in place of H and Tz for T in equations 3.1 and 3.2, estimates of the peak near-bed orbital currents were calculated at a distance of 0.5 m above the sea bed. These calculations were performed for pre and post dredging conditions for the two different met-ocean conditions. Both the peak near-bed orbital currents ( $ .u m0 5 ) and the square of this value ( $ .u m0 5
2 ), have been computed at every grid point for each case. The square of any fluid velocity is directly proportional to its kinetic energy (the energy of the fluid due to its motion). Hence, $ .u m0 5
2 is an indicator of the kinetic energy of the wave induced oscillatory motion experienced 0.5 m above the sea bed.
3.1.1 Swell Event
The estimates of $ .u m0 5 and $ .u m0 52 obtained during the swell wave event is presented in Figure 3.1.
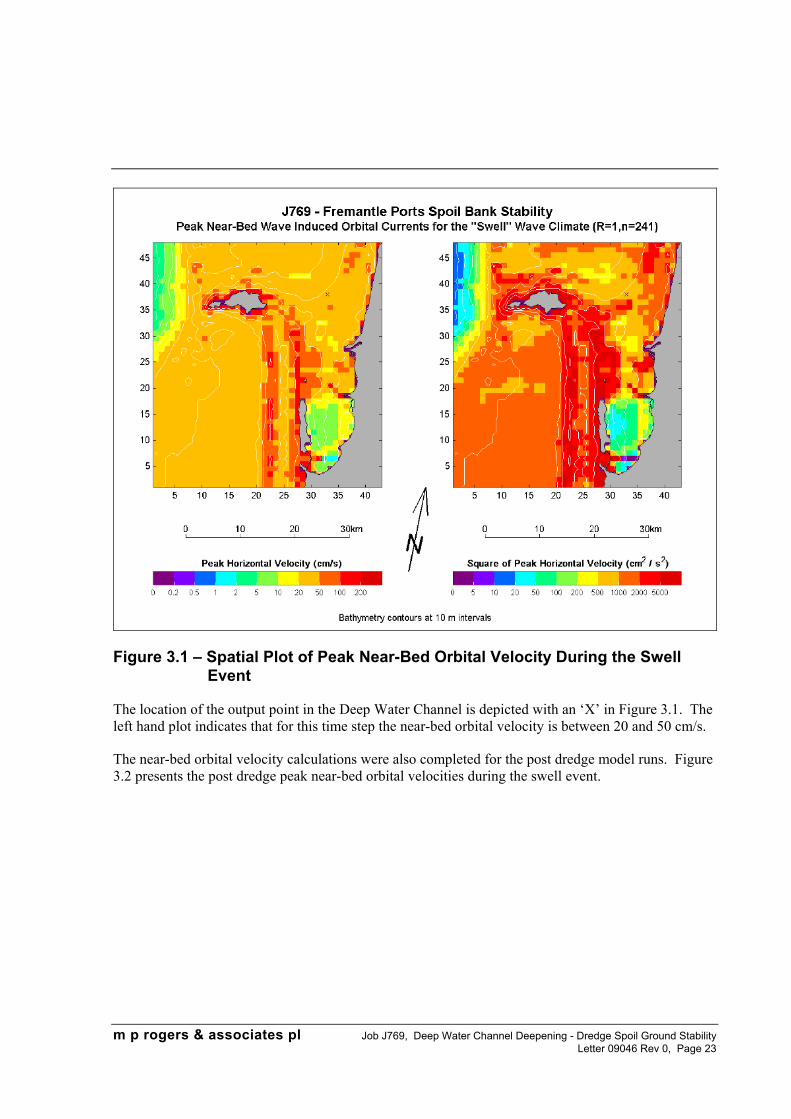
m p rogers & associates pl Job J769, Deep Water Channel Deepening - Dredge Spoil Ground Stability Letter 09046 Rev 0, Page 23
Figure 3.1 – Spatial Plot of Peak Near-Bed Orbital Velocity During the Swell Event
The location of the output point in the Deep Water Channel is depicted with an ‘X’ in Figure 3.1. The left hand plot indicates that for this time step the near-bed orbital velocity is between 20 and 50 cm/s.
The near-bed orbital velocity calculations were also completed for the post dredge model runs. Figure 3.2 presents the post dredge peak near-bed orbital velocities during the swell event.

m p rogers & associates pl Job J769, Deep Water Channel Deepening - Dredge Spoil Ground Stability Letter 09046 Rev 0, Page 24
Figure 3.2 – Spatial Plot of Peak Near-Bed Orbital Velocity During the Swell Event – Post Dredge Spoil Placement
The northern ‘X’ in Figure 3.2 depicts the output location of the Proposed Spoil ground while the southern ‘X’ depicts the output location of the Alternative Spoil ground. The left hand plot in Figure 3.2 indicates that for this time step the near-bed orbital velocity is between 20 and 50 cm/s at both spoil grounds.
Time histories were also output at the following locations of interest:
• Deep Water Channel;
• Proposed Spoil ground; and
• Alternative Spoil ground.
Time histories of the near-bed orbital velocities at these locations for the swell event are shown in Figure 3.3.

m p rogers & associates pl Job J769, Deep Water Channel Deepening - Dredge Spoil Ground Stability Letter 09046 Rev 0, Page 25
Figure 3.3 – Time History of Peak Near-Bed Orbital Velocity During the Swell Event
Figure 3.3 shows that the near-bed orbital velocities:
• at the Deep Water Channel decrease from approximately 30 cm/s to 20 cm/s over the duration of the swell event.
• at the Proposed Spoil ground decrease from approximately 25 cm/s to approximately 15 cm/s over the duration of the swell event.
• at the Alternative Spoil ground decrease from approximately 30 cm/s to approximately 20 cm/s over the duration of the swell event; and
• are greatest at the existing Deep Water Channel location.
3.1.2 Severe Storm Event
The estimates of $ .u m0 5 and $ .u m0 52 obtained at the peak of the severe storm event is presented in Figure
3.4.

m p rogers & associates pl Job J769, Deep Water Channel Deepening - Dredge Spoil Ground Stability Letter 09046 Rev 0, Page 26
Figure 3.4 – Spatial Plot of Peak Near-Bed Orbital Velocity During the Severe Storm Event
The location of the output point in the Deep Water Channel is depicted as an ‘X’ in Figure 3.4. The left hand plot indicates that at the peak of the storm the near-bed orbital velocity is between 50 and 100 cm/s.
Figure 3.5 presents the post dredge peak near-bed orbital velocities during the severe storm event.

m p rogers & associates pl Job J769, Deep Water Channel Deepening - Dredge Spoil Ground Stability Letter 09046 Rev 0, Page 27
Figure 3.5 – Spatial Plot of Peak Near-Bed Orbital Velocity During the Severe Storm Event – Post Dredge Spoil Placement
The northern ‘X’ in Figure 3.5 depicts the output location within the Proposed Spoil ground while the southern ‘X’ depicts the output location within the Alternative Spoil ground. The left hand plot indicates that at the peak of the storm:
• the Proposed Spoil ground has a near-bed orbital velocity of around 50 cm/s; and
• the Alternative Spoil ground has a near-bed orbital velocity of between 20 and 50 cm/s.
Time histories were also output at the three locations of interest for the severe storm event, as shown in Figure 3.6.

m p rogers & associates pl Job J769, Deep Water Channel Deepening - Dredge Spoil Ground Stability Letter 09046 Rev 0, Page 28
Figure 3.6 – Time History of Peak Near-Bed Orbital Velocity During the Severe Storm Event
Figure 3.6 shows that the near-bed orbital velocity:
• at the Deep Water Channel increases from around 5 cm/s to peak at approximately 60 cm/s and tails off to approximately 40 cm/s during the severe storm event;
• at the Proposed Spoil ground increases from approximately 5 cm/s, peaks just above 40 cm/s and tails off to approximately 30 cm/s during the severe storm event;
• at the Alternative Spoil ground increases from approximately 5 cm/s, peaks at approximately 30 cm/s and tails off to approximately 25 cm/s during the severe storm event; and
• the peak near-bed orbital velocity is much greater at the existing Deep Water Channel location than either of the dredge spoil grounds.
3.1.3 Summary of Peak Near-Bed Orbital Velocities The results presented above are summarised in Table 3.1.

m p rogers & associates pl Job J769, Deep Water Channel Deepening - Dredge Spoil Ground Stability Letter 09046 Rev 0, Page 29
Table 3.1 Summary of Peak Near-Bed Orbital Velocities
Location Peak Near-Bed Orbital Velocity (cm/s)
Swell Event Severe Storm Event
Deep Water Channel 32 62
Proposed Spoil Ground 27 41
Alternative Spoil Ground 29 34
Table 3.1 shows that the peak near-bed velocity ranges from 27 to 62 cm/s for the two modelled events at the three locations. The table highlights that the peak orbital velocities are significantly greater at the Deep Water Channel site than the spoil grounds.
A variety of research has been conducted with the aim of establishing a link between near-bed wave induced orbital currents and the initiation of sediment motion. One of the most commonly used methods is the van-Rijn method (van Rijn, 1989). This method is outlined in Section 3.2.

m p rogers & associates pl Job J769, Deep Water Channel Deepening - Dredge Spoil Ground Stability Letter 09046 Rev 0, Page 30
3.2 Van Rijn Method of Sediment Movement Van Rijn (1989) provides techniques for calculating the sediment transport rates caused by waves and currents. This technique, which has been termed the van Rijn method, accounts for the following parameters:
• Fluid properties – viscosity, density and temperature;
• Sediment properties – density, porosity, angle of repose, particle size, shape and fall velocity;
• Bed forms – flat, ripples, dunes, bars and washed out dunes;
• Bed roughness; and
• Hydraulic loads – shear stress and pressure fluctuations caused by currents and waves.
The van Rijn method applies these parameters in a number of complex computations to calculate the initiation of motion and suspension, the bed load transport rate and the suspended load transport rate. The accuracy of the calculation method has been compared to measurements from experiments in large laboratory flumes and a number of field locations.
These calculations require a great deal of information to adequately represent the physical conditions. The basic parameters that are required, together with the source of the information for the present work are listed in Table 3.2 on the next page.

m p rogers & associates pl Job J769, Deep Water Channel Deepening - Dredge Spoil Ground Stability Letter 09046 Rev 0, Page 31
Table 3.2 Sources of Information Used in the van Rijn Method
Parameters Source of Information
Fluid Properties (density, viscosity and temperature)
Oceanographic texts and measurements in region
Sediment Properties (density, particle size distribution and fall
velocity)
Measurements of sediments from the Deep Water Channel
Bed Forms and Roughness (flat, ripples or dunes)
Calculated in the van Rijn method
Wave Conditions (heights, periods and directions)
Output from the 2GWAVE model runs outlined above
Wave Kinematics (orbital currents, pressure fluctuations and Stokes
Drift)
Calculated in the van-Rijn method and generally based on linear wave theory
Currents (wind, tide and drift currents)
Current measurements from around 20 m of water at Cape Peron and checked against measurements taken for FP at
proposed spoil ground
Water Depths Deep Water Channel = 16 m Proposed Spoil Ground = 17 m Alternative Spoil Ground = 19 m
3.2.1 Swell Event The van Rijn method was completed for the swell event at the following locations:
• Deep Water Channel;
• Proposed Spoil ground; and
• Alternative Spoil ground.
Figure 3.7 presents the output of the van Rijn method at these locations for the swell event.

m p rogers & associates pl Job J769, Deep Water Channel Deepening - Dredge Spoil Ground Stability Letter 09046 Rev 0, Page 32
Figure 3.7 – Predicted Sediment Transport During Swell Event
Figure 3.7 shows almost zero sediment transport at all three locations during the swell event. This suggests that all three locations are stable under the prevailing swell conditions.
3.2.2 Severe Storm Event The van Rijn method was also completed for the severe storm event at the three locations of interest. Figure 3.8 presents the output of the van Rijn method for the severe storm event.

m p rogers & associates pl Job J769, Deep Water Channel Deepening - Dredge Spoil Ground Stability Letter 09046 Rev 0, Page 33
Figure 3.8 – Predicted Sediment Transport During Severe Storm Event
Figure 3.8 shows that there is some minor sediment movement, approximately 190 m3/day per m, predicted at the Deep Water Channel under the severe storm event. To put this rate in context, peak movement rates of approximately 2,500 m3/day per m have been estimated on Success Bank during the severe storm event (MRA 2007c).
Very minor sediment transport rates were predicted at the two dredge spoil disposal sites in the severe storm; up to 45 m3/day per m at the Proposed Spoil ground and up to 15 m3/day per m at the Alternative Spoil ground.

m p rogers & associates pl Job J769, Deep Water Channel Deepening - Dredge Spoil Ground Stability Letter 09046 Rev 0, Page 34
3.2.3 Summary of van Rijn Results Results of the van Rijn method are summarised in Table 3.2.
Table 3.2 Summary of Peak van Rijn Sediment Movement Rates
Location Peak Sediment Transport (m3/day per m) 1
Swell Event Severe Storm Event
Deep Water Channel 0 190
Proposed Spoil Ground 0 45
Alternative Spoil Ground 0 15 Notes: 1. The peak sediment transport for the duration of the Swell and Severe Storm event are presented above.
The van Rijn method predicts almost zero sediment movement at all three locations under swell wave conditions. These moderate swell conditions could be expected approximately 50 times per year.
Under the severe storm event the predicted sediment transport rates are minor at all three locations. Importantly, the predicted sediment transport is much higher in the Deep Water Channel than at the two dredge spoil grounds. Anecdotal evidence from FP suggests that little movement of sediment has been noted in the existing Deep Water Channel location (pers comm. Lyle Banks, FP).
The transport rates above suggest that the dredged material will be more stable in either of the spoil grounds than in the current Deep Water Channel location. It is anticipated that the sediment movement in either of the spoil grounds will be small and less than the natural movement at the Deep Water Channel location.

m p rogers & associates pl Job J769, Deep Water Channel Deepening - Dredge Spoil Ground Stability Letter 09046 Rev 0, Page 35
4. Summary and Conclusions Fremantle Ports are proposing to deepen sections of the Deep Water Channel as part of a project to allow ships with draft of 14 m to utilise the Fremantle Inner Harbour. The DEC have queried the long-term stability of dredge material placed in spoil grounds as part of this project. Fremantle Ports engaged MRA to:
• Complete wave modelling of a moderate swell and severe storm event to determine wave conditions in the project areas.
• Estimate near-bed orbital velocities in the Deep Water Channel, the Proposed Spoil ground and an Alternative Spoil ground.
• Estimate the potential for sediment movement at depth using the van Rijn method.
The A grid of the validated 2GWAVE wave model was used to determine the wave conditions in this study. Measured waves at Fremantle Ports’ Deep Water Channel buoy compared well with output from the two modelled wave events. This wave buoy is very close to the area of interest and reinforces the validity of the 2GWAVE model for this study.
The wave induced near-bed velocities were calculated for the two wave events. The peak near-bed orbital velocities during the swell event ranged from 27 cm/s at the Proposed Spoil ground to 32 cm/s at the Deep Water Channel. The peak near bed orbital velocities during the severe storm event ranged from 34 cm/s at the Alternative Spoil ground to 64 cm/s at the Deep Water Channel. In both events the greatest orbital velocities were calculated at the Deep Water Channel.
The van Rijn method was used to determine the magnitude of sediment transport under the different wave conditions. The results indicated that there was zero transport under the swell event and minor transport under the severe storm event. The estimated transport at the proposed spoil grounds was much less than at the existing Deep Water Channel location.
Subsequently, sediment movement on either of the proposed spoil grounds is estimated to be very low.

m p rogers & associates pl Job J769, Deep Water Channel Deepening - Dredge Spoil Ground Stability Letter 09046 Rev 0, Page 36
5. References CERC (U.S. Army Coastal Engineering Research Centre), 1977. Shore Protection Manual,
Department of the Army, Corps of Engineers, Virginia, United States of America.
Goda, Y., 1985. Random Seas and Maritime Structures, University of Tokyo Press, Tokyo, Japan.
M P Rogers & Associates Pty Ltd, 1995. Owen Anchorage Wave Model Set-up, Calibration & Verification, R008 Rev 1. Prepared for Cockburn Cement Ltd, Perth, Western Australia.
M P Rogers & Associates Pty Ltd, 1996. Owen Anchorage Near-bed Wave Induced Orbital Currents Study, R022 Rev 1. Prepared for Cockburn Cement Ltd, Perth, Western Australia.
M P Rogers & Associates Pty Ltd, 2007a. Cockburn Wave Modelling 2004 – Wave Model Validation, R142 Rev 0. Prepared for Cockburn Cement Ltd, Perth Western Australia.
M P Rogers & Associates Pty Ltd, 2007b. Port Beach - Wave and Shoreline Modelling, R177 Rev 0. Prepared for Department for Planning & Infrastructure, Perth Western Australia.
M P Rogers & Associates Pty Ltd, 2007c. Stage 1 and 2 Dredging Wave Modelling, R212 Rev 0. Prepared for Cockburn Cement Ltd, Perth Western Australia.
Sinclair Knight Merz, 2009. Fremantle Port Inner Harbour & Channel Deepening, Reclamation at Rous Head and Offshore Placement of Dredged Material – Public Environmental Review. Prepared for Fremantle Ports, Perth, Western Australia.
Steedman Science & Engineering, 1992. Technical Note No. 150, Wave Kinematics - Measurement, Modelling and Application, Steedman Science & Engineering, Perth, Australia.

Fremantle Ports Fremantle Port Inner Harbour and Channel Deepening
Public Environmental Review Supplement and Response to Submissions
SINCLAIR KNIGHT MERZ
I:\WVES\Projects\WV03196\Deliverables\09_PERResponse\09_20090513\FremantlePER_PERSupplement_WV03196_Rev2.doc PAGE 157
Appendix E Hydrodynamic Modelling Verification

F R E M A N T L E P O R T A U T H O R I T Y
Inner Harbour Development
Hydrodynamic Modelling Verification
May 2009
GEMS
G L O B A L E N V I R O N M E N T A L M O D E L L I N G S Y S T E M S
G L O B A L E N V I R O N M E N T A L M O N I T O R I N G S Y S T E M S

GEMS – Global Environmental Modelling Systems Pty. Ltd.
Fremantle Inner Harbour - Hydrodynamic Modelling Verification Page 2
GEMS Contact Details
Melbourne Office
Telephone: +61 (0)3 8683 5405
PO Box 149
Warrandyte VIC 3113
Perth Office
Telephone: +61 (0)8 6364 0880
PO Box 1432
Subiaco WA 6097
Dr Graeme D Hubbert
Head of Oceanographic Studies
Fixed phone: +61 (0)3 8683 5405
Mobile: +61 (0)418 36 63 36
Email: graeme.hubbert@gems‐aus.com
Steve Oliver
Head of Meteorological and Wave Studies
Mobile: +61 (0)408 81 8702
Email: steve.oliver@gems‐aus.com
Matt Eliot
Coastal Engineer
Mobile: +61 (0)408 414 225
Email: matt.eliot@gems‐aus.com
Website : www.gems‐aus.com
About GEMS
Global Environmental Modelling Systems (GEMS), a wholly owned Australian company, has expertise in the development and application of high‐resolution computer models to realistically predict atmospheric and oceanographic conditions for use in riverine, coastal and oceanic settings. The GEMS team is made up of qualified and experienced physical oceanographers, meteorologists, numerical modellers and environmental scientists. GEMS is a leading developer of numerical models in Australia. It has developed a system of validated environmental models and rigorous analytical procedures that provide solutions to a variety of environmental, engineering and operational problems.
Disclaimer
This report and the work undertaken for its preparation, is presented for the use of the SKM and the project proponent (BHPBIO). GEMS warrants that the study was carried out in accordance with accepted practice and available data, but that no other warranty is made as to the accuracy of the data or results contained in the report.
This GEMS report may not contain sufficient or appropriate information to meet the purpose of other potential users. GEMS, therefore, does not accept any responsibility for the use of the information in the report by other parties.

GEMS – Global Environmental Modelling Systems Pty. Ltd.
Fremantle Inner Harbour - Hydrodynamic Modelling Verification Page 3
Contents
1. Introduction ................................................................................................................................................ 5
2. Field Work .................................................................................................................................................. 7
2.1 Measurements of Currents and Tides ...................................................................................... 7
2.2 Drifting Buoy Deployments ...................................................................................................... 7
3. Ocean Circulation Simulation ................................................................................................................... 12
3.1 Bathymetry ............................................................................................................................. 13
3.2 Atmospheric Forcing .............................................................................................................. 13
3.3 Tides ....................................................................................................................................... 13
3.4 Swan River Flow ..................................................................................................................... 13
3.5 Verification against currents measured at the proposed spoil ground .................................. 14
3.6 Verification against the surface drifter tracks in March and April, 2007 ............................... 15
APPENDIX A: DESCRIPTION OF GCOM3D ................................................................................................ 25
A.1 History and Physics ................................................................................................................ 25
A.2 General Description ............................................................................................................... 25
A.3 Horizontal and Vertical Structure .......................................................................................... 26
A.4 Numerical Procedures ........................................................................................................... 27
A.5 Boundary Conditions ............................................................................................................. 27
A.6 Tidal Data Assimilation .......................................................................................................... 28
A.7 Model Applications ................................................................................................................ 28
A.8 GCOM3D References .............................................................................................................. 29
Table of Tables
Table 1: GEMS Drifting Buoy Deployment Locations and FPA Current and Tide Measurement Stations 8

GEMS – Global Environmental Modelling Systems Pty. Ltd.
Fremantle Inner Harbour - Hydrodynamic Modelling Verification Page 4
Table of Figures
Figure 1: Fremantle Inner Harbour dredging study region showing the tide and current data collection locations (CM1 at the proposed spoil ground; CM2 at the north end of Cockburn Sound; CM3 in the Inner Harbour). .................................................................................................................. 6
Figure 2: Wireless GPS Davis drifter prior to deployment. ......................................................................... 9
Figure 3: Wireless GPS Davis drifter in the ocean. ..................................................................................... 9
Figure 4: The two wireless GPS Davis drifter tracks in March 2007 (black dot=release point). ............... 10
Figure 5: The five wireless GPS Davis drifter tracks in April 2007 (black dot=release point). .................. 11
Figure 6: Large scale GCOM3D grid. ......................................................................................................... 16
Figure 7: High resolution GCOM3D inner grid. ......................................................................................... 17
Figure 8: Example of wind and tidal driven currents predicted by GCOM3D during a southerly wind event. 18
Figure 9: West‐east ocean current components at depths of 2m and 17m at CM1. ............................... 19
Figure 10: South‐north ocean current components at depths of 2m and 17m at CM1. ............................ 19
Figure 11: Comparison of near‐surface current speeds measured at CM1 from January 21 to February 12, 2006 (blue) with GCOM3D predictions (red). ...................................................................... 20
Figure 12: Comparison of near‐surface current directions measured at CM1 from February 28 to March 9, 2007 (blue) with GCOM3D predictions (red). ........................................................................ 20
Figure 13: Comparison of near‐surface west‐east current speeds measured at CM1 from February 28 to March 9, 2007 (blue) with GCOM3D predictions (red). ............................................................ 21
Figure 14: Comparison of near‐surface south‐north current directions measured at CM1 from February 28 to March 9, 2007 (blue) with GCOM3D predictions (red). ................................................... 21
Figure 15: Comparison of west‐east current speeds measured at a depth of 17m at CM1 from February 28 to March 29, 2007 (blue) with GCOM3D predictions (red). ................................................. 22
Figure 16: Comparison of south‐north current speeds measured at a depth of 17m at CM1 from February 28 to March 29, 2007 (blue) with GCOM3D predictions (red). .................................. 22
Figure 17: Comparison of the first 2 GPS drifter tracks in March, 2007 with the tracks predicted from GCOM3D near‐surface currents (marked with M). ................................................................... 23
Figure 18: Comparison of the 5 GPS drifter tracks in April, 2007 with the tracks predicted from GCOM3D near‐surface currents (marked with M). ................................................................................... 24

GEMS – Global Environmental Modelling Systems Pty. Ltd.
Fremantle Inner Harbour - Hydrodynamic Modelling Verification Page 5
1. INTRODUCTION
Global Environmental Modelling Systems (GEMS) was contracted by Sinclair Knight Merz (SKM) to supply oceanographic and hydrodynamic modelling services to the Fremantle Port Authority for environmental studies for the proposed dredging program in the Inner Harbour, near the mouth of the Swan River.
The proposed dredging program involves the deepening of the Inner Harbour port areas and some deepening of the access channel between the coast and Rottnest Island. A significant amount of the material from the Inner Harbour dredging is to be used to reclaim and area on the coast, just outside the port and the remainder is to be dumped at an offshore spoil ground. The study region is shown in Figure 1.
The work has been undertaken using three sophisticated numerical computer models:
• The GEMS 3D Coastal Ocean Model (GCOM3D) to simulate the complex three‐dimensional ocean currents in the region;
• The GEMS 3D Dredge Simulation Model (DREDGE3D) to determine the fate of particles released into the water column during the dredging operations; and
• The SWAN wave model to simulate the waves in the region between the coast and Rottnest Island during the dredging operations for calculations of sediment re‐suspension and dredging operability.
In addition a small field program was undertaken to map surface currents with wireless tracked surface drifters to augment existing data available for verification of the wind, wave and ocean models.
This report documents the verification of GCOM3D predictions against the field data.

GEMS – Global Environmental Modelling Systems Pty. Ltd.
Fremantle Inner Harbour - Hydrodynamic Modelling Verification Page 6
Figure 1: Fremantle Inner Harbour dredging study region showing the tide and current data collection locations (CM1 at the proposed spoil ground; CM2 at the north end of Cockburn Sound; CM3 in the Inner Harbour).

GEMS – Global Environmental Modelling Systems Pty. Ltd.
Fremantle Inner Harbour - Hydrodynamic Modelling Verification Page 7
2. FIELD WORK
In order to produce reliable predictions of the fate of turbid plumes during the dredging it is critical to have accurate predictions of the ocean currents and tides.
2.1 MEASUREMENTS OF CURRENTS AND TIDES
A field program measuring winds and currents was undertaken from February to May, 2007 by the FPA. Of importance to this study, current and tide data were collected at the proposed spoil ground and at the northern end of the Cockburn Sound basin (see Figure 1 and Table 1). Long term current and tide data was also available from the inner harbour region of the Swan River.
These field measurements were enhanced by the deployment of five wireless tracked GPS drifting buoys (Davis drifters) for 5 days in the waters between the mouth of the Swan River and Rottnest Island.
2.2 DRIFTING BUOY DEPLOYMENTS
GEMS developed the wireless tracked GPS drifting buoys (known as Davis drifters) specifically for lagrangian drifter experiments to help map ocean surface currents (see Figures 2 and 3). A wireless receiver on the deck of the boat, or mounted on a shore station, can then receive the location of each of the drifters from the onboard GPS. The Davis drifters are subject to very low windage due to their design (particularly the underwater “sail”).
The release points for the wireless GPS Davis drifters in March and April, 2007 are defined in Table 1 and the tracks are shown in Figures 4 and 5.

GEMS – Global Environmental Modelling Systems Pty. Ltd.
Fremantle Inner Harbour - Hydrodynamic Modelling Verification Page 8
Table 1: GEMS Drifting Buoy Deployment Locations and FPA Current and Tide Measurement Stations
Location Latitude Longitude Start Date
(UTC+8.0)
End Date
(UTC+8.0)
Duration
(nearest hour)
CM1 ‐32.1841 115.7593 20070131 20070329 1392
CM2 ‐32.1671 115.7285 20070131 20070329 1392
CM3 ‐32.0415 115.6793 20050101 20061231 8760
Drifter 1 ‐32.030765 115.679310 20070306 1540 20070307 1440 23
Drifter 2 ‐32.045232 115.677667 20070306 1515 20070307 1440 23
Drifter 3 ‐32.043870 115.632893 20070426 1305 20070427 1200 23
Drifter 4 ‐32.050905 115.709452 20070426 1220 20070427 1440 26
Drifter 5 ‐32.050058 115.690207 20070426 1215 20070427 1430 26
Drifter 6 ‐32.049872 115.669858 20070426 1225 20070427 1220 24
Drifter 7 ‐32.050087 115.650412 20070426 1245 20070427 1140 23

GEMS – Global Environmental Modelling Systems Pty. Ltd.
Fremantle Inner Harbour - Hydrodynamic Modelling Verification Page 9
Figure 2: Wireless GPS Davis drifter prior to deployment.
Figure 3: Wireless GPS Davis drifter in the ocean.
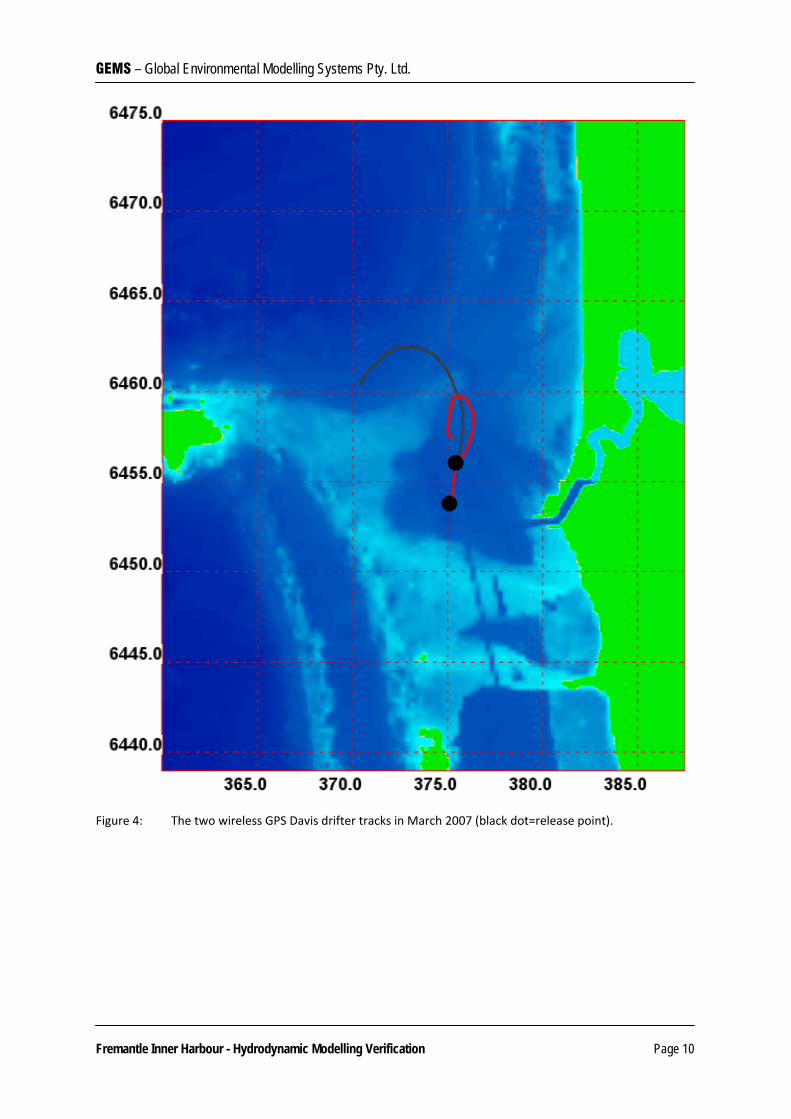
GEMS – Global Environmental Modelling Systems Pty. Ltd.
Fremantle Inner Harbour - Hydrodynamic Modelling Verification Page 10
Figure 4: The two wireless GPS Davis drifter tracks in March 2007 (black dot=release point).

GEMS – Global Environmental Modelling Systems Pty. Ltd.
Fremantle Inner Harbour - Hydrodynamic Modelling Verification Page 11
Figure 5: The five wireless GPS Davis drifter tracks in April 2007 (black dot=release point).

GEMS – Global Environmental Modelling Systems Pty. Ltd.
Fremantle Inner Harbour - Hydrodynamic Modelling Verification Page 12
3. OCEAN CIRCULATION SIMULATION
The Fremantle Port Inner Harbour is situated in the lower reaches of the Swan River before it enters the Indian Ocean in Perth coastal waters.
The dominant influence on the circulation on the continental shelf in the Perth coastal waters is the local wind. Tides are relatively weak and mixed, varying from diurnal to semi‐diurnal throughout the year with a spring tidal range of approximately 0.7 metres.
The flows in the region of the Inner Harbour are influenced by the coastal oceanography and also the flows from the upper reaches of the Swan River..
Data on both the currents in the lower reaches of the Swan River and in the open ocean, at the proposed spoil ground, were obtained for comparison with the ocean model predictions used in this study. The results are discussed in the next section.
The ocean currents and sea levels were modelled on two “nested” grids with GCOM3D (Appendix A). A large scale grid (Figure 6) was used to generate boundary conditions for a higher resolution GCOM3D grid (Figure 7). The coarse grid was run at a resolution of 250m driven by tides and MesoLAPS winds and atmospheric pressures. The finer grid was nested in the larger grid at a resolution of 50 metres. It is necessary to run this nested system to fully capture the interaction between the river flows and the open ocean and the detail of the currents between Fremantle and Rottnest Island.
The basic steps involved in setting up GCOM3D included:
• Incorporation of detailed bathymetry data for the Perth coastal waters obtained from the Department of Planning and Infrastructure.
• Establishment of bathymetric grids covering the lower reaches of the Swan River and the Perth coastal waters from Mandurah to Hilary’s Boat Harbour for the hydrodynamic modelling.
• Extraction of hourly meteorological data from the high resolution (10km) Bureau of Meteorology forecast model (Mesoscale Limited Area Prediction System – MesoLAPS) for the region.
• Setting up tidal forcing for the region from the GEMS Australian region tidal database (originally developed for AMSA Search and Rescue in Canberra).
• Running GCOM3D, driven by tides and MesoLAPS winds, for selected periods, to compare with ocean currents and tides measured by Fugro in summer 2007 and with drifter data measured by GEMS.

GEMS – Global Environmental Modelling Systems Pty. Ltd.
Fremantle Inner Harbour - Hydrodynamic Modelling Verification Page 13
3.1 BATHYMETRY
The bathymetric data sets held by GEMS were updated with bathymetry obtained from DPI. The GEMS database has been developed from a range of sources including data from Geoscience Australia (formerly AUSLIG) and oil company surveys.
3.2 ATMOSPHERIC FORCING
The BoM routinely operates a suite of Numerical Weather Prediction (NWP) models at a range of spatial and temporal resolutions. These models are nested in space so that the model system captures a range of atmospheric scales ranging from global through regional (continental) to the local, or Mesoscale.
The main Australian region forecast model run by the BoM is LAPS (Limited Area Prediction System) which runs on a 35km grid from halfway across the Indian Ocean to east of New Zealand. This model runs twice daily nested in the BoM global atmospheric model – GASP (Global Assimilation and Prediction model) and produces forecasts out to ten days.
The BoM has also operated its meso‐scale model (MesoLAPS – Mesoscale Limited Area Prediction System) at a spatial resolution of about 10km for a period of more than seven years (since the Sydney 2000 Olympics). The model is nested inside LAPS and runs twice daily producing an analysis and forecasts out to 48 hours. Meteorological data from the analysis cycle (zero hour) and the first eleven hours of forecasts of this model are now routinely downloaded twice daily and archived by GEMS. This generates a database of hourly meteorological data with the longest forecast time step of eleven hours.
Validation of the accuracy of the meteorological data for each new study area needs to be undertaken, however GEMS has determined from previous studies that the MesoLAPS model data provides a very good representation of coastal wind regimes.
3.3 TIDES
Tidal forcing was based on data from the GEMS Australian region gridded tidal data base, which has been developed with extensive modelling programmes (primarily for AMSA Search and Rescue in Canberra).
3.4 SWAN RIVER FLOW
It is difficult to model the flows in the Swan River without data due to the complex interaction of incoming flow from the ocean and downstream flow from the upper reaches of the river. Fortunately long term data was available for the flows through the Inner Harbour in the lower reaches of the Swan River and these data were used to define the flows on the upstream river boundary of GCOM3D.

GEMS – Global Environmental Modelling Systems Pty. Ltd.
Fremantle Inner Harbour - Hydrodynamic Modelling Verification Page 14
3.5 VERIFICATION AGAINST CURRENTS MEASURED AT THE PROPOSED SPOIL GROUND
To verify GCOM3D, and to provide 3D currents for the dredge plume modelling, bathymetric grids covering the regions shown in Figures 6 and 7 were set up at resolutions of 250 metres and 50 metres respectively. The vertical levels were at 2, 4,7, 10, 14, 20, 30, 40 metres etc.
Current data was available at three locations as shown in Figure 8 which gives an example of the surface currents off Fremantle during southerly winds.
The data in the river was used to drive the river flow in the model and cannot therefore be used for verification and the data at CM2 on the northern limit of Cockburn Sound was too near the fine grid boundary to be used for accurate validation. As a result the major focus for verification was the data collected at the proposed spoil ground (CM1).
To illustrate the need to simulate the ocean currents with a 3D ocean model, Figures 9 and 10 compare the west‐east and the south‐north current components measured at depths of 2m and 17m at site CM1. These figures show a significant decrease in the current speed with depth.
GCOM3D was run for the period of measurements at CM1 (February 28 to March 29, 2007) producing half‐hourly currents at each vertical level.
Figures 11 to 14 show the good agreement obtained between GCOM3D predictions of near‐surface currents with the data at CM1 for current speed and direction and the west‐east and south‐north components of the current respectively.
To test the ability of GCOM3D to simulate the variation in current speed with depth observed in Figures 9 and 10, the GCOM3D predictions of currents at a depth of 17m are compared with the data at CM1 in Figures 15 and 16 for west‐east and south‐north components of the current respectively.
The agreement shown in Figures 15 and 16 is very good and demonstrates that GCOM3D does simulate the variation of current speed and direction with depth, a feature which is very important for dredge plume modelling since dredged particles settle through the entire water column. Accurate simulation of the bottom currents is also important because they are important for re‐suspension of sediments and if the near‐surface currents were used, re‐suspension would be overpredicted.

GEMS – Global Environmental Modelling Systems Pty. Ltd.
Fremantle Inner Harbour - Hydrodynamic Modelling Verification Page 15
3.6 VERIFICATION AGAINST THE SURFACE DRIFTER TRACKS IN MARCH AND APRIL, 2007
To produce drifter track predictions for comparison with the observations GCOM3D was run from March to April, 2007 producing current files every 15 minutes.
Figures 17 and 18 show the comparison of drift tracks predicted from the GCOM3D currents with the measured drift tracks. It is virtually impossible to get exact agreement with drifter tracks and the very good agreement obtained showed that GCOM3D is predicting the surface currents very well.
The important issue with ocean modelling is that the model used can be shown to represent the basic oceanographic features reliably and with an acceptable level of accuracy. The agreement between model predictions and observations in this study appears to satisfy these requirements very well.

GEMS – Global Environmental Modelling Systems Pty. Ltd.
Fremantle Inner Harbour - Hydrodynamic Modelling Verification Page 16
Figure 6: Large scale GCOM3D grid.

GEMS – Global Environmental Modelling Systems Pty. Ltd.
Fremantle Inner Harbour - Hydrodynamic Modelling Verification Page 17
Figure 7: High resolution GCOM3D inner grid.

GEMS – Global Environmental Modelling Systems Pty. Ltd.
Fremantle Inner Harbour - Hydrodynamic Modelling Verification Page 18
Figure 8: Example of wind and tidal driven currents predicted by GCOM3D during a southerly wind event.

GEMS – Global Environmental Modelling Systems Pty. Ltd.
Fremantle Inner Harbour - Hydrodynamic Modelling Verification Page 19
Figure 9: West‐east ocean current components at depths of 2m (blue) and 17m (red) at CM1 from February 28 to March 29, 2007.
Figure 10: South‐north ocean current components at depths of 2m (blue) and 17m (red) at CM1 from February 28 to March 29, 2007.

GEMS – Global Environmental Modelling Systems Pty. Ltd.
Fremantle Inner Harbour - Hydrodynamic Modelling Verification Page 20
Figure 11: Comparison of near‐surface current speeds measured at CM1 from February 28 to March 9, 2007 (blue) with GCOM3D predictions (red).
Figure 12: Comparison of near‐surface current directions measured at CM1 from February 28 to March 9, 2007 (blue) with GCOM3D predictions (red).

GEMS – Global Environmental Modelling Systems Pty. Ltd.
Fremantle Inner Harbour - Hydrodynamic Modelling Verification Page 21
Figure 13: Comparison of near‐surface west‐east current speeds measured at CM1 from February 28 to March 9, 2007 (blue) with GCOM3D predictions (red).
Figure 14: Comparison of near‐surface south‐north current directions measured at CM1 from February 28 to March 9, 2007 (blue) with GCOM3D predictions (red).

GEMS – Global Environmental Modelling Systems Pty. Ltd.
Fremantle Inner Harbour - Hydrodynamic Modelling Verification Page 22
Figure 15: Comparison of west‐east current speeds measured at a depth of 17m at CM1 from February 28 to March 29, 2007 (blue) with GCOM3D predictions (red).
Figure 16: Comparison of south‐north current speeds measured at a depth of 17m at CM1 from February 28 to March 29, 2007 (blue) with GCOM3D predictions (red).

GEMS – Global Environmental Modelling Systems Pty. Ltd.
Fremantle Inner Harbour - Hydrodynamic Modelling Verification Page 23
Figure 17: Comparison of the first 2 GPS drifter tracks in March, 2007 with the tracks predicted from GCOM3D near‐surface currents (marked with M).

GEMS – Global Environmental Modelling Systems Pty. Ltd.
Fremantle Inner Harbour - Hydrodynamic Modelling Verification Page 24
Figure 18: Comparison of the 5 GPS drifter tracks in April, 2007 with the tracks predicted from GCOM3D near‐surface currents (marked with M).

GEMS – Global Environmental Modelling Systems Pty. Ltd.
Fremantle Inner Harbour - Hydrodynamic Modelling Verification Page 25
4. APPENDIX A: DESCRIPTION OF GCOM3D
For studies of hydrodynamic circulation and sea level variation under ambient and extreme weather conditions, GEMS has developed the GEMS 3‐D Coastal Ocean Model (GCOM3D). GCOM3D is an advanced, fully three‐dimensional, ocean‐circulation model that determines horizontal and vertical hydrodynamic circulation due to wind stress, atmospheric pressure gradients, astronomical tides, quadratic bottom friction and ocean thermal structure. The system will run on Windows/NT or UNIX platforms. GCOM3D is fully functional anywhere in the world using tidal constituent and bathymetric data derived from global, regional and local databases.
GCOM3D has never been fully published. Some details appear in publications (Hubbert 1991, 1993,1999). Further information is given below.
A.1 HISTORY AND PHYSICS
The history of development of GCOM3D began in 1982, initially stimulated by the 3D model development by Lendertsee (1973) who applied a “z” co‐ordinate 3D barotropic model to a number of coastal engineering tasks in the 1970’s.
The publication of what was the predecessor to the Princeton Ocean Model in 1987 by Blumberg and Mellor (1987) raised the standard of 3D ocean modelling by incorporating the vertical mixing schemes then used in atmospheric modelling into an ocean model for the first time.
GCOM3D was the first “z” coordinate ocean model to incorporate the Mellor‐Yamada (1974, 1982) vertical mixing scheme and was first used for consulting purposes in 1984 for the Geelong ocean outfall study near Barwon Heads in Victoria.
GCOM3D is a fully baroclinic ocean model but is most often run in barotropic (hydrodynamic) mode due to either the lack of data on ocean thermal structure or the dominance of winds and tides as the major forcing factors.
A.2 GENERAL DESCRIPTION
GCOM3D is a fully three‐dimensional, ocean‐circulation model that determines horizontal and vertical circulation due to wind stress, atmospheric pressure gradients, astronomical tides, quadratic bottom friction and ocean thermal structure.
The system will run on Windows or UNIX platforms
GCOM3D is formulated as a re‐locatable model which can be applied anywhere in the world using tidal constituent and bathymetric data derived from global and local databases.
The three‐dimensional structure of the model domain, tidal conditions at the open boundaries, thermodynamics and wind forcing are defined for each model application by extraction of data stored in gridded databases covering a wider geographical area of interest.

GEMS – Global Environmental Modelling Systems Pty. Ltd.
Fremantle Inner Harbour - Hydrodynamic Modelling Verification Page 26
The model scale is freely adjustable, and nesting to any number of levels is supported in order to suit the oceanographic complexity of a study area.
As the model is fully three‐dimensional, output can include current data at any or all levels in the water column.
A.3 HORIZONTAL AND VERTICAL STRUCTURE
The model operates on a regular grid (in the x and y directions) and uses a z‐coordinate vertical‐layering scheme. That is, the depth structure is modelled using a varying number of layers, depending on the depth of water, and each layer has a constant thickness over the horizontal plane.
The horizontal resolution and the vertical layer depths and thickness can be varied according to the situation to be modelled and the ocean physics which needs to be represented.
The vertical scheme decouples surface wind stress and seabed friction and avoids the bias of current predictions for a particular layer caused by averaging of currents over varying depths, as used in sigma co‐ordinate and “depth‐averaged” model schemes.
In the upper water column levels are typically a few metres apart, increasing to several hundred metres in deep waters.

GEMS – Global Environmental Modelling Systems Pty. Ltd.
Fremantle Inner Harbour - Hydrodynamic Modelling Verification Page 27
A.4 NUMERICAL PROCEDURES
The basic equations are solved using a split‐explicit finite‐difference scheme on an Arakawa‐C grid (Mesinger and Arakawa, 1976) as described in Hubbert et al. (1990). The continuity equation and the gravity wave and Coriolis terms in the momentum equations are solved on the shortest time step, (the adjustment step) using the forward‐backward method.
The non‐linear advective terms are solved on an intermediate advective time step using the two‐time‐level method of Miller and Pearce (1974). Finally, on the longest time step, the so‐called physics step, the surface wind stress, bottom friction stress and atmospheric pressure terms are solved using a backward‐implicit method. This approach is extremely efficient in oceanographic models with free surfaces because of the large disparity between advective speeds and gravity‐wave phase speeds in deep water.
The numerical scheme used for the advective step is the two‐time‐level method of Miller and Pearce (1974). This scheme alternates the Euler and Euler‐backward (Matsuno) schemes at odd and even advective time‐steps and has the major advantage of an amplification factor of almost exactly unity for the Courant numbers that are found in ocean models (Hubbert et al. 1991).
The adjustment and advective integration cycle is carried out N times to produce an interim solution which is completed with the inclusion of the physics terms using a numerical technique similar to that described for the adjustment step.
A.5 BOUNDARY CONDITIONS
Boundary conditions can be applied in a range of ways depending on the type of process being modelled.
Meteorological forcing is applied via the wind stress and surface pressure gradient at all submerged model grid‐points in the computational domain. The surface drag co‐efficient used when calculating the wind stress is based on Smith and Banke (1975).
Tidal and meteorological forcing at lateral boundaries is achieved by specifying the incremental displacement of the water surface due to changes in tidal height and atmospheric pressure. These boundary conditions are applied using a ‘one‐way nesting’ technique to the appropriate model variable with a logarithmic decreasing intensity from the boundary to some specified number of model grid‐points (typically 10‐15) into the domain.
At coastal boundaries and along river banks, the wetting and drying of grid cells is accomplished via the inundation algorithm published in Hubbert and McInnes (1999a and b).
On outflow, a radiation boundary condition, as described in Miller and Thorpe (1981) is applied to the velocity field to prevent the buildup of numerical energy, while on inflow boundaries, a zero‐gradient condition is applied.

GEMS – Global Environmental Modelling Systems Pty. Ltd.
Fremantle Inner Harbour - Hydrodynamic Modelling Verification Page 28
A.6 TIDAL DATA ASSIMILATION
In order to improve the simulation of tidal forced dynamics the model includes the facility to “nudge” the solution with tidal height predictions at locations within the model domain.
The nudging method is based on deriving a new solution at grid points near each tidal station from a weighted combination of the model solution and the station sea level prediction.
A.7 MODEL APPLICATIONS
GCOM3D has undergone exhaustive evaluation and verification in the 15 years it has served the coastal engineering industry in Australia and has a proven record of accurately predicting the wind and tidal driven ocean currents around the Australian continental shelf (and in many other parts of the world).
The Australian National Search and Rescue system is based on ocean currents from GCOM3D, which has been running in real‐time at the Australian Maritime Safety Authority in Canberra for the past 4 years. It is the first real‐time ocean prediction model in Australia.
The U.S. Navy also purchased GCOM3D for its coastal ocean forecasting system.
GCOM3D has also been used in a wide range of ocean environmental studies including prediction of the fate of oil spills, sediments, hydrotest chemicals, drill cuttings, produced formation water and cooling waters as well as in other coastal ocean modelling studies such as storm surges and search and rescue.

GEMS – Global Environmental Modelling Systems Pty. Ltd.
Fremantle Inner Harbour - Hydrodynamic Modelling Verification Page 29
A.8 GCOM3D REFERENCES
Blumberg A. F. and G. L. Mellor, 1987: A description of a three‐dimensional coastal ocean circulation model, Three‐Dimensional Coastal Ocean Models, Coastal Estuarine Science, N. S. Heaps, Ed., Amer. Geophys. Union, 1‐16, 1987.
Hubbert, G.D., G.J. Holland, L.M. Leslie and M.J. Manton, 1991: A real‐time system for forecasting tropical cyclone storm surges. Weather and Forecasting, 6, 86‐97.
Hubbert, G.D., L.M. Leslie and M.J. Manton, 1990: A storm surge model for the Australian region. Quart. J. Roy. Met. Soc., 116, 1005‐1020.
Hubbert, G.D. (1993): Modelling continental shelf flows along the New South Wales coast with a fully three dimensional ocean model. Proc. 11th Australasian Coastal and Ocean Engineering Conference, Townsville, Australia.
Hubbert, G.D. and K.L. McInnes, 1999a: A storm surge inundation model for coastal planning and impact studies. J. Coastal Research. 15. 168‐185.
Hubbert, G.D. and K.L. McInnes, 1999b: Modelling Storm Surges and Coastal Ocean Flooding.’ In: Modelling Coastal Sea Processes. Editor B. J. Noye. World Scientific Publishing Co. p 159‐188.
Leendertse, J. J., 1973: A water‐quality simulation model for well‐mixed estuaries and coastal seas: Vol. 1, Principles of Computation. The Rand Corporation, Santa Monica, Feb. 1970, RM‐6230‐RC.
Mellor, G. L., and T. Yamada, 1974: A hierarchy of turbulence closure models for planetary boundary layers. J. Atmos. Sci., 31: 1791‐1806.
Mellor, G. L., and T. Yamada, 1982: Development of a turbulence closure model for geophysical fluid problems. Rev. Geophys. and Space Phys., 20: 851‐875.
Mesinger, F., and A. Arakawa, 1976: Numerical methods used in atmospheric models. GARP Publication Series No. 14. WMO/ICSU Joint Organising Committee, 64 pp.
Miller, M.J. and Pearce, R. P., 1974: Numerical model of a cumulonimbus. Q. J. R. Meteorol. Soc., 100, 133‐154.
Miller, M. J. and Thorpe, A. J. 1981: Radiation conditions for the lateral boundaries of limited‐area numerical models. Q. J. R. Meteorol. Soc., 107: 615‐628.
Smith, S. D. and Banke, E.G., 1975: Variation of the sea surface drag coefficient with wind speed. Q. J. R. Meteorol. Soc., 101: 665‐673.
Fremantle Ports Fremantle Port Inner Harbour and Channel Deepening Public Environmental Review Supplement and Response to Submissions
SINCLAIR KNIGHT MERZ
I:\WVES\Projects\WV03196\Deliverables\09_PERResponse\09_20090513\FremantlePER_PERSupplement_WV03196_Rev2.doc
This page has been intentionally left blank