FreedomCAR Automotive Lightweighting Materials Joseph … Automotive... · the Clean Air Acts...
41
Materials Technologies Joseph A. Carpenter, Jr. , U.S. Department of Energy Edward Daniels, Argonne National Laboratory Philip Sklad and C. David Warren, Oak Ridge National Laboratory Mark Smith, Pacific Northwest National Laboratory TMS Light Metals Division Luncheon Walt Disney World Orlando, Florida USA February 28, 2007 (In remembrance of Dr. Sidney Diamond of USDOE) FreedomCAR Automotive Lightweighting Materials Materials Technologies
Transcript of FreedomCAR Automotive Lightweighting Materials Joseph … Automotive... · the Clean Air Acts...
Materials Technologies
Joseph A. Carpenter, Jr., U.S. Department of EnergyEdward Daniels, Argonne National Laboratory
Philip Sklad and C. David Warren, Oak Ridge National LaboratoryMark Smith, Pacific Northwest National Laboratory
TMS Light Metals Division LuncheonWalt Disney World
Orlando, Florida USA
February 28, 2007
(In remembrance of Dr. Sidney Diamond of USDOE)
FreedomCAR Automotive Lightweighting Materials
Materials Technologies
Materials Technologies
Outline
• The FreedomCAR and Fuels Initiative- History- Goals
• FreedomCAR-supported Body and Chassis Lightweighting Materials Thrusts
• Summary and Thoughts
Based upon paper in Proceedings of the International Auto Body Conference, Novi, Michigan USA, September 19, 2006
Materials Technologies
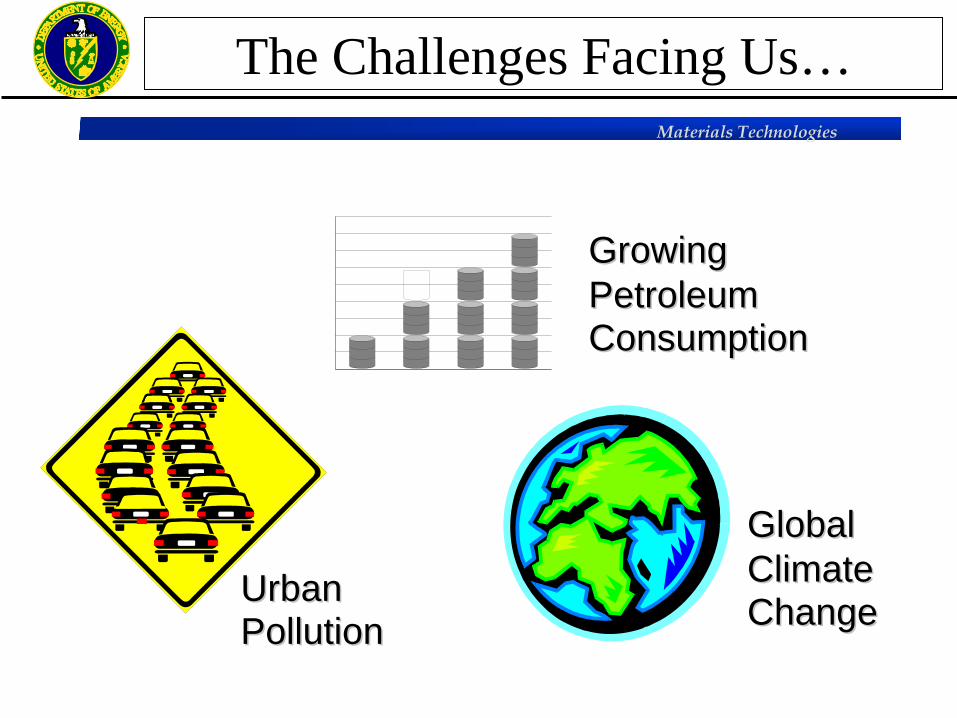
Urban Urban PollutionPollution
Global Global Climate Climate ChangeChange
The Challenges Facing Us…
00.5
11.5
22.5
33.5
44.5
Growing Growing Petroleum Petroleum ConsumptionConsumption
Materials Technologies
0
5
10
15
20
25
30
1930 1935 1940 1950 1960 1965 1970 1973 1975 1980 1985 1990 1991 1993 1994 1996 2000 2010 2020 2030 2040 2050
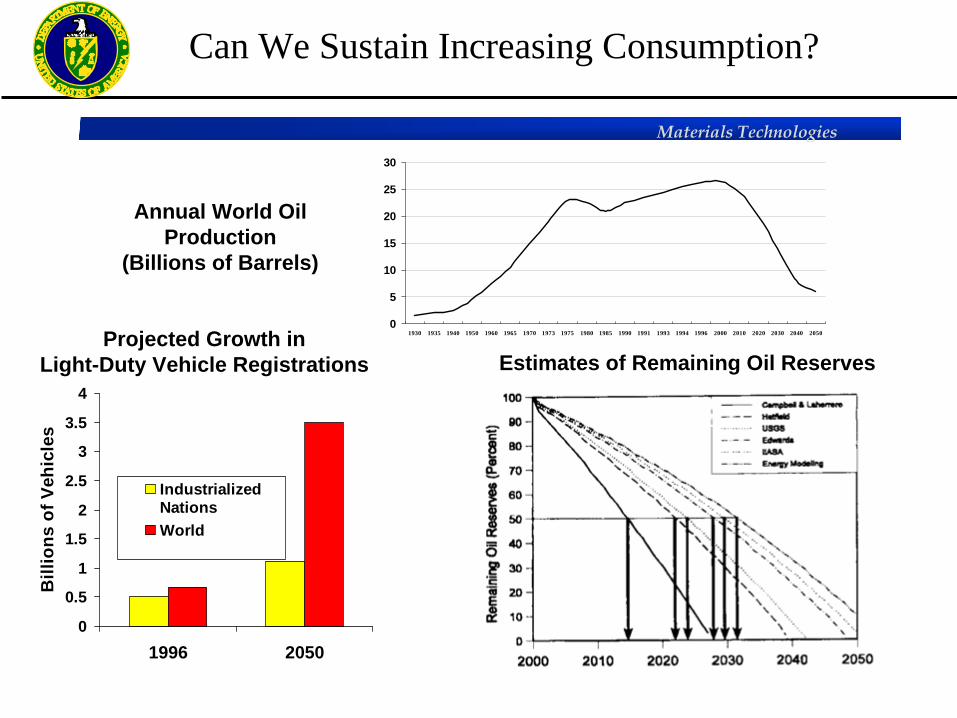
Annual World Oil Production
(Billions of Barrels)
Estimates of Remaining Oil Reserves
0
0.5
1
1.5
2
2.5
3
3.5
4
1996 2050
Bill
ions
of V
ehic
les
IndustrializedNationsWorld
Projected Growth inLight-Duty Vehicle Registrations
Can We Sustain Increasing Consumption?
0
200
400
600
800
1900 1910 1920 1930 1940 1950 1960 1970 1980 1990
Veh
icle
s per
Tho
usan
d Pe
ople
Industrialized Pacific
Western Europe
Developing AsiaLatin AmericaFormer Soviet Union
Mid-East
Eastern Europe
AfricaChina
U.S.
U.S. Historic
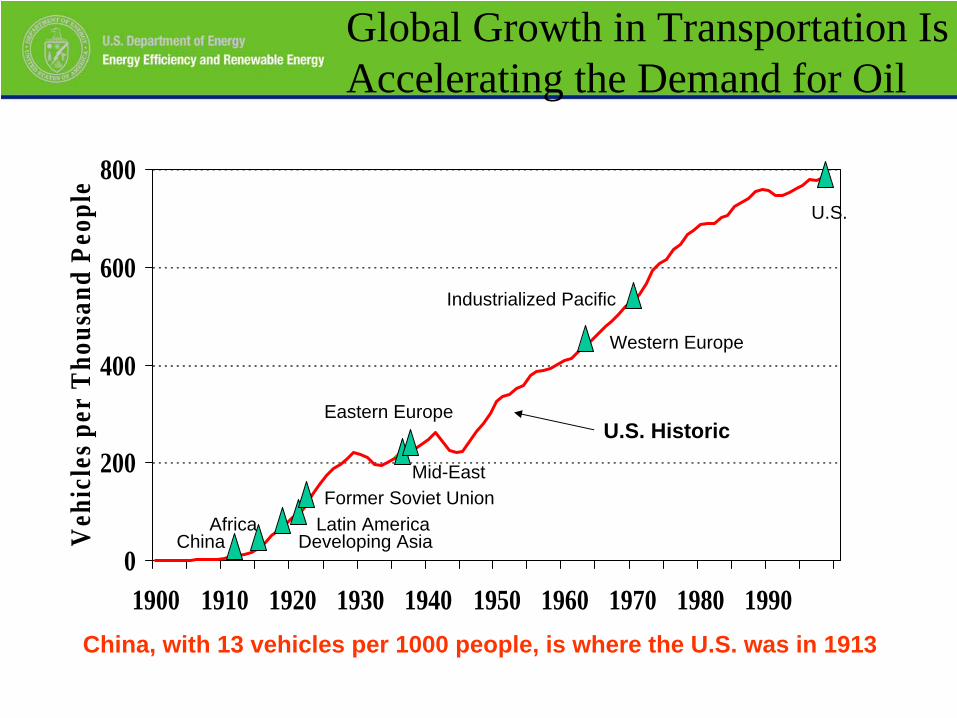
China, with 13 vehicles per 1000 people, is where the U.S. was in 1913
Global Growth in Transportation Is Accelerating the Demand for Oil
Materials Technologies
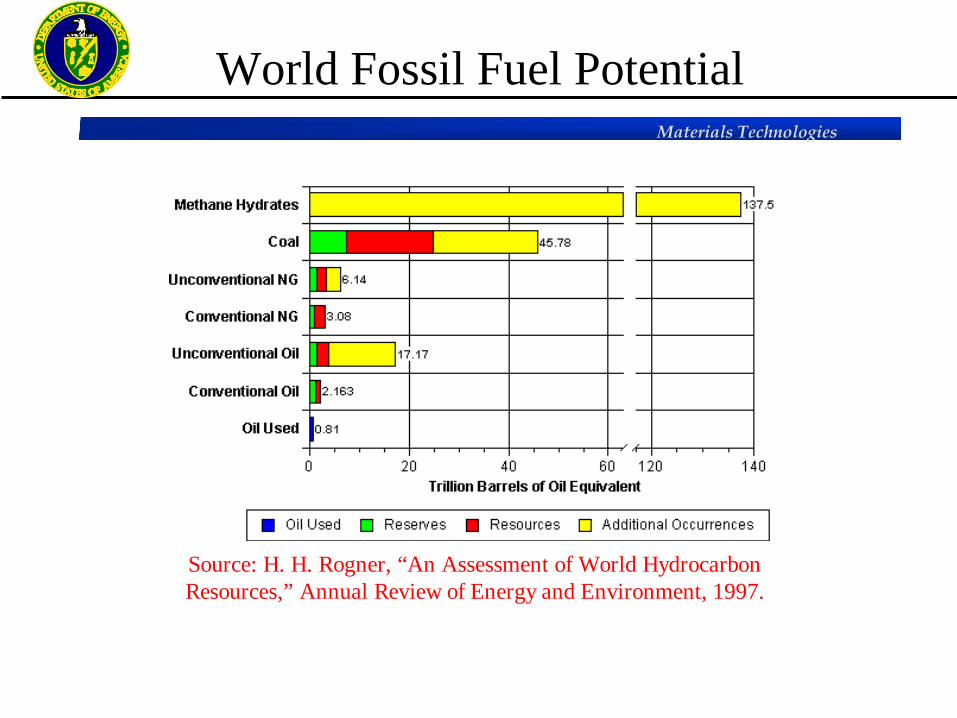
Source: H. H. Rogner, “An Assessment of World Hydrocarbon Resources,” Annual Review of Energy and Environment, 1997.
World Fossil Fuel Potential
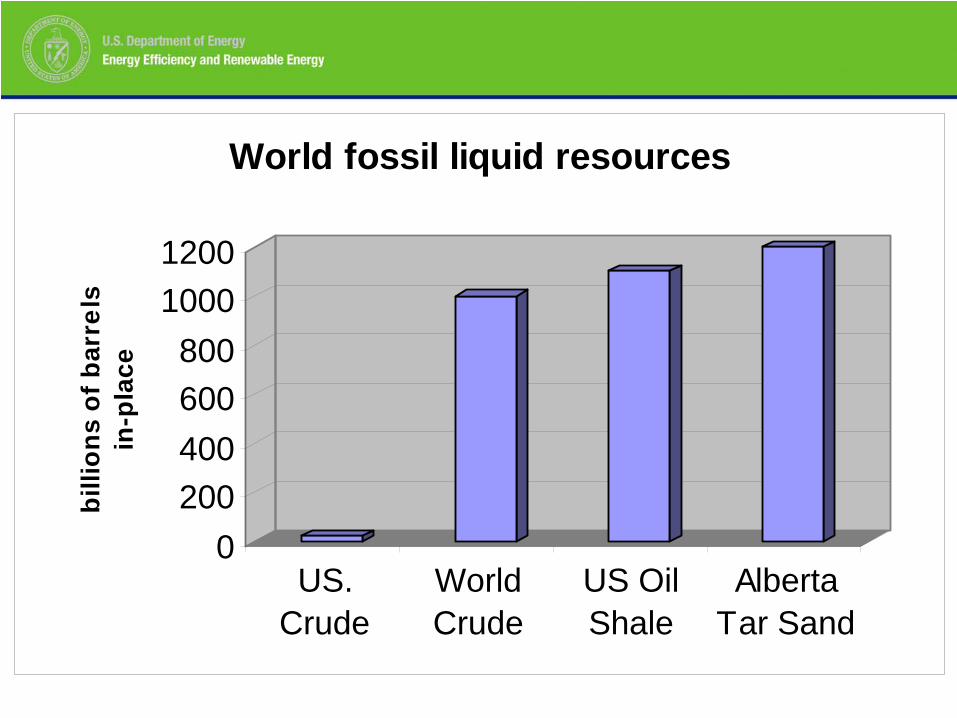
0200400600800
10001200
billi
ons
of b
arre
ls
in-p
lace
US.Crude
WorldCrude
US OilShale
AlbertaTar Sand
World fossil liquid resources

Materials Technologies
billion barrels of oil equivalent
2000 $ per boe
Source:Shell, 2000
Unconventional Oil
35000
5
10
15
20
0 500 1000 1500 2000 2500 3000
Produced at
1.1.2000
4000
Oil and Substitute Costs
Materials Technologies
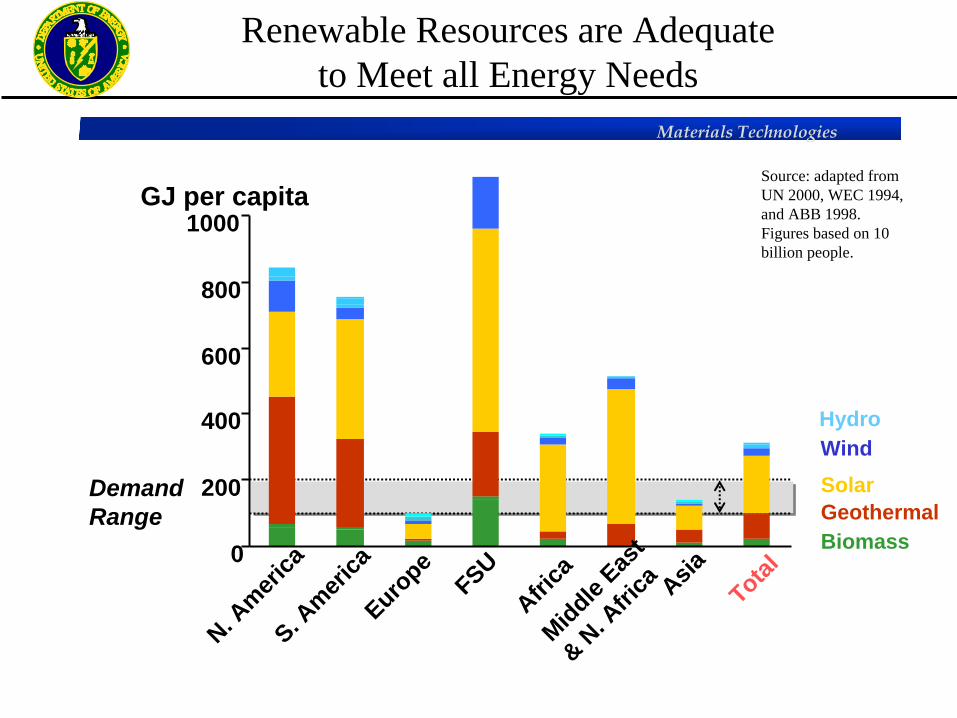
GJ per capita
Demand Range
SolarWind
Biomass
Hydro
Geothermal
0
200
400
600
800
1000
N. Ameri
caS. A
merica
Europe
FSU Afri
caMiddle
East
& N. A
frica Asia
Total
Renewable Resources are Adequate to Meet all Energy Needs
Source: adapted from UN 2000, WEC 1994, and ABB 1998. Figures based on 10 billion people.
Materials Technologies
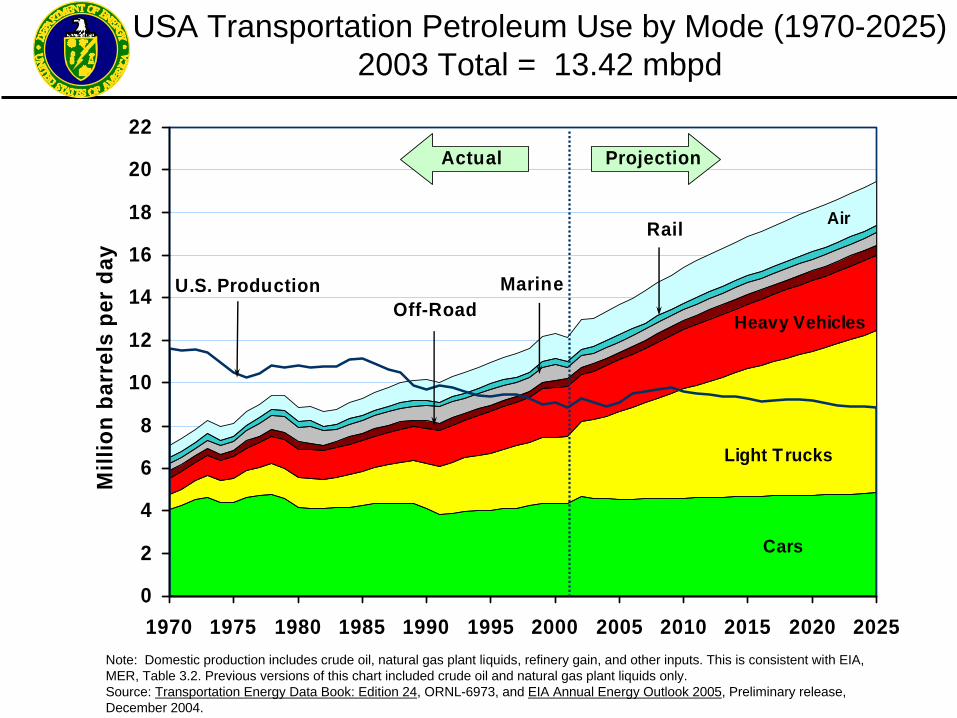
Note: Domestic production includes crude oil, natural gas plant liquids, refinery gain, and other inputs. This is consistent with EIA, MER, Table 3.2. Previous versions of this chart included crude oil and natural gas plant liquids only.Source: Transportation Energy Data Book: Edition 24, ORNL-6973, and EIA Annual Energy Outlook 2005, Preliminary release, December 2004.
USA Transportation Petroleum Use by Mode (1970-2025) 2003 Total = 13.42 mbpd
0
2
4
6
8
10
12
14
16
18
20
22
1970 1975 1980 1985 1990 1995 2000 2005 2010 2015 2020 2025
Mill
ion
barr
els
per
day
Marine
Rail
Actual Projection
Cars
Air
Light Trucks
Heavy Vehicles
U.S. ProductionOff-Road

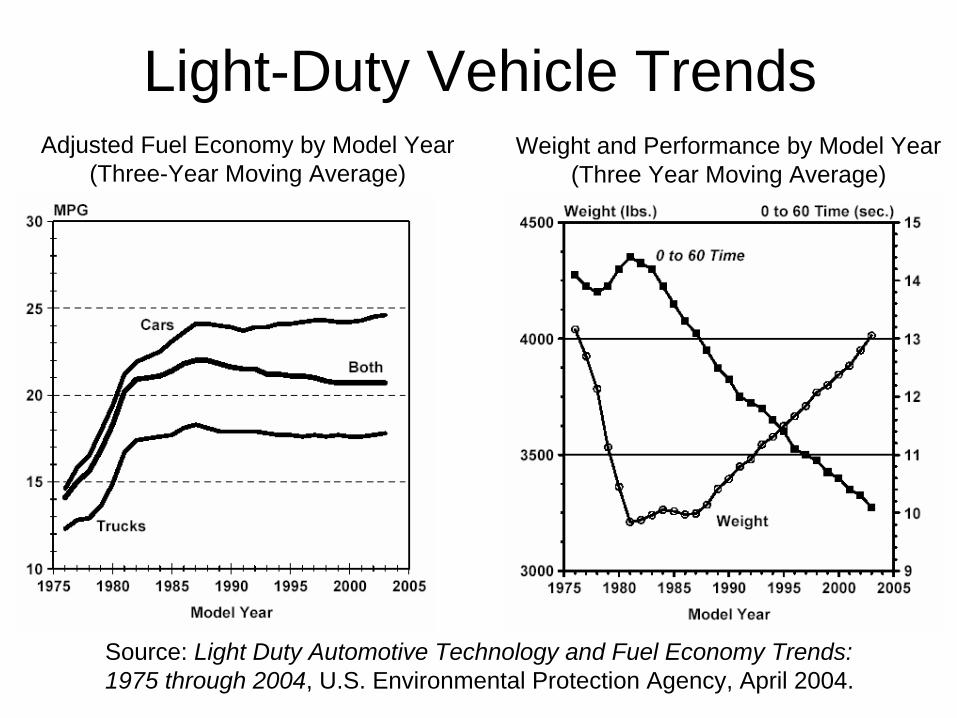
Light-Duty Vehicle Trends
Source: Light Duty Automotive Technology and Fuel Economy Trends: 1975 through 2004, U.S. Environmental Protection Agency, April 2004.
Adjusted Fuel Economy by Model Year(Three-Year Moving Average)
Weight and Performance by Model Year(Three Year Moving Average)
Materials Technologies
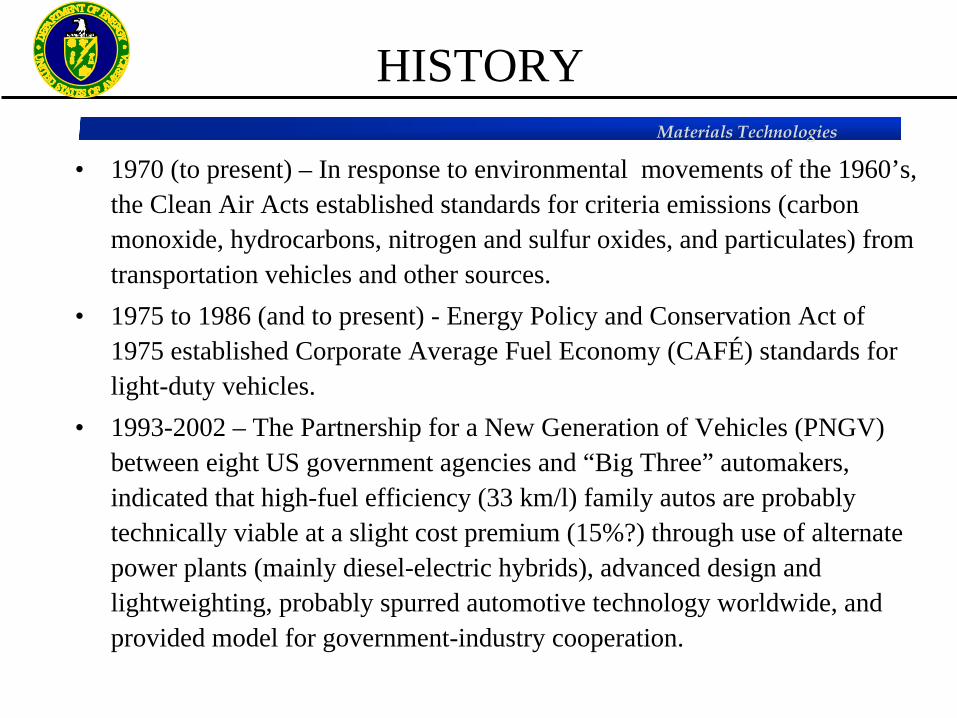
HISTORY
• 1970 (to present) – In response to environmental movements of the 1960’s, the Clean Air Acts established standards for criteria emissions (carbon monoxide, hydrocarbons, nitrogen and sulfur oxides, and particulates) from transportation vehicles and other sources.
• 1975 to 1986 (and to present) - Energy Policy and Conservation Act of 1975 established Corporate Average Fuel Economy (CAFÉ) standards for light-duty vehicles.
• 1993-2002 – The Partnership for a New Generation of Vehicles (PNGV) between eight US government agencies and “Big Three” automakers, indicated that high-fuel efficiency (33 km/l) family autos are probably technically viable at a slight cost premium (15%?) through use of alternate power plants (mainly diesel-electric hybrids), advanced design and lightweighting, probably spurred automotive technology worldwide, and provided model for government-industry cooperation.
Materials Technologies
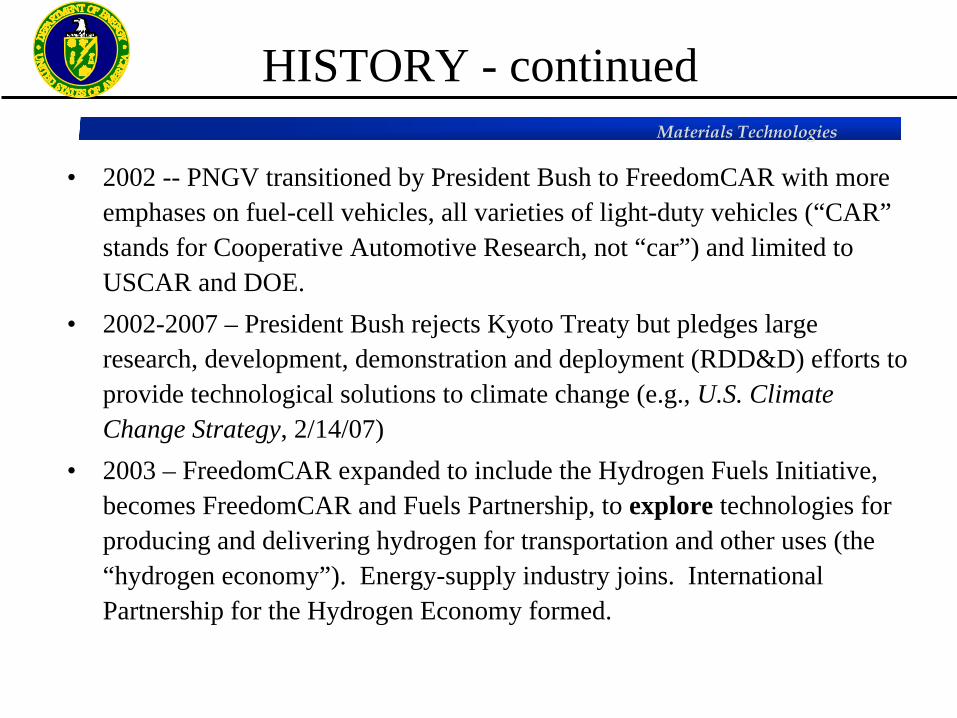
HISTORY - continued
• 2002 -- PNGV transitioned by President Bush to FreedomCAR with more emphases on fuel-cell vehicles, all varieties of light-duty vehicles (“CAR” stands for Cooperative Automotive Research, not “car”) and limited to USCAR and DOE.
• 2002-2007 – President Bush rejects Kyoto Treaty but pledges large research, development, demonstration and deployment (RDD&D) efforts to provide technological solutions to climate change (e.g., U.S. Climate Change Strategy, 2/14/07)
• 2003 – FreedomCAR expanded to include the Hydrogen Fuels Initiative, becomes FreedomCAR and Fuels Partnership, to explore technologies for producing and delivering hydrogen for transportation and other uses (the “hydrogen economy”). Energy-supply industry joins. International Partnership for the Hydrogen Economy formed.
Materials Technologies
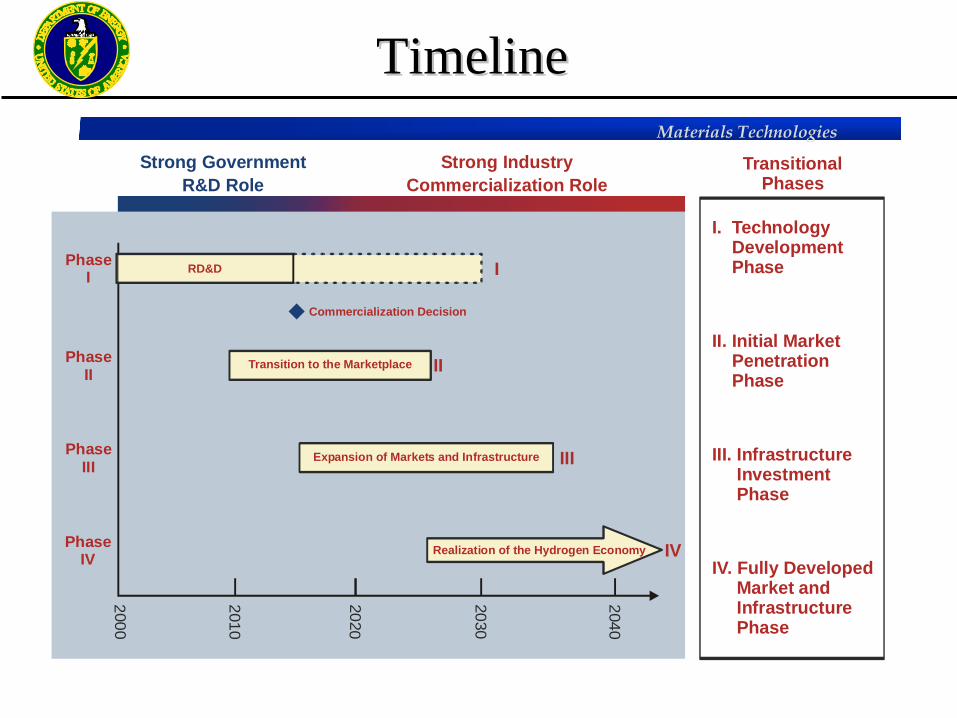
Transitional Phases
I. Technology Development Phase
II. Initial Market Penetration Phase
III. Infrastructure Investment Phase
IV. Fully Developed Market and Infrastructure Phase
Strong Government R&D Role
Strong Industry Commercialization Role
2 000
2020
2010
2030
2040
PhaseI
PhaseII
PhaseIII
PhaseIV
RD&D I
Transition to the Marketplace
Commercialization Decision
II
Expansion of Markets and Infrastructure III
Realization of the Hydrogen Economy IV
TimelineTimeline
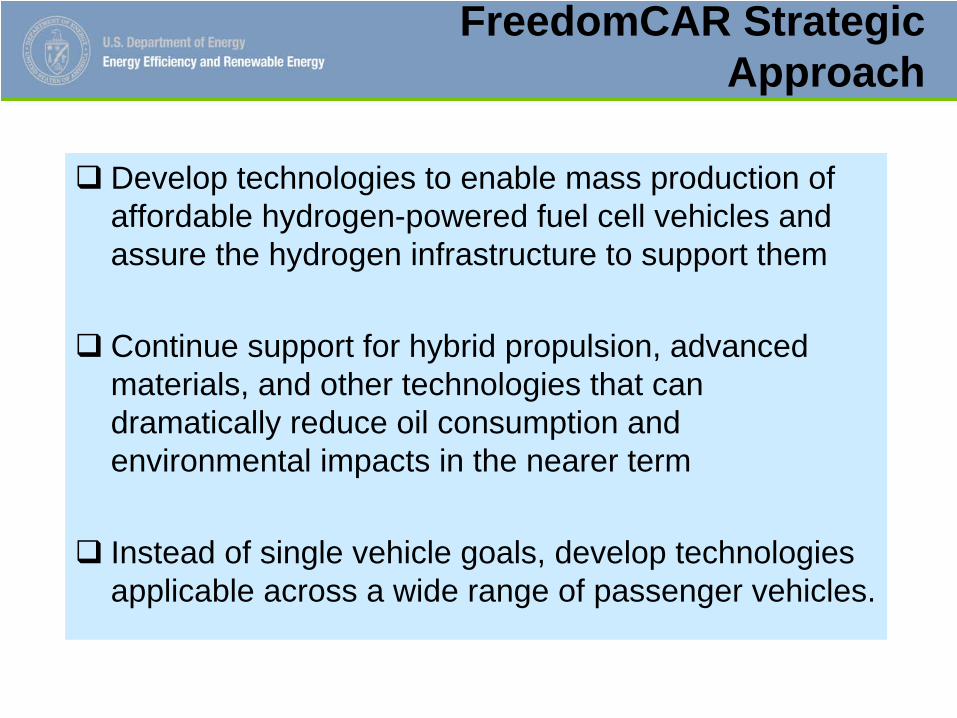
FreedomCAR Strategic Approach
Develop technologies to enable mass production of affordable hydrogen-powered fuel cell vehicles and assure the hydrogen infrastructure to support them
Continue support for hybrid propulsion, advanced materials, and other technologies that can dramatically reduce oil consumption and environmental impacts in the nearer term
Instead of single vehicle goals, develop technologies applicable across a wide range of passenger vehicles.

Transportation Materials
• 6-8% (with mass compounding) increase in fuel economy for every 10% drop in weight, everything else the same
or
• Offset the increased weight and cost per unit of power of alternative powertrains (hybrids, fuel cells) with respect to conventional powertrains (Alice in Wonderland syndrome)
Effect of Automotive Lightweighting
Materials Technologies
Drivers
• Potentially higher prices of fuel.• The hydrogen-fueled fuel-cell vehicle.• Increasing “customer value” while
staying within Corporate Average Fuel Economy (CAFÉ) limits

Materials Technologies
Barriers
• Historically low prices of fuel.• Higher costs of lightweighting materials.• Lack of familiarity with them.• Preferences for large vehicles• Perceptions of safety• Recycling (plastics)

Materials Technologies
Efficiency Power Energy Cost* Life Weight
Fuel Cell System60% (hydrogen)
45% (w/ reformer)325 W/kg220 W/L
$45/kW (2010)$30kW (2015)
Hydrogen Fuel/ Storage/Infrastructure
70% well to pump70% well to pump 2 kW2 kW--h/kgh/kg1.1 kW1.1 kW--h/Lh/L
$5/kW-h$1.25/gal (gas
equiv.)
Electric Propulsion >>55 kW 18 s 30 55 kW 18 s 30 kW cont.kW cont. $12/kW peak$12/kW peak 15 years15 years
Electric Energy Storage 25 kW 18 s25 kW 18 s 300 W300 W--hh $20/kW$20/kW 15 years15 years
Materials SameSame SameSame 50% less50% less
EnginePowertrain System**
45% peak45% peak $30/kW$30/kW 15 years15 years
* Cost references based on CY2001 dollar values ** Meets or exceeds emissions standards.
FreedomCAR Technology Specific Goals
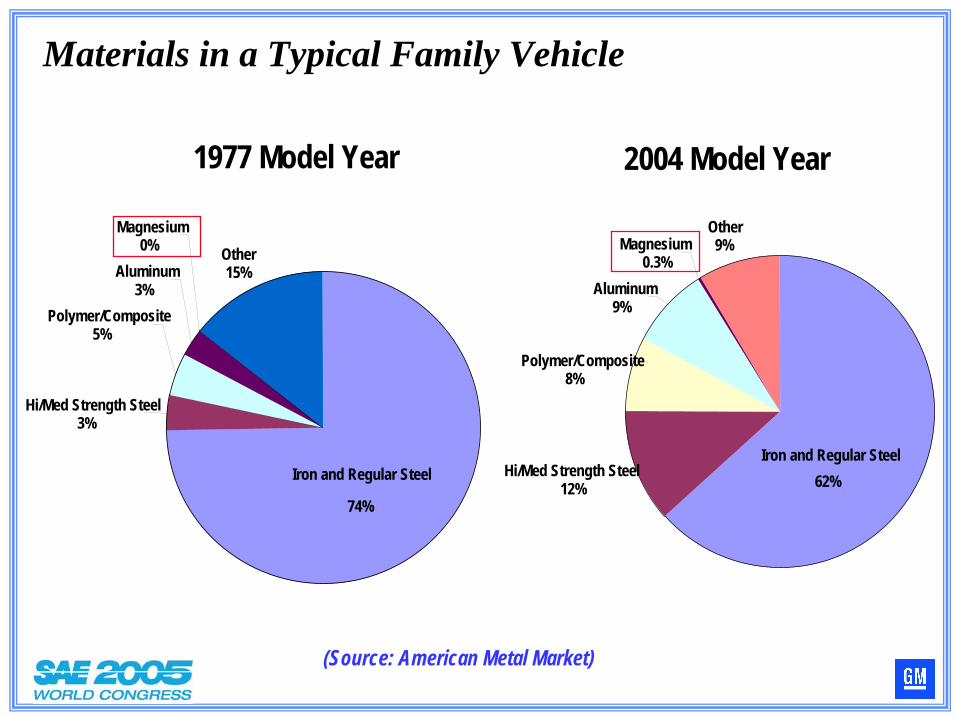
1977 Model Year
Iron and Regular Steel
74%
Hi/Med Strength Steel3%
Polymer/Composite5%
Aluminum3%
Magnesium0% Other
15%
2004 Model Year
Iron and Regular Steel62%Hi/Med Strength Steel
12%
Polymer/Composite8%
Aluminum9%
Magnesium0.3%
Other9%
Materials in a Typical Family Vehicle
(Source: American Metal Market)
Materials Technologies
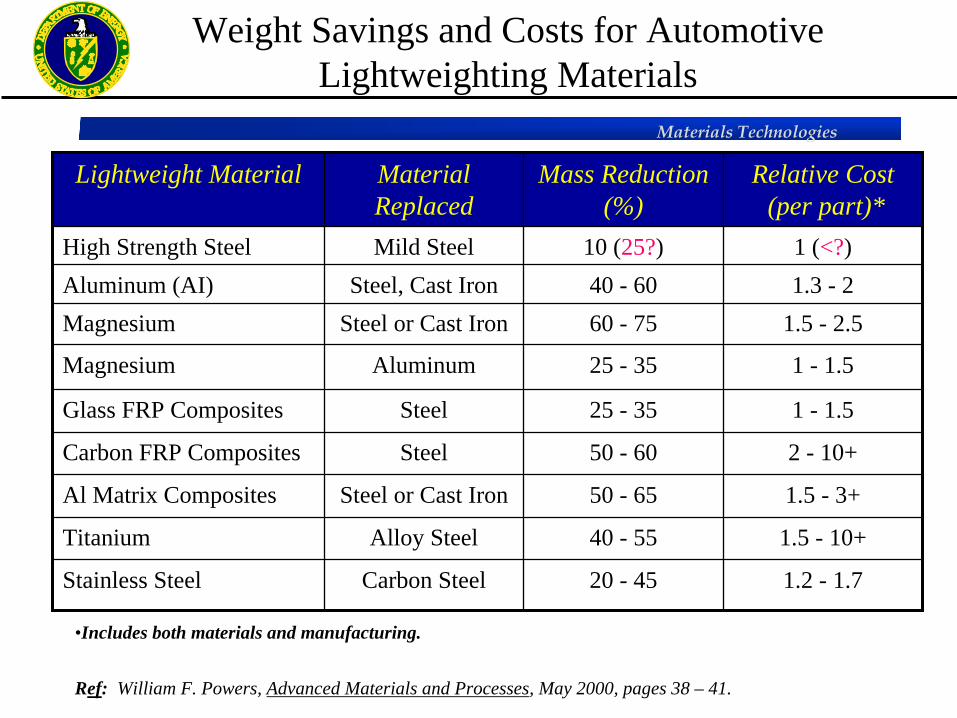
Lightweight Material Material Replaced
Mass Reduction (%)
Relative Cost (per part)*
High Strength Steel Mild Steel 10 (25?) 1 (<?)Aluminum (AI) Steel, Cast Iron 40 - 60 1.3 - 2Magnesium Steel or Cast Iron 60 - 75 1.5 - 2.5
Magnesium Aluminum 25 - 35 1 - 1.5
Glass FRP Composites Steel 25 - 35 1 - 1.5
Carbon FRP Composites Steel 50 - 60 2 - 10+
Al Matrix Composites Steel or Cast Iron 50 - 65 1.5 - 3+
Titanium Alloy Steel 40 - 55 1.5 - 10+
Stainless Steel Carbon Steel 20 - 45 1.2 - 1.7
Weight Savings and Costs for Automotive Lightweighting Materials
•Includes both materials and manufacturing.
Ref: William F. Powers, Advanced Materials and Processes, May 2000, pages 38 – 41.
Transportation Materials
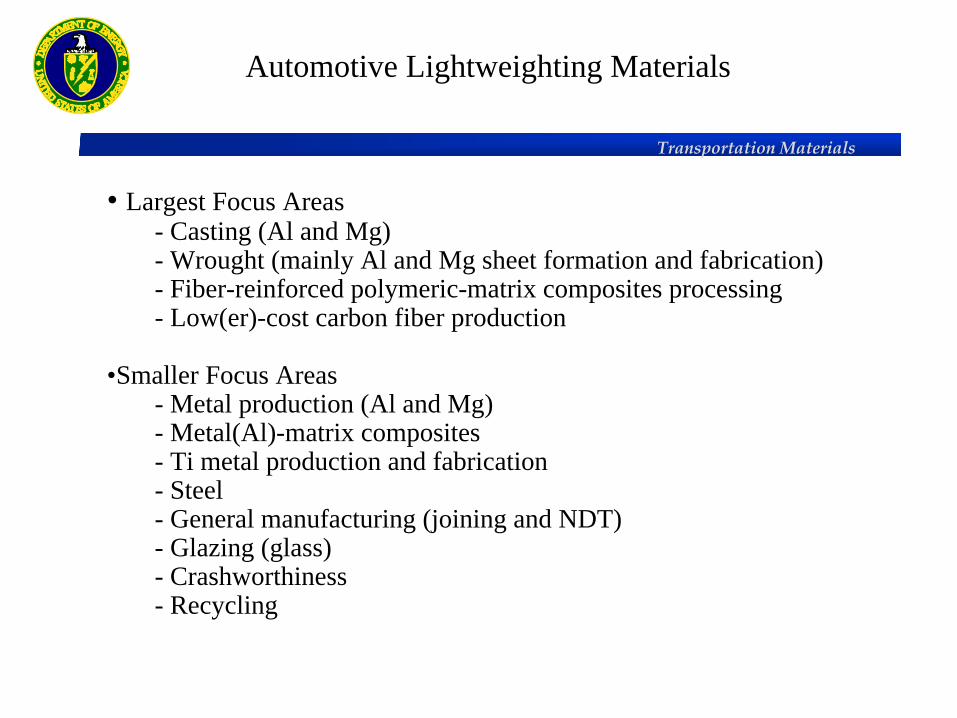
• Largest Focus Areas- Casting (Al and Mg)- Wrought (mainly Al and Mg sheet formation and fabrication)- Fiber-reinforced polymeric-matrix composites processing- Low(er)-cost carbon fiber production
•Smaller Focus Areas- Metal production (Al and Mg)- Metal(Al)-matrix composites - Ti metal production and fabrication- Steel- General manufacturing (joining and NDT) - Glazing (glass)- Crashworthiness- Recycling
Automotive Lightweighting Materials
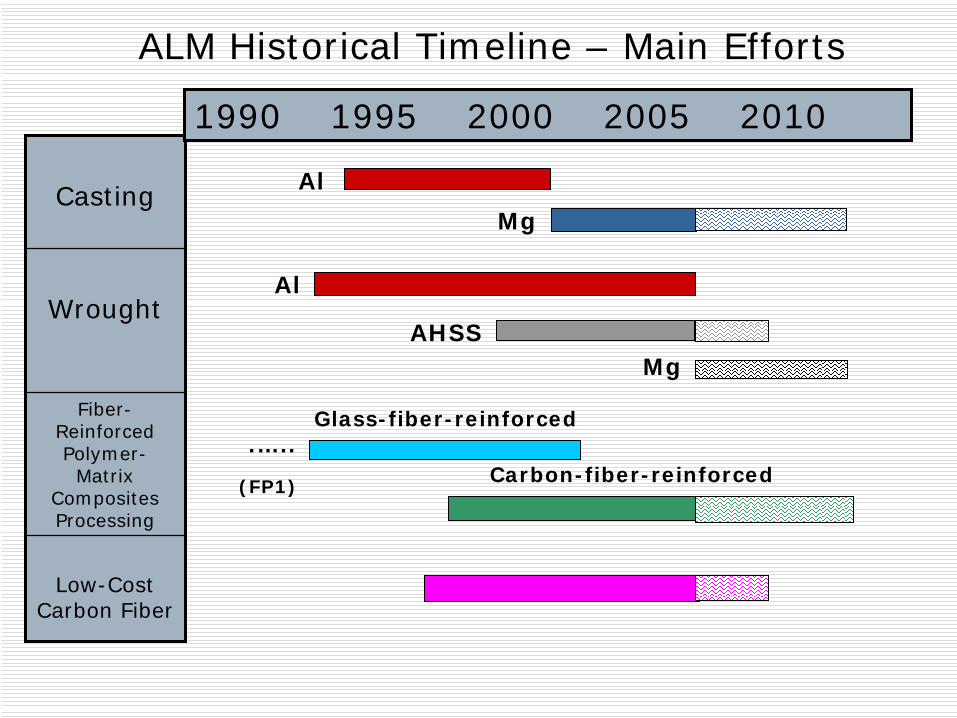
ALM Historical Timeline – Main Efforts
Casting
Wrought
Fiber- Reinforced Polymer-
Matrix Composites Processing
Low-Cost Carbon Fiber
Al
Mg
Al
AHSSMg
Glass-fiber-reinforced
1990 1995 2000 2005 2010
Carbon-fiber-reinforced.…..
(FP1)

ALM Historical Timeline - General Manufacturing
1990 1995 2000 2005 2010
Metal Production
Joining
Nondestructive Testing
Crashworthiness
Recycling
(FP1) ….

ALM Historical Timeline – Minor Materials
1990 1995 2000 2005 2010
Metal-Matrix Composites
Titanium
Steel
Glazing (Glass)
ULSAB .………..…..….
Transportation Materials
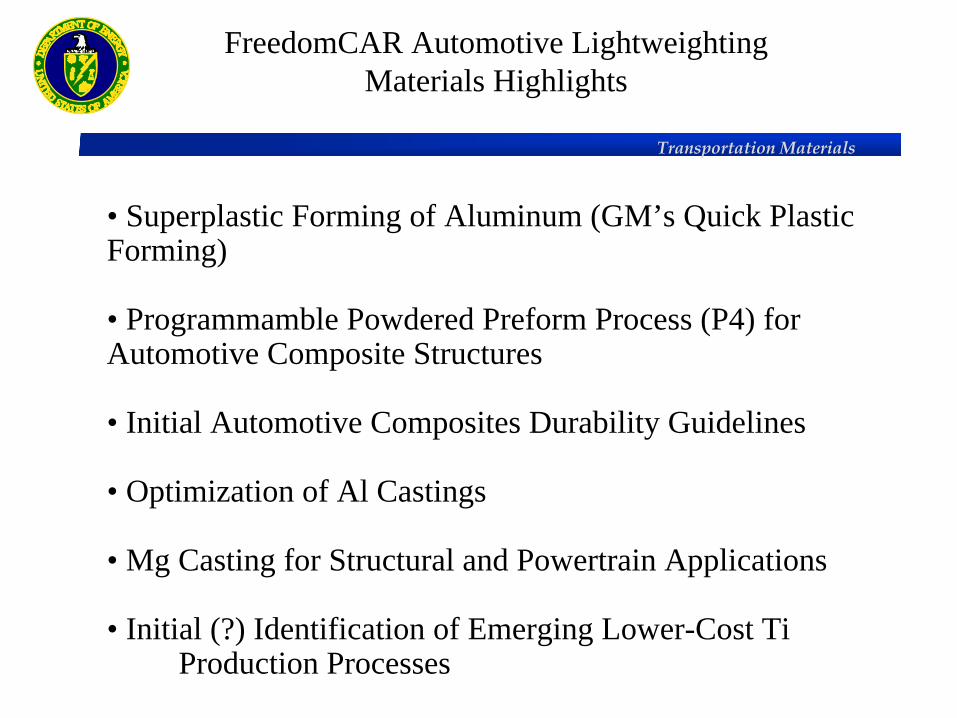
• Superplastic Forming of Aluminum (GM’s Quick Plastic Forming)
• Programmamble Powdered Preform Process (P4) for Automotive Composite Structures
• Initial Automotive Composites Durability Guidelines
• Optimization of Al Castings
• Mg Casting for Structural and Powertrain Applications
• Initial (?) Identification of Emerging Lower-Cost TiProduction Processes
FreedomCAR Automotive Lightweighting Materials Highlights
Materials Technologies
•FreedomCAR supports research, development, demonstration and deployment (RDD&D) to increase the energy efficiency of vehicles and the use of alternative fuels, especially hydrogen.
• Lightweighting is addressed by FreedomCAR to help minimize overall costs of vehicles, especially those powered by hydrogen- fueled fuel-cells.
• Such applied R&D is best done when the potential implementer(s) is(are) involved from the start.
• The ultimate implementation decisions are more apt to be based on economic and political factors than technical factors.
Summary and Thoughts
Materials Technologies
• Has the $200M + spent by FreedomCAR and PNGV onautomotive lightweighting been worth it?
- Commercial implementations and formal evaluations wouldindicate “yes.”
- Too early to tell quantitatively?- At least we know the technical and costs parameter space
better
• Qualitatively, the greatest value may have been in fosteringgovernment-industry collaborations.
- Industry brought their “A Teams”
Summary and Thoughts
Materials Technologies
http://www.eere.energy.gov
Bringing you a prosperous future where energy is clean, abundant, reliable, and affordable
Office of Energy EfficiencyOffice of Energy Efficiency and Renewable Energyand Renewable Energy
Materials Technologies
Back-upSlides

EERE Organization
Communications & Outreach
Assistant Secretary
Principal DeputyBoard of Directors
DAS for Business Administration
EERE Program Offices— Solar— Wind & Hydropower— Geothermal— Distributed Energy— Biomass— Industrial Technologies— FreedomCAR & Vehicle Technologies— Hydrogen & Infrastructure— Building Technologies— Weatherization & Intergov. Grants— FEMP
Golden Field Office
Program Execution Support
Planning, Budget Formulation & Analysis
Information & Business Management Systems
DAS for Technology Development
6 Regional Offices
HQ
Cor
pora
teFi
eld
Impl
emen
tatio
nH
Q P
rogr
am a
ndB
usin
ess
Man
agem
ent
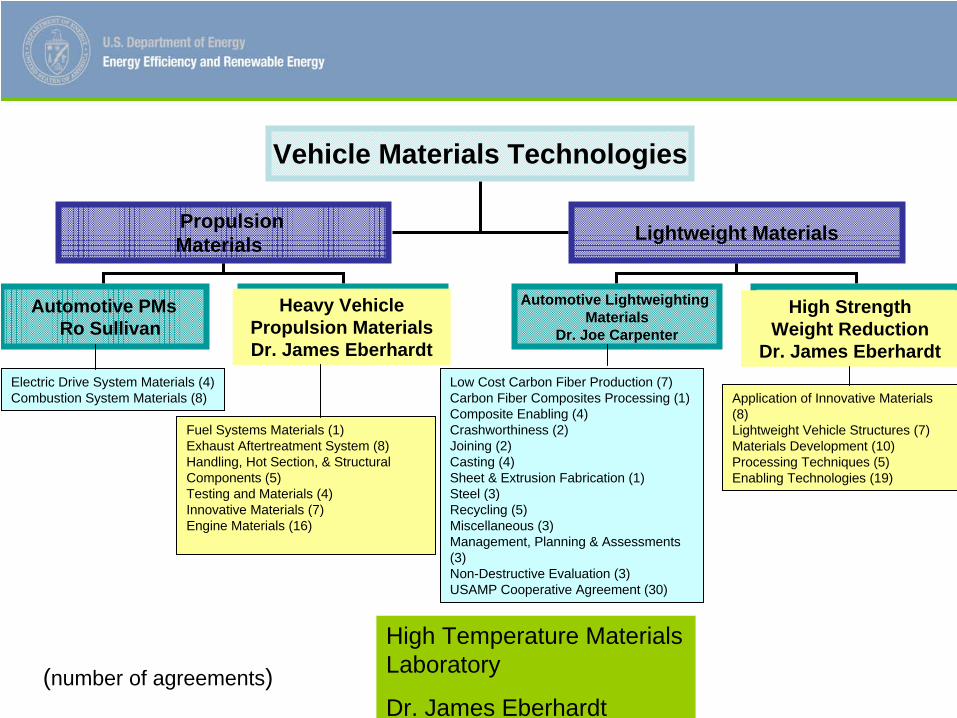
Vehicle Materials Technologies
Propulsion Materials Lightweight Materials
Automotive PMsRo Sullivan
Automotive LightweightingMaterials
Dr. Joe Carpenter
Low Cost Carbon Fiber Production (7)Carbon Fiber Composites Processing (1)Composite Enabling (4)Crashworthiness (2)Joining (2)Casting (4)Sheet & Extrusion Fabrication (1)Steel (3)Recycling (5)Miscellaneous (3)Management, Planning & Assessments (3)Non-Destructive Evaluation (3)USAMP Cooperative Agreement (30)
Electric Drive System Materials (4)Combustion System Materials (8)
Fuel Systems Materials (1)Exhaust Aftertreatment System (8) Handling, Hot Section, & Structural Components (5)Testing and Materials (4)Innovative Materials (7)Engine Materials (16)
Application of Innovative Materials (8)Lightweight Vehicle Structures (7)Materials Development (10)Processing Techniques (5)Enabling Technologies (19)
Heavy Vehicle Propulsion MaterialsDr. James Eberhardt
High Strength Weight Reduction
Dr. James Eberhardt
(number of agreements)
High Temperature Materials Laboratory
Dr. James Eberhardt
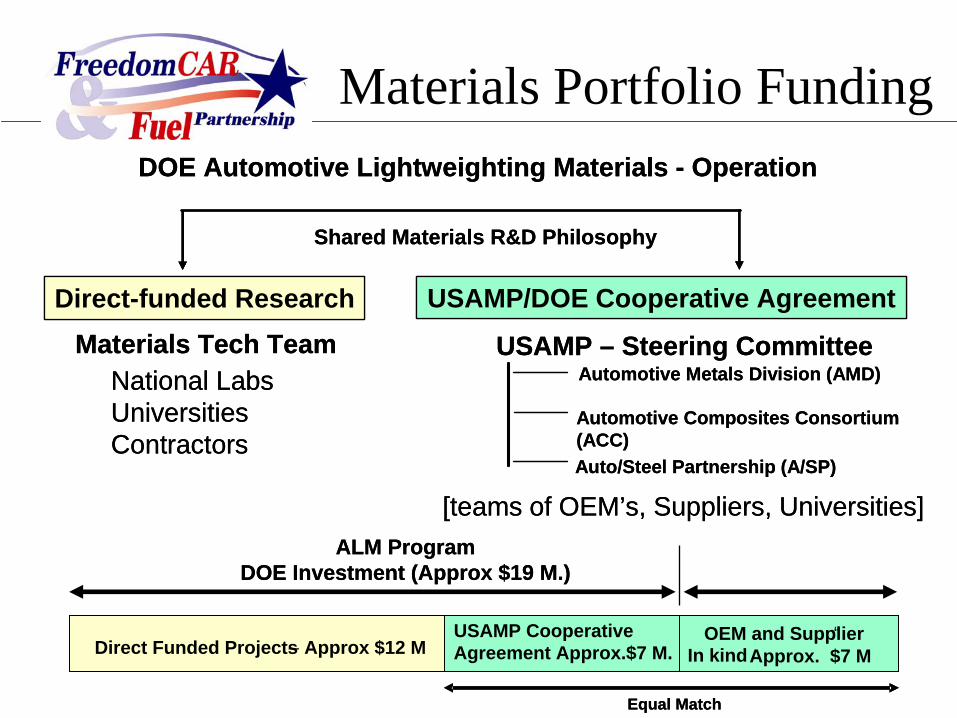
DOE Automotive Lightweighting Materials - Operation
USAMP/DOE Cooperative AgreementMaterials Tech Team USAMP – Steering Committee
Automotive Metals Division (AMD)
Automotive Composites Consortium(ACC)Auto/Steel Partnership (A/SP)
National LabsUniversitiesContractors
[teams of OEM’s, Suppliers, Universities]
Shared Materials R&D Philosophy
Direct-funded Research
Materials Portfolio Funding
OEM and Supplier “in kind” Approx. $7 M
USAMP CooperativeAgreement Approx.$7 M.Direct Funded Projects – Approx $12 M
ALM ProgramDOE Investment (Approx $19 M.)
Equal Match
OEM and Supplier “In kindApprox. $7 M
USAMP CooperativeAgreement Approx.$7 M.Direct Funded Projects – Approx $12 M
ALM ProgramDOE Investment (Approx $19 M.)
Equal Match
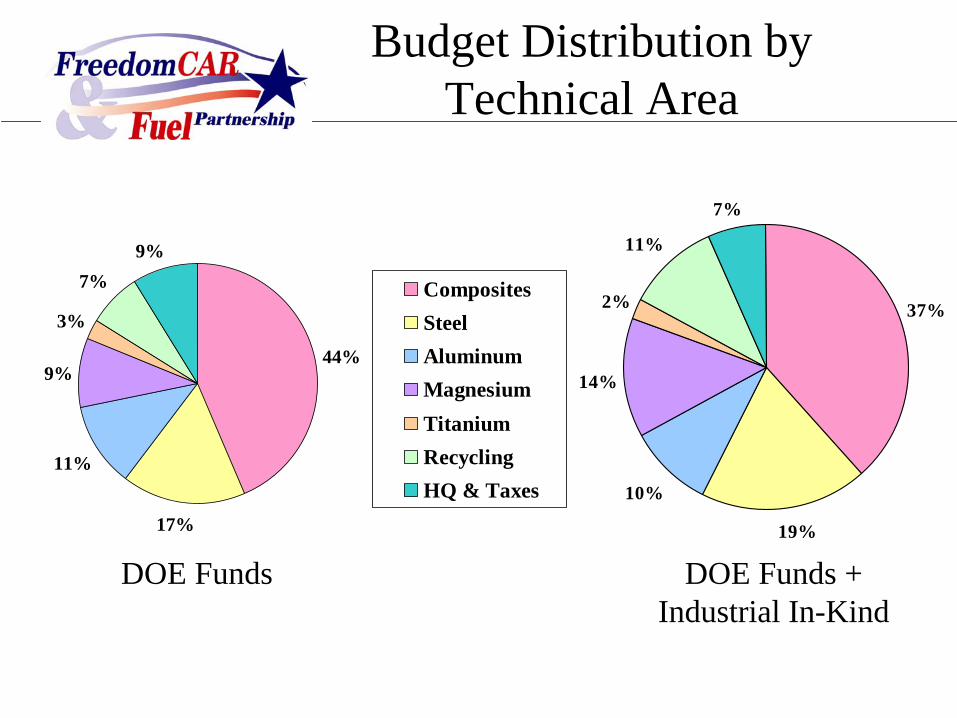
44%
17%
11%
9%
3%
7%9%
CompositesSteelAluminumMagnesiumTitaniumRecyclingHQ & Taxes
Budget Distribution by Technical Area
37%
19%
10%
14%
2%
11%
7%
DOE Funds DOE Funds +Industrial In-Kind
Materials Technologies
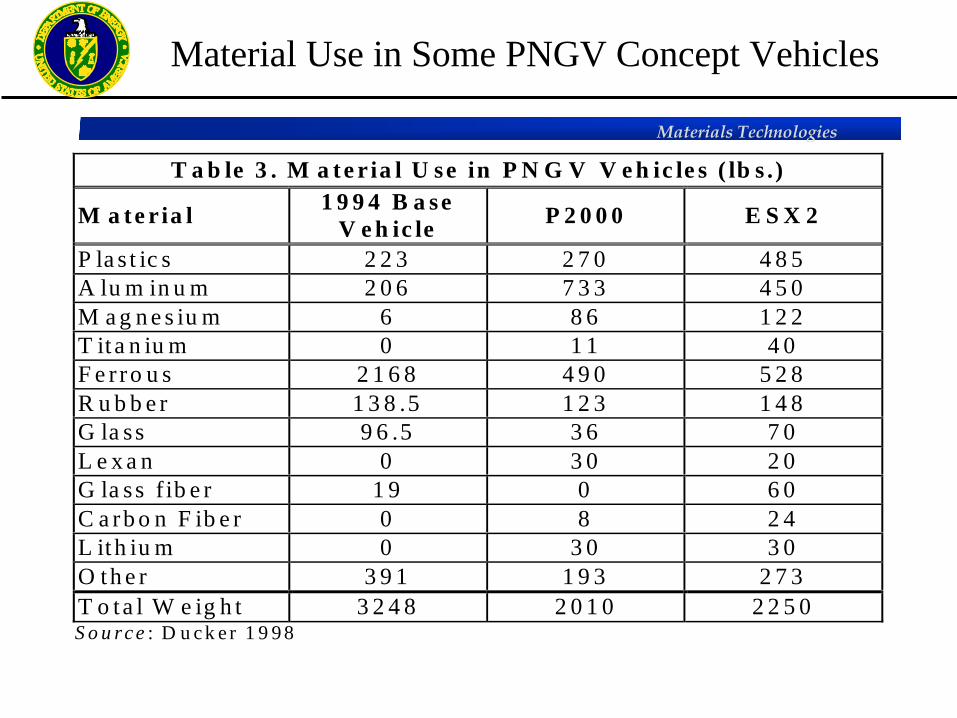
T a b le 3 . M a te r ia l U se in P N G V V e h ic le s ( lb s .)
M a te r ia l 1 9 9 4 B a seV e h ic le P 2 0 0 0 E S X 2
P la s t ic s 2 2 3 2 7 0 4 8 5A lu m in u m 2 0 6 7 3 3 4 5 0M a g n e s iu m 6 8 6 1 2 2T it a n iu m 0 1 1 4 0F e r ro u s 2 1 6 8 4 9 0 5 2 8R u b b e r 1 3 8 .5 1 2 3 1 4 8G la ss 9 6 .5 3 6 7 0L e x a n 0 3 0 2 0G la ss f ib e r 1 9 0 6 0C a rb o n F ib e r 0 8 2 4L ith iu m 0 3 0 3 0O th e r 3 9 1 1 9 3 2 7 3T o ta l W e ig h t 3 2 4 8 2 0 1 0 2 2 5 0
S o u rc e : D u c k e r 1 9 9 8
Material Use in Some PNGV Concept Vehicles
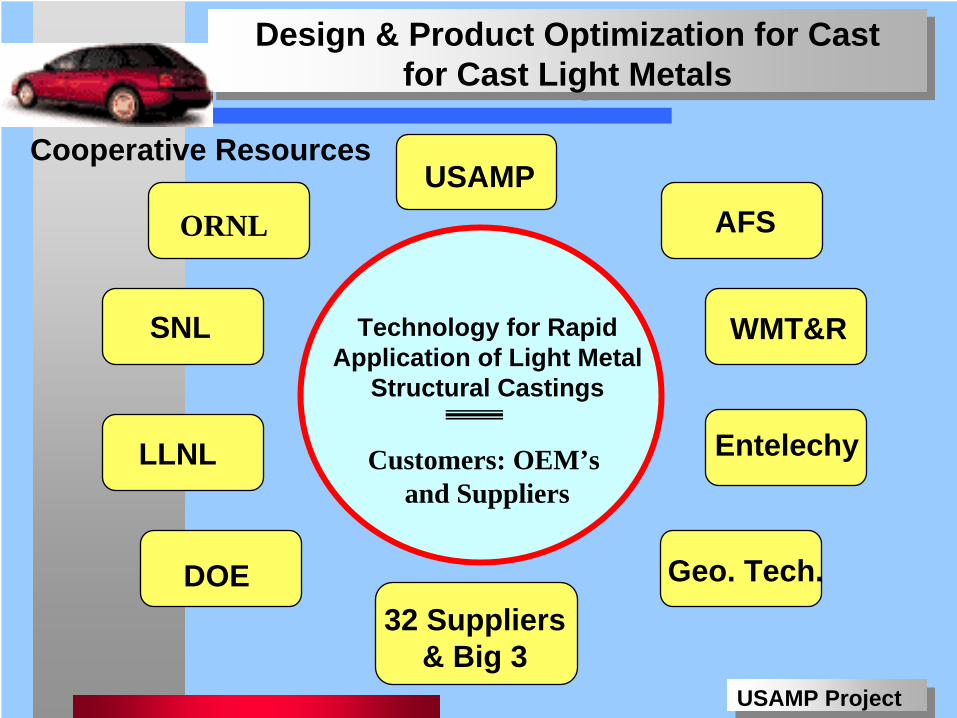
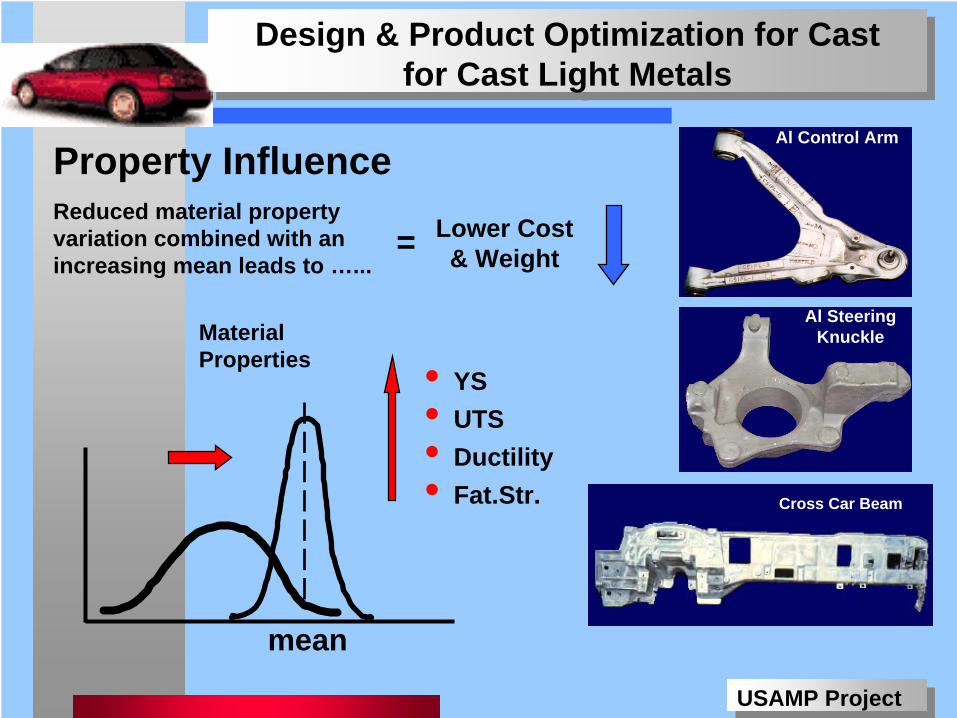
Design & Product Optimization for Castfor Cast Light Metals
Design & Product Optimization for Castfor Cast Light Metals
USAMP ProjectUSAMP Project
Technology for RapidApplication of Light Metal
Structural Castings
Customers: OEM’s and Suppliers
Cooperative Resources
AFS
WMT&R
Entelechy
USAMP
DOE
LLNL
SNL
ORNL
Geo. Tech.32 Suppliers
& Big 3

Design & Product Optimization for Castfor Cast Light Metals
Design & Product Optimization for Castfor Cast Light Metals
USAMP ProjectUSAMP Project
Material & TechnologyUsing New Technology to Further Reduce Component Weight
Original - Nodular Iron16 lbs.
Conversion to CastAluminum 6.7 lbs.
Application of Simulation Tool 5.4 lbs..
Component Weight Reduction
20% Savings58% Savings
Design & Product Optimization for Castfor Cast Light Metals
Design & Product Optimization for Castfor Cast Light Metals
USAMP ProjectUSAMP Project
mean
Cross Car Beam
Property InfluenceReduced material propertyvariation combined with anincreasing mean leads to …...
= Lower Cost& Weight
MaterialProperties
Al Control Arm
Al Steering Knuckle
• YS• UTS• Ductility• Fat.Str.
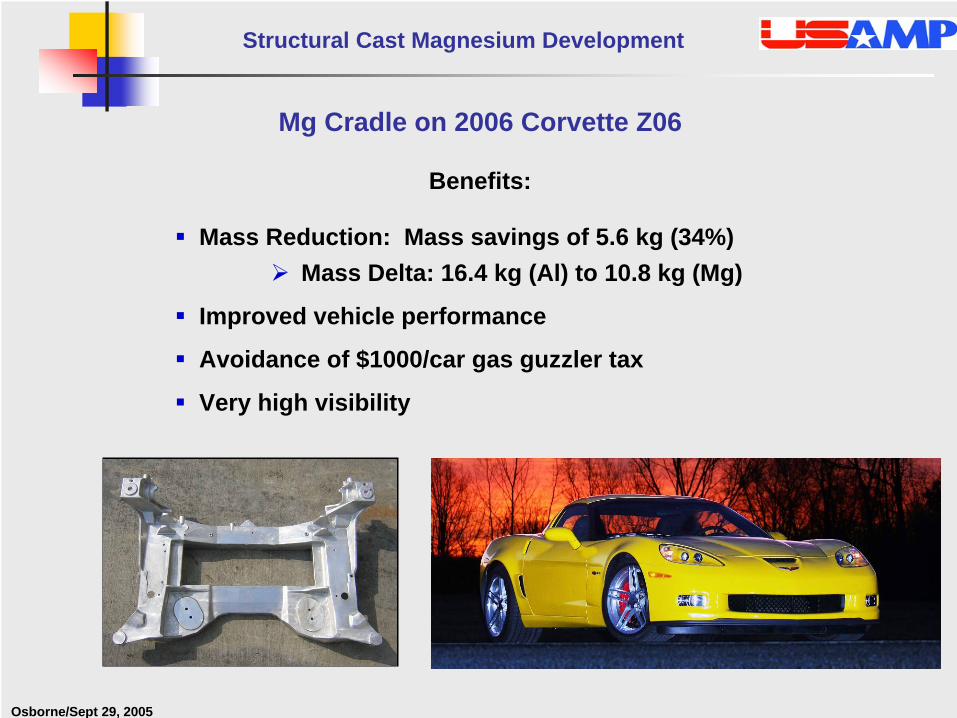
Structural Cast Magnesium Development
Osborne/Sept 29, 2005
Mg Cradle on 2006 Corvette Z06
Benefits:
Mass Reduction: Mass savings of 5.6 kg (34%)Mass Delta: 16.4 kg (Al) to 10.8 kg (Mg)
Improved vehicle performance
Avoidance of $1000/car gas guzzler tax
Very high visibility
AAT
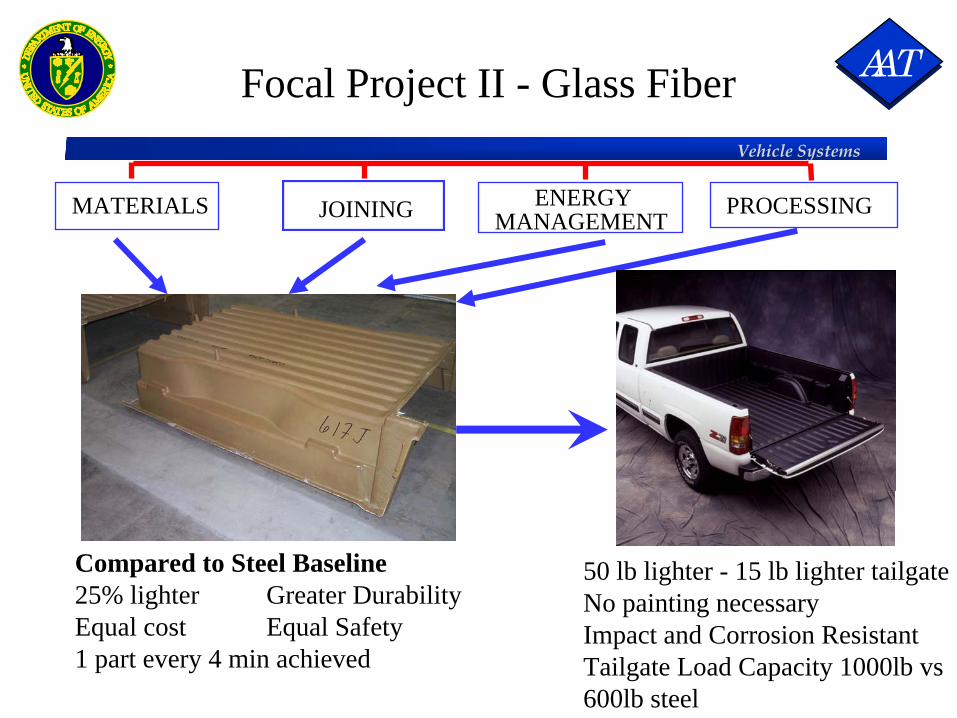
Vehicle Systems
Focal Project II - Glass Fiber
MATERIALS PROCESSINGJOINING ENERGYMANAGEMENT
Compared to Steel Baseline25% lighter Greater DurabilityEqual cost Equal Safety1 part every 4 min achieved
50 lb lighter - 15 lb lighter tailgateNo painting necessaryImpact and Corrosion ResistantTailgate Load Capacity 1000lb vs600lb steel