Freddie Mac Seasoned Loan Offerings
48
© Freddie Mac Freddie Mac Seasoned Loan Offerings Seasoned Credit Risk Transfer (“SCRT”) Seasoned Loans Structured Transaction (“SLST”) Non-Performing Loan Sales (“NPL”) September 2019
Transcript of Freddie Mac Seasoned Loan Offerings

© Freddie Mac 1
Freddie Mac Seasoned Loan Offerings
Seasoned Credit Risk Transfer (“SCRT”)
Seasoned Loans Structured Transaction (“SLST”)
Non-Performing Loan Sales (“NPL”)
September 2019

© Freddie Mac 2
Disclaimer
Notice to all Investors:
This document is not an offer to sell any Freddie Mac securities. Offers for any given security are made only through applicable offering circulars and related supplements, which incorporate Freddie Mac’s
Annual Report on Form 10-K for the year ended December 31, 2018, filed with the SEC on February 14, 2019; all other reports Freddie Mac filed with the SEC pursuant to Section 13(a) of the Exchange Act
since December 31, 2018, excluding any information "furnished" to the SEC on Form 8-K; and all documents that Freddie Mac files with the SEC pursuant to Sections 13(a), 13(c) or 14 of the Exchange Act,
excluding any information “furnished” to the SEC on Form 8-K. Content in this presentation is not reflective of current market/spreads and is not indicative of any future Freddie Mac offerings. Please use this
deck for informational purposes only.
The Presentation (the “Presentation”) is confidential and may not be reproduced or transferred, in whole or in part, to any other party that is not an employee, officer, director, or authorized agent of the recipient
without the express written consent of Freddie Mac.
The material provided herein is for informational purposes only and delivered solely as reference material with respect to previously issued securities. Any future offering of securities will occur only in
accordance with the terms and conditions set forth in an offering circular (“Offering Circular”). Investors are strongly urged to carefully review the related Offering Circular (including the risk factors described
therein) and to discuss any prospective investment in the related securities with their legal and tax advisers in order to make an independent determination of the suitability and consequences of an investment.
No person has been authorized to give any information or to make any representation, warranty, statement or assurance not contained in the related Offering Circular and, if given or made, such other
information or representation, warranty, statement or assurance must not be relied upon.
Prospective investors should inform themselves and take appropriate advice as to any applicable legal requirements and any applicable taxation and exchange control regulations in the countries of their
citizenship, residence or domicile which might be relevant to the subscription, purchase, holding, exchange, redemption or disposal of any securities.
Targets are objectives and should not be construed as providing any assurance or guarantee as to the results that may be realized in the future from investment in any asset or asset class described in the
Presentation. Please be advised that any targets shown in the Presentation are subject to change at any time and are current as of the date of this presentation only. In addition, the information contained
therein includes observations and/or assumptions and involves significant elements of subjective judgment and analysis. No representations are made as to the accuracy of such observations and assumptions
and there can be no assurances that actual events will not differ materially from those assumed. In the event any of the assumptions used in the Presentation do not prove to be true, results are likely to vary
substantially from those discussed therein.
A prospective investor in any securities must conduct its own independent review and due diligence to make its own assessment of the merits and risks of making an investment in, perform its own legal,
accounting and tax analysis and conclude that the investment in the securities (i) is fully consistent with the investor’s financial requirements and financial condition, investment objectives and risk tolerance; (ii)
complies and is fully consistent with all investment policies, guidelines and restrictions applicable to the investor; and (iii) is a fit, proper and suitable investment for the investor.
© Freddie Mac 3
Table of Contents
1. Retained Portfolio and Legacy Activity
2. Program Comparison and Collateral
3. Freddie Mac Credit Auctions
4. SCRT Structure
5. SLST Structure
6. Investor Participation
7. SCRT and SLST Deal Performance
8. SCRT and SLST Credit Features
9. Freddie Mac Key Contacts
© Freddie Mac 4
1. Retained Portfolio and Legacy Activity
© Freddie Mac 5
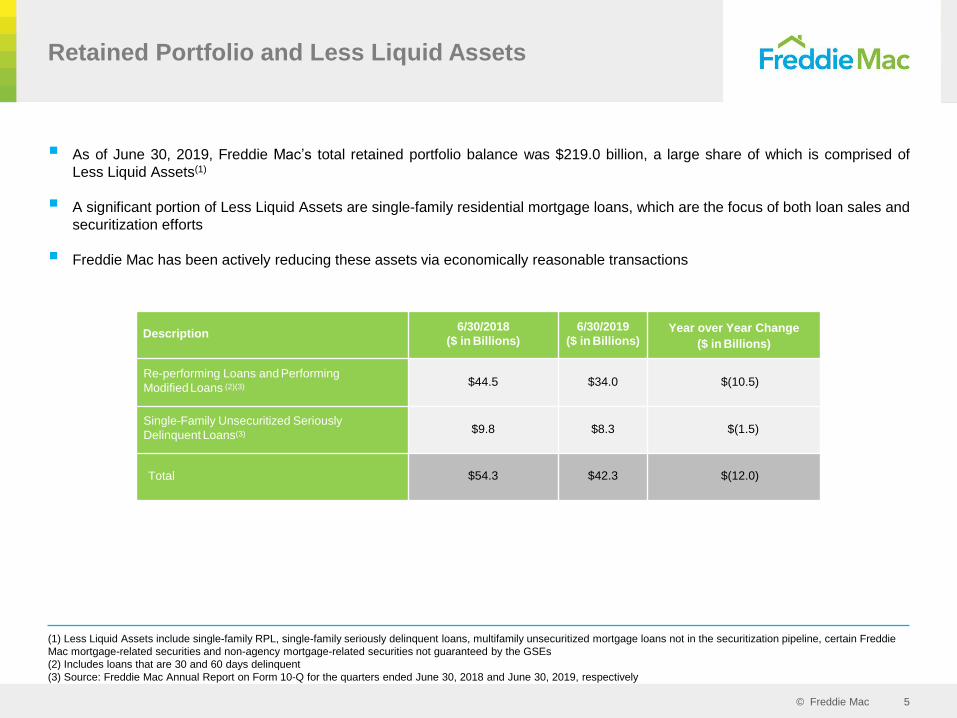
▪ As of June 30, 2019, Freddie Mac’s total retained portfolio balance was $219.0 billion, a large share of which is comprised of
Less Liquid Assets(1)
▪ A significant portion of Less Liquid Assets are single-family residential mortgage loans, which are the focus of both loan sales and
securitization efforts
▪ Freddie Mac has been actively reducing these assets via economically reasonable transactions
(1) Less Liquid Assets include single-family RPL, single-family seriously delinquent loans, multifamily unsecuritized mortgage loans not in the securitization pipeline, certain Freddie
Mac mortgage-related securities and non-agency mortgage-related securities not guaranteed by the GSEs
(2) Includes loans that are 30 and 60 days delinquent
(3) Source: Freddie Mac Annual Report on Form 10-Q for the quarters ended June 30, 2018 and June 30, 2019, respectively
Retained Portfolio and Less Liquid Assets
Description6/30/2018
($ in Billions)
6/30/2019
($ in Billions)Year over Year Change
($ in Billions)
Re-performing Loans and Performing
ModifiedLoans (2)(3) $44.5 $34.0 $(10.5)
Single-Family Unsecuritized Seriously
Delinquent Loans(3) $9.8 $8.3 $(1.5)
Total $54.3 $42.3 $(12.0)

© Freddie Mac 6
PCs - Fully Guaranteed Securitizations
R, M and H Pools
$28.7 billion settled since 2011
Primarily 12+ months clean pay history
Serviced to Freddie Mac Guide
No forborne UPB
No servicing change
SCRT - RPL Senior/Sub
Guaranteed Seniors/ Non-guaranteed Subs
$22.5 billion settled since Q4 2016
Primarily 12+ months clean pay history
Not serviced to Freddie Mac Guide
Includes forborne UPB
Freddie Mac selects servicer for trust
NPL Sales
SPO and EXPO Offerings
$8.1 billion settled since 2014
Primarily 12+ months delinquent
Not serviced to Freddie Mac Guide
Includes forborne UPB
NPL buyer selects servicer
SLST - RPL Structured Sales
Guaranteed Seniors/ Non-guaranteed Subs
$4.3 billion settled since Q4 2016
Primarily inconsistent pay RPLs and moderately DQ NPLs
Not serviced to Freddie Mac Guide
Includes forborne UPB
Buyer of subs selects servicer for the trust
Freddie Mac Seasoned and Legacy Loan ActivityApproximately $64 Billion from 2011 through August 2019
Source: Freddie Mac Press Releases on FreddieMac.com

© Freddie Mac 7
2. Program Comparison and Collateral

© Freddie Mac 8
Terms/Structural
FeatureSCRT SLST NPL
Guaranteed
CertificatesSeniors n/a
Ratings Class M Certificates None n/a
Representations &
Warranties Sunset36 Months 18 Months 10 Months
Collateral
Typically three loan groups consisting of
modified re-performing loans which have
been current based on the MBA method for
at least the prior 12 months
Single loan group of re-performing loans which
are typically < 12 months current and loans which
may be 30 or 60 days delinquent
SPO Pools: Typically comprised of two to three
loan pools, grouped by LTV and/or geography.
Each loan pool consists of loans that are
generally at least one year delinquent
EXPO Pools: Generally smaller in size than
SPO pools and may or may not be
geographically diverse. The marketing period is
approximately two weeks longer than the typical
marketing period for SPO pools
StructureThree separate groups of senior certificates
and shared subordinate certificates
One group of senior certificates and shared
subordinate certificatesTypically three SPO pools and one EXPO pool
Legal Final 40 Years 10 Years - Seniors n/a
Mandatory Guarantor
Repurchase Obligationn/a
Mandatory at year 10 for the Guarantor to
purchase the Class AF Certificaten/a
Optional Redemption n/a
The Majority Representative may call the deal at
years 4, 5, 7 and annually thereafter. In such
case, the Guaranteed Certificates will receive
102%, 101% and 100% of the Class Principal
Amount respectively
n/a
MACRs Yes n/a
Marketing Process SyndicatedSeniors – Syndicated
Subordinates - AuctionTwo Auctions – SPO and EXPO
Advancing by Servicer No P&I Advancing n/a
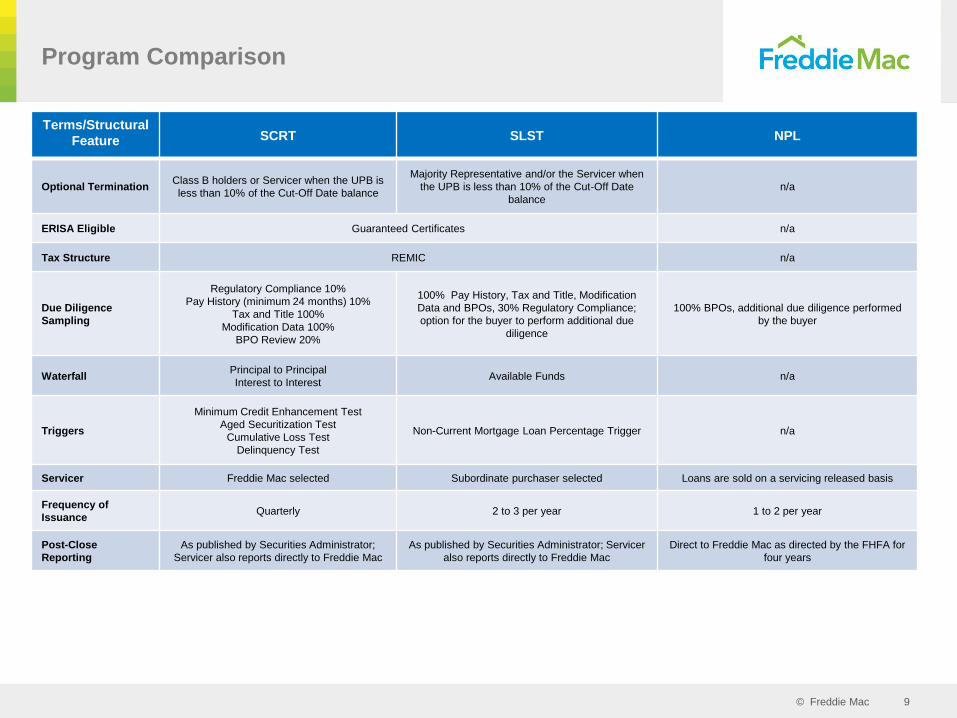
Program Comparison
© Freddie Mac 9
Terms/Structural
Feature SCRT SLST NPL
Optional TerminationClass B holders or Servicer when the UPB is
less than 10% of the Cut-Off Date balance
Majority Representative and/or the Servicer when
the UPB is less than 10% of the Cut-Off Date
balance
n/a
ERISA Eligible Guaranteed Certificates n/a
Tax Structure REMIC n/a
Due Diligence
Sampling
Regulatory Compliance 10%
Pay History (minimum 24 months) 10%
Tax and Title 100%
Modification Data 100%
BPO Review 20%
100% Pay History, Tax and Title, Modification
Data and BPOs, 30% Regulatory Compliance;
option for the buyer to perform additional due
diligence
100% BPOs, additional due diligence performed
by the buyer
WaterfallPrincipal to Principal
Interest to InterestAvailable Funds n/a
Triggers
Minimum Credit Enhancement Test
Aged Securitization Test
Cumulative Loss Test
Delinquency Test
Non-Current Mortgage Loan Percentage Trigger n/a
Servicer Freddie Mac selected Subordinate purchaser selected Loans are sold on a servicing released basis
Frequency of
IssuanceQuarterly 2 to 3 per year 1 to 2 per year
Post-Close
Reporting
As published by Securities Administrator;
Servicer also reports directly to Freddie Mac
As published by Securities Administrator; Servicer
also reports directly to Freddie Mac
Direct to Freddie Mac as directed by the FHFA for
four years
Program Comparison

© Freddie Mac 10
Collateral Groups
Seasoned Credit Risk Transfer (“SCRT”)
▪ 100% modified, broken into three loan groups
• Group M55 current threshold; has varied over time
Seasoned Loans Structured Transaction (“SLST”)
▪ Single loan group consisting of modified re-performing loans which are typically < 12 months current and loans which may be up to 60 days
delinquent
➢ Includes fixed rate and step-rate loans modified under GSE HAMP or other Freddie Mac modification programs
Group H Group M Group M55*
Step-rate modified loans that
have not made a final payment
at their final rate
Fixed-rate and step-rate
modified loans which have made
at least one payment at their
final rate
Fixed-rate and step-rate
modified loans which have made
at least one payment at their
final rate
May or may not include forborne
principal
May or may not include forborne
principalNo forborne principal
No cap on note rate
Note rate < 5.50% with no
forbearance; and any note rate
with forbearance
Note rate > 5.50%
SPO Pool 1 SPO Pool 2 SPO Pool 3 EXPO PoolBPO CLTV < 90; High
active Bankruptcy and
cashflowing loan
concentration
BPO CLTV < 90;
National
BPO CLTV > 90;
National
BPO CLTV > 90;
National; typically less
than $25mm UPB
Non-Performing Loans (“NPL”)

© Freddie Mac 11
SCRT Collateral Characteristics Comparison
2017-1 2017-2 2017-3 2017-4 2018-1 2018-2 2018-3 2018-4 2019-1 2019-2 2019-3
Ge
ne
ral
As of Date 3/31/2017 6/30/2017 8/31/2017 10/31/2017 1/31/2018 4/30/2018 6/30/2018 9/30/2018 1/31/2019 3/31/2019 6/30/2019
% Modified 100% 100% 100% 100% 100% 100% 100% 100% 100% 100% 100%
Loan Count 4,361 9,939 7,176 9,977 10,983 8,628 11,716 9,782 12,185 12,406 13,018
Total UPB (incl. forborne UPB) in millions of USD $1,115 $2,475 $1,707 $1,852 $1,832 $1,592 $2,324 $1,952 $2,097 $2,411 $2,246
Forborne UPB in millions of USD $249 $488 $375 $76 $192 $170 $296 $258 $256 $302 $236
% UPB Forborne 22% 20% 22% 4% 11% 11% 13% 13% 12% 13% 11%
% of Loans with a Forbearance UPB 93% 91% 93% 14% 46% 45% 55% 57% 49% 54% 41%
Avg. Loan Size in thousands of USD $256 $249 $238 $186 $167 $185 $198 $200 $172 $194 $173
No
te R
ate
Weighted Average Note Rate at Origination(1) 6.43% 6.43% 6.36% 6.32% 6.15% 6.00% 6.12% 6.24% 6.13% 6.22% 5.81%
Weighted Average Current Note Rate(1) 3.69% 3.52% 4.10% 4.04% 4.29% 4.15% 4.10% 4.17% 4.40% 4.34% 4.46%
Weighted Average Effective Note Rate(2) 2.87% 2.83% 3.20% 3.87% 3.84% 3.71% 3.58% 3.62% 3.86% 3.80% 3.99%
Weighted Average Terminal Note Rate (1)(3) 4.51% 4.28% 4.46% 4.47% 4.58% 4.50% 4.39% 4.39% 4.50% 4.45% 4.53%
Weighted Average Terminal Effective Note Rate(2)(3) 3.51% 3.44% 3.48% 4.28% 4.10% 4.02% 3.83% 3.81% 3.96% 3.89% 4.05%
Te
rm / L
TV
/ C
red
it S
co
re Weighted Average Loan Age from Origination (mos) 121 125 126 130 137 139 137 143 150 147 141
Weighted Average Loan Age from Modification (mos)(4) 67 58 65 62 60 64 66 71 70 66 61
Weighted Average Remaining Maturity (mos) 408 415 411 349 389 378 379 377 385 394 384
Weighted Average LTV at Origination 77% 80% 81% 78% 81% 80% 78% 78% 79% 79% 81%
Weighted Average Updated LTV (FHFA Indexed)(5) 81% 87% 82% 69% 70% 67% 67% 66% 64% 68% 62%
Weighted Average AVM Current LTV 88% 92% 89% 72% 75% 69% 69% 71% 71% 74% 66%
% of Loans with AVM Current LTV >105% 17% 24% 21% 4% 11% 6% 7% 8% 7% 9% 4%
Non-Zero Weighted Average Credit Score at Origination 702 698 697 691 694 695 698 695 686 689 694
Non-Zero Weighted Average Current Credit Score 691 681 688 675 673 677 689 691 672 675 674
Pa
y H
isto
ry /
Mo
dif
ica
tio
ns
Average Number of Months Clean Pay History 58 51 56 51 49 51 56 58 47 43 42
% of Loans with 12+ Months Clean Pay History 100% 100% 100% 100% 100% 100% 100% 100% 100% 100% 100%
% of Loans with 24+ Months Clean Pay History 92% 86% 92% 87% 73% 83% 87% 88% 63% 62% 52%
% of Loans with 36+ Months Clean Pay History 77% 73% 80% 63% 60% 66% 75% 75% 49% 41% 39%
% of Loans modified within 24 Months 4% 7% 1% 8% 18% 10% 4% 5% 9% 13% 28%
% of Loans modified between 25 to 36 Months 6% 8% 3% 10% 7% 9% 7% 6% 11% 12% 9%
Servicer SPS Nationstar Nationstar Nationstar SLS SLS SPS SPS SLS SPS SLS
(1) Note rates are weighted by interest bearing unpaid principal balance only
(2) Calculated as the note rate multiplied by the ratio of the aggregate unpaid interest bearing balance over the aggregate unpaid principal balance
(3) Calculated as the weighted average of the fixed-rate or maximum step-rate over the life of each Mortgage Loan
(4) Modification date is based on the later of deferred payment modification and non-deferred payment modification for deals up to and including SCRT 2018-4. Beginning with SCRT 2019-1, modification date excludes any
deferred payment modifications
(5) The updated LTVs were estimated based on the most recent FHFA Home Price Index values available as of the related Cut-Off Date
© Freddie Mac 12
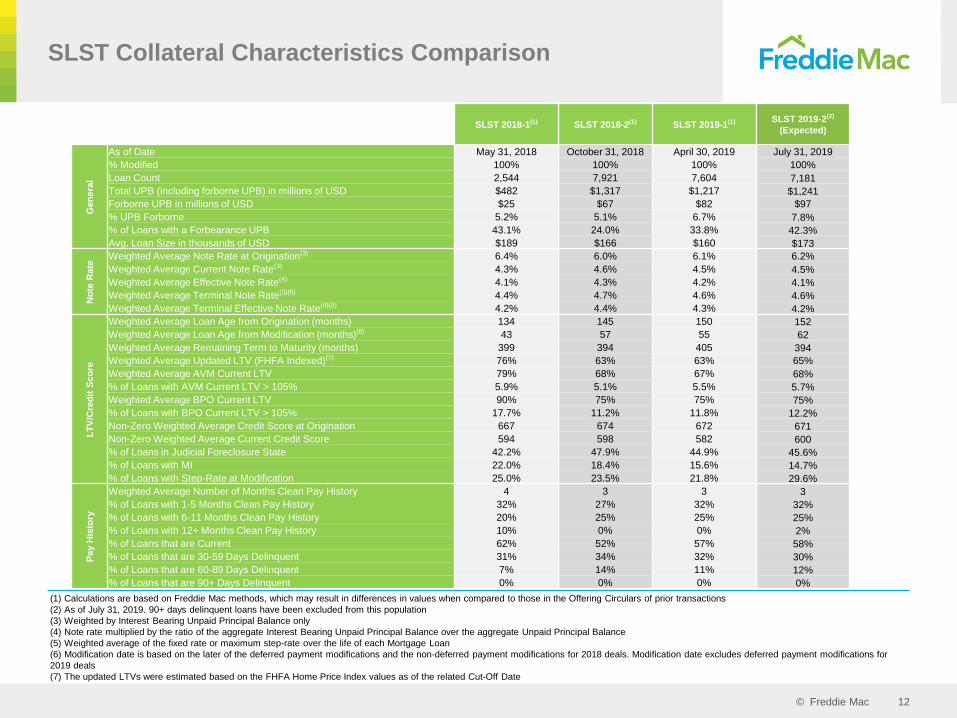
SLST Collateral Characteristics Comparison
(1) Calculations are based on Freddie Mac methods, which may result in differences in values when compared to those in the Offering Circulars of prior transactions
(2) As of July 31, 2019. 90+ days delinquent loans have been excluded from this population
(3) Weighted by Interest Bearing Unpaid Principal Balance only
(4) Note rate multiplied by the ratio of the aggregate Interest Bearing Unpaid Principal Balance over the aggregate Unpaid Principal Balance
(5) Weighted average of the fixed rate or maximum step-rate over the life of each Mortgage Loan
(6) Modification date is based on the later of the deferred payment modifications and the non-deferred payment modifications for 2018 deals. Modification date excludes deferred payment modifications for
2019 deals
(7) The updated LTVs were estimated based on the FHFA Home Price Index values as of the related Cut-Off Date
SLST 2018-1(1) SLST 2018-2(1) SLST 2019-1(1) SLST 2019-2(2)
(Expected)
Gen
era
l
As of Date May 31, 2018 October 31, 2018 April 30, 2019 July 31, 2019
% Modified 100% 100% 100% 100%
Loan Count 2,544 7,921 7,604 7,181
Total UPB (including forborne UPB) in millions of USD $482 $1,317 $1,217 $1,241
Forborne UPB in millions of USD $25 $67 $82 $97
% UPB Forborne 5.2% 5.1% 6.7% 7.8%
% of Loans with a Forbearance UPB 43.1% 24.0% 33.8% 42.3%
Avg. Loan Size in thousands of USD $189 $166 $160 $173
No
te R
ate
Weighted Average Note Rate at Origination(3) 6.4% 6.0% 6.1% 6.2%
Weighted Average Current Note Rate(3) 4.3% 4.6% 4.5% 4.5%
Weighted Average Effective Note Rate(4) 4.1% 4.3% 4.2% 4.1%
Weighted Average Terminal Note Rate(3)(5) 4.4% 4.7% 4.6% 4.6%
Weighted Average Terminal Effective Note Rate(4)(5) 4.2% 4.4% 4.3% 4.2%
LT
V/C
red
it S
co
re
Weighted Average Loan Age from Origination (months) 134 145 150 152
Weighted Average Loan Age from Modification (months)(6) 43 57 55 62
Weighted Average Remaining Term to Maturity (months) 399 394 405 394
Weighted Average Updated LTV (FHFA Indexed)(7) 76% 63% 63% 65%
Weighted Average AVM Current LTV 79% 68% 67% 68%
% of Loans with AVM Current LTV > 105% 5.9% 5.1% 5.5% 5.7%
Weighted Average BPO Current LTV 90% 75% 75% 75%
% of Loans with BPO Current LTV > 105% 17.7% 11.2% 11.8% 12.2%
Non-Zero Weighted Average Credit Score at Origination 667 674 672 671
Non-Zero Weighted Average Current Credit Score 594 598 582 600
% of Loans in Judicial Foreclosure State 42.2% 47.9% 44.9% 45.6%
% of Loans with MI 22.0% 18.4% 15.6% 14.7%
% of Loans with Step-Rate at Modification 25.0% 23.5% 21.8% 29.6%
Pay H
isto
ry
Weighted Average Number of Months Clean Pay History 4 3 3 3
% of Loans with 1-5 Months Clean Pay History 32% 27% 32% 32%
% of Loans with 6-11 Months Clean Pay History 20% 25% 25% 25%
% of Loans with 12+ Months Clean Pay History 10% 0% 0% 2%
% of Loans that are Current 62% 52% 57% 58%
% of Loans that are 30-59 Days Delinquent 31% 34% 32% 30%
% of Loans that are 60-89 Days Delinquent 7% 14% 11% 12%
% of Loans that are 90+ Days Delinquent 0% 0% 0% 0%

© Freddie Mac 13
NPL Collateral Characteristics Comparison 2019-1
(1) Denotes rates that are weighted by interest bearing unpaid principal balance only
(2) LTV is calculated as Total UPB divided by BPO
Description All SPO 1 SPO 2 SPO 3 EXPO 1
Genera
l
As of Date 2/28/2019 2/28/2019 2/28/2019 2/28/2019 2/28/2019
% Modified 57% 67% 44% 65% 54%
Loan Count 2123 568 960 473 122
Total UPB (incl. forborne UPB) in millions of USD $363 $104 $142 $93 $23
Total Debt in millions of USD $431 $118 $171 $112 $30
Total BPO in millions of USD $467 $140 $212 $82 $34
Forborne UPB in millions of USD $17 $5 $2 $10 $0.4
% UPB Forborne 5% 4% 1% 11% 2%
% of Loans with a Forbearance Modification 22% 22% 9% 44% 15%
Avg. Loan Size in thousands of USD $171 $183 $148 $199 $186
No
te R
ate Weighted Average Number of Days Delinquent 783 588 828 850 1,118
Weighted Average Note Rate at Origination(1) 5.98% 6.00% 5.87% 6.19% 5.83%
Weighted Average Current Note Rate(1) 4.70% 4.5% 4.99% 4.46% 4.69%
LT
V/C
red
it S
co
re
Weighted Average Loan Age from Origination (months) 135 135 134 138 136
Weighted Average LTV at Origination 80% 79% 79% 82% 76%
Weighted Average Current Loan-to-Value Ratio weighted by UPB(2) 86% 81% 70% 122% 70%
Weighted Average Current Loan-to-Value Ratio weighted by BPO(2) 78% 74% 67% 115% 67%
% of Loans with <= 90 LTV(2) 66% 73% 100% 0% 100%
% of Loans with > 90 LTV(2) 34% 27% 0% 100% 0%
Pa
y H
isto
ry
% of Loans that are 90+ Days Delinquent 100% 100% 100% 100% 100%
% of Loans with Mortgagors in Bankruptcy 17% 60% 0% 0% 0%
% of Loans with Mortgagors in Active Foreclosure 39% 10% 48% 53% 56%
% of Loans with Mortgagors in Suspended Foreclosure 51% 69% 45% 42% 41%
Cashflowing Loans (1 payment last 3 months, or 2 payments last 6 months 22% 76% 0% 0% 0%
Cashflowing Loans' Average Payment Percentage (of last 3 months) 60% 60% 0% 0% 0%
Geogra
phy Florida 13% 10% 12% 19% 0%
New York 17% 12% 6% 20% 100%
New Jersey 9% 10% 9% 12% 0%
North Carolina/South Carolina/Virginia 3% 5% 4% 2% 0%

© Freddie Mac 14
3. Freddie Mac Credit Auctions
Seasoned Loans Structured Transactions (“SLST”) - Subordinates
Non-Performing Loan Sales
Standard Pool Offerings (“SPO”)
Extended Timeline Pool Offerings (“EXPO”)

© Freddie Mac 15
Qualification and Process
Qualification for SLST & NPL
▪ To qualify, Bidders need to provide:
➢ Non-Disclosure Agreement and Bidder Qualification Statement providing representations to Freddie Mac and
identifying the Bidding Entity, its Owners, Financiers and Capital Providers
➢ Proof of funds to demonstrate the winning Bidder’s ability to provide the deposit post-award
➢ A Servicer Diligence Questionnaire providing details about the Bidder’s selected initial servicer, subject to
Freddie Mac’s approval
➢ NPL EXPO qualification has lower net worth requirements given smaller pool size
Process
▪ SLST
➢ Eligible Bidders are bidding for the right to purchase the subordinate securities of the SLST transaction and
the right to appoint a servicer and a collateral administrator
➢ Once eligible, Bidders have access to the Data Room which provides access to a data tape, Intex (cdi) file,
term sheet, form PSA and due diligence results
▪ Non-Performing Loans – SPO & EXPO
➢ Eligible Bidders are bidding to purchase whole loans that are sold servicing-released
➢ Once eligible, Bidders have access to the Data Room which provides access to a data tape, form MLPSA,
form ISA, and servicing files

© Freddie Mac 16
SLST Subordinate Auction
(1) Indicative structure based on whole loan price of 96.00%
(2) Advance rate is equal to (1.0 minus the Initial Credit Enhancement) divided by the applicable whole loan price (assumed)
Whole Loan Price
(Assumed)(1)
Initial Credit
Enhancement %Advance Rate(2)
Subordinate
Certificate Price
Subordinate
Certificates Size
($mm)
Subordinate
Certificates
Invested ($mm)
Base -2.0% 94.00% 21.50% 83.51% 72.09% $310 $223
Base -1.0% 95.00% 20.75% 83.42% 75.90% $299 $227
Indicative
Base96.00% 20.00% 83.33% 80.00% $288 $230
Base +1.0% 97.00% 19.25% 83.25% 84.42% $277 $234
Base +2.0% 98.00% 18.50% 83.16% 89.19% $266 $238
▪ Each Bidder will be required to submit a loan-level price for each Mortgage Loan in the Mortgage Pool in a percentage of the Unpaid
Principal Balance
▪ The loan-level prices provided will be used to calculate certain securitization structures in the form (e.g., the original principal balance of
the Guaranteed Certificates and the credit enhancement levels) and the price of the Subordinate Certificates
▪ Freddie Mac is not obligated to accept any bidder stipulations or conditions
Examples of indicative structure output and invested amounts at various whole loan price inputs. Repo may further reduce
invested amounts
(i) Offering (ii) Auction (iii) Purchaser Diligence & Collateral Administrator Formation & Terms
(iv) Final Population
(v) Senior Syndication
(vi)Settlement

© Freddie Mac 17
Rights and Obligations – SLST Auction Winner
Subordinate Certificate Retention Requirement
Majority Representative
▪ The Majority Representative, if any, has:
➢ The Optional Redemption Right;
➢ The right to exercise the Clean-Up Call; and
➢ The right to terminate the Collateral Administrator, with the obligation to replace the Collateral Administrator
Loan Sale Right
▪ Beginning in month three after issuance, the Servicer may sell any loans that are 180 days or more delinquent to any third
party unaffiliated with the Servicer, Collateral Administrator or Majority Representative, in an arm’s length transaction as long
as:
➢ Sale must result in an economic benefit to the Certificateholders;
➢ The maximum number of loans sold in any calendar year will not exceed 5.0% of the total number of mortgage loans
as of the immediately preceding calendar year; and
➢ The number of loans sold must not cumulatively exceed 10.0% of the total number of mortgage loans as of the Cut-Off
Date
Years 1 to 3 Years 4, 5 and 7 After year 7
100% of the Class M-2, Class
M-3, Class B and Class XS
May sell all to a single
purchaser
May sell all or some if certain
thresholds are met

© Freddie Mac 18
NPL Auction
(i) Offering(ii) SPO Auction
(iii) EXPO Auction
(iv) Purchaser Diligence(v) Final
Population
(vi) Settlement (Dates may vary by Purchaser)
▪ Each Bidder will be required to submit a loan-level price for each Mortgage Loan in the Mortgage Pool as a
percentage of the Unpaid Principal Balance
▪ Freddie Mac is not obligated to honor (and, if such bid wins, may ignore) any bid stipulations requiring consultation
with a bidder prior to awarding the pool to such bidder
▪ A single winning bidder will be selected for each pool or multiple pools in an all-or-none award contingency
▪ The winning bidder will have an opportunity to conduct its own analysis of the mortgage loans upon executing the
Binding Trade Confirmation and prior to purchasing the mortgage loans
▪ Expo bids are due two weeks after SPO bids

© Freddie Mac 19
4. SCRT Structure

© Freddie Mac 20
SCRT 2019-3 Capital Structure
(1) Only Guaranteed Pass-Through Certificates are included in the Guaranteed Class
Section
(2)
(3) Class Coupons described in more detail in the term sheet and offering materials
(4) MACR Certificates
Transaction Structure(1)
Loan
GroupClass
Maximum Initial Class
Principal or
Initial Class
Notional Amount
Approximate
Initial Class
Coupon
Initial Credit
Enhancement
WAL
(years)(2)
Stated Final
Distribution
Date
Principal
Window
(months)(2)
Ratings
DBRS / Fitch
H HT(4) $99,746,000 3.000% 9.00% 7.41 October 2058 1 – 289 Guaranteed
M MT(4) $1,747,024,000 3.500% 9.00% 7.74 October 2058 1 – 299 Guaranteed
M55 M55D $196,876,000 4.000% 9.00% 4.42 October 2058 1 - 206 Guaranteed
Mezzanine M $72,988,000 4.750%(3) 5.75% 8.58 October 2058 77 – 135 B(low)(sf) / B-(sf)
Sub PO B $129,131,518 0.000%(5) 0.00% 22.95 October 2058 135 – 469 NR / NR
Excess Servicing IO XS-IO $2,245,765,518 0.065%(3) N/A 8.34 October 2058 N/A NR / NR
Senior IO A-IO $2,043,646,000 0.201%(3) N/A 7.41 October 2058 N/A NR / NR
Sub IO B-IO $202,119,518 2.010%(3) N/A 17.76 October 2058 N/A NR / NR
Sub + IO BBIO(4)(7) $129,131,518 3.146%(3) 0.00% 22.95 October 2058 135 – 469 NR / NR
Sub + IO BX(4)(6) $129,131,518 6.333%(3) 0.00% 22.95 October 2058 135 – 469 NR / NR
Sub + IO + Ex. Serv. BXS(4)(8) $129,131,518 7.464%(3) 0.00% 22.95 October 2058 135 – 469 NR / NR
Total $2,245,765,518
Pricing Assumptions CPR CDR Severity
Group H Ramp from 5% to
8% CPR over 24
months
Ramp from 0%
to 1% over 36
months
25%Group M
Group M55 15% CPR
(5) The Class B Certificates are principal only certificates
(6) The Class BX Certificates are a combination of the Class B, Class A-IO and Class B-IO
Certificates
(7) The Class BBIO Certificates are a combination of the Class B and Class B-IO Certificates
(8) The Class BXS Certificates are a combination of the Class B, Class A-IO, Class B-IO and
Class XS-IO Certificates
Note: On the Closing Date, investors paid 43 days of Accrued Interest, calculated on the issuance Unpaid Principal Balance and the
initial Class Coupon for the related security purchased

© Freddie Mac 21
SCRT 2019-3 Guaranteed Senior Certificates
SCRT 2019-3
Group Class
Initial Class
Principal or
Initial Class
Notional Amount
Approximate
Initial Class
Coupon
Initial Credit
Enhancement
WAL
(years)(2)Principal Window
(months) (2)Pricing - Spread or
Proceeds
H HT(1) $99,746,000 3.000% 9.00% 7.41 1-289 4 up / UMBS 3.0
H HA $74,810,000 3.000% 9.00% 4.54 1-135 85 / I
H HB(1) $24,936,000 3.000% 9.00% 16.00 135-289 103 / I
H HV $12,468,000 3.000% 9.00% 9.66 1-158 95 / I
H HZ $12,468,000 3.000% 9.00% 17.36 158-289 112 / I
M MT(1) $1,747,024,000 3.500% 9.00% 7.74 1-299 62 up / UMBS 3.5
M MA $1,310,268,000 3.500% 9.00% 476 1-141 90 / I
M MC(1) $1,310,268,000 3.250% 9.00% 4.76 1-141 n/a
M MD(1) $1,310,268,000 3.000% 9.00% 4.76 1-141 n/a
M MA-IO(1) $187,181,142 3.500% 9.00% 4.76 N/A n/a
M MB(1) $436,756,000 3.500% 9.00% 16.68 141-299 108 / I
M MV $218,378,000 3.500% 9.00% 9.30 1-159 98 / I
M MZ $218,378,000 3.500% 9.00% 17.79 159-299 118 / I
M55 M55D $196,876,000 4.000% 9.00% 4.42 1-206 40 up / UMBS 4.0
M55 M55E(1) $196,876,000 3.500% 9.00% 4.42 1-206 n/a
M55 M55G(1) $196,876,000 3.000% 9.00% 4.42 1-206 n/a
M55 M55I(1) $35,795,636 5.500% 9.00% 4.42 N/A n/a
(1) MACR Certificates
(2)SCRT Pricing Assumptions CPR CDR Severity
Group HRamp from 5% to 8%
CPR over 24 months
Ramp from 0% to
1% over 36
months
25%Group M
Group M55 15% CPR

© Freddie Mac 22
SCRT Structure Evolution
Item Description SCRT 18-1 SCRT 18-2 SCRT 18-3 SCRT 18-4 SCRT 19-1 SCRT 19-2 SCRT 19-3
Initial Credit
Enhancement
Initial Subordination
Percentage 10.00% 8.00% 7.75% 7.75% 9.25% 10.25% 9.00%
Class M Subordination
Percentage 6.00% 4.75% 4.50% 4.50% 5.50% 6.25% 5.75%
Minimum Credit
Enhancement
Test
The Subordination
Percentage is greater than
or equal to the stated
amount and the sum of
the Class M and Class B
Certificates exceeds the
stated amount
17.50% 15.00% 16.00% 15.00% 16.50% 18.00% 16.50%
3.00 % of the Cut-Off Date UPB 4.00% of the Cut-Off Date UPB
Aged
Securitization
Test
The Class M is outstanding and the Distribution Date is before month 180
Delinquency TestIf the Distressed Principal Balance for a Distribution Date is less than the product of (i) 50% and (ii) any excess of the aggregate outstanding Class
Principal Amount of the Class M and Class B Certificates over aggregate Realized Losses
Cumulative Loss
Test

© Freddie Mac 23
SCRT 2019-3 MACR and Exchangeable Combinations
Note: All percentages are approximate
(1) MACR Certificates
(2) Exchangeable Certificates
(3) Accretion Directed (“AD”) Certificates
HT(1)
3.00%
Pass-Through
HB(1)
3.00%
Back-Pay (25%)
HA(2)
3.00%
Front-Pay (75%)
HZ(2)
3.00%
Accrual (50%)
HV(2)(3)
3.00%
AD (50%)
MT(1)
3.50%
Pass-Through
MB(1)
3.50%
Back-Pay (25%)
MA(2)
3.50%
Front-Pay (75%)
MZ(2)
3.50%
Accrual (50%)
MV(2)(3)
3.50%
AD (50%)
Group H Certificates Group M Certificates

© Freddie Mac 24
SCRT 2019-3 MACR Combinations
Note: All percentages are approximate
(1) MACR Certificates
(2) Exchangeable Certificates
(3) For illustrative purposes, 100% of the maximum Class Principal Amount of MA can be exchanged for MA1 and MAIO as described in the related Offering Circular
(4) For illustrative purposes, 100% of the maximum Class Principal Amount of M55D can be exchanged for M55G and M55I as described in the related Offering Circular
MA(2)
3.50%
Front-Pay (75%)
MA1(1)
3.00%
Strip Down (100%)
MAIO(1)(3)
3.50%
MA Certificates
MA2(1)
3.25%
Strip Down (100%)
M55D(2)
4.00%
Pass-Through
M55G(1)
3.00%
Strip Down (100%)
M55I(1)(4)
5.50%
IO
Group M55 Certificates
M55E(1)
3.50%
Strip Down (100%)
IO
© Freddie Mac 25
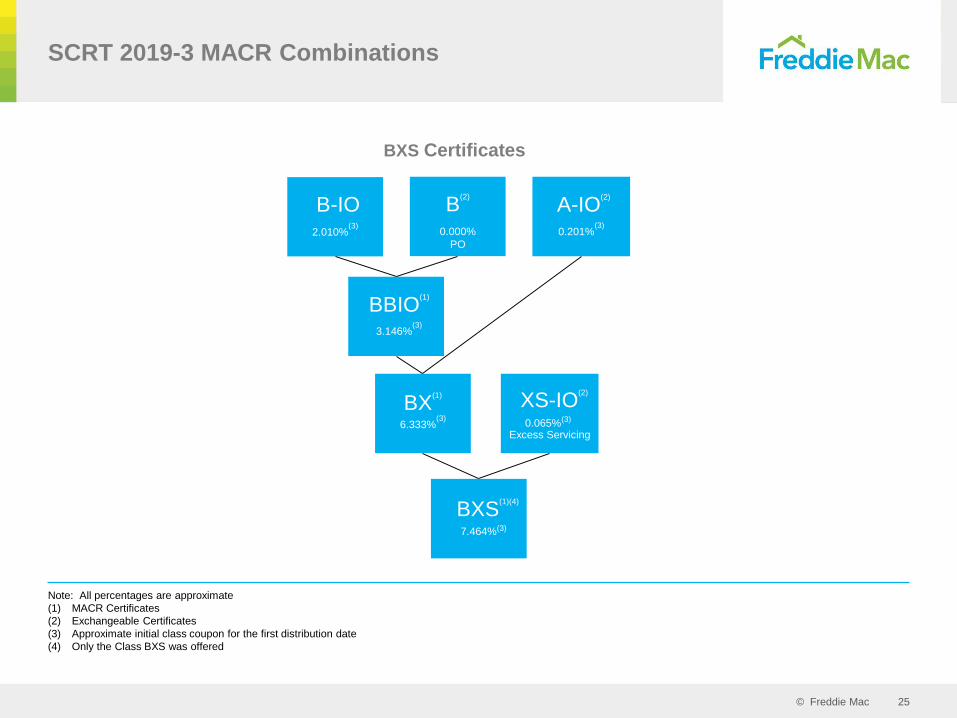
BBIO(1)
3.146%(3)
SCRT 2019-3 MACR Combinations
Note: All percentages are approximate
(1) MACR Certificates
(2) Exchangeable Certificates
(3) Approximate initial class coupon for the first distribution date
(4) Only the Class BXS was offered
BXS(1)(4)
7.464%(3)
BX(1)
6.333%(3)
XS-IO(2)
0.065%(3)
Excess Servicing
B-IO2.010%
(3)
B(2)
0.000%
PO
A-IO(2)
0.201%(3)
BXS Certificates

© Freddie Mac 26
5. SLST Structure

© Freddie Mac 27
SLST 2019-1 Capital Structure
Transaction Structure
Class
Initial Class
Principal or
Initial Class
Notional Amount
% UPBInitial Credit
Enhancement
Initial
CouponClass Type
Mandatory
Guarantor
Repurchase
Date/Stated
Final
Distribution
Date
Class Type Pricing
Spreads
A-1 $734,728,882 56.44% 24.75% 3.50% Fixed May 2029 Guaranteed/Sequential 70 / I
A-2 $244,909,627 18.81% 24.75% 3.50% Fixed May 2029 Guaranteed/Sequential 78 / I
AF $979,638,509 75.25% 24.75% 3.50% Fixed/Floating October 2058 Guaranteed/Not Offered N/A
A $979,638,509 75.25% 24.75% 3.50% Fixed May 2029 Guaranteed/Pass-Through N/A
M-1 $80,551,672 18.56% 18.56% 3.00% Fixed/Net WAC October 2058 Subordinate N/A
M-2 $80,551,672 12.38% 12.38% 3.00% Fixed/Net WAC October 2058 Subordinate N/A
M-3 $80,551,672 6.19% 6.19% 3.00% Fixed/Net WAC October 2058 Subordinate N/A
B $80,551,672 6.19% 0.00% 3.00% Fixed/Net WAC October 2058 Subordinate N/A
XS N/A N/A N/A N/A N/A N/A Excess Servicing Strip N/A
Total $1,301,845,198 100.00%
SLST Pricing Assumptions CPR CDR Severity
SLST 2019-1Ramp from 3% to 6%
CPR over 36 months
Ramp from 0% to
2.5% over 36
months
30%

© Freddie Mac 28
SLST 2019-3 Guaranteed Senior Certificates
(1) Only Guaranteed Pass-Through Certificates are included in the Guaranteed Class
Section
(2) Class Coupons described in more detail in a term sheet and offering materials
(3) MACR Certificates
SLST Pricing Assumptions CPR CDR Severity
SLST 2019-1Ramp from 3% to 6%
CPR over 36 months
Ramp from 0% to
2.5% over 36
months
30%
Indicative MACR Combinations(1)
Base
Class
Offered
Class
Maximum Initial
Class
Principal/Notional
Amount
Approximate
Initial Class
Coupon %
WAL
(years)(2)
Principal
Window
(months)(2)
Class Type Pricing Spreads
A-1
A-1 $706,289,201 3.50% 5.14 1-120 Sequential 70 / I
A-1B(3) $706,289,201 3.00% 5.14 1-120 Sequential, Strip Down 78 / I
A-1C(3) $706,289,201 2.75% 5.14 1-120 Sequential, Strip Down N/A
A-1D(3) $706,289,201 2.50% 5.14 1-120 Sequential, Strip Down N/A
A-1IO(3) $201,796,914(4) 3.50% 5.14 N/A Interest Only N/A
A-2
A-2 $235,429,734 3.50% 9.99 120-120 Sequential N/A
A-2B(3) $235,429,734 3.00% 9.99 120-120 Sequential, Strip Down N/A
A-2C(3) $235,429,734 2.75% 9.99 120-120 Sequential, Strip Down N/A
A-2D(3) $235,429,734 2.50% 9.99 120-120 Sequential, Strip Down N/A
A-2IO(3) $67,265,638(4) 3.50% 9.99 N/A Interest Only N/A
A(3)
A(3) $941,718,935 3.50% 6.36 1-120 Pass-Through N/A
AB(3) $941,718,935 3.00% 6.36 1-120 Pass-Through, Strip Down N/A
AC(3) $941,718,935 2.75% 6.36 1-120 Pass-Through, Strip Down N/A
AD(3) $941,718,935 2.50% 6.36 1-120 Pass-Through, Strip Down N/A
A-IO(3) $269,062,552(4) 3.50% 6.36 N/A Interest Only N/A

© Freddie Mac 29
SLST Structure Evolution
(1) Exchangeable Certificates
(2) Class A Certificates in SLST 2018-1 and Class AF Certificates in SLST 2018-2, SLST 2019-1 and SLST 2019-2 are collateral for Class A-1 and Class A-2 Certificates, as applicable in their respective
transactions
Terms/Structural Features
SLST 2018-1
June 2018
$482 million
SLST 2018-2
November 2018
$1,317 million
SLST 2019-1
May 2019
$1,217 million
SLST 2019-2
(as of July 2019)
$1,241 million
Guaranteed Certificates
A-1 – Fixed (front sequential)
A-2 – Fixed (back sequential)
A(2) – Fixed/Floating
A-1(1) – Fixed (front sequential)
A-2(1) – Fixed (back sequential)
AF(2) – Fixed/Floating
A(1) – Fixed (MACR)
Representation and Warranty
Sunset18 Months
Tax Structure REMIC
Cashflow Triggers Non Current Mortgage Loan Percentage Trigger
Initial Credit Enhancement 27.78% 24.13% 22.63% 21.45%
Maximum Equity Leakage /
Target Credit Enhancement
Excess above the amount needed to maintain Guaranteed Certificates Target Credit Enhancement
Target Credit Enhancement:
32.78%
Target Credit Enhancement:
29.13%
Target Credit Enhancement:
29.63%
Target Credit Enhancement:
28.45%
Optional Redemption At Years 4, 5, 7 and annually thereafter (subject to Call Prices)
Guarantor Repurchase of
Guaranteed Certificates Mandatory at year 10
Subordinate Certificate
Retention RequirementsM-2, M-3 and B M-2, M-3, B and XS M-1, M-2, M-3, B and XS

© Freddie Mac 30
6. Investor Participation

© Freddie Mac 31
Guaranteed Senior Investor Types
Guaranteed Certificates – SCRT(1) Guaranteed Certificates – SLST(2)
(1) Market Value is reflected as of issuance for SCRT 2017-1 to 2019-3
(2) Market Value is reflected as of issuance for SLST 2018-1 to 2019-2
Bank/Credit Union, 24.6%
Dealer, 15.3%
Money Manager, 48.4%
Insurance Company,
7.9%
REIT, 1.9%
Hedge Fund, 1.8%
Bank/Credit Union, 41.2%
Dealer, 0.2%
Money Manager, 45.3%
Insurance Company,
9.8%
REIT, 1.5%
Hedge Fund, 0.1% FHLB, 2.0%

© Freddie Mac 32
Guaranteed Senior Investor Participation
SCRT Program Participation – Guaranteed Certificates
SLST Program Participation – Guaranteed Certificates
613 14 18 14 14 20 24 30 28 32 28614
2127 29 32
3744
5260
66 67
0
10
20
30
40
50
60
70
SCRT2016-1
SCRT2017-1
SCRT2017-2
SCRT2017-3
SCRT2017-4
SCRT2018-1
SCRT2018-2
SCRT2018-3
SCRT2018-4
SCRT2019-1
SCRT2019-2
SCRT2019-3
Deal Participation Cumulative Participation
19 20 16 15
19
30
3844
0
10
20
30
40
50
SLST2018-1
SLST2018-2
SLST2019-1
SLST2019-2
Deal Participation Cumulative Participation

© Freddie Mac 33
Subordinate Investor Types
Non-Guaranteed Certificates – SCRT(1) Non-Guaranteed Certificates – SLST(2)
(1) Market Value is reflected as of issuance for SCRT 2017-1 to 2019-3
(2) Market Value is reflected as of issuance for SLST 2018-1 to 2019-2
Dealer, 0.9%
Money Manager, 28.9%
Insurance Company,
1.2%REIT, 18.0%
Hedge Fund, 31.4%
Private Equity, 19.6%
REIT, 61.0%
Hedge Fund / Private Equity,
39.0%

© Freddie Mac 34
SCRT Credit Tranches at Pricing
* Total Market Value ("MV") divided by Class B balanceSources:
(1) 100 PPS via Intex CDI (Pricing-Closing Info collateral mode)(2) BTM via Bloomberg BCMV page at 100 BTM (19-3: as of 8/16/2019; 19-2: as of 6/18/2019, prior to 19-2: as of 4/16/2019, using oldest available collateral)(3) YB via Yield Book v21.4 model (19-3: as of 8/2019 remit, assuming 9/17/2019 settle; 19-2: as of 5/2019 remit, assuming 6/18/2019; prior to 19-2:as of 3/2019 remit, assuming 4/16/2019 settle)
100 PPS BTM YB
Deal Spread Investors New Unique Tranche Format MV (mm) $ PX* Investors New Unique
16-1 475 7 7 7 B+BIO Auction 11.0 11.8 19.2 1 1 1 4.6 2.6 3.3
17-1 475 3 1 8 B+BIO Dealer 12.0 10.8 21.4 1 1 2 4.1 2.9 2.1
17-2 385 8 3 11 B+BIO Syndicated 50.0 20.2 11.4 4 3 5 4.1 3.4 3.3
17-3 310 12 5 16 B+BIO Syndicated 40.0 23.4 9.5 5 3 8 4.1 2.8 2.9
17-4 260 10 2 18 B+BIO Syndicated 37.0 40.0 8.7 4 0 8 1.4 1.8 0.7
18-1 210 8 0 18 BX Syndicated 60.0 54.6 7.4 6 1 9 1.7 2.2 1.2
18-2 225 5 0 18 BX Syndicated 37.0 48.9 7.5 4 0 9 1.8 3.0 1.0
18-3 225 5 0 18 BX Syndicated 34.0 32.5 8.8 4 0 9 1.8 2.2 0.9
18-4 260 4 2 20 BXS Syndicated 27.5 31.3 9.7 2 0 9 1.8 2.2 1.6
19-1 350 9 1 21 BXS Syndicated 41.0 35.6 10.7 1 0 9 1.8 2.4 1.7
19-2 330 11 2 23 BXS Syndicated 50.0 33.2 10.8 4 2 11 1.8 2.9 2.5
19-3 285 9 1 24 BXS Syndicated 64.0 49.6 9.1 6 1 12 1.8 2.2 1.3
Yield Cumu. Net Loss Rate (CNLR)
Second Loss First Loss Collateral
475 475
385
310260
210 225 225260
350 330285
0
100
200
300
400
500
0
2
4
6
8
10
12
14
16-1 17-1 17-2 17-3 17-4 18-1 18-2 18-3 18-4 19-1 19-2 19-3
Spre
ad in
Bas
is Po
ints
Coun
t
Second Loss
Investors New Spread (RHS)
19.221.4
11.49.5 8.7
7.4 7.58.8 9.7 10.7 10.8
9.1
0
3
6
9
12
15
18
21
24
0
1
2
3
4
5
6
7
8
16-1 17-1 17-2 17-3 17-4 18-1 18-2 18-3 18-4 19-1 19-2 19-3
Bond
Equ
ival
ent
Yiel
d
Coun
t
First Loss
Investors New Yield (RHS)

© Freddie Mac 35
SCRT and SLST Program Support
Models
▪ Bloomberg
➢ Natively supports pricing speeds: 100 PPS: through the API and BDP
➢ Model Projections: 100 BTM calls a version of the Bloomberg Transition Model fit to similar collateral
▪ Yield Book
➢ Prepay model fit for cohorts with forbearance
➢ Modern default model similar to STACR models
➢ Analytics: Agency OAS is available through the GUI and YB add-in
▪ Loan-Level Data (Post-Issuance)
➢ US Bank Trust Gateway: Provides monthly loan-level remittance data
➢ https://pivot.usbank.com/
➢ CoreLogic: Redistributes loan-level remittance data
➢ 1010data: Redistributes loan-level remittance data in the form of an aggregated dataset (stacked for each
deal and month)
➢ https://www.1010data.com/industires/financial-services/fixed-income/
➢ SCRT/SLST dataset path: pub.fin.risk_share.fhlmc_rpl.monthly
Financing
▪ Freddie Mac can offer repo financing for SCRT and SLST pass-through, front and back pay sequential tranches to
approved counterparties
➢ Contact: Carmino Santomaro at 571-382-5701
▪ Bank of New York has re-classified SCRT Guaranteed Certificates as “Agency MBS” making them eligible for
financing under the BNY Mellon Tri-party Repo
▪ SCRT Guaranteed Securities are acceptable collateral to pledge at some of the FHLBs

© Freddie Mac 36
7. SCRT and SLST Deal Performance

© Freddie Mac 37
SCRT Historical Performance by Group
Source: Bloomberg
(1) 1 Month VPR is weighted by the aggregate unpaid principal balance of the mortgage loans as of the prior month
(2) Group M > SCRT 2017-3 1 Month VPR includes Group M45 1 Month VPR
(3) Group M55 1 Month VPR includes Group M60 1 Month VPR
Apr-17 May-17 Jun-17 Jul-17 Aug-17 Sep-17 Oct-17 Nov-17 Dec-17 Jan-18 Feb-18 Mar-18 Apr-18 May-18 Jun-18 Jul-18 Aug-18 Sep-18 Oct-18 Nov-18 Dec-18 Jan-19 Feb-19 Mar-19 Apr-19 May-19 Jun-19
Group H </= SCRT 2017-3 4.4 4.3 6.9 5.5 4.0 4.7 5.7 6.4 4.1 4.3 2.9 3.8 4.1 4.3 4.5 4.5 4.8 3.3 3.6 3.7 2.3 2.9 2.0 3.3 4.3 4.2 4.6
Group H > SCRT 2017-3 10.3 9.3 10.7 3.5 7.0 5.0 7.0 6.8 5.2 7.1 5.7 5.0 5.0 4.4 4.4 4.6 4.9 5.3 6.5
Group M </= SCRT 2017-3 4.5 2.6 4.0 4.2 2.4 4.6 3.6 5.4 3.8 4.4 2.2 1.7 3.5 3.9 3.0 5.5 4.5 2.2 3.1 2.2 2.8 3.9 2.5 2.5 3.4 4.4 3.9
Group M > SCRT 2017-3(2) 14.7 11.8 10.7 8.1 7.2 7.5 8.9 8.8 9.8 7.9 6.6 6.7 5.6 5.1 4.9 4.2 5.5 6.4 5.8
Group M55(3) 11.5 20.5 16.5 16.5 11.3 11.1 15.5 12.1 11.3 14.1 13.5 10.6 10.1 10.5 12.5 11.0 9.9 10.4 10.7
1 Month VPR(1)
0.00
5.00
10.00
15.00
20.00
25.00
Group H </= SCRT 2017-3 Group H > SCRT 2017-3 Group M </= SCRT 2017-3 Group M > SCRT2017-3(2) Group M55(3)
Ra
te %

© Freddie Mac 38
SCRT Historical Performance
Source: Bloomberg
1 Month VPR
1 Month VPR
0.00
2.00
4.00
6.00
8.00
10.00
12.00
14.00
Rate
%
SCRT 2016-1 SCRT 2017-1 SCRT 2017-2 SCRT 2017-3
0.00
2.00
4.00
6.00
8.00
10.00
12.00
14.00
Rate
%
SCRT 2017-4 SCRT 2018-1 SCRT 2018-2 SCRT 2018-3 SCRT 2018-4 SCRT 2019-1 SCRT 2019-2

© Freddie Mac 39
SCRT Historical Performance
Source: Bloomberg
Historical DQ60+(1)
0.00
1.00
2.00
3.00
4.00
5.00
6.00
7.00
8.00
Rate
%
SCRT 2016-1 SCRT 2017-1 SCRT 2017-2 SCRT 2017-3 SCRT 2017-4 SCRT 2018-1
SCRT 2018-2 SCRT 2018-3 SCRT 2018-4 SCRT 2019-1 SCRT 2019-2
(1) DQ 60+ is the percentage of mortgage loans 60 or more days delinquent, including mortgage loans in foreclosure, bankruptcy, and real estate owned (REO) buckets

© Freddie Mac 40
SCRT Forbearance Recovery(1)
IB UPB
= 86%
FB UPB
= 14%
Recovery
of IB UPB
= 83%
Severity
on IB UPB
= 17% Total
Average
Severity
= 31%
All SCRT Issued
(LTV(6) = 77)
IB UPB
= 78%
FB UPB
= 22%
SCRT Liquidated Loans
(LTV(6) = 109)
Severity
on FB UPB
= 78%
(1) Based on issuance data and post-issuance remittance data available up to June 2019 Distribution
(2) Includes Principal Forbearance Loss
(3) Includes Subsequent Gains/Losses
(4) Assumes recovery proceeds are applied to interest bearing UPB then applied to forbearance UPB
(5) Total Forbearance Recovery = (e + k + r - q) / (d + j + q + r)
(6) Weighted average AVM LTV at issuance
SCRT Issuance
a Total UPB 20,291,180,155
b Forbearance UPB 2,856,895,322
c % UPB Forborne 14%
Prepaid in Full
d Forbearance UPB(2) 106,336,471
e Forbearance Collected 106,336,471
f Forbearance Recovery 100%
Liquidated
g Interest Bearing UPB 13,841,794
h Interest Bearing Collected(3)(4) 11,436,999
i Severity on Interest Bearing UPB(4) 17%
j Forbearance UPB 3,994,128
k Forbearance Collected(3)(4) 886,365
l Severity on Forbearance UPB(4) 78%
m Total UPB 17,835,921
n Severity on Total UPB 31%
Modified Post-Closing
o Forbearance UPB at Issuance 19,664,392
p Post-Closing Additional Forbearance 3,247,709
q Forbearance Forgiven 550,083
r Forbearance moved to Interest Bearing 2,375,712
s Post-Mod Forbearance UPB 19,986,307
Total
t Forbearance Recovery(5) 96%
© Freddie Mac 41
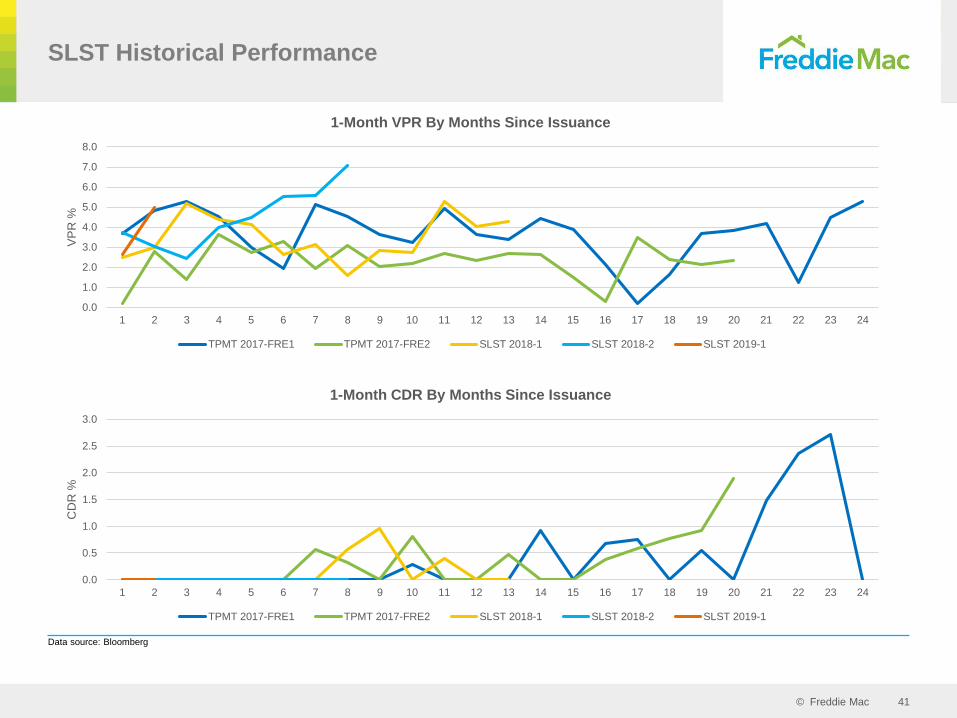
SLST Historical Performance
Data source: Bloomberg
0.0
1.0
2.0
3.0
4.0
5.0
6.0
7.0
8.0
1 2 3 4 5 6 7 8 9 10 11 12 13 14 15 16 17 18 19 20 21 22 23 24
VP
R %
1-Month VPR By Months Since Issuance
TPMT 2017-FRE1 TPMT 2017-FRE2 SLST 2018-1 SLST 2018-2 SLST 2019-1
0.0
0.5
1.0
1.5
2.0
2.5
3.0
1 2 3 4 5 6 7 8 9 10 11 12 13 14 15 16 17 18 19 20 21 22 23 24
CD
R %
1-Month CDR By Months Since Issuance
TPMT 2017-FRE1 TPMT 2017-FRE2 SLST 2018-1 SLST 2018-2 SLST 2019-1

© Freddie Mac 42
SLST Historical Credit Performance
(1) Includes Bankruptcy, Foreclosure and REO
Data source: Bloomberg
40
50
60
70
80
90
1 2 3 4 5 6 7 8 9 10 11 12 13 14 15 16 17 18 19 20 21 22 23 24 25
% C
urr
en
t
Current by Deal Age
TPMT 2017-FRE1 TPMT 2017-FRE2 SLST 2018-1 SLST 2018-2 SLST 2019-1
0
10
20
30
40
1 2 3 4 5 6 7 8 9 10 11 12 13 14 15 16 17 18 19 20 21 22 23 24 25
% 9
0+
da
ys D
Q
90+ Days DQ by Deal Age(1)
TPMT 2017-FRE1 TPMT 2017-FRE2 SLST 2018-1 SLST 2018-2 SLST 2019-1

© Freddie Mac 43
60%
65%
70%
75%
80%
85%
90%
95%
100%
105%
110%
% Scheduled Payments MadeBy Calendar Month(1)(2)
SLST 2017-1 SLST 2017-2 SLST 2018-1 SLST 2018-2 SLST 2019-1
SLST Historical Cashflow
90% of Scheduled Payments Made
(1) Weighted by ending total UPB as of July 2019 remittance data
(2) It is assumed that: (a) if a loan is modified or liquidated in the current cycle, no payment is made; and (b) actual number of payments made is calculated as the number of months due date moved forward
compared to the prior cycle

© Freddie Mac 44
8. SCRT and SLST Credit Features
© Freddie Mac 45
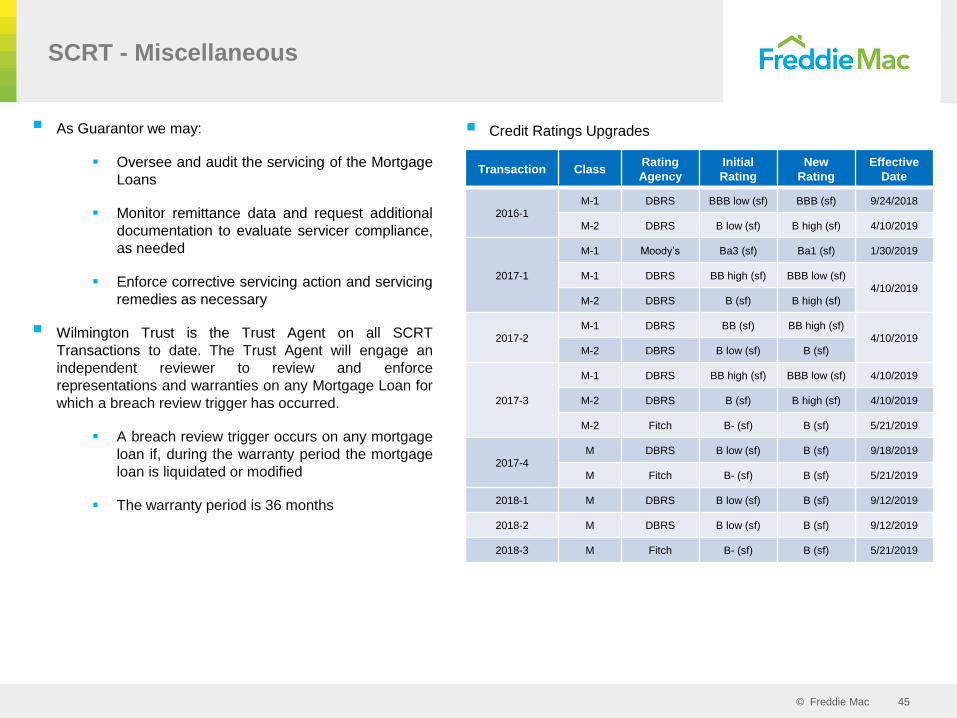
▪ As Guarantor we may:
▪ Oversee and audit the servicing of the Mortgage
Loans
▪ Monitor remittance data and request additional
documentation to evaluate servicer compliance,
as needed
▪ Enforce corrective servicing action and servicing
remedies as necessary
▪ Wilmington Trust is the Trust Agent on all SCRT
Transactions to date. The Trust Agent will engage an
independent reviewer to review and enforce
representations and warranties on any Mortgage Loan for
which a breach review trigger has occurred.
▪ A breach review trigger occurs on any mortgage
loan if, during the warranty period the mortgage
loan is liquidated or modified
▪ The warranty period is 36 months
SCRT - Miscellaneous
▪ Credit Ratings Upgrades
Transaction ClassRating
Agency
Initial
Rating
New
Rating
Effective
Date
2016-1M-1 DBRS BBB low (sf) BBB (sf) 9/24/2018
M-2 DBRS B low (sf) B high (sf) 4/10/2019
2017-1
M-1 Moody’s Ba3 (sf) Ba1 (sf) 1/30/2019
M-1 DBRS BB high (sf) BBB low (sf)4/10/2019
M-2 DBRS B (sf) B high (sf)
2017-2M-1 DBRS BB (sf) BB high (sf)
4/10/2019M-2 DBRS B low (sf) B (sf)
2017-3
M-1 DBRS BB high (sf) BBB low (sf) 4/10/2019
M-2 DBRS B (sf) B high (sf) 4/10/2019
M-2 Fitch B- (sf) B (sf) 5/21/2019
2017-4M DBRS B low (sf) B (sf) 9/18/2019
M Fitch B- (sf) B (sf) 5/21/2019
2018-1 M DBRS B low (sf) B (sf) 9/12/2019
2018-2 M DBRS B low (sf) B (sf) 9/12/2019
2018-3 M Fitch B- (sf) B (sf) 5/21/2019

© Freddie Mac 46
SLST Servicing and Collateral Oversight
The Collateral Administrator and Guarantor each have responsibilities for management of the collateral and servicing.
COLLATERAL ADMINISTRATOR
▪ General oversight of the Securitization Servicer
▪ Subject to the terms of the Pooling and Servicing Agreement, consent, withhold consent or waive the right to consent to the
Securitization Servicer’s:
» Strategy for implementing foreclosure alternatives and property valuation
» Sale of any REO properties
» Any litigation related settlement offers
▪ Review alleged Material Breaches, Collateral Deficiencies and Existing Liens, and issue Notices of Breach or Indemnification to
Freddie Mac
GUARANTOR OVERSIGHT AND SERVICING REMEDY MANAGEMENT PROCESS
▪ Securitization Servicer remits monthly data to Freddie Mac as Guarantor
▪ Guarantor monitors remittance data and may request additional documentation to evaluate Securitization Servicer compliance
▪ If a servicing defect is identified, the Guarantor review will determine if it is the result of a servicing violation, and whether or not
it can be remedied:
» Where the defect can be remedied, the Securitization Servicer will be required to remedy the defect within the
servicing correction period of 90 days
» Where the defect cannot be remedied (e.g., extinguishes the lien, etc.), the Securitization Servicer will be issued a
servicing remedy letter that may include a servicing remedy amount
▪ The servicing remedy amount is an amount determined by the Guarantor and payable by the Securitization Servicer, to
compensate for damages, expenses and losses resulting from the servicing defect
© Freddie Mac 47
9. Freddie Mac Key Contacts

© Freddie Mac 48
Freddie Mac Key Contacts
Team Member Email Address Business Phone
John Glessner
Senior Vice President
Asset Liability Management and Treasurer
[email protected] 571-382-5915
Terin Vivian
Head Loan Portfolio [email protected] 571-382-5835
Sally Baker
Securitization Programs [email protected] 571-382-5667
Mary Ann Thomas
SLST and NPL [email protected] 571-382-5894
Bob Perret
SCRT [email protected] 571-382-1860
Michael Lam
[email protected] 571-382-4465
Jie Bai
Data, Analytics and [email protected] 571-382-4687
Sally Au-Yeung
Data, Analytics and [email protected] 571-382-5896
Lenore Kelly
Legal [email protected] 703-903-3366
Carmino Santomaro
Structured [email protected] 571-382-5701