
Frankenstein, Dracula andN tB fitR id Net Benefit Regression · Frankenstein, Dracula andN tB fitR...
42
Frankenstein, Dracula dNtB fit R i and Net Benefit Regression: What You Need to Know Jeffrey S. Hoch, PhD Research Scientist, St. Michael’s Hospital Associate Professor, University of Toronto Head, Pharmacoeconomics Research Unit, Cancer Care Ontario The Canadian Association for Population Therapeutics: “A Look to the Future: Medication Use, Safety and Effectiveness under Economic Uncertainty” April 19 – 21, 2009 Montreal, Quebec Fairmont The Queen Elizabeth
Transcript of Frankenstein, Dracula andN tB fitR id Net Benefit Regression · Frankenstein, Dracula andN tB fitR...

Frankenstein, Dracula d N t B fit R iand Net Benefit Regression: What You Need to Know
Jeffrey S. Hoch, PhDResearch Scientist, St. Michael’s HospitalAssociate Professor, University of Toronto
Head, Pharmacoeconomics Research Unit, Cancer Care Ontario
The Canadian Association for Population Therapeutics: “A Look to the Future: Medication Use, Safety and Effectiveness under Economic Uncertainty”
April 19 – 21, 2009 Montreal, Quebec Fairmont The Queen Elizabeth

Disclaimers and PerspectivesDisclaimers and Perspectives
Disclaimers PerspectiveDisclaimersMy views represent my views, not views of:
St Mi h l’ H it l
pAcademic
Teaching and researchSt. Michael’s Hospital
The Ministry of HealthCancer Care Ontario
researchHave reviewed for
DQTC, CEDAC, Canadian Cancer SocietyUniversity of Toronto
CED / CCO subcommittee
Occasionally interact ywith Industry
© Jeffrey S. Hoch, PhD
PlanPlan
More research on population therapeuticsMore research on population therapeutics Cost-effectiveness using models and trialsNet benefit regressionNet benefit regression
© Jeffrey S. Hoch, PhD
×More research demanded
×Cost-effectiveness
×Net benefit regression

Three key trendsThree key trends
1) Comparative effectiveness research1) Comparative effectiveness research2) The liberation of administrative data3) Increasing drug prices3) Increasing drug prices
© Jeffrey S. Hoch, PhD
×More research demanded
×Cost-effectiveness
×Net benefit regression

Comparative effectiveness research in CANADA
Comparative effectiveness isp“the evaluation of the relative (clinical) effectiveness, safety, and cost of 2 or more medical services, drugs, devices therapies or procedures used to treat thedevices, therapies, or procedures used to treat the same condition.”
Who uses this Canada?Common Drug Review (CDR) at the Canadian Agency for Drugs and Technologies in Health (CADTH)Committee to Evaluate Drugs (CED & CED/CCO) g ( )
Ontario Ministry of Health and Long Term CareYour hospital’s pharmacy?
© Jeffrey S. Hoch, PhD
×More research demanded
×Cost-effectiveness
×Net benefit regression

Comparative effectiveness research in the USA
In February, the United States CongressIn February, the United States Congress appropriated (via the economic stimulus bill)$1,100,000,000 (1.1 Billion) to $ , , , ( )
DHHS, AHRQ, and NIH for Comparative Effective Research (CER).for Comparative Effective Research (CER).
With $100’s of millions available for CERWith $100 s of millions available for CER, more will be done.
© Jeffrey S. Hoch, PhD
×More research demanded
×Cost-effectiveness
×Net benefit regression

The potential impactThe potential impact
? More interest in CER?? More interest in CER?? Policy makers / decision makers? Researchers? Researchers? Journals / journalists
? Will you feel an elephant turn over in bed?
© Jeffrey S. Hoch, PhD
×More research demanded
×Cost-effectiveness
×Net benefit regression

The liberation of administrative dataThe liberation of administrative data
In ONTARIO,In ONTARIO,ICES to create more satellite sitesSpecial focus on liberating cancer dataSpecial focus on liberating cancer data
Direct effect (from this action)More access to dataMore access to data
Indirect effect (as others respond)More access to dataMore access to dataMore info about access to data
© Jeffrey S. Hoch, PhD
×More research demanded
×Cost-effectiveness
×Net benefit regression

Increasing drug prices: Bach (2009)Increasing drug prices: Bach (2009)
© Jeffrey S. Hoch, PhD

“Health economists are concerned… because the prices of cancer drugs appear to be rising faster than the health benefits cancer drugs appear to be rising faster than the health benefits associated with them… the increase in the cost of treatment exceeded the magnitude of improvement in efficacy… making each treatment advance less cost-effective than the one that preceded it.”
© Jeffrey S. Hoch, PhD

© Jeffrey S. Hoch, PhD

© Jeffrey S. Hoch, PhD

Meaning and implicationMeaning and implication
There are compelling reasons to believe thatThere are compelling reasons to believe that there will be a growing need for research on what we are getting for what we are paying.
Cost effectiveness analysis (CEA) provides y ( ) pthis information.
Net benefit regression is a way to do CEA.
© Jeffrey S. Hoch, PhD
×More research demanded
×Cost-effectiveness
×Net benefit regression

NNT turns 20!NNT turns 20!
© Jeffrey S. Hoch, PhD
×More research demanded
×Cost-effectiveness
×Net benefit regression

NNT and cost-effectiveness
Extra Cost ofNew Treatment NENW New Treatment NENW
$80,000
$60,000$ ,
$20,000
Number neededto treat10 50 100
© Jeffrey S. Hoch, PhDNew treatmentless costlySW SE
×More research demanded
×Cost-effectiveness
×Net benefit regression
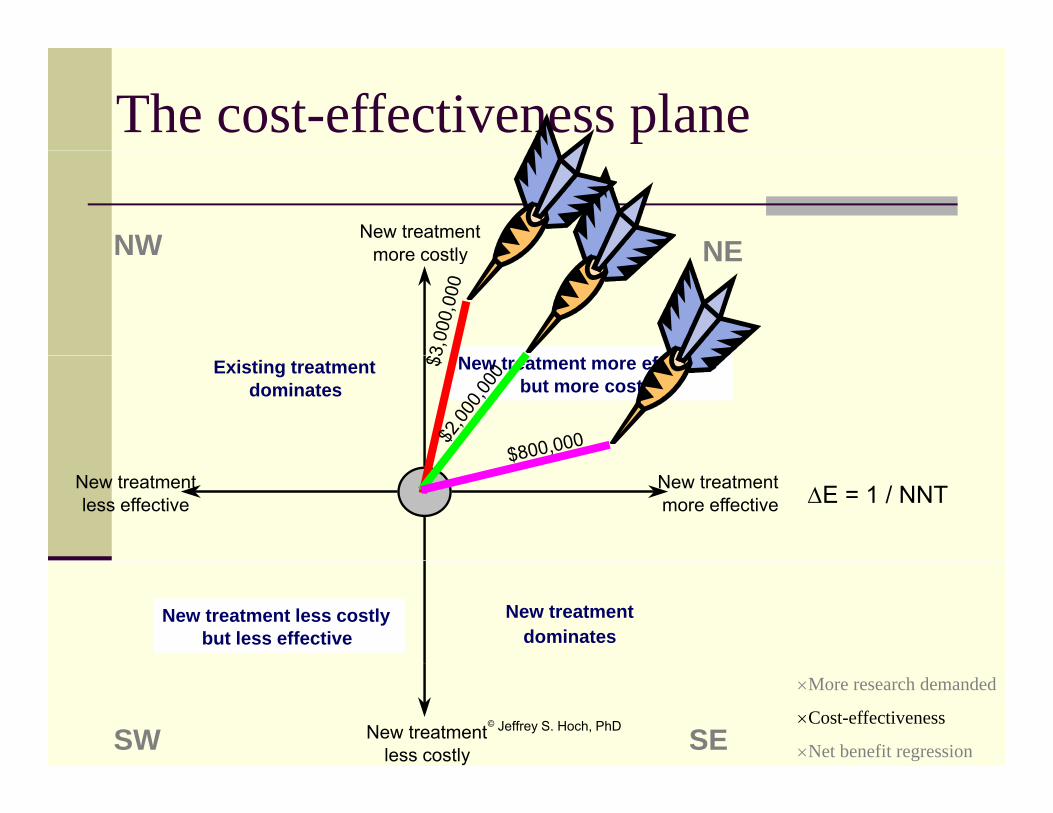
The cost-effectiveness plane
New treatmentmore costly NENW more costly NENW
Existing treatmentdominates
New treatment more effectivebut more costly
New treatmentmore effective
New treatmentless effective ∆E = 1 / NNT
New treatment dominates
New treatment less costlybut less effective
© Jeffrey S. Hoch, PhDNew treatmentless costlySW SE
×More research demanded
×Cost-effectiveness
×Net benefit regression

Cost-effectiveness analysis (CEA)Cost effectiveness analysis (CEA)
The goal of CEA is to compare the costs and effects g pof one treatment to a relevant alternative. CEA computes an incremental cost-effectiveness
ti (ICER)ratio (ICER).Researchers compute the ICER using data from
Individuals based on their reported costs and effectsIndividuals, based on their reported costs and effectsorVarious sources, cobbling together a prediction model
EC
EECCR CT
∆∆
=−
=ˆ
© Jeffrey S. Hoch, PhD
EEE CT ∆− ×More research demanded
×Cost-effectiveness
×Net benefit regression

Decision modeling: piecing together FrankensteinFrankensteinDecision model = No autologous
transfusion
From Coyle et al.
Frankenstein’s monsterAdmin data, literature
PAD
No non fatal HR
Non fatal HRNo allo.transfusion
No fatal HR
transfusion
Fatal HRA
N HIV
HIVHepB
HepFebrilei
AutologoustransfusionOrthopedic
C
No HIV
HIV
Both are scary! Non fatalHR No HIV
HIVNo HIVC
NoHepAsCl C
No febrilereaction
reaction
No fatal HR
OrthopedicSurgeryPatients B
Clone CAsClone B
reactionNo nonfatal HR
Allo.transfusion
EPO to augment PAD
As Clone A
Fatal HR
© Jeffrey S. Hoch, PhD
×More research demanded
×Cost-effectiveness
×Net benefit regression

Trial based CEA: Dracula!!!Trial based CEA: Dracula!!!
Based on trial data, Trial based CEA = ,CTX and CUC
ETX and EUC
Vampirei.e., the analysis feeds off the clinicalfeeds off the clinical trial data
© Jeffrey S. Hoch, PhD
×More research demanded
×Cost-effectiveness
×Net benefit regression

O’Brien’s nightmareO Brien s nightmare
Decision model = Trial based CEA = Frankenstein’s monster
Admin data, literature
VampireE.g., clinical trial dataliterature data
Both are scary!
© Jeffrey S. Hoch, PhD
×More research demanded
×Cost-effectiveness
×Net benefit regression

RCT data may not be suitable:
Clinical practice
CEA is done a lot
Clinical practice ≠ experimental conditions
The analyses are required!
Good data
© Jeffrey S. Hoch, PhD
are needed

Challenges with RCT data and modelsChallenges with RCT data and models
Choice of comparisonChoice of comparisonOutcome
Right one?Right one?Intermediate vs. final
Follow up lengthFollow up lengthNot real treatment Wrong treatment patternsWrong treatment patternsWrong patients or MDs
© Jeffrey S. Hoch, PhD
×More research demanded
×Cost-effectiveness
×Net benefit regression
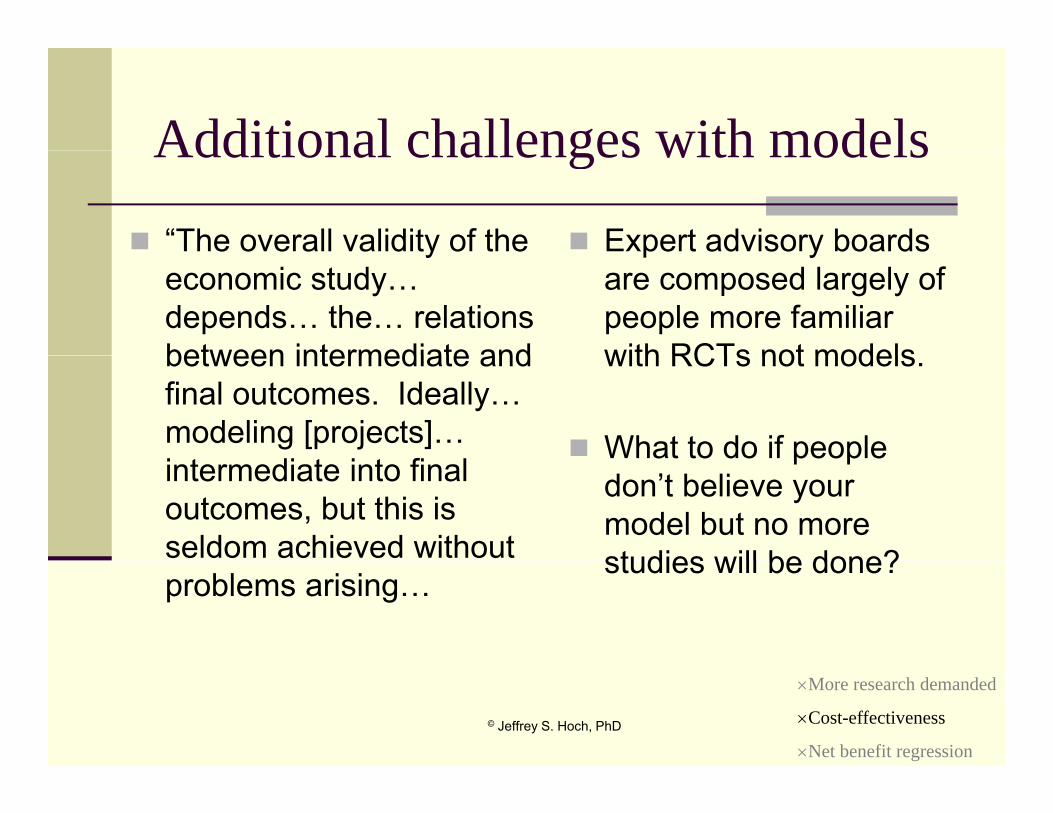
Additional challenges with modelsAdditional challenges with models
“The overall validity of the Expert advisory boards yeconomic study… depends… the… relations between intermediate and
p yare composed largely of people more familiar with RCTs not modelsbetween intermediate and
final outcomes. Ideally… modeling [projects]…
f
with RCTs not models.
What to do if peopleintermediate into final outcomes, but this is seldom achieved without
What to do if people don’t believe your model but no more studies will be done?
problems arising…studies will be done?
© Jeffrey S. Hoch, PhD
×More research demanded
×Cost-effectiveness
×Net benefit regression

Challenges contChallenges, cont.
“For example, in an early cost-effectivenessFor example, in an early cost effectiveness model of tissue plasminogen activator versus streptokinase in acute MI, mortality predictions… [were used]; subsequent trials with mortality as the measured outcome have i ld d ti ti t f thyielded more conservative estimates of the
mortality benefits of [the] drug”
© Jeffrey S. Hoch, PhD
×More research demanded
×Cost-effectiveness
×Net benefit regression

ProblemProblem
How to get real data for the right question?g g q
A modest proposal: Post-marketing monitoring to determine whether the estimated cost-effectiveness matches the real cost-effectiveness
HOW?Formal Phase IV trialsCoverage with evidence developmentInformal analysis of administrative data
© Jeffrey S. Hoch, PhD
Informal analysis of administrative data×More research demanded
×Cost-effectiveness
×Net benefit regression

Analytical challengesAnalytical challenges
How to analyze non-randomized, non-How to analyze non randomized, noncontrolled person-level cost and outcome data?
What if cost-effectiveness varies by patient y psubgroup?How do you make a 95% CI for a ratio with no known distribution? What if it is negative?How to tell if the model fits the data well?H t th i t l ?How to use other regression tools?Is the extra cost per extra effect a good deal?
© Jeffrey S. Hoch, PhD
×More research demanded
×Cost-effectiveness
×Net benefit regression

CEA w/ incremental net benefit (INB)CEA w/ incremental net benefit (INB)
CEA:CEA: Is the extra benefit > than the extra cost?
Is ∆E ⋅ $ > ∆C ?Is ∆E ⋅ $ - ∆C > 0 ?
Is INB > 0 ?
Why not estimate INB with regression?
© Jeffrey S. Hoch, PhD
×More research demanded
×Cost-effectiveness
×Net benefit regression

CEA w/ 1 regressionregression
ei ⋅ $ - ci ≡ NBi
NBi = β0 + βTXTX
β = ∆E $ ∆CβTX = ∆E ⋅ $ – ∆CβTX = INBIf βTX > 0If βTX 0
TX is CE
© Jeffrey S. Hoch, PhD
×More research demanded
×Cost-effectiveness
×Net benefit regression

Net benefit regression: Regression based CEA
Simple AnalysisSimple AnalysisNB = β0 + β1 TX + ν
More precise estimates of β1More precise estimates of β1NB = β0 + β1 TX + β2 X + ν
Cost-effectiveness varies by sub-group?
β1 = the INB. I.e., λ∆E - ∆C
Cost effectiveness varies by sub group? NB = β0 + β1 TX + β2 X + β3 X·TX + ν
© Jeffrey S. Hoch, PhD
×More research demanded
×Cost-effectiveness
×Net benefit regression

Example 1: Handling selection bias with net benefit regression
STEP 1: Run a regression to obtain a propensity score (PS)
“Because the… study did not directly d i ti t t l id la propensity score (PS)
STEP 2: Use NBR & PS
E.g., NBi = β0 + βTXTX + βPSPS + ε
randomize patients to clopidogrel versus placebo, there is the possibility of selection bias… The analysis of the clinical results…
dj t d f thi ibilit th hNBi β0 + βTXTX + βPSPS + ε
Mahoney EM et al., “Long-term cost-effectiveness of early and
adjusted for this possibility through the use of a propensity score covariate obtained from a logistic regression analysis. A similar
it dj t d ty
sustained clopidogrel therapy for up to 1 year in patients undergoing percutaneous coronary intervention after presenting with acute coronary syndromes without ST-segment
propensity score–adjusted cost-effectiveness analysis was carried out in the current study using a net benefit regression model”y g
elevation.” Am Heart J. 2006.
© Jeffrey S. Hoch, PhD
×More research demanded
×Cost-effectiveness
×Net benefit regression
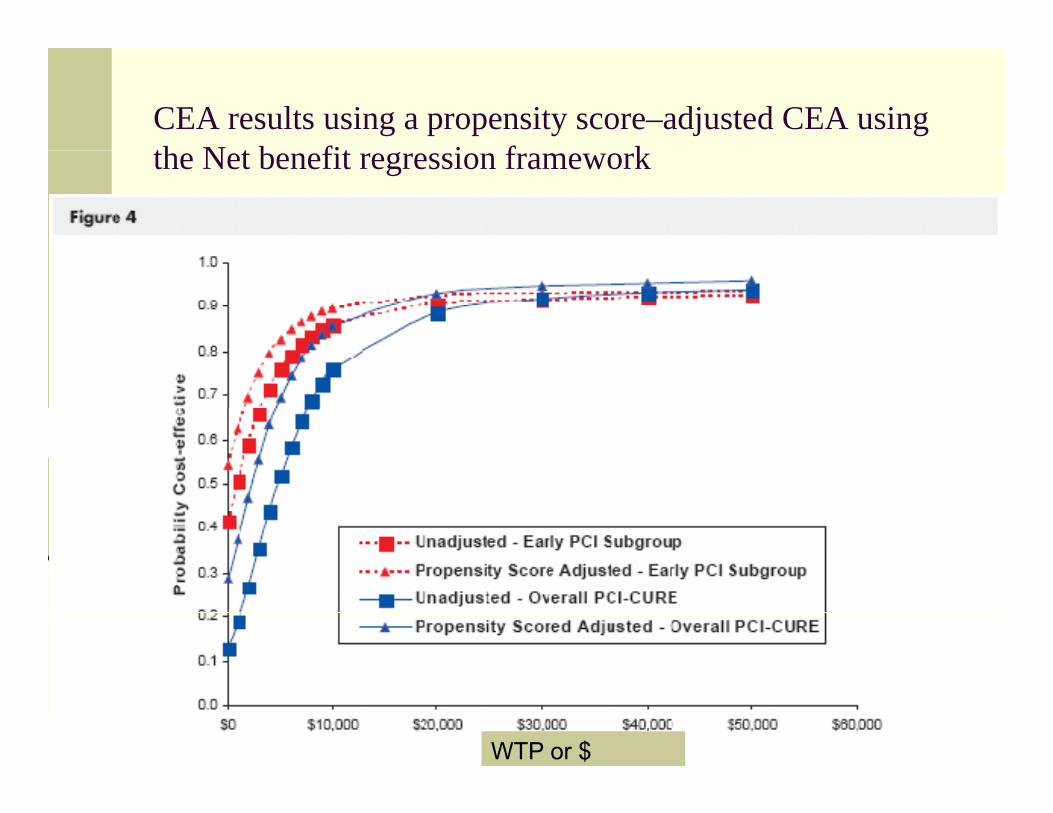
CEA results using a propensity score–adjusted CEA using th N t b fit i f kthe Net benefit regression framework
© Jeffrey S. Hoch, PhD
WTP or $

Example 2: Adjusting for X can affect CEAdjusting for X can affect CE
© Jeffrey S. Hoch, PhD
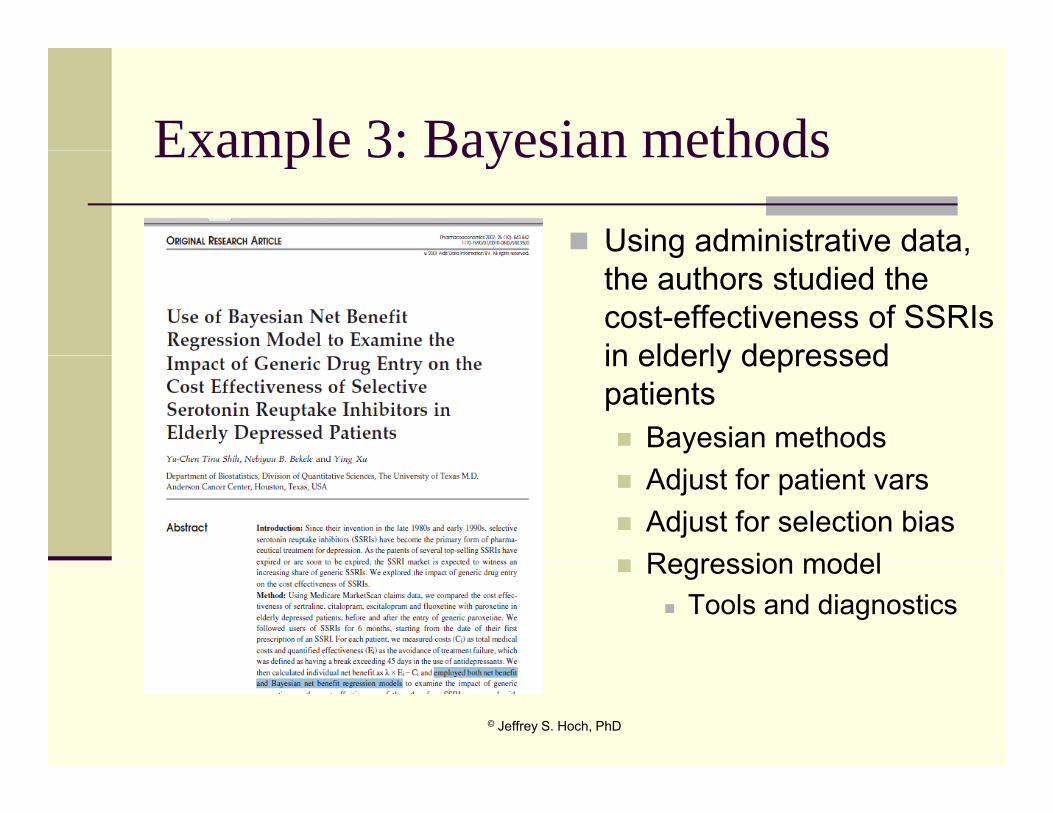
Example 3: Bayesian methodsExample 3: Bayesian methods
Using administrative data, g ,the authors studied the cost-effectiveness of SSRIs in elderly depressedin elderly depressed patients
Bayesian methodsAdjust for patient varsAdjust for selection biasRegression modelRegression model
Tools and diagnostics
© Jeffrey S. Hoch, PhD

Results from Shih et al. (2007)
© Jeffrey S. Hoch, PhD

SummarySummary
Analysis of what we are getting for what weAnalysis of what we are getting for what we are paying will become more popular.Administrative databases offer a good source gof “real world” data.Net benefit regression can be used to ganalyze these data
© Jeffrey S. Hoch, PhD
ImplicationsImplications
Researchers have a role to play in helpingResearchers have a role to play in helping decision makers both make and re-evaluate their decisions. Judgment and opinion must be supplemented with evidence from the “real world”.Economics and Statistics should constitute a part of the decision making cycle.
© Jeffrey S. Hoch, PhD

Extra slides

© Jeffrey S. Hoch, PhD

© Jeffrey S. Hoch, PhD

© Jeffrey S. Hoch, PhD

The confidence intervals challengeThe confidence intervals challenge
Different methods gi eDifferent methods give different intervalsAll have challengesgKey issues include:
ICERs < 0No transitivity
ICERs with the same numerical value but u e ca a ue budifferent meanings
© Jeffrey S. Hoch, PhD
Why is CEA done?Why is CEA done?
CEA is done to help decision makersCEA is done to help decision makers understand the rate at which they must spend to get an additional patient outcome:
Cancer Drug A vs. Cancer Drug B: $160,000 for an additional year of life vs.Exercise and CBT vs Depression Drug Z:Exercise and CBT vs. Depression Drug Z: $25,000 for an additional year of life
Do the advantages of the new medication /Do the advantages of the new medication / test / procedure justify the higher price?
© Jeffrey S. Hoch, PhD