Francesca Rizzo Metodi di valutazione dellusabilità Di Francesca Rizzo.
Politicamente Scorretto 2013
Casalecchio di Reno, 24 Novembre 2013
Francesca Recanatini Senior Economist, Banca Mondiale
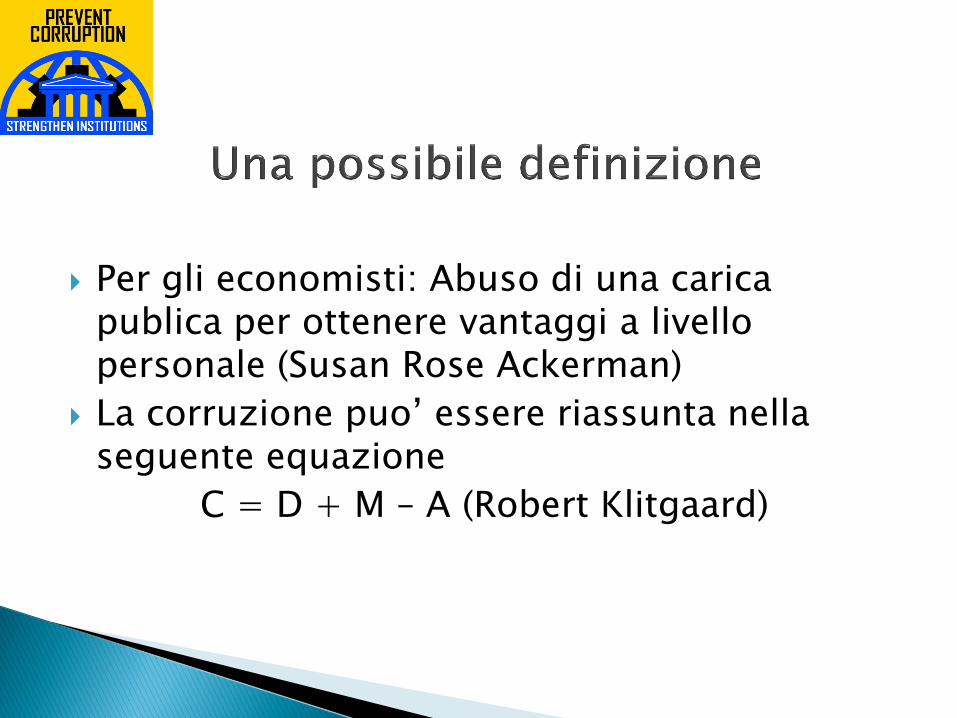
Per gli economisti: Abuso di una carica publica per ottenere vantaggi a livello personale (Susan Rose Ackerman)
La corruzione puo’ essere riassunta nella seguente equazione
C = D + M – A (Robert Klitgaard)
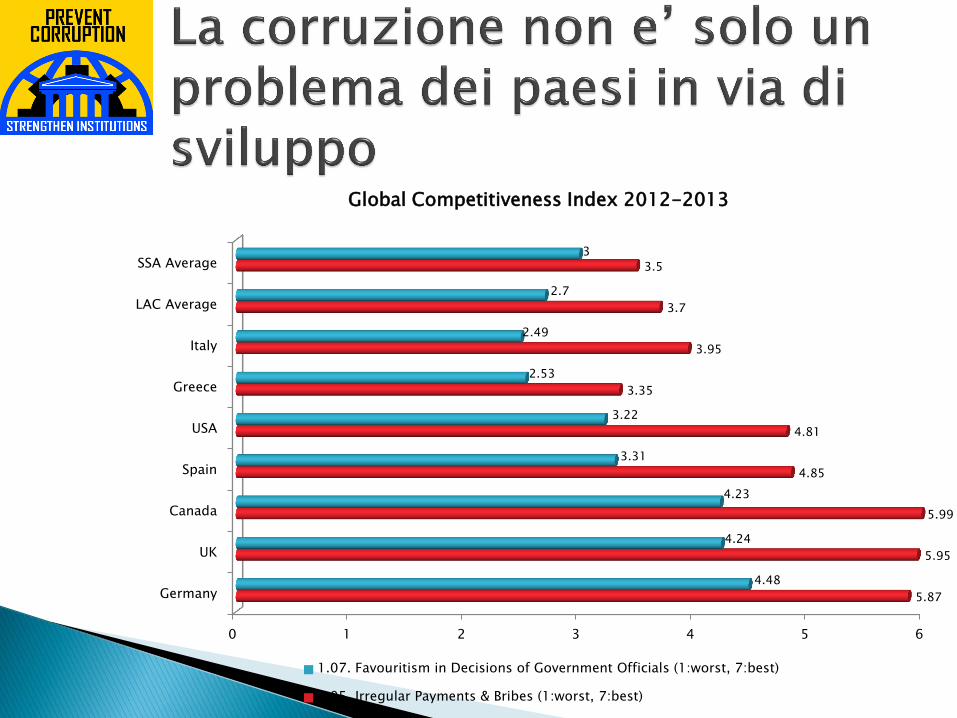
0 1 2 3 4 5 6
Germany
UK
Canada
Spain
USA
Greece
Italy
LAC Average
SSA Average
5.87
5.95
5.99
4.85
4.81
3.35
3.95
3.7
3.5
4.48
4.24
4.23
3.31
3.22
2.53
2.49
2.7
3
Global Competitiveness Index 2012-2013
1.07. Favouritism in Decisions of Government Officials (1:worst, 7:best)
1.05. Irregular Payments & Bribes (1:worst, 7:best)
La corruzione ha un costo reale e significativo: ◦ per il paese (in termini di PIL, crescita e benessere
dei cittadini),
◦ per i cittadini (in termini di qualita’ e accesso ai servizi pubblici, e di reddito),
◦ per le imprese (in termini di concorrenza e di profitto)
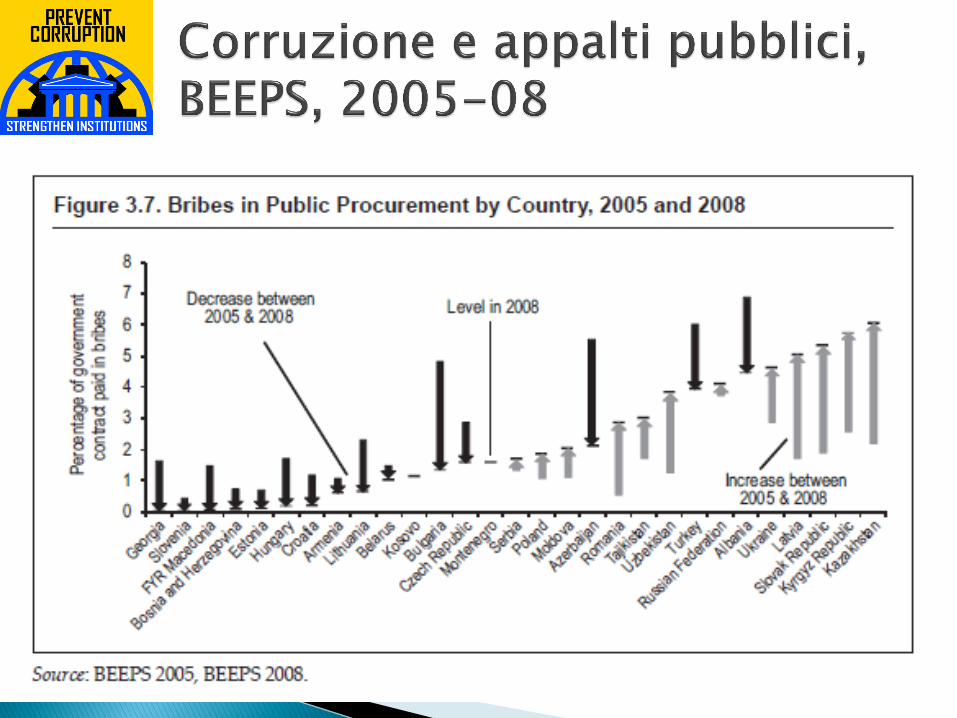
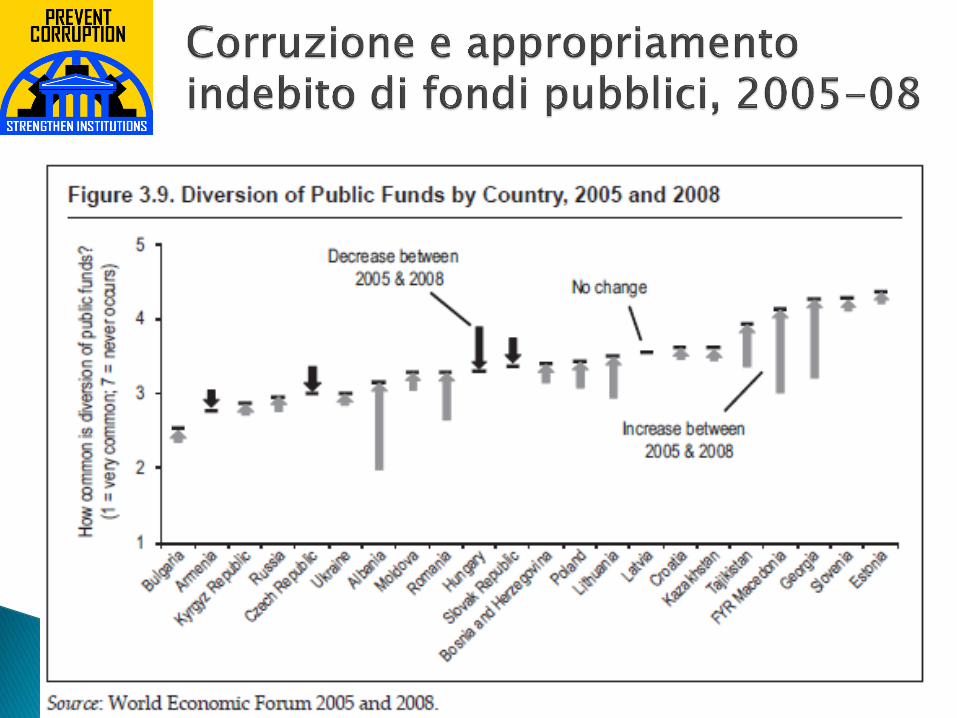
Alcuni esempi che utilizzano approcci diversi per misurare la corruzione
0%
10%
20%
Low Medium High
Income
% d
isco
ura
ged
use
rs
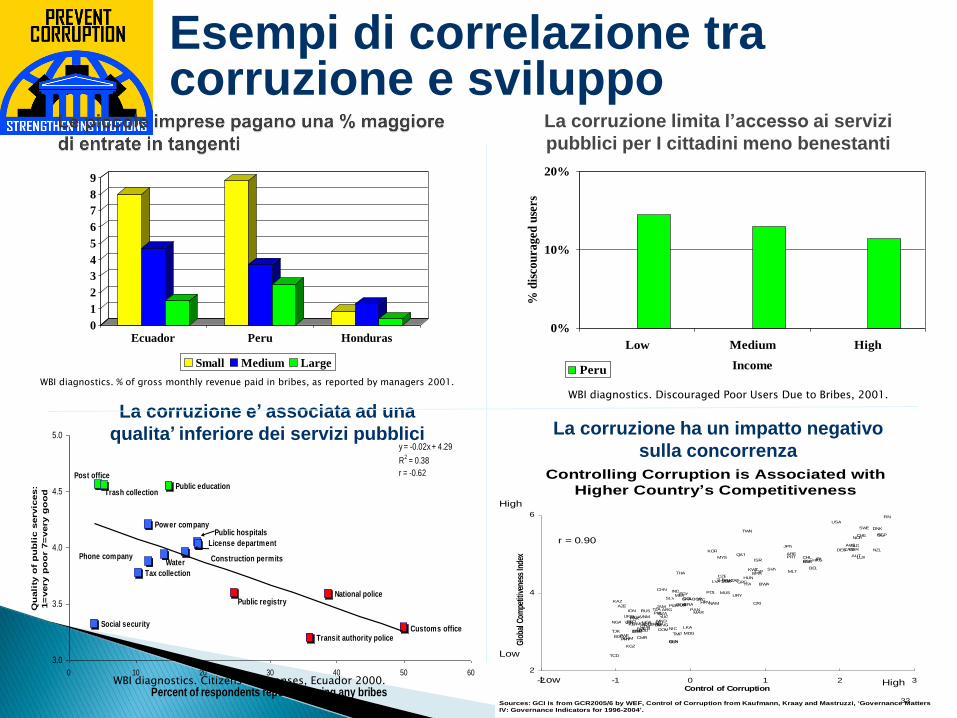
PeruWBI diagnostics. % of gross monthly revenue paid in bribes, as reported by managers 2001.
0
1
2
3
4
5
6
7
8
9
Ecuador Peru Honduras
Small Medium Large
La corruzione limita l’accesso ai servizi
pubblici per I cittadini meno benestanti
WBI diagnostics. Discouraged Poor Users Due to Bribes, 2001.
Esempi di correlazione tra corruzione e sviluppo
La corruzione e’ associata ad una
qualita’ inferiore dei servizi pubblici
Social security
Transit authority policeCustoms office
National policePublic registry
Trash collection
Post office
Public education
Power company
Tax collection
Phone company
License department
Public hospitals
Construction permitsWater
y = -0.02x + 4.29
R2 = 0.38
r = -0.62
3.0
3.5
4.0
4.5
5.0
0 10 20 30 40 50 60
Percent of respondents reported paying any bribes
Qu
ali
ty o
f p
ub
lic s
ervic
es:
1=
very p
oo
r 7
=very g
oo
d
WBI diagnostics. Citizens’ Responses, Ecuador 2000.
La corruzione ha un impatto negativo
sulla concorrenza
32
Controlling Corruption is Associated with
Higher Country’s Competitiveness
ZWE
VNM
VEN
URY
USA
GBRARE
UKR
UGA
TUR
TUN
TTO
THA
TZA
TJK
TWNCHE
SWE
LKA
ESP
ZAF
SVN
SVK
SGP
YUG
RUS
ROM
QATPRT
POL
PHL
PER
PRY
PAN
PAK
NOR
NGA
NIC
NZLNLD
NAM
MOZ
MAR
MNG
MDA
MEXMUS
MLT
MLI
MYS
MWIMDG
MKD
LUX
LTULVA
KGZ
KWT
KOR
KEN
KAZ
JOR
JPN
JAM
ITA
ISR IRL
IDN
IND
ISL
HUN
HKG
HND
GUY
GTM
GRC
GHA
DEU
GEOGMB
FRA
FIN
ETH
SLVEGY
ECUTMP
DOM
DNK
CZE
CYP
HRV CRI
COL
CHN
CHL
TCD
CAN
CMRKHM
BGR
BRA
BWA
BIHBOL
BEN
BEL
BGD
BHR
AZE
AUT
AUS
ARGDZA
ALB
2
4
6
-2 -1 0 1 2 3Control of Corruption
Glo
bal C
ompe
titiv
enes
s In
dex
Low
Low High
High
r = 0.90
Sources: GCI is from GCR2005/6 by WEF, Control of Corruption from Kaufmann, Kraay and Mastruzzi, ‘Governance Matters
IV: Governance Indicators for 1996-2004’.
BGDIND
LKA
NPL
PAK
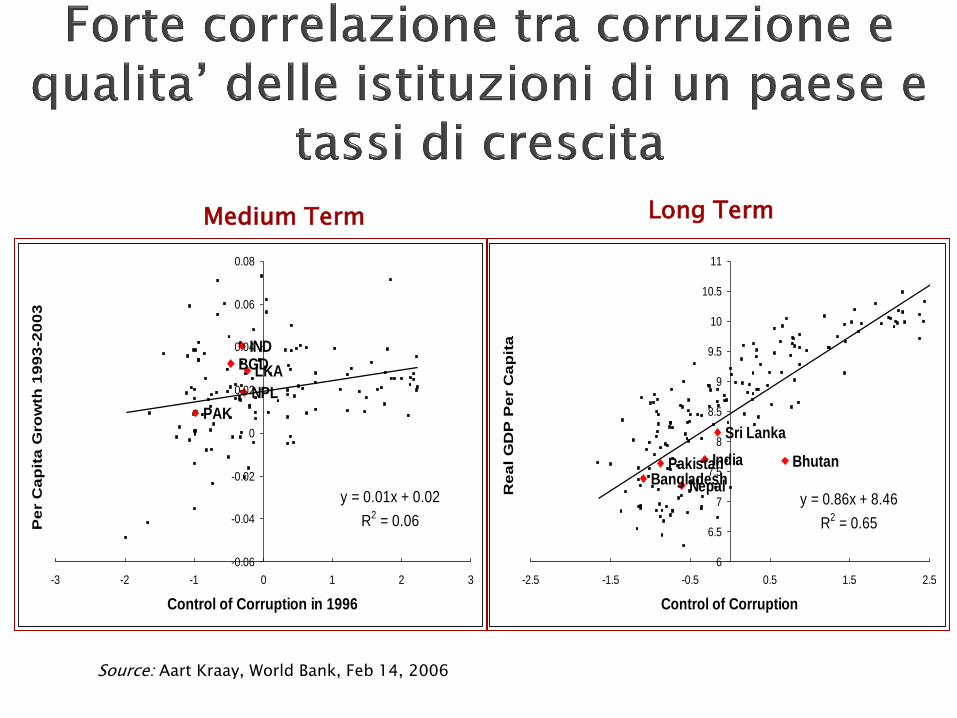
y = 0.01x + 0.02
R2 = 0.06
-0.06
-0.04
-0.02
0
0.02
0.04
0.06
0.08
-3 -2 -1 0 1 2 3
Control of Corruption in 1996
Pe
r C
ap
ita
Gro
wth
19
93
-20
03
Pakistan
Nepal
Sri Lanka
India BhutanBangladesh
y = 0.86x + 8.46
R2 = 0.65
6
6.5
7
7.5
8
8.5
9
9.5
10
10.5
11
-2.5 -1.5 -0.5 0.5 1.5 2.5
Control of Corruption
Re
al
GD
P P
er
Ca
pit
a
Source: Aart Kraay, World Bank, Feb 14, 2006
Medium Term Long Term
AGOMLI ZMB
ETHTCDPAKUGA
NGACMR
ZWEHTI SENZAFBGD
GHA
EGYIDNGTM PERDOM
DZABRAPHL CHN
TUN
JAMPAN VENMUS
RUSURYLVA
CRI
CHLESTKOR
HRV
USA
GBRITA CAN NLDSVN FRA DNK
FINNOR
ISL
2.0 4.5 7.0
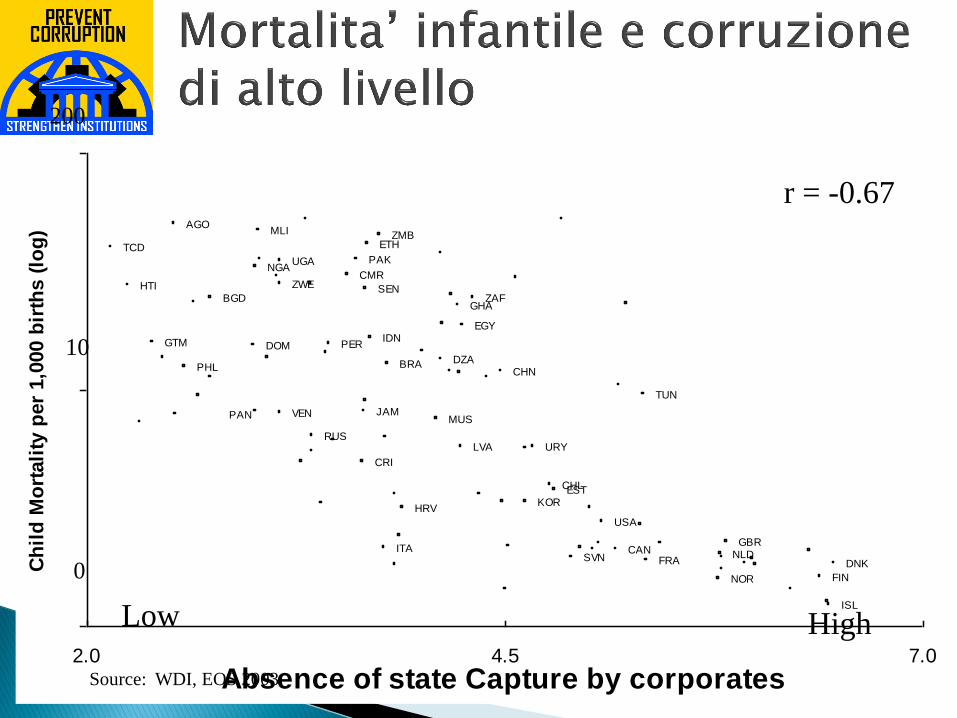
Absence of state Capture by corporates
Ch
ild
Mo
rtali
ty p
er
1,0
00 b
irth
s (
log
)
Source: WDI, EOS 2003
Low High
r = -0.67
0
10
200
ZWE
ZMB
ZAR
ZAF
YEM
VUT
VNMVENVCT
UZB
USA
URYUKR
UGATZA
TUR
TUNTTO TON
TMP
TKM
TJK
THA
TGO
TCD
SYRSYC
SWZ
SWESVNSVK
SUR
STP
SLV
SLB
SGP
SEN
SDN
SAUSAM
RWA
RUS ROM QATPRY
PRT
PRK
POL
PNG
PHLPER
PAN
PAK
OMN
NZL
NPL
NORNLD
NIC
NGA
NER
NAM
MYS
MWI
MUS
MRT
MOZ
MNG
MMR
MLT
MLI
MKD
MHL
MEX
MDV
MDG
MDA
MAR
LVA
LUXLTU
LSO
LKA
LIE
LCA
LBY
LBR
LBN
LAO
KWT
KOR
KIR
KHM
KGZ
KEN
KAZ
JPN
JOR
JAM
ITA ISRISL
IRN
IRL
IND
IDN
HUN
HTI
HRV
HND
GUY
GTM
GRD
GRC
GNQGNB
GMB
GIN
GHA
GEO
GBR
GAB
FSM
FRA
FJI
FIN
ETH
ESTESP
ERI
EGYECU
DZA
DOM
DNK
DMA
DJI
DEUCZE CYPCUB
CRI
CPV
COM
COL
CMR
CIV
CHN
CHLCHECAN
CAF
BWA
BTN
BRB
BRA
BOL
BLZ
BLRBIH
BHSBHRBGR
BGD
BFA
BEN
BEL
BDI
AZE
AUTAUS
ATG
ARM
ARGALB
AGO
ADO
0
40
80
120
160
-2.5 -1.5 -0.5 0.5 1.5 2.5
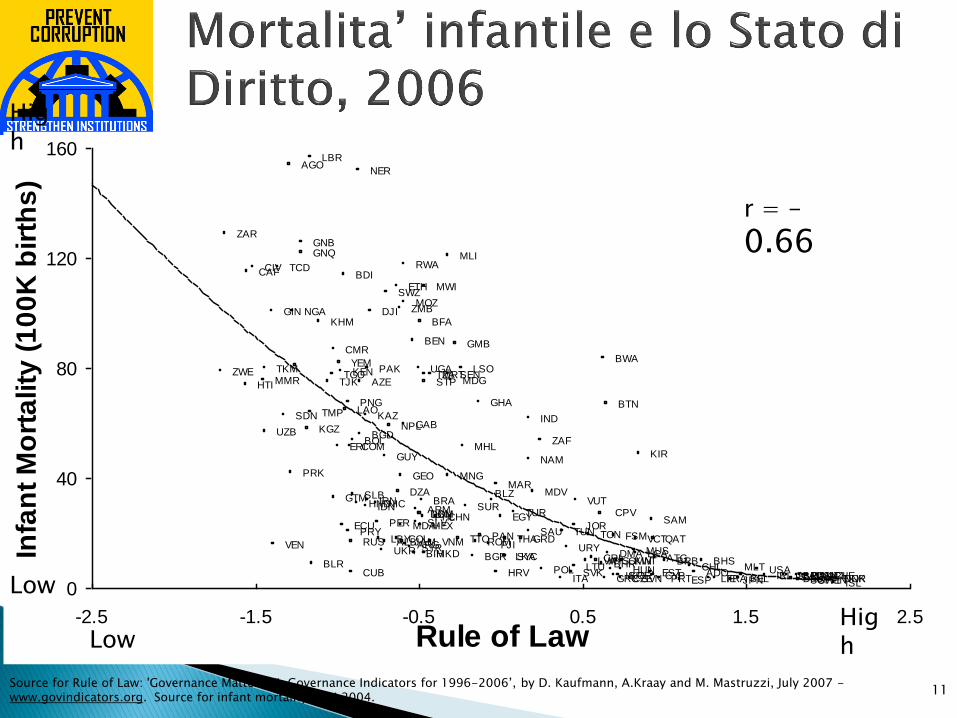
Rule of Law
Infa
nt
Mo
rta
lity
(1
00
K b
irth
s)
11
Low
Low High
High
r = -
0.66
Source for Rule of Law: 'Governance Matters VI: Governance Indicators for 1996-2006’, by D. Kaufmann, A.Kraay and M. Mastruzzi, July 2007 - www.govindicators.org. Source for infant mortality, WDI 2004.
DZA
AGO
BGDBRACMR
CAN
TCD
CHL
CHN
CRI HRV
DNK
DOM
EGY
EST
ETH
FIN
FRA
GHA
GTMHTI
ISL
IDN
ITA
JAM
KOR
LVA
MLI
MUS
NLD
NGA
NOR
PAK
PAN
PERPHL
RUS
SEN
SVN
ZAF
TUN
UGA
GBR
USA
URY
VEN
ZMB
ZWE
1
4
7
2.0 4.5 7.0
Eq
uali
ty o
f H
ealt
h A
ccess
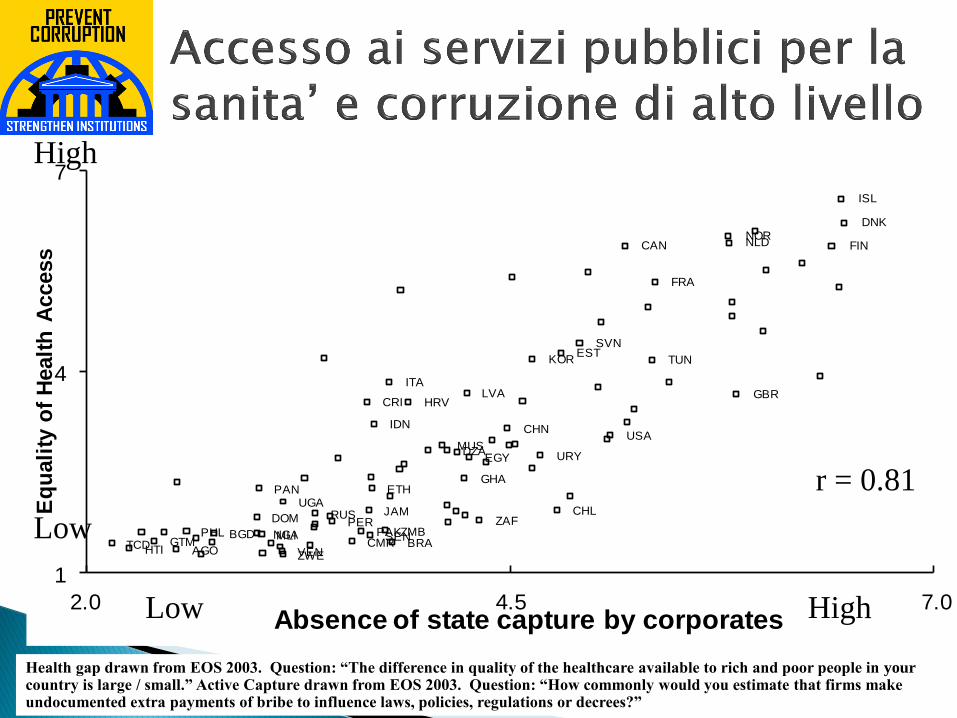
Absence of state capture by corporates
Health gap drawn from EOS 2003. Question: “The difference in quality of the healthcare available to rich and poor people in your country is large / small.” Active Capture drawn from EOS 2003. Question: “How commonly would you estimate that firms make undocumented extra payments of bribe to influence laws, policies, regulations or decrees?”
Low
Low
High
High
r = 0.81
0.0
2.0
4.0
6.0
8.0
10.0
12.0
14.0
Ecuador Peru Honduras Paraguay Guinea Sierra
Leone
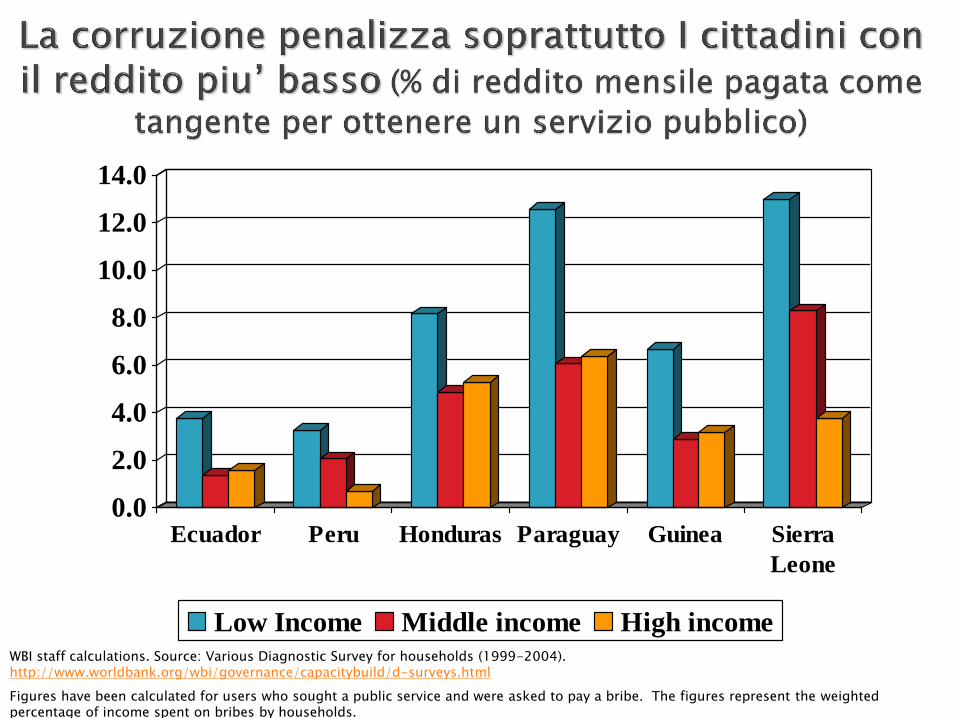
Low Income Middle income High incomeWBI staff calculations. Source: Various Diagnostic Survey for households (1999-2004). http://www.worldbank.org/wbi/governance/capacitybuild/d-surveys.html
Figures have been calculated for users who sought a public service and were asked to pay a bribe. The figures represent the weighted percentage of income spent on bribes by households.
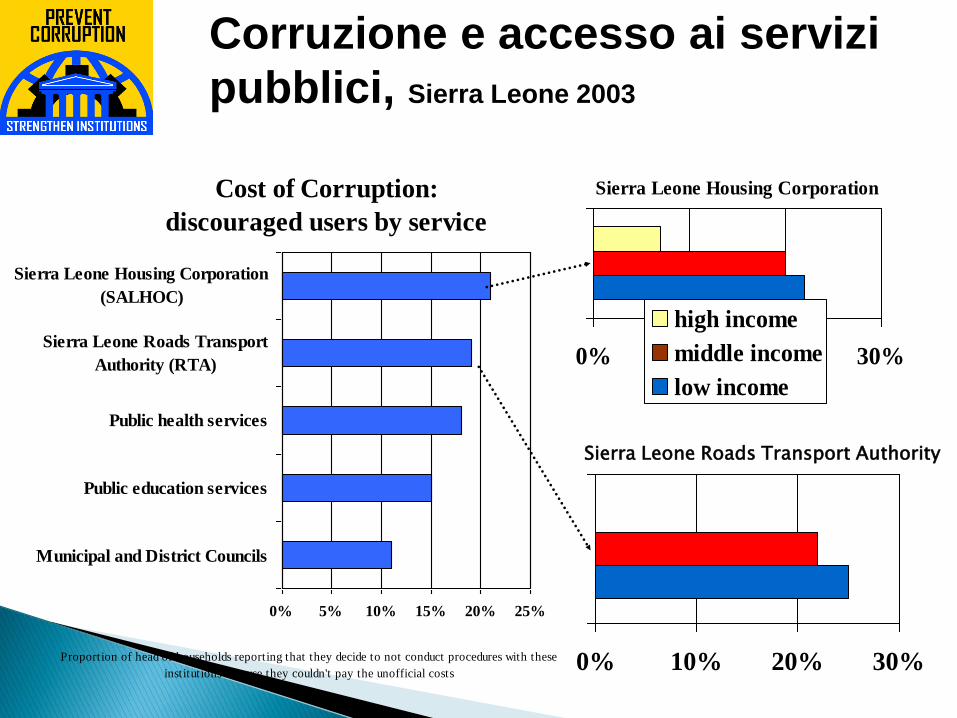
Corruzione e accesso ai servizi
pubblici, Sierra Leone 2003
Cost of Corruption:
discouraged users by service
0% 5% 10% 15% 20% 25%
Municipal and District Councils
Public education services
Public health services
Sierra Leone Roads Transport
Authority (RTA)
Sierra Leone Housing Corporation
(SALHOC)
Proportion of head of households reporting that they decide to not conduct procedures with these
institutions because they couldn't pay the unofficial costs
Sierra Leone Housing Corporation
0% 10% 20% 30%
high income
middle income
low income
0% 10% 20% 30%
Sierra Leone Roads Transport Authority
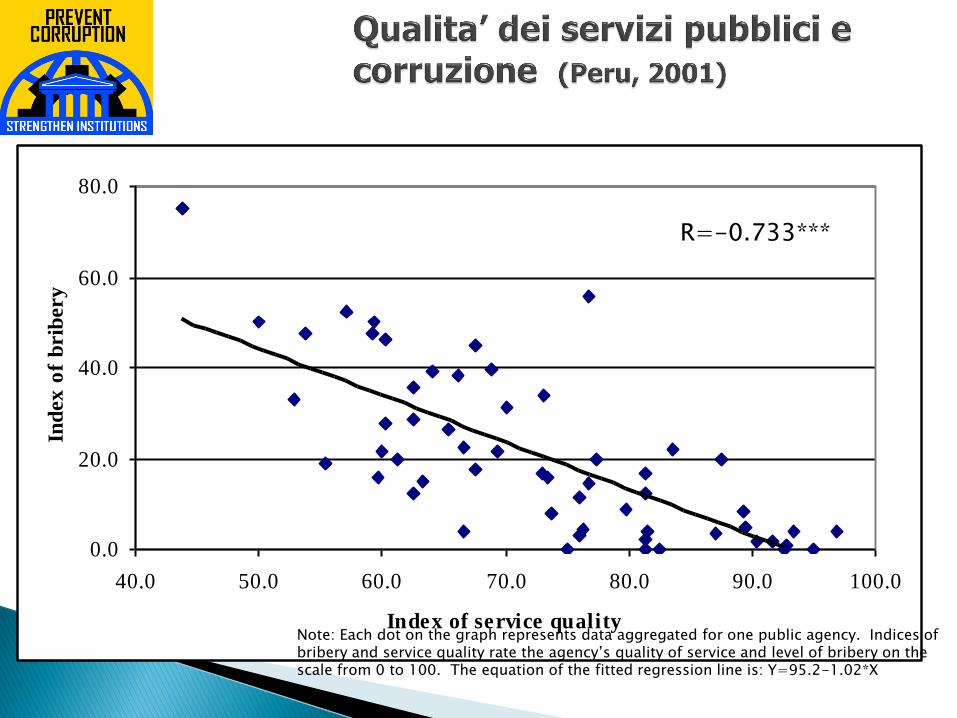
0.0
20.0
40.0
60.0
80.0
40.0 50.0 60.0 70.0 80.0 90.0 100.0
Index of service quality
Ind
ex
of
brib
ery
R=-0.733***
Note: Each dot on the graph represents data aggregated for one public agency. Indices of bribery and service quality rate the agency’s quality of service and level of bribery on the scale from 0 to 100. The equation of the fitted regression line is: Y=95.2-1.02*X
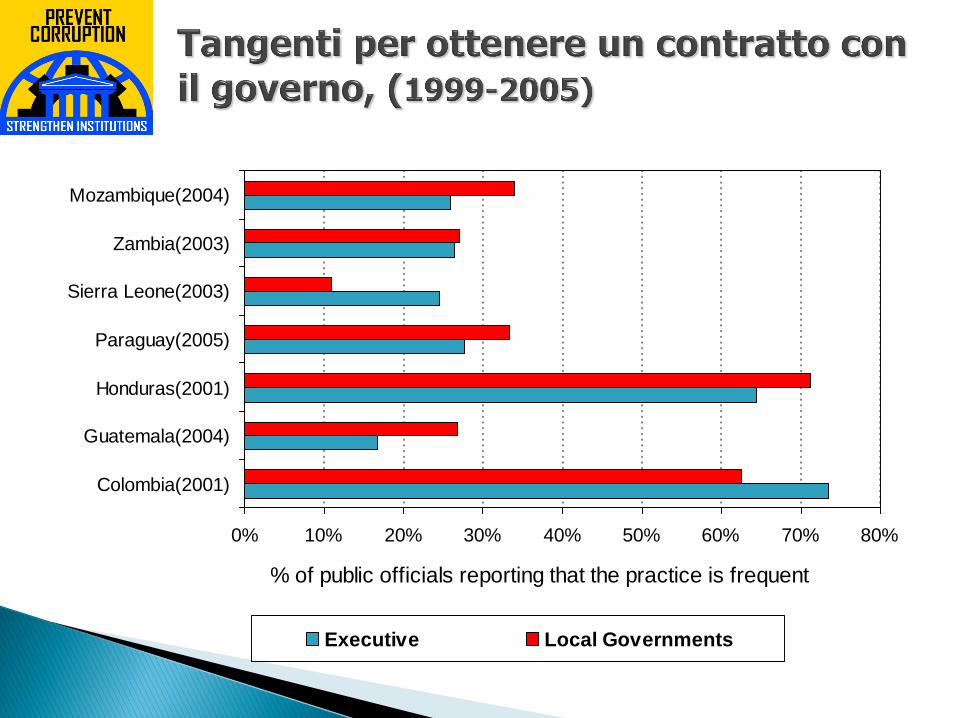
0% 10% 20% 30% 40% 50% 60% 70% 80%
Colombia(2001)
Guatemala(2004)
Honduras(2001)
Paraguay(2005)
Sierra Leone(2003)
Zambia(2003)
Mozambique(2004)
% of public officials reporting that the practice is frequent
Executive Local Governments
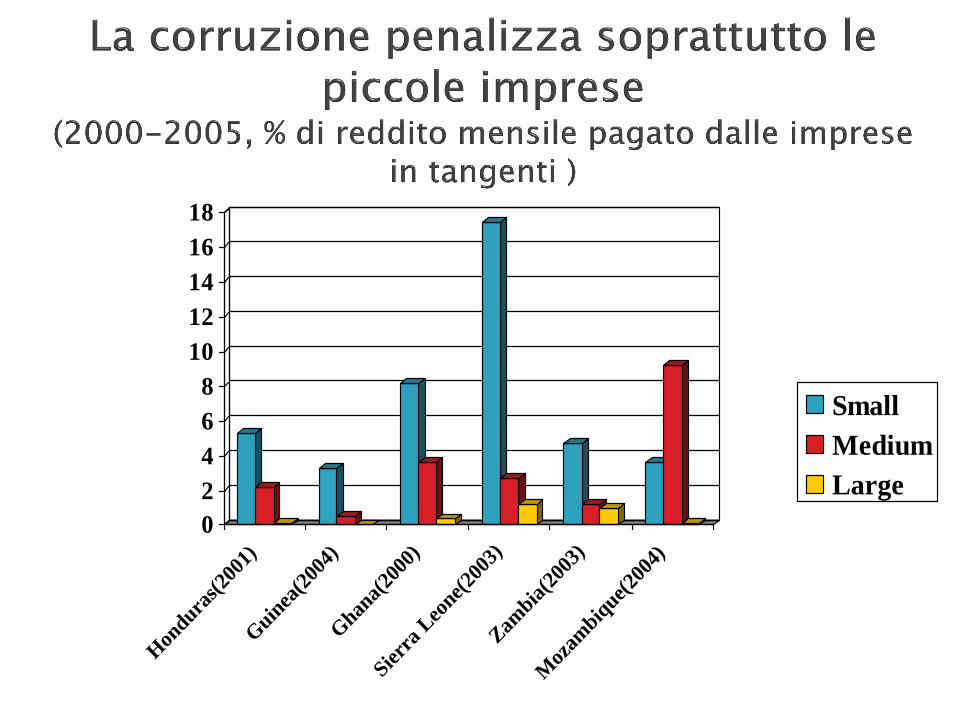
0
2
4
6
8
10
12
14
16
18
Hon
duras(
2001
)
Guin
ea(2
004)
Ghan
a(20
00)
Sierr
a Leo
ne(20
03)
Zam
bia(2
003)
Moz
ambiq
ue(20
04)
Small
Medium
Large
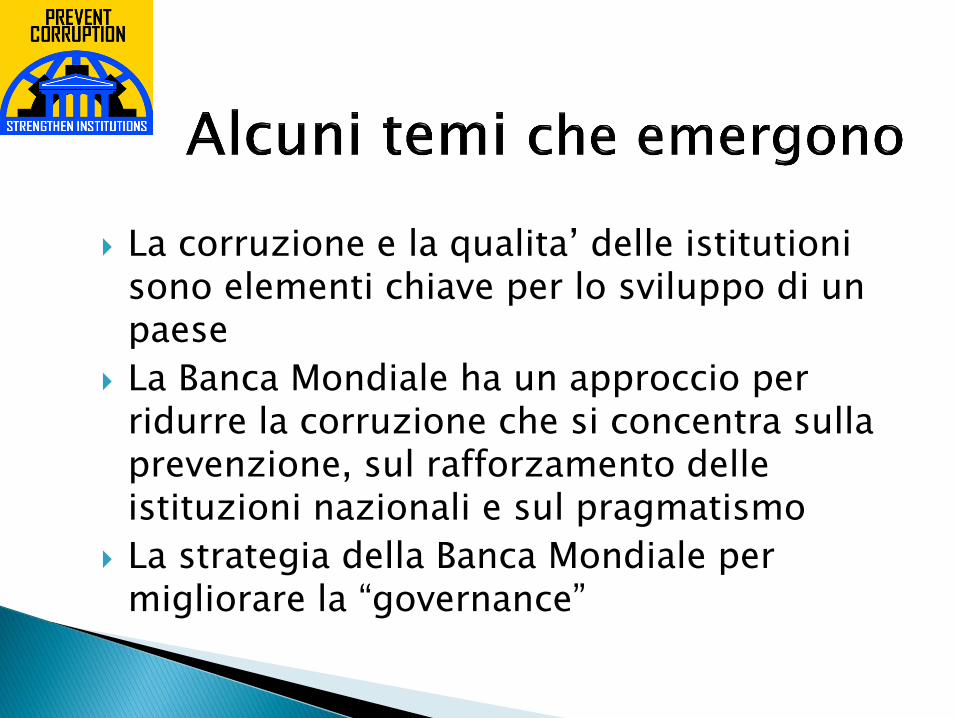
La corruzione e la qualita’ delle istitutioni sono elementi chiave per lo sviluppo di un paese
La Banca Mondiale ha un approccio per ridurre la corruzione che si concentra sulla prevenzione, sul rafforzamento delle istituzioni nazionali e sul pragmatismo
La strategia della Banca Mondiale per migliorare la “governance”
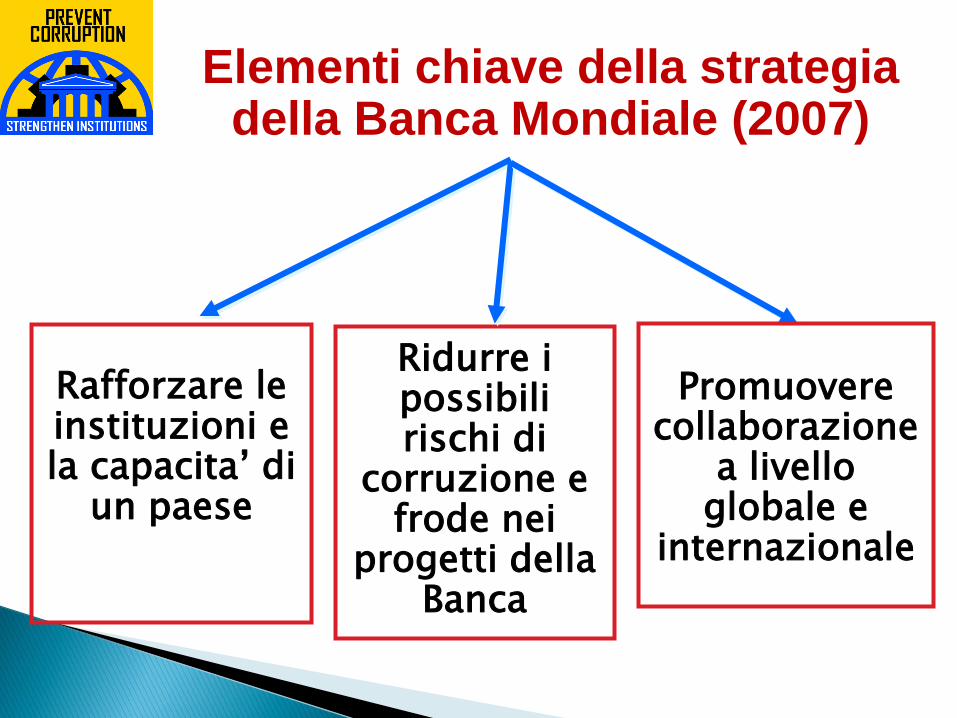
Ridurre i possibili rischi di
corruzione e frode nei
progetti della Banca
Rafforzare le instituzioni e la capacita’ di
un paese
Promuovere
collaborazione a livello
globale e internazionale
Elementi chiave della strategia della Banca Mondiale (2007)
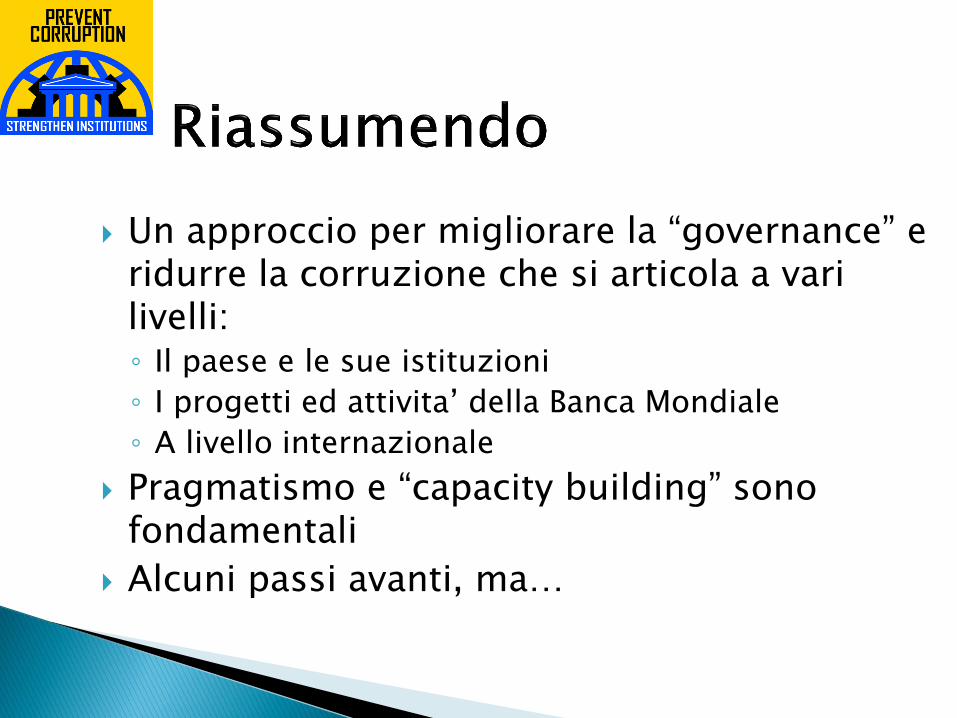
Un approccio per migliorare la “governance” e ridurre la corruzione che si articola a vari livelli: ◦ Il paese e le sue istituzioni
◦ I progetti ed attivita’ della Banca Mondiale
◦ A livello internazionale
Pragmatismo e “capacity building” sono fondamentali
Alcuni passi avanti, ma…
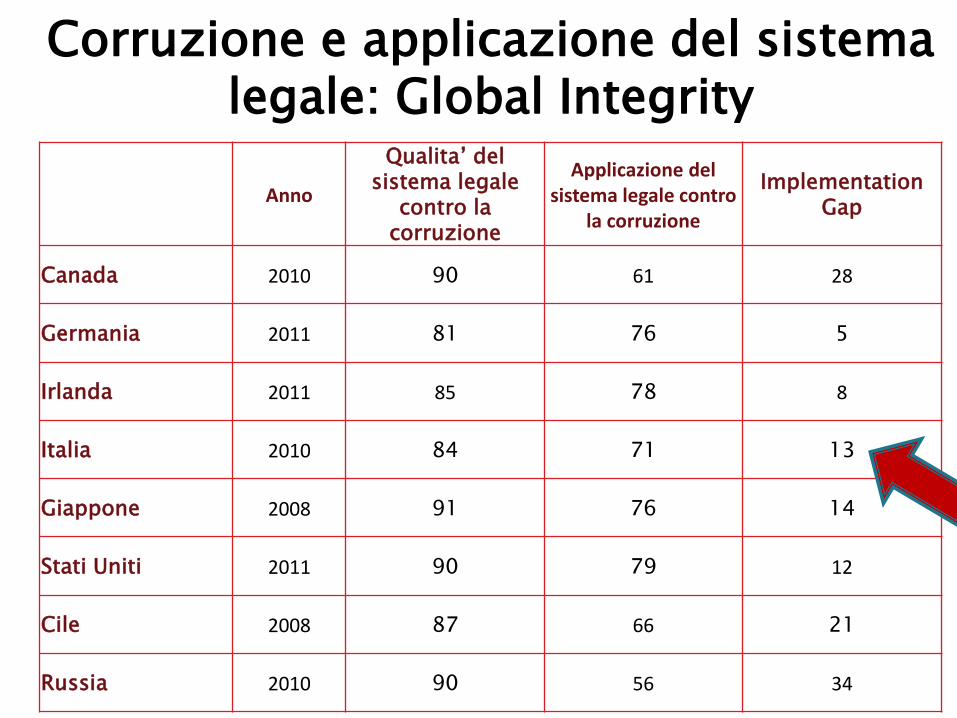
Anno
Qualita’ del sistema legale
contro la corruzione
Applicazione del sistema legale contro
la corruzione
Implementation Gap
Canada 2010 90 61 28
Germania 2011 81 76 5
Irlanda 2011 85 78 8
Italia 2010 84 71 13
Giappone 2008 91 76 14
Stati Uniti 2011 90 79 12
Cile 2008 87 66 21
Russia 2010 90 56 34
Corruzione e applicazione del sistema legale: Global Integrity
Corruzione: un fenomeno complesso che ha manifestazioni diverse e un costo significativo per una economia che puo’ essere stimato (con un margine di errore)
Cittadini ed imprese vengono penalizzati in modo regressivo
Elementi di politica economica chiave per ridurre la corruzione: un sistema di gestione del personale basato sui meriti e le capacita’; meccanismi di controllo interni ed esterni; accesso all’informazione
Cosa e’ necessario? ◦ Strumenti diversi per problematiche diverse, ◦ Un forte compromesso politico, ◦ Una visione di medio/largo periodo
DICHIARAZIONE DEI DIRITTI E DOVERI DELL’UOMO, DEL POPOLO E DE’ SUOI RAPPRESENTANTI, REPUBBLICA PARTENOPEA (FRANCESCO MARIO PAGANO, 1799)
Art. 11 – Ogni cittadino deve essere premiato o punito a proporzione de’ meriti e de’ delitti senza distinzione alcuna di persone.
28