France - OECD · France . This note on France ... are among the achievements of the French...
14
Education at a Glance: OECD Indicators is the authoritative source for accurate and relevant information on the state of education around the world. It provides data on the structure, finances, and performance of the education systems in the 34 OECD member countries, as well as a number of G20 and partner countries. France This note on France focuses on three major topics covered in the present edition of Education at a Glance, all of which particularly concern France. The first topic analyses the linkage between educational attainment, acquired skills, employability and access to vocational education and training, and it refers extensively to new data from the PIAAC Survey of Adult Skills. The second topic looks at the situation of French primary and secondary school teachers and draws heavily on data from the TALIS study on lower-secondary school teachers, and on actual pay data (including the various bonuses and allowances received by teachers). Lastly, the third topic takes stock of the resources invested in education and provides input for assessing how the economic crisis has impacted funding for the education systems of the OECD countries. Topic 1: Educational attainment, skills and employability The level of educational attainment in France has risen considerably in the past 40 years. This increase has been even more pronounced with regard to higher education. Over the past 40 years, France has closed the gap that it had with a great many OECD countries in regards to its population’s educational attainment. The significant rise in the proportion of young people completing their studies with a secondary school diploma or the equivalent, and the successful mass expansion of higher education enrolments in the 1980s – with the creation of IUTs (“university institutes of technology”) in 1966 and the development of university-level curricular pathways and grandes écoles – are among the achievements of the French education system.
Transcript of France - OECD · France . This note on France ... are among the achievements of the French...

Education at a Glance: OECD Indicators is the authoritative source for accurate and relevant information on the state of education around the world. It provides data on the structure, finances, and performance of the education systems in the 34 OECD member countries, as well as a number of G20 and partner countries.
France This note on France focuses on three major topics covered in the present edition of Education at a Glance, all of which particularly concern France. The first topic analyses the linkage between educational attainment, acquired skills, employability and access to vocational education and training, and it refers extensively to new data from the PIAAC Survey of Adult Skills. The second topic looks at the situation of French primary and secondary school teachers and draws heavily on data from the TALIS study on lower-secondary school teachers, and on actual pay data (including the various bonuses and allowances received by teachers). Lastly, the third topic takes stock of the resources invested in education and provides input for assessing how the economic crisis has impacted funding for the education systems of the OECD countries.
Topic 1: Educational attainment, skills and employability
The level of educational attainment in France has risen considerably in the past 40 years. This increase has been even more pronounced with regard to higher education. Over the past 40 years, France has closed the gap that it had with a great many OECD countries in regards to its population’s educational attainment. The significant rise in the proportion of young people completing their studies with a secondary school diploma or the equivalent, and the successful mass expansion of higher education enrolments in the 1980s – with the creation of IUTs (“university institutes of technology”) in 1966 and the development of university-level curricular pathways and grandes écoles – are among the achievements of the French education system.

France – Country Note – Education at a Glance 2014: OECD Indicators
© OECD 2
Thus, the percentage of higher education graduates has increased significantly in recent decades. In 2012, 43% of 25-34 year-olds (versus the OECD average of 39%) in France were higher education graduates, as opposed to only 20% (cf. OECD average 24%) of 55-64 year-olds (see chart above). It should be noted that in France the percentage of higher education graduates varies considerably between regions, even though the education system is administered nationally. For example, the proportion of 25-34 year-olds who are higher education graduates is no more than 19% in French Guyana, but reaches 55% in Île-de-France (see Box A1.1).
These outcomes have led to upward educational mobility within France: 40% of young people (25-34 year-olds) have a higher level of educational attainment than their parents. In all countries except Estonia, Germany, Norway and Sweden, the absolute mobility of the level of educational attainment is more often upward than downward, reflecting the development of education systems in most of the OECD countries. Thus, in France, 40% of 25-34 year-olds have a higher level of educational attainment than their parents (versus an average of 32% in the OECD countries participating in the OECD Survey of Adult Skills), whereas only 10% of them failed to equal their parents’ level of educational attainment (cf. OECD average of 16%) (Table A4.4 ).
Rising levels of educational attainment in France have been accompanied by a substantial boost in the skills level of the population.
The population’s level of educational attainment having risen, it is no surprise that its skills level has also made spectacular progress. The results concerning skills show that in the 24 OECD countries and
France – Country Note – Education at a Glance 2014: OECD Indicators
© OECD 3
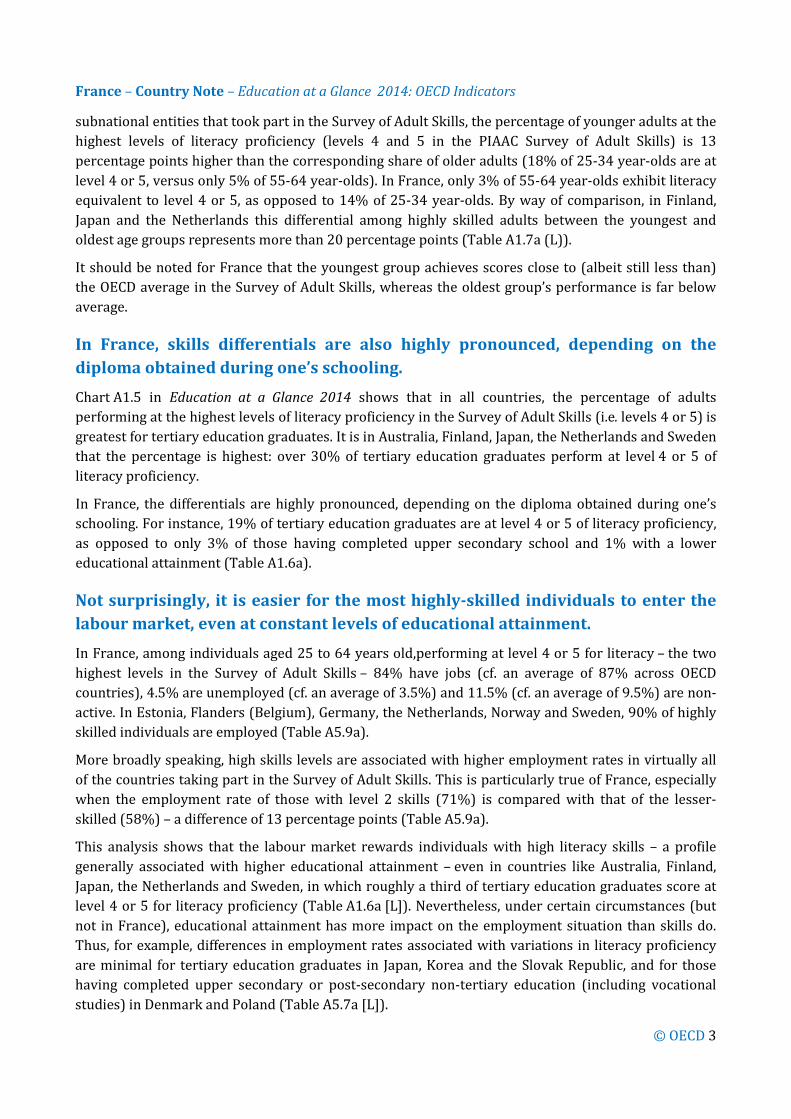
subnational entities that took part in the Survey of Adult Skills, the percentage of younger adults at the highest levels of literacy proficiency (levels 4 and 5 in the PIAAC Survey of Adult Skills) is 13 percentage points higher than the corresponding share of older adults (18% of 25-34 year-olds are at level 4 or 5, versus only 5% of 55-64 year-olds). In France, only 3% of 55-64 year-olds exhibit literacy equivalent to level 4 or 5, as opposed to 14% of 25-34 year-olds. By way of comparison, in Finland, Japan and the Netherlands this differential among highly skilled adults between the youngest and oldest age groups represents more than 20 percentage points (Table A1.7a (L)).
It should be noted for France that the youngest group achieves scores close to (albeit still less than) the OECD average in the Survey of Adult Skills, whereas the oldest group’s performance is far below average.
In France, skills differentials are also highly pronounced, depending on the diploma obtained during one’s schooling. Chart A1.5 in Education at a Glance 2014 shows that in all countries, the percentage of adults performing at the highest levels of literacy proficiency in the Survey of Adult Skills (i.e. levels 4 or 5) is greatest for tertiary education graduates. It is in Australia, Finland, Japan, the Netherlands and Sweden that the percentage is highest: over 30% of tertiary education graduates perform at level 4 or 5 of literacy proficiency.
In France, the differentials are highly pronounced, depending on the diploma obtained during one’s schooling. For instance, 19% of tertiary education graduates are at level 4 or 5 of literacy proficiency, as opposed to only 3% of those having completed upper secondary school and 1% with a lower educational attainment (Table A1.6a).
Not surprisingly, it is easier for the most highly-skilled individuals to enter the labour market, even at constant levels of educational attainment. In France, among individuals aged 25 to 64 years old,performing at level 4 or 5 for literacy – the two highest levels in the Survey of Adult Skills – 84% have jobs (cf. an average of 87% across OECD countries), 4.5% are unemployed (cf. an average of 3.5%) and 11.5% (cf. an average of 9.5%) are non-active. In Estonia, Flanders (Belgium), Germany, the Netherlands, Norway and Sweden, 90% of highly skilled individuals are employed (Table A5.9a).
More broadly speaking, high skills levels are associated with higher employment rates in virtually all of the countries taking part in the Survey of Adult Skills. This is particularly true of France, especially when the employment rate of those with level 2 skills (71%) is compared with that of the lesser- skilled (58%) – a difference of 13 percentage points (Table A5.9a).
This analysis shows that the labour market rewards individuals with high literacy skills – a profile generally associated with higher educational attainment – even in countries like Australia, Finland, Japan, the Netherlands and Sweden, in which roughly a third of tertiary education graduates score at level 4 or 5 for literacy proficiency (Table A1.6a [L]). Nevertheless, under certain circumstances (but not in France), educational attainment has more impact on the employment situation than skills do. Thus, for example, differences in employment rates associated with variations in literacy proficiency are minimal for tertiary education graduates in Japan, Korea and the Slovak Republic, and for those having completed upper secondary or post-secondary non-tertiary education (including vocational studies) in Denmark and Poland (Table A5.7a [L]).

France – Country Note – Education at a Glance 2014: OECD Indicators
© OECD 4
These results explain why diplomas are still more important for finding work in France, where the least skilled are most vulnerable. It is obvious that failure to complete secondary school is a serious handicap for finding a job, whereas obtaining a tertiary diploma bolsters chances for employment, especially in times of economic crisis.
During the recent economic crisis, unemployment rates rose sharply in most of the OECD countries and have remained high ever since. In France, young adults (25 to 34 years old) who have not completed their upper secondary studies were hit harder by the crisis than older adults with the same educational attainment. On average, in the OECD countries, the unemployment rate associated with this level of educational attainment increased by roughly 6 percentage points for 25-34 year-olds between 2008 and 2012, rising from 13.6% to 19.8%, while in France it rose from 16.9% to 23.2%. In 2012, France had the OECD countries’ ninth-highest unemployment rate for unskilled 25-34 year-olds, after the Slovak Republic (53%), Spain (38%), Ireland (37%), Greece (36%), the Czech Republic (33%), Hungary (28%), Estonia (26%) and Poland (25%) (Table A5.4a).
Graduates (25-34 year-olds) fared better. Twelve percent of young adults in France with a secondary diploma (i.e. baccalauréat or the equivalent) were looking for work – exceeding the OECD average of 10% and the corresponding rates in neighbouring countries such as Germany (5%) and Switzerland (4%), but in line with the average for European countries. University graduates were the group that did best. With their jobless rate of 6.8%, France was nearly 2 percentage points below the European country average (8.5%) and slightly below the OECD average (7.4%) (Table A5.4a).
It is therefore necessary to expand vocational education and training. And yet, this is not at all developed in France … On average in the OECD countries, according to the PIAAC Survey of Adult Skills, over 50% of adults (25 to 64 years) old take part each year in formal and/or informal training activities versus 36% in France. The proportion varies significantly, however, from one country to another. The proportion of adults taking part in such activities is over two out of three in Denmark, Finland and Sweden, but a third in the Slovak Republic and one in four or less in Italy and the Russian Federation (Table C6.1 (L)).
… and, above all, insufficiently targeted at the categories that need it most, i.e. the oldest and least skilled. Literacy proficiency and educational attainment seem to combine to influence participation in formal and/or informal training activities. On average, higher education graduates in the OECD countries are roughly three times as likely to engage in educational activities as those having a lower level of schooling. Some 71% of tertiary graduates have taken part in formal and/or informal training activities, versus only 27% of people who have not completed an upper secondary education. France is no exception, with 56% of higher education graduates having undergone vocational education or training, as opposed to only 17% of those not completing secondary school (Table C6.2a).
Likewise, individuals between 25 and 34 years old are around twice as likely to take part in adult training activities as 55-64 year-olds (the corresponding figures being 62% as opposed to 34% for 55-64 year-olds). This trend is even more pronounced in France, with only 19% of 55-64 year-olds taking part in vocational education or training over the past 12 months versus 45% of 25-34 year-olds (Table C6.2b).
France – Country Note – Education at a Glance 2014: OECD Indicators
© OECD 5
In France, employers’ lack of support is a reason given by 18% of adults aged 25 to 64 years old for not taking part in vocational training activities over the past 12 months. Some 45% of these potential participants cited professional or family responsibilities (versus only 30% in France) to explain why they did not take part in such training activities. Another statistic: in France, 18% of individuals questioned chose the option “My employer did not encourage me” to explain why they had given up on taking part in training activities of interest to them, versus an OECD average of only 8% (see Table C6.5).
Topic 2: Teachers
In France, nursery school teachers are virtually the only ones in all the OECD countries to have pursued their initial studies to a master’s degree. The length of initial teacher education varies more in pre-primary education that at any other level: from two years for basic certification in Japan and Korea to five years in Austria, Chile, France, Iceland and Italy. The only countries that require a master’s degree to teach pre-primary school are England, France, Iceland and Italy; this attainment level is required to teach primary school in 11 of the 35 countries for which data are available; to teach general studies in lower secondary school in 16 countries; and to teach upper secondary school in 22 countries (see Table D6.1 a, b, c and d).
Initial education in France does not adequately prepare teachers to teach. The TALIS survey reveals more about teachers’ initial education, and above all about how they perceive it. In France, 90% of teachers deem themselves well prepared or very well prepared with regard to the content of the subject they teach (cf. TALIS average of 93%). In contrast, nearly 40% of teachers feel inadequately prepared for the pedagogical aspects of teaching, which is the highest proportion in any of the 34 countries taking part in the TALIS survey (see Chart D6.a).
In France, the ongoing training available is inadequately focused on the needs of the teachers. On average among the countries taking part in the TALIS survey, approximately 88% of teachers reported having undertaken a professional development activity over the past 12 months. In France, the proportion was lower (76%), and even lower still at private schools (only 69%, versus a TALIS average of 86%). The training courses on offer to teachers are also less intensive in France. For example, the number of days spent by French teachers in courses or workshops is only half the average for TALIS survey countries (4 days per year, as opposed to a TALIS average of 8 days) (see Chart D7.c and the TALIS note for France).
As a rule, the level and intensity of teachers’ participation in professional development activities are influenced by the types of support they receive. In France, however, this fails to explain the causes for this lesser participation, insofar as 73% of French teachers (cf. a TALIS average of 66%), are entitled to full financing of their professional development costs, or to another type of support allowing them to take part (see Chart D7.a and the TALIS note for France).

France – Country Note – Education at a Glance 2014: OECD Indicators
© OECD 6
According to the TALIS survey, the reasons holding French teachers back are more a lack of incentives, professional (or family) scheduling incompatibility, or the failure (in their eyes) of the available training to meet their needs (see also Note d’information No. 22 of the Directorate for Evaluation, Forward Planning and Performance - DEPP).
In France statutory salaries for primary and secondary school teachers are significantly below the OECD average. In France, statutory salaries for primary and secondary school teachers are below the OECD average, both for starting teachers and for those with 10 or 15 years’ professional experience. However, the differential narrows if the analysis looks only at secondary school teachers.
On average across OECD countries, statutory salaries for teachers with at least 15 years’ experience, in 2012, averaged USD 37 350 (versus USD 33 994 in France) in pre-primary education, USD 39 024 (versus USD 33 994 in France) in primary education, USD 40 570 (versus USD 37 065 in France) in lower secondary education and USD 42 861 (versus USD 37 355 in France) in upper secondary education (see Table D3.1).
From a methodological standpoint, the OECD indicator compares gross annual salaries of public school teachers as defined by official pay scales (statutory salaries). These data therefore do not include bonuses or other allowances to which not all teachers are entitled. Lastly, salaries are converted into US dollars (USD) on the basis of purchasing power parties (PPPs) which equalise the purchasing power of each country’s currency.
In France, only the maximum salaries for teachers exceed the OECD average at all levels. However, 29 years’ service is needed to reach the highest pay steps in France, as opposed to an average of 24 years for the OECD countries.
However, when bonuses and other allowances paid to teachers are factored in, the differentials between levels of education narrow (favouring secondary school teachers). When all the bonuses and allowances paid to teachers are factored in, French teachers fare better, at least in respect of those teaching at secondary schools (lower and upper, i.e. collèges and lycées). The average salary in France is still significantly below average for the OECD countries in respect of pre-primary and primary education (by respectively 7% and 17%). However, the average actual pay is virtually equal to the OECD average for French teachers employed in lower or upper secondary education (where average pay is below the OECD average at 3% and 2%respectively ). It should be noted, however, that actual pay for France includes that of collège and lycée teachers holding the country’s highest teaching degree (l’agrégation) at the end of their careers (with the highest salaries), whereas for these levels of education, statutory salaries include only the amounts corresponding to certified teachers with 15 years’ service (see Table D3.4).
In some countries including France, the average actual pay difference is greater between levels of education than the statutory salary gap for teachers with 15 years’ experience. Thus in France, the average actual pay differential between pre-primary and upper secondary school teachers is nearly 30%, while the statutory salary gap between the two groups is only 10%. These differences are attributable in part to the diversity of bonus-awarding policies between primary and secondary
France – Country Note – Education at a Glance 2014: OECD Indicators
© OECD 7
education, but also to the fact that pre-primary teachers tend to be younger than their secondary school counterparts, which is reflected in actual pay but not in statutory salaries. (See Tables D3.1 and D3.4).
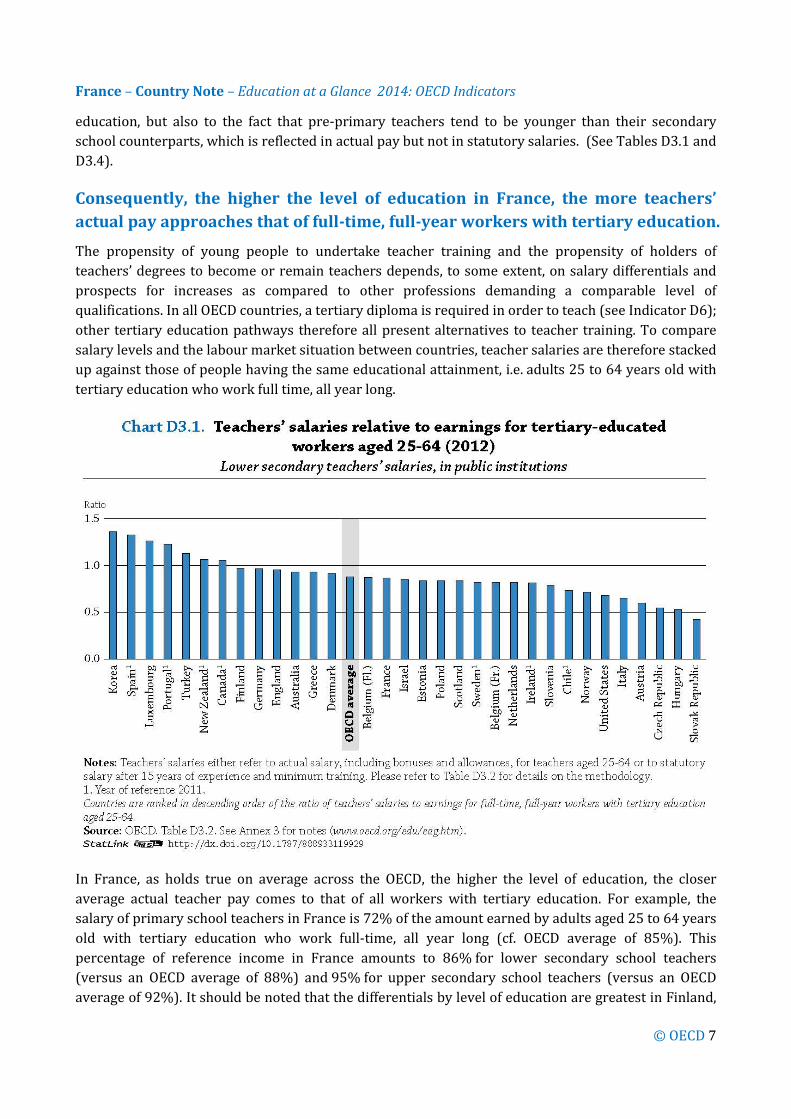
Consequently, the higher the level of education in France, the more teachers’ actual pay approaches that of full-time, full-year workers with tertiary education. The propensity of young people to undertake teacher training and the propensity of holders of teachers’ degrees to become or remain teachers depends, to some extent, on salary differentials and prospects for increases as compared to other professions demanding a comparable level of qualifications. In all OECD countries, a tertiary diploma is required in order to teach (see Indicator D6); other tertiary education pathways therefore all present alternatives to teacher training. To compare salary levels and the labour market situation between countries, teacher salaries are therefore stacked up against those of people having the same educational attainment, i.e. adults 25 to 64 years old with tertiary education who work full time, all year long.
In France, as holds true on average across the OECD, the higher the level of education, the closer average actual teacher pay comes to that of all workers with tertiary education. For example, the salary of primary school teachers in France is 72% of the amount earned by adults aged 25 to 64 years old with tertiary education who work full-time, all year long (cf. OECD average of 85%). This percentage of reference income in France amounts to 86% for lower secondary school teachers (versus an OECD average of 88%) and 95% for upper secondary school teachers (versus an OECD average of 92%). It should be noted that the differentials by level of education are greatest in Finland,

France – Country Note – Education at a Glance 2014: OECD Indicators
© OECD 8
where a pre-primary school teacher earns 65% of the average salary for workers with tertiary education, whereas the ratio rises to 109% for Finnish upper secondary school teachers (Table D3.2).
More generally, upper secondary school teachers are paid as much as, if not more than, full-time, full-year workers with tertiary education in 12 of the 32 countries for which data are available (see Table D3.2 and Chart D3.1). It is in Korea, Luxembourg (in secondary education), Portugal and Spain that relative teacher pay is highest: teachers in those countries earn at least 20% more than the average full-time, full-year worker with tertiary education.
Topic 3: Funding the education system
France invests over 6% of its GDP in education… In 2011, the OECD countries earmarked an average of 6.1% of their GDP on school funding, like France. The percentage exceeded 7% in Argentina, Denmark, Iceland, Israel, Korea, New Zealand, Norway and the United States (Table B2.1).
… but the split between primary and secondary education shows an imbalance. Outlays per student on secondary education were 20% higher in France than the OECD average (USD 11 109 versus an average of USD 9 280), but the corresponding figure for primary education was 20% below the OECD average (USD 6 917 versus an average of USD 8 296 USD) (see Table B1.1a).
The education sector has until now been protected from the economic crisis in both France and two-thirds of the OECD countries. In 2011, investment in education had still not been hit by the economic crisis in most OECD countries. However, between 2009 and 2011, GDP rose (in real terms) in most countries, but public expenditure on educational institutions decreased in a third of OECD countries during this period (by more than 2% in Estonia, Hungary, Iceland, Ireland, Italy, Portugal, the Russian Federation, Spain and the United States), probably because of budget-cutting measures. France was not among those countries, and public expenditure on educational institutions increased by 2%, on average, between 2008 and 2009, and remained stable between 2009 and 2011 (Table B2.5).
In the same vein, public expenditure on education and aggregate public expenditure increased in all countries between 2008 and 2011, with the exception of Estonia, Hungary, Iceland, Italy, the United Kingdom and the United States. In 15 of the 28 countries under study here, public expenditure on education rose even more sharply than aggregate outlays (see Table B4.2). France, however, was not one of those 15 countries; over the period 2008-11, public spending on education increased by 2% while public spending on all services increased by 5%
In the countries hit hardest by the economic crisis, it was often teacher salaries that were the most affected. Between 2000 and 2012, teacher salaries in real terms increased in all countries for which data are available, except France, Greece and Japan. However, in most countries salaries did not rise as much after 2005 as they had between 2000 and 2005. The 2008 economic slowdown also had a direct impact on teacher salaries, which were frozen or lowered in certain countries, but not in France,
France – Country Note – Education at a Glance 2014: OECD Indicators
© OECD 9
despite a freeze in the reference index because of increases in teachers’ starting salaries. As a result, between 2008 and 2012, teacher salaries in real terms increased in less than half of the OECD countries. The crisis had an especially significant impact on teacher pay in England, Estonia, Greece, Hungary, Ireland, Italy, Portugal, Scotland and Spain (Box D3.2). Given the rise in salaries at the beginning of careers, this is not the case for France.
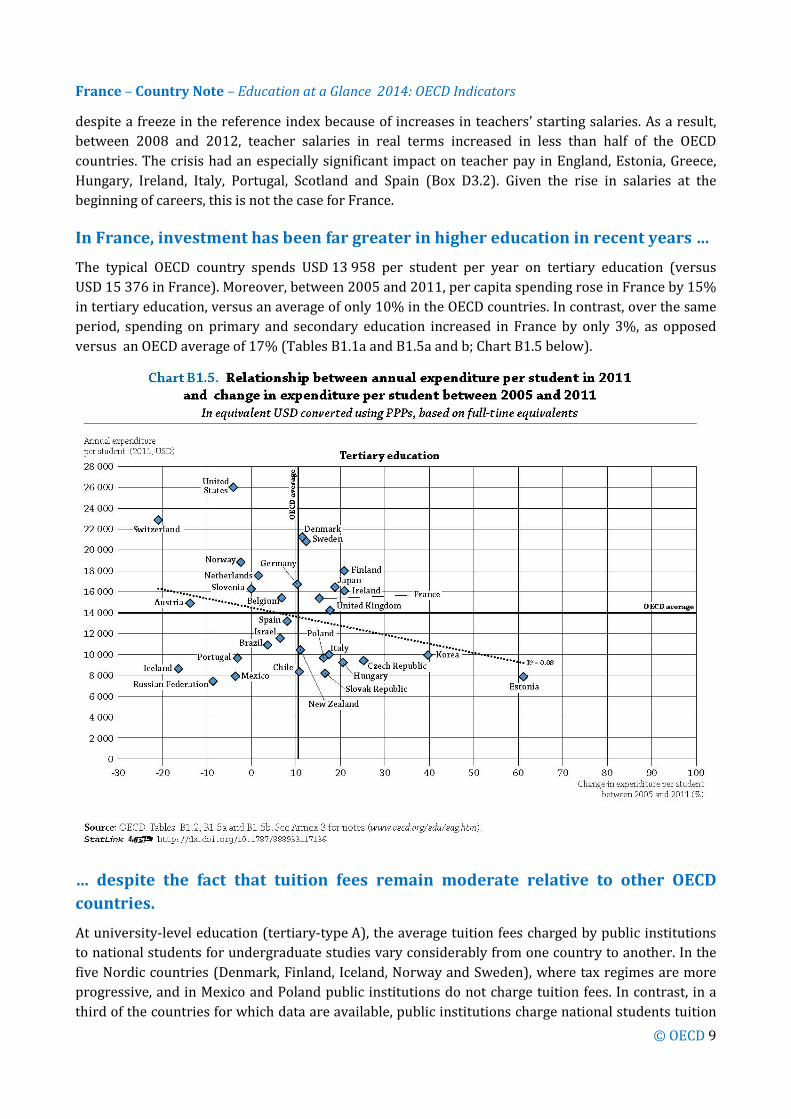
In France, investment has been far greater in higher education in recent years … The typical OECD country spends USD 13 958 per student per year on tertiary education (versus USD 15 376 in France). Moreover, between 2005 and 2011, per capita spending rose in France by 15% in tertiary education, versus an average of only 10% in the OECD countries. In contrast, over the same period, spending on primary and secondary education increased in France by only 3%, as opposed versus an OECD average of 17% (Tables B1.1a and B1.5a and b; Chart B1.5 below).
… despite the fact that tuition fees remain moderate relative to other OECD countries. At university-level education (tertiary-type A), the average tuition fees charged by public institutions to national students for undergraduate studies vary considerably from one country to another. In the five Nordic countries (Denmark, Finland, Iceland, Norway and Sweden), where tax regimes are more progressive, and in Mexico and Poland public institutions do not charge tuition fees. In contrast, in a third of the countries for which data are available, public institutions charge national students tuition
France – Country Note – Education at a Glance 2014: OECD Indicators
© OECD 10
fees in excess of USD 1 500; the fees even exceed USD 5 000 in Chile, Korea and the United States. The tuition fees charged to students are low at public tertiary-type A institutions in Austria, Belgium, France, Ireland, Italy, Portugal, Spain and Switzerland. Of the EU21 countries for which data are available, the Netherlands and the United Kingdom are the only ones in which full-time national students must pay tuition fees in excess of USD 1 500 per year (see table B5.1 and Chart B5.2). More generally, the share of private funding stands for 19% in France versus 31% on average across OECD countries (see Table B3.2b).
Allowing France to remain an attractive country for foreign students … Over the past 30 years, the number of students studying in a country of which they are not citizens has grown sharply throughout the world: from 0.8 million in 1975, it more than quintupled to 4.5 million in 2012. “Foreign students” account for a significant proportion of tertiary education enrolments in France (12%) (Table C4.1).
According to 2012 statistics, more than half of all foreign students choose their destinations amongst a relatively limited number of countries. In fact, a majority of students pursuing higher education in a foreign country are split among just five countries. It is the United States that hosts the most foreign students (in absolute value), with 16% of the worldwide population of foreign students, followed by the United Kingdom (13%), Australia (6%), Germany (6%) and France (6%) (Chart C4.2 and Table C4.7, online).
… even if new emerging countries are starting to compete in the education market. Apart from the five leading host countries, a substantial number of foreign students are pursuing studies in Canada (5%), the Russian Federation (4%), Japan (3%), Spain (2%) and China (2%) (see Table C4.4). In twelve years, the proportion of internationally mobile students choosing the United States as a destination country fell from 23% to 16%, and the proportion dropped by over two percentage points in Germany. In contrast, the proportion of internationally mobile students choosing New Zealand rose by over one percentage point, while the proportion of those choosing the Russian Federation or the United Kingdom rose by approximately 2 percentage points in each case (Chart C4.3).
Other findings
• On average in the OECD countries, unemployment rates for 25-64 year-olds are lower for those who have completed vocational upper secondary or post-secondary non-tertiary studies (8.1%) than for those who have completed general upper secondary studies (9.3%). However, the unemployment rate (8.3%) are identical in France for both (Table A5.5a).
• In France, a tertiary education graduate with literacy proficiency at level 4 or 5 according to the PIAAC Survey of Adults Skills earns about 9% more than someone of equal educational attainment at level 3 or below (versus an average of 11%). For adults with upper secondary education, the salary differential is roughly 11% between highly skilled individuals (levels 4 and 5) and those with low skills (level 1 and lower) (versus an average of 33%) (Table A6.6a).

France – Country Note – Education at a Glance 2014: OECD Indicators
© OECD 11
• In all of the OECD countries, tertiary (higher) education gives individuals a substantial financial advantage. In France, tertiary education graduates can hope to earn, on average, 54% more than those with just an upper secondary education (versus an average of 59%) (Table A6.1a).
• Educational attainment and literacy proficiency levels are correlated with more positive social outcomes, such as feeling that one is in good health, can trust others and has a say in government. At any given level of educational attainment, the higher an individual’s literacy proficiency level, the more positive the social outcomes (see Indicator A8).
• Enrolment rates among 15-19 year-olds in France have been falling over the last 15 years, but this decrease can be explained by significantly less recourse to grade repetition during this period, and by the fact that it has become easier to switch between curricular pathways, leading many young people to complete their secondary education at the age of 18 (see Indicator C1).
• Early childhood education is available to the great majority of children in France. In percentage of GDP, expenditure on pre-primary education exceeds the OECD average (0.7% in France versus an average of 0.6%). However, in relation to the number of children enrolled in pre-primary school, the expenditure per child is below the average for OECD countries (Indicator C2).
• In 2012, on average in the OECD countries, 87% of 15-19 year-olds were in education, versus 91% in France. Nevertheless, these high figures should not obscure the fact that among 15-19 year-olds not in education in France, 73% of them (i.e. 6.5% of 15-19 year-olds) were unemployed or inactive (Indicator C5).
• On average in OECD countries, the proportion of young people 25-29 years old not in education and either unemployed or inactive was 19%, versus 22% in France (see TableC5.3a).
• In 21 of the 29 OECD countries for which 2003 and 2012 data are available, the percentage of students in tertiary education and enrolled in a private institution increased considerably between 2003 and 2012. France is no exception to this finding, 20% of students having been enrolled in a private institution in 2012 versus only 16% in 2003 (see Table C7.6)
• In France, students attend more hours of classes than the average for OECD countries, in primary and secondary education alike, the differential from the average tending to rise with the level of education. Learning is also more heavily concentrated on basics (mathematics and reading comprehension) in primary education, relative to the OECD average (see indicator D1).
• It is only in the Czech Republic, France, Greece, Indonesia, Israel and Turkey that teachers spend at least 30% more hours of classes per year in primary education than in lower secondary school. Thus in France, primary school teachers are teaching their students an average of 924 hours per year, or 142 hours more than the OECD average of 782 hours (see Table D4.1).
• On average, teachers in primary and secondary education are younger in France than in many European and OECD countries, and fewer of them will retire in the next few years, again in comparison to the OECD average (see Indicator D5).
France – Country Note – Education at a Glance 2014: OECD Indicators
© OECD 12
* EU21 countries are those that are members of both the European Union and the OECD. These 21 countries are Austria, Belgium, the Czech Republic, Denmark, Estonia, Finland, France, Germany, Greece, Hungary, Ireland, Italy, Luxembourg, the Netherlands, Poland, Portugal, Slovenia, the Slovak Republic, Spain, Sweden and the United Kingdom. The Survey of Adult Skills is a product of the OECD Programme for the International Assessment of Adult Competencies (PIAAC). This work is published under the responsibility of the Secretary-General of the OECD. The opinions expressed and arguments employed herein do not necessarily reflect the official views of OECD member countries. This document and any map included herein are without prejudice to the status of or sovereignty over any territory, to the delimitation of international frontiers and boundaries and to the name of any territory, city or area. Note regarding data from Israel The statistical data for Israel are supplied by and are under the responsibility of the relevant Israeli authorities. The use of such data by the OECD is without prejudice to the status of the Golan Heights, East Jerusalem and Israeli settlements in the West Bank under the terms of international law. Note regarding data from the Russian Federation in the Survey of Adult Skills (PIAAC) Readers should note that the sample for the Russian Federation does not include the population of the Moscow municipal area. The data published, therefore, do not represent the entire resident population aged 16-65 in Russia but rather the population of Russia excluding the population residing in the Moscow municipal area. More detailed information regarding the data from the Russian Federation as well as that of other countries can be found in the Technical Report of the Survey of Adult Skills (OECD, forthcoming). For more information on Education at a Glance 2014 and to access the full set of Indicators, visit www.oecd.org/edu/eag.htm.
Questions may be directed to: Andreas Schleicher Director for Education and Skills and Advisor to the Secretary-General on Education Policy E-mail: [email protected] Telephone: +33 6 07 38 54 64
Country Note Author: Eric Charbonnier E-mail: [email protected]

Key Facts for France in Education at a Glance 2014
Table Indicator
Rank among
OECD countries
and partner
countries*
Enrolment rates 2012 2005 2012 2005 2012 2005
3-year-olds (in early childhood education) 98% 100% 70% 64% 79% 73% 2 of 37
4-year-olds (in early childhood and primary
education)100% 100% 84% 79% 89% 84% 1 of 38
C1.1a 5-14 year-olds (all levels) 99% 98% 98% 14 of 44
Percentage of population that has only attained
below upper secondary education2012 2000 2012 2000 2012 2000
A1.4a 25-64 year-olds 27% 38% 24% 34% 23% 34% 11 of 36
Percentage of the population whose highest
level of attainment is upper secondary
education
2012 2000 2012 2000 2012 2000
A1.4a 25-64 year-olds 42% 41% 44% 44% 48% 46% 19 of 37
Percentage of population that has attained
tertiary education2012 2000 2012 2000 2012 2000
25-64 year-olds 31% 22% 33% 22% 29% 20% 22 of 37
25-34 year-olds 43% 31% 40% 26% 37% 24% 15 of 36
55-64 year-olds 20% 13% 25% 15% 22% 14% 23 of 36
Entry rates into tertiary education 2012 2000 2012 2000 2012 2000
Youth expected to enter tertiary-type A
programmes before turning 2539% m 48% m 48% m 25 of 35
Graduation rates 2012 2000 2012 2000 2012 2000
A2.2a
Percentage of today’s young people expected to
complete upper secondary education in their
lifetime
m m 84% 76% 83% 77%
A3.2a
Percentage of today’s young people expected to
complete university education (tertiary-type A) in
their lifetime
m m 38% 28% 38% 27%
Unemployment rate of 25-64 year-olds - Men
and Women2012 2008 2012 2008 2012 2008
Below upper secondary 14% 10% 14% 9% 17% 10% 13 of 35
Upper secondary and post-secondary non-tertiary 8% 6% 8% 5% 9% 5% 12 of 36
Tertiary 5% 4% 5% 3% 6% 3% 11 of 36
Unemployment rate of 25-64 year-olds -
Women2012 2008 2012 2008 2012 2008
Below upper secondary 14% 11% 13% 9% 16% 11% 14 of 35
Upper secondary and post-secondary non-tertiary 9% 7% 9% 6% 10% 6% 13 of 35
Tertiary 5% 4% 5% 4% 6% 4% 12 of 35
Average earnings advantage for 25-64 year-olds
with tertiary education**
Men and women 18 of 33
Men 16 of 33
Women 22 of 34
Average earnings penalty for 25-64 year-olds
who have not attained upper secondary
education**
Men and women 12 of 33
Men 4 of 33
Women 15 of 34
Percentage of 15-29 year-olds neither
employed nor in education or training, by
highest level of education
2012 2008 2012 2008 2012 2008
Below upper secondary 19% 17% 15% 14% 15% 13% 10 of 35
Upper secondary 18% 15% 16% 14% 16% 12% 13 of 34
Tertiary 11% 7% 13% 11% 12% 10% 19 of 34
C5.3d
(Web)
2012 or latest year
available
France OECD average EU21 average
Educational Access and Output
C2.1
A1.3a
A1.4a
A6.1a
A6.1b (Web)
154 159 159
162 164 166
155 162 160
C3.1b
Economic and Labour Market Outcomes
A5.4a
A5.4c
(Web)
2012 or latest year
available
2012 or latest year
available
2012 or latest year
available
2012 or latest year
available
2012 or latest year
available
A6.1a
A6.1b (Web)
82 78 79
89 78 80
76 75 76

Key Facts for France in Education at a Glance 2014
Table Indicator
Rank among
OECD countries
and partner
countries*
France OECD average EU21 average
Annual expenditure per student (in equivalent
USD, using PPPs)
Pre-primary education 17 of 36
Primary education 23 of 38
Secondary education 9 of 38
Tertiary education 14 of 37
Total expenditure on educational institutions as
a percentage of GDP2011 2000 2011 2000 2011 2000
B2.2 Percentage of GDP 6% 6% 6% 5% 6% 5% 19 of 37
Total public expenditure on education 2011 2000 2011 2000 2011 2000
B4.2 As a percentage of total public expenditure 10% 12% 13% 13% 12% 11% 31 of 34
Share of private expenditure on educational
institutions
B3.1 Pre-primary education 28 of 33
B3.1Primary, secondary and post-secondary non-
tertiary education21 of 36
B3.1 Tertiary education 24 of 34
B3.1 All levels of education 24 of 33
Ratio of students to teaching staff
Pre-primary education 5 of 31
Primary education 8 of 36
Secondary education 18 of 37
Number of hours of teaching time per year (for
teachers in public institutions)2012 2000 2012 2000 2012 2000
Pre-primary education 924 1001 988 17 of 28
Primary education 924 936 782 780 761 776 6 of 33
Lower secondary education 648 648 694 697 657 658 16 of 33
Upper secondary education 648 648 655 628 638 635 14 of 33
Index of change in statutory teachers’ salaries
for teachers with 15 years of
experience/minimum training (2005 = 100)
2012 2008 2012 2008 2012 2008
Primary school teachers 94 97 103 103 99 103 22 of 26
Lower secondary school teachers 95 96 102 103 99 103 20 of 25
Upper secondary school teachers 95 96 101 103 98 103 20 of 25
Ratio of teachers’ salaries to earnings for full-
time, full-year adult workers with tertiary
education
Pre-primary school teachers 14 of 25
Primary school teachers 20 of 28
Lower secondary school teachers 13 of 28
Upper secondary school teachers 11 of 28
C6.1(L)
* Countries are ranked in descending order of values.
** Compared to people with upper secondary education; upper secondary = 100.
The Survey of Adult Skills is a product of the OECD Programme for the International Assessment of Adult Competencies
m': data is not available. 'n': magnitude is either negligible or zero. 'c': there are too few observations to provide reliable estimates.
Financial Investment in Education
2011 2011 2011
15375 13958 13572
6% 19% 13%
B1.1a
6615 7428 7933
6917 8296 8482
11109 9280 9615
2011 2011 2011
11% 16% 11%
Schools and Teachers
2012 2012 2012
8% 9% 6%
19% 31% 21%
D2.2
22 14 13
19 15 14
13 13 12
0.85 0.81
0.86 0.88 0.85
0.95 0.92 0.90
D4.2
D3.5
2012 2012 2012
D3.2
0.73 0.80 0.76
0.72
New data from the Survey of Adult SkillsAverage of countries
with available data
2012
36%
50%
2012
A4.1a
10% 9%
41% 37%
55%
51%
2012
2012Students in tertiary education... (20-34 year-olds)
…whose parents have not attained upper secondary education
...whose parents have an upper secondary education
...whose parents have a tertiary education degree
Adults in formal and non-formal education
25-64 year-olds
France