Framing Desalination Within the Water-Energy-Climate Nexus
115
Framing Desalination Within the Water-Energy-Climate Nexus T Fischer, J Kühl and M Govender Report to the Water Research Commission by EScience Associates (Pty) Ltd WRC Report No. 2778/1/18 February 2019
Transcript of Framing Desalination Within the Water-Energy-Climate Nexus

Framing Desalination Within the
Water-Energy-Climate Nexus
T Fischer, J Kühl and M Govender
Report to the Water Research Commission
by
EScience Associates (Pty) Ltd
WRC Report No. 2778/1/18
February 2019

ii
Obtainable from
Water Research Commission Private Bag X03 Gezina, 0031
[email protected] or download from www.wrc.org.za
DISCLAIMER
This report has been reviewed by the Water Research Commission (WRC) and approved for publication. Approval does not signify that the contents necessarily reflect
the views and policies of the WRC, nor does mention of trade names or commercial products constitute endorsement or recommendation for use.
ISBN 978-0-6392-0074-3
© WATER RESEARCH COMMISSION
iii
EXECUTIVE SUMMARY
Background
Large areas of the world and most of South Africa are water scarce. Traditional water resources and their conveyance and storage systems are characterised by increasing supply uncertainty due to a combination of climate change and poor water governance. Economic growth and the related increase in demands on water resources will increasingly lead to water scarcity. In view of the water scarcity problem, the increased use of alternative water sources is becoming necessary. Seawater desalination has been identified as one of the possible responses to meet the growing water demand. Desalination is a mature process comprising different technologies, which have historically been favoured in different parts of the world. However, the implementation of desalination projects requires an integrated nexus approach considering the dynamic interplay between water, energy and climate change in order to manage water supply risks, particularly during periods where the demand for the desalinated water decreases; for example, during non-drought periods, which may result in plants being turned off and requiring costly maintenance and repairs to start up again. To manage the demand-side risk, strategies have to be developed that consider the system within which the plant operates on the micro level and from a holistic perspective.
Need for an integrated water-energy-climate nexus approach for implementation of desalination
The current regulatory approval procedure for implementing seawater desalination projects largely hinges on environmental impact assessment requirements. Although national climate change and energy efficiency policies exist (as well as those that specifically address the water-energy-climate change nexus), there is no coherence and synergy in the enforcement of these policies when implementing desalination projects.
Techno-economic analysis of the water-energy-climate approach to desalination
This study considered several strategies and evaluated the costs and economic viability of certain implementation options. The linkages between desalination, energy and climate change were identified, with a specific focus on the following:
• Identifying opportunities to optimise the operation of desalination plants, balancing the cost of water production in terms of energy requirements and cost, energy utilisation, capital expenditure and recovery, operational cost and operability.
• Considering integrated water/energy solutions, with the exploitation of the potential benefits of co-location and cooperation of water and energy generation (and storage) technologies.
• Dovetailing desalination with renewable and non-carbon-based energy sources, and the implications of such strategies.
• Considering desalination as a climate change adaptation strategy to reduce the impact of increased variability in weather patterns and reduced long-term rainfall.
Findings showed that the economics of desalination are tied to the cost and quantity of energy used for the process as energy is the single largest variable cost for a desalination plant. Energy cost typically varies from a quarter to more than half the total cost of desalinated water. Desalination processes, such as reverse osmosis (RO), multi-effect distillation (MED) and multistage flash distillation (MSF) are still more expensive alternatives to water supply and demand-side management options, apart from long-distance pumped water transfer.
The RO process is more cost-effective than MED unless a free source of low-grade heat is used as a thermal input. The MED process is more prevalent in areas with large amounts of associated natural gas at low prices, such as the Middle East and North Africa. Here it is generally applied as a bottoming
iv
cycle of an integrated power and water generation facility. South Africa currently does not have access to low-cost natural gas, but MED may still be an option if coupled with low-grade waste heat from solar-thermal and nuclear power generation plants. This, however, is not yet cost-competitive as a desalination process due to the high cost of thermal energy storage and the need for MED to operate at high load factors.
The desalinated water price is less sensitive to electricity cost than to capital recovery. Operating the desalination plant continuously results in a lower water cost than a part-load operation based on lower time-of-use electricity pricing. It may be beneficial to idle desalination plants during peak periods (peak-shedding and demand-side management) when electricity is most expensive; this could be used as a demand control tool. The ability to dispatch electrical generation capacity installed for desalination to other consumers during peak periods can affect the required reserve margin and thereby the installed electricity generation capacity. This could theoretically realise savings in generation plant build cost. Seasonal part-load in seawater reverse osmosis (SWRO) desalination plants have a similar effect than daily part-load operation. Water cost increases exponentially at a lower plant utilisation. It generally makes sense to continuously operate desalination plants rather than idling them for extended periods of time with costs roughly doubling from 90% utilisation to 40% utilisation.
Desalination is significantly more expensive at low load factors; hence, desalination cannot rely on renewable electricity alone but needs to be supplied by grid or dispatchable generation plant, augmented by renewable energy plus storage. Although the mid-merit cost of renewable energy plus storage is not yet at grid parity in South Africa, it is likely that such parity will be achieved in the short to medium term. Since the price of desalinated water is less sensitive to electricity cost than to capital recovery, the impact of the electricity cost on the water price is small.
Desalination energy recovery systems are generally designed to operate continuously and in tandem with the RO feed pumps. It is, however, also possible to operate multiple forms of energy recovery, notably the energy recovered during times when electricity is available at lower cost may be stored intermittently; for example, using pumped storage and then releasing it later to augment supply when electricity is more expensive. In certain locations where such storage is insufficient to cater for variability, other options are implemented to augment supply or curtail demand.
In the same way as for an electrical grid, water supply networks may rely on a multitude of supply-/demand-matching techniques. Each of the above techniques has its benefits, limitations and drawbacks that makes it suitable for specific interventions. The optimal mix of technologies is specific to a particular water management area. The justification of investment in desalination should in the author’s view be made based on the economic cost of unserved water and/or the cost of suppression of economic development – or opportunity cost – as a consequence of a lack of secure water supply. The required capacity and justifiable cost, however, have to be determined based on stochastic analysis of natural water availability, probability and economic consequence of various levels of drought.
Construction costs vary significantly, are highly site-specific, and dependent on brine disposal and other environmental requirements. Co-location of desalinisation and thermal waste plants, such as nuclear power plants, at coastal sites could potentially reduce construction, storage and transportation costs. Continuous operation of a desalination plant is more cost-effective than periodic use of the same plant, maintenance costs excluded. Therefore, the tariff for water supply is less susceptible to variation. Co-location of desalination with, for example, gas-to-power and nuclear energy at a coastal location should be considered ideal during the project planning stages.
Conclusions and recommendations
Desalination is not a proverbial silver bullet solution to our country’s sustainable water future. There are specific applications, however, especially in water-stressed areas with limited alternatives, where desalination is likely to play an important part in the longer-term solution. When considering

v
desalination, it is important to consider the economic activity of the area/basin in which it is applied and specifically the level of resilience of that area to water shortages, as well as the economic impacts that could be unlocked through access to a more secure, less variable water supply. In these areas, certain economic activities can be secured and expanded by implementing desalination together with other interventions. Application of desalination in coastal areas also needs to be considered in terms of what coastal water security and the augmentation/displacement of inland freshwater supply means for retaining water and applying to alternative uses of water in the inland areas. As an example, expansion of inland irrigation schemes and associated agriculture may currently not be possible because coastal water demand is receiving priority. When coastal demand is served through desalination, it may be possible to unlock enhanced inland economic activity.
Desalination differs markedly from traditional water resources in that it is simultaneously a more expensive supply but also has a high supply certainty. Indications are that large-scale desalination options are being excluded from water supply portfolios because tariff structures do not readily allow their entry as water supply certainty requirements are not appropriately valued nor does supply certainty attract an appropriate premium in tariff. Accordingly, sectors that are both willing and able to pay a premium (e.g. tourism) are precluded from doing so. The investment in desalinisation processes should be made in contrast with the economic cost of unserved water and/or cost of economic development suppression due to lack of a secure water supply. Desalination is expensive, but the supply is certain. Although this study cannot necessarily realise key answers to all questions, it informs possible areas of further research and investigation that could provide the necessary enablement.
The setting of water tariffs has traditionally been developed around the supply of traditional water resources and the methods currently applied fail in situations of severely constrained supply specifically where certain sectors require security of supply (most efficiently afforded by desalination) and have been willing to pay for supply and certainty of supply. Tariff structures depend on many factors, including the network’s characteristics and the objectives pursued via pricing policy. The charges may differ between customer classes (such as residential, commercial and industrial). The problem faced by the water sector is that prices and tariffs are almost universally below the full cost of supply. This also holds to water tariffs in South Africa (with socio-economic objectives tariffs are set to promote multiple objectives other than cost recovery). Due to the increased need for using alternative water resources with varying cost and certainty of supply attributes, conventional tariff structures need to be adapted considering a more holistic water resources pricing approach.
This study considered the key policy instruments for possible adjustments to enable equitable investment in desalination and other water supply options. Policy research recommendations to better value certainty of supply are as follows:
• Harmonising the policy and legislative frameworks to enable the implementation of an integrated and strategic approach to guide technology research development and deployment to address regional water-energy issues, yielding information that can be applied nationally and globally.
• Strengthening policies that enhance the integration of data and models to inform regulators, decision makers and the public. At this stage, there are no models and/or combination of models that can:
o Facilitate decision-making and options analysis based on an integrated water-energy-climate nexus approach.
o Estimate the cost of unserved water and the value of certainty in supply. o Determine the value proposition of desalination and other alternative water options at
the hand of different tariff schemes.

vi
ACKNOWLEDGEMENTS
The project team wishes to thank the following people for their contributions to the project.
Reference Group Affiliation
Dr Nonhlanhla Kalebaila Water Research Commission (Chairperson)
Prof. H Badenhorst University of Pretoria
Mr D Bosman TCTA
Mr M Ncube Development Bank of Southern Africa
Mr G Grobler Department of Water and Sanitation
Ms L Moodley eThekwini Municipality
Ms CL Phillips Eskom
Dr A Madhlopha University of Cape Town

vii
TABLE OF CONTENTS
EXECUTIVE SUMMARY ....................................................................................................................... iii ACKNOWLEDGEMENTS ...................................................................................................................... vi TABLE OF CONTENTS ....................................................................................................................... vii LIST OF FIGURES ................................................................................................................................ ix LIST OF TABLES .................................................................................................................................. xi ACRONYMS AND ABBREVIATIONS ................................................................................................. xii CHAPTER 1: BACKGROUND ............................................................................................................ 1
Introduction .................................................................................................................................. 1 Project Aims ................................................................................................................................ 2 Work Packages ........................................................................................................................... 3
Scoping assessment and gap analysis ......................................................................... 3 Stakeholder engagement phase ................................................................................... 4 Draft final report ............................................................................................................. 4 Print-ready final report including results, conclusions and recommendations .............. 4
CHAPTER 2: IMPLEMENTATION OF DESALINATION IN SOUTH AFRICA – A REVIEW ............ 5 Introduction .................................................................................................................................. 5 National Desalination Strategy .................................................................................................... 5
Overview ........................................................................................................................ 5 Key strategic considerations ......................................................................................... 6
Planning for Desalination ............................................................................................................ 6 Regulatory approvals..................................................................................................... 6 Provincial and municipal policy and planning ................................................................ 6 Desalination guide for South African municipal engineers ............................................ 6
Desalination Technologies .......................................................................................................... 7 Desalination technology review ..................................................................................... 7 Thermal desalination processes .................................................................................... 9 Membrane processes .................................................................................................. 12 Other desalination technologies of interest ................................................................. 15
Global Distribution of Desalination Technologies ..................................................................... 19 Global desalination capacity ........................................................................................ 20 MSF desalination ......................................................................................................... 27 Electrodialysis desalination ......................................................................................... 30 RO desalination ........................................................................................................... 33
Analysis of Costs of Desalination Technologies ....................................................................... 36 Capital costs ................................................................................................................ 36 Turnkey cost breakdown ............................................................................................. 41 Commercial generation tariffs ..................................................................................... 42
Summary ................................................................................................................................... 44 Key issues on the implementation of desalination in South Africa .............................. 44 Other challenges to the implementation of desalination ............................................. 45 Research questions ..................................................................................................... 46
CHAPTER 3: DESALINATION WITHIN THE WATER-ENERGY-CLIMATE CHANGE CONTEXT 47 Introduction ................................................................................................................................ 47 Policy and Legislative Context for the Water-Energy-Climate Change Nexus ......................... 48 Solutions for Energy-Efficient Desalination ............................................................................... 48
Overview ...................................................................................................................... 48 Energy recovery in RO desalination plants (Veolia South Africa) ............................... 49 Storage of recovered energy for dispatch during peak periods .................................. 51 Hybridisation of RO desalination, desalination energy recovery systems, pumped
storage and renewable energy .................................................................................... 51 Using reservoir capacity to buffer desalination production.......................................... 52

viii
Desalination in Context of Climate Change and Drought ......................................................... 52 Climate change and drought ....................................................................................... 52 Climate change vulnerability assessments and climate change adaptation ............... 55 Development and development planning in the context of climate change timelines . 55
Summary ................................................................................................................................... 56 CHAPTER 4: SCOPING-LEVEL TECHNO-ECONOMIC ANALYSIS OF DESALINATION TECHNOLOGIES ................................................................................................................................. 59
Method and Scenarios .............................................................................................................. 59 Results and Discussion ............................................................................................................. 59
Desalination plant capital cost breakdown for RO and MED ...................................... 59 Desalinated water cost breakdown for RO and MED .................................................. 60 Benefits of co-location with existing seawater intakes and outfalls ............................. 61 RO: Sensitivity of water price to mid-merit and off-peak operation ............................. 62 Seasonal part-load ...................................................................................................... 62 RO: Augmenting energy supply with renewables plus battery storage ....................... 63 RO: Energy recovery and hybridisation with pumped storage .................................... 63 Desalination and water storage, including aquifer recharge ....................................... 64 Benchmarking desalination against other water supply options ................................. 64
Determining the mix of water supply options and need for desalination in a WMA .... 67 CHAPTER 5: SUMMARY AND CONCLUSIONS ............................................................................. 69 CHAPTER 6: RECOMMENDATIONS .............................................................................................. 72
Policy Recommendations for Achieving Water-Energy-Climate Change Security ................... 72 Background ................................................................................................................. 72 Policy considerations: Water agriculture hydro-economic modelling .......................... 74 Policy considerations: Tariffs and allocations ............................................................. 75 Modelling considerations: Enablement of Desalination and Reuse of Water ............. 78
Research Recommendations .................................................................................................... 80 Main research theme: Membrane technologies .......................................................... 80 Main research theme: Alternative technologies .......................................................... 81 Main research theme: Brine concentrate management technologies ......................... 81 Main research theme: Economics of desalination ....................................................... 81 Main research theme: Institutional issues ................................................................... 81 Main research theme: Regulatory/policy considerations ............................................. 82
LIST OF REFERENCES ....................................................................................................................... 86 APPENDIX A: REGULATORY APPROVALS ..................................................................................... 93 APPENDIX B: POLICY AND LEGISLATIVE CONTEXT FOR THE WATER-ENERGY CLIMATE CHANGE NEXUS ................................................................................................................................. 99

ix
LIST OF FIGURES
Figure 1: Subnational level water scarcity picture of the world in 2005 ................................................................... 1 Figure 2: Procedure for managing the implementation of seawater desalination .................................................... 7 Figure 3: Summary of desalination processes ........................................................................................................ 8 Figure 4: The desalination process (flow diagram) .................................................................................................. 8 Figure 5: Energy sources for desalination ............................................................................................................... 9 Figure 6: Shock electrodialysis.............................................................................................................................. 15 Figure 7: Forward osmosis process ...................................................................................................................... 16 Figure 8: Membrane distillation ............................................................................................................................. 16 Figure 9: Thermo-ionic desalination process ........................................................................................................ 17 Figure 10: LTTD .................................................................................................................................................... 17 Figure 11: Passarell Process ................................................................................................................................ 18 Figure 12: Capacitive deionisation ........................................................................................................................ 19 Figure 13: Countries ranked based on total desalination capacity ........................................................................ 20 Figure 14: Countries ranked based on total desalination capacity with the water stress indices shown ............... 20 Figure 15: Top ten countries based on total desalination capacity and their corresponding dam capacities ........ 21 Figure 16: Countries ranked based on total desalination capacity per mm rainfall ............................................... 21 Figure 17: Countries ranked based on total desalination capacity per m3 rainfall ................................................. 22 Figure 18: Countries ranked based on total desalination capacity per km2 of land area ....................................... 22 Figure 19: Countries ranked based on total desalination capacity per person ...................................................... 23 Figure 20: Countries ranked based on their water stress indices with total desalination capacity per person ...... 24 Figure 21: Countries ranked based on total MED desalination capacity ............................................................... 24 Figure 22: Map of MED desalination plants globally ............................................................................................. 25 Figure 23: Countries ranked based on total MED desalination capacity per mm rainfall ....................................... 25 Figure 24: Countries ranked based on total MED desalination capacity per m3 rainfall ........................................ 26 Figure 25: Countries ranked based on total MED desalination capacity per km2 land area .................................. 26 Figure 26: Countries ranked based on total MED desalination capacity per person ............................................. 27 Figure 27: Countries ranked based on total MSF desalination capacity ................................................................ 27 Figure 28: Map of MSF desalination plants globally .............................................................................................. 28 Figure 29: Countries ranked based on total MSF desalination capacity per mm of rainfall ................................... 28 Figure 30: Countries ranked based on total MSF desalination capacity per m3 rainfall ......................................... 29 Figure 31: Countries ranked based on total MSF desalination capacity per km2 land area .................................. 29 Figure 32: Countries ranked based on total MSF desalination capacity per person.............................................. 30 Figure 33: Countries ranked based on total electrodialysis desalination capacity ................................................. 30 Figure 34: Map of electrodialysis desalination plants globally ............................................................................... 31 Figure 35: Countries ranked based on total electrodialysis desalination capacity per mm of rainfall .................... 31 Figure 36: Countries ranked based on total electrodialysis desalination capacity per m3 rainfall .......................... 32 Figure 37: Countries ranked based on total electrodialysis desalination capacity per km2 land area .................... 32 Figure 38: Countries ranked based on total electrodialysis desalination capacity per person ............................... 33 Figure 39: Countries ranked based on total RO desalination capacity .................................................................. 33 Figure 40: Map of RO desalination plants globally ................................................................................................ 34 Figure 41: Countries ranked based on total RO desalination capacity per mm rainfall ......................................... 34

x
Figure 42: Countries ranked based on total RO desalination capacity per m3 rainfall ........................................... 35 Figure 43: Countries ranked based on total RO desalination capacity per km2 land area ..................................... 35 Figure 44: Countries ranked based on total RO desalination capacity per person ................................................ 36 Figure 45: Capital cost per capacity versus capacity for MED technology ............................................................ 37 Figure 46: Capital cost per capacity versus capacity for MSF technology ............................................................ 37 Figure 47: Size distribution for MED desalination plants, both seawater and brackish water feed sources .......... 37 Figure 48: Size distributions for MED desalination plants for brackish and seawater feed sources separately .... 38 Figure 49: Size distribution for MSF desalination plants, both seawater and brackish water feed sources ........... 38 Figure 50: Capital cost per capacity versus capacity for electrodialysis technology.............................................. 39 Figure 51: Capital cost per capacity versus capacity for RO technology ............................................................... 39 Figure 52: Size distribution for electrodialysis desalination plants, both seawater and brackish water feed sources .............................................................................................................................................................................. 40 Figure 53: Size distribution for RO desalination plants, both seawater and brackish water feed sources ............. 40 Figure 54: Size distributions for RO desalination plants for brackish and seawater feed sources separately ....... 41 Figure 55: Commercial generation tariffs .............................................................................................................. 43 Figure 56: Electrical energy use in desalination plants ......................................................................................... 49 Figure 57: Hydraulic energy recovery ................................................................................................................... 49 Figure 58: Energy recovery devices incorporated into an existing desalination plant ........................................... 50 Figure 59: Turbines or Pelton wheels illustration .................................................................................................. 50 Figure 60: Integrated energy recovery and storage system .................................................................................. 51 Figure 61: Projected changes in rainfall for South Africa measured as the number of dry spell days ................... 53 Figure 62: Water supply and demand relationships in context of expanding populations and climate change ..... 53 Figure 63: Water supply in Colorado River basin framed in climate change and drought ..................................... 54 Figure 64: Vulnerability exposure and risk in a climate change frame .................................................................. 55 Figure 65: Timeline illustrating the lifetimes (sum of lead and consequence times) of different types of decision 56 Figure 66: Desalination plant capital cost breakdown for RO and MED ................................................................ 60 Figure 67: Influence of energy cost on desalinated water cost, MED .................................................................... 61 Figure 68: Relationship between desalination plant utilisation and water cost ...................................................... 62 Figure 69: Water augmentation options for the Western Cape ............................................................................. 65 Figure 70: Application of desalination and other water supply options in response to different demand scenarios .............................................................................................................................................................................. 68 Figure 71: Water resources yield model (WRYM) configured for the National Water Resources Model ............... 72 Figure 72: Hydro-economic modelling (adapted from California Department of Water Resources) ...................... 73 Figure 73: Conceptual water agriculture hydro-economic model .......................................................................... 74 Figure 74: General principles when determining the cost and economic value of water ....................................... 76 Figure 75: Economic and marginal cost considerations for desalination ............................................................... 77
xi
LIST OF TABLES
Table 1: The advantages and disadvantages of MSF distillation .......................................................................... 10 Table 2: Advantages and disadvantages of MED (Turner et al., 2015) ................................................................. 10 Table 3: Advantages and disadvantages of TVC (Anon, 2011) ............................................................................ 11 Table 4: Advantages and disadvantages of electrodialysis (Westerling, 2015) ..................................................... 13 Table 5: Advantages and disadvantages of RO .................................................................................................... 14 Table 6: Thermal desalination typical cost breakdown (Sommariva, 2009) .......................................................... 42 Table 7: Membrane desalination typical cost breakdown (Sommariva, 2009) ...................................................... 42 Table 8: Impact of energy recovery ....................................................................................................................... 50 Table 9: Capital costs breakdown for RO and thermal MED ................................................................................. 59 Table 10: Unitary water costs for 100 Mℓl/day reference case facilities ................................................................. 60 Table 11: Grid-based electricity costs ................................................................................................................... 61 Table 12: Impact on water cost ............................................................................................................................. 62 Table 13: Impact of part-load operation on the water price ................................................................................... 62 Table 14: Modelled electricity costs grid-tied solar PV/batteries ........................................................................... 63 Table 15: Impact of electricity cost on water price: grid-only versus grid plus PV/storage .................................... 63 Table 16: Comparison of water supply networks and their benefits, limitations and drawbacks ........................... 65 Table 17: Large water users in South Africa ......................................................................................................... 78 Table 18: Specific research activities being undertaken globally .......................................................................... 82 Table 19: Potential NEMA listed activities ............................................................................................................. 93 Table 20: NEMWA listed waste management activities listed under GN R.921 .................................................... 97

xii
ACRONYMS AND ABBREVIATIONS
Capex Capital Expenditure CDI Capacitive Deionisation
CGE Computable General Equilibrium DWAF Department of Water Affairs and Forestry
DWS Department of Water and Sanitation ED Electrodialysis EIA Environmental Impact Assessment
FTC Flow-through Capacitor GDP Gross Domestic Product
ICMA Integrated Coastal Management Act, No. 24 of 2008 IEP Integrated Energy Plan
IPCC Intergovernmental Panel on Climate Change IRP Integrated Resource Plan
LTTD Low-temperature Thermal Desalinisation MED Multi-effect Distillation MEH Multi-effect Humidification
MENA Middle East and North Africa MSF Multistage Flash Distillation MVC Mechanical Vapour Compression
NCCRP National Climate Change Response Policy NDP National Development Plan
NEMA National Environmental Management Act, No. 107 of 1998 NEMBA National Environmental Management: Biodiversity Act, No. 10 of 2004
NEMWA National Environmental Management: Waste Act, No. 59 of 2008 NHRA National Heritage Resources Act, No. 25 of 1999 NWA National Water Act, No. 36 of 1998
NWRS National Water Resource Strategy NWRS2 National Water Resource Strategy 2
PV Photovoltaic RDD&D Research, Development, Demonstration and Deployment
RO Reverse Osmosis SAWSAM South African Water Social Accounting Matrix
SFWR Strategic Framework for Water Resources SWMED Seawater Multi-Effect Distillation
SWRO Sea Water Reverse Osmosis TDS Total Dissolved Solids TVC Thermal Vapour Compression UAE United Arab Emirates
UN United Nations USD United States Dollar
VMEMD Vapour Membrane Distillation WCWDM Water Conservation and Demand Management
WfGD Water for Growth and Development WMA Water Management Area WRC Water Research Commission
WRYM Water Resources Yield Model ZAR South African Rand
1
CHAPTER 1: BACKGROUND
Introduction
Water is a finite resource that is necessary for life. The water distribution on earth is variable and location-specific. Our freshwater supply is finite. There is no way to make more water, and no substitute for it. The mass of water held on earth cannot be increased by scientific discovery, technological breakthroughs or other means, yet the demand keeps growing. Water has been likened to “blue gold”, or “the oil of the twenty-first century”. Water plays a vital role in any country’s macro-economic function and its economic worth and, furthermore, water is the third-largest global industry (USD400 billion) after natural gas/oil exploration and electricity generation (Hoffmann, 2009). More than 70% of the world’s freshwater withdrawals are for agriculture (United Nations, 2009) and water cost influences agricultural sector production and the cost of food.
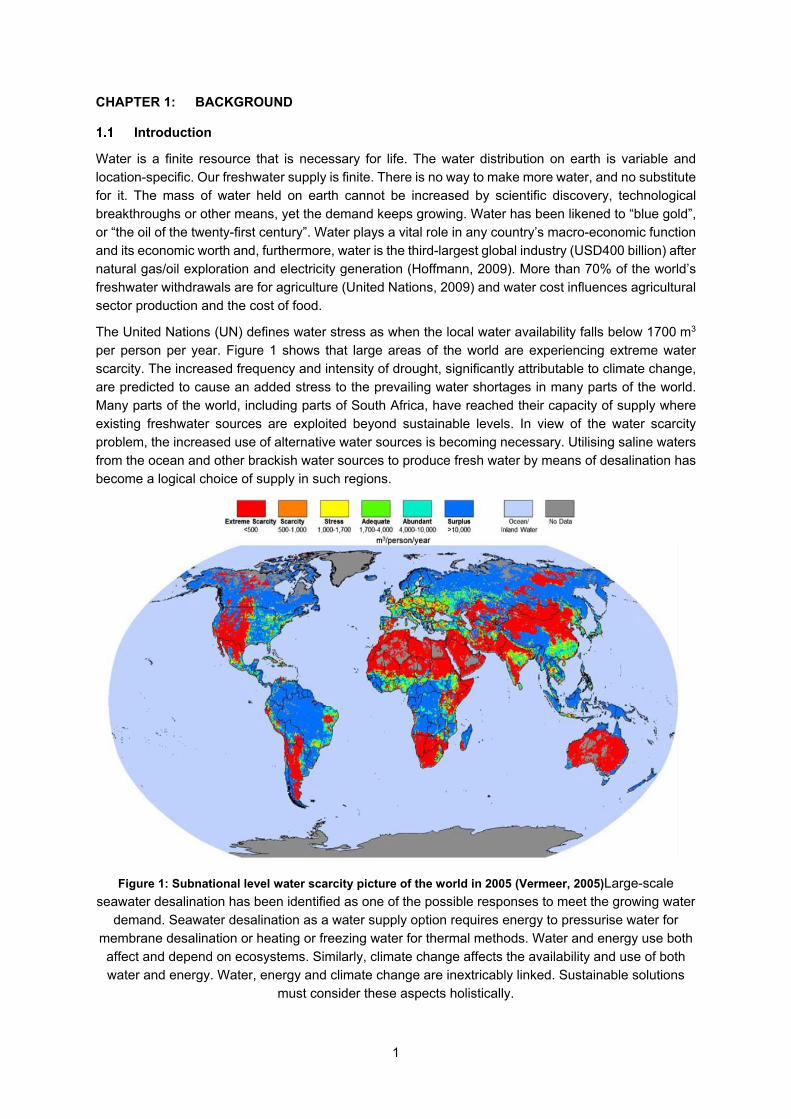
The United Nations (UN) defines water stress as when the local water availability falls below 1700 m3 per person per year. Figure 1 shows that large areas of the world are experiencing extreme water scarcity. The increased frequency and intensity of drought, significantly attributable to climate change, are predicted to cause an added stress to the prevailing water shortages in many parts of the world. Many parts of the world, including parts of South Africa, have reached their capacity of supply where existing freshwater sources are exploited beyond sustainable levels. In view of the water scarcity problem, the increased use of alternative water sources is becoming necessary. Utilising saline waters from the ocean and other brackish water sources to produce fresh water by means of desalination has become a logical choice of supply in such regions.
Figure 1: Subnational level water scarcity picture of the world in 2005 (Vermeer, 2005)Large-scale seawater desalination has been identified as one of the possible responses to meet the growing water
demand. Seawater desalination as a water supply option requires energy to pressurise water for membrane desalination or heating or freezing water for thermal methods. Water and energy use both affect and depend on ecosystems. Similarly, climate change affects the availability and use of both water and energy. Water, energy and climate change are inextricably linked. Sustainable solutions
must consider these aspects holistically.

2
Various parts of South Africa’s interior and, more recently, its coastal regions have been experiencing severe water shortages in the past years. To alleviate this deficiency, numerous municipalities have constructed small reverse osmosis (RO) desalination plants. However, recent reports on these plants have shown that the demand for the water tends to decrease during non-drought periods, resulting in some of the plants being turned off. The plants require costly maintenance and repairs to start up again. In addition, the operation and maintenance costs of these plants are excessive when compared with conventional plants due to the increased electricity use. To manage the demand-side risk, strategies have to be developed to consider the system within which the plant operates on the micro level and from a holistic perspective.
Ideally, one has to consider water generation technologies that assist in flattening the electricity consumption profile by integrating the national supply and demand profiles. Coastal regions also may have some interesting opportunities for pumped storage and renewable energy supply options, which can be integrated into the envisaged desalination strategies. The National Water Resource Strategy (NWRS) has indicated possible significant deficits by 2025.
Large-scale seawater desalination has been identified as one of the possible responses to meet the growing water demand. It has been projected that desalination plants could account for between 7% and 10% of the country’s overall urban water supply by 2030. The current drought crisis and plans for large-scale desalination present an opportunity for integrating water, energy and climate change aspects in desalination planning and decision-making. Systematically balancing the relationships between water, energy and climate change can contribute to the increased sustainability and resilience of desalination as a water supply option. The proposed study aimed to establish an understanding of desalination within the water-energy-climate nexus; clarify the role of desalination with or without drought; explore opportunities for achieving water-energy-climate change security in the context of desalination; and identify any knowledge and policy gaps. This study considers several strategies and tests the costs and economic viability of certain implementation options.
Project Aims
The following were the aims of the project:
1. Review and report on the legal frameworks within which the planning and implementation of seawater desalination and associated environmental impacts are managed.
2. Examine the water-energy-climate change nexus in the context of desalination, with emphasis on the potential role of desalination within a broader climate change adaptation strategy, considering both periods of drought and flood episodes.
3. Suggest alternatives to desalination. 4. Propose opportunities for generating energy when the water supply in the nexus is more
assured by introducing seawater desalination. 5. Compare the energy requirements for different desalination technologies and emerging
strategies for achieving: (i) energy efficiency by using energy reduction/recovery technologies and emerging energy-efficient desalination technologies; and (ii) sustainability by using renewable energy technologies.
6. Formulate a research framework for desalination in South Africa, including a stakeholder engagement process.
7. Formulate policy recommendations for achieving water-energy-climate change security in South Africa.

3
Work Packages
Scoping assessment and gap analysis
The key components were as follows:
1. Review of the different desalination technologies including benchmark energy requirements, technology maturity, global application, benchmark capital and operating costs, operating regimes (the ability of the technology to operate in intermittent conditions), possibility of integrating with RO technologies, possible other alternatives to desalination.
2. South African vendor interviews to compare benchmark global costing information with implementation in South Africa.
3. Global and South African case study analysis to identify what is being built, best available technology, potential problems, how drought and flood conditions are handled, operating protocols and economic sustainability.
4. Identify alternative solutions to desalination, e.g. water reuse, evaporation reduction methods and bulk water transfer schemes.
5. Develop a methodology to determine the opportunity cost of desalination water supply options in various economic sectors and the assessment of the cost of unserved water to the economy and relevant sectors.
6. Conceptual development of an integrated water-energy techno-economic model for South Africa and how an assurance of water supply and desalination value proposition can be determined.
The aim of the scoping phase was to strategically frame the potential of desalination within the water-energy-climate nexus. A working document of the findings was produced for the stakeholder engagement phase. The basic method was as follows:
• Undertaking a literature review of the legal framework within which the planning and implementation of seawater desalination and associated environmental impacts are managed. The team assessed the regulatory and legal landscape related to the planning and implementation of seawater desalination and assessed the required routes to be followed on a national, provincial and local level.
• Defining the water-energy-climate change nexus in the context of desalination with an emphasis on the potential role of desalination within a broader climate change adaptation strategy, considering both periods of drought and flood episodes.
• Identifying opportunities for energy generation, when the assurance of the water supply in the nexus is raised by introducing the desalination of seawater and brackish water.
• Conducting scoping-level techno-economic modelling to compare different desalination technology options in terms of cost and operating characteristics. The focus was on comparing a range of widely adopted desalination technologies and considering, for each technology, the key factors that would determine the optimal desalination plant technology under prevailing circumstances. Technical aspects considered included:
o Order-of-magnitude plant-specific capital costs (in ZAR/unit of water production capacity) for:
Small modular, medium-sized and large RO plants. Multiple-effect distillation plants. Electrodialysis reversal plants.
o Specific energy consumption for each technology, including the type of energy consumed, time-of-use and associated costs, based on current electricity and other
4
energy pricing. Reduction of energy costs by, for example, peak electricity demand reduction through turndown and/or intermittent operation will be considered. The impact on energy costs when using alternative, renewable energy sources will be considered.
o Plant operating and maintenance costs. o Unitary charge for desalinated water based on the above. o The influence of intermittent and turndown operation on the capital recovery and
unitary cost of desalination.
The linkages between desalination, energy and climate change were identified, with a specific focus on the following:
• Identifying opportunities to optimise the operation of desalination plants, balancing the cost of water production in terms of energy requirements and cost, energy utilisation, capital expenditure and recovery, operational cost and operability.
• Considering integrated water/energy solutions with exploitation of the potential benefits of co-location and cooperation of water and energy generation (and storage) technologies.
• Dovetailing of desalination with renewable and non-carbon-based energy sources, and the implications of such strategies.
• Considering desalination as a climate change adaptation strategy to reduce the impact of increased variability in weather patterns and reduced long-term rainfall.
This study considered the key policy instruments for possible adjustments to enable equitable investment in desalination and other water supply options. Although this study cannot necessarily realise key answers to all questions, it informed possible areas of further research and investigation that could provide the necessary enablement.
Stakeholder engagement phase
Following the scoping assessment phase, a report including the key findings was produced and circulated to relevant stakeholders identified by the project team in consultation with the Reference Group and Water Research Commission (WRC) Project Manager. A one-day workshop was held with the stakeholders to garner and test inputs into the:
• Formulation of a research framework for desalination in South Africa.
• Formulation of policy recommendations for achieving water-energy-climate change security in South Africa.
Draft final report
The draft final report was submitted following the stakeholder engagement phase, including:
• Legal and policy framework for desalination in South Africa.
• Desalination technologies and how they have been applied around the world.
• Scoping-level analysis results.
• A research framework for desalination in South Africa.
• Conclusions and recommendations.
Print-ready final report including results, conclusions and recommendations
Following the stakeholder engagement phase, a draft final report including the results of the scoping assessment and stakeholder engagement process outputs was presented to the Reference Group. Following review by the Reference Group, all comments were addressed, and a final report produced.
5
CHAPTER 2: IMPLEMENTATION OF DESALINATION IN SOUTH AFRICA – A REVIEW
Introduction
Desalination technologies will play an increasing role in bridging the water supply gap in many countries. There are 16 000 desalination plants operational worldwide today with a total operating capacity of 70 million m3 per day. Desalination capacity is poised for substantial growth in the coming decades as countries explore alternative solutions to meet growing water demand. In the Middle East and North Africa (MENA) region, for instance, the shortage of water (approximately 9.3 billion m3) will mostly be met through desalination by 2050 (World Bank, 2012). Currently, desalination in South Africa is being implemented very slowly. However, the planned large-scale desalination will require a careful consideration of its social, economic and environmental impacts as well as its associated energy demand.
Desalination is arguably the most energy-intensive water production technique available today. It consumes at least 75.2 TWh of electricity per year, which is equivalent to around 0.4% of the global electricity consumption (UN Water, 2014). Most of the energy required for desalination presently comes from fossil fuels, with less than 1% of its capacity dependent on renewables and low-carbon fuels (IRENA and IEA-ETSAP, 2012). As the number of desalination plants increases, continued dependence on fossil fuels is no longer sustainable from an economic and environmental perspective. Considering that energy and water pricing frameworks in most countries do not reflect the full production costs, the burden of using expensive desalination techniques will likely increase further on governments. Nuclear power and renewable energy technologies, perhaps in combination with energy storage, offer the opportunity to uncouple water production from fossil fuel supply.
National Desalination Strategy
Overview
The National Water Act (1998) (Republic of South Africa RSA, 1998)requires the Minister of Water Affairs to establish an NWRS:
“Part 1 requires the progressive development, by the Minister, after consultation with society at large, of a National Water Resource Strategy. The National Water Resource Strategy provides the framework for the protection, use, development, conservation, management and control of water resources for the country as a whole. It also provides the framework within which water will be managed at regional or catchment level, in defined water management areas. The National Water Resource Strategy, which must be formally reviewed from time to time, is binding on all authorities and institutions exercising powers or performing duties under this Act.”
The National Water Resources Strategy 2 (NWRS2) (Gazetted 16 August 2013) (DWAF, 2013) recognises the need to develop alternative water resources and indicates that “a mix of water resources is required to reconcile supply and demand”. In support of the water supply mix strategy, a national desalination strategy was developed and included as part of NWRS2, which states that desalination should form part of the strategy that will inform future water resource planning. In particular:
• Small-scale seawater desalination already being used in certain areas.
• Treated mine water desalination becoming more important.
• Desalination of seawater on a large scale.
It is also stated that “particular attention will be given to the potential for the desalination of seawater for supplying coastal towns and cities where there are sufficient sources of electricity for this purpose”.
6
Key strategic considerations
The Department of Water and Sanitation (DWS) is to develop guidelines to implement desalination projects as necessary and appropriate. These guidelines will address relevant topics, such as:
• Selection of appropriate technology and equipment.
• Capital and capital replacement costs.
• Operations and maintenance costs.
• Management, operations and maintenance staffing and resources requirements.
• Financing of projects.
• Tariff development and implementation.
• Public and consumer communications and outreach programmes.
Other key strategic elements considered in the strategy include:
• Planning aspects, i.e. regulatory approvals, integrating energy and water planning.
• Water source, scale, location, energy and environmental considerations.
• Implementation considerations such as critical factors for success, partnership models for the provision of desalination solutions, and skills and capacity building.
• Water quality aspects.
Planning for Desalination
Regulatory approvals
Appendix A provides a list of applicable legislation for to be considered for desalination.
Provincial and municipal policy and planning
Provincial and municipal plans and policies must be considered when planning the development of a desalination plant such as:
• Provincial and municipal growth and development strategies.
• Provincial and municipal integrated development plans.
• Provincial and municipal spatial development frameworks.
• Provincial and municipal coastal management plans.
• Provincial and municipal environmental management frameworks.
Desalination guide for South African municipal engineers
The first budgetary requirement that municipalities need to meet is to develop water service development plans as part of integrated development plans. Municipalities should be made aware of what options are available for providing adequate water services. There are some areas of the country where water is not available at an acceptable quality, especially in coastal towns where surface water has already been depleted/polluted by the time it reaches the coast. With membrane technology becoming more affordable and desalination not contributing as much to the total water tariff, the Department of Water Affairs and Forestry (DWAF) (Du Plessis, et al., 2006) identified the need to provide guidelines for selecting suitable desalination options. The guide provides important primary considerations, including:
• Saline water source, energy source and process selection.
• Fouling, scale formation and plant availability.

7
• Disposal of concentrate and environmental considerations.
• Physical location of plant and cost distribution.
• Manufacturing specifications and plant life.
The procedure for implementing a seawater desalination plant is illustrated in Figure 2 and shows specifically at which point in the environmental impact assessment (EIA) process requests for proposals should be undertaken.
Figure 2: Procedure for managing the implementation of seawater desalination (Du Plessis, et al., 2006)
Desalination Technologies
Desalination technology review
Desalinated water can be produced from saline water by two main processes, namely, thermal and membrane processes. Salinity is usually expressed as the concentration of the total dissolved solids (TDS), generally in milligrams per litre (mg/ℓ). Different feedwater salinities are usually categorised as:
• Seawater: 15 000 to 50 000 mg/ℓ TDS.
• Brackish water: 1 500 to 15 000 mg/ℓ TDS.
• Surface water: 500 to 3 000 mg/ℓ TDS.
• Pure water: less than 500 mg/ℓ TDS.
Well-established desalination technologies can be classified as thermal (phase-change) and membrane (non-phase-change) processes as set out in Figure 3. The processes are also called evaporation and size exclusion respectively.

8
Figure 3: Summary of desalination processes
The most reliable desalination processes that can currently be exploited at the commercial scale can be divided in two main categories:
• Thermal (or distillation) processes such as multistage flash distillation (MSF), multi-effect distillation (MED), thermal vapour compression (TVC), and mechanical vapour compression (MVC) processes.
• Membrane processes: RO and electrodialysis processes. Electrodialysis is mostly used for brackish water installations, while RO can be used for both brackish water and seawater.
The primary thermal processes are MSF and MED. The main membrane processes include RO and electrodialysis. New developments include technologies such as multi-effect humidification (MEH), vapour membrane distillation (VMEMD) and shock electrodialysis.
Figure 4: The desalination process (flow diagram)
9
Figure 4 shows that all desalination processes involve the input of energy to turn a feed stream of saline solution into a desalinated stream and a brine stream. The energy can be in the form of heat (in thermal distillation), pressure (in membrane distillation) or electricity (electrodialysis). While both thermal and membrane processes can use both thermal and electrical energy, different technologies are better suited to different forms of energy. Thermal desalination plants use heat sources as the driving force. These heat sources can be hot water or steam from a turbine. Therefore, thermal desalination can be combined for cogeneration with power plants. Electric power is only necessary for parasitical internal demands such as pumps.
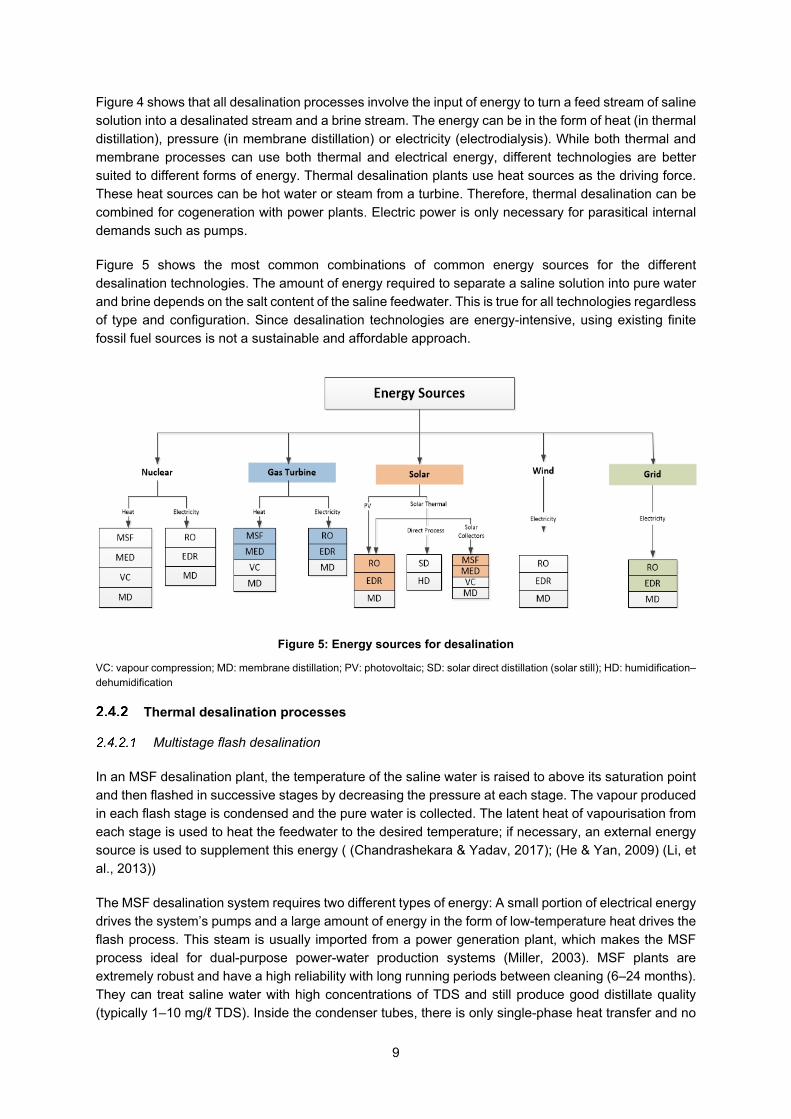
Figure 5 shows the most common combinations of common energy sources for the different desalination technologies. The amount of energy required to separate a saline solution into pure water and brine depends on the salt content of the saline feedwater. This is true for all technologies regardless of type and configuration. Since desalination technologies are energy-intensive, using existing finite fossil fuel sources is not a sustainable and affordable approach.
Figure 5: Energy sources for desalination
VC: vapour compression; MD: membrane distillation; PV: photovoltaic; SD: solar direct distillation (solar still); HD: humidification–dehumidification
Thermal desalination processes
Multistage flash desalination
In an MSF desalination plant, the temperature of the saline water is raised to above its saturation point and then flashed in successive stages by decreasing the pressure at each stage. The vapour produced in each flash stage is condensed and the pure water is collected. The latent heat of vapourisation from each stage is used to heat the feedwater to the desired temperature; if necessary, an external energy source is used to supplement this energy ( (Chandrashekara & Yadav, 2017); (He & Yan, 2009) (Li, et al., 2013))
The MSF desalination system requires two different types of energy: A small portion of electrical energy drives the system’s pumps and a large amount of energy in the form of low-temperature heat drives the flash process. This steam is usually imported from a power generation plant, which makes the MSF process ideal for dual-purpose power-water production systems (Miller, 2003). MSF plants are extremely robust and have a high reliability with long running periods between cleaning (6–24 months). They can treat saline water with high concentrations of TDS and still produce good distillate quality (typically 1–10 mg/ℓ TDS). Inside the condenser tubes, there is only single-phase heat transfer and no

10
degassing in the heat exchangers, which in turn reduces scaling. However, MSF plants are expensive as they need large specific heat transfer surfaces. Furthermore, the electrical energy consumption is higher (3–4 kWh/t) than other thermal systems. The MSF desalination technology has been employed in the industry for more than 40 years (Trieb, et al., 2010). The advantages and disadvantages of this technology are summarised in Table 1.
Table 1: The advantages and disadvantages of MSF distillation(Turner, et al., 2015)
Advantages Disadvantages
Simple, reliable operation, long successful track record
Low thermal efficiency (only cost-effective if low-cost steam is available)
Minimal (or no) feedwater pretreatment High cooling water requirement
Product water quality of 5 mg/ℓ to 10 mg/ℓ TDS Only practical for seawater applications
Multi-effect distillation
The MED processes work in the following way: water containing dissolved salts is sprayed on the outside surface of tubes laying in horizontal configuration with the post-turbine steam flowing within the tubes. As the steam travels through the tubes, it cools and condenses; meanwhile, the raw water sprayed on the outside is heated and begins to evaporate. The heavy brine condensate collects at the bottom. The raw water, which has now been heated to steam, travels to the next stage where the process is repeated until the saline water has been sufficiently purified. This process operates at less than 70°C to prevent scale formation.
Typical industrial MED systems have up to 12 stages. Low-pressure steam extracted from cogeneration boilers is used in the first stage. The vapour generated in this first effect is used to evaporate the water/effluent in the second stage, and this continues until the temperature drops to 30–40°C. In such low-temperature desalination processes, for every 1 MW of electricity generated through a thermal generation plant, some 3 MW of waste heat that is captured through steam condensation (at the back end of the turbine) may be used to drive desalination, resulting in a freshwater output of 3 m³/h (thus delivering approximately 3 m³/MWh).
Like MSF, MED plants can treat saline water with high concentrations of TDS and produce good distillate quality. The MED plants are also highly reliable with long running periods between cleaning (6–24 months). Furthermore, MED plants are less expensive than MSF plants due to the smaller heat transfer surface required. Also, no sophisticated equipment is required. MEDs have a better thermal efficiency and very low electrical consumption (0.5–0.6 kWh/t) (Trieb, et al., 2010) compared with MSFs. In MED, heat transfer takes place in dual-phase flow; therefore, degassing occurs during evaporation. However, the tube surface can only be cleaned chemically. The maximum steam temperature is limited to 70°C due to scaling (Trieb, et al., 2010). Where MED is coupled to a power plant, it replaces the cost of the condensation unit of the steam cycle and partially uses waste heat from power generation for the desalination process. In this case, not all the primary energy used is for the desalination process, but only the portion that is equivalent to a reduction of the amount of electricity generated in the plant when compared with conventional cooling at a lower temperature, and the direct power consumption of the MED process. The advantages and disadvantages are summarised in Table 2.
Table 2: Advantages and disadvantages of MED (Turner et al., 2015)
Advantages Disadvantages
Higher thermal efficiency than MSF More complex and smaller unit size than MSF
Lower top temperature operation than MSF May not be cost-competitive with RO

11
Uses less cooling water and electrical energy than MSF
Only practical for seawater applications
Lower capital cost than MSF
Product water quality of 5–10 mg/ℓ TDS
Thermal vapour compression
To improve efficiency, TVC is added to a multi-effect distiller. Vapour compression reuses vapour produced in the distiller as a source of heating steam after recompression (Patel & Multani, 2016). Water is sprayed onto bundles of tubes, which is heated from the inside by condensing steam. The transport of heat via the tube walls causes the liquid film on the outside of the tubes to evaporate. The resulting steam is used to heat the next stage, where the steam condenses on the inside of the tube bundle again. As in the MED process, TVC consists of several effects (stages) each equipped with heat exchanger tube bundles. Table 3 summarises the advantages of the technology.
Table 3: Advantages and disadvantages of TVC ( (MED-TVC – Multi Effect with Thermal Vapour Compres, 2011))
Advantages Disadvantages
Small to large plant sizes There is an additional cost for the compressor and its
Low investment costs The mechanical complexity of the vapour compressor is high, thus the system requires more maintenance
Minimised corrosion risk
Reduced scaling risk
Lower thermal energy consumption
Low operating costs
Efficient use of plant volume
Mechanical vapour compression
The MVC process can also be applied to MED to increase efficiency. As in the MED process, saline water is sprayed onto the tube surface. The evaporated water is compressed in a mechanical compressor, the compressed steam is condensed and heat is again exchanged with saline water. MVC plants are driven by electric power. The advantage of a MED with a mechanical vapour compressor is that it does not need steam and is very robust, like all MED systems. However, the compressors are expensive, although compressors with a higher compression ratio are now available. A MED–MVC installation requires a large heat transfer surface in order to achieve low power consumption. Large preheaters have to be installed to maintain evaporation at roughly 55–65°C (Trieb, et al., 2010).
Solar stills
Solar stills is a simple type of technology that uses solar energy directly. A transparent cover is fitted over a basin of saline water wherein water evaporates under the influence of solar radiation and condenses on the cover. The dark bottom surface of the still increases the absorption of solar radiation and enhances the evaporation. These stills are used for small-scale applications as the rate of production of water is directly proportional to the area of the still. Typical daily production rates are limited to approximately 4 ℓ/m2 ( (Bouchekima, 2003); (Chandrashekara & Yadav, 2017); (Li, et al., 2013)). Solar stills do not require any auxiliary power, nor any control, and can be erected with cheap and simple construction materials. Feed flow can be kept very low as solar stills can operate with high
12
salt concentrations. This system is advantageous due to its simple operation and few maintenance requirements. This technology is also known as solar distillation.
Multi-effect humidification
The MEH process is based on the same principle as solar stills (Müller-Holst & Schölkopf, 2001). An isolated chamber consists of an evaporator and a condenser section. Hot saline water is distributed on top of the evaporator section, which is constructed with parallel plates. Part of the water evaporates while flowing downward and cooling. At the same time, air flows upwards through natural convection and becomes more humid by absorbing the water vapour. Cold saline water flows from the bottom to the top in the condenser section, exchanging heat with the down-flowing air. Water condenses on the heat exchanger surface and is collected at the bottom. Brine is collected at the bottom of the evaporator section. The saline water is further heated to 85°C by an external heat source like hot water or steam (Trieb, et al., 2010).
Some specifications of the MEH system and its advantages are summarised below:
• A low-temperature heat of 85°C is used for evaporation.
• The absence of moving parts within the distillation chamber ensures low-maintenance demand.
• The sophisticated geometrical design allows easy maintenance and optimum performance at the same time.
• No pretreatment of raw water is needed. The process is insensitive to high salt contents.
• Modular set-up; available sizes comprise units with 1000 ℓ/d, 5000 ℓ/d and 10 000 ℓ/d capacities.
Membrane processes
The purpose of membranes is separating the phase (liquid/vapour) or molecules and ions. For phase-change membranes, the driving force is heat. Evaporation occurs in the membrane due to a difference in vapour pressure on either side of the membrane, thus separating the liquid from the vapour. The other separation process is diffusion: only molecules or ions that are small enough can pass through the pores of the membrane.
The driving force for this separation is a difference in chemical potential, which can either be pressure or electrical voltage. Electrodialysis separates the ions from water by using direct current across the membrane, which is an ion conductor, while the membrane in RO acts like a filter, letting the water molecules through the membrane and leaving the ions of the brine behind. Electric pumps generate the necessary high pressure, up to 70 bar for saline water desalination in RO, while a differential voltage is applied across an electrodialysis membrane.
Electrodialysis
In electrodialysis, the cathode and anode envelop a block of membranes. Two different kinds of membranes are alternated – one which is selective to anions, the other which is selective to cations. Saline water is distributed in the channels between the membranes where the salt in the water ionises when an electrical field is applied. The channels alternate between salt-rich and salt-depleted water. The two streams, distillate and brine, are collected at the bottom of the cell. Electrodialysis processes are generally used only for brackish water desalination. The newest plants have output rates over 20 000 m³/d (Trieb, et al., 2010).
Historically, electrodialysis was cost-prohibitive but has now become a viable alternative to RO for brackish water in the 2000 ppm to 15 000 ppm range of TDS. As opposed to RO, electrodialysis operates at lower pressures, operates quietly, and does not require specialised piping, valves or pumps.

13
The stress on the equipment in the RO process increases running costs; this is reduced in the electrodialysis system. Both systems require clean-in-place to keep membranes free from fouling and scaling. However, unlike RO, there is no drop in the electrodialysis treatment capacity when the system is taken offline for cleaning. Electrodialysis operators can also change the footprint of the plant by running at a higher power, thus reducing the footprint or increasing the number of modules to keep energy consumption low. This is especially advantageous when the footprint or energy are expensive commodities (Westerling, 2015). The advantages and disadvantages are given in Table 4.
Table 4: Advantages and disadvantages of electrodialysis (Westerling, 2015)
Advantages Disadvantages
Turnability* Cannot remove suspended solids, total organic carbon, etc.
Low-pressure operation
Lower life cycle costs
Cleaning
Flexible footprint size
*The ability to change the input and output.
Reverse osmosis
Since their introduction in the late 1950s, RO, nanofiltration, ultrafiltration and microfiltration have been used increasingly in the field of water treatment. Improved performance, reliability and lower operating costs over the years have made membranes the preferred technology for the desalination of saline water, brackish water and waste water. In the last decade, RO desalination has gone through a significant transformation. Currently, most implemented saline water desalination plants use RO technology. Systems of 300 000 m3/day and larger have been built and are in operation in many parts of the world. Desalinated water costs have decreased from USD2.0/m3 to USD0.5/m3 (Trieb, et al., 2010) and capacity is steadily increasing worldwide.
Osmosis is a physical process that takes place when two solutions of different salt concentrations are separated by a semi-permeable membrane. Under normal conditions, water passes from the solution with the higher salt concentration to the lower salt concentration until the hydrostatic pressure difference between the two is equalised. The pressure difference between distilled water and any saline solution, when the flow of water in both directions is identical, is equal to the osmotic pressure of the solution. Applying an external pressure on the concentrated solution, which is larger than the osmotic pressure, causes water to flow from the concentrated solution to the dilute solution through the membrane. This process is called RO. The osmotic pressure is proportional to the salt concentration.
The energy requirements in the RO process originate from the need to pressurise the saline feedwater. Most of the energy lost in this process is due to the release of concentrated brine. For this reason, large-scale RO plants are occasionally equipped with devices that recover that energy with up to 95% efficiency. Fouling and scaling of the osmotic membrane is a problem with RO desalination, and regular costly chemical washing is required. The need for pretreatment of the feedwater also adds to the cost of desalination via RO.
Recently, an increase in RO technology has led to an increase in membrane efficiency and a decrease in energy consumption. These advances have made it possible to build smaller RO plants and intake systems, requiring lower capital investments and operating costs. A summary of the advantages and disadvantages of RO are given in Table 5.
14
Table 5: Advantages and disadvantages of RO
Advantages Disadvantages
Low energy requirements Intensive cleaning
Reliable Slow process
Low operating costs
Recent studies have suggested that using batch processes in RO can save energy in amounts that are comparable to the savings energy recovery technologies achieve. (Werber, et al., 2017) have shown that batch-like processes such as semi-batch RO and two-stage RO have similar energy savings as energy recovery, but that the capital cost, process robustness and energy use should be considered. Energy savings are constrained by the design of conventional RO plants. The main operational concerns in seawater reverse osmosis (SWRO) plants that need to be resolved by pretreatment are:
• Particulate fouling by suspended particles.
• Biofouling by microorganisms caused by nutrients in the feedwater.
• Organic fouling by dissolved organic matter.
• Scaling by sparingly soluble inorganic compounds.
• Oxidation and halogenation by residual chlorine added during the pretreatment.
The type and amount of pretreatment depend on the intake water quality and the desalination process. As surface intakes have to cope with more variable water quality due to seasonal weather conditions and algae blooms, pretreatment is generally more complex and extensive than for subsurface intakes.
Vapour membrane distillation
VMEMD is a newly developed technique that combines distillation via membrane with a MED process. In this new technique, preheated saline water enters into the channel of stage 1, which is enclosed on one side by a condensing non-permeable membrane and on the other side by a hydrophobic but permeable membrane. The condensing membrane of the first stage is heated by hot water or steam. Thus, heat is transferred to the saline water. The pressure of the second stage is lower than in the first stage. Water evaporates through the membrane into the second chamber. This vapour condenses again at the condensing membrane of the second stage, transferring heat to the saline water chamber. The thermal and electric power consumption is the same as for MEDs. Capacities of up to 10 000 m³/d and more can be achieved with serial and parallel arrays of modules (Trieb, et al., 2010).
Shock electrodialysis
In electrodialysis systems, saline feedwater flows through an open channel between an anion and cation exchange membrane. A current is applied to the system, removing salts (anions and cations) from the water. Shock electrodialysis uses an electricity-driven shockwave within a stream of flowing water that pushes saline water to one side and clean water to the other. Figure 6 summarises the process of shock electrodialysis (Chandler, 2015). The main difference between electrodialysis and shock electrodialysis is that the latter does not use a membrane, thus reducing the need for chemicals and cleaning to prevent fouling and scaling. Shock electrodialysis is also less energy-intensive than other desalination methods and requires very little infrastructure, which means it has applications in portable systems.
The process of generating a shockwave of salt water was discovered a few years ago by the group of Juan Santiago (insights.globalspec.com, 2017)) at Stanford University but was done on a small scale

15
on still water. The new system being tested at MIT is a continuous water desalination system using cheap materials that are expected to be easily scalable. To date, the research has produced a laboratory demonstration of the process and a theoretical analysis that explains how the process works. The next step is to scale the system up for practical testing.
Figure 6: Shock electrodialysis (insights.globalspec.com, 2017)
Nanofiltration
Nanotube membranes are arranged and packed like a pile of straws; water molecules can pass through membranes while bacteria, biological material and other impurities cannot. Nanofiltration, a lower-pressure membrane process with high rejection for divalent ions, has been identified as a key component to reduce the costs relating to both pressure and fouling in the desalination process. Lower cost seawater desalination processes have been developed by integrating nanofiltration with various other types of desalination technologies, including RO, forward osmosis, electrodialysis, MSF, MED, membrane distillation and ion exchange.
Other desalination technologies of interest
Forward osmosis
Forward osmosis is a natural process for water transfer through a selectively permeable membrane driven by the osmotic pressure gradient across the membrane (shown in Figure 7). Since it is driven by an osmotic pressure gradient, forward osmosis does not require significant energy input (only for stirring or pumping of solutions). Forward osmosis membranes reject organics, minerals and other solids. Forward osmosis is similar to traditional pressure-driven RO but obviates typical fouling problems. Technical barriers of forward osmosis include:
• Lack of an ideal draw solution that exhibits high osmotic pressure and can be easily regenerated to produce pure water.
• Lack of an optimised membrane to produce a high-water flux comparable to commercial RO membranes.
• A suitable module design to maintain long-term system performance for specific applications.

16
Figure 7: Forward osmosis process (Advanced Purification Engineering Corporation, 2017)
FO: forward osmosis
Membrane distillation
Membrane distillation combines membrane technology and evaporation processing in one unit. It needs both thermal and electrical energy. Water vapours are transported through the hydrophobic membrane pores via the temperature gradient across the membrane (Figure 8). Membrane distillation is an attractive process, offering operation at atmospheric pressure and low temperatures (30–90°C). The technology has the theoretical ability to achieve 100% salt rejection. Membrane distillation is promising and cost-competitive with RO, and thermal energy (heat) is available at low or no cost.
Figure 8: Membrane distillation (Aquaver, 2014)
Thermo-ionic desalination process
In October 2009, Saltworks Technologies ( (saltworkstech.com, 2017), a Canadian firm, announced a process that uses solar or other thermal heat to drive an ionic current that removes all sodium and chlorine ions from the water using ion-exchange membranes. The process employs an innovative thermo-ionic energy conversion system. The energy reduction is achieved by harnessing low-temperature heat and atmospheric dryness to overcome the desalination energy barrier. The system works best in dry regions. The process is illustrated in Figure 9.

17
Figure 9: Thermo-ionic desalination process (saltworkstech.com, 2017)
Low-temperature thermal desalination
Low-temperature thermal desalination (LTTD) involves flashing relatively warm seawater (28–30°C) inside a vacuum flash chamber and condensing the resultant vapour using deep-sea cold water (7–15°C) (Figure 10). The technology was developed in Italy, but the first LTTD plant was built in India. The process can be used for producing drinking water, generating power and supplying air-conditioning.
Figure 10: LTTD ( (Chaudhry, 2013)
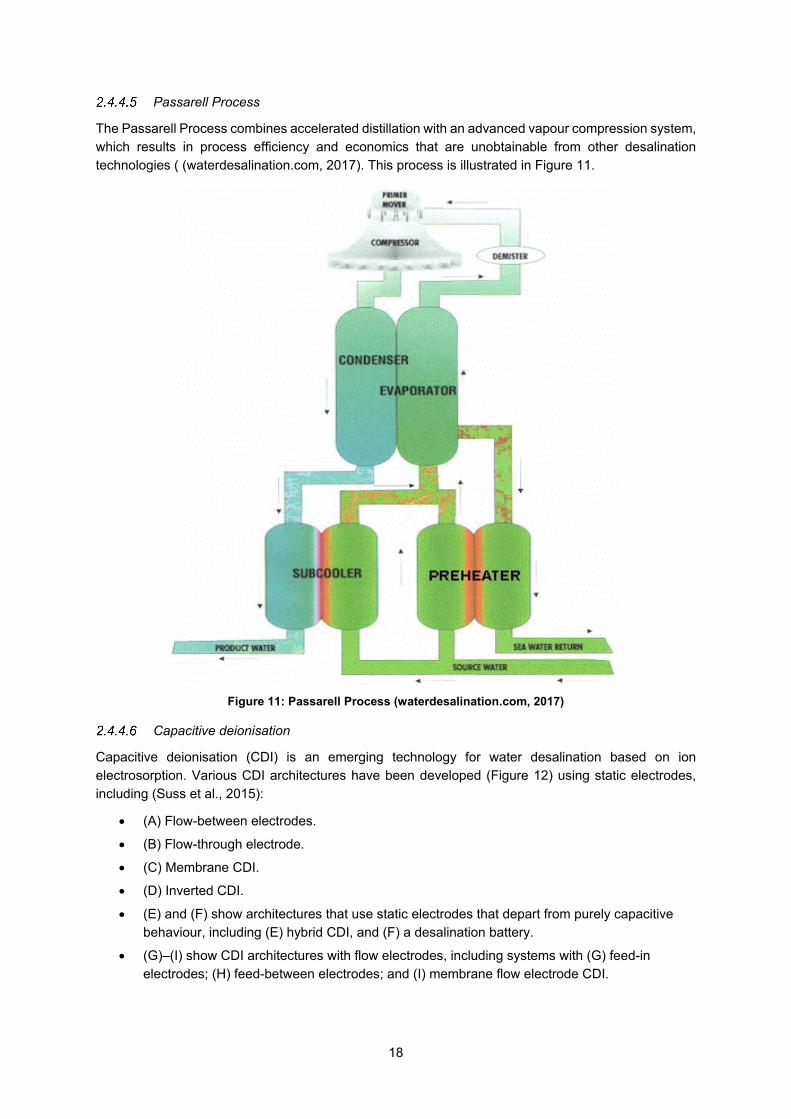
18
Passarell Process
The Passarell Process combines accelerated distillation with an advanced vapour compression system, which results in process efficiency and economics that are unobtainable from other desalination technologies ( (waterdesalination.com, 2017). This process is illustrated in Figure 11.
Figure 11: Passarell Process (waterdesalination.com, 2017)
Capacitive deionisation
Capacitive deionisation (CDI) is an emerging technology for water desalination based on ion electrosorption. Various CDI architectures have been developed (Figure 12) using static electrodes, including (Suss et al., 2015):
• (A) Flow-between electrodes.
• (B) Flow-through electrode.
• (C) Membrane CDI.
• (D) Inverted CDI.
• (E) and (F) show architectures that use static electrodes that depart from purely capacitive behaviour, including (E) hybrid CDI, and (F) a desalination battery.
• (G)–(I) show CDI architectures with flow electrodes, including systems with (G) feed-in electrodes; (H) feed-between electrodes; and (I) membrane flow electrode CDI.
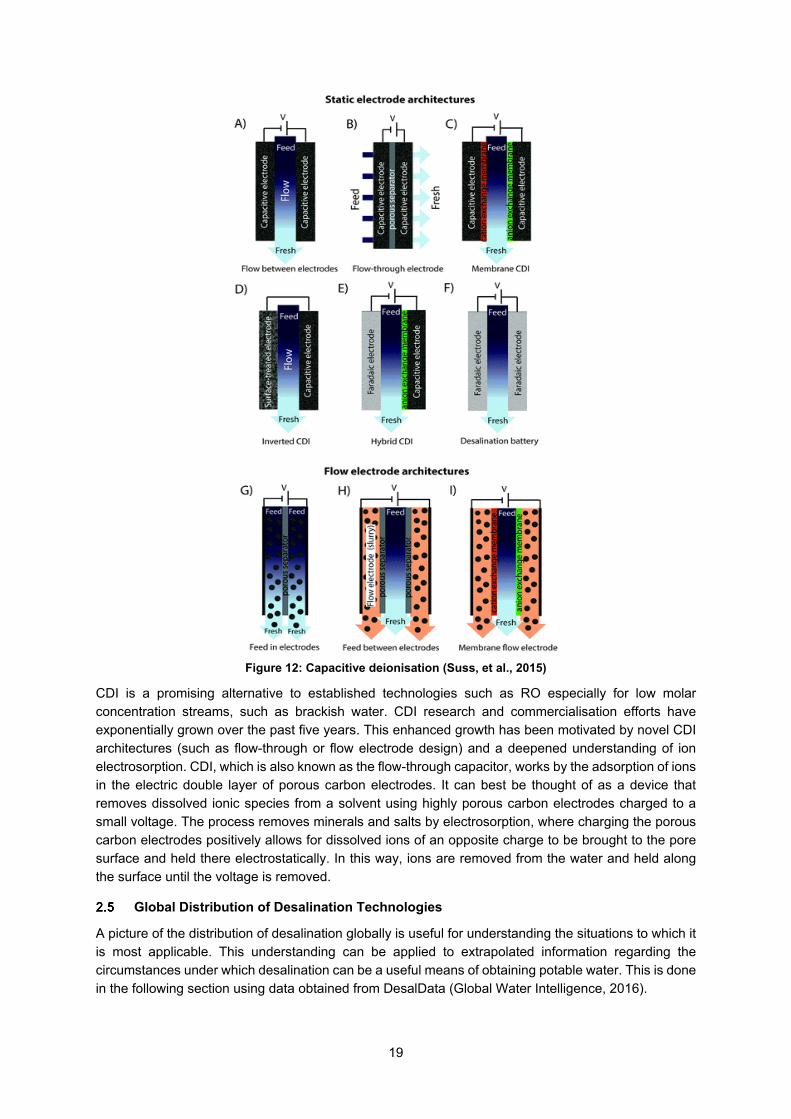
19
Figure 12: Capacitive deionisation (Suss, et al., 2015)
CDI is a promising alternative to established technologies such as RO especially for low molar concentration streams, such as brackish water. CDI research and commercialisation efforts have exponentially grown over the past five years. This enhanced growth has been motivated by novel CDI architectures (such as flow-through or flow electrode design) and a deepened understanding of ion electrosorption. CDI, which is also known as the flow-through capacitor, works by the adsorption of ions in the electric double layer of porous carbon electrodes. It can best be thought of as a device that removes dissolved ionic species from a solvent using highly porous carbon electrodes charged to a small voltage. The process removes minerals and salts by electrosorption, where charging the porous carbon electrodes positively allows for dissolved ions of an opposite charge to be brought to the pore surface and held there electrostatically. In this way, ions are removed from the water and held along the surface until the voltage is removed.
Global Distribution of Desalination Technologies
A picture of the distribution of desalination globally is useful for understanding the situations to which it is most applicable. This understanding can be applied to extrapolated information regarding the circumstances under which desalination can be a useful means of obtaining potable water. This is done in the following section using data obtained from DesalData (Global Water Intelligence, 2016).
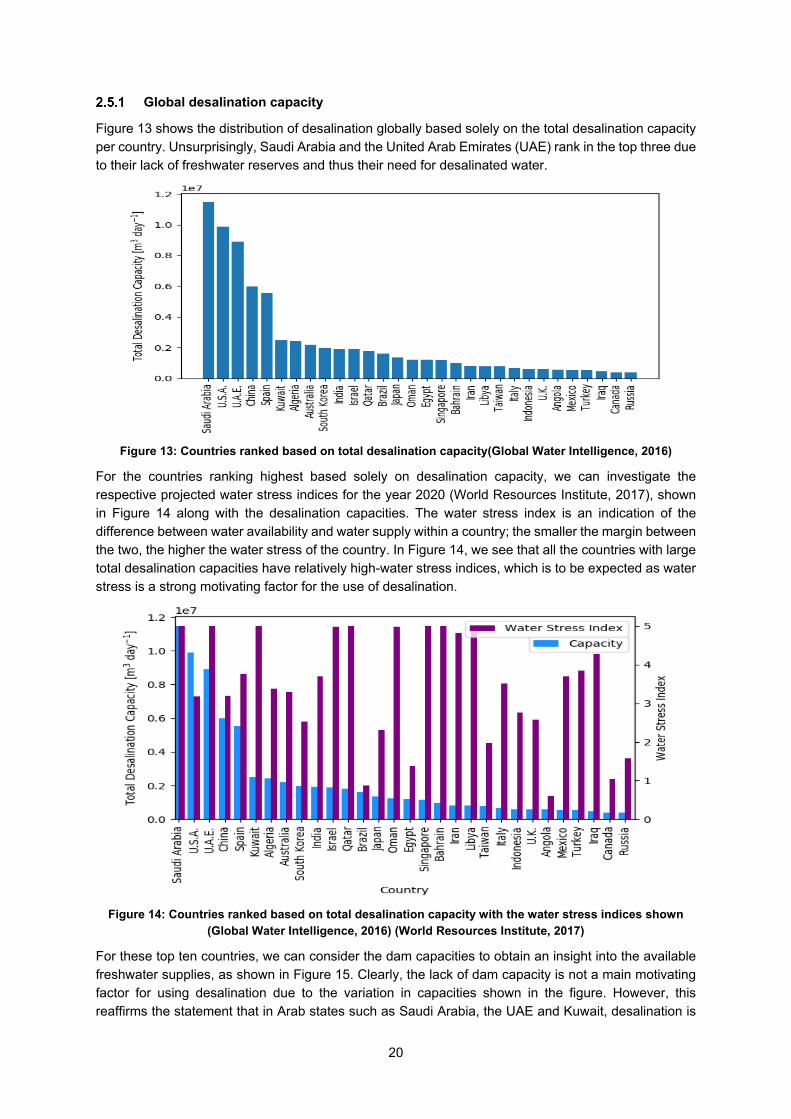
20
Global desalination capacity
Figure 13 shows the distribution of desalination globally based solely on the total desalination capacity per country. Unsurprisingly, Saudi Arabia and the United Arab Emirates (UAE) rank in the top three due to their lack of freshwater reserves and thus their need for desalinated water.
Figure 13: Countries ranked based on total desalination capacity(Global Water Intelligence, 2016)
For the countries ranking highest based solely on desalination capacity, we can investigate the respective projected water stress indices for the year 2020 (World Resources Institute, 2017), shown in Figure 14 along with the desalination capacities. The water stress index is an indication of the difference between water availability and water supply within a country; the smaller the margin between the two, the higher the water stress of the country. In Figure 14, we see that all the countries with large total desalination capacities have relatively high-water stress indices, which is to be expected as water stress is a strong motivating factor for the use of desalination.
Figure 14: Countries ranked based on total desalination capacity with the water stress indices shown
(Global Water Intelligence, 2016) (World Resources Institute, 2017)
For these top ten countries, we can consider the dam capacities to obtain an insight into the available freshwater supplies, as shown in Figure 15. Clearly, the lack of dam capacity is not a main motivating factor for using desalination due to the variation in capacities shown in the figure. However, this reaffirms the statement that in Arab states such as Saudi Arabia, the UAE and Kuwait, desalination is

21
due to the lack of freshwater reserves; therefore, the desalination industry is driven primarily by the need for alternative water sources.
Figure 15: Top ten countries based on total desalination capacity and their corresponding dam capacities
(FAO, 2016) (Global Water Intelligence, 2016)
Rain is a primary source of fresh water; dams often rely on rainfall to maintain a constant and reliable water supply. Precipitation for a country is generally measured in millimetre per year and is therefore normalised. This millimetric measurement is a better indicator of the relative water stress of a country than the volumetric precipitation measurement obtained by multiplying the millimetric value by the country area (Figure 16 and Figure 17).
Figure 16: Countries ranked based on total desalination capacity per mm rainfall (Global Water
Intelligence, 2016) (NationMaster, 2017)

22
Figure 17: Countries ranked based on total desalination capacity per m3 rainfall (Global Water
Intelligence, 2016) (NationMaster, 2017) (World Factbook, 2017)
Other ways to represent the data is as desalination capacity per land area of the respective country or per capita of the country. The total desalination capacities per area and per person are shown in Figure 18 and Figure 19.
Figure 18: Countries ranked based on total desalination capacity per km2 of land area (Global Water
Intelligence, 2016) (World Factbook, 2017)
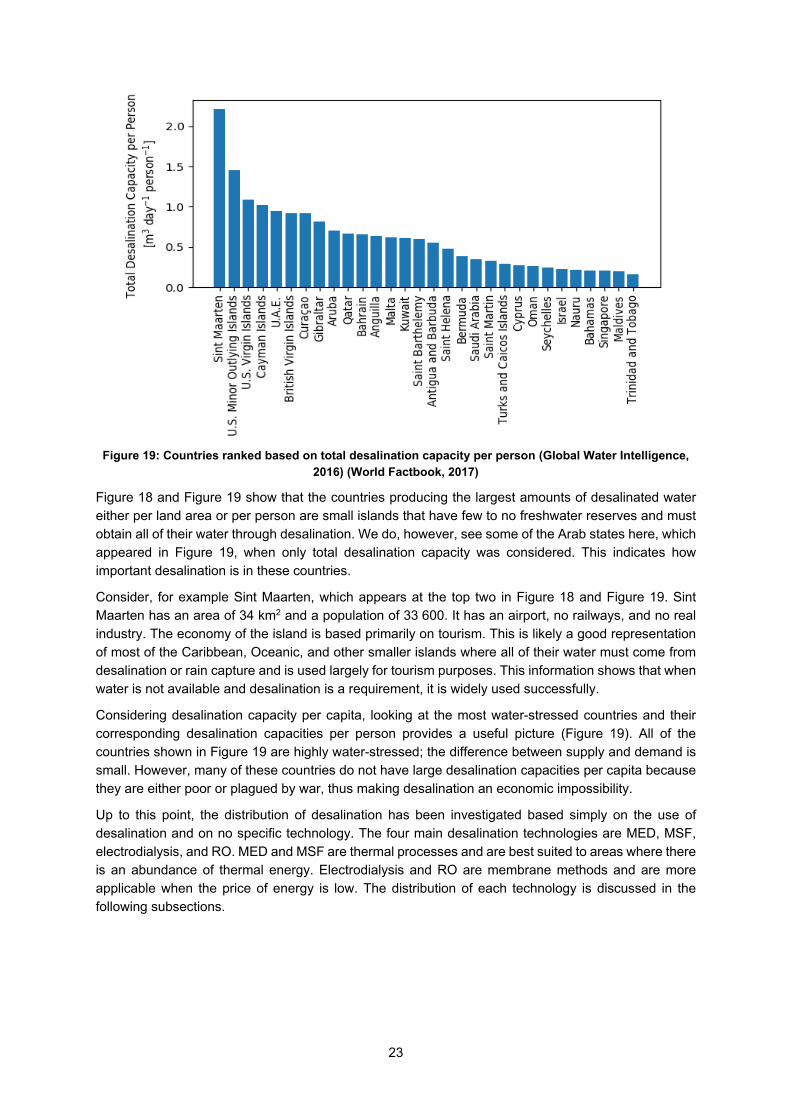
23
Figure 19: Countries ranked based on total desalination capacity per person (Global Water Intelligence,
2016) (World Factbook, 2017)
Figure 18 and Figure 19 show that the countries producing the largest amounts of desalinated water either per land area or per person are small islands that have few to no freshwater reserves and must obtain all of their water through desalination. We do, however, see some of the Arab states here, which appeared in Figure 19, when only total desalination capacity was considered. This indicates how important desalination is in these countries.
Consider, for example Sint Maarten, which appears at the top two in Figure 18 and Figure 19. Sint Maarten has an area of 34 km2 and a population of 33 600. It has an airport, no railways, and no real industry. The economy of the island is based primarily on tourism. This is likely a good representation of most of the Caribbean, Oceanic, and other smaller islands where all of their water must come from desalination or rain capture and is used largely for tourism purposes. This information shows that when water is not available and desalination is a requirement, it is widely used successfully.
Considering desalination capacity per capita, looking at the most water-stressed countries and their corresponding desalination capacities per person provides a useful picture (Figure 19). All of the countries shown in Figure 19 are highly water-stressed; the difference between supply and demand is small. However, many of these countries do not have large desalination capacities per capita because they are either poor or plagued by war, thus making desalination an economic impossibility.
Up to this point, the distribution of desalination has been investigated based simply on the use of desalination and on no specific technology. The four main desalination technologies are MED, MSF, electrodialysis, and RO. MED and MSF are thermal processes and are best suited to areas where there is an abundance of thermal energy. Electrodialysis and RO are membrane methods and are more applicable when the price of energy is low. The distribution of each technology is discussed in the following subsections.

24
Figure 20: Countries ranked based on their water stress indices with total desalination capacity per
person(Global Water Intelligence, 2016) (World Resources Institute, 2017) (World Resources Institute, 2017)
Figure 21 ranks countries based on their total MED desalination capacity. The bigger countries rank highly based on capacity only. Looking at the distribution of the MED desalination plants in Figure 22, we see a concentration of MED plants in the northern parts of Africa and in the Arab states. This is likely due to the abundance of thermal energy in these areas, which can be used for desalination.
Figure 21: Countries ranked based on total MED desalination capacity (Global Water Intelligence, 2016)

25
Figure 22: Map of MED desalination plants globally (Global Water Intelligence, 2016)
To gain additional insight into where and why MED desalination is used, the same figures that were made for desalination as a whole can be made for each desalination technology, which are shown in Figure 23 to Figure 26 for MED.
Figure 23: Countries ranked based on total MED desalination capacity per mm rainfall ( (Global Water
Intelligence, 2016) (NationMaster, 2017))

26
Figure 24: Countries ranked based on total MED desalination capacity per m3 rainfall ( (Global Water
Intelligence, 2016) (NationMaster, 2017) (World Factbook, 2017))
Looking at the capacity for MED desalination per mm rainfall and per volume rainfall in Figure 23 and Figure 24, we see very similar results compared with the global distribution of desalination. This is likely because MED is a versatile technology that can be used for varying scales and feedwater sources without drastic changes to the cost. It is one of the oldest desalination technologies to date and thus has great maturity of technology, which lends itself to its widespread use. The same is true for the MED desalination capacity per area and per capita in Figure 25. In Figure 26, the technology mirrors the results of the total desalination distribution.
Figure 25: Countries ranked based on total MED desalination capacity per km2 land area ( (Global Water
Intelligence, 2016); (World Factbook, 2017))

27
Figure 26: Countries ranked based on total MED desalination capacity per person ( (Global Water
Intelligence, 2016) (World Factbook, 2017))
MSF desalination
MSF is a thermal technology similar to MED, but was the dominant method of desalination prior to the rise of RO desalination (He & Yan, 2009). We see the distribution of MSF based on capacity in Figure 27. The results are similar to MED, which is unsurprising due to the similarities in the technologies.
Figure 27: Countries ranked based on total MSF desalination capacity (Global Water Intelligence, 2016)
The map of MSF plants in Figure 28 is not unlike that for MED, but with fewer plants concentrated in Africa. This is likely because MSF is more energy-intensive than MED and consequently more expensive.

28
Figure 28: Map of MSF desalination plants globally (Global Water Intelligence, 2016)
Figure 29 and Figure 30 show the distributions of MSF technologies per mm and per m3 of rainfall. Figure 31 and Figure 32 show the distributions of MSF technologies per area and per capita. These figures differ from those seen for MED; the Arab states predominate instead of the small islands, which confirms that the cost of this technology and its energy requirements play a large role in determining where it is applied.
Figure 29: Countries ranked based on total MSF desalination capacity per mm of rainfall ( (Global Water
Intelligence, 2016) (NationMaster, 2017))

29
Figure 30: Countries ranked based on total MSF desalination capacity per m3 rainfall ( (Global Water
Intelligence, 2016) (NationMaster, 2017) (World Factbook, 2017))
Figure 31: Countries ranked based on total MSF desalination capacity per km2 land area ( (Global Water
Intelligence, 2016) (World Factbook, 2017))

30
Figure 32: Countries ranked based on total MSF desalination capacity per person ( (Global Water
Intelligence, 2016) (World Factbook, 2017))
Electrodialysis desalination
Electrodialysis desalination is a membrane technology. The distribution of this technology is therefore expected to differ from that of the thermal methods. The price of electricity, rather than the availability of thermal energy, is an important factor in determining the location of membrane plants. Electrodialysis specifically is often used on a smaller scale than other technologies; subsequently, its distribution can appear much more random. The countries that rank highest for electrodialysis desalination capacity are shown in Figure 33, and the map of plants is shown in Figure 34. The distribution appears to be much more widespread with large varieties of countries and regions making an appearance in the data set; this is likely because the scale of the plants is smaller and because this technology is used in specific industries or for very specific applications.
Figure 33: Countries ranked based on total electrodialysis desalination capacity (Global Water
Intelligence, 2016)

31
Figure 34: Map of electrodialysis desalination plants globally (Global Water Intelligence, 2016)
The same trend is seen in Figure 35 to Figure 38, where the distribution of electrodialysis per mm of rainfall, per m3 of rainfall, per area, and per capita are shown. We see more wealthy countries ranking highly for their electrodialysis desalination capacities. Looking specifically at the per capita graph in Figure 35, electrodialysis capacities per person are very clearly an order of magnitude smaller than MED or MSF capacities per person.
Figure 35: Countries ranked based on total electrodialysis desalination capacity per mm of rainfall (
(Global Water Intelligence, 2016); (NationMaster, 2017))

32
Figure 36: Countries ranked based on total electrodialysis desalination capacity per m3 rainfall ( (Global
Water Intelligence, 2016); (NationMaster, 2017); (World Factbook, 2017))
Figure 37: Countries ranked based on total electrodialysis desalination capacity per km2 land area (
(Global Water Intelligence, 2016); (World Factbook, 2017))
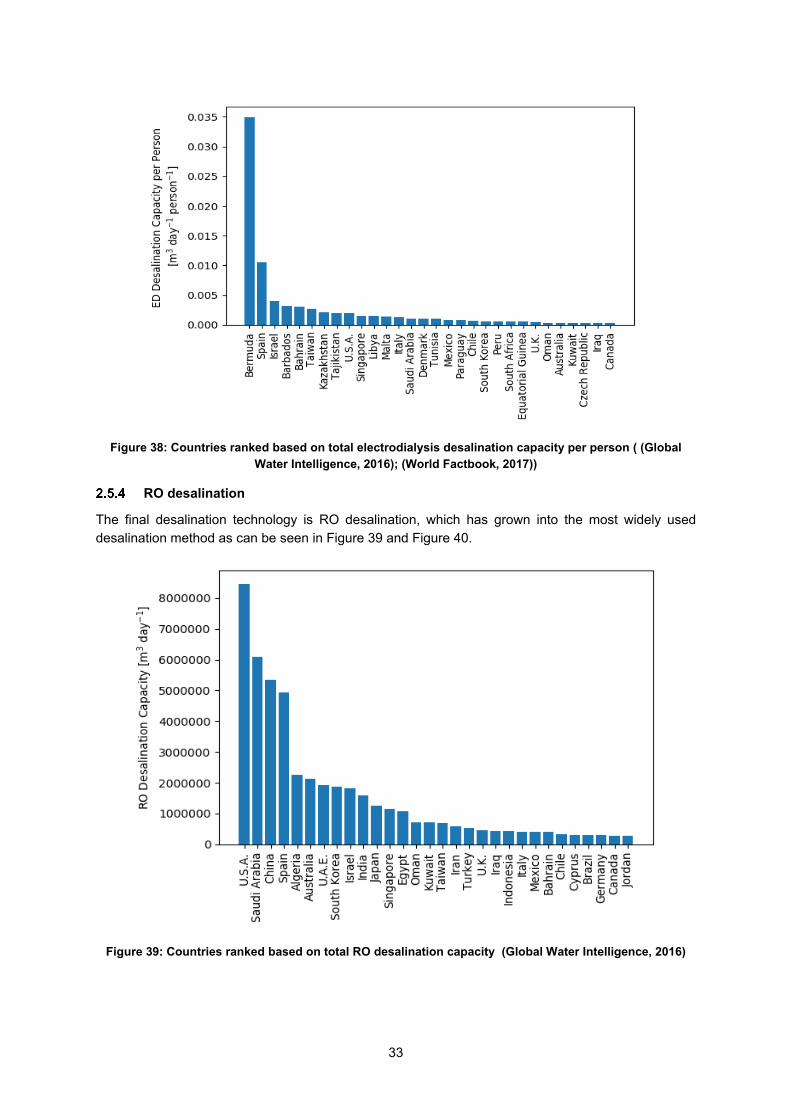
33
Figure 38: Countries ranked based on total electrodialysis desalination capacity per person ( (Global
Water Intelligence, 2016); (World Factbook, 2017))
RO desalination
The final desalination technology is RO desalination, which has grown into the most widely used desalination method as can be seen in Figure 39 and Figure 40.
Figure 39: Countries ranked based on total RO desalination capacity (Global Water Intelligence, 2016)

34
Figure 40: Map of RO desalination plants globally (Global Water Intelligence, 2016)
The distributions of RO per mm of rainfall and per m3 of rainfall are shown in Figure 41 and Figure 42. We observe a good distribution of regions, indicating the widespread use of RO throughout the world.
Figure 41: Countries ranked based on total RO desalination capacity per mm rainfall ( (Global Water
Intelligence, 2016); (NationMaster, 2017))
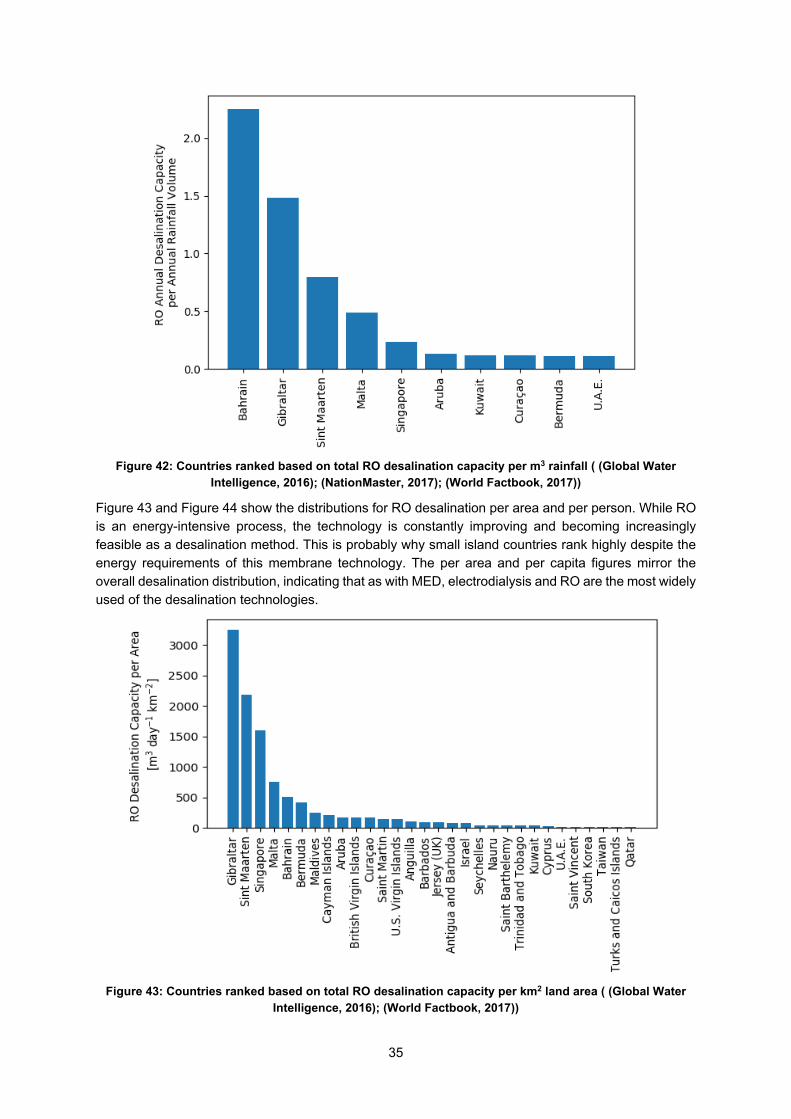
35
Figure 42: Countries ranked based on total RO desalination capacity per m3 rainfall ( (Global Water
Intelligence, 2016); (NationMaster, 2017); (World Factbook, 2017))
Figure 43 and Figure 44 show the distributions for RO desalination per area and per person. While RO is an energy-intensive process, the technology is constantly improving and becoming increasingly feasible as a desalination method. This is probably why small island countries rank highly despite the energy requirements of this membrane technology. The per area and per capita figures mirror the overall desalination distribution, indicating that as with MED, electrodialysis and RO are the most widely used of the desalination technologies.
Figure 43: Countries ranked based on total RO desalination capacity per km2 land area ( (Global Water
Intelligence, 2016); (World Factbook, 2017))

36
Figure 44: Countries ranked based on total RO desalination capacity per person ( (Global Water
Intelligence, 2016); (World Factbook, 2017))
Analysis of Costs of Desalination Technologies
Capital costs
The cost of desalination depends on the technology and the feedwater being used; water with a lower salinity content will be cheaper to purify. This means that desalinating a brackish water source is less expensive than desalinating a saltwater source. The graphs of capital cost per capacity against capacity for the respective technologies are shown in the following set of figures. The capital costs have all been scaled to the year 2016 using CEPCI1 indices.
Figure 45 and Figure 46 show the cost data for MED and MSF desalination. It is clear that these two technologies are very similar in cost, and that there is a clear separation between the desalination of brackish water and seawater. A further trend in the data is that as the capacity increases in order of magnitude, the capital cost per capacity decreases gradually, with a nearly 10% decrease in cost per order-of-magnitude increase in capacity. It is clearly visible for seawater desalination. However, due to the limited data, no real claims can be made for brackish water desalination.
1 Chemical Engineering Plant Cost Index

37
Figure 45: Capital cost per capacity versus capacity for MED technology, where capital cost is in USD
and capacity in m3 per day, for both brackish and seawater sources (Global Water Intelligence)
Figure 46: Capital cost per capacity versus capacity for MSF technology, where capital cost is in USD
and capacity in m3 per day, for both brackish and seawater sources (Global Water Intelligence)
To comment on the sizes of the plants, the size distributions for MED are shown in two figures: the total size distribution in Figure 47, and seawater and brackish water desalination distribution in Figure 48.
Figure 47: Size distribution for MED desalination plants, both seawater and brackish water feed sources
(Global Water Intelligence)

38
Figure 48: Size distributions for MED desalination plants for brackish and seawater feed sources
separately (Global Water Intelligence)
A clear distinction between sizes of seawater and brackish water MED plants is visible; the brackish water plants are significantly smaller on average. The size distribution for MSF is shown in Figure 49; only the combined distribution is shown as there are insufficient brackish water data points for plotting them separately. The average size of an MSF plant is significantly larger than an MED plant.
Figure 49: Size distribution for MSF desalination plants, both seawater and brackish water feed sources
(Global Water Intelligence)
The cost data for electrodialysis and RO are shown in Figure 50 and Figure 51. While the thermal methods, MED and MSF, are used predominantly for seawater desalination, the membrane methods, electrodialysis and RO, are used more for brackish water desalination. This is likely due to the cost associated with treating the water: with thermal methods, the cost is not highly dependent on the TDS and both brackish and seawater sources can be treated for similar prices. However, membrane methods are sensitive to the quality of the feed source and the cost increases for high TDS.
Figure 50 show that the capacities of electrodialysis plants are significantly lower than those of MED and MSF. Figure 51 show that the capacities of RO plants are similar to those of MED and MSF at

39
similar costs. We again observe the decrease in cost with an increase in capacity and that seawater desalination is more expensive than brackish water for the same capacities.
Figure 50: Capital cost per capacity versus capacity for electrodialysis technology, where capital cost is in USD and capacity in m3 per day, for both brackish and seawater sources (Global Water Intelligence)
Figure 51: Capital cost per capacity versus capacity for RO technology, where capital cost is in USD and
capacity in m3 per day, for both brackish and seawater sources (Global Water Intelligence)
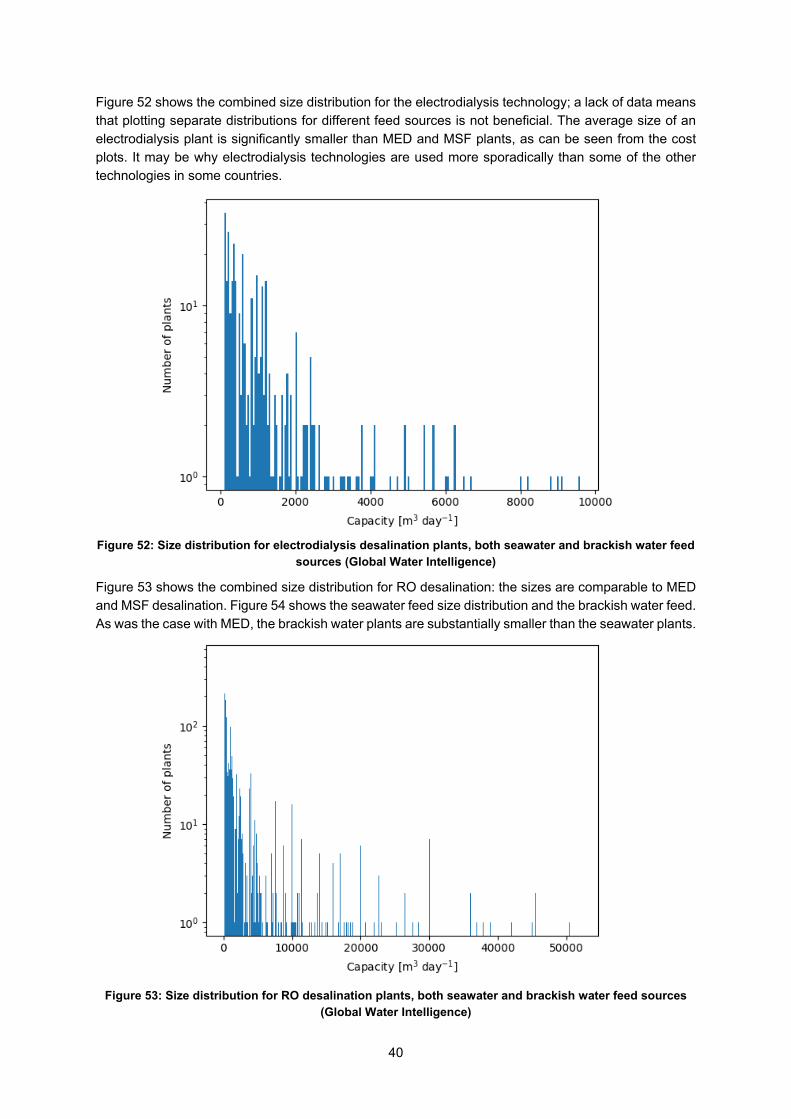
40
Figure 52 shows the combined size distribution for the electrodialysis technology; a lack of data means that plotting separate distributions for different feed sources is not beneficial. The average size of an electrodialysis plant is significantly smaller than MED and MSF plants, as can be seen from the cost plots. It may be why electrodialysis technologies are used more sporadically than some of the other technologies in some countries.
Figure 52: Size distribution for electrodialysis desalination plants, both seawater and brackish water feed
sources (Global Water Intelligence)
Figure 53 shows the combined size distribution for RO desalination: the sizes are comparable to MED and MSF desalination. Figure 54 shows the seawater feed size distribution and the brackish water feed. As was the case with MED, the brackish water plants are substantially smaller than the seawater plants.
Figure 53: Size distribution for RO desalination plants, both seawater and brackish water feed sources
(Global Water Intelligence)

41
Figure 54: Size distributions for RO desalination plants for brackish and seawater feed sources
separately (Global Water Intelligence)
It is interesting to note the difference in size between the seawater and brackish water desalination plants and the consistent differences in the sizes regardless of the desalination technology being used. Regardless of technology, the differences in the costs between brackish and seawater desalination remain relatively constant. This is unexpected as membrane methods are more sensitive to feed source than thermal methods. It would have been unsurprising for the cost of desalinating brackish and seawater via MED or MSF to be significantly more similar than the comparative costs for electrodialysis or RO.
Turnkey cost breakdown
The baseline for water cost computation has been widely discussed. In particular, the fluctuation in the costs of materials and energy has in turn become a major factor in determining the method and the technology to be used. The capital cost of desalination, particularly as far as thermal technologies are concerned, is primarily governed by the cost of material. Table 6 shows the costs and the individual items’ contribution to the overall project cost. Table 6 provides a further breakdown of civil and mechanical cost components. The evaporator itself comprises the greater part of the costs of a thermal desalination plant. This includes all the construction material of the desalination vessel, which in turn includes all the prefabrication activities at the workshop, such as preparing and cutting the stainless or duplex steel sheets, and preassembling and constructing the modules and welding materials.
The capital expenditure (capex) for an SWRO plant is far more variable than for thermal plants. It depends on the quality of the seawater at the site, the degree of availability of the SWRO plant, and the trade-off between operating and capex. For instance, an increase in the seawater abstraction system costs may result in a decrease in the pretreatment system; and an increase in capex may result in a decrease in operating expenditure.
Table 6 shows a typical membrane desalination cost breakdown. When comparing thermal and SWRO data, it should be noted that there could be a geographical bias as the data is averaged. Also, most thermal plants are located in the Middle East. Ocean conditions and environmental regulations can further influence and skew the data.
The values below can vary considerably depending on the specific case. The values are determined by sea conditions, water quality and environmental requirements. A desalination plant’s seawater intake and concentrate outfall can significantly affect a facility’s capital and operating costs. Their designs pose significant engineering and environmental challenges, which often are the determining factor as to whether a plant is economically viable.

42
Table 6: Thermal desalination typical cost breakdown (Sommariva, 2009)
Plant component Cost percentage Seawater (offshore) intake civil works 8.5% Seawater (onshore) intake civil works 13.0% Outfall civil works 2.0% Desalination plant mechanical 50.0% Seawater mechanical system 3.5% Balance of plant mechanical 4.0% Electrical works 5.0% Control and instrumentation works 4.0% External fees (legal, financial etc.) 1.5% Development cost 4.0% Insurance and initial working capital 0.5% Contingency 4.0%
Table 7: Membrane desalination typical cost breakdown (Sommariva, 2009)
Plant component Cost percentage Seawater (offshore) intake civil works 15.0% Seawater (onshore) intake civil works 7.0% Outfall civil works 3% Desalination plant mechanical and membranes 38.0% Seawater mechanical system 6.0% Balance of plant mechanical 7.0% Electrical works 6.0% Control and instrumentation works 9.0% External fees (legal, financial etc.) 1.0% Development cost 3.0% Insurance and initial working capital 0.5% Contingency 4.0%
Commercial generation tariffs
The tariff at production may differ from the tariff at households to a great extent. It may be possible that the tariffs at production points may be incongruent with each other because of different construction times, different technology and market demand. Therefore, the generation tariffs unavoidably differ from one development to another. It should be further considered that the power and water sectors are traditionally susceptible to political and regulatory interventions. In this respect, the role of the regulatory bodies is to provide harmony between the tariffs at the production points and the bulk tariffs to the end users along with the provision for subsidies.
Figure 55 shows the prevailing water tariff at the production point for projects in the Mediterranean and Middle East. For uniformity, the tariffs have been converted to USD/m3. The tariff trend reflects the behaviour of the specific capex item. Generally, the tariffs contain an investment rate of return ranging from 8% for the Mediterranean projects to 13%, which is the value typically assumed in the Middle East. Tariffs are also heavily dependent on the energy price.

43
Figure 55: Commercial generation tariffs (Sommariva, 2009)

44
Summary
Desalination is not a proverbial silver bullet solution to our country’s sustainable water future. There are specific applications, however, especially in water-stressed areas with limited alternatives where desalination is likely to play an important role in the longer-term solution. When considering desalination, it is important to consider the economic activity of the area/basin where it is applied and, specifically, the level of resilience of that area to water shortages, as well as the economic impacts that could be unlocked through access to a more secure, less variable water supply. In these areas, certain economic activities can be secured and expanded by implementing desalination together with other interventions.
Application of desalination in coastal areas also needs to be considered in terms of what coastal water security and the augmentation/displacement of inland freshwater supply means for retaining and alternative uses of water in the inland areas. As an example, expansion of inland irrigation schemes and associated agriculture may currently not be possible because coastal water demand is receiving priority. When coastal demand is served through desalination, it may be possible to unlock enhanced inland economic activity.
Key issues on the implementation of desalination in South Africa
Planning aspects
When considering how desalination should fit into in South Africa’s greater water management plans, the motivation for employing desalination, source location, availability of water for desalination, mineral content of recoverable water, and the disposal of brines are key considerations. Although technological advances over the past 50 years have reduced the costs of desalination, which led to dramatic increases in its use worldwide, a host of financial, regulatory, socio-economic, and environmental factors still impede its use.
Desalinated seawater is generally considered an expensive alternative water resource. The installation of large-scale desalination facilities globally has attracted significant public criticism in the past, specifically in instances where desalination facilities were motivated by droughts. When the drought is broken during the construction of or shortly after commissioning the desalination plant, the plant is in some cases decommissioned or deemed too expensive to operate and regarded as an unnecessary burden in terms of its regular maintenance and upkeep cost.
In the case of seawater desalination, however, the feed to the facility is abundant and therefore an alternative freshwater supply from the facility can be predicted and assured with a high level of certainty. Such desalination should therefore not only be considered an alternative source of fresh water, but an assured alternative. In an area where the climate is extremely variable, desalination can reduce the peaks and troughs in the availability of water. Because regional activities such as agriculture are heavily reliant on fresh water and have a limited resilience to water supply shortages, the economic effects of a reduction in variability and access to adequate reserve margins can be significant.
Currently, no coherent policies are being developed to address the effects of water on energy production, causing more complex decision-making. An integrated, strategic approach can guide technology research, development, demonstration and deployment (RDD&D) to address regional water-energy issues, yielding information that can be applicable nationally and globally. Enhancing and integrating data and models will better inform researchers, decision makers, and the public. The relationship between water, energy and climate change in the context of desalination is critical and requires careful balancing. The current drought crisis and plans for large-scale desalination present an opportunity for integrating water, energy and climate change aspects in desalination planning and decision-making. Systematically balancing the relationships between water, energy and climate change can contribute to the increased sustainability and resilience of desalination as a water supply option.
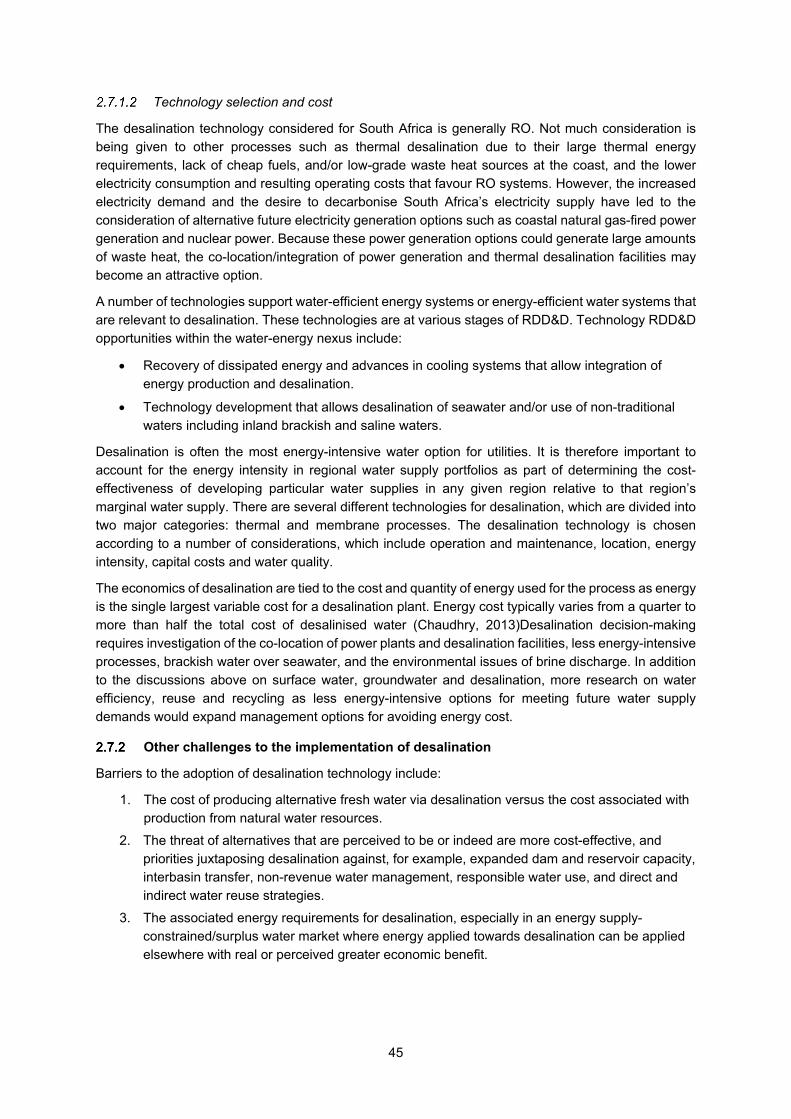
45
Technology selection and cost
The desalination technology considered for South Africa is generally RO. Not much consideration is being given to other processes such as thermal desalination due to their large thermal energy requirements, lack of cheap fuels, and/or low-grade waste heat sources at the coast, and the lower electricity consumption and resulting operating costs that favour RO systems. However, the increased electricity demand and the desire to decarbonise South Africa’s electricity supply have led to the consideration of alternative future electricity generation options such as coastal natural gas-fired power generation and nuclear power. Because these power generation options could generate large amounts of waste heat, the co-location/integration of power generation and thermal desalination facilities may become an attractive option.
A number of technologies support water-efficient energy systems or energy-efficient water systems that are relevant to desalination. These technologies are at various stages of RDD&D. Technology RDD&D opportunities within the water-energy nexus include:
• Recovery of dissipated energy and advances in cooling systems that allow integration of energy production and desalination.
• Technology development that allows desalination of seawater and/or use of non-traditional waters including inland brackish and saline waters.
Desalination is often the most energy-intensive water option for utilities. It is therefore important to account for the energy intensity in regional water supply portfolios as part of determining the cost-effectiveness of developing particular water supplies in any given region relative to that region’s marginal water supply. There are several different technologies for desalination, which are divided into two major categories: thermal and membrane processes. The desalination technology is chosen according to a number of considerations, which include operation and maintenance, location, energy intensity, capital costs and water quality.
The economics of desalination are tied to the cost and quantity of energy used for the process as energy is the single largest variable cost for a desalination plant. Energy cost typically varies from a quarter to more than half the total cost of desalinised water (Chaudhry, 2013)Desalination decision-making requires investigation of the co-location of power plants and desalination facilities, less energy-intensive processes, brackish water over seawater, and the environmental issues of brine discharge. In addition to the discussions above on surface water, groundwater and desalination, more research on water efficiency, reuse and recycling as less energy-intensive options for meeting future water supply demands would expand management options for avoiding energy cost.
Other challenges to the implementation of desalination
Barriers to the adoption of desalination technology include:
1. The cost of producing alternative fresh water via desalination versus the cost associated with production from natural water resources.
2. The threat of alternatives that are perceived to be or indeed are more cost-effective, and priorities juxtaposing desalination against, for example, expanded dam and reservoir capacity, interbasin transfer, non-revenue water management, responsible water use, and direct and indirect water reuse strategies.
3. The associated energy requirements for desalination, especially in an energy supply-constrained/surplus water market where energy applied towards desalination can be applied elsewhere with real or perceived greater economic benefit.
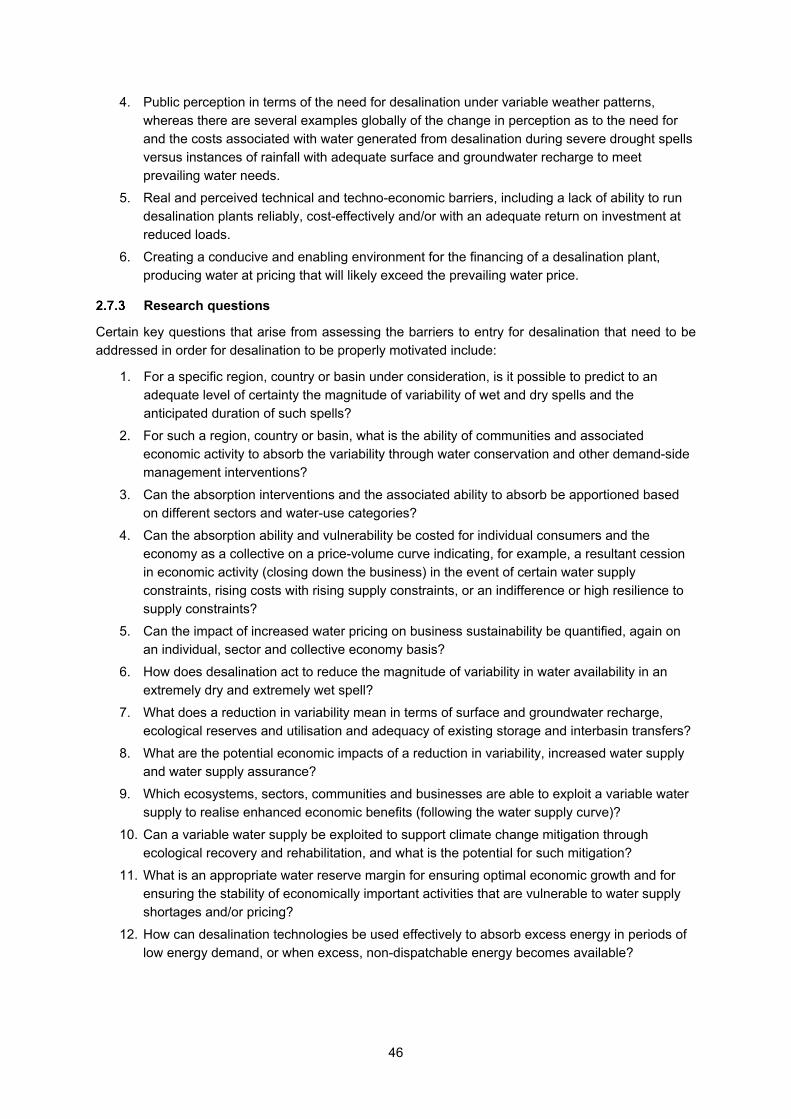
46
4. Public perception in terms of the need for desalination under variable weather patterns, whereas there are several examples globally of the change in perception as to the need for and the costs associated with water generated from desalination during severe drought spells versus instances of rainfall with adequate surface and groundwater recharge to meet prevailing water needs.
5. Real and perceived technical and techno-economic barriers, including a lack of ability to run desalination plants reliably, cost-effectively and/or with an adequate return on investment at reduced loads.
6. Creating a conducive and enabling environment for the financing of a desalination plant, producing water at pricing that will likely exceed the prevailing water price.
Research questions
Certain key questions that arise from assessing the barriers to entry for desalination that need to be addressed in order for desalination to be properly motivated include:
1. For a specific region, country or basin under consideration, is it possible to predict to an adequate level of certainty the magnitude of variability of wet and dry spells and the anticipated duration of such spells?
2. For such a region, country or basin, what is the ability of communities and associated economic activity to absorb the variability through water conservation and other demand-side management interventions?
3. Can the absorption interventions and the associated ability to absorb be apportioned based on different sectors and water-use categories?
4. Can the absorption ability and vulnerability be costed for individual consumers and the economy as a collective on a price-volume curve indicating, for example, a resultant cession in economic activity (closing down the business) in the event of certain water supply constraints, rising costs with rising supply constraints, or an indifference or high resilience to supply constraints?
5. Can the impact of increased water pricing on business sustainability be quantified, again on an individual, sector and collective economy basis?
6. How does desalination act to reduce the magnitude of variability in water availability in an extremely dry and extremely wet spell?
7. What does a reduction in variability mean in terms of surface and groundwater recharge, ecological reserves and utilisation and adequacy of existing storage and interbasin transfers?
8. What are the potential economic impacts of a reduction in variability, increased water supply and water supply assurance?
9. Which ecosystems, sectors, communities and businesses are able to exploit a variable water supply to realise enhanced economic benefits (following the water supply curve)?
10. Can a variable water supply be exploited to support climate change mitigation through ecological recovery and rehabilitation, and what is the potential for such mitigation?
11. What is an appropriate water reserve margin for ensuring optimal economic growth and for ensuring the stability of economically important activities that are vulnerable to water supply shortages and/or pricing?
12. How can desalination technologies be used effectively to absorb excess energy in periods of low energy demand, or when excess, non-dispatchable energy becomes available?

47
CHAPTER 3: DESALINATION WITHIN THE WATER-ENERGY-CLIMATE CHANGE CONTEXT
Introduction
South Africa, as is the case with most developing countries, is experiencing significant urbanisation and population growth – specifically in water-constrained coastal areas. In general, four interrelated processes drive water stresses:
• Population growth.
• Economic growth.
• Increased demand for food, feed and energy (of which biofuel is one source).
• Increased climate variability.
Choices must be made about how to share, allocate and reallocate the increasingly scarce water – within sectors, from one user group to another, and between sectors. Desalination has emerged in South Africa as a key part of a systemic solution to these risks and challenges, largely because of the (i) lowering costs of RO, and (ii) the drought combined with fears of continued climate and other changes affecting rainfall and its distribution. Connected to (ii) is the fact that (iii) the costs or damage to a society that suffers water shortages that can be avoided is usually a multiple of the investment costs. Thus, it is anticipated that reduced inland economic activity could further result in some migration to coastal areas – further constraining their water resources.
The existing water delivery infrastructure is already constrained and, in many instances, requires significant investment in maintenance and upgrades due to its mature service life. The continued expansion of the natural freshwater infrastructure to deliver water to these coastal regions is placing mounting stress on ecological reserves and catchment areas. Coastal cities therefore face numerous water supply challenges, related not only to climate change but also to population growth, the maintenance and upgrading of infrastructure, and eroding reserve margins.
Water is increasingly a critical factor in decisions regarding the location of economic activities. In sectors such as industry, mining, power, export-oriented agriculture and tourism, investment decisions are increasingly made with the certainty of supply of water as a key consideration. Lower risks and an independence of supply from climate and weather mean the costs of capital and risks of agricultural and other investment are lowered. Public and private sector investment in water supply infrastructure, including desalination and other water supply alternatives, relies on the adequate recovery of costs through a water tariff. It is hence critically important that water tariffs should reflect costs, consider water demand profiles and reserves, and structure adequate incentives for responsible water use and penalties for wastage. The availability and associated assurance have to consider appropriate water reserve margins, drought mitigation strategies and initiatives to secure and expand economic activity. While desalination has historically been prohibitively expensive, technological improvements and the rising cost of conventional water supplies are making desalination increasingly viable.
The value of desalination lies not only in the provision of an assured source of drinking water but also in the potential offsetting of existing domestic water use to allow for the expansion of water use in other sectors, notably agriculture. One should carefully consider the impact of water supply constraints on sector development and specifically the linkages between the water, agricultural and agro-processing sectors. Water management consists of allocating scarce water resources whose supply levels are appropriately certain to competing water uses. In many parts in the world, increasing pressures on water resources are leading to a shortage of water to satisfy all needs. Accordingly, desalination should theoretically have a function in a balanced water supply portfolio in which more favourable economically and environmentally feasible alternatives have been developed. Considering the feasibility of desalination should include evaluating the risk premium and resulting pricing for alternative bulk supply sources.

48
Seen from an economic perspective, the core function of desalination will be to ensure the security of supply, albeit at elevated cost. It has to consider how the process of economic development could justify new desalination plants over time as plant and energy costs come down (solar power, for example) and as productivity in water-intensive activities rises. The high desalination costs are probably modest in comparison with the potential and actual drought damage to gardens, parks and sports grounds, not to mention its concomitant economic and insecurity damage. However, these costs are generally not considered when comparing the cost of conventional water resources with the cost of desalination.
1. How can the greenhouse gas emissions associated with the energy used for desalination be avoided by using supportive non-carbon-based energy sources?
2. Where does desalination fit in a regional, country and basin or water management area (WMA) relative to competing water supply and demand-side alternatives, including aspects such as security of supply, accessibility and cost as well as sustainability?
Policy and Legislative Context for the Water-Energy-Climate Change Nexus
As a signatory to the UN Framework Convention on Climate Change (UNITED NATIONS, 1992), the Paris Agreement and the Kyoto Protocol ( (UNFCCC, 1997), South Africa has made a voluntary commitment to combat climate change. The country aims to reduce greenhouse gas emissions by 34% by 2020 and 42% by 2025 compared with the business-as-usual scenario. At the same time, South Africa is also developing a national adaptation strategy based on latest research findings. The National Development Plan (NDP) (National Planning Commission, 2011) stipulates a peak, plateau and decline trajectory for greenhouse gas emissions, with the peak being reached around 2025. By 2030, an economy-wide carbon price should be entrenched and a zero emission building standard be enforced. Considering the proposed carbon tax, the carbon intensity of energy sources is an important consideration.
It is likely that climate change is expected to put additional strain on water provision. This, along with the drive to provide energy for all, will result in an increased demand for water if the current means of energy production are continued. The provision of water to all citizens of South Africa is inherent to many of the country’s policies. Desalination is one of the means of achieving this objective. The WRC-commissioned study The Water-Energy Nexus in the Context of Climate Change recommends a policy framework that links (or ensures a balance between) efficient water use and energy production under changing climatic conditions.
Appendix B provides a list of some of the key policies, legislation and development plants considered in this study, with a specific focus on requirements in the context of desalination.
Solutions for Energy-Efficient Desalination
Overview
Energy and water are intricately connected; desalination is no exception. Seawater desalination as a water supply option requires energy to pressurise water for membrane desalination or for heating or freezing water for thermal methods. Water and energy use both affect and depend on ecosystems. Similarly, climate change affects the availability and use of both water and energy. Water, energy and climate change are inextricably linked. Sustainable solutions must consider these aspects holistically.
Desalination is energy-intensive and the cost of desalinated water is closely linked to energy prices. In water-constrained regions where desalination is widely applied, it could contribute significantly to local energy consumption. Consequently, if the energy demand profile of desalination can be shaped, it could become a technology that is suitable as a means of energy storage/demand-side management. Hence, if desalination is conducted at times when the energy supply exceeds demand, it may improve operational stability and efficiency, utilisation factors and, subsequently, the capital recovery of the

49
energy generation plant. Conversely, the application of intermittent desalination would adversely affect the capital recovery of the desalination plant, which could negatively influence the desalination plant’s life, operability and efficiency. In this context, the question becomes whether the energy producer or the desalination plant (or both, in combination) is capable of and should be operated as swing producer. The sections that follow cover some of the of the key approaches for ensuring energy efficiency during desalination.
Energy recovery in RO desalination plants (Veolia South Africa)
The use of energy recovery devices in RO desalination plants can reduce electrical energy consumption by 20–50%. Electricity comprises over 50% of a desalination plant’s operating costs. Roughly 70% of this electricity is consumed by the high-pressure RO pumps as illustrated in Figure 56.
Figure 56: Electrical energy use in desalination plants ( (WRC, n.d.)
SW: Seawater
Brine streams exiting the RO membranes are at high pressure; hence, hydraulic energy can be recovered from these streams prior to discharge. Some recovery options are illustrated in Figure 57.
Figure 57: Hydraulic energy recovery ( (WRC, n.d.)
ERD: Energy recovery device
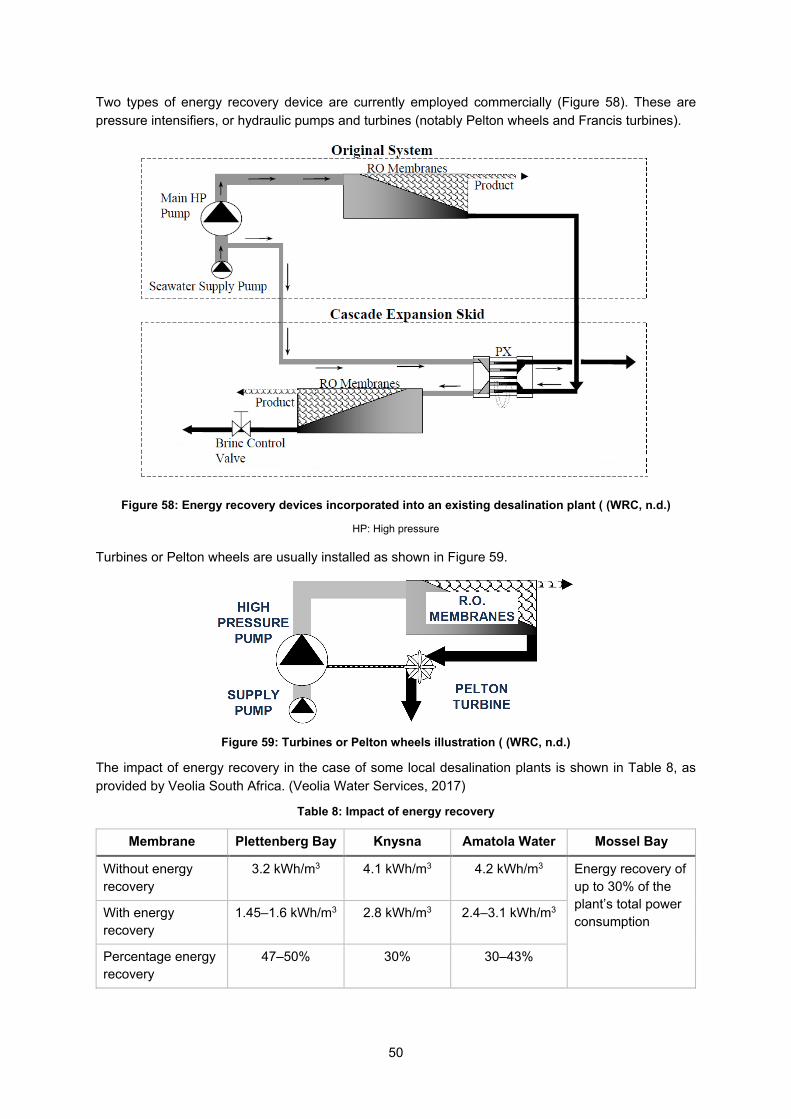
50
Two types of energy recovery device are currently employed commercially (Figure 58). These are pressure intensifiers, or hydraulic pumps and turbines (notably Pelton wheels and Francis turbines).
Figure 58: Energy recovery devices incorporated into an existing desalination plant ( (WRC, n.d.)
HP: High pressure
Turbines or Pelton wheels are usually installed as shown in Figure 59.
Figure 59: Turbines or Pelton wheels illustration ( (WRC, n.d.)
The impact of energy recovery in the case of some local desalination plants is shown in Table 8, as provided by Veolia South Africa. (Veolia Water Services, 2017)
Table 8: Impact of energy recovery
Membrane Plettenberg Bay Knysna Amatola Water Mossel Bay
Without energy recovery
3.2 kWh/m3 4.1 kWh/m3 4.2 kWh/m3 Energy recovery of up to 30% of the plant’s total power consumption With energy
recovery 1.45–1.6 kWh/m3 2.8 kWh/m3 2.4–3.1 kWh/m3
Percentage energy recovery
47–50% 30% 30–43%

51
Storage of recovered energy for dispatch during peak periods
Energy recovery devices normally return energy to the RO plant on a continuous basis. However, it is also possible to recover energy to an energy storage facility in an integrated energy recovery and pumped storage scheme (Figure 60). As an alternative to such a scheme, a turbine-generator battery storage option may also be considered.
RO Membranes
Pump
Reservoir(Pumped Storage)
Hydraulic drive pump
Brine
Brine Discharge
Salt Water
Desalinated water
Water supply Figure 60: Integrated energy recovery and storage system (Chaudhry, 2013)
As an alternative to intermittent operation, an RO desalination plant can possibly run in the following modes to accommodate energy demand-side management:
1. During off-peak tariff periods – no energy recovery, maximum consumption using excess energy to pump to reservoir.
2. During standard tariff periods – own energy recovery. 3. During peak tariff periods – own energy recovery plus dispatch from pumped storage
generated as per 1. above – and/or exchange of peaking power with the grid.
This approach may be employed to avoid idling and intermittent operation of the desalination plant (which results in a lower capital recovery) while utilising time-of-use and demand-side management factors in favour of the desalination plant.
Hybridisation of RO desalination, desalination energy recovery systems, pumped storage and renewable energy
Renewable energy derived from solar and wind resources is intermittent by nature. At the same time, the cost of electricity from renewable energy sources is still declining to the extent that these intermittent sources can in future compete with off-peak electricity prices. Hence, renewable energy can similarly be incorporated in off-peak energy in the above-mentioned RO energy recovery and pumped storage scheme. This will serve a twofold purpose:

52
• Create a demand for intermittent energy.
• Store residual intermittent energy to produce dispatchable energy.
Using reservoir capacity to buffer desalination production
While electrical energy cannot be stored readily and needs to be transferred to other forms of energy for storage, it is readily stored in water in the following two forms:
• Potential energy (pumped storage, reservoir storage).
• Chemical energy/local entropy reversal – desalination of seawater.
A practice frequently employed by water utilities, which is a practical example of the water-energy nexus, is off-peak raw and bulk water transfer. In this form of electrical demand-side management and associated energy cost optimisation, water utilities optimise their pumping schedules and reservoir capacity to avoid pumping during peak periods when electricity is more expensive. It results in a relative flattening of the electrical demand profile and enhanced use of the supply capacity. This, in combination with other demand-side management interventions and load optimisations, improves the electrical grid’s ability to match supply and demand. In turn, it can theoretically reduce the reserve margin, which can result in deferred generation plant build and resulting cost savings. Pumped storage and hydro are a complementary expansion of the above. Moreover, the introduction of intermittent renewable energy can be harmonised with the design of desalination, bulk water transfer, reservoir buffer capacity, pump storage and hydro.
Desalination in Context of Climate Change and Drought
Climate change and drought
The relationship between desalination and climate change is complex. Global warming has increased the intensity and frequency of droughts around the world. Some long-held freshwater sources are no longer reliably available to hundreds of millions of people. An overview of the regional climate and precipitation trends as observed and predicted in southern Africa is provided by (Daron, 2014)
• Over the past 50 years, there has been substantial multidecadal variability in rainfall, with large parts of the region experiencing wetter than average conditions in the 1970s and drier than average conditions in the 1990s.
• There is evidence of an increase in summer rainfall across much of Lesotho, Namibia and South Africa, particularly in the region south of Lesotho. A decrease in summer rainfall is observed in other regions, particularly in the border region of Botswana, Namibia, Zimbabwe and Zambia, corresponding to part of the upper Zambezi river catchment.
• In South Africa, many model projections show a tendency for wetting in the summer rainfall region (north and east) and drying in the winter rainfall region (southwest). The magnitudes of such changes are highly uncertain.
• The effects of future climate change on different sectors are complicated by the spread of model projections and the complexity of natural and societal systems.
• The effects of climate change on water availability are unclear, but the increased evaporation that is likely to occur with increased temperatures may place additional stress on vulnerable systems.
It is further reported that rainfall projections show a general drying pattern over South Africa, in particular in the south-west where the duration of dry spells is expected to increase (Walsdorff, et al., 2017). An increase in the frequency of both heavy and extreme rainfall events is likely over the eastern parts of the country during the summer months (Figure 61).
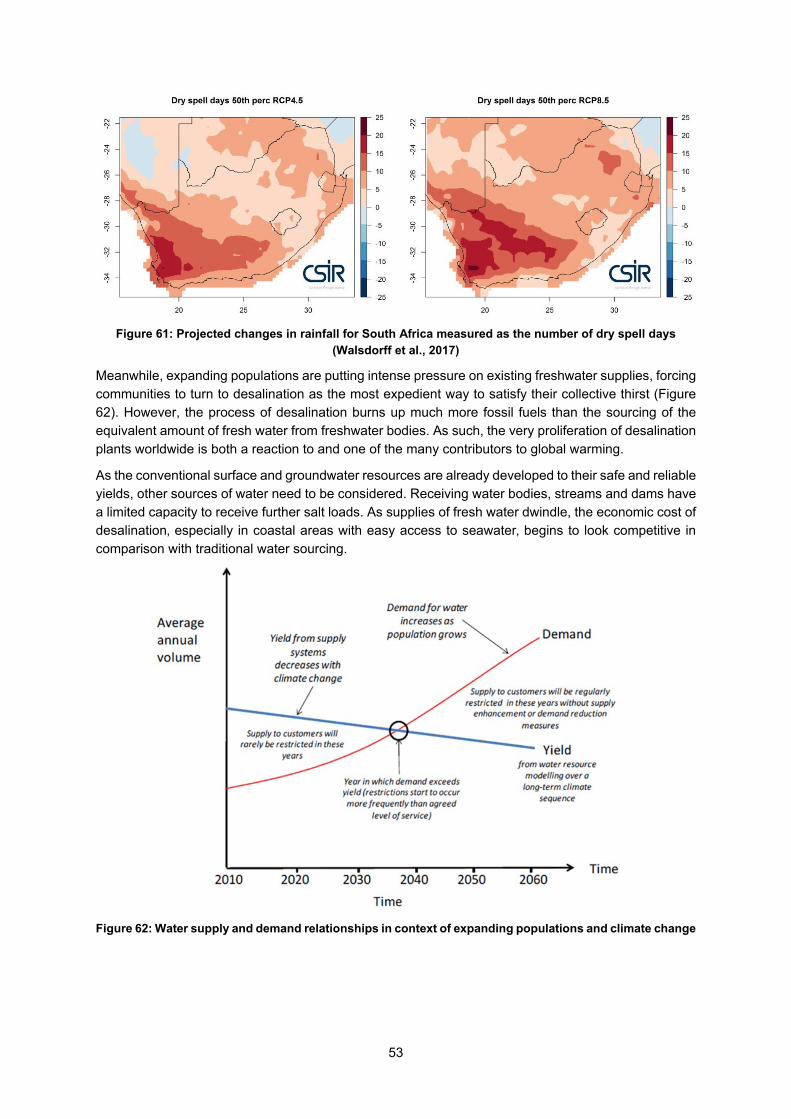
53
Figure 61: Projected changes in rainfall for South Africa measured as the number of dry spell days (Walsdorff et al., 2017)
Meanwhile, expanding populations are putting intense pressure on existing freshwater supplies, forcing communities to turn to desalination as the most expedient way to satisfy their collective thirst (Figure 62). However, the process of desalination burns up much more fossil fuels than the sourcing of the equivalent amount of fresh water from freshwater bodies. As such, the very proliferation of desalination plants worldwide is both a reaction to and one of the many contributors to global warming.
As the conventional surface and groundwater resources are already developed to their safe and reliable yields, other sources of water need to be considered. Receiving water bodies, streams and dams have a limited capacity to receive further salt loads. As supplies of fresh water dwindle, the economic cost of desalination‚ especially in coastal areas with easy access to seawater‚ begins to look competitive in comparison with traditional water sourcing.
Figure 62: Water supply and demand relationships in context of expanding populations and climate change

54
Figure 62: Water supply and demand relationships in context of expanding populations and climate
change (continued)
Figure 63 is a schematic of the water supply in the Colorado River basin framed in climate change and drought (Sciox.org, 2017), which further depicts the combined impact of a growing demand and climate change on the supply.
Figure 63: Water supply in Colorado River basin framed in climate change and drought (Bratrschovsky,
2012)

55
Climate change vulnerability assessments and climate change adaptation
Vulnerability assessments for climate change adaptation build on work from several disciplines, which have served to both enrich and confuse their execution. A wide variety of approaches and frameworks have been proposed over the past 20 years; many, if not most, are formulated around the conceptual thinking outlined in the past three Intergovernmental Panel on Climate Change (IPCC) assessment reports (De Sherbinin, 2013); (UNDP, 2010), shown in Figure 64. These reports conceptualise vulnerability as a function of exposure and sensitivity to a hazard and the capacity of a system to adapt in order to mitigate negative consequences. The exact formulation of vulnerability (or the related concept of risk) has evolved from the third to the fifth IPCC assessment report, and the literature about risk assessments has been similarly evolving in response.
The IPCC framework is the most commonly used framework for vulnerability mapping (De Sherbinin, 2013; IRENA and IEA-ETSAP, 2012; UNDP, 2010).
• Vulnerability assessments are scale-dependent, thus it is important to examine the spatial scale of the data relevant to desalination decision-making.
• Vulnerability assessments are time-dependent and need to consider the typical planning time horizons; the decisions made today must account not only for how long their effects will be felt, but also for climate changes that may take place within their useful lifespans.
Figure 64: Vulnerability exposure and risk in a climate change frame(IPCC, 2012)
Development and development planning in the context of climate change timelines
The prospect that climate change may increase faster and occur sooner makes considering substantial and continuing adaptation activities a greater priority, in particular when considering adaptation decisions with long lifetimes. Here, we define decision lifetime as the sum of lead time (the time from first consideration to execution) and consequence time (the time period over which the consequences of the decision emerge). Although various issues regarding these decisions have been raised in academic literature, they have not been absorbed by practitioners (Stafford, et al., 2011).
First, decisions can be mapped with respect to their lifetime. Decisions may have a short lead time and short consequence period, such as choosing which existing wheat cultivar to plant – a decision that can be adjusted every year. Alternatively, decisions may have a short lead time and long consequences,

56
such as when building individual houses. Or decisions could have a long lead time but short consequences, such as when developing a new cultivar of wheat for planting. Finally, decisions may have a long lead time and long consequences, such as choosing the location of suburbs, which are very hard to move once developed (Stafford et al., 2011). In relation to climate change adaptation, the key issue is the total decision lifetime (Figure 65).
Research demonstrates that individuals and organisations struggle to deal effectively with uncertainty. This is a well-recognised barrier to better decision-making in relation to climate change, even though there are many risk-management tools and techniques available to help policymaking under such conditions. As the analysis of climate adaptation becomes more sophisticated, there is a move towards a more explicit treatment of uncertainty through, for example, probabilistic scenarios. However, even when the outcomes and probabilities of an event are known (risk), this does not mean that decision-making is any easier, or any more accurate, or that a risk-based approach to decision-making will necessarily lead to the effective management of uncertainty (Stafford et al., 2011).
Figure 65: Timeline illustrating the lifetimes (sum of lead and consequence times) of different types of
decision, compared with the time scales for some global environmental changes, and the changing implications for adaptation (Stafford, et al., 2011)
Summary
Water, in general, has evolved as a social and economic commodity in many parts of the world (Rogers, et al., 1998) and it has gained the socio-economic status of energy sources such as oil. However, unlike oil it cannot be replaced by other forms of energy and its volumetric cost is not high enough to warrant transport over ultra-long distances at scale. Bulk water supply services are affected by climate and they become more sensitive as resources are fully or oversubscribed.
Global warming forecasts predict temperature increases over most parts of South Africa, although its impact on rainfall is much less determinate. Precipitation is also expected to become more variable, possibly with more droughts and severe flood events. Streamflow and rates of run-off will likely decrease and become more variable. Traditionally, the statistical analysis of past climatic records has been a reliable basis for predicting the water cycle and its hydrological extremes, including droughts and floods. However, the variations in precipitation and precipitation patterns because of climate change and the

57
increased variability of future water supply due to variable water use will make analyses based on historical data less reliable. There is also greater uncertainty on the demand side due to an increase in the number and complexity of choices, which are outgrowing managers’ abilities to assimilate and analyse data and make decisions.
The potential for intermittent operation of a desalination plant and the resultant economic value have been investigated to determine whether desalination could be an effective means of energy supply/demand management if the energy demand profile of desalination can be shaped to optimise time-of-use power tariffs. Also, synergies between power generation and desalination (such as the use of common seawater intakes and brine disposal, and the use of waste heat to improve desalination process) should be considered.
Desalination can be performed using different energy sources, either separately or in combination; notably heat and electricity. Thermal desalination processes such as MED are useful, particularly when there are opportunities for using large amounts of low-grade heat that is generated through thermal power generation, or as waste heat from combustion and other heat-generating processes. Thermal processes are particularly useful in instances where raw water is highly polluted or of very high salinity. It is typical for thermal desalination processes to be integrated with gas-fired, coal-fired and nuclear power generation.
Renewable energies derived from solar and wind resources are termed non-dispatchable as energy is not generated when it is required, but rather when the energy resource is available (so-called intermittent resources). Harnessing this energy most effectively along a specific demand profile requires interventions such as load shifting, load shedding and demand-side interventions, together with energy storage mechanisms. The utilisation of surplus, intermittent or otherwise non-dispatchable energy for water desalination or other forms of water treatment, including the bulk conveyance and/or storage of water, is potentially an important intervention. In South Africa, significant amounts of non-dispatchable energy are already being converted to potential energy through pumped storage and off-peak pumping for bulk and potable water transfer. Potential energy is stored in dams and water reservoirs and in pumped storage schemes, avoiding pumping energy and even converting stored potential energy into electricity during periods of peak demand.
Preheating the feedwater to an RO desalination plant can reduce the energy requirements for desalination. If, for example, a desalination plant is co-located with a large cooling load, using seawater cooling and then using the cooling water return as a feed to the desalination plant could carry some benefit in reducing the electricity consumption. Preheating could, of course, also be achieved through solar-thermal technology, where no low-grade waste heat is available.
A more integrated approach to the interconnected challenges of energy and water could stimulate the development and deployment of solutions for objectives in both domains. Salient aspects of the water-energy nexus in South Africa are:
• Energy and water systems are interdependent and inextricably linked.
• Water scarcity, climate variability, and uncertainty are becoming more prominent, potentially leading to vulnerabilities of the South Africa water and energy systems because they are not managed on a higher level as an integrated system.
• Water-use changes the profiles of the energy sector. The introduction of flue gas desulphurisation (wet or dry technologies) and the entry of renewable and cleaner energy are the prime movers that will be altering the water-energy equilibrium.
• Future water-use and climate patterns are increasingly uncertain. The stagnation in water and energy technology development, regulatory evolution and informed decision-making expose South Africa to water and energy supply risk.

58
• South African water and energy specialists have a history of technology expertise, modelling, analysis, and data generation that can contribute to understanding the issues and solutions across the entire nexus.
• It is time for a more integrated approach to address the challenges and opportunities of the water-energy nexus through research and development, capacity building and policy development.
Direct and indirect water reuse is in certain instances a competing alternative to desalination, and a detailed techno-economic comparison is needed to consider water reuse both in parallel with and as an alternative to desalination.

59
CHAPTER 4: SCOPING-LEVEL TECHNO-ECONOMIC ANALYSIS OF DESALINATION TECHNOLOGIES
Method and Scenarios
A scoping-level techno-economic analysis was conducted to evaluate water costs specifically for seawater desalination in South Africa, considering selected commercially available technologies and energy sources under different operating scenarios. To compare desalination technologies, a reference case plant of 100 Mℓ/day was chosen.
Scenarios considered include:
1. Comparison of the capital costs of SWRO and thermal desalination of water through MED (seawater multi-effect distillation (SWMED)/MSF).
2. Comparison of the operating costs of SWRO and SWMED with thermal desalination either using waste heat or natural gas. For thermal desalination, also demonstrate the sensitivity of desalinated water cost to cost of energy.
3. High level review of the potential benefits of co-location of desalination plants with power generation plants in terms of shared intake and outfall infrastructure.
4. Review of the impact of the part-load operation of desalination (SWRO) on water pricing, specifically with the consideration of time-of-use electricity tariffs.
5. Discussion of seasonal part-load. 6. The impact on water pricing of renewable energy plus storage, augmented by off-peak
electricity from the grid.
This section further provides a qualitative analysis of SWRO energy recovery to pumped storage and discusses the interaction of desalination with storage.
Results and Discussion
Desalination plant capital cost breakdown for RO and MED
Table 9 shows the costing assumed for modelling the reference case facilities of 100 Mℓ/day standalone plants.
Table 9: Capital costs breakdown for RO and thermal MED
SWRO MED/Thermal
Overnight capital costs, ZAR/Mℓ/day 21 000 000 24 500 000
Energy performance certificate costs 72.5% 84.5%
Owner’s costs 15.5% 8.0%
Contingencies 12.0% 7.5%
Source: GWI, Desaldata, Almar Water and author’s calculations
Capital costs for RO and MED are comparable, but the cost of RO has dropped to below MED costs and the market share of RO has subsequently increased, as illustrated in Figure 66. Capital costs were found to be fairly insensitive to scale for plants larger than 50 Mℓ/day.

60
Figure 66: Desalination plant capital cost breakdown for RO and MED (Almar water Solutions, 2016)
Desalinated water cost breakdown for RO and MED
Unitary water costs are reported in Table 10 for the 100 Mℓ/day reference case facilities, including natural gas-fired MED and MED using waste heat. The calculations are based on an exchange rate of ZAR14/USD and a natural gas price of USD4/GJ. The calculations in Table 10 assume electricity costs (energy and demand charge) that are in line with current Eskom Megaflex tariffs. Table 11 shows the grid-based electricity costs (energy and demand charges) used for the economic analysis. In the case of MED, the sensitivity of desalinated cost to the cost of energy is illustrated in Figure 67.
Table 10: Unitary water costs for 100 Mℓl/day reference case facilities
Project type SWRO, with energy recovery
device
MED − waste heat, free
MED/MSF, heat from natural gas at ZAR56/GJ
(USD4/GJ and ZAR14/USD)
Capital costs, ZAR/m3 7.38 8.31 8.31
Total operating costs, ZAR/m3
4.72 2.80 11.88
Thermal energy costs 0% 0% 76%
Electrical energy costs 46% 50% 12%
Other operations and maintenance costs
54% 50% 12%
Thermal energy consumption, kWhth/m3
0 45 45
Electrical energy consumption, kWhe/m3
2.7 1.75 1.75
Unitary charge, ZAR/m3 12.11 11.11 20.18
Source: GWI, Desaldata, Veolia, Almar Water and author’s calculations

61
Table 11: Grid-based electricity costs (energy and demand charges) used for the economic analysis, adapted from Eskom Megaflex tariffs
Electricity cost, average ZAR/kWh 0.80
Electricity cost, peak, high season ZAR/kWh 3.10
Electricity cost, standard, high season ZAR/kWh 0.95
Electricity cost, off-peak, high season ZAR/kWh 0.51
Electricity cost, peak, low season ZAR/kWh 1.20
Electricity cost, standard, low season ZAR/kWh 0.81
Electricity cost, off-peak, low season ZAR/kWh 0.51
Figure 67: Influence of energy cost on desalinated water cost, MED
It is shown that at scoping level, RO is essentially more cost-effective than MED unless a free source of low-grade waste heat is used as the thermal energy input. MED is more prevalent in MENA due to the availability of large amounts of associated natural gas production at low gas prices. In MENA, MED is often applied as part of the bottoming cycle of an integrated power and water generation facility.
South Africa currently does not have access to low-cost natural gas. MED may be an option for South Africa in future if paired with low-grade waste heat from, for example, solar-thermal and nuclear power generation plants. However, solar-thermal/MED is not yet cost-competitive with grid/RO desalination because of the cost of thermal energy storage and the need for MED to operate at high load factors.
Benefits of co-location with existing seawater intakes and outfalls
Co-locating the seawater intakes and outfalls of desalination plants with coastal power plant cooling systems may be beneficial, which results in reduced water production costs. Apart from the obvious benefit of shared infrastructure, a new design could carry the added benefit of utilising lower grade waste heat for, for example, RO water-preheating or hybrid MED-RO desalination, which can reduce energy consumption.
A qualitative analysis was conducted based on a co-locational capital cost benefit of 15%. Table 12 shows the impact on water costs on this basis. The analysis is hypothetical based on a typical intake/
10,00
12,00
14,00
16,00
18,00
20,00
22,00
24,00
26,00
28,00
30,00
20,00 30,00 40,00 50,00 60,00 70,00 80,00 90,00 100,00 110,00 120,00
Uni
tary
Wat
er C
harg
e, Z
AR/m
3
Energy cost, ZAR/GJ

62
outfall cost contribution and shared costs between co-located developments. Intake and outfall construction costs vary significantly; they are site-specific and depend on brine disposal and other environmental requirements. Co-location of desalination with, for example, gas-to-power and nuclear energy at a coastal location should be considered, ideally during the planning stages of the projects.
Table 12: Impact on water cost
Scenario Water cost, ZAR/m3
Reference case SWRO plant, standalone 12.11
Reference case SWRO plant, co-located intake and outfall 11.15
RO: Sensitivity of water price to mid-merit and off-peak operation
The influence of part-load operation on desalinated water cost was investigated for RO, ignoring the impact of intermittent operation on the membranes (Table 13). The proposed scenarios were based on electricity tariff structures for the Eskom Megaflex time-of-use tariffs, with electricity prices as documented in Table 11.
Table 13: Impact of part-load operation on the water price
Scenario Load factor Water cost, ZAR/m3
Baseload 90% 12.11
Off-peak and standard time 77% 12.99
Off-peak 45% 18.71
From the analysis it is evident that the desalinated water price is less sensitive to electricity cost than to capital recovery. Operating the desalination plant continuously results in a lower water cost than part-load operation based on the lower time-of-use electricity pricing. However, it may be beneficial to allow desalination plants to idle during peak periods (peak-shedding and demand-side management) when electricity is most expensive, and this could be used as a demand control tool. The ability to dispatch electrical generation capacity installed for desalination to other consumers during peak periods can affect the required reserve margin and thereby the installed electricity generation capacity. This could theoretically realise savings in generation plant build cost.
Seasonal part-load
Seasonal part-load in SWRO desalination plants has a similar effect than daily part-load operation. The relationship between percent utilisation and water cost is illustrated in Figure 68.
Figure 68: Relationship between desalination plant utilisation and water cost
1011121314151617181920
40% 50% 60% 70% 80% 90% 100%
Wat
er su
pply
cos
t, ZA
R/m
3
Percent Utilisation

63
Figure 68 shows that the water cost increases exponentially at lower plant utilisation. It generally makes sense to continuously operate desalination plants rather than idling them for extended periods as costs roughly double between 90% utilisation and 40% utilisation. This analysis does not consider the additional maintenance and upkeep cost of idling plants.
RO: Augmenting energy supply with renewables plus battery storage
RO desalination may also be performed using renewable energy. However, desalination is significantly more expensive at low load factors. Desalination therefore cannot rely on renewable electricity alone but needs to be supplied by grid or dispatchable generation plant and augmented by a renewable energy plus storage.
A scenario was investigated where renewable energy and battery storage augment the electricity supply to a grid-tied RO plant. The scenario is based on the 100 Mℓ/day reference case RO plant. The RO plant receives its electricity from renewables plus a battery storage facility during standard and peak time and buys off-peak electricity from the grid. The unitary charge used for this analysis was obtained for solar photovoltaic (PV)/batteries from Lazard’s Levelized Cost of Energy Analysis, version 11, 2017. Other renewable energy generation technologies such as wind and storage options (for example, pumped storage and hybrid renewable/gas power plants) may also be considered, but these were not analysed.
The electricity costs modelled are given in Table 14. Although the mid-merit cost of renewable energy plus storage is not yet at grid parity in South Africa, it is likely that such parity will be achieved in the short to medium term.
Table 14: Modelled electricity costs grid-tied solar PV/batteries
Electricity cost, average ZAR/kWh 0.97
Electricity cost, peak (solar PV plus batteries, 50% load factor)
ZAR/kWh 1.44
Electricity cost, standard (solar PV plus batteries, 50% load factor)
ZAR/kWh 1.44
Electricity cost, off-peak (grid)
ZAR/kWh 0.51
Since the desalinated water price is less sensitive to electricity cost than to capital recovery, the impact of the electricity cost on the water price is small (Table 15). Augmenting grid power with PV plus storage to drive desalination carries a price premium, but also provides an important benefit, namely, an energy storage facility that can provide dispatchable electricity. Working together with desalination plant demand-side management, the peak-shedding ability is augmented by an electricity generation peaking plant, which is already more cost-effective than diesel-based power generation.
Table 15: Impact of electricity cost on water price: grid-only versus grid plus PV/storage
Scenario Water cost, ZAR/m3
Baseload, grid 12.11
Baseload, grid off-peak plus PV/storage mid-merit 12.57
RO: Energy recovery and hybridisation with pumped storage
RO desalination energy recovery systems are generally designed to operate continuously and in tandem with the RO feed pumps. It is also possible to operate multiple forms of energy recovery. Notably, the energy recovered during times when electricity is available at lower cost may be stored

64
intermittently; for example, by using pumped storage and then releasing it later to augment supply when electricity is more expensive. For such a scheme, a RO desalination plant can typically be configured to run in the following modes:
1. During off-peak tariff periods – no energy recovery, maximum electricity consumption from grid with using excess energy to pump to the reservoir.
2. During standard tariff periods – own energy recovery. 3. During peak tariff periods – own energy recovery plus dispatch from pumped storage
generated as per 1. above – and/or exchange for peaking power with the grid.
In this way, one may avoid the intermittent operation of the desalination plant (which results in lower capital recovery) and use time-of-use and demand-side management factors in favour of the desalination plant. Establishing such a scheme again provides an energy storage facility for dispatchable electricity.
Desalination and water storage, including aquifer recharge
Natural water supply is intermittent and variable. Its additional buffer capacity (classically dam and groundwater storage) allows for a smaller reserve margin between water supply and demand. Pairing desalination with appropriately sized and cost-effective storage in theory makes it possible to provide more dispatchable water per unit of desalination capacity (implying a relatively smaller desalination plant).
Desalination requirements should be determined considering existing raw and bulk water storage capacity, future water storage potential and the ability to integrate with storage, as well as raw water treatment and purification capacity and the load factor. Such an analysis has to be conducted on a case-by-case basis within a specific WMA and is beyond the scope of this study.
Benchmarking desalination against other water supply options
In electricity supply networks, different fuels and technologies provide different electricity supply options. Notably, renewable energy such as solar and wind are considered non-dispatchable: they generate electricity when the sun shines and/or the wind blows and not when the electricity is demanded by consumers. This type of electricity thus needs to be stored, augmented by other sources and/or at worst curtailed to match the electricity supply with demand. Other power generation options such as natural gas-fired power generation are readily dispatchable and generation capacity can be adjusted to follow demand. Water supply networks work in a similar fashion. However, water storage in dams is well established, much simpler, and relatively more cost-effective than electrical energy storage in batteries. In water supply networks, storage in dams, aquifers and reservoirs is generally used to balance supply and demand. In certain locations where such storage is insufficient to allow for variability, other options are implemented to augment supply or curtail demand. These include:
• Water demand-side management.
• Water reuse.
• Storm water, run-off and rainwater harvesting.
• Interbasin water transfer.
• Desalination.
• Minimisation of water losses.
• Water demand curtailment.

65
In the same way as for an electrical grid, water supply networks may rely on a multitude of techniques for matching supply/demand. Each of the above techniques has its benefits, limitations and drawbacks in the context of specific interventions. The optimal mix of technologies is specific to a particular WMA. An example of a marginal cost of water supply analysis is illustrated in Figure 69 (DWA, 2010).
Figure 69: Water augmentation options for the Western Cape ( (DWA, 2010))
EWR: Environmental water requirement
As Figure 69 indicates, desalination is still more expensive than most other water supply- and demand-side management options; a possible exception could be long-distance pumped water transfer. However, desalination cannot be directly compared with other water supply options. A detailed comparison of different water supply and demand-side management options is beyond the scope of this study, but some relevant points are provided in Table 16.
Table 16: Comparison of water supply networks and their benefits, limitations and drawbacks

66
Water supply/demand
management technology
Key attributes, benefits, limitations and drawbacks
Dam, reservoir and aquifer storage
• Often the simplest and cheapest form of supply/demand balancing. • Provides seasonal buffering. • Flood control measures have to be implemented. • Requires significant land area with a specific topography – typically highly
arable agricultural land located in valleys. • Evaporative losses reduce overall water availability in exchange for
enhanced water availability. • Environmental, ecological and land-use impact of dam-building.
Water demand-side management and demand curtailment
• Where water demand is elastic and where it is possible to conserve water, this is normally a cost-effective/cost-saving approach to water management.
• A significant impact may be realised in periodically water-stressed areas. • Relies on human behaviour. • Pricing signals such as block tariffs may be implemented to discourage
higher water usage or to recover costs of more expensive supply options. • Once the measures have been implemented, subsequent opportunity
diminishes. • Demand-side management may have unintended economic
consequences. • Demand curtailments such as water restrictions rely on human behaviour
and require enforcement. • If demand is curtailed and elasticity is lost, the economic cost of unserved
water has to be considered. • Demand curtailment cannot be applied in sectors that are inelastic, for
example, intensive agriculture because the economic consequences potentially outstrip the costs of alternative water supply.
Water reuse
• Essentially focused on waste water and water collected through sewers. • Direct and indirect reuse possible. Direct reuse requires more elaborate
water quality control and indirect reuse requires ecological buffers. • In some cases, it might be possible to reuse grey and partially treated
water for e.g. industrial purposes. Location and case specific. • Generally, more expensive than dam and reservoir storage and interbasin
transfer, but can significantly increase water availability, especially in municipal supply networks.
• Generally less expensive than desalination. • Recycles existing water resource and is not an additional water resource.

67
Water supply/demand
management technology
Key attributes, benefits, limitations and drawbacks
Interbasin transfer
• In the case where there is ample water in one catchment area and a shortage in another, a pumped interbasin transfer may be a viable consideration.
• The opportunity cost of water must be determined when interbasin transfer is considered, because future use of water in the catchment area where it is collected may carry a higher economic potential than moving it to another catchment. The justification for interbasin transfer also has to consider macro-economics. A decision about interbasin transfer should not be made only based on the marginal cost of water.
• A relevant example is the transfer of water from a less arid catchment to a more arid catchment to augment agricultural water supply where the economic optimum might have been to relocate or change the agricultural activity. Spatial, historical, land ownership and community issues also play a role and have to be accounted for.
Desalination
• Generally, a more expensive supply option than dam capacity, water reuse and interbasin transfer.
• Since it reclaims water rendered unsuitable for use, it is the only technology that provides an additional freshwater resource.
• Desalinated water differs from natural freshwater resources as it is a secured water source, which is available on demand.
Determining the mix of water supply options and need for desalination in a WMA
Since desalination is a secure but expensive source of water, it is particularly suitable and justified for a supply shortfall, specifically with inelastic demand. Figure 70 qualitatively illustrates the anticipated application of desalination and other water supply options in response to different demand scenarios.
Investment in desalination should in the authors’ view be justified based on the economic cost of unserved water and/or the cost of suppression of economic development – or opportunity cost – as a consequence of a lack of a secure water supply. The required capacity and justifiable cost, however, have to be determined based on a stochastic analysis of natural water availability and the probability and economic consequences of various levels of drought.

68
Figure 70: Application of desalination and other water supply options in response to different demand
scenarios
Inelastic demand
Elastic demand
Reserve margin
1 in Y year flood
1 in X year drought
Desalination capacity
Demand side management
Re-use, inter-basin transfer
Dam capacity
Flood control
Demand Supply

69
CHAPTER 5: SUMMARY AND CONCLUSIONS
The mass of water is finite and hence cannot be increased by scientific discovery, technological break-throughs or other means, yet demand for this resource continues to increase. Water has a vital role in any country’s macro-economic function and its economic worth as water is the third-largest global industry. More than 70% of the world’s freshwater withdrawals are for agriculture. Water cost influences the agricultural sector production and in turn the cost of food. Acute changes in water availability across the world, including parts of South Africa, are significantly attributed to climate change and the increased frequency and intensity of drought periods.
Desalination is a mature process comprising different technologies that have historically been favoured in different parts of the world. Desalination processes, such as RO, MED and MSF, are still a more expensive alternative to water supply and demand-side management options, with the exception of long-distance pumped water transfer. The investment in desalinisation processes should be made in contrast with the economic cost of unserved water and/or cost of economic development suppression due to lack of a secure water supply. Traditional water resources and their conveyance and storage systems are characterised by increasing supply uncertainty due to a combination of climate change and poor water governance. Economic growth and the attendant increase in demands on traditional water resources will increasingly lead to water scarcity. As water use grows and water resources are subscribed, desalination should increasingly come into play.
RO is more cost-effective than MED, unless a free source of low-grade heat is used as a thermal input. MED is more prevalent in areas with large amounts of associated natural gas at low prices, such as MENA. Here it is generally applied as a bottoming cycle of an integrated power and water generation facility. South Africa currently does not have access to low-cost natural gas, but MED may still be an option if coupled with low-grade waste heat from solar-thermal and nuclear power generation plants. This however is not yet cost-competitive as a desalination process due to high cost of thermal energy storage and the need for MED to operate at high load factors.
Construction costs vary significantly, are highly site-specific, and are dependent on brine disposal and other environmental requirements. Co-location of desalinisation and thermal waste plants, such as nuclear power plants, at coastal sites could potentially reduce construction, storage and transportation costs. Continuous operation of a desalination plant is more cost-effective than periodic use of the same plant, maintenance costs excluded; as a result, the tariff for water supply is less susceptible to variation. Co-location of desalination with, for example, gas-to-power and nuclear energy at a coastal location should be considered – ideally during the project planning stages.
Desalinated water price is less sensitive to electricity cost than capital recovery. Operating the desalination plant continuously results in a lower water cost than part-load operation based on lower time-of-use electricity pricing. It may be beneficial to idle desalination plants during peak periods (peak-shedding and demand-side management) when electricity is most expensive, and this could be used as a demand control tool. The ability to dispatch electrical generation capacity installed for desalination to other consumers during peak periods can impact the required reserve margin and thereby the installed electricity generation capacity. This could theoretically realise savings in generation plant build cost. Seasonal part-load in SWRO desalination plants has a similar effect to daily part-load operation. Water cost increases exponentially at lower plant utilisation. It generally makes sense to continuously operate desalination plants rather than idling them for extended periods of time with costs roughly doubling from 90% utilisation to 40% utilisation.
Desalination is significantly more expensive at low load factors; hence desalination cannot rely on renewable electricity alone but needs to be supplied by grid or dispatchable generation plant, augmented by renewable energy plus storage. Although the mid-merit cost of renewable energy plus storage is not yet at grid parity in South Africa, it is likely that such parity will be achieved in the short to medium term. Since the desalinated water price is less sensitive to electricity cost than to capital

70
recovery, the impact of the electricity cost on the water price is small. RO desalination energy recovery systems are generally designed to operate continuously and in tandem with the RO feed pumps. It is however also possible to operate multiple forms of energy recovery – notably the energy recovered during times when electricity is available at lower cost may be stored intermittently; for example, using pumped storage, and then releasing later to augment supply when electricity is more expensive. In certain locations where such storage is insufficient to cater for variability, other options are implemented to augment supply or curtail demand. These include:
• Water demand-side management.
• Water reuse.
• Storm water, run-off and rainwater harvesting.
• Interbasin water transfer.
• Desalination.
• Minimisation of water losses.
• Water demand curtailment.
In the same way as for an electrical grid, water supply networks may rely on a multitude of supply-/demand-matching techniques. Each of the above techniques have its benefits, limitations and draw-backs that make them suitable for specific interventions. The optimal mix of technologies is specific to a particular WMA. The justification of investment in desalination should in the authors’ view be made based on the economic cost of unserved water and/or the cost of suppression of economic development – or opportunity cost – as a consequence of a lack of secure water supply. The required capacity and justifiable cost, however, have to be determined based on a stochastic analysis of natural water availability, probability and the economic consequence of various levels of drought.
There is reduced water availability and reliability in conventional resources due to climate change. There is increased water demand due to a significant increase in urban living standards, industrialisation and use in agricultural production due to the increased demand and increased intensity and frequency of drought periods. An increase in pressure to prioritise water allocation between urban residential and rural agricultural consumers requires an assured source of water supply. This source is more expensive but has a greater value in the economic realm. Additional cost should be recovered from those users who are willing and able to pay for certainty of supply by applying a system tariff approach. The cost of unserved and served water will be different and tariff structures need to accommodate this.
Desalination differs markedly from traditional water resources in that it is simultaneously a more expensive supply but also has high supply certainty. Indications are that large-scale desalination options are being excluded from water supply portfolios because tariff structures do not readily allow their entry as water supply certainty requirements are not appropriately valued and supply certainty does not attract an appropriate premium in tariff. Therefore, sectors that are both willing and able to pay a premium, for example, tourism, are precluded from doing so.
The setting of water tariffs has traditionally been developed around the supply of traditional water resources. The methods currently applied fail in situations of severely constrained supply – specifically where certain sectors require security of supply (most efficiently afforded by desalination) and have been willing to pay for supply and certainty of supply. Tariff structures depend on many factors, including the network’s characteristics and the objectives pursued via pricing policy. The charges may differ between customer classes (such as residential, commercial and industrial).
The problem faced by the water sector is that prices and tariffs are almost universally below the full cost of supply. This also holds to water tariffs in South Africa (with socio-economic objectives tariffs are set to promote multiple objectives other than cost recovery). Due to the increased need of using alternative water resources with varying cost and certainty of supply attributes, conventional tariff structures need
71
to be adapted considering a more holistic water resources pricing approach. At this stage, there are no models and/or combination of models that can:
• Estimate the cost of unserved water and value of certainty in supply.
• Determine the value proposition of desalination and other alternative water options at the hand of different tariff schemes.
A set of linked models that feed the dynamic stochastic general equilibrium model as extension to Hassan–Thurlow Water SAM2 CGE3 model is proposed as a next step for specific WMAs and extended to national level to:
• Accommodate certainty of supply variability of water as part of a stochastic production function.
• Allow for the assessments of the impact of potential shifts in water technology and water policy towards more market-based allocation regimes, which the NWRS aspires to promote.
• Generate evolution paths towards ultimate steady states.
A restructuring of the way we view and price water as a resource is necessary to account for its macro-economic potential, not only on a sectoral but also on a spatially disaggregated locational basis. Such a model can be used to identify the key strategic interventions required to make alternative water resources, including water reuse and desalination, available. For that purpose, a measure can be devised for unlocking private sector investment in bulk water, which is informed by the approach taken and lessons learnt by the South African government in the procurement of independent power producers and demand-side management interventions in the electricity sector.
2 Social accounting matrix 3 Computable general equilibrium
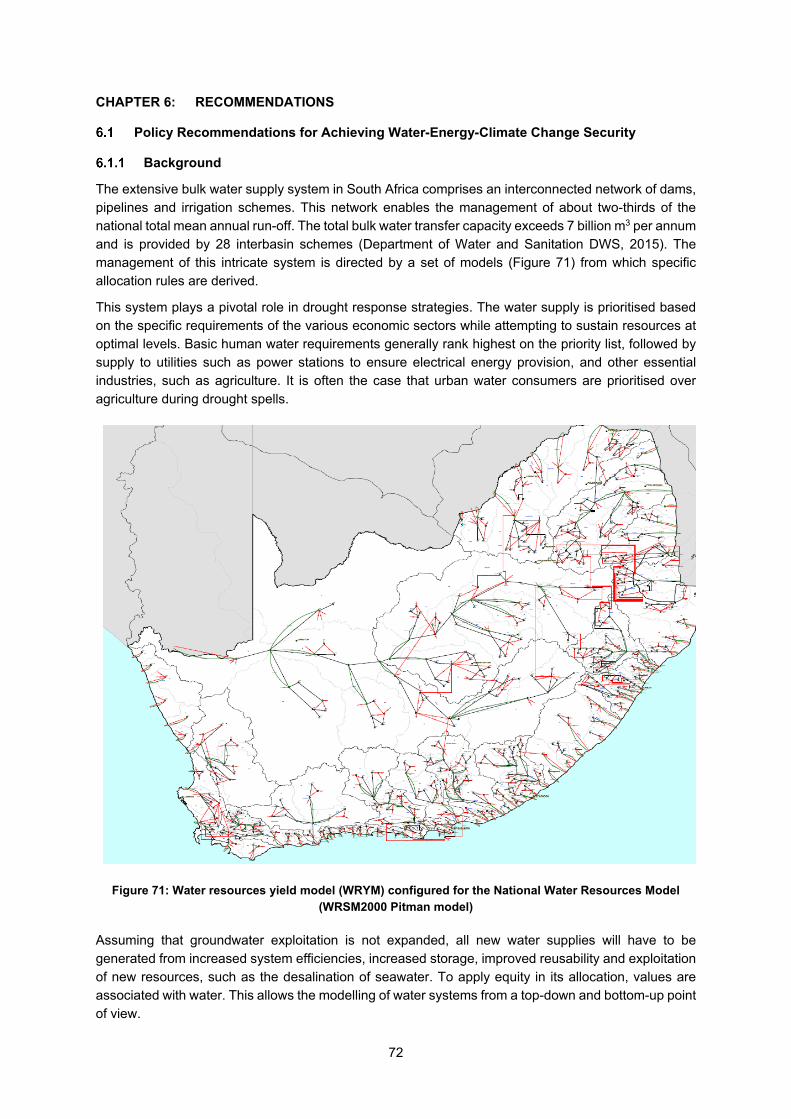
72
CHAPTER 6: RECOMMENDATIONS
Policy Recommendations for Achieving Water-Energy-Climate Change Security
Background
The extensive bulk water supply system in South Africa comprises an interconnected network of dams, pipelines and irrigation schemes. This network enables the management of about two-thirds of the national total mean annual run-off. The total bulk water transfer capacity exceeds 7 billion m3 per annum and is provided by 28 interbasin schemes (Department of Water and Sanitation DWS, 2015). The management of this intricate system is directed by a set of models (Figure 71) from which specific allocation rules are derived.
This system plays a pivotal role in drought response strategies. The water supply is prioritised based on the specific requirements of the various economic sectors while attempting to sustain resources at optimal levels. Basic human water requirements generally rank highest on the priority list, followed by supply to utilities such as power stations to ensure electrical energy provision, and other essential industries, such as agriculture. It is often the case that urban water consumers are prioritised over agriculture during drought spells.
Figure 71: Water resources yield model (WRYM) configured for the National Water Resources Model (WRSM2000 Pitman model)
Assuming that groundwater exploitation is not expanded, all new water supplies will have to be generated from increased system efficiencies, increased storage, improved reusability and exploitation of new resources, such as the desalination of seawater. To apply equity in its allocation, values are associated with water. This allows the modelling of water systems from a top-down and bottom-up point of view.

73
The top-down views typically reflect the economic value of water demand, while the bottom-up approach enables the costing of supply. There are a number of water resource models available to the DWS, of which the WRYM is the most comprehensive. The WRYM (Department of water and Forestry DWAF, 2017) is a sophisticated network-based model that optimises resources subject to various operational constraints. It has a stochastic functionality, which is appropriate for the assurance of specific yields. This is typical of a bottom-up approach. The WRYM is useful for evaluating water demand management options and infrastructure developments, and balancing available water resources in systems subject to specific water requirements and losses.
A number of macro-economic (top-down) models have been developed to explain the various forces that have an impact on the agricultural and industrial sectors. The work of (Hassan & Thurlow, 2011) and (Juana, 2008) is particularly important as the link with water usage in South Africa is also addressed. Hassan and Thurlow developed the South African Water Social Accounting Matrix (SAWSAM) for use in a static CGE model for South African conditions to examine the national impact of selected macro- and micro- (water-related) policies. The developed SAWSAM should accommodate water as a production factor to allow for the disaggregation of production and consumption activities by WMA in South Africa. The Hassan–Thurlow model focuses on assessing the economic impact of different allocations and tariff structures and resolves allocation of water for dryland and irrigation purposes in the agriculture sector.
A link between the operational optimisation models (sometimes also referred to as partial equilibrium models) and a top-down macro-economic model (also referred to as general equilibrium models) does not exist as yet. Such an integrated approach would enable the assessment of the true value of unserved water (direct, indirect and induced impact), and the economic and financial propositions of initiatives such as reusability and desalination infrastructure. Moreover, it will also elucidate the impact of tariffs and policies that are determined for the equitable allocation of water to consumers and for productive use.
Figure 72: Hydro-economic modelling (adapted from California Department of Water Resources) (Manero,
2008)
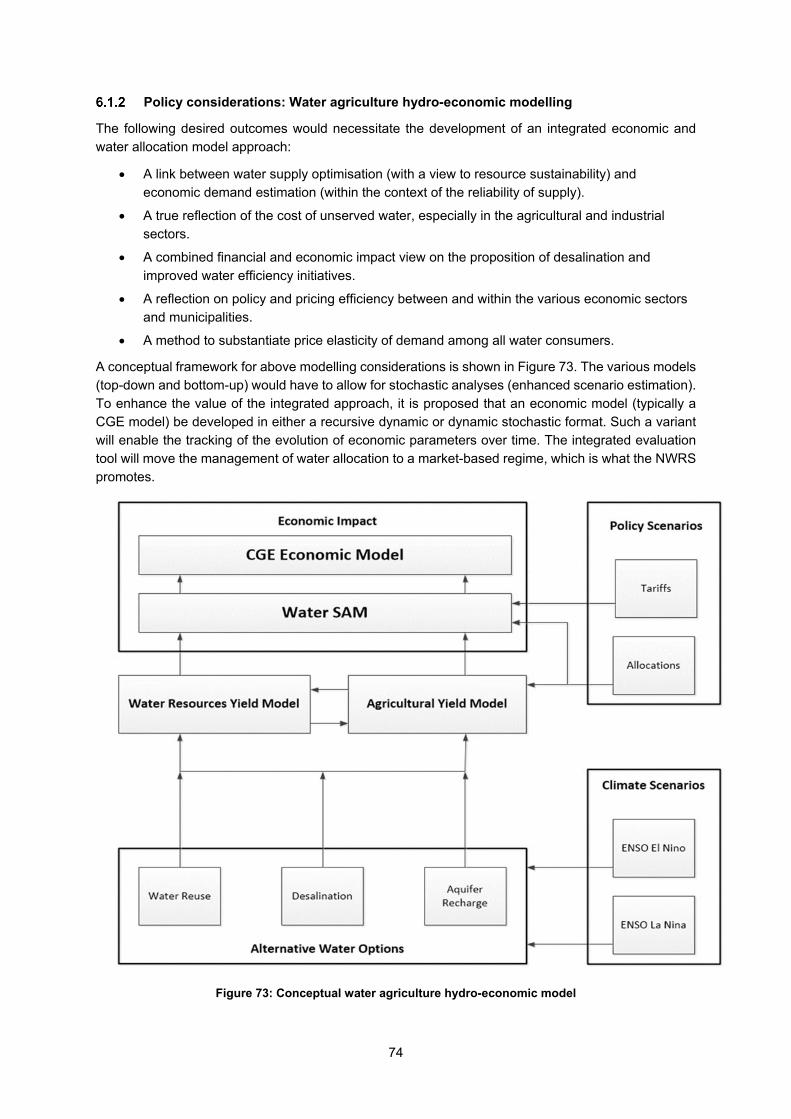
74
Policy considerations: Water agriculture hydro-economic modelling
The following desired outcomes would necessitate the development of an integrated economic and water allocation model approach:
• A link between water supply optimisation (with a view to resource sustainability) and economic demand estimation (within the context of the reliability of supply).
• A true reflection of the cost of unserved water, especially in the agricultural and industrial sectors.
• A combined financial and economic impact view on the proposition of desalination and improved water efficiency initiatives.
• A reflection on policy and pricing efficiency between and within the various economic sectors and municipalities.
• A method to substantiate price elasticity of demand among all water consumers.
A conceptual framework for above modelling considerations is shown in Figure 73. The various models (top-down and bottom-up) would have to allow for stochastic analyses (enhanced scenario estimation). To enhance the value of the integrated approach, it is proposed that an economic model (typically a CGE model) be developed in either a recursive dynamic or dynamic stochastic format. Such a variant will enable the tracking of the evolution of economic parameters over time. The integrated evaluation tool will move the management of water allocation to a market-based regime, which is what the NWRS promotes.
Figure 73: Conceptual water agriculture hydro-economic model

75
Integrated energy-water economic modelling, scenario development, and analysis are important to inform understanding and decision-making across complex coupled energy and water systems. Such integrated water-energy models and scenarios can inform decisions about preferred or appropriate technology, assessment of alternative scenarios, and relevant planning and other decisions made by energy, water and other stakeholders.
Policy considerations: Tariffs and allocations
The problem faced by the water sector is that prices and tariffs are almost universally below the full cost of supply (Rogers, et al., 2005). This also applies to water tariffs in South Africa (with socio-economic objectives, tariffs are set to promote objectives other than cost recovery). This has unintended consequences as such subsidisation typically causes large inefficiencies in the water sector. Where water resources have become constrained, water prices logically need to be raised to improve water-use productivity, but this has socio-economic consequences.
The World Water Commission strongly endorses the need for full-cost pricing of water services, confirming this report’s recommended single most immediate and important measure, namely, the systematic adoption of full-cost pricing of water services (World Water (World Water Commission, 2000). In a recent report, the World Bank contended that the price of water should reflect its local scarcity value (Xie, et al., 2009). The social impact of applying the full price of water needs requires implementing socio-economic measures at local levels.
Because of the conflation of costs, value, and price, there is some ambiguity on the exact definition of full-cost pricing. This report is based on the definitions given by Rogers et al. (1998) for the full-cost pricing of water services. They set out the relationships between full-supply cost, full economic cost, and full cost. In addition to cost and value, the water price (the tariff to be charged for the water service) needs to be considered.
The following definitions by Rogers et al. (2002), shown in Figure 74, are used:
• Cost: Operating and maintenance costs, capital costs, opportunity costs, costs of economic and environmental externalities.
• Value: Benefits to users, benefits from returned flows, indirect benefits, and intrinsic values.
• Price: Amount set by the political and social system to ensure cost recovery, equity and sustainability. The price may or may not include subsidies. The prices of water are not determined solely by cost.
The opportunity cost of water
Opportunity cost refers to a benefit that an entity could have enjoyed, but gave up to exercise an alternative option. This cost is therefore most relevant for two mutually exclusive events: to desalinate and pay more, or not to desalinate and suffer the economic consequences. In the economic sense, it refers to the difference in return between a chosen investment and one that was discarded.
Cost of unserved water
The cost of unserved water is the economic cost associated with not having access to the water that an economy requires; this cost differs from sector to sector, and economy to economy. By way of example, the Western Cape has substantial tourism and agricultural sectors with the capacity to pay different tariffs; their willingness to pay will vary substantially, with agriculture best-placed to forego water and wait through the drought rather than to be faced with higher tariffs. The tourism sector is the exact opposite. The cost of unserved and served water will be different and tariff structures need to accommodate this.

76
Figure 74: General principles when determining the cost and economic value of water (Rogers et al., 2002)
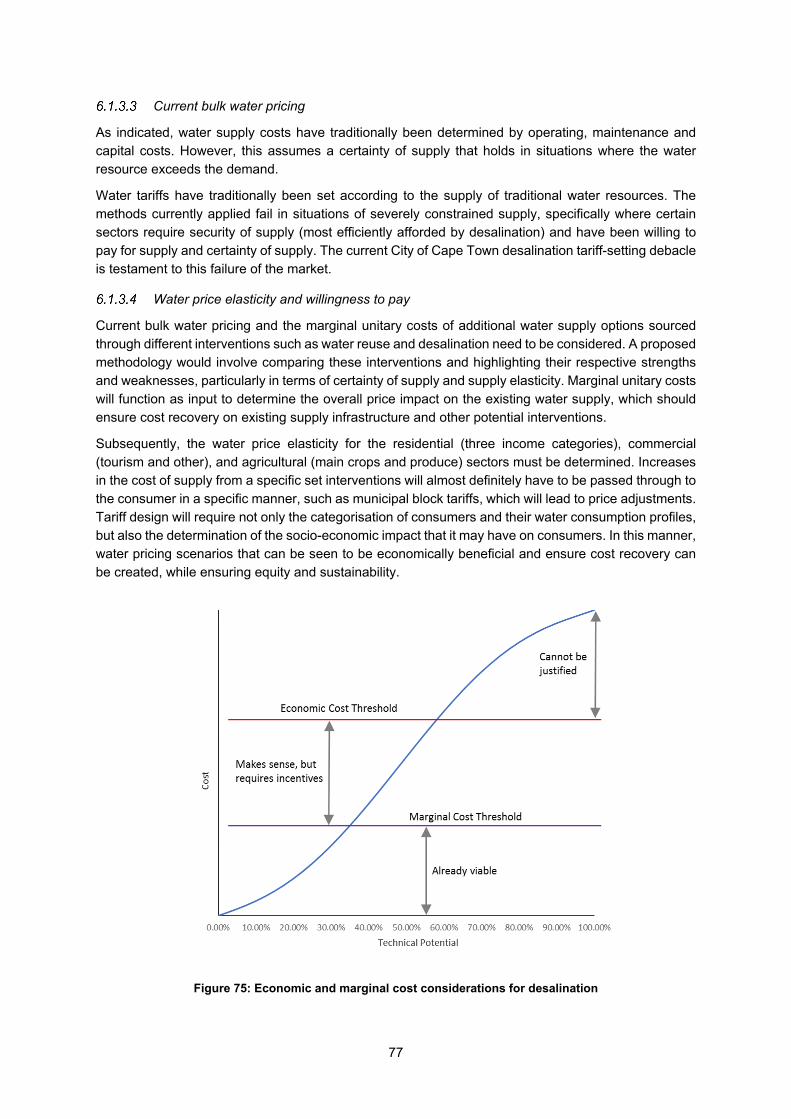
77
Current bulk water pricing
As indicated, water supply costs have traditionally been determined by operating, maintenance and capital costs. However, this assumes a certainty of supply that holds in situations where the water resource exceeds the demand.
Water tariffs have traditionally been set according to the supply of traditional water resources. The methods currently applied fail in situations of severely constrained supply, specifically where certain sectors require security of supply (most efficiently afforded by desalination) and have been willing to pay for supply and certainty of supply. The current City of Cape Town desalination tariff-setting debacle is testament to this failure of the market.
Water price elasticity and willingness to pay
Current bulk water pricing and the marginal unitary costs of additional water supply options sourced through different interventions such as water reuse and desalination need to be considered. A proposed methodology would involve comparing these interventions and highlighting their respective strengths and weaknesses, particularly in terms of certainty of supply and supply elasticity. Marginal unitary costs will function as input to determine the overall price impact on the existing water supply, which should ensure cost recovery on existing supply infrastructure and other potential interventions.
Subsequently, the water price elasticity for the residential (three income categories), commercial (tourism and other), and agricultural (main crops and produce) sectors must be determined. Increases in the cost of supply from a specific set interventions will almost definitely have to be passed through to the consumer in a specific manner, such as municipal block tariffs, which will lead to price adjustments. Tariff design will require not only the categorisation of consumers and their water consumption profiles, but also the determination of the socio-economic impact that it may have on consumers. In this manner, water pricing scenarios that can be seen to be economically beneficial and ensure cost recovery can be created, while ensuring equity and sustainability.
Figure 75: Economic and marginal cost considerations for desalination

78
Modelling considerations: Enablement of Desalination and Reuse of Water
In South Africa, the quality of scarce fresh water is declining because of an increase in pollution and the destruction of river catchments, caused by urbanisation, deforestation, damming of rivers, destruction of wetlands, industry, mining, agriculture, energy use and accidental water pollution. There is an uneven distribution of rainfall across South Africa. Due to weather conditions, the eastern half of the country is much wetter than the western half. South Africa also experiences alternating periods of droughts and floods, which affect the amount of water across South Africa. Water use in South Africa is dominated by four large water-use sectors as shown in Table 17.
Table 17: Large water users in South Africa
Agricultural and forestry (including irrigation) 60.0%
Environmental use 18.0%
Urban and domestic use 11.5%
Mining and industrial use 10.5%
Source: Nature Divided Land Degradation in South Africa (Hoffman & Ashwell, 2001)
Agriculture, upon which most of the world’s population depends, is competing with industrial, domestic and environmental uses for the scarce water supply. As the economy grows, the competition for water by agriculture, mining, manufacturing industries, domestic and environmental uses increases, while the supply of water is constrained as a finite resource and largely inelastic.
In times of economic growth and improved standards of living, the demand for the bulk water supply increases rapidly and external problems associated with water pollution become increasingly important. As the limits of supply are reached, competition drives up the value of water, and in order to make the best use of a constrained resource, the efficient water allocation among different sectors (and costing of water) is necessary. Therefore, the benefits and necessity of demand-side management and the development of new sources of water where possible have significantly increased.
Agriculture is the single largest user of water in South Africa. Agriculture uses approximately 60% of South Africa’s fresh water, and irrigation accounts for 50% of the total water use in South Africa. While agriculture accounts for only about 4% of the gross domestic product (GDP), the sector provides employment for approximately 11% of the workforce. In contrast, the mining and manufacturing industries, which respectively contribute about 8% and 23% to the GDP and employ about 7% and 19% of the total number of workers, account for only 15% of the total water requirements (Department of Water Affairs and Forestry DWAF, 2004). Accordingly, there has been increasing pressure to reallocate water from agriculture to the mining and manufacturing industries, to promote sustainable economic growth and employment.
From the economic perspective, the issue of reallocating water from low-value to high-value uses often seems rational under efficiency considerations. In most cases, however, efficiency considerations fail to consider the backward and forward linkages among sectors, the primary factors of production and institutions, and the other non-economic uses of water, which if incorporated into the valuation framework, address the issues of equity and sustainability. The question is therefore not only how much a particular sector contributes to the GDP, but how a given water resource can be allocated in such a way that the standard of living of the critical mass of people is improved.
More important, increased agricultural activity has the distinct benefit that it could provide significant job creation and expansion of the rural economy, providing employment and economic activity where many people live and reducing the strain on the urban infrastructure. The agricultural sector, in alignment with

79
the rural development and land reform strategy, can provide unique and significant opportunities for economic transformation and redress, as well as local economic development.
Water is a critical resource in the agricultural sector, where a combination of recent droughts and infrastructure development challenges has had large-scale, devastating effects on communities and the economy. The effect has been significant for emerging commercial and subsistence farmers who do not have the cash flow or balance sheets to weather environmental disasters.
The NDP (National Planning Commission, 2011) and the Agricultural Policy Action Plan ( (DAFF, 2014) envisage a substantial increase in agricultural production from additional cropland under irrigation, stating that “the 1.5 million hectares under irrigation (which produce virtually all South Africa’s horticultural harvest and some field crops) can be expanded by at least 500 000 hectares through the better use of existing water resources and developing new water schemes”. These plans, however, do not provide details of the corresponding government infrastructure budgets, sources of funding and associated targets required to accomplish this.
NWRS2 (DWAF, 2013), developed through the DWS, also highlighted that South Africa’s Irrigation Strategy sets a target of an increase of more than 50% of irrigated land in South Africa. The plan, however, assumes that the amount of water allocated for agriculture will essentially remain the same and that an increase in irrigation will be affected through increased water-use efficiency and selected new developments (notably the Mzimvubu water project in the Eastern Cape Province). Although there is certainly potential for improving water-use efficiency, redistributing saved water to other water-stressed basins and delivering water to alternative land with significant agricultural potential are not straightforward. In short, farmers and communities with viable farming and cropland, irrespective of their farming methods, will be looking for new sources of water. Without the enabling these new sources, this land will not deliver its full economic potential nor achieve the objectives of economic transformation and development of the rural economy. This will, in turn, accelerate urbanisation, affect already constrained services and infrastructure in our cities, and make South Africa even more reliant on imports to secure its increasing food requirements.
Considering the global economic climate and suppressed economic growth, governments, especially in emerging economies, currently face significant fiscal pressure. Under these conditions, alternative means of securing infrastructure funding becomes extremely important for sustaining a stable economy. Project finance, concessions, and public-private partnerships are receiving increasing interest; however, these mechanisms have very little sentiment for macro-economic strategy and are concerned predominantly with return on investment. It is critical for the enablement of project-financed transactions to provide a viable business case with secured revenue streams and regulatory certainty/enablement. This has classically been a problem in the water sector because the prevailing water pricing has lagged behind and has not reflected the cost of an appropriate water supply infrastructure. Also, water is still seen as a cheap, abundant commodity by many. In several cases, a lack of access to a secure source of water is preventing downstream investment and potential for economic growth and job creation, notably also in agriculture.
We seek to further develop academic and institutional capacity of understanding and readily modelling the interactions between the agricultural sector and the availability of water resources, as well as the macro-economic potential of strategic future water supply interventions. Furthermore, such a model can be used to identify the key strategic interventions required to make alternative water resources available, including water reuse and desalination. For that purpose, a measure can be devised for unlocking private sector investment in bulk water, informed by the approach taken and lessons learnt by the South African government in the procurement of independent power producers and demand-side management interventions in the electricity sector.
We seek to propose a restructuring of the way we view and price water as a resource to account for its macro-economic potential, not only on a sectoral but also on a spatially disaggregated, locational basis.
80
A longer-term objective linked to this work is to create a conducive environment for attracting private sector funding and implementing appropriate technology.
Agriculture will remain the biggest user of water as food production has a high-water intensity compounded by water use along feed and food production cycles. Agriculture is the largest consumer of freshwater resources by volume, and a substantial user of energy for food production. In terms of food, the volume of demand is growing with population expansion. There is significant global move away from a mainly starch-based diet to an increasing demand for more water-intensive meat and dairy as incomes grow and people move away from subsistence agriculture to urban consumption patterns.
Authorities and utilities often have limited capacity to plan for and control urban expansion and its impacts on water and energy demand. Expanding the current framework to consider the water-energy-food nexus is key to charting a course towards achieving sustainable development. Demand for all three is increasing, driven by economic growth and changing diets, and increased population and urbanisation.
A systematic review of 245 journal articles and book chapters by (Albrecht, et al., 2018) reveals that:
• Use of specific and reproducible methods for nexus assessment is uncommon (less than one-third).
• Nexus methods frequently fall short of capturing interactions among water, energy, and food –the very linkages they conceptually purport to address.
• Assessments strongly favour quantitative approaches (nearly three-quarters).
• Use of social science methods is limited (approximately one-quarter).
• Many nexus methods are confined to disciplinary silos – only about one-quarter combine methods from diverse disciplines, and less than one-fifth utilise both quantitative and qualitative approaches.
Albrecht et al find that to address complex resource and development challenges, mixed-methods and transdisciplinary approaches are needed to incorporate the social and political dimensions of water, energy, and food; utilise multiple and interdisciplinary approaches; and engage stakeholders and decision makers.
The integrated nexus approach, which is encompassed by innovation, context, collaboration and implementation, needs to be substantiated by facts emanating from socio-economic assessments and techno-economic studies. To achieve these goals, it will be required to develop, expand and integrate the technical and economic tools to enable analysis of the integrated water-energy-food nexus.
Research Recommendations
The long list of research themes and specific activities being undertaken globally are presented in Section 6.2.1 to Section 6.2.6.
Main research theme: Membrane technologies
• Pretreatment.
• Membrane performance/properties.
• Fouling.
• Post-treatment.
• Operations.
• Other.
81
Main research theme: Alternative technologies
• Hybrid and integrated systems, for example, eutectic freeze desalination hybrids.
• Alternative membranes.
• Offshore desalination.
• Renewable energy integration.
• Energy consumption and recovery.
• Alternate integrated technologies for optimising seawater desalination plant design and operating concepts.
Main research theme: Brine concentrate management technologies
• Disposal, fundamental research.
• Disposal, applied research.
• Beneficial use, fundamental research.
• Beneficial use, applied research.
Main research theme: Economics of desalination
• Alternative water supplies and the role of desalination.
• Benefits of desalination.
• Energy cost reduction.
• Optimising seawater desalination plant design and operating concepts for power management and consumption.
• Source water issues and options analysis.
• Total cost of seawater desalination, including a relatively large number of minor cost components that must be identified, optimised, and controlled.
• The relationship between finished-water quality specifications and plant design/costs.
• Scaling pilot testing to full-scale desalination plant design and operations.
Main research theme: Institutional issues
• Improving the understanding of the technology.
• Environmental considerations.
• Regional planning: motivating ocean water desalination as a water supply source.
• Public information and outreach about seawater desalination.
• What value does provincial water resource planning add to desalination?
• Desalination in the context of provincial water planning.
• Developing a portfolio approach with customers to make water management decisions.
• Regional planning: when do you build a desalination plant as a supply source?
• Municipal financing should be allowed for private electrical generator stations that favour the development of desalination.
• Will there be an adequate number of certified water plant operators qualified to operate seawater desalination plants?
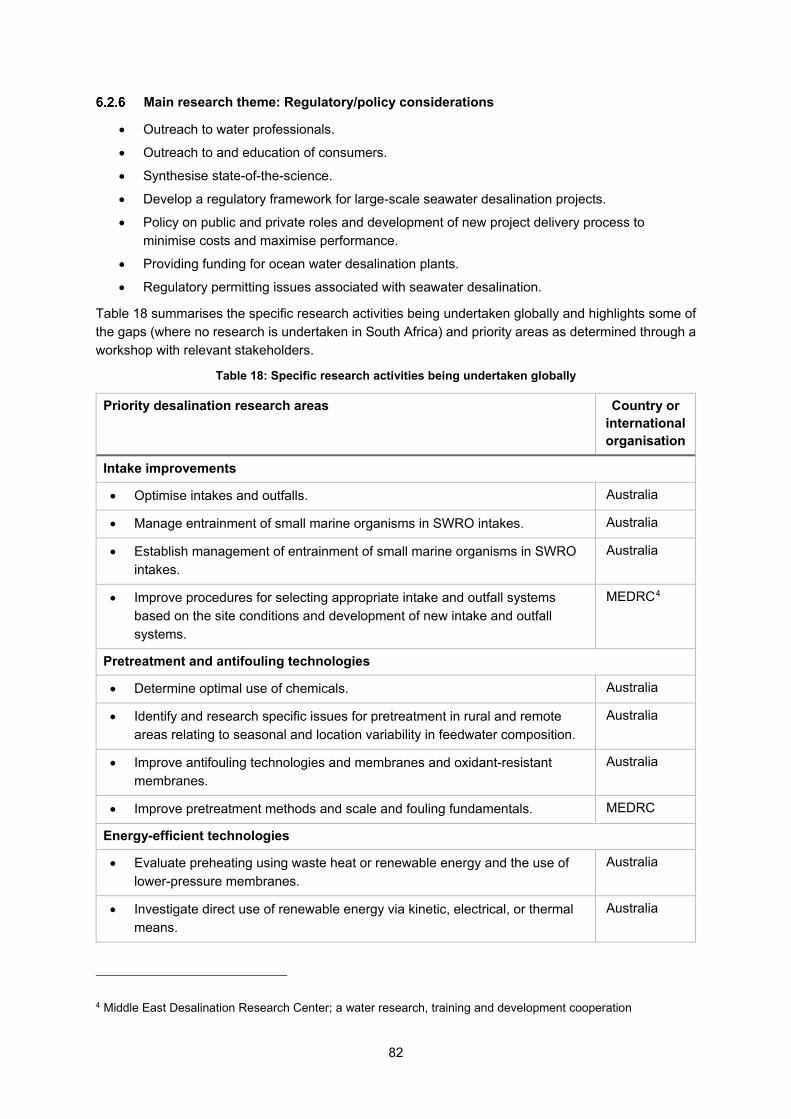
82
Main research theme: Regulatory/policy considerations
• Outreach to water professionals.
• Outreach to and education of consumers.
• Synthesise state-of-the-science.
• Develop a regulatory framework for large-scale seawater desalination projects.
• Policy on public and private roles and development of new project delivery process to minimise costs and maximise performance.
• Providing funding for ocean water desalination plants.
• Regulatory permitting issues associated with seawater desalination.
Table 18 summarises the specific research activities being undertaken globally and highlights some of the gaps (where no research is undertaken in South Africa) and priority areas as determined through a workshop with relevant stakeholders.
Table 18: Specific research activities being undertaken globally
Priority desalination research areas Country or international organisation
Intake improvements
• Optimise intakes and outfalls. Australia
• Manage entrainment of small marine organisms in SWRO intakes. Australia
• Establish management of entrainment of small marine organisms in SWRO intakes.
Australia
• Improve procedures for selecting appropriate intake and outfall systems based on the site conditions and development of new intake and outfall systems.
MEDRC4
Pretreatment and antifouling technologies
• Determine optimal use of chemicals. Australia
• Identify and research specific issues for pretreatment in rural and remote areas relating to seasonal and location variability in feedwater composition.
Australia
• Improve antifouling technologies and membranes and oxidant-resistant membranes.
Australia
• Improve pretreatment methods and scale and fouling fundamentals. MEDRC
Energy-efficient technologies
• Evaluate preheating using waste heat or renewable energy and the use of lower-pressure membranes.
Australia
• Investigate direct use of renewable energy via kinetic, electrical, or thermal means.
Australia
4 Middle East Desalination Research Center; a water research, training and development cooperation

83
Priority desalination research areas Country or international organisation
• Couple water production with renewable energy. Australia
• Develop solar ponds for energy and concentrate management. Egypt
• Develop solar polyvinyl-RO systems. Egypt
• Develop energy recovery in RO processes. MEDRC
• Reduce energy consumption and the use of cheap alternative energy sources.
MEDRC
• Expand the application of renewable energy sources for desalination. MEDRC
• Support research into and the development of more energy-efficient desalination technologies.
South Africa
Treatment improvements
• Improve membrane materials to reduce operating pressure while maintaining or increasing flux rates and maintaining ion rejection.
Australia
• Optimise contaminant removal without the need for second-pass RO. Australia
• Optimise operations of RO desalting for plant simplification. Australia
• Develop novel technologies, including those for direct agricultural and industrial use.
Australia
• Develop low-maintenance, reliable evaporative technologies using waste heat or renewable energy.
Australia
• Pilot real-world situations and breakthroughs near commercial desalination technology.
Australia
• Design reliable, robust small-scale systems. Australia
• Design and manufacture solar stills. Egypt
• Apply reflection reduction solution to the glass of solar desalination units. Egypt
• Manufacture standalone small desalination units (1.0–20 m3/day). Egypt
• Develop an integrated complex for the production of water (solar stills), electricity (wind, solar, biomass), food (greenhouses self-sufficient of irrigating water, rabbit, sheep and bird-breeding), and salts (chemical salts, artemia and fish nutrients).
Egypt
• Provide continuous improvement in material enhancement for solar desalination unit.
Egypt
• Enhance evaporation through multistage condensation evaporation cycle. Egypt
• Study the biology of salty water, including understanding of environmental impacts, using bacteria for beneficial treatment.
Egypt
• Develop ionisation of salty water for irrigation. Egypt
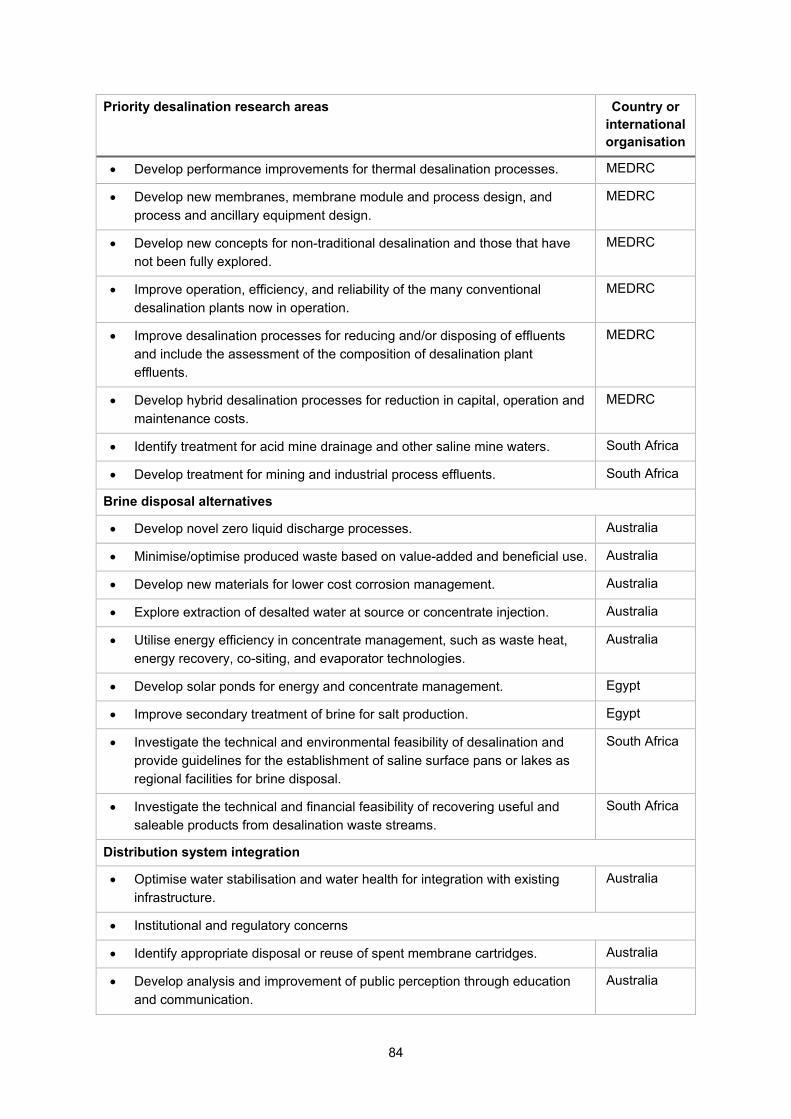
84
Priority desalination research areas Country or international organisation
• Develop performance improvements for thermal desalination processes. MEDRC
• Develop new membranes, membrane module and process design, and process and ancillary equipment design.
MEDRC
• Develop new concepts for non-traditional desalination and those that have not been fully explored.
MEDRC
• Improve operation, efficiency, and reliability of the many conventional desalination plants now in operation.
MEDRC
• Improve desalination processes for reducing and/or disposing of effluents and include the assessment of the composition of desalination plant effluents.
MEDRC
• Develop hybrid desalination processes for reduction in capital, operation and maintenance costs.
MEDRC
• Identify treatment for acid mine drainage and other saline mine waters. South Africa
• Develop treatment for mining and industrial process effluents. South Africa
Brine disposal alternatives
• Develop novel zero liquid discharge processes. Australia
• Minimise/optimise produced waste based on value-added and beneficial use. Australia
• Develop new materials for lower cost corrosion management. Australia
• Explore extraction of desalted water at source or concentrate injection. Australia
• Utilise energy efficiency in concentrate management, such as waste heat, energy recovery, co-siting, and evaporator technologies.
Australia
• Develop solar ponds for energy and concentrate management. Egypt
• Improve secondary treatment of brine for salt production. Egypt
• Investigate the technical and environmental feasibility of desalination and provide guidelines for the establishment of saline surface pans or lakes as regional facilities for brine disposal.
South Africa
• Investigate the technical and financial feasibility of recovering useful and saleable products from desalination waste streams.
South Africa
Distribution system integration
• Optimise water stabilisation and water health for integration with existing infrastructure.
Australia
• Institutional and regulatory concerns
• Identify appropriate disposal or reuse of spent membrane cartridges. Australia
• Develop analysis and improvement of public perception through education and communication.
Australia

85
Priority desalination research areas Country or international organisation
• Identify policy developments to better understand energy-water interdependence.
Australia
• Develop a centralised understanding of national desalination deployment, performance, and lessons learnt.
Australia
• Develop a detailed understanding of the salinity and toxin tolerance of marine species in the vicinity of SWRO outflows.
Australia
• Develop, sustain, and support the Alexandria Desalination Academy − the first e-learning institute in both Arabic and English.
Egypt
• Develop procedures for assessment of environmental impact of desalination plant effluents.
MEDRC
• Promote the development and use of appropriate codes of practice and standards in materials, systems, operation and maintenance.
MEDRC
Monitoring improvements
• Improve real-time monitoring and classification of potential foulants. Australia
Cost/benefit analysis
• Develop a total life cycle analysis and sustainability assessment of desalination against other water sources.
Australia
Miscellaneous topics
• Characterise groundwater and seawater sources and map those to best fit desalination technologies.
Australia
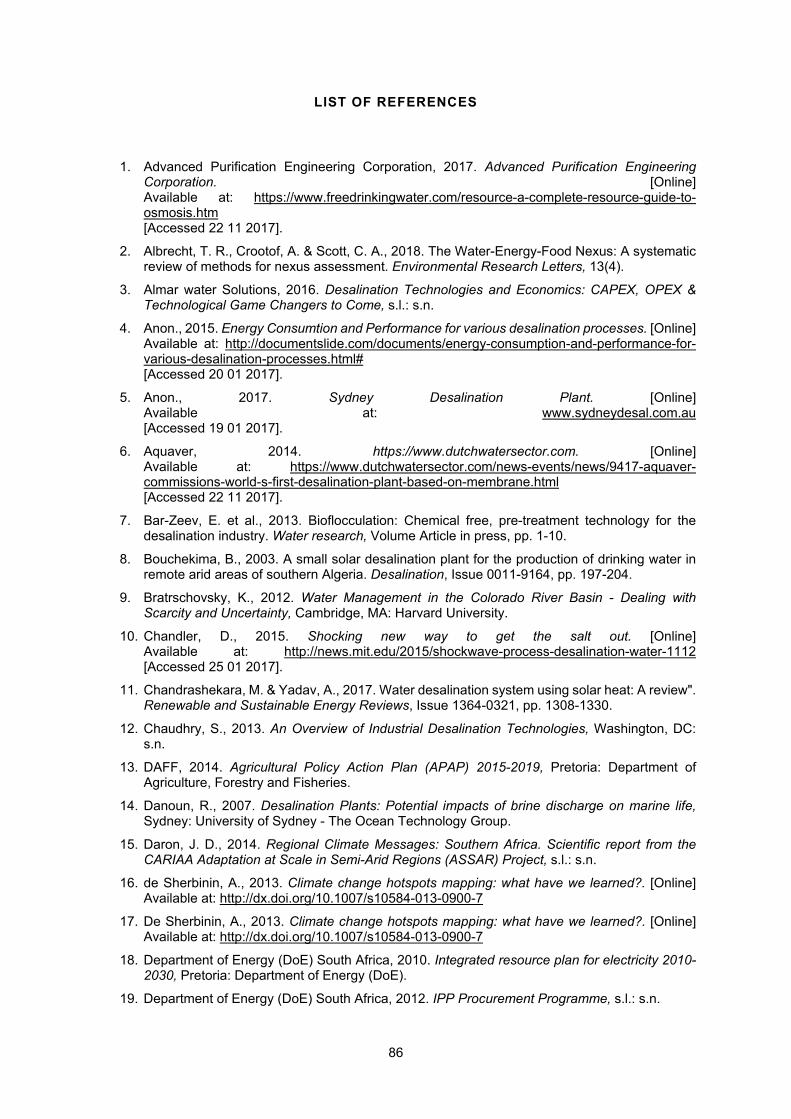
86
LIST OF REFERENCES
1. Advanced Purification Engineering Corporation, 2017. Advanced Purification Engineering Corporation. [Online] Available at: https://www.freedrinkingwater.com/resource-a-complete-resource-guide-to-osmosis.htm [Accessed 22 11 2017].
2. Albrecht, T. R., Crootof, A. & Scott, C. A., 2018. The Water-Energy-Food Nexus: A systematic review of methods for nexus assessment. Environmental Research Letters, 13(4).
3. Almar water Solutions, 2016. Desalination Technologies and Economics: CAPEX, OPEX & Technological Game Changers to Come, s.l.: s.n.
4. Anon., 2015. Energy Consumtion and Performance for various desalination processes. [Online] Available at: http://documentslide.com/documents/energy-consumption-and-performance-for-various-desalination-processes.html# [Accessed 20 01 2017].
5. Anon., 2017. Sydney Desalination Plant. [Online] Available at: www.sydneydesal.com.au [Accessed 19 01 2017].
6. Aquaver, 2014. https://www.dutchwatersector.com. [Online] Available at: https://www.dutchwatersector.com/news-events/news/9417-aquaver-commissions-world-s-first-desalination-plant-based-on-membrane.html [Accessed 22 11 2017].
7. Bar-Zeev, E. et al., 2013. Bioflocculation: Chemical free, pre-treatment technology for the desalination industry. Water research, Volume Article in press, pp. 1-10.
8. Bouchekima, B., 2003. A small solar desalination plant for the production of drinking water in remote arid areas of southern Algeria. Desalination, Issue 0011-9164, pp. 197-204.
9. Bratrschovsky, K., 2012. Water Management in the Colorado River Basin - Dealing with Scarcity and Uncertainty, Cambridge, MA: Harvard University.
10. Chandler, D., 2015. Shocking new way to get the salt out. [Online] Available at: http://news.mit.edu/2015/shockwave-process-desalination-water-1112 [Accessed 25 01 2017].
11. Chandrashekara, M. & Yadav, A., 2017. Water desalination system using solar heat: A review". Renewable and Sustainable Energy Reviews, Issue 1364-0321, pp. 1308-1330.
12. Chaudhry, S., 2013. An Overview of Industrial Desalination Technologies, Washington, DC: s.n.
13. DAFF, 2014. Agricultural Policy Action Plan (APAP) 2015-2019, Pretoria: Department of Agriculture, Forestry and Fisheries.
14. Danoun, R., 2007. Desalination Plants: Potential impacts of brine discharge on marine life, Sydney: University of Sydney - The Ocean Technology Group.
15. Daron, J. D., 2014. Regional Climate Messages: Southern Africa. Scientific report from the CARIAA Adaptation at Scale in Semi-Arid Regions (ASSAR) Project, s.l.: s.n.
16. de Sherbinin, A., 2013. Climate change hotspots mapping: what have we learned?. [Online] Available at: http://dx.doi.org/10.1007/s10584-013-0900-7
17. De Sherbinin, A., 2013. Climate change hotspots mapping: what have we learned?. [Online] Available at: http://dx.doi.org/10.1007/s10584-013-0900-7
18. Department of Energy (DoE) South Africa, 2010. Integrated resource plan for electricity 2010-2030, Pretoria: Department of Energy (DoE).
19. Department of Energy (DoE) South Africa, 2012. IPP Procurement Programme, s.l.: s.n.

87
20. Department of Energy (DOE) South Africa, 2013. Integrated Resource Plan for Electricity (IRP) 2010-2030: Update Report 2013, s.l.: s.n.
21. Department of Energy DOE, 2015. Integrated Energy Plan, Pretorial: Department of Energy.
22. Department of Environment Affairs (DEA) South Africa, 2014. Climate Change Mitigation Policy Mainstreaming, Pretoria: s.n.
23. Department of Environmental Affairs (DEA) South Africa, 2013. Long-Term Adaptation Scenarios Flagship Research Programme (LTAS) for South Africa. Climate Change Implications for the Water Sector in South Africa, Pretoria: Department of Environmental Affairs.
24. Department of Environmental Affairs DEA, 2011. National Climate Change Response Policy (NCCRP), Pretoria: Department of Environmental Affairs.
25. Department of Minerals and Energy South Africa (DME), 1998. White Paper on the Energy Policy of the Republic of South Africa, Pretoria: DME.
26. Department of Minerals and Energy South Africa (DME), 2003. White Paper on Renewable Energy, Pretoria: DME.
27. Department of Minerals and Energy South Africa (DME), 2005. Energy Efficiency Strategy of the Republic of South Africa, Pretoria: DME.
28. Department of National Treasury South africa (DNT), 2015. Carbon Budget Design Document, s.l.: DNT.
29. Department of Water Affairs and Forestry (DWAF), 1995. South African water quality guidelines for coastal marine waters, Pretoria: s.n.
30. Department of Water Affairs and Forestry (DWAF), n.d. The Strategic Framework for Water Resources (SFWR), Pretoria: DWAF.
31. Department of Water Affairs and Forestry DWAF, 2004. National Water Resource Strategy First Edition (NWRS 1), Pretoria: s.n.
32. Department of Water Affairs DWA, 2009. Water for Growth and Development Framework, Pretoria: Department of Water Affairs.
33. Department of Water Affairs South Africa, 2013. National Water Resource Strategy (NWRS2), s.l.: Department of Water Affairs .
34. Department of water and Forestry DWAF, 2017. DWAF. [Online] Available at: http://www.dwaf.gov.za/IWRP/SystemAnalysis/soft_wrym.htm [Accessed 22 11 2017].
35. Department of Water and Sanitation DWS, 2015. Strategic Overview of the Water Sector in South Africa. [Online] Available at: http://www.dwaf.gov.za/Downloads/WS/Macro_Planning_Products/STRATEGIC%20OVERVIEW%20OF%20WATER%20SERVICES/STRATEGIC%20OVERVIEW%20OF%20THE%20WATER%20SERVICES%202015%20(A6%20Booklet).pdf [Accessed 22 11 2017].
36. Department of Water Use and Forestry South Africa, 2007. External Water Use Licence Application Guideline, s.l.: s.n.
37. Department of Water Use and Forestry South Africa, 2013. National Water Policy Review, s.l.: Department of Water Affairs.
38. Du Plessis, J., Burger, A., Swartz, C. & Museev, N., 2006. A desalination guide for South African municipal engineers, s.l.: DWAF.
39. DWA, 2010. Assessment of the ultimate potential and future marginal cost of water resources in South africa, Pretoria: s.n.
40. DWAF, 1997. White Paper on a National Water Policy for South Africa, Pretoria: DWAF.
41. DWAF, 2013. National Water Resource Strategy (NWRS2), s.l.: Department of Water Affairs .

88
42. Edkins, M., Marquard, A. & Winkler, H., 2010. South Africa’s renewable energy roadmaps. [Online] Available at: http://www.erc.uct.ac.za/Reseacrh/publications/10Edkinsetalrenewables_roadmaps.pdf [Accessed 05 2017].
43. FAO, 2016. Food and Agriculture Organization of the United Nations (FAO). [Online] Available at: http://www.fao.org/nr/water/aquastat/countries_regions/ [Accessed 12 12 2017].
44. Global Water Intelligence, 2016. DesalData. [Online] Available at: https://www.desaldata.com/ [Accessed 20 11 2017].
45. Hassan, R. & Thurlow, J., 2011. Macro–micro feedback links of water management in South Africa: CGE analyses of selected policy regimes. Agricultural Economics, International Association of Agricultural Economist, 42(2), pp. 235-247.
46. He, T. & Yan, L., 2009. Application of alternative energy integration technology in seawater desalination. Desalination, Issue 0011-9164, pp. 104-108.
47. He, Y. &., 2009. s.l.: s.n.
48. Hoffmann, S., 2009. Planet Water: Investing in the World’s most Valuable Resource, Hoboken,NJ: John Wiley and Sons.
49. Hoffman, T. & Ashwell, A., 2001. Nature divided: land degradation in South Africa, Cape Town: University of Cape Town Press.
50. insights.globalspec.com, 2017. insights.globalspec.com - Engineering360 News Desk. [Online] Available at: https://thewaternetwork.com/article-FfV/shocking-purity-24LR7bf6U3yLFuBJn0lupw [Accessed 22 11 2017].
51. IPCC, 2012. Managing the risks of extreme events and disasters to advance climate change adaptation, Uk and New York: Cambridge University Press.
52. IRENA and IEA-ETSAP, 2012. Water Desalination Using Renewable Energy - Technology Brief. [Online] Available at: www.irena.org/Publications
53. Jameel, A. L., 2016. Low Carbon Desalination : Status and Research, Development, and Demonstration Needs, s.l.: Massachusetts Institute of Technology (MIT).
54. Juana, J. S., 2008. Efficiency and equity considerations in modeling inter-sectoral water demand in South Africa, Pretoria: University of Pretoria.
55. Li, C., Goswami, W. & Stefanakos, E., 2013. Solar assisted sea water desalination: A review. Renewable and Sustainable Energy Reviews, pp. 136-163.
56. Madhlopa, A. et al., 2016. The Water-Energy Nexus in the Context of Climate Change: Investigating Trade-Offs between Water Use Efficiency and Renewable Energy Options for South Africa, Pretoria: Water Research Commission (WRC).
57. Manero, A., 2008. Comparative water management practices in California and Spain. [Online] Available at: http://upcommons.upc.edu/bitstream/handle/2099.1/6053/05.pdf [Accessed 23 01 2017].
58. Masdar, n.d. Masdar’s Renewable Energy Seawater Desalination Programme, Abu Dhabi: Masdar; A Mubadala Company.
59. MED-TVC – Multi Effect with Thermal Vapour Compres, 2011. MED-TVC – Multi Effect with Thermal Vapour Compression. [Online] Available at: http://www.wabag.com/performance-range/processes-and-technologies/me-tvc-multi-effect-with-thermal-vapour-compression/ [Accessed 26 01 2017].
60. Miller, J., 2003. Review of Water Resources and Desalination Technologies. Albuquerque: Sandia NAtional Loboratories.

89
61. Müller-Holst, H. & Schölkopf, W., 2001. Thermally Driven Seawater Desalination using the Multi-Effect-Humidification Dehumidification Method. Adelaide Australia, ISES.
62. National Planning Commission, 2011. National Development Plan 2030. Our future – make it work, Pretoria: Government Printer.
63. NationMaster, 2017. Countries Compared by Geography > Average rainfall in depth > Mm per year. International Statistics. [Online] Available at: http://www.nationmaster.com/country-info/stats/Geography/Average-rainfall-in-depth/Mm-per-year [Accessed 8 12 2017].
64. Patel, V. & Multani, S., 2016. A Review on Seawater Desalination Technology and Concentrating. International Research Journal of Engineering and Technology, 03(05), pp. 2669-2672.
65. Republic of South Africa RSA, 1994. The Maritime Zones Act (Act No. 15 of 1994), Cape Town: Government Gazette.
66. Republic of South Africa RSA, 1996. Constitution of the Republic of South Africa, Cape Town: Government Gazette,.
67. Republic of South Africa RSA, 1998 . National Environmental Management Act 107 of 1998, Cape Town: Government Gazette.
68. Republic of South Africa RSA, 1998. National Water Act No. 36 of 1998, Cape Town: Government Gazette.
69. Republic of South Africa RSA, 1998. National Water Resources Act 36 of 1998, Cape Town: s.n.
70. Republic of South Africa RSA, 1999. National Heritage Resources Act, 1999 (Act No. 25 of 1999) , Cape Town: Government Gazette.
71. Republic of South Africa RSA, 2003. Protected Areas Act (Act No. 57 of 2003), Cape Town: Government Gazette.
72. Republic of South Africa RSA, 2004. National Energy Regulation Act, No. 40 of 2004, Cape Town: Government Gazette.
73. Republic of South Africa RSA, 2004. National Energy Regulator Act 40 of 2004, Cape Town: Government Gazette .
74. Republic of South Africa RSA, 2004. National Environmental Management: Biodiversity Act, 2004 (Act No. 10 of 2004), Cape Town: Government Gazette.
75. Republic of South Africa RSA, 2006. Amended Energy Regulations Act, No. 2006, Cape Town: Government Gazette.
76. Republic of South Africa RSA, 2006. Electricity Regulation Act 4 of 2006, Cape Town: Government Gazette.
77. Republic of South Africa RSA, 2008. Integrated Coastal Management Act (Act No. 24 of 2008), Cape Town: Government Gazette.
78. Republic of South Africa RSA, 2008. National Energy Act 34 of 2008, Cape Town: Government Gazette.
79. Republic Of South Africa RSA, 2008. National Energy Act No 34 of 2008, Cape Town: Government Gazette.
80. Republic of South africa RSA, 2008. National Environmental Management: Waste Act (Act No. 59 of 2008), Cape Town: Government Gazette.
81. Republic of South Africa RSA, 2011. National Climate Change Response White Paper, Pretoria: s.n.
82. Republic of South africa, 1998. National Environmental Management Act 107 of 1998, Cape Town: Government Gazette.
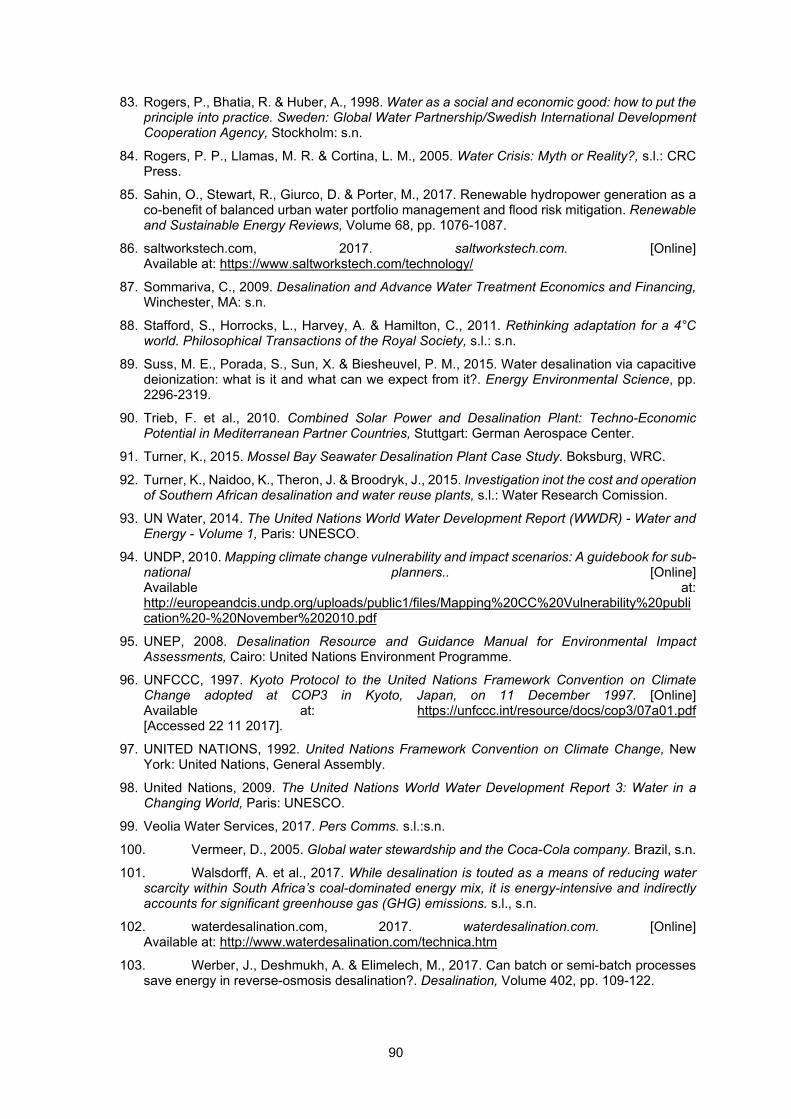
90
83. Rogers, P., Bhatia, R. & Huber, A., 1998. Water as a social and economic good: how to put the principle into practice. Sweden: Global Water Partnership/Swedish International Development Cooperation Agency, Stockholm: s.n.
84. Rogers, P. P., Llamas, M. R. & Cortina, L. M., 2005. Water Crisis: Myth or Reality?, s.l.: CRC Press.
85. Sahin, O., Stewart, R., Giurco, D. & Porter, M., 2017. Renewable hydropower generation as a co-benefit of balanced urban water portfolio management and flood risk mitigation. Renewable and Sustainable Energy Reviews, Volume 68, pp. 1076-1087.
86. saltworkstech.com, 2017. saltworkstech.com. [Online] Available at: https://www.saltworkstech.com/technology/
87. Sommariva, C., 2009. Desalination and Advance Water Treatment Economics and Financing, Winchester, MA: s.n.
88. Stafford, S., Horrocks, L., Harvey, A. & Hamilton, C., 2011. Rethinking adaptation for a 4°C world. Philosophical Transactions of the Royal Society, s.l.: s.n.
89. Suss, M. E., Porada, S., Sun, X. & Biesheuvel, P. M., 2015. Water desalination via capacitive deionization: what is it and what can we expect from it?. Energy Environmental Science, pp. 2296-2319.
90. Trieb, F. et al., 2010. Combined Solar Power and Desalination Plant: Techno-Economic Potential in Mediterranean Partner Countries, Stuttgart: German Aerospace Center.
91. Turner, K., 2015. Mossel Bay Seawater Desalination Plant Case Study. Boksburg, WRC.
92. Turner, K., Naidoo, K., Theron, J. & Broodryk, J., 2015. Investigation inot the cost and operation of Southern African desalination and water reuse plants, s.l.: Water Research Comission.
93. UN Water, 2014. The United Nations World Water Development Report (WWDR) - Water and Energy - Volume 1, Paris: UNESCO.
94. UNDP, 2010. Mapping climate change vulnerability and impact scenarios: A guidebook for sub-national planners.. [Online] Available at: http://europeandcis.undp.org/uploads/public1/files/Mapping%20CC%20Vulnerability%20publication%20-%20November%202010.pdf
95. UNEP, 2008. Desalination Resource and Guidance Manual for Environmental Impact Assessments, Cairo: United Nations Environment Programme.
96. UNFCCC, 1997. Kyoto Protocol to the United Nations Framework Convention on Climate Change adopted at COP3 in Kyoto, Japan, on 11 December 1997. [Online] Available at: https://unfccc.int/resource/docs/cop3/07a01.pdf [Accessed 22 11 2017].
97. UNITED NATIONS, 1992. United Nations Framework Convention on Climate Change, New York: United Nations, General Assembly.
98. United Nations, 2009. The United Nations World Water Development Report 3: Water in a Changing World, Paris: UNESCO.
99. Veolia Water Services, 2017. Pers Comms. s.l.:s.n.
100. Vermeer, D., 2005. Global water stewardship and the Coca-Cola company. Brazil, s.n.
101. Walsdorff, A. et al., 2017. While desalination is touted as a means of reducing water scarcity within South Africa’s coal-dominated energy mix, it is energy-intensive and indirectly accounts for significant greenhouse gas (GHG) emissions. s.l., s.n.
102. waterdesalination.com, 2017. waterdesalination.com. [Online] Available at: http://www.waterdesalination.com/technica.htm
103. Werber, J., Deshmukh, A. & Elimelech, M., 2017. Can batch or semi-batch processes save energy in reverse-osmosis desalination?. Desalination, Volume 402, pp. 109-122.
91
104. Westerling, K., 2015. ED vs. RO: The Benefits Of Electrodialysis For Desalination. [Online] Available at: http://www.wateronline.com/doc/ed-vs-ro-the-benefits-of-electrodialysis-for-desalination-0001 [Accessed 26 01 2017].
105. World Bank, 2012. Renewable Energy Desalination:An Emerging Solution to Close the Water Gap in the Middle East and North Africa, Washington DC: World Bank.
106. World Factbook, 2017. SA. Country Factbook - IndexMundi. [Online] Available at: https://www.indexmundi.com/factbook/ [Accessed 17 11 2017].
107. World Resources Institute, 2017. Aqueduct Projected Water Stress Country Rankings. [Online] Available at: http://www.wri.org/resources/data-sets/aqueduct-projected-water-stress-country-rankings [Accessed 12 12 2017].
108. World Water Commission, 2000. A Water Secure World: Vision for Water, Life, and the Environment, The Hague, The Netherlands: s.n.
109. WRC, n.d. Energy Recovery Devices (ERDs) for Energy Recovery at Desalination Plants: VWS South Africa Plants. [Online] Available at: www.wrc.org.za/Lists/Knowledge%20Hub%20Items/Attachments/10297/SA-SC%20-%20South%20Cape%20-%20ERDs%20for%20desalination%20plants.docx [Accessed 22 11 2017].
110. Xie, J. et al., 2009. Addressing China’s Water Scarcity: Recommendations for Selected Water Resource Management Issues, Washington DC: The World Bank.

92

93
APPENDIX A: REGULATORY APPROVALS
1. National Environmental Management Act (NEMA) and EIA Regulations
The NEMA, Act 107 of 1998, as amended, is South Africa’s overarching environmental legislation. NEMA contains a comprehensive legal framework to give effect to the environmental rights contained in section 24 of The Constitution. Section 2 of NEMA contains environmental principles that form the legal foundation for sustainable environmental management in South Africa.
NEMA places a duty to care on all persons who may cause significant pollution or degradation of the environment. Consequently, a proponent of any development must take “reasonable steps” to prevent pollution or degradation of the environment, which may result from the proposed activities. These reasonable steps include investigating and evaluating the potential impact and identifying means to prevent an unacceptable impact on the environment, and containing and minimising potential impacts where they cannot be eliminated.
Section 24 of NEMA stipulates that certain identified activities may not commence without an environmental authorisation. Section 24(1) of NEMA requires applicants to consider, investigate, assess and report the potential environmental impact of these activities. The requirements for the investigation, assessment and communication of potential environmental impacts are contained in the so-called 2014 EIA Regulations (GN R.982, R. 983, R. 984 and R. 985; 4 December 2014).
Based on the potential significance of impacts, the regulations identify specific activities that are either subject to a basic assessment process, or more comprehensive scoping and EIA process in order to obtain an environmental authorisation. The listed activities that would be (or are likely to be) associated with a desalination plant are listed below.
Table 19: Potential NEMA listed activities
Listing Notice
Activity Number
Activity Description
GN R.983 basic assessment activities
14 The development of facilities or infrastructure, for the storage, or for the storage and handling, of a dangerous good, where such storage occurs in containers with a combined capacity of 80 cubic metres or more but not exceeding 500 cubic metres (Treatment Chemical Storage).
15 The development of structures in the coastal public property where the development footprint is bigger than 50 square metres, excluding– (i) the development of structures within existing ports or harbours that will
not increase the development footprint of the port or harbour; (ii) the development of a port or harbour, in which case activity 26 in Listing
Notice 2 of 2014 applies; (iii) the development of temporary structures within the beach zone where
such structures will be removed within 6 weeks of the commencement of development and where indigenous vegetation will not be cleared; or
(iv) activities listed in activity 14 in Listing Notice 2 of 2014, in which case that activity applies.
16 The development and related operation of facilities for the desalination of water with a design capacity to produce more than 100 cubic metres of treated water per day.

94
Listing Notice
Activity Number
Activity Description
17 Development– (i) in the sea; (ii) in an estuary; (iii) within the littoral active zone; (v) if no development setback exists, within a distance of 100 metres inland
of the high-water mark of the sea or an estuary, whichever is the greater;
in respect of– (a) fixed or floating jetties and slipways; (e) buildings of 50 square metres or more; or (f) infrastructure with a development footprint of 50 square metres or more– but excluding– (aa) the development of infrastructure and structures within existing ports or
harbours that will not increase the development footprint of the port or harbour;
(bb) where such development is related to the development of a port or harbour, in which case activity 26 in Listing Notice 2 of 2014 applies;
(cc) the development of temporary infrastructure or structures where such structures will be removed within 6 weeks of the commencement of development and where indigenous vegetation will not be cleared; or
(dd) where such development occurs within an urban area.
19 The infilling or depositing of any material of more than 5 cubic metres into, or the dredging, excavation, removal or moving of soil, sand, shells, shell grit, pebbles or rock of more than 5 cubic metres from – (i) a watercourse; (ii) the seashore; or (iii) the littoral active zone, an estuary or a distance of 100 metres inland of
the high-water mark of the sea or an estuary, whichever distance is the greater but excluding where such infilling, depositing, dredging, excavation, removal or moving–
(a) will occur behind a development setback; (b) is for maintenance purposes undertaken in accordance with a
maintenance management plan; or (c) falls within the ambit of activity 21 in this Notice, in which case that
activity applies.
53 The expansion and related operation of facilities for the desalination of water where the design capacity will be expanded to produce an additional 100 cubic metres or more of treated water per day.

95
Listing Notice
Activity Number
Activity Description
GN R.984 EIA activities
6 The development of facilities or infrastructure for any process or activity which requires a permit or licence in terms of national or provincial legislation governing the generation or release of emissions, pollution or effluent, excluding– (i) activities which are identified and included in Listing Notice 1 of 2014; (ii) activities which are included in the list of waste management activities
published in terms of section 19 of the National Environmental Management: Waste Act, 2008 (Act No. 59 of 2008) in which case the National Environmental Management: Waste Act, 2008 applies; or
(iii) the development of facilities or infrastructure for the treatment of effluent, waste water or sewage where such facilities have a daily throughput capacity of 2000 cubic metres or less.
9 The development of infrastructure exceeding 1000 metres in length for the bulk transportation of water or storm water– (i) with an internal diameter of 0.36 metres or more; or (ii) with a peak throughput of 120 litres per second or more; excluding where– (a) such infrastructure is for bulk transportation of water or storm water or
storm water drainage inside a road reserve; or (b) where such development will occur within an urban area
14 The development and related operation of– (i) an island; (ii) anchored platform; or (iii) any other structure or infrastructure on, below or along the sea bed;
excluding– (a) development of facilities, infrastructure or structures for aquaculture
purposes; or (b) the development of temporary structures or infrastructure where such
structures will be removed within 6 weeks of the commencement of development and where indigenous vegetation will not be cleared.
26 Development– (i) in the sea; (ii) in an estuary; (iii) within the littoral active zone; (v) if no development setback exists, within a distance of 100 metres inland
of the high-water mark of the sea or an estuary, whichever is the greater;
in respect of– (c) inter- and sub-tidal structures for entrapment of sand; (d) breakwater structures; (g) tunnels; or (h) underwater channels; but excluding the development of structures within existing ports or harbours that will not increase the development footprint of the port or harbour.

96
Listing Notice
Activity Number
Activity Description
GN R.985 basic assessment activities
2 The development of reservoirs for bulk water supply with a capacity of more than 250 cubic metres (different applicable areas per province).
12 The clearance of an area of 300 square metres or more of indigenous vegetation except where such clearance of indigenous vegetation is required for maintenance purposes undertaken in accordance with a maintenance management plan (different applicable areas per province).
14 The development of– (iii) bridges exceeding 10 square metres in size; (vi) bulk storm water outlet structures exceeding 10 square metres in size; (viii) jetties exceeding 10 square metres in size; (ix) slipways exceeding 10 square metres in size; (x) buildings exceeding 10 square metres in size; (xii) infrastructure or structures with a physical footprint of 10 square metres
or more; where such development occurs– (a) within a watercourse; (c) if no development setback has been adopted, within 32 metres of a
watercourse, measured from the edge of a watercourse; excluding the development of infrastructure or structures within existing ports or harbours that will not increase the development footprint of the port or harbour (different applicable areas per province).
2. National Water Act, 1998 (Act No. 36 of 1998) [NWA]
The National Water Act (NWA), 1998 (Act 36 of 1998), aims to manage national water resources in order to achieve sustainable use of water for the benefit of all water users. This requires that the quality of water resources is protected, and integrated management of water resources takes place. In terms of the NWA, a water-use licence application is required for:
a) taking water from a water resource; b) storing water; c) impeding or diverting the flow of water in a watercourse; d) engaging in a streamflow reduction activity contemplated in section 36; e) engaging in a controlled activity identified as such in section 37 (1) or declared under
section 38(1); f) discharging waste or water containing waste into a water resource through a pipe, canal, sewer,
sea outfall or other conduit; g) disposing of waste in a manner which may detrimentally impact on a water resource; h) disposing in any manner of water which contains waste from, or which has been heated in, any
industrial or power generation process; i) altering the bed, banks, course or characteristics of a watercourse; j) removing, discharging or disposing of water found underground if it is necessary for the efficient
continuation of an activity or for the safety of people; and k) using water for recreational purposes.
A number of the above activities are likely to be applicable to a desalination plant depending on the proposed location of the plant, hence a water-use licence is likely to be required.

97
3. National Environmental Management: Waste Act (Act No. 59 of 2008) [NEMWA]
The NEMWA was enacted on 10 March 2009 and came into force on 01 July 2009. NEMWA was published in 2008 to, among other objectives, to:
• Reform the law regulating waste management in order to protect health and the environment by providing reasonable measures for the prevention of pollution and ecological degradation and for securing ecologically sustainable development.
• Provide for national norms and standards for regulating the management of waste by all spheres of government.
• Provide for specific waste management measures.
According to section 19(1) and 19(3) of the NEMWA, the Minister may publish a list of waste management activities that have, or are likely to have, a detrimental effect on the environment and must specify whether a waste management licence is required to conduct these activities. Under these provisions, a list of Category A, Category B and Category C waste management activities were published via General Notice No: 921 on 29 November 2013 as Schedule 1 to NEMWA. Category A and Category B activities require a waste management licence in terms of section 20(b) of NEMWA, whereas Category C activities require that the person conducting these activities complies with the relevant requirements or standards as stated in GN. R.921.
In terms of this notice, a person who wishes to commence, undertake or conduct any of these listed activities must, as part of the waste management licence application, conduct either a basic assessment process (for Category A activities), or a scoping and EIA (for Category B) as stipulated in the EIA Regulations (GN R.982). Activities listed under Category C do not require a basic assessment or scoping and EIA.
Anticipated wastes to be created and managed at a desalination plant would include but not be limited to:
• Concentrated brine.
• Sludge from a clarifier.
• Used chemicals and chemicals containers.
The listed activities regarding treatment of waste specifically exclude effluent and waste water; thus, these are not expected to be applicable.
The storage of waste must be in accordance with national norms and standards for the storage of waste. Table 20 shows the NEMWA listed waste management activities listed under GN R.921 applicable to the proposed facility.
Table 20: NEMWA listed waste management activities listed under GN R.921
Applicable Category B (Scoping and EIA) Activities
Category B – Activity (7) The disposal of any quantity of hazardous waste to land (applicable if brine disposal ponds will be implemented, as opposed to marine discharge).
Category B – Activity (10) The construction of facilities for a waste management activity listed in Category B of this schedule (not in isolation to associated activity).

98
4. National Environmental Management: Biodiversity Act, 2004 (Act No. 10 of 2004) [NEMBA]
The objectives of NEMBA are:
• To provide for: o The management and conservation of biological diversity within the Republic and of
the components of such biological diversity. o The use of indigenous biological resources in a sustainable manner. o The fair and equitable sharing among stakeholders of benefits arising from
bioprospecting involving indigenous biological resources.
• To give effect to ratified international agreements relating to biodiversity which are binding on the Republic.
• To provide for co-operative governance in biodiversity management and conservation.
• To provide for a South African National Biodiversity Institute to assist in achieving the objectives of the Act.
Permits may be required if the desalination plant affects sensitive ecosystems, fauna and/or flora.
5. National Heritage Resources Act, 1999 (Act No. 25 of 1999) [NHRA]
The aims of the NHRA are to manage national heritage resources in an integrated and interactive way, and to encourage the public to conserve heritage resources for future generations. The Act also provides guidelines to manage heritage resources throughout South Africa. The NHRA states in section 38 that the relevant heritage resources authority must be notified of the proposed development/ activities where such activities trigger either of the following:
• The construction of a linear development (road, wall) or barrier exceeding 300 m in length.
• The construction of a bridge or similar structure exceeding 50 m in length.
• Any development or activity which will change the character of a site: o Exceeding 5000 m2 (½ ha) in extent; or o Involving three or more existing erven or subdivision thereof; or o Involving three or more existing erven or subdivision thereof which have been
consolidated within the past 5 years; or
• The rezoning of a site exceeding 10 000 m2 (1 ha) in extent.
6. Integrated Coastal Management Act (Act No. 24 of 2008) [ICMA]
Chapter 8 of the ICMA regulates the discharge of effluent into coastal waters from any source on land, by requiring permits to authorise such discharges. A desalination plant requires a Coastal Waters Discharge Permit in terms of the ICMA in order to permit the disposal and discharge of effluent to sea.
7. The Maritime Zones Act (Act No. 15 of 1994)
The Act serves to demarcate maritime zones in South Africa, and deals with matters of instillations, maritime casualties and self-defence within these zones. The Act defines territorial waters as the sea within a distance of 12 nautical miles from the baseline (lowest water level), and the economic zone as within 200 nautical miles of the baseline. The economic zone is the area in which South Africa has the same rights in respect of resources as it has in territorial waters.
8. Protected Areas Act (Act No. 57 of 2003)
The Protected Areas Act aims to protect and conserve ecologically viable areas that represent South Africa’s biodiversity and natural landscapes, as well as to establish a register of protected areas in order to manage them in accordance with national norms and standards. Activities in protected area are regulated and can be restricted.
99
APPENDIX B: POLICY AND LEGISLATIVE CONTEXT FOR THE WATER-ENERGY CLIMATE CHANGE NEXUS
1. Constitution of the Republic of South Africa (Act No. 108 of 1996)
The Constitution of the Republic of South Africa commits government to take reasonable measures, within its available resources, to ensure that all South Africans have access to adequate housing, health care, education, food, water and social security. The Constitution is the overarching document that guides all the other legislative and policy instruments adopted by the government. In context of the water-energy climate nexus:
• National energy and water resources need to be adequately tapped and delivered to cater for the needs of the nation.
• Energy and water should be made available and affordable to all citizens, irrespective of geographic location.
• The production and distribution of energy and water should be sustainable and lead to an improvement in the standard of living of citizens.
2. Policies and Plans Relevant to Water-Energy Climate Change Nexus
White Paper on a National Water Policy for South Africa (1997)
The White Paper is aimed at guiding the management of water in the country. Its objectives are equity in access to water services, water resources and benefits from water resource use (DWAF, 1997). The policy highlights the need to focus on efficiency, effectiveness and demand-side management in water utilisation to promote water conservation. The policy also covers elements of protecting water resources.
White Paper on the Energy Policy of South Africa (1998)
The White Paper prescribes energy policy and formulation that promotes sustainable development by highlighting equity and the sustainable use of natural resources. The policy was created with the following objectives:
• Increasing access to affordable energy services for disadvantaged household’s small business, small farms and community services.
• Improving energy governance by defining responsibilities and roles of the different government institutions.
• Simulating economic growth by promoting competition in the energy markets in an investor friendly climate.
• Reaching a balance between exploitation of fossil fuels and maintenance of environmental requirements.
• Securing energy supply thought diversity.
Revised White Paper on Renewable Energy Policy (2010)
The renewable energy policy provides a basis, with vision and commitments, for developing the potential for the national energy service needs to be met by more optimal utilisation of the country’s rich endowment of renewal energy resources.
• It provides a basis for the rapid and sustained deployment of renewable energy technologies over the next 20 years until 2030 and moves South Africa into line with international progress in energy planning.

100
• Such renewal energy supply is targeted to a minimum of 27% of the national energy demand by 2030 while also contributing to: (i) increase access to energy services, (ii) creating increased employment, (iii) maximising the use of natural resources, (iv) reducing greenhouse gas emissions and water use, and (v) growing the economy.
• It identifies 20 individual renewal market segments and describe their policies, purpose, specific targets for 2013, 2015, 2020 and 2030, and implementation strategy allocation resources and responsibilities.
National Climate Change Response Policy (2011)
The National Climate Change Response Policy (NCCRP) focuses on mitigation by reducing energy generation and use sector emissions. The NCCRP notes that reduced emissions should come from greater energy efficiency, demand management and moving to a less emission-intensive energy mix. It notes several flagship initiatives including the Renewable Energy Flagship Programme, the Energy Efficiency and Energy Demand Management Flagship Programme, the Carbon Capture and Sequestration Flagship Programme, and the Water Conservation and Demand Management (WCWDM) Programme, which is to be implemented in the mining, industrial, electricity, agriculture and water service sectors.
In the implementation of the emission reduction elements, government has proposed a carbon tax. The government aims to integrate the carbon tax with other measures to achieve emission reductions, increased energy efficiency and increased productivity, competitiveness and local manufacturing of green technologies. The tax will be used as a compliance tool, in relation to the set emission reduction objectives per sector (and measures to achieve them), in order to drive energy efficiency, improve productivity and increase investment in green technology.
The Integrated Resource Plan (IRP) 2010
The IRP (2010–2030) provides a long-term cost-effective resource plan for meeting electricity demand which is consistent with reliable electricity supply and environmental, social and economic policies. The IRP is designed to be revised every two years with the next revision being planned in 2013. Theoretically, the IRP aims to identify the requisite investments in the electricity sector that maximise the national interest. While in practice, it identifies the investment in the electricity sector that allows the country to meet the forecasted demand with minimum cost to the country.
• The IRP provides for a diversified energy mix, in terms of new generation capacity, that will comprise inter alia, renewable energy carriers, which include hydro at 6.1%, wind at 19.7%, concentrated solar power at 2.4% and PV at 19.7%.
• Under the IRP, the Department of Energy committed to produce 8400 MW from PV, 8400 MW from wind and 1000 MW from concentrated solar power through the Renewable Energy Independent Power Producer Programme by 2030. Firm commitment to renewable energy projects is necessary to realise these targets.
• Furthermore, the IRP 2010 has allocated 42% of new energy generating capacity from renewable sources over the next two decades, translating to a renewable energy share from 0% to 9% by 2030.

101
Integrated Energy Plan (IEP)
The purpose of the IEP is to provide a roadmap of the future energy landscape for South Africa, which guides the future energy infrastructure investments and policy development. Eight objectives were identified as part of the IEP:
• Ensuring the security of energy supply.
• Minimising the cost of energy.
• Promoting the creation of jobs and localisation.
• Minimising negative environmental impacts from the energy sector.
• Promoting the conservation of water.
• Diversifying supply sources and primary sources of energy.
• Promoting energy efficiency in the economy.
• Increasing access to modern energy.
National Development Plan 2030
The NDP is an economic policy framework that “aims to eliminate poverty and reduce inequality by 2030”. The NDP is divided into 13 chapters that address the most pressing challenges facing South Africa and provide envisaged solutions to these challenges in the form of proposals and actions. The plan outlines sector-specific goals and a vision for South Africa to be achieved by the year 2030. The plan also deals with water and energy issues. Sufficient, reliable and affordable energy and water supply are fundamental pillars of the NDP.
The Water for Growth and Development (WfGD)
The WfGD framework is a planning programme ensuring continued water to developing areas. It is supported by existing legislation and policy but needs continued political support. This programme is in line with the Strategic Framework for Water Services and the NWRS. NDPs need to take due cognisance of the constraints imposed by water scarcity, and planning should consider technical, economic, socio-economic and environmental impacts.
3. National Legislation Relevant to Water-Energy Climate Change Nexus
NWA, No. 36 of 1998
The NWA, published in 1998, provides the legal framework for the effective and sustainable management of our water resources. Providing water resources of sufficient quantity and quality to meet the requirements of the Reserve (basic human needs and ecological reserves) is the priority. But there are other priorities that need to be met before water can be allocated to WMAs. To meet these priorities, a portion of water in each WMA is placed under the direct control of the Minister. The Act recognises that to achieve sustainability, equity and efficiency, water resources need to be managed in an integrated manner.
National Energy Act, No. 34 of 2008
This Act aims at development and maintenance of sources of energy and infrastructure for the storage, transportation and distribution of energy in the Republic of South Africa and for this purpose establishes the South African National Energy Development Institute (SANEDI) and charges this institution and other competent authorities with duties and powers in the field of integrated energy planning and development. This regulatory instrument compels the Minister of Energy to develop and publish an IEP. The Minister derives the power to determine and publish the IRP from the Electricity Regulations on New Generation Capacity of 2009, which in turn are promulgated in terms of the Electricity Regulation Act of 2006.
102
National Energy Regulation Act, No. 40 of 2004
The National Energy Regulator Act establishes a single regulator to regulate the electricity, piped-gas and petroleum pipeline industries of South Africa.
Amended Energy Regulations Act, No. 2006
The Act aims:
“To establish a national regulatory framework for the electricity supply industry; to make the National Energy Regulator the custodian and enforcer of the national electricity regulatory framework; to provide for licences and registration as the manner in which generation, transmission, distribution, trading and the import and export of electricity are regulated; and to provide for matters connected therewith.”
The Act also seeks the diversification of energy sources, allowing the National Energy Regulator of South Africa (NERSA) to identify sources from which electricity should be generated from, and in what proportions.
NEMA, No. 107 of 1998
The Act provides for co-operative environmental governance by establishing principles for decision-making on matters affecting the environment, institutions that will promote co-operative governance and procedures for co-ordinating environmental functions exercised by organs of state; to provide for certain aspects of the administration and enforcement of other environmental management laws; and to provide for matters connected therewith. In context of water-energy climate nexus the following is noted:
• In terms of section 24 of the NEMA, renewable energy developments are subject to obtaining environmental authorisation a process which requires public participation and submission of detailed reports.
• Section 2(a) requires that development must be socially, environmentally and economically sustainable.
• Section 2[4(a)(vi)] of the NEMA promotes avoiding pollution and degradation of the environment by stating that “... the development, use and exploitation of renewable resources and the ecosystems of which they are part do not exceed the level beyond which their integrity is jeopardised”.
• Also in terms of section 2 of the NEMA, renewable energy developments are expected to adhere to the national environmental principles stipulated therein including social, environmental and economic sustainability.
• Developers need to assess their impact on the environment and establish management plans to minimise those impacts and ensure local health and safety.
4. Strategies Relevant to Water-Energy Climate Change Nexus
NWRS2
The NWRS provides a roadmap on how water should be used, protected, conserved, distributed and managed for the benefit of all South Africans. NWRS2 recognises that “South Africa’s growing economy and social development is giving rise to the growing demands for water”. The NWRS2 considers a range of options for balancing supply and demand, which include WCWDM, and the desalination of seawater. Both options have energy implications. It is noted that desalination is an energy-intensive process. So, a decrease in water consumption would result in a reduction in the energy demand for pumping, treatment and heating of water. The NWRS2 acknowledges that the water-energy connection

103
should receive more attention to ensure that policies that transition to a sustainable, low-carbon South African economy are achieved.
The Strategic Framework for Water Resources (SFWR)
The SFWR sets out a comprehensive approach with respect to the provision of water resources, ranging from small rural areas to industries in the largest urban areas. It outlines the change in approach needed to achieve policy goals. Water services refer to water supply and sanitation services and include regional water schemes, local water schemes, on-site sanitation and the collection and treatment of waste water.
Energy Efficiency Strategy
In November 2012, Cabinet approved South Africa’s revised energy efficiency strategy. This Strategy links the energy sector with other government initiatives, and recognises the potential for improvements in energy efficiency across all economic sectors. It should be noted that the water sector is also an energy user. Energy is used in water abstraction, treatment and conveyance. Thus, implementation of energy efficiency in this sector can contribute to environmental, social and economic sustainability. It should also be noted that different desalination technology options have varying energy efficiency characteristics.