Framework on concepts of quality sec- 11 mar2011
61
Topics in the Document Evolution of the concept of Quality (Industrial Revolution) Need for Quality Definitions of Quality Dimensions of Quality Quality Control Tools Measurement of Quality Factors Influencing Quality Methods to Assure Quality
-
Upload
kranthi-rainbow -
Category
Leadership & Management
-
view
228 -
download
0
Transcript of Framework on concepts of quality sec- 11 mar2011

Topics in the Document
Evolution of the concept of Quality (Industrial Revolution)
Need for Quality
Definitions of Quality
Dimensions of Quality
Quality Control Tools
Measurement of Quality
Factors Influencing Quality
Methods to Assure Quality

Framework on Concepts of Quality 15MAR2011
Prepared By: Kranthi Page 2 of 61
Evolution of the concept of Quality

Framework on Concepts of Quality 15MAR2011
Prepared By: Kranthi Page 3 of 61
With the basics of changes in the activities of human to fulfill their basic needs (Food, Clothing, and
Shelter); we have two remarkable revolutions in history. They are:
Neolithic Revolution: The Neolithic revolution can be defined as a transition of the human race from
a food gathering society into a food producing society. The Neolithic revolution is thought to have
taken place in the period between 8000 and 6000 B.C. During this period humans settled down in
particular areas to cultivate food crops rather than traveling from place to place gathering what they
required. Many social, political and economic changes happened during this period.The Neolithic
Revolution is the first agricultural revolution—the transition from hunting and gathering to agriculture
and settlement.
Industrial Revolution: The Industrial Revolution was a transformation of human life circumstances
that occurred in the late eighteenth and early nineteenth centuries (roughly 1760 to 1840) in Britain,
the United States, and Western Europe due in large measure to advances in the technologies of
industry. The Industrial Revolution was characterized by a complex interplay of changes in
technology, society, medicine, economy, education, and culture in which multiple technological
innovations replaced human labor with mechanical work, replaced vegetable sources like wood with
mineral sources like coal and iron, freed mechanical power from being tied to a fixed running water
source, and supported the injection of capitalist practices, methods, and principles into what had been
an agrarian society.
Evolution of the concept of Quality:
There was a time, not so long ago in the 1940‘s when the concept of quality was almost non-existent.
The quality movement took almost four decades to become a strong force. It is only now that
adherence to quality is believed to yield tangible benefits like reduced costs or increased customers.
During the Second World War, a number of bombs exploded in factories during assembly. As a result,
factories were required to document their procedures and to provide records to show that they were
followed. They were then inspected to prove conformity to defined procedures.
Juran is the founder of Juran Institute and Juran Foundation (presently known as Juran Centre at the
University of Minnesota in U.S) and brain behind starting the Malcolm Baldrige National Quality
Award. He also developed many statistical tools for quality, which are widely in use.
J.M. Juran visited Japan for the first time in 1954. It was a time when there were very few buildings in
Tokyo and bicycles the primary means of transportation.
Japan was then perceived as a country, which produced and sold poor quality products. Americans
and Europeans looked down on Japanese products since they were convinced that Japanese
products were replicas of American and Western design products.
However, Juran observed the seeds of revolution, which would engulf Japan- a revolution that would
change the very face of Japan.

Framework on Concepts of Quality 15MAR2011
Prepared By: Kranthi Page 4 of 61
Juran had gone to conduct lectures and plant visits. One thing he noticed among the participants of
his lectures was the resolve to bring about quality in all their business activities and to produce top
class quality products. Their determination was evident from the participation of top industrial
managers and CEOs in Juran‘s lectures.
These managers and CEOs invested in training their employees on quality and its tools. They also
ascertained that the lower level of management like the foreman, frontline personnel were involved
too. The management also sent some of the teams to visit foreign countries. They would be required
to study the approaches followed by other companies globally.
Most of the existing books on quality were written in other languages. A lot of this literature was being
translated into Japanese to enable everyone to read and understand them.
The role of Dr. Deming and Japanese Union of Science and Engineers (JUSE) in initiating this interest
in Quality in Japan cannot be denied. Deming was a famous statistician who extended the statistical
methodology to introduce the PDCA (Plan, Do, Check, Act) cycle to improve quality. In 1947 the
American section of industrialists in Japan invited him to share his views on quality. His ideologies
and thoughts became so popular in Japan that he was asked to return for more lectures. Apart from
Deming, many other coordinators from JUSE (Japanese Union of Science and Engineers) conducted
various seminars and courses. They made the Japanese aware of the various quality control tools
and principles.
Some key observations
Some observations made in Japan by Juran during this period are.
1. Focus on quality control tools: Juran observed that the Japanese focused more on the use of
statistical quality control tools and less on the managerial tools for quality control. So did other nations
when they began their journey of quality and quality control.
2. Lack of automation: Juran noticed that most of the Japanese industries lacked proper technology
and mechanization. He attributed this situation to Japan‘s economic condition after the Second World
War. Automation was a costly investment for the Japanese manufacturers in those days. Moreover,
the supply of such advanced technology was very limited. Another important reason why Japan did
not go for automation was that it had plenty of cheap labor to sustain production.
3. Lifetime commitment: Juran was quite surprised that Japanese workers worked at a faster pace
(than those in the west). This was despite the poor working conditions in many of the plants. This
commitment and motivation was traced back to the philosophy of lifelong employment prevailing in
Japanese companies.
4. Lack of Educational Institutions: In those days Japan had the ignominy of being a country, which
copied designs and products produced in other countries. This was because Japan lacked the
institutions where people could study about the latest developments in technology and design. This in

Framework on Concepts of Quality 15MAR2011
Prepared By: Kranthi Page 5 of 61
turn resulted in lack of personnel who were capable of designing new products or applying technology
for new product development. Within a decade later the situation reversed.
Juran‟s visit
Juran visited Japan at the end of 1960. During the six years gap Japan had witnessed a sea change.
Japan‘s real estate was beginning to take off with several high-rise buildings, residential complexes
and plants.
The standard of living saw a marked increase and Japan was beginning to look like an industrialized
nation. Automated equipment was gradually but surely replacing manually operated machines.
Quality too had improved in Japan. Earlier the Japanese laid great emphasis on statistical tools. Now
they were beginning to look quality from a bigger perspective. The management of quality was being
given great importance.
All levels of management were being trained. Training in quality was not only being offered through
seminars but was also being broadcast through the media (radio and television). Another important
development Juran witnessed was the Deming‘s prize. Companies were beginning to implement
principles on which Deming‘s award was built. Several nation wide standards were being created not
just in terms of product quality and specifications but also the application of quality tools and
techniques.
Another development that Juran noticed was the birth of the concept of the company wide
involvement in quality. In the western world quality was a prerogative of quality department. In Japan
however it was the responsibility of everyone. The top management demonstrated their involvement
by conducting and reviewing yearly quality performance. The lower level workforce were made
responsible for quality and trained to ensure it. This organization wide involvement in quality
eventually led to the birth of quality circles.
Quality circles
The quality circles movement began in Japan in the year 1962. A quality circle would consist of
workers/employees from the same company/unit. Headed by a foreman or a manager they meet
periodically to discuss various issues relating to quality.
The main objectives of the quality circles are,
• Chalking out measures that enhance the unit/organization‘s performance.
• Protecting human relations and creating a working environment that fosters creativity.
• Leveraging human capabilities to improve organizational and individual performance.

Framework on Concepts of Quality 15MAR2011
Prepared By: Kranthi Page 6 of 61
Juran had heard about this concept even before his visit to Japan in the 60‘s. However at that time he
had failed to understand either its value or its principles. It was during his second visit that he could
see the circle phenomenon operating in many Japanese companies.
Realizing the benefits of quality circles, Juran decided to make foreign countries aware of it. Juran
started introducing the concept and its benefits during various national and international conferences.
The concept was also promoted through various publications in paper, courses, seminars and
lectures.
The Japanese perception of goods eventually changed. While earlier Japanese goods were looked
down upon for their poor quality, now they were beginning to be recognized for their better quality.
Their adherence to quality and its principles helped gain a better market share for their products.
In certain industries, Japan was actually giving companies in other parts of the world a run for their
money. The impact of the quality revolution in Japan was also seen in different forms, some of which
are explained below.
Rather than facing the Japanese business counterparts as rivals, few foreign competitors collaborated
with the Japanese companies. This helped the Japanese get better access to foreign markets and
trends. The collaboration also helped the Japanese adapt various best practices and systems that
these foreign companies followed.
Similarly, foreign countries also became aware of the quality control movement in Japan. They began
understanding the Japanese quality control revolution by attending the various seminars and lectures
in Japan. They were so impressed with the results that they initiated certain activities that would help
implement quality control principles in their industries.
Quality changed everything
The 60‘s is thus considered a golden decade for the Japanese quality control. It was during this period
that Japan began experiencing the benefits of the quality movement.
Decade of troubles
During the 70‘s, Japan and most other developing nations faced several problems. Japan was facing
a major crisis because of the limited supply of energy and other natural resources.
Juran realized that the situation in Japan was quite similar to what the British faced some two hundred
years ago during the industrial revolution. At that time Britain and its surrounding islands were getting
highly populated. The resources that were available were consumed rapidly. This led to a crisis.
These similarities apart there were also some differences the process of industrialization in Japan and
that of Britain. Britain‘s colonial system helped it acquire many foreign markets and materials through
conquest. However, this colonist system was absent during Japan‘s rise of industrialization. The

Framework on Concepts of Quality 15MAR2011
Prepared By: Kranthi Page 7 of 61
Japanese explored and conducted trade in foreign countries by meeting all the rules regulations and
other trade policies of the home country.
During that period, Japan also faced other issues related to growing nationalism. Generally, when
nations begin developing they prefer not to have any foreign control or dominance. In Japan too, the
rising nationalism made it further difficult for foreign suppliers to have easy access into the Japanese
markets. They had to meet various trade policies and adhere to various rules to enter the Japanese
market to conduct their business.
Quality challenges
Japan‘s predicament with regard to quality issues in the 70‘s was quite different. The 50‘s and the
60‘s saw Japan emphasizing more on the quality of the products so as to sell its products worldwide.
However, the 70‘s brought in the challenge of sustaining quality and tackling related issues.
Some of the challenges it faced include:
1. Managing and motivating people
The 70‘s brought in the need for Japanese companies to effectively manage the workforce to sustain
quality at their workplace. Some of the issues to be considered were:
a. Job satisfaction.
b. Defining job responsibilities
c. Developing systems to ensure quality
d. Encouraging its employees to accept job rotation
2. Consumer communication
Until the 70‘s, Japanese companies focused on producing quality products and selling them. Now
they had to address consumer issues related to:
a. Providing sufficient information regarding product through labeling and packaging
b. Guiding users in product usage
c. Minimizing pollution and health related issues arising due to use of products
3. Safety and legal responsibility
The Japanese companies had to look into designing safety into products, encouraging safe work
practices, setting standards for minimizing pollution, and tackling legal issues.
4. After-sales service
In the 70‘s Japanese had to focus on developing an effective after sales service network. They also
had to ensure sufficient spare parts inventory and minimize the customer‘s cost of ownership of
product. In short, the Japanese were tackling the next level of quality issues in the 70‘s.

Framework on Concepts of Quality 15MAR2011
Prepared By: Kranthi Page 8 of 61
Change of guard
In the 1950‘s there were many Japanese leaders who helped in setting Japan on the path of quality
and industrialization. They helped in providing the direction and impetus that motivated Japan to
create better quality output. Some of these famous leaders include the Kenichi Koyanagi and
Ishikawa, both associated with JUSE.
Sustaining the quality principles
The quality control revolution helped the Japanese in achieving good quality results. The close of the
70‘s established the need for the Japanese to continue to value their quality journey. It needed a new
generation of leaders and engineers who would take Japan to new levels of quality. These leaders
need to foresee plausible problems lest they should lose out to their competitors.
To lay due emphasis on these new problems, the Japanese needed good leaders who could convince
the people of the new issues resolved. They had to therefore initiate programs that would motivate the
economy to fully utilize various resources. Thereby they would be able to achieve their new goals and
resolve new problems.
Younger generation
Juran happened to interact with the younger generation of Japanese quality leaders during his visit in
the 70‘s. He was glad to observe that the younger generation was enthusiastic in improving the
economy and its quality. Juran hoped that this enthusiasm and commitment of the younger leaders
would lead Japan to becoming a developed nation.
The journey continues
Japan has come a long way from being a nation of copiers to a nation that epitomizes quality. Its
journey to success though has not been easy. It was the commitment from consecutive generations of
Japanese quality and business leaders that helped Japan transform so drastically. Today Japan is
considered one of the leading industrial super powers in the world. Japan owes it all to the quality
movement and other revolutions. This expedition of Japan, which led to its quality evolution, should
serve as an important lesson for other developing nations.
In the 1970s some major organizations such as the Ministry of Defence (MoD) and Ford developed
their own 'quality' management standards which and required their suppliers to define how they
operated and provide evidence that they 'conformed' to the defined procedures - with an implied
quality of product as an outcome.
In 1979, BS5750 was developed as a national standard on what constituted a quality system. In the
1980s, the International Organization for Standardization was persuaded by the British government to
adopt BS 5750 as an international standard, and it became ISO 9000.
Framework on Concepts of Quality 15MAR2011
Prepared By: Kranthi Page 9 of 61
ISO 9000:1987 had the same structure as BS 5750, with three 'models' for quality management
systems:
ISO 9001:1987 Model for quality assurance in design, development, production, installation, and
servicing
ISO 9002:1987 Model for quality assurance in production, installation, and servicing
ISO 9003:1987 Model for quality assurance in final inspection and test
Other relevant standards during this period included the DEF STAN 05/20 series (MoD). DEF STAN
05/21 covered the design, production and service of hardware functions and was broadly equivalent
to the 1969 NATO quality management specifications (AQAP). The US did not impose AQAP
specifications for their defence contractors but introduced MIL-Q-9858 in its place.
The emphasis of ISO 9000:1987 remained on inspection to ensure conformance with procedures. ISO
9000:1994 emphasized quality assurance by means of preventive actions instead of 'just' checking
the final product, but it still required evidence of compliance with documented procedures. So
companies still created volumes of procedure manuals which at times made it more difficult to change
and improve.
ISO 9001:2000 was a more significant update, combining 9001, 9002, and 9003 into one standard. It
also introduced the concept of 'process management'. TC176, the ISO 9001 technical committee is
currently drafting the next release (ISO 9001:2008), which is not expected to have substantial
changes.
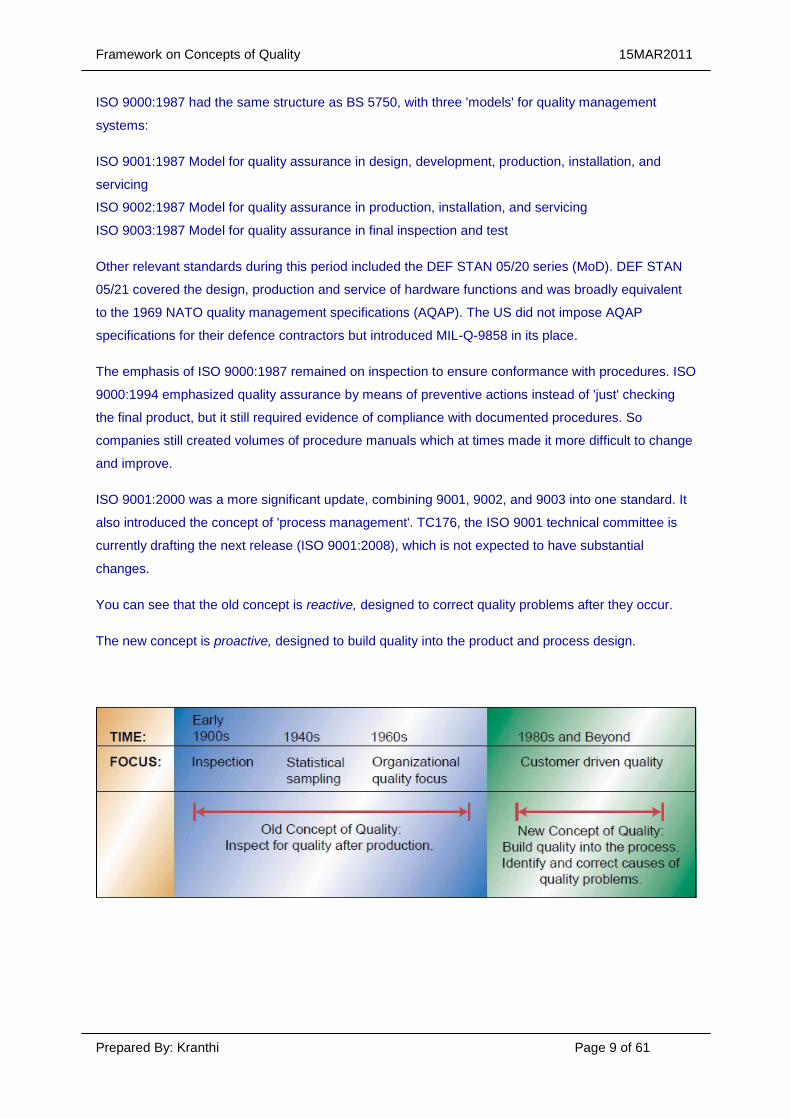
You can see that the old concept is reactive, designed to correct quality problems after they occur.
The new concept is proactive, designed to build quality into the product and process design.

Framework on Concepts of Quality 15MAR2011
Prepared By: Kranthi Page 10 of 61
Unsatisfied customer - Satisfied Customer
Business Loss - Profit
Employee Dissatisfaction - Satisfaction
Costly Product - Economical Product
Need for Quality

Framework on Concepts of Quality 15MAR2011
Prepared By: Kranthi Page 11 of 61
Many definitions have been given for Quality and these are derived from the real time experiences
and expressions of the people. The need for quality can be derived from those definitions and some of
the definitions are given below:
Webster: ―That which makes something what it is; characteristic element; basic nature, kind; the
degree of excellence of a thing; excellence, superiority.‖
ANSI/ASQ: ―The totality of features and characteristics of a product or service that bears on it, ability
to satisfy given needs.‖
Garvin‟s Five Definitions:
Transcendent Definition (Relative Quality) Quality is universally recognizable; it is related to a
comparison of features and characteristics of products.
Product- Based Definition Quality is a precise and measurable variable. Differences in quality reflect
differences in quantity of some product attribute.
User- Based Definition Quality is “fitness for intended use”
Manufacturing Based Definition Quality is “Conformance to specifications.”
Value-Based Definition Quality is defined in terms of costs and prices. A quality product is one
that provides performance at an acceptable price or conformance at an acceptable cost.
Modern Definition: Quality is meeting or exceeding customer expectations
Who is the customer?
External Customers: Recipient of an output but are not part of the organization supplying it.
Internal Customers: Recipients of another person‘s or department‘s output within an organization.
Five Ways of Looking at Quality Definitions
David M. Dilts, Professor of the Faculty of Science at the Universität of Waterloo, Waterloo Ontario,
Canada made a list of quotations according to 5 different targets:
1. Customer - based
"Quality consists of the capacity to satisfy wants."(C.D. Edwards, "The Meaning of Quality", in
Quality Progress Oct.1968)
"Quality is fitness for use." (J.M. Juran, ed. Quality Control Handbook 1988)
2. Manufacturing - based
Framework on Concepts of Quality 15MAR2011
Prepared By: Kranthi Page 12 of 61
"Quality is the degree to which a specific product conforms to a design or specification" (H.L.
Gilmore: Product Conformance Cost. Quality progress June 1974)
"Quality [means] conformance to requirements." (P.B. Crosby: Quality Is Free)
3. Product - based
"Quality refers to the amount of the unpriced attributes contained in each unit of the priced
attribute." (K. B. Leifler: Ambiguous Changes in Product Quality,
American Economic Review Dec.1982)
4. Value - based
"Quality is the degree of excellence at an acceptable price and the control of variability at an
acceptable cost." (R. A. Broh: Managing Quality for Higher Profits, 1982)
5. Transcendent
"Quality is neither mind nor matter, but a third entity independent of the two, even though
Quality cannot be defined, you know what it is." (R. M. Pirsig: Zen and the Art of Motorcycle
Maintenance)
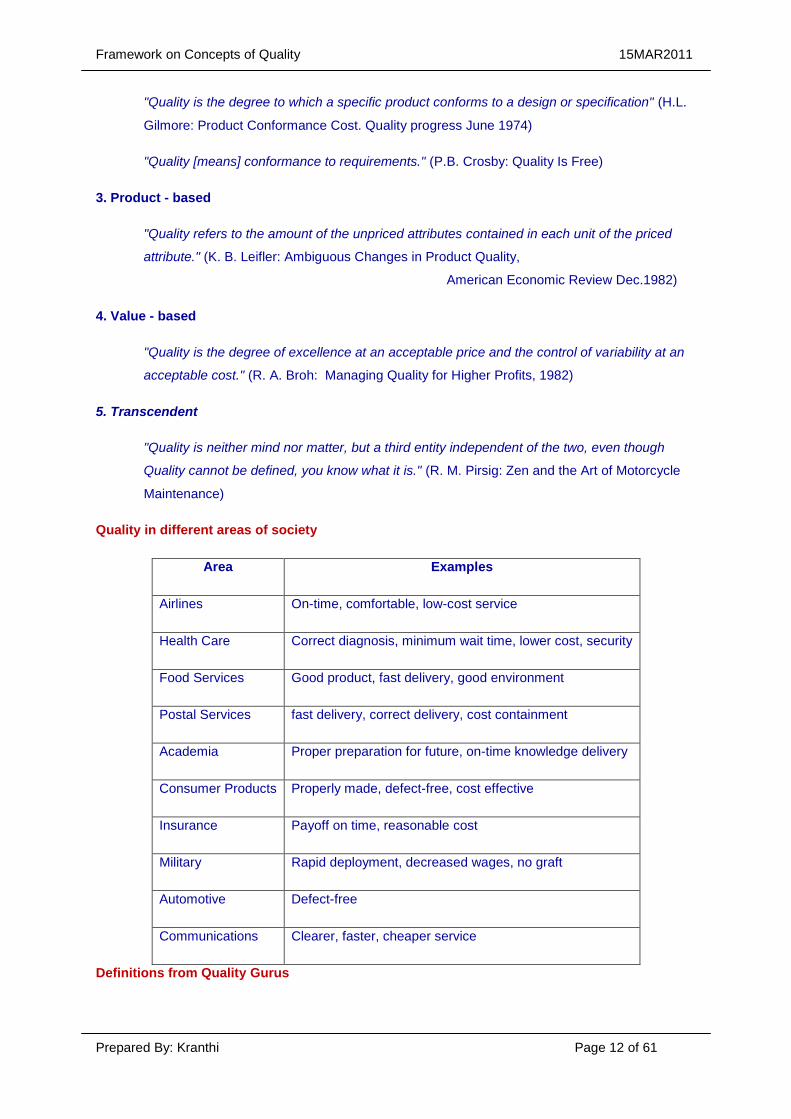
Quality in different areas of society
Area Examples
Airlines On-time, comfortable, low-cost service
Health Care Correct diagnosis, minimum wait time, lower cost, security
Food Services Good product, fast delivery, good environment
Postal Services fast delivery, correct delivery, cost containment
Academia Proper preparation for future, on-time knowledge delivery
Consumer Products Properly made, defect-free, cost effective
Insurance Payoff on time, reasonable cost
Military Rapid deployment, decreased wages, no graft
Automotive Defect-free
Communications Clearer, faster, cheaper service
Definitions from Quality Gurus

Framework on Concepts of Quality 15MAR2011
Prepared By: Kranthi Page 13 of 61
Juran "Quality is fitness for use."
Crosby ―Conformance to requirements‖
Deming ―Meeting or exceeding customer expectations"
Quality Means:
Understand what your customer expects from you
Decide what you can reasonably give in your product
Agree with your customer what you can give
Deliver product to your customer as promised
Quality is the core task of a business. It is not optional.
It is essential for survival
Customer Satisfaction is Ultimate
Give product/service meeting to customer requirements
Keep the price of your product competitive
Deliver product/service to your customer within agreed time
After delivery of the product you should be willing to resolve customer complaint if any, in time
Results of Poor Quality
Your time & effort lost in first making a product with errors and then for re-processing the
same
Your time and effort lost in recalling your product from customer
Your time and effort lost in resolving customer complaints, if any
You may lose future business if your customer remains dissatisfied
Cost of Rectifying Error
0x: Producing right first time
1x: If process owner detects error & rectifies
10x: If error is detected by next process & rectified
100x: If error is detected by Customer (out side the org.)
‗x‘ is cost of rectification of defect
„A stitch in time saves nine‟

Framework on Concepts of Quality 15MAR2011
Prepared By: Kranthi Page 14 of 61
The reason quality has gained such prominence is that organizations have gained an understanding
of the high cost of poor quality. Quality affects all aspects of the organization and has dramatic cost
implications. The most obvious consequence occurs when poor quality creates dissatisfied customers
and eventually leads to loss of business.
However, quality has many other costs, which can be divided into two categories. The first category
consists of costs necessary for achieving high quality, which are called quality control costs. These
are of two types: prevention costs and appraisal costs. The second category consists of the cost
consequences of poor quality, which are called quality failure costs. These include external failure
costs and internal failure costs. The first two costs (Prevention and Appraisal Costs) are incurred in
the hope of preventing the second two.
Prevention costs are all costs incurred in the process of preventing poor quality from occurring. They
include quality planning costs, such as the costs of developing and implementing a quality plan. Also
included are the costs of product and process design, from collecting customer information to
designing processes that achieve conformance to specifications. Employee training in quality
measurement is included as part of this cost, as well as the costs of maintaining records of
information and data related to quality.
Appraisal costs are incurred in the process of uncovering defects. They include the cost of quality
inspections, product testing, and performing audits to make sure that quality standards are being met.
Also included in this category are the costs of worker time spent measuring quality and the cost of
equipment used for quality appraisal.
Internal failure costs are associated with discovering poor product quality before the product
reaches the customer site. One type of internal failure cost is rework, which is the cost of correcting

Framework on Concepts of Quality 15MAR2011
Prepared By: Kranthi Page 15 of 61
the defective item. Sometimes the item is so defective that it cannot be corrected and must be thrown
away. This is called scrap, and its costs include all the material, labor, and machine cost spent in
producing the defective product. Other types of internal failure costs include the cost of machine
downtime due to failures in the process and the costs of discounting defective items for salvage value.
External failure costs are associated with quality problems that occur at the customer site. These
costs can be particularly damaging because customer faith and loyalty can be difficult to regain. They
include everything from customer complaints, product returns, and repairs, to warranty claims, recalls,
and even litigation costs resulting from product liability issues. A final component of this cost is lost
sales and lost customers. For example, manufacturers of lunch meats and hot dogs whose products
have been recalled due to bacterial contamination have had to struggle to regain consumer
confidence. Other examples include auto manufacturers whose products have been recalled due to
major malfunctions such as problematic braking systems and airlines that have experienced a crash
with many fatalities. External failure can sometimes put a company out of business almost overnight.
Companies that consider quality important invest heavily in prevention and appraisal costs in order to
prevent internal and external failure costs. The earlier defects are found, the less costly they are to
correct. For example, detecting and correcting defects during product design and product production
is considerably less expensive than when the defects are found at the customer site. External failure
costs tend to be particularly high for service organizations. The reason is that with a service the
customer spends much time in the service delivery system, and there are fewer opportunities to
correct defects than there are in manufacturing. Examples of external failure in services include an
airline that has overbooked flights, long delays in airline service, and lost luggage.
Prevention costs. Costs of preparing and implementing a quality plan.
Appraisal costs. Costs of testing, evaluating, and inspecting quality.
Internal failure costs. Costs of scrap, rework, and material losses.
External failure costs. Costs of failure at customer site, including returns, repairs, and recalls.
A product that satisfies their needs is the basic need of customers and to provide a product that
satisfies the needs is the responsibility of the supplier.
Genichi Taguchi Dr. Genichi Taguchi is a Japanese quality expert known for his work in the area of
product design. He estimates that as much as 80 percent of all defective items are caused
by poor product design. Taguchi stresses that companies should focus their quality efforts on the
design stage, as it is much cheaper and easier to make changes during the product design stage than
later during the production process. Taguchi is known for applying a concept called design of
experiment to product design.
This method is an engineering approach that is based on developing robust design, a design that
results in products that can perform over a wide range of conditions.

Framework on Concepts of Quality 15MAR2011
Prepared By: Kranthi Page 16 of 61
Taguchi‘s philosophy is based on the idea that it is easier to design a product that can perform over a
wide range of environmental conditions than it is to control the environmental conditions. Taguchi has
also had a large impact on today‘s view of the costs of quality. He pointed out that the traditional view
of costs of conformance to specifications is incorrect, and proposed a different way to look at these
costs. Let‘s briefly look at Dr. Taguchi‘s view of quality costs.
Recall that conformance to specification specifies a target value for the product with specified
tolerances, say 5.00 +/- 0.20. According to the traditional view of conformance to specifications,
losses in terms of cost occur if the product dimensions fall outside of the specified limits. This is
shown in Figure. However, Dr. Taguchi noted that from the customer‘s view there is little difference
whether a product falls just outside or just inside the control limits. He pointed out that there is a much
greater difference in the quality of the product between making the target and being near the control
limit. He also stated that the smaller the variation around the target, the better the quality. Based on
this he proposed the following: as conformance values move away from the target, loss increases as
a quadratic function. This is called the
Taguchi loss function and is shown in Figure. According to the function, smaller differences from the
target result in smaller costs: the larger the differences, the larger the cost. The Taguchi loss function
has had a significant impact in changing the view of quality cost.
Figure 1 Traditional View of Cost of Non- Conformance

Framework on Concepts of Quality 15MAR2011
Prepared By: Kranthi Page 17 of 61
Figure 2 Taguchi View of Cost of Non Conformance- Taguchi loss function

Framework on Concepts of Quality 15MAR2011
Prepared By: Kranthi Page 18 of 61
Dimensions of Quality

Framework on Concepts of Quality 15MAR2011
Prepared By: Kranthi Page 19 of 61
Product Quality
Service Quality
Process Quality
Garvin‟s 8 Dimensions of Product Quality
Performance, Features, Reliability, Conformance, Durability, Serviceability, Aesthetics, Perceived
Quality
Dimension 1: Performance
Does the product or service do what it is supposed to do, within its defined tolerances?
Performance is often a source of contention between customers and suppliers, particularly
when deliverables are not adequately defined within specifications.
The performance of a product often influences profitability or reputation of the end-user. As such,
many contracts or specifications include damages related to inadequate performance.
Dimension 2: Features
Does the product or services possess all of the features specified, or required for its intended
purpose?
While this dimension may seem obvious, performance specifications rarely define the features
required in a product. Thus, it’s important that suppliers designing product or services from
performance specifications are familiar with its intended uses, and maintain close
relationships with the end-users.
Dimension 3: Reliability
Will the product consistently perform within specifications?
Reliability may be closely related to performance. For instance, a product specification may define
parameters for up-time, or acceptable failure rates.
Reliability is a major contributor to brand or company image, and is considered a fundamental
dimension of quality by most end-users.
Dimension 4: Conformance
Does the product or service conform to the specification?
If it’s developed based on a performance specification, does it perform as specified? If it’s
developed based on a design specification, does it possess all of the features defined?

Framework on Concepts of Quality 15MAR2011
Prepared By: Kranthi Page 20 of 61
Dimension 5: Durability
How long will the product perform or last, and under what conditions?
Durability is closely related to warranty. Requirements for product durability are often included
within procurement contracts and specifications.
For instance, fighter aircraft procured to operate from aircraft carriers include design criteria intended
to improve their durability in the demanding naval environment.
Dimension 6: Serviceability
Is the product relatively easy to maintain and repair?
As end users become more focused on Total Cost of Ownership than simple procurement costs,
serviceability (as well as reliability) is becoming an increasingly important dimension of quality and
criteria for product selection.
Dimension 7: Aesthetics
The way a product looks is important to end-users. The aesthetic properties of a product contribute to
a company‘s or brand‘s identity. Faults or defects in a product that diminish its aesthetic
properties, even those that do not reduce or alter other dimensions of quality, are often cause
for rejection.
Dimension 8: Perception
Perception is reality. The product or service may possess adequate or even superior dimensions of
quality, but still fall victim to negative customer or public perceptions.
As an example, a high quality product may get the reputation for being low quality based on poor
service by installation or field technicians. If the product is not installed or maintained properly,
and fails as a result, the failure is often associated with the product’s quality rather than the
quality of the service it receives.
Summary
It should be obvious from the discussion above that the individual dimensions of quality are not
necessarily distinct. Depending on the industry, situation, and type of contract or specification several
or all of the above dimensions may be interdependent.
When designing, developing or manufacturing a product (or delivering a service) the interactions
between the dimensions of quality must be understood and taken into account.
Framework on Concepts of Quality 15MAR2011
Prepared By: Kranthi Page 21 of 61
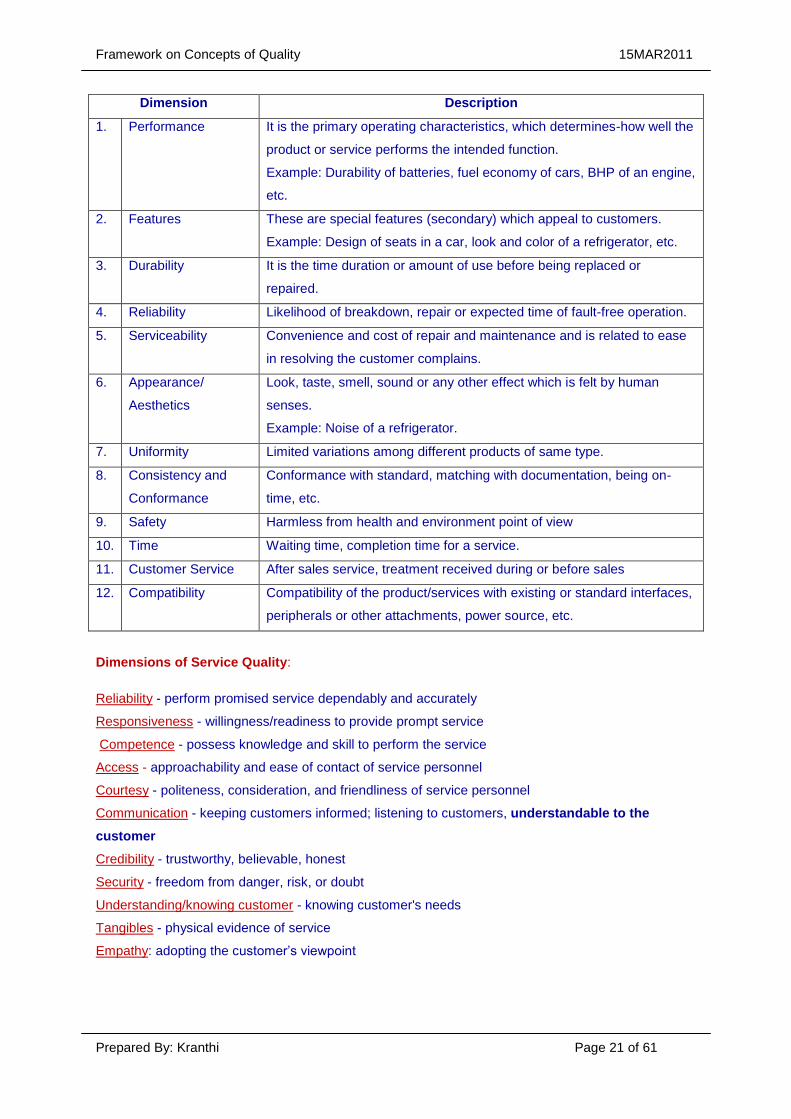
Dimension Description
1. Performance It is the primary operating characteristics, which determines-how well the
product or service performs the intended function.
Example: Durability of batteries, fuel economy of cars, BHP of an engine,
etc.
2. Features These are special features (secondary) which appeal to customers.
Example: Design of seats in a car, look and color of a refrigerator, etc.
3. Durability It is the time duration or amount of use before being replaced or
repaired.
4. Reliability Likelihood of breakdown, repair or expected time of fault-free operation.
5. Serviceability Convenience and cost of repair and maintenance and is related to ease
in resolving the customer complains.
6. Appearance/
Aesthetics
Look, taste, smell, sound or any other effect which is felt by human
senses.
Example: Noise of a refrigerator.
7. Uniformity Limited variations among different products of same type.
8. Consistency and
Conformance
Conformance with standard, matching with documentation, being on-
time, etc.
9. Safety Harmless from health and environment point of view
10. Time Waiting time, completion time for a service.
11. Customer Service After sales service, treatment received during or before sales
12. Compatibility Compatibility of the product/services with existing or standard interfaces,
peripherals or other attachments, power source, etc.
Dimensions of Service Quality:
Reliability - perform promised service dependably and accurately
Responsiveness - willingness/readiness to provide prompt service
Competence - possess knowledge and skill to perform the service
Access - approachability and ease of contact of service personnel
Courtesy - politeness, consideration, and friendliness of service personnel
Communication - keeping customers informed; listening to customers, understandable to the
customer
Credibility - trustworthy, believable, honest
Security - freedom from danger, risk, or doubt
Understanding/knowing customer - knowing customer's needs
Tangibles - physical evidence of service
Empathy: adopting the customer‘s viewpoint

Framework on Concepts of Quality 15MAR2011
Prepared By: Kranthi Page 22 of 61
The 5 major service quality dimensions-- Reliability, Responsiveness, Assurance, Tangibles, and
Empathy
Dimensions of Process Quality
In operations management it has been emphasized that these controllable internal quality aspects of
a business process ultimately determine the external quality perception of goods and services created
by the process [1]. In this section we acknowledge that quality of a business process builds on the
quality of its functions. In essence there are two levels of granularity at which the quality of functions
can be analyzed: for the function as a whole, or by looking into the entities related to it.
Function Input/ Output Non- Human Resource Human Resource
Suitability Accuracy Suitability Domain Knowledge
Accuracy Objectivity Accuracy Qualification
Security Believability Security Certification
Reliability Reputation Reliability Experience
Understandability Accessibility Time Efficiency Time Management
Learnability Security Resource Utilization Communication Skills
Time Efficiency Relevancy Effectiveness
Resource Utilization Value-added Safety
Effectiveness Timeliness User Satisfaction
Productivity Completeness Robustness
Safety Amount of Data Availability
User Satisfaction
Robustness

Framework on Concepts of Quality 15MAR2011
Prepared By: Kranthi Page 23 of 61
Quality Control Tools

Framework on Concepts of Quality 15MAR2011
Prepared By: Kranthi Page 24 of 61
You can see that TQM places a great deal of responsibility on all workers. If employees are to identify
and correct quality problems, they need proper training. They need to understand how to assess
quality by using a variety of quality control tools, how to interpret findings, and how to correct
problems. In this section we look at seven different quality tools. These are often called the seven
tools of quality control they are easy to understand, yet extremely useful in identifying and analyzing
quality problems. Sometimes workers use only one tool at a time, but often a combination of tools is
most helpful.
Cause-and-Effect Diagrams Cause-and-effect diagrams are charts that identify potential causes
for particular quality problems. They are often called fishbone diagrams because they look like the
bones of a fish. A general cause-and-effect diagram is shown in figure. The ―head‖ of the fish is the
quality problem, such as damaged zippers on a garment or broken valves on a tire. The diagram is
drawn so that the ―spine‖ of the fish connects the ―head‖ to the possible cause of the problem. These
causes could be related to the machines, workers, measurement, suppliers, materials, and many
other aspects of the production process. Each of these possible causes can then have smaller
―bones‖ that address specific issues that relate to each cause. For example, a problem with machines
could be due to a need for adjustment, old equipment, or tooling problems. Similarly, a problem with
workers could be related to lack of training, poor supervision, or fatigue. Cause-and-effect diagrams
are problem-solving tools commonly used by quality control teams. Specific causes of problems can
be explored through brainstorming.
The development of a cause-and-effect diagram requires the team to think through all the possible
causes of poor quality.
Flowcharts A flowchart is a schematic diagram of the sequence of steps involved in an operation or
process. It provides a visual tool that is easy to use and understand. By seeing the steps involved in
an operation or process, everyone develops a clear picture of how the operation works and where
problems could arise.

Framework on Concepts of Quality 15MAR2011
Prepared By: Kranthi Page 25 of 61
Checklists A checklist is a list of common defects and the number of observed occurrences of these
defects. It is a simple yet effective fact-finding tool that allows the worker to collect specific information
regarding the defects observed. The checklist in Figure 5-7 shows four defects and the number of
times they have been observed. It is clear that the biggest problem is ripped material. This means that
the plant needs to focus on this specific problem—for example, by going to the source of supply or
seeing whether the material rips during a particular production process. A checklist can also be used
to focus on other dimensions, such as location or time. For example, if a defect is being observed
frequently, a checklist can be developed that measures the number of occurrences per shift, per
machine, or per operator. In this fashion we can isolate the location of the particular defect and then
focus on correcting the problem.
Control Charts Control charts are a very important quality control tool. We will study the use of
control charts at great length in the next chapter. These charts are used to evaluate whether a
process is operating within expectations relative to some measured value such as weight, width, or
volume. For example, we could measure the weight of a sack of flour, the width of a tire, or the
volume of a bottle of soft drink. When the production process is operating within expectations, we say
that it is ―in control.‖
To evaluate whether or not a process is in control, we regularly measure the variable of interest and
plot it on a control chart. The chart has a line down the center representing the average value of the
variable we are measuring. Above and below the center line are two lines, called the upper control
limit (UCL) and the lower control limit (LCL). As long as the observed values fall within the upper and
lower control limits, the process is in control and there is no problem with quality. When a measured
observation falls outside of these limits, there is a problem.

Framework on Concepts of Quality 15MAR2011
Prepared By: Kranthi Page 26 of 61
Scatter Diagrams Scatter diagrams are graphs that show how two variables are related to one
another. They are particularly useful in detecting the amount of correlation, or the degree of linear
relationship, between two variables. For example, increased production speed and number of defects
could be correlated positively; as production speed increases, so does the number of defects. Two
variables could also be correlated negatively, so that an increase in one of the variables is associated
with a decrease in the other. For example, increased worker training might be associated with a
decrease in the number of defects observed.
The greater the degrees of correlation, the more linear are the observations in the scatter diagram. On
the other hand, the more scattered the observations in the diagram, the less correlation exists
between the variables. Of course, other types of relationships can also be observed on a scatter
diagram, such as an inverted _. This may be the case when one is observing the relationship between
two variables such as oven temperature and number of defects, since temperatures below and above
the ideal could lead to defects.
Pareto Analysis Pareto analysis is a technique used to identify quality problems based on their
degree of importance. The logic behind Pareto analysis is that only a few quality problems are
important, whereas many others are not critical. The technique was named after Vilfredo Pareto, a
nineteenth-century Italian economist who determined that only a small percentage of people
controlled most of the wealth. This concept has often been called the 80–20 rule and has been

Framework on Concepts of Quality 15MAR2011
Prepared By: Kranthi Page 27 of 61
extended to many areas. In quality management the logic behind Pareto‘s principle is that most
quality problems are a result of only a few causes. The trick is to identify these causes.
One way to use Pareto analysis is to develop a chart that ranks the causes of poor quality in
decreasing order based on the percentage of defects each has caused. For example, a tally can be
made of the number of defects that result from different causes, such as operator error, defective
parts, or inaccurate machine calibrations. Percentages of defects can be computed from the tally and
placed in a chart like those shown in Figure .We generally tend to find that a few causes account for
most of the defects.
Histograms A histogram is a chart that shows the frequency distribution of observed values of a
variable. We can see from the plot what type of distribution a particular variable displays, such as
whether it has a normal distribution and whether the distribution is symmetrical.
In the food service industry the use of quality control tools is important in identifying quality problems.
Grocery store chains, such as Kroger and Meijer, must record and monitor the quality of incoming
produce, such as tomatoes and lettuce. Quality tools can be used to evaluate the acceptability of
product quality and to monitor product quality from individual suppliers. They can also be used to
evaluate causes of quality problems, such as long transit time or poor refrigeration. Similarly,
restaurants use quality control tools to evaluate and monitor the quality of delivered goods, such as
meats, produce, or baked goods.

Framework on Concepts of Quality 15MAR2011
Prepared By: Kranthi Page 28 of 61
Factors Influencing Quality
Framework on Concepts of Quality 15MAR2011
Prepared By: Kranthi Page 29 of 61
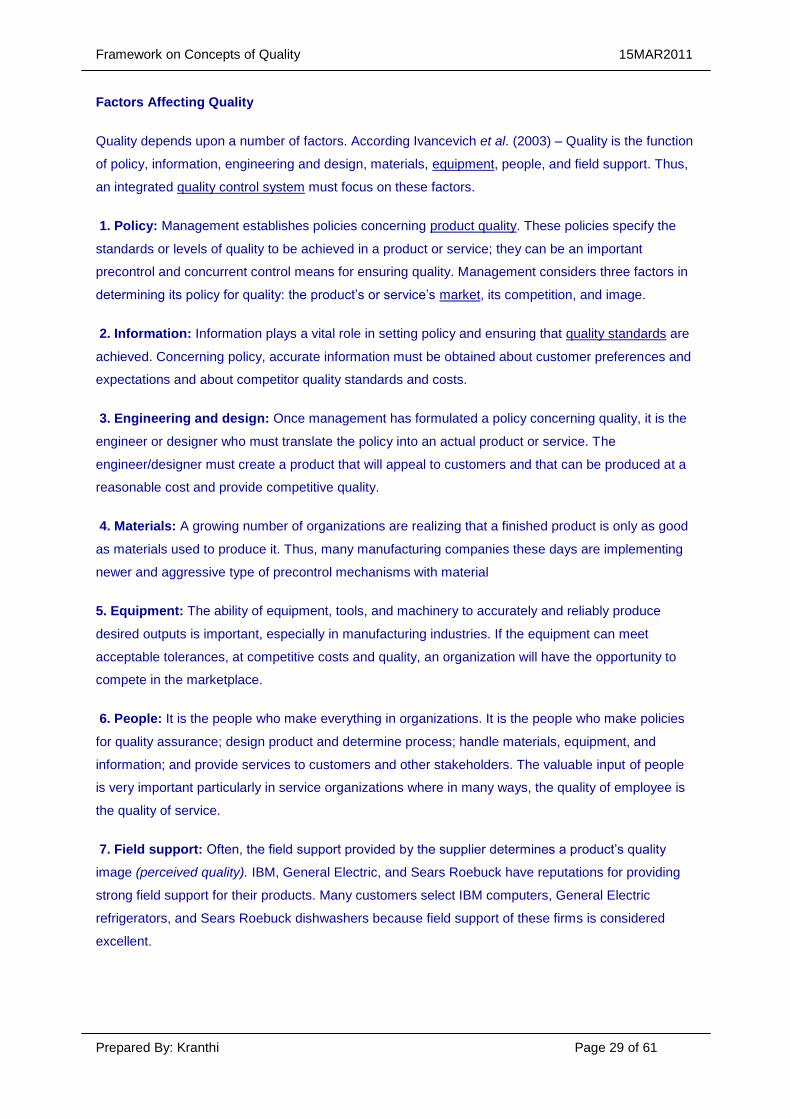
Factors Affecting Quality
Quality depends upon a number of factors. According Ivancevich et al. (2003) – Quality is the function
of policy, information, engineering and design, materials, equipment, people, and field support. Thus,
an integrated quality control system must focus on these factors.
1. Policy: Management establishes policies concerning product quality. These policies specify the
standards or levels of quality to be achieved in a product or service; they can be an important
precontrol and concurrent control means for ensuring quality. Management considers three factors in
determining its policy for quality: the product‘s or service‘s market, its competition, and image.
2. Information: Information plays a vital role in setting policy and ensuring that quality standards are
achieved. Concerning policy, accurate information must be obtained about customer preferences and
expectations and about competitor quality standards and costs.
3. Engineering and design: Once management has formulated a policy concerning quality, it is the
engineer or designer who must translate the policy into an actual product or service. The
engineer/designer must create a product that will appeal to customers and that can be produced at a
reasonable cost and provide competitive quality.
4. Materials: A growing number of organizations are realizing that a finished product is only as good
as materials used to produce it. Thus, many manufacturing companies these days are implementing
newer and aggressive type of precontrol mechanisms with material
5. Equipment: The ability of equipment, tools, and machinery to accurately and reliably produce
desired outputs is important, especially in manufacturing industries. If the equipment can meet
acceptable tolerances, at competitive costs and quality, an organization will have the opportunity to
compete in the marketplace.
6. People: It is the people who make everything in organizations. It is the people who make policies
for quality assurance; design product and determine process; handle materials, equipment, and
information; and provide services to customers and other stakeholders. The valuable input of people
is very important particularly in service organizations where in many ways, the quality of employee is
the quality of service.
7. Field support: Often, the field support provided by the supplier determines a product‘s quality
image (perceived quality). IBM, General Electric, and Sears Roebuck have reputations for providing
strong field support for their products. Many customers select IBM computers, General Electric
refrigerators, and Sears Roebuck dishwashers because field support of these firms is considered
excellent.
Framework on Concepts of Quality 15MAR2011
Prepared By: Kranthi Page 30 of 61
Measurement of Quality

Framework on Concepts of Quality 15MAR2011
Prepared By: Kranthi Page 31 of 61
The three parts of measurement of quality are Measurement of product quality, Measurement of
service quality, Measurement of process quality. This is because we have defined the definition of
quality also the dimensions of quality product from an organization has these three constituents i.e.
Product, Process, Service.
‘When you can measure what you are speaking about and express it in numbers, you know
something about it’. -Kelvin
‘You cannot manage what you cannot measure’.-Anon
Cost of quality measurement
The cost of doing a quality job, conducting quality improvements and achieving goals must be
carefully managed, so that the long-term effect of quality on the organization is a desirable one. These
costs must be a true measure of the quality effort, and are best determined from an analysis of the
costs of quality.
Such an analysis provides:
• A method of assessing the effectiveness of the management of quality
• A means of determining problem areas, opportunities, savings and action priorities
Cost of quality is also an important communication tool. Crosby demonstrated what a powerful tool it
could be to raise awareness of the importance of quality. He referred to the measure as the “Price of
Nonconformance”, and argued that organizations chose to pay for poor quality.
Quality-related activities that will incur costs may be split into prevention costs, appraisal costs and
failure costs.
Prevention costs are associated with the design, implementation and maintenance of the TQM
system.
They are planned and incurred before actual operation, and could include:
• Product or service requirements – setting specifications for incoming materials, processes, finished
products/ services
• Quality planning – creation of plans for quality, reliability, operational, production, inspection
• Quality assurance – creation and maintenance of the quality system
• Training – development, preparation and maintenance of programmes
Appraisal costs are associated with the suppliers‘ and customers‘ evaluation of purchased materials,
processes, products and services to ensure they conform to specifications. They could include:

Framework on Concepts of Quality 15MAR2011
Prepared By: Kranthi Page 32 of 61
• Verification – checking of incoming material, process set-up, products against agreed specifications
• Quality audits – check that the quality system is functioning correctly
• Vendor rating – assessment and approval of suppliers, for products and services
Failure costs can be split into those resulting from internal and external failure.
Internal failure costs occur when the results of work fail to reach designed quality standards and are
detected before they are transferred to the customer. They could include:
• Waste – doing unnecessary work or holding stocks as a result of errors, poor organization or
Communication
• Scrap – defective product or material that cannot be repaired, used or sold
• Rework or rectification – the correction of defective material or errors
• Failure analysis – activity required to establish the causes of internal product or service failure
External failure costs occur when the products or services fail to reach design quality standards, but
are not detected until after transfer to the customer. They could include:
• Repairs and servicing – of returned products or those in the field
• Warranty claims – failed product that are replaced or services re-performed under a guarantee
• Complaints – all work and costs associated with handling and servicing customers‘ complaints
• Returns – handling and investigation of rejected or recalled products, including transport costs
The relationship between the quality-related costs of prevention, appraisal and failure (the P-A-F
model) and increasing quality awareness and improvement in the organization is shown graphically
as:

Framework on Concepts of Quality 15MAR2011
Prepared By: Kranthi Page 33 of 61
Expenditure on prevention and improvement activities is an investment from which a return is
expected.
Effective quality improvements should result in a future stream of benefits, such as:
• Reduced failure costs
• Lower appraisal costs
• Increased market share
• Increased customer base
• More productive workforce
Many organizations will have true quality related costs as high as 15% of their sales revenue, and
effective quality improvement programmes can reduce this substantially, thus making a direct
contribution to profits.
An alternative to the P-A-F model is the Process Cost Model, which categorizes the cost of quality
(COQ) into the cost of conformance (COC) and the cost of non-conformance (CONC), where:
Framework on Concepts of Quality 15MAR2011
Prepared By: Kranthi Page 34 of 61
COC is the process cost of providing products/services to the required standards, by a given specified
process in the most effective manner.
CONC is the failure cost associated with a process not being operated to the requirements, or the
cost due to the variability of the process.
To identify, understand and reap the cost benefits of quality improvement activities the following
fundamental steps should be included in the approach:
• Management commitment to finding the true costs of quality
• A quality costing system to identify, report and analyze quality related cost
• A quality related cost management team responsible for direction and co-ordination of
the quality costing system
• The inclusion of quality costing training to enable everyone to understand the
financial implications of quality improvement
• The presentation of significant costs of quality to all personnel to promote the
approach
• Introduction of schemes to achieve maximum participation of all employees
The system, once established, should become dynamic and have a positive impact on the
achievement of the organization‘s mission, goals and objectives.
A simple performance measurement framework
A good performance measurement framework will focus on the customer and measure the right
things.
Performance measures must be:
• Meaningful, unambiguous and widely understood
• Owned and managed by the teams within the organization
• Based on a high level of data integrity
• Such that data collection is embedded within the normal procedures
• Able to drive improvement

Framework on Concepts of Quality 15MAR2011
Prepared By: Kranthi Page 35 of 61
• Linked to critical goals and key drivers of the organization
There are four key steps in a performance measurement framework - the strategic objectives of the
organization are converted into desired standards of performance, metrics are developed to compare
the desired performance with the actual achieved standards, gaps are identified, and improvement
actions initiated. These steps are continuously implemented and reviewed:
Initially, focus on a few key goals that are critical to the success of the organization or business, and
ensure they are SMART, i.e.:
Specific
Measurable
Achievable
Relevant
Timely
To assist in the development of these goals, consider the use of a balanced scorecard, as discussed
in the following section.
Once the goals have been defined, the next step in developing a performance measurement
framework is to define the outcome metrics - what has to be measured to determine if these goals
are being achieved.
If it is difficult to define outcome metrics for a particular goal, it is possible that the goal is either not
―SMART‖ or critical to the success of the business.
For each outcome metric, brainstorm candidate drivers by answering the question, “What
measurable factors influence this outcome?” Once the list is complete, select those with greatest
impact, and these, the most important drivers, should have driver metrics, and be put in place first.
Driver metrics at one level will be outcome metrics at the next level down.
An organization needs to evolve its own set of metrics, using any existing metrics as a starting point in
understanding current performance. To ensure they trigger the improvement cycle, they should be in
three main areas:

Framework on Concepts of Quality 15MAR2011
Prepared By: Kranthi Page 36 of 61
This is about the process output, and doing what you said you would do. The effectiveness metrics
should reflect whether the desired results are being achieved, the right things being accomplished.
Metrics could include quality, e.g., grade of product or level of service, quantity, e.g., tonnes,
timeliness, e.g., speed of response, and cost/price, e.g., unit cost.
This is about the process input, e.g., labor, staff, equipment, materials, and measures the
performance of the process system management. It is possible to use resources efficiently, but
ineffectively.
Simple ratios, e.g., tonnes per person-hour, computer output per operator day, are used.
Next, design a data collection/reporting process using the following steps:
• Set up a system for collecting and reporting data
• Write clear definitions
• Agree method for establishing current performance (if not already determined)
• List resources required to support the design
• Agree data formats and classifications for aggregation and consolidation
• Identify possible sources of benchmark data
• Set reporting calendar
• Establish roles and responsibilities
• Detail training requirements
• Validate with process stakeholders
The gap between current and desired performance now has to be measured. Some of the metrics
already exist and their current performance data must be collected, as well as data for new metrics.
Framework on Concepts of Quality 15MAR2011
Prepared By: Kranthi Page 37 of 61
Once all the data has been collected to identify the current performance, the target level of
performance for the medium- and long-term must be decided. These performance levels must be
achievable, and should be broken down into targets for discrete short-term intervals, e.g., the next
three quarters.
To implement the performance measurement framework, a plan with timescales and designated
responsibilities is needed. Once the plan has been implemented and data collected, new baselines
can be set, comparisons made and new standards/targets set.
The metrics, targets and improvement activities must be cascaded down through the organization,
involving people and teamwork in the development of new metrics, data collection and improvement
activities.
Improvement can be initiated by examining the gaps between current and target performance of the
driver metrics at each level. A minimum, achievable set of actions is determined, with plans, assigned
responsibilities and owners.
The critical elements of a good performance measurement activity are very similar to those required
for a total quality improvement activity:
• Leadership and commitment
• Good planning and a sound implementation strategy
• Appropriate employee involvement
• Simple measurement and evaluation
• Control and improvement
The balanced scorecard approach
First developed by Kaplan and Norton, a balanced scorecard recognizes the limitations of purely
financial measurement of an organization, which is normally short-term measurement.

Framework on Concepts of Quality 15MAR2011
Prepared By: Kranthi Page 38 of 61
A scorecard has several measurement perspectives, with the original scorecard having financial,
customer, internal business and innovation and learning perspectives. Balanced scorecards are
normally a key output from the strategy formulation process.
The key goals that are identified as being critical to the success of the business, as part of a
performance measurement framework, can also be considered in the context of a balanced
scorecard.
A balanced scorecard derived from the EFQM Excellence Model® (discussed in the Excellence
section) would include financial and non-financial results, customer results, employee results and
societal results.

Framework on Concepts of Quality 15MAR2011
Prepared By: Kranthi Page 39 of 61
Origin of Quality Problems:
Due to incorrect specifications / design - 40%
Due to poor quality of purchased material - 30%
Due to poor controls on production floor - 30%
(This is how Japanese look at quality related problems)
Hurdles for Quality:
You remain satisfied with the way your process is running
You agree on deadlines with your customers which you are not sure you can meet
You believe that defective products can be sorted by inspection instead of preventing
defects to happen
Your processes and system may be unreliable
You believe in person-dependency
You believe in fighting the problem every time as it comes up

Framework on Concepts of Quality 15MAR2011
Prepared By: Kranthi Page 40 of 61
Methods to assure Quality

Framework on Concepts of Quality 15MAR2011
Prepared By: Kranthi Page 41 of 61
The ultimate method to assure Quality is the satisfied Customer. The other way of assurance is
through certification
Product Certification
Management System Certification
Product certification or product qualification is the process of certifying that a certain product has
passed performance and quality assurance tests or qualification requirements stipulated in regulations
such as a building code and nationally accredited test standards, or that it complies with a set of
regulations governing quality and minimum performance requirements.
VDE Testing and Certification Institute
Mark Description
VDE Mark for appliances as technical equipment
according to the Appliance Safety Law (GSG), for Medical
Device Law (MPG), components and installation materials.
The VDE Mark indicates conformity with the VDE standards or
European or internationally harmonized standards resp. and
confirms compliance with protective requirements of the
applicable EC Directive(s). The VDE Mark is a symbol for
electrical, mechanical, thermal, toxic, radiological and other
hazards.
For appliances as technical equipment according to the
GSG. For ready-to-use equipment, the license holder may
chose to affix the VDE Mark or the VDE GS Mark.
For products certified on the basis of harmonized
certification agreements. Testing is based on harmonized
European standards listed in the ENEC Agreement. Products
(at present luminaries and related components, energy saving
lamps, IT equipment, transformers, switches for appliances,
electrical controls, certain types of capacitors and EMI
suppression components) tested to tested to the listed
standards may be marked with the ENEC Mark of the VDE.
The approval of any other body participating in the ENEC
Agreement is not required.

Framework on Concepts of Quality 15MAR2011
Prepared By: Kranthi Page 42 of 61
For appliances in compliance with standards for
electromagnetic compatibility. The VDE EMC Mark
expresses the conformity of a product with applicable
standards for electromagnetic compatibility. The reliable
function of the product in its electromagnetic environment is
also included. The requirements for granting this mark
comprise automatically and without restriction the compliance
with applicable standards.
For cables, insulated cords, installation conduits and
ducts, the VDE Cable Mark is applicable.
For cables and cords, the VDE Identification Thread may be
used.
VDE-HARmonization Marking
The VDE HARmonization Marking or VDE HARmonization
Thread resp. for cables and insulated cords according to
harmonized certification procedures. Testing is based on
the Harmonization Documents (HD) listed in the HAR
Agreement. Products (harmonized power cables) tested and
found in compliance with the requirements of the mentioned
standards may be marked with the VDE HARmonization
Marking. Further information is available from the Laboratory
for Cables and Cords, Materials and Special Tests.
The VDE Component Mark may be used for electronic
components.
The CECC Mark for electronic components according to
CECC Specifications. For electronic components according
to CECC Specifications (CECC: CENELEC Electronic
Components Committee) the CECC Mark may be used.
VDE-Reg.-Nr. XXXXX
VDE-Reg.-Nr. (VDE Certificate of Conformity in
conjunction with factory surveillance)This mark is used in
two cases: firstly, for products in compliance with applicable
clauses of VDE standards in the absence of a fully applicable

Framework on Concepts of Quality 15MAR2011
Prepared By: Kranthi Page 43 of 61
VDE standard, and secondly, if a product, e.g. a sub-
assembly, requires the fulfillment of additional conditions when
incorporated into complete equipment. For cables and
insulated cords, the VDE-Reg.-Nr. or the relevant mark resp. is
applicable in absence of special regulations for products which
were tested on the basis other standards. Special
constructions and all variations of non-harmonized cables and
insulated cords belong to this category of products.
Underwriters Laboratories Inc.
Mark Description
UL Listing Mark
This is one of the most common UL Marks. If a product carries
this Mark, it means UL found that samples of this product met
UL's safety requirements. These requirements are primarily
based on UL's own published Standards for Safety. This type
of Mark is seen commonly on appliances and computer
equipment, furnaces and heaters, fuses, electrical panel
boards, smoke and carbon monoxide detectors, fire
extinguishers and sprinkler systems, personal flotation devices
like life jackets and life preservers, bullet resistant glass, and
thousands of other products.
C-UL Listing Mark
This mark is applied to products for the Canadian market. The
products with this type of mark have been evaluated to
Canadian safety requirements, which may be somewhat
different from U.S. safety requirements. You will see this type
of Mark on appliances and computer equipment, vending
machines, household burglar alarm systems, lighting fixtures,
and many other types of products.
C-UL US Listing Mark
UL introduced this new Listing Mark in early 1998. It indicates
compliance with both Canadian and U.S. requirements. The
Canada/U.S. UL Mark is optional. UL encourages those
manufacturers with products certified for both countries to use
this new, combined Mark, but they may continue using
separate UL Marks for the United States and Canada.
Framework on Concepts of Quality 15MAR2011
Prepared By: Kranthi Page 44 of 61
Classification Mark
This mark appears on products which UL has also evaluated.
Products carrying this mark have been evaluated for specific
properties, a limited range of hazards, or suitability for use
under limited or special conditions. Typically, products
Classified by UL fall into the general categories of building
materials and industrial equipment. Examples of types of
equipment Classified by UL include immersion suits, fire doors,
protective gear for fire fighters and industrial trucks.
C-UL Classification Mark
This Classification marking is used for products intended for
the Canadian marketplace. It indicates that UL has used
Canadian standards to evaluate the product for specific
hazards or properties. Examples of C-UL Classified products
include air filter units, fire stop devices, certain types of roofing
systems, and others.
C-UL US Classification Mark
UL introduced this new Classification Mark in early 1998. It
indicates compliance with both Canadian and U.S.
requirements. The Canada/U.S. UL Mark is optional. UL
encourages those manufacturers with products certified for
both countries to use this new, combined Mark, but they may
continue using separate UL Marks for the United States and
Canada.
Recognized Component Mark and Canadian Recognized
Component Mark
These are marks consumers rarely see because they are
specifically used on component parts that are part of a larger
product or system. These components may have restrictions
on their performance or may be incomplete in construction.
The Component Recognition marking is found on a wide range
of products, including some switches, power supplies, printed
wiring boards, some kinds of industrial control equipment and
thousands of other products. Products intended for Canada
carry the Recognized Component mark "C."
Recognized Component Mark for Canada and the United
States

Framework on Concepts of Quality 15MAR2011
Prepared By: Kranthi Page 45 of 61
This new UL Recognized Component Mark, which became
effective April 1, 1998, may be used on components certified
by UL to both Canadian and U.S. requirements. Although UL
had not originally planned to introduce a combined
Recognized Component Mark, the popularity of the
Canada/U.S. Listing and Classification Marks among clients
with UL certifications for both Canada and the United States
has led to the new Mark.
International "emc-Mark"
The International "emc-Mark" appears on products meeting the
electromagnetic compatibility requirements of Europe, the
United States, Japan, Australia, or any combination of the four.
In the United States, some types of products can't be sold
without proof of compliance to U.S. electromagnetic
compatibility requirements. The types of products that are
subject to EMC testing include medical and dental equipment,
computers, microwave ovens, televisions, radios, transmitters,
and radio-controlled equipment.
EPH Product Mark
The UL EPH mark appear on products that have been
evaluated to Environmental and Public Health Standards. The
"Classified" version is used for products complying with
ANSI/NSF Standards and other food equipment hygiene codes
and requirements. Examples include Food Service and Meat
and Poultry Plant Equipment and Drinking Water Additives.
The "Listed" version is typically used for products complying
with UL's own published EPH Standards for Safety.
Food Service Product Certification Mark
The UL Food Service Product Certification Mark is UL's
Classification Mark with specific reference to the appropriate
NSF International standard. In addition, at the manufacturer's
option, a supplemental Mark can be applied as shown.
Equipment bearing the Mark is not limited to electrical
products, but also includes gas appliances and non-powered
equipment. These products are commonly found in
commercial food establishments, institutional food services
and other locations.

Framework on Concepts of Quality 15MAR2011
Prepared By: Kranthi Page 46 of 61
Field Evaluated Product Mark
A Field Evaluated Product Mark is applied to a product that is
thoroughly evaluated in the field instead of UL's laboratories or
the manufacturer's facility. If a product has been significantly
modified since its manufacture or the product doesn't bear any
third-party certification mark, a building owner, a regulatory
authority, or anyone else directly involved with the product can
request that UL conduct tests in the field on the specific piece
of equipment. Products that meet appropriate safety
requirements are labeled with a tamper-resistant Field
Evaluated Product Mark.
Facility Registration Mark
The UL Registered Firm Mark is a mark you will never see on
a product. Instead, it indicates that a particular facility has
passed UL's evaluation to quality assurance standards and is
used in promotion and marketing by companies with quality
assessment programs audited by UL. The standards UL uses
are the ISO 9000 series of quality assurance standards; QS-
9000, the quality standards developed by the Big Three U.S.
automakers for their suppliers; and ISO 14001, the standard
covering environmental management systems.
Marine Mark
The UL Marine mark appears on products which have been
evaluated specifically for marine use. Products bearing this
Mark have been evaluated to UL's published Marine Safety
Standards and other applicable standards and codes. These
requirements address hazards that can occur as a result of
exposure to harsh marine environments such as vibration,
shock (impact), ignition protection, water ingress and salt
spray corrosion common on pleasure craft and boats.
Examples of the type of equipment suitable for the UL Marine
Mark include alternators, battery chargers/power inverters,
navigation lights, and fuel tanks, filters and pumps.
AR-UL Mark Used in conjunction with the mandatory "S" Mark
of Argentina's National Office of Internal Commerce (Direccion
Nacional de Comercio Interior, or DNCI), the "AR-UL" Mark
indicates a product's compliance with Phase III of Argentina's
Resolution 92/98. Most electrical and electronic products
Framework on Concepts of Quality 15MAR2011
Prepared By: Kranthi Page 47 of 61
entering Argentina will have to display the "S" Mark adjacent to
the Mark of an accredited and Recognized third-party
certification organization such as UL de Argentina, S.R.L.
CSA International
Mark Description
The CSA mark may appear alone or with indicators. If it
appears alone, it means that the product is certified for the
Canadian market, to the applicable Canadian standards.
If the CSA mark appears with the indicator "US" or "NRTL" it
means that the product is certified for the U.S. market, to the
applicable U.S. standards.
If this Mark appears with the indicator "C and US" or "NRTL/C"
it means that the product is certified for both the U.S. and
Canadian markets, to the applicable U.S. and Canadian
standards.
CGA "Script"
The Canadian Gas Association (CGA) "Script" for components
of gas appliances and other liquid petroleum products
indicates certification to applicable Canadian standards.
A.G.A. Blue Star
The American Gas Association (A.G.A.) "Blue Star" mark for
gas appliances and other liquid petroleum products indicates
certification to applicable U.S. standards.
CSA Blue Star
The CSA Blue Star Mark for gas appliances and other liquid
petroleum products indicates certification to applicable U.S.
standards.

Framework on Concepts of Quality 15MAR2011
Prepared By: Kranthi Page 48 of 61
CGA Blue Flame
The Canadian Gas Association (CGA) "Blue Flame" mark for
gas appliances and other liquid petroleum products indicates
certification to applicable Canadian standards.
CSA Blue Flame
The CSA Blue Flame Mark for gas appliances and other liquid
petroleum products indicates certification to applicable
Canadian standards.
A.G.A. "Script"
The American Gas Association (A.G.A.) "Script" for
components of gas appliances and other liquid petroleum
products indicates certification to applicable U.S. standards.
NEMKO
Mark Description
Shows that the product is Safety Certified and when relevant,
that the product is also compliant with the EMC Directive.
The well-known N-mark is a certification mark based on
Nemko's own testing or results from testing performed by often
laboratory according to multi-national or bi-lateral agreement
or by otherwise Nemko accepted laboratories including all
authorized manufacturers. The mark itself signifies that Nemko
has tested or certified the product according to national
standards official safety regulations in Norway. (which in
principle are equivalent to those of the other European
EU/EEA states)
Shows that the product is tested and certified as above, but
signifies clearly that the product is certified for both safety and
EMC by Nemko or by a Nemko authorized laboratory. In
addition this mark confirms that the product also covers the
EMC Directive, tested by Nemko or Nemko authorized
laboratories.

Framework on Concepts of Quality 15MAR2011
Prepared By: Kranthi Page 49 of 61
The product is only certified for EMC by Nemko.
Products certified by Nemko may if desired be tagged with the
unique "Nemko Approved" label for use as advertising, shows,
displays packages and also on the actual products.
DEMKO
Mark Description
DEMKO's D-Mark represents electrical product safety for a
great majority of consumers.
The D-Mark demonstrates that, from a safety point of view, the
tested product complies with:
Harmonized standards, e.g. EN/HD
International standards, e.g. IEC
National standards, e.g. DS
Other national standards e.g. American National or UL
Standards
Other relevant parts of the above-mentioned
standards which form part of the basis for certification
e.g. National Deviations.
DEMKO is the Competent Body for the EMC Directive and
performs testing under the EMC Directive. An EMC test, in
addition to an LVD test, at DEMKO gives you the right to use
DEMKO's EMC Mark. The accompanying report can be used
as documentation for CE Marking of your product in
accordance with the EMC Directive. Safety related EMC tests
under the Low Voltage and Machinery Directives should
always be performed either before, or in connection with, EMC
testing under the EMC Directive in order to avoid expensive
double work. EMC testing at DEMKO can be monitored by the
manufacturer so that any problems arising can be dealt with
immediately, or DEMKO can, by agreement with the
manufacturer, make any necessary changes and retest the

Framework on Concepts of Quality 15MAR2011
Prepared By: Kranthi Page 50 of 61
product.
European EMC Mark
A mark for EMC has been introduced in the 15 most
recognized certification bodies in Europe.
The CCA EMC Mark gives you the possibility to
document that EMC requirement, which can often be
difficult to handle, have been complied with.
The CCA EMC Mark is recognized by the certification
bodies in the 15 countries that recognize each other's
results. Full European recognition is hereby achieved.
The EMC Certificate is always documented by an
accompanying EMC test report.
The EMC Mark can be used together with national
safety marks as well as with the CE Mark.
FIMKO
Mark Description
The SGS Fimko FI mark is a well-known and respected
impartial certification mark indicating the safety and quality of a
product. The FI mark can only be used on products that have a
valid FI certificate granted by FIMKO.
The FI mark can appear on the certified product, in the User‘s
Manual and Installation Guide, in product catalogues and, for
example in newspaper, TV and radio advertisements. Below
the FI mark our slogan ‗safe quality‘ can be used to strengthen
and enhance the value of the mark (see figure). More
information about the use of the FI mark can be found in
FIMKO‘s FI handbook and on a diskette which can be obtained
free of charge.
An EMC certificate issued by FIMKO is a powerful way of
demonstrating the EMC conformity of the product for
international markets. SGS Fimko‘s EMC mark gives added
value and can be used in marketing, for example on the
packaging, in brochures and price lists. EMC certified products
can be browsed on SGS Fimko‘s website under the FI register,

Framework on Concepts of Quality 15MAR2011
Prepared By: Kranthi Page 51 of 61
product lists. The EMC certificate granted by SGS Fimko
requires that testing is carried out according to European
standards or in a testing laboratory assessed and approved by
SGS Fimko.
SGS Fimko‘s EMC mark can be granted to all products which
are in accordance with European standards, for example
household appliances, switches for household appliances,
lighting fittings, measurement instruments, electro medical
equipment, IT equipment, office machines, hand-held tools
and consumer electronics.
SEMKO
Mark Description
The S marking, which is voluntary today, means that SEMKO
as an impartial testing laboratory certifies that the product
fulfils valid safety requirements.
The safety requirements include checking of e.g.
electrical safety
fire protection
mechanical hazards
radiation risks, e.g. of CD players and solaria
VARIOUS
Mark Description
The CE-marking is the manufacturer's statement to the EU
authorities that his product complies with all relevant CE-
marking Directives. It is important to emphasize that the CE-
marking is not a quality mark or a guarantee to consumers in
EU.
The manufacturer is always responsible - within or outside EU
- for CE-marking. If the manufacturer is not located in EU, he
can authorize a representative located in EU who thus
becomes responsible for CE-marking. The representative's
duties and responsibilities must be agreed in writing. Importers
not authorized by the manufacturer must keep his
documentation in safekeeping in EU for ten years after the last

Framework on Concepts of Quality 15MAR2011
Prepared By: Kranthi Page 52 of 61
production date. Please bear in mind, that the importer may
always be held responsible for the documentation.
ENEC is an abbreviation for "European Norms Electrical
Certification". These four letters are part of the registered trade
mark that demonstrates that a product has been certified by
one of the national certification institutes in Europe. Today,
there are 18 certification institutes who are signatories to the
agreement. Apart from the ENEC Mark itself, there is also a
two digit number that indicates which certification body has
issued the ENEC Certificate.
The ENEC Agreement was originally (in 1991 under the name,
the LUM Agreement) started with a view to providing
manufacturers of luminaries with a joint European certification
mark to replace all the different national marks. In 1999, the
agreement was expanded to include:
Lighting
Components for lamp holders
IT
Electric office equipment
Safety isolating transformers
Isolating transformers and separating transformers
Power supply units
Switches
The GS-Mark is the German national mark that demonstrates
that a product has been tested and found to comply with the
standards for the product. The GS-Mark is to Germans what
the Danish D-Mark is to Danes. The GS-Mark is very well
recognized by German consumers; so well recognized that
certain products are nearly impossible to sell without the GS-
Mark.
For manufacturers and importers wishing to sell their electrical
products in Germany, it is a good idea to have a GS-Mark.

Framework on Concepts of Quality 15MAR2011
Prepared By: Kranthi Page 53 of 61
There are three particular areas where a GS-Mark is nearly a
necessity: tools, IT equipment and electro medical equipment.
Manufacturers of tools often have a hard, if not impossible,
time selling their products in Germany without a GS-Mark
because such marking is supported by consumers and the
trade unions. IT equipment is also affected by the requirement
for GS-Marking; the mark is a requirement if you wish to sell
major companies or institutions.
The third area where the GS-Mark is particularly important is
electro medicine because a GS-Mark is a prerequisite for a
grant to the institution in question from the German authorities.
Keymark is a European safety mark identical to the well-known
systems on which the existing European CCA system is built.
Some of the most important criteria for testing products under
the CCA rules are: factory inspection, random sample
supervision and testing performed by testing institutes of equal
standing. Market supervision is performed, i.e. products are
periodically sampled from the market for examination in
accordance with the procedures applied by the individual
countries' national bodies. The testing institute responsible for
issuing the Keymark is identified by means of a numerical
code which constitutes part of the Keymark itself.
Institute für Software, Elektronik, Bhantechnik
The NOM Mark is the Mexican product safety mark. Our
Mexico City laboratory is an accredited SECOFI laboratory -
however, you can receive testing from any one of our
laboratories to receive this certification.
Warnock Mark represents compliance to United States and/or
Canadian product safety standards. The Warnock Hersey
Mark can be found mainly on fire doors, sealed insulated
glass, building materials and gas and oil fired products, like
hearth products.

Framework on Concepts of Quality 15MAR2011
Prepared By: Kranthi Page 54 of 61
The GOST R certification mark is part of the mandatory
Russian Certification system.
ETL Listed Mark
ETL Listed Mark represents compliance to United States
and/or Canadian product safety standards. You will find the
ETL Listed Mark on electrical- gas-or oil- fired products.
For the United States, we are recognized by Occupational
Safety Hazards Association (OSHA) as a National Recognized
Testing Laboratory (NRTL). Click on the NRTL link to view the
scope of recognition (the list of standards, sites, and programs
that OSHA has recognized us for). In Canada, we are
accredited by the Standards Council of Canada (SCC) as a
Testing Organization and a Certification Organization.
ENERGY STAR is the symbol for energy efficiency. It's a label
-- created by the U.S. Environmental Protection Agency and
the U.S. Department of Energy -- to help consumers save
money and prevent air pollution.
An appliance or product with the ENERGY STAR label means
that it's in the top of its class for energy efficiency. Products
that meet EPA and Department of Energy efficiency criteria
qualify as ENERGY STAR. Consumers save money with
ENERGY STAR products because they use less energy than
conventional products and cost less to operate. ENERGY
STAR products also offer the same or often better
performance and features as conventional products
Management System Certification
There are several approaches to improve the system in terms of quality, time, cost and resources
spent which are the key factors influencing customer satisfaction and Business. Some of them are
presented here.
Six Sigma: Structures data driven methodology for eliminating defects, waste and QC problems in
manufacturing, service delivery and management incorporating DMAIC process Define, Improve,
Measure, Control, Analyze, Standardize.

Framework on Concepts of Quality 15MAR2011
Prepared By: Kranthi Page 55 of 61
Total Quality Management: An approach for effective management of an enterprise through focus
on people and processes for customer driven leadership. The foundation of TQM being continuous
improvement, it incorporates the concept of Product Quality, Process Control, Quality Assurance and
Quality Improvement.
Kaizen: Revolutionary Japanese concept of ongoing continuous improvement involving all members
of team. This is an investment turn around maverick a panacea for bringing about change through
continuous improvement.
BPR: Business process Re- engineering a fundamental rethinking and radical redesign of business
process to achieve dramatical improvements in critical measures of performance including cost quality
services and speed.
TPM: Total Productive Maintenance is series of methods to ensure that every machine in a production
process is always able to perform to required tasks so that production is never interrupted.
Quality Circles and 5S Implementation: Work Place Improvement through a small group of people
from the same work area bringing about structures problem solving deploying 7QC tools and 7 New
QC tools with practice of 5S concept and PDCA Process.
Lean Manufacturing: Philosophy of efficiency aimed at shortening the time between order and
delivery by eliminating waste.
JIT: Just-in Time, a system for producing and delivering the right items at the right time in the right
amounts.
Kanban: One of the primary tools of JIT system. It signals a cycle of replenishment for production and
material through effective visual control.
QFD: Quality Function Deployment a visual decision marking procedure for multi- Skilled project
teams which develops a common understanding of the voice of the customer and a consensus on the
final engineering specifications of the product.
Waste Elimination: Seven Type of Mudas (Waste) Overproduction Waiting Unnecessary Transport
Over Processing Inventories More than the Absolute Minimum, Unnecessary Movement, Production
of Defective arts. Identification & Elimination of these Mudas.
TAKT Time: Time synchronization on customer demand
SMED: Single Minute Exchange of Dies
Poke Yoke: Way to ensure mistake proofing to prevent reoccurrences of defect.
Framework on Concepts of Quality 15MAR2011
Prepared By: Kranthi Page 56 of 61
Lean Six Sigma: is a business improvement methodology which combines (as the name implies)
tools from both Lean Manufacturing and Six Sigma. Lean manufacturing focuses on speed and
traditional Six Sigma focuses on quality. By combining the two, the result is better quality faster.
FMEA, EVA, Balance Score Card, SWOT Analysis, Strategic Business Planning, Benchmarking
Studies, Climate Surveys.
Country Specific National Standard Institutes
National standards organizations
Algeria - IANOR - Institut Algerien de Normalisation
Argentina - IRAM - Instituto Argentino de Normalizacion
Armenia - SARM - National Institute of Standards and Quality
Australia - SAI - Standards Australia International
Austria - ON - Austrian Standards Institute
Bangladesh - BSTI - Bangladesh Standards and Bangladesh Standards and Testing Institutio
Belarus - BELST - Committee for Standardization, Metrology and Certification of Belarus
Belgium - IBN - The Belgian Institution for Standardization
Bolivia - IBNORCA - Instituto Boliviano de Normalizacien y Calidad
Bosnia and Herzegovina - BASMP - Institute for Standards, Metrology and Intellectual
Property of Bosnia and Herzegovina
Brazil - ABNT - Associao Brasileira de Normas Tecnicas
Brunei Darussalam - CPRU - Construction Planning and Research Unit, Ministry of
Development
Bulgaria - BDS - Bulgarian Institute for Standardization

Framework on Concepts of Quality 15MAR2011
Prepared By: Kranthi Page 57 of 61
Canada - SCC - Standards Council of Canada
Chile - INN - Instituto Nacional de Normalizacion
China - SAC - Standardization Administration of China
China - CSSN - China Standards Information Center
Colombia - ICONTEC - Instituto Colombiano de Normas Tecnicas y Certificacion
Costa Rica - INTECO - Instituto de Normas Tecnicas de Costa Rica
Croatia - DZNM - State Office for Standardization and Metrology
Cuba - NC - Oficina Nacional de Normalizacion
Czech Republic - CSNI - Czech Standards Institute
Denmark - DS - Dansk Standard
Ecuador - INEN - Instituto Ecuatoriano de Normalizacion
Egypt - EO - Egyptian Organization for Standardization and Quality Control
El Salvador - CONACYT - Consejo Nacional de Ciencia y Tecnologia
Estonia - EVS - Eesti Standardikeskus
Ethiopia - QSAE - Quality and Standards Authority of Ethiopia
Finland - SFS - Finnish Standards Association
France - AFNOR - Association Francaise de Normalisation
Germany - DIN - Deutsches Institut für Normung
Greece - ELOT - Hellenic Organization for Standardization
Grenada - GDBS - Grenada Bureau of Standards
Guatemala - COGUANOR - Comision Guatemalteca de Normas
Guyana - GNBS - Guyana National Bureau of Standards
Hong Kong - ITCHKSAR - Innovation and Technology Commission
Hungary - MSZT - Magyar Szabvnygyi Testlet
Iceland - IST - Icelandic Council for Standardization

Framework on Concepts of Quality 15MAR2011
Prepared By: Kranthi Page 58 of 61
India - BIS - Bureau of Indian Standards
Indonesia - BSN - Badan Standardisasi Nasional
Iran - ISIRI - Institute of Standards and Industrial Research of Iran
Ireland - NSAI - National Standards Authority of Ireland
Israel - SII - The Standards Institution of Israel
Italy - UNI - Ente Nazionale Italiano di Unificazione
Jamaica - JBS - Bureau of Standards, Jamaica
Japan - JISC - Japan Industrial Standards Committee
Jordan - JISM - Jordan Institution for Standards and Metrology
Kazakstan - KAZMEMST - Committee for Standardization, Metrology and Certification
Kenya - KEBS - Kenya Bureau of Standards
Republic of Korea - KATS - Korean Agency for Technology and Standards
Kuwait - KOWSMD - Public Authority for Industry, Standards and Industrial Services Affairs
Kyrgyzstan - KYRGYZST - State Inspection for Standardization and Metrology
Latvia - LVS - Latvian Standard
Lebanon - LIBNOR - Lebanese Standards Institution
Lithuania - LST - Lithuanian Standards Board
Luxembourg - SEE - Service de l'Energie de l'Etat, Organisme Luxembourgeois de
Normalisation
Malaysia - DSM - Department of Standards Malaysia
Malta - MSA - Malta Standards Authority
Mauritius - MSB - Mauritius Standards Bureau
Mexico - DGN - Direccion General de Normas
Moldova - MOLDST - Department of Standardization and Metrology
Morocco - SNIMA - Service de Normalisation Industrielle Marocaine

Framework on Concepts of Quality 15MAR2011
Prepared By: Kranthi Page 59 of 61
Netherlands - NEN - Nederlandse Norm, maintained by the Nederlands Normalisatie Instituut
(NNI)
New Zealand - SNZ - Standards New Zealand
Nicaragua - DTNM - Direccion de Tecnologia, Normalizacion y Metrologia
Nigeria - SON - Standards Organisation of Nigeria
Norway - NSF - Norges Standardiseringsforbund
Oman - DGSM - Directorate General for Specifications and Measurements
Pakistan - PSQCA - Pakistan Standards and Quality Control Authority
Palestine - PSI - Palestine Standards Institution
Panama - COPANIT - Comision Panameoa de Normas Industriales y Tecnicas
Papua New Guinea - NISIT - National Institute of Standards and Industrial Technology
Peru - INDECOPI - Instituto Nacional de Defensa de la Competencia y de la Proteccion de la
Propiedad Intelectual
Philippines - BPS - Bureau of Product Standards
Poland - PKN - Polish Committee for Standardization
Portugal - IPQ - Instituto Portuguis da Qualidade
Romania - ASRO - Asociatia de Standardizare din Romania
Russian Federation - GOST-R - State Committee of the Russian Federation for
Standardization, Metrology and Certification
Saudi Arabia - SASO - Saudi Arabian Standards Organization
Serbia and Montenegro - ISSM -Institution for Standardization of Serbia and Montenegro
Seychelles - SBS - Seychelles Bureau of Standards
Singapore - SPRING SG - Standards, Productivity and Innovation Board
Slovakia - SUTN - Slovak Standards Institute
Slovenia - SIST - Slovenian Institute for Standardization
South Africa - SABS - South African Bureau of Standards

Framework on Concepts of Quality 15MAR2011
Prepared By: Kranthi Page 60 of 61
Spain - AENOR - Asociacion Espanola de Normalizacion y Certificacion
Sri Lanka - SLSI - Sri Lanka Standards Institution
Sweden - SIS - Swedish Standards Institute
Switzerland - SNV - Swiss Association for Standardization
Syrian Arab Republic - SASMO - The Syrian Arab Organization for Standardization and
Metrology
Taiwan - BSMI - The Bureau of Standards, Metrology and Inspection
Tanzania - TBS - Tanzania Bureau of Standards
Thailand - TISI - Thai Industrial Standards Institute
Trinidad and Tobago - TTBS - Trinidad and Tobago Bureau of Standards
Turkey - TSE - Trk Standardlari Enstits
Uganda - UNBS - Uganda National Bureau of Standards
Ukraine - DSSU - State Committee on Technical Regulation and Consumer Policy of Ukraine
United Kingdom - BSI - British Standards Institute
Uruguay - UNIT - Instituto Uruguayo de Normas Tecnicas
USA - ANSI - American National Standards Institute
USA - NIST - National Institute of Standards and Technology
Venezuela - FONDONORMA - Fondo para la Normalizacion y Certificacion de la Calidad
Viet Nam - TCVN - Directorate for Standards and Quality
Some transnational and continental standards organizations:
CEN - European Committee for Standardization
CENELEC - European Committee for Electro technical Standardization
ETSI - European Telecommunications Standards Institute
Some international standards organizations:
IEC - International Electro technical Commission

Framework on Concepts of Quality 15MAR2011
Prepared By: Kranthi Page 61 of 61
IEEE - Institute of Electric and Electronic Engineers
IETF - Internet Engineering Task Force
ISO - International Organization for Standardization
ITU - The International Telecommunication Union
ITU-R - ITU Radio communications Sector (CCIR)
ITU-T - ITU Telecommunications Sector (CCITT)
IUPAC - International Union of Pure and Applied Chemistry
OASIS - Organization for the Advancement of Structured Information Standards
SI - Systéme International d'Unit's (International System of Units)
W3C - World Wide Web Consortium
Accellera - Accellera Organization