Framework for Multi-Resolution Analyses of … · Analyses of Advanced Traffic Management...
27
Framework for Multi - Resolution Analyses of Advanced Traffic Management Strategies presented by Mohammed Hadi , Ph.D., PE Florida International University December 6, 2016
Transcript of Framework for Multi-Resolution Analyses of … · Analyses of Advanced Traffic Management...

Framework for Multi-Resolution
Analyses of Advanced Traffic
Management Strategiespresented by
Mohammed Hadi, Ph.D., PE
Florida International University
December 6, 2016

Needs for the Framework
• Performance measurement and estimation is increasingly needed
• Combinations of advanced modeling tools are needed for advanced strategies
– Congested conditions, ML, construction and incident management, ATDM, ICM, and automated and connected vehicles
• Tools and methods are becoming available, however integration of tools is needed for effective modeling
2

Multi-Resolution Modeling
3

Objectives
• Investigate the ability of combinations of tools in estimating performance and analyzing congestion and advanced strategies
• Recommend a framework for use in support of agency analysis and modeling processes
• Apply and assess the utilization of tools in the modeling of use cases
4
Proposed Framework Components
5

Discussed Aspects
• Tool assessment criteria
• O-D estimation tools and inputs
• ML modeling applications– Fixed VOT versus VOT distribution
– Incorporating reliability in the assignment
– Ability of modeling ML shifts due to pricing change
– Modeling CAV on ML
– Demonstration of MRM use
• Work zone MRM modeling applications
• Capacity and signal timing Improvements MRM applications - varying demand levels
6

Criteria for Tool Assessment
7
• General Criteria (Hardware, Software, Interface, and etc.)
• Shortest Path and Path Choice
• Assignment type
• En-route dynamic routing (e.g., in-vehicle dynamic navigation system, DMS)
• Specification of fine-grained assignment interval (e.g., 15-30 minutes)
• Allows fixing paths for parts of the demands
• Convergence criteria
• Outputting and using interval-based convergence gap
• Assignment of individual vehicles
• Assignment of multiple demand types

Criteria for Tool Assessment (Con’t)
8
• Traffic Flow Model (TFM)
• Traffic flow model type
• Queuing and spillback
• Modeling of signalized arterials
• Modeling of freeways
• Modeling of alternative routes to facilities
• Automatic calculation of signal timing in dynamic traffic assignment
• Lane-by-lane simulation
• Merging/weaving simulation
• Modeling turn lane and bay Length

Criteria for Tool Assessment (Con’t)
9
• ML Modeling
• Generalized cost in assignment
• Incorporation of willingness-to-pay (WTP) into assignment
• Link access restrictions/prohibitions by vehicle type
• Modeling managed lanes and reversed lanes
• Fixed and time-of-day pricing by user types
• Dynamic pricing
• Inhomogeneous VOT and VOR
• Advanced Vehicle Technology
• Capacity as a function of proportion of vehicle types
• Fixed and time-of-day pricing by different percentage of advanced vehicle technology

ODME - Factorized Matrix Start Initial
10
Goodness-of-Fit Statistics
Initial Demand
Running DTA
without ODMERunning ODME Optimization
Macroscopic Model Mesoscopic Models Macroscopic Model Mesoscopic Models
MAE (veh/ln/15min) 108.13 101.56 - 123.48 80.74 68.21 - 112.51
MAPE (%) 18.69 16.11 - 20.61 13.32 12.52 - 15.35
RMSE (veh/ln/15min) 158.79 149.14 - 181.32 118.56 100.16 - 165.21
R squared 0.46 0.29 - 0.47 0.72 0.39 - 0.81
Improved Demand Estimation Utilizing
ODME Optimization (%)25.33 8.88 - 32.84

Impact of ODME – Fine-Tuned Initial
11
Goodness-of-Fit Statistics
Initial Demand
Running DTA
without ODMERunning ODME Optimization
Macroscopic Model Mesoscopic Models Macroscopic Model Mesoscopic Models
MAE (veh/ln/15min) 62.13 62.19 - 67.79 59.71 55.18 - 63.44
MAPE (%) 11.09 10.98 - 11.21 10.9 10.62 - 11.02
RMSE (veh/ln/15min) 91.24 91.33 - 95.15 87.68 81.03 - 93.15
R squared 0.821 0.80 - 0.832 0.95 0.81 - 0.96
Improved Demand Estimation Utilizing
ODME Optimization (%)3.9 2.09 - 11.27

Impact of Using Partial Trips (PT)
12

Using Partial Trips
13
Facility Type Initial (Before ODME) Counts-Only Adding Partial Trip
Freeway 28.43% 28.11% 22.01%
Freeway-Ramp 39.42% 37.86% 28.09%
Arterials 44.93% 34.69% 4.65%
Total 44.80% 39.10% 22.93%
Observed Count volume From Initial(No ODME) Counts Only Adding Partial Trip
26-894 44.75% 35.3% 6.81%
1308-2620 26.55% 26.18% 21%
Total 44.80% 39.10% 22.93%
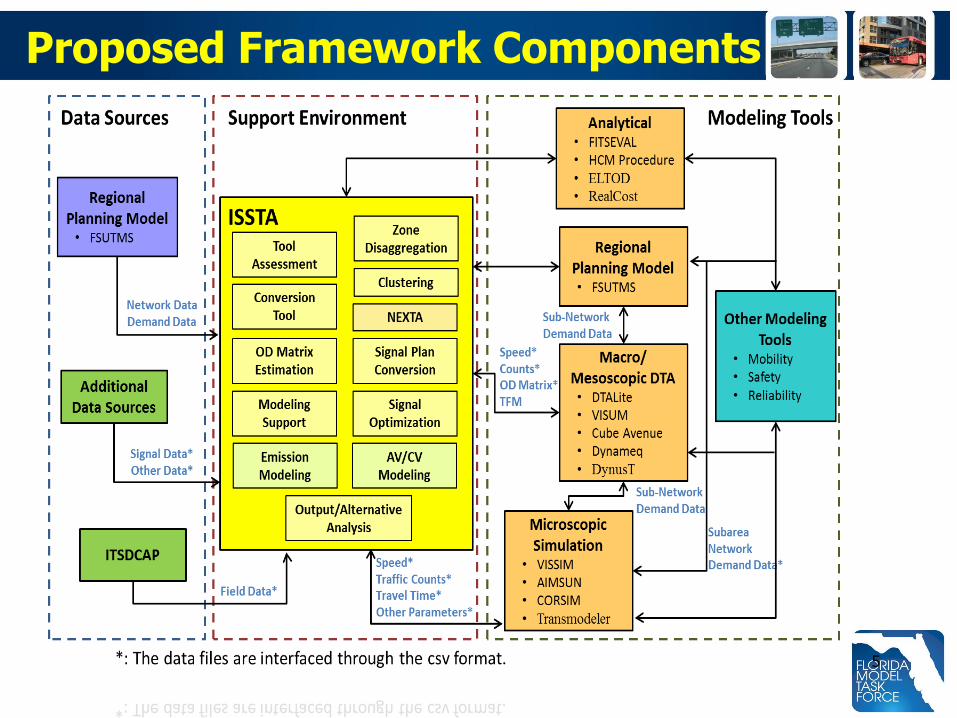
ML Modeling VOT Distribution
Goodness-of-Fit Statistics
Value of Time $ (VOT)
$12 $20 $30 $40 $50$40 Fixed
(without Distribution)
MAPE (%) 16.50 9.70 11.86 4.01 5.73 9.03
RMSE(veh/ln/15min) 73.94 41.76 52.11 18.11 26.60 40.34

Impact of VOR Use
Goodness-of-Fit Statistics ELToD Meso Macro
With
Consideration of
VOR
RMSE
(veh/ln/15min)12.00 8.23-9.18 10.77
MAPE (%) 2.29 1.89-1.96 2.27
Without
Consideration of
VOR
RMSE
(veh/ln/15min)54.30 40.34-46.22 37.03
MAPE (%) 13.36 9.03-11.29 8.68
𝑇𝑇𝐼𝑛% = 𝑒(𝑗𝑛 𝐿𝐻𝐿+𝑘𝑛𝑑𝑐𝑐𝑟𝑖𝑡 +𝑙𝑛𝑅0.05" ) (4.1)
Where, 𝑇𝑇𝐼𝑛% = 𝑛𝑡ℎ 𝑝𝑒𝑟𝑐𝑒𝑛𝑡𝑖𝑙𝑒 𝑇𝑇𝐼 𝑣𝑎𝑙𝑢𝑒
𝐿𝐻𝐿 = 𝑙𝑎𝑛𝑒 − ℎ𝑜𝑢𝑟 𝑙𝑜𝑠𝑡 𝑑𝑐𝑐𝑟𝑖𝑡 = 𝑐𝑟𝑖𝑡𝑖𝑐𝑎𝑙 𝑑𝑒𝑚𝑎𝑛𝑑 − 𝑐𝑎𝑝𝑎𝑐𝑖𝑡𝑦 𝑟𝑎𝑡𝑖𝑜
𝑅0.05" = ℎ𝑜𝑢𝑟𝑠 𝑜𝑓 𝑟𝑎𝑖𝑛𝑓𝑎𝑙 𝑒𝑥𝑐𝑒𝑒𝑖𝑛𝑔 0.05 𝑖𝑛𝑐ℎ𝑒𝑠
𝑗𝑛 , 𝑘𝑛 ,𝑙𝑛 = 𝑐𝑜𝑒𝑓𝑓𝑖𝑐𝑖𝑒𝑛𝑡𝑠 𝑓𝑜𝑟 𝑛𝑡ℎ 𝑝𝑒𝑟𝑐𝑒𝑛𝑡𝑖𝑙𝑒
U 𝑎1 𝑇𝑇 + 𝑎2 𝑇𝐶 + 𝑎3 𝑇𝑇80% + 𝑎4 𝑇𝑇95%
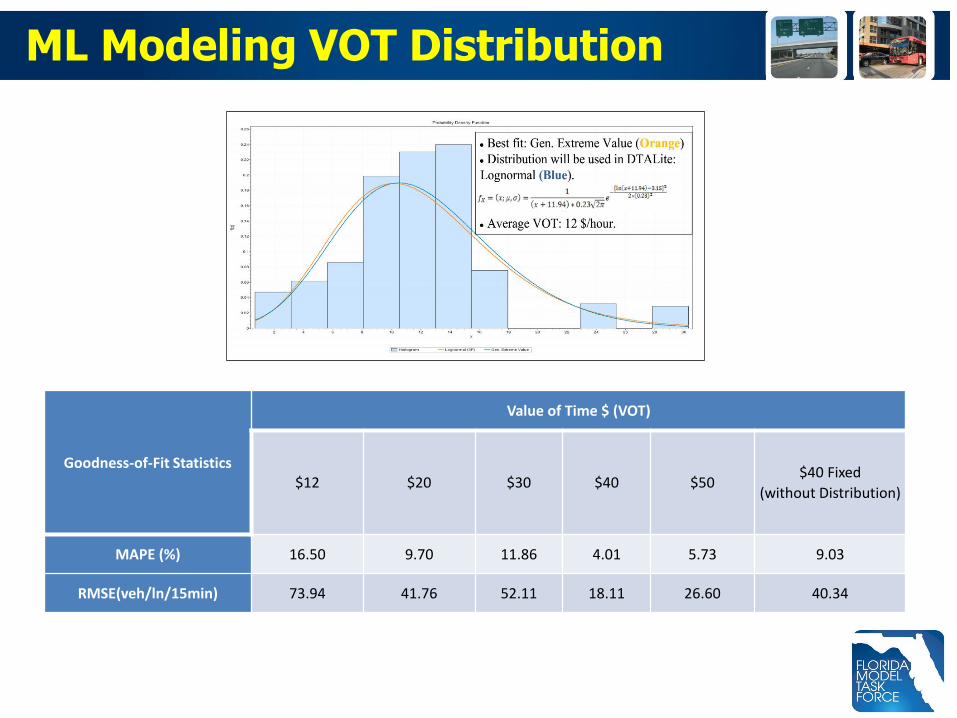
Can Models Predict ML Shifts
Goodness-of-Fit StatisticsFixed Pricing and Static
Assignment(ELTOD)
Dynamic pricing with Dynamic Assignment
(Avenue)
New Toll PolicyRMSE (veh/ln/15min) 51.42 25.15
MAPE (%) 12.22 5.87
Old Toll policyRMSE (veh/ln/15min) 67.39 31.04
MAPE (%) 13.48 5.90

Macro+Meso+Micro Modeling
• Waiting for I-95 Model from FDOT D6

Estimation of CV MP
0
0.1
0.2
0.3
0.4
0.5
0.6
0.7
0.8
0.9
1
1 2 3 4 5 6 7 8 9 10 11 12 13 14 15 16 17 18 19 20 21 22 23 24 25 26 27 28 29 30
Per
cen
tage
of
CV
Year
Min MP
Max MP
MP Difference

Estimation of CV MP
Percentage of CACC Vehicles (%) Lane Capacity (veh/ln/hr)
0 2018
0 2092
40 2230
60 2500
80 2890
100 4000
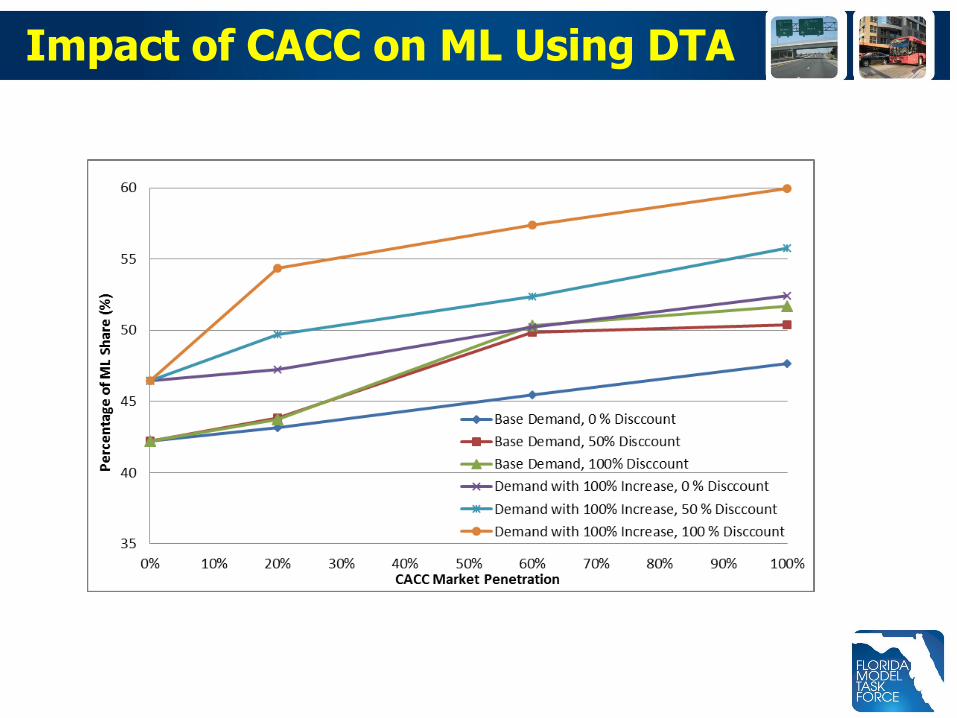
Impact of CACC on ML Using DTA
0
5
10
15
20
25
30
35
40
45
50
0.8 0.9 1 1.1 1.2 1.3 1.4 1.5
Tra
vel D
ela
y(m
in)
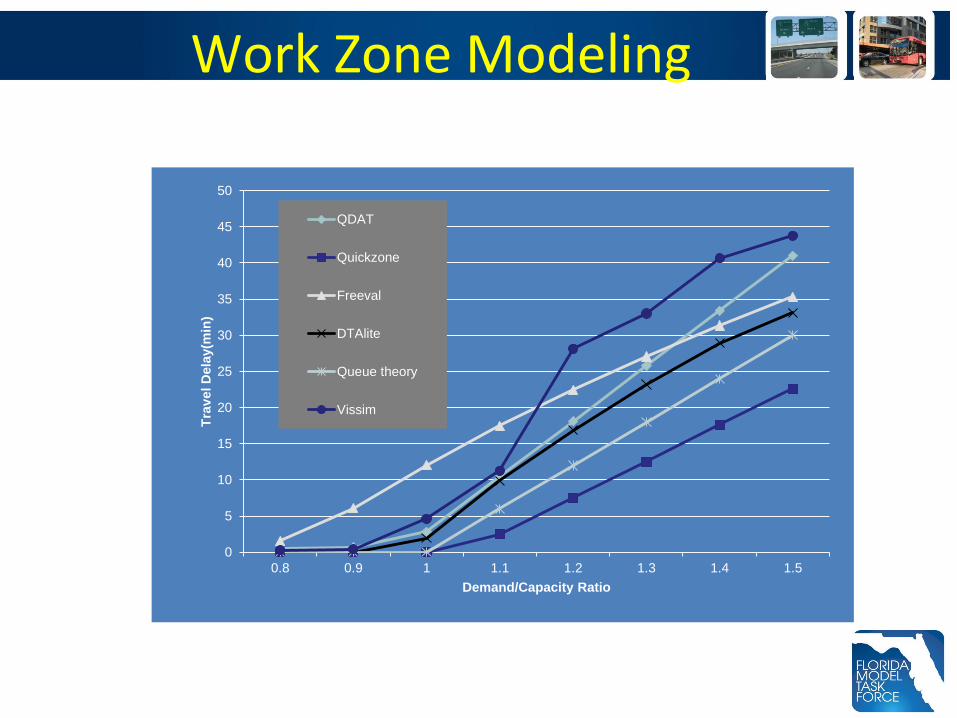
Demand/Capacity Ratio
QDAT
Quickzone
Freeval
DTAlite
Queue theory
Vissim
Work Zone Modeling

Construction Diversion Analysis
• Demonstrate how day-to-day learning type assignment can be used in conditions, in which equilibrium cannot be assumed
• For work zones with different number of days utilizing DTALite learning
• Compare to user equilibrium and logit model

Diversion Analysis Results

Meso+Micro Modeling of WZ
0
10
20
30
40
50
60
I-595 I-95_NB Ramp I-95_SB Ramp
Without Diversion
With Diversion_long-term
With Diversion_short-term

ATM - Modeling Different Demands

Turning Movement in DTA
• Good estimation of link volume does not guarantee good turning movement volumes
• Turning movement volumes needed for many applications - need incorporating TM in calibration and updating zones and connecters
• Use TM counts, improve network connectors, and fine-tune demands to produce counts
Observed Count volume
PRMSE Without
Multilevel calibration
PRMSE With Multi
level Calibration
0 ~ 250 56.35% 26.96%
250 ~ 500 62.99% 26.55%
>500 82.90% 23.28%

Application of MRM to DTA
• Testing the benefits of MRM for updating capacity and signal control under different demands