
Framework for Evaluating Quality Performances of ...
17
Journal of Construction in Developing Countries, 25(1), 163–179, 2020 © Penerbit Universiti Sains Malaysia, 2020. This work is licensed under the terms of the Creative Commons Attribution (CC BY) (http://creativecommons.org/licenses/by/4.0/). Framework for Evaluating Quality Performances of Subcontractors: Case of Turkish Contractors * Befrin Neval Bingol 1 and * Gul Polat 2 Published online: 15 July 2020 To cite this article: Befrin Neval Bingol and Gul Polat (2020). Framework for evaluating quality performances of subcontractors: Case of Turkish contractors. Journal of Construction in Developing Countries, 25(1): 163–179. https://doi.org/10.21315/ jcdc2020.25.1.9. To link to this article: https://doi.org/10.21315/jcdc2020.25.1.9 Abstract: Success of a construction project mainly depends on the performances of the subcontractors. Thus, general contractors should be very careful when selecting their subcontractors. Turkish contractors are active in international markets, where competition is fierce. This study aims to provide general contractors, who predominantly operate in international markets, with a practical and user-friendly subcontractor quality performance measurement framework. The methodology of this study has two main phases, pre-survey and survey stages. The pre-survey stage aims to identify the most important key performance indicators (KPIs), which can be used to develop a framework for measuring the quality performances of candidate subcontractors. For this purpose, an extensive literature review and a questionnaire survey among 40 large scale Turkish contractors were conducted. In the survey stage, the performance measurement framework was developed using the group decision on the weights of the most important KPIs obtained from the analytic hierarchy process (AHP) calculations. Face-to-face interviews were conducted with the target users of the proposed performance measurement framework to construct the comparison matrices and thereby determine the weights of these KPIs. The proposed framework can be used by Turkish contractors to measure the quality performances of subcontractor candidates in an objective, systematic and structured manner. Keywords: AHP, Group decision making, KPI, Subcontractor selection, Quality performance measurement INTRODUCTION Globalisation and scarcity of construction projects in domestic markets compel general contractors to expand into new markets. Turkey is a developing country and both the economic crisis and shortage of projects have induced Turkish contractors to seek new opportunities in foreign countries since 1972. Turkish contractors have done business in 120 countries and undertaken more than 9,300 international projects, most of which were large or mega-scale projects, since then. As a result of the success of these projects, Turkish contractors ranked second in the Engineering News-Record (ENR) "Top 250 International Contractors" list in 2016 (Turkish Contractors Association [TCA], 2018). Large or mega-scale construction projects involve a great number of activities and general contractors may not be capable of carrying out all these activities by themselves. In those cases, they may prefer to divide their projects into smaller 1 Department of Civil Engineering, Sirnak University, Mehmet Emin Acar Campus, Sirnak, TURKEY 2 Department of Civil Engineering, Istanbul Technical University, Istanbul, TURKEY *Corresponding author: [email protected]
Transcript of Framework for Evaluating Quality Performances of ...
Journal of Construction in Developing Countries 25(1) 163ndash179 2020
copy Penerbit Universiti Sains Malaysia 2020 This work is licensed under the terms of the Creative Commons Attribution (CC BY) (httpcreativecommonsorglicensesby40)
Framework for Evaluating Quality Performances of Subcontractors Case of Turkish Contractors
Befrin Neval Bingol1 and Gul Polat2
Published online 15 July 2020
To cite this article Befrin Neval Bingol and Gul Polat (2020) Framework for evaluating quality performances of subcontractors Case of Turkish contractors Journal of Construction in Developing Countries 25(1) 163ndash179 httpsdoiorg1021315jcdc20202519
To link to this article httpsdoiorg1021315jcdc20202519
Abstract Success of a construction project mainly depends on the performances of the subcontractors Thus general contractors should be very careful when selecting their subcontractors Turkish contractors are active in international markets where competition is fierce This study aims to provide general contractors who predominantly operate in international markets with a practical and user-friendly subcontractor quality performance measurement framework The methodology of this study has two main phases pre-survey and survey stages The pre-survey stage aims to identify the most important key performance indicators (KPIs) which can be used to develop a framework for measuring the quality performances of candidate subcontractors For this purpose an extensive literature review and a questionnaire survey among 40 large scale Turkish contractors were conducted In the survey stage the performance measurement framework was developed using the group decision on the weights of the most important KPIs obtained from the analytic hierarchy process (AHP) calculations Face-to-face interviews were conducted with the target users of the proposed performance measurement framework to construct the comparison matrices and thereby determine the weights of these KPIs The proposed framework can be used by Turkish contractors to measure the quality performances of subcontractor candidates in an objective systematic and structured manner
Keywords AHP Group decision making KPI Subcontractor selection Quality performance measurement
InTroduCTIon
Globalisation and scarcity of construction projects in domestic markets compel general contractors to expand into new markets Turkey is a developing country and both the economic crisis and shortage of projects have induced Turkish contractors to seek new opportunities in foreign countries since 1972 Turkish contractors have done business in 120 countries and undertaken more than 9300 international projects most of which were large or mega-scale projects since then As a result of the success of these projects Turkish contractors ranked second in the Engineering News-Record (ENR) Top 250 International Contractors list in 2016 (Turkish Contractors Association [TCA] 2018)
Large or mega-scale construction projects involve a great number of activities and general contractors may not be capable of carrying out all these activities by themselves In those cases they may prefer to divide their projects into smaller
1Department of Civil Engineering Sirnak University Mehmet Emin Acar Campus Sirnak TURKEY2Department of Civil Engineering Istanbul Technical University Istanbul TURKEYCorresponding author gulpolagmailcom
Befrin Neval Bingol and Gul Polat
164PENERBIT UNIVERSITI SAINS MALAYSIA
components and assign subcontractors to them based on their speciality areas In construction projects where large portions of the activities are outsourced numerous subcontractors are obliged to work together which in turn makes construction sites chaotic and complicated In such projects coordinating and controlling the works of these subcontractors is not an easy task for general contractors Since most of the construction activities are carried out by subcontractors and the success of the entire project which is mostly assessed in terms of time cost and quality is determined by their performances working with ineligible subcontractors may bring about failures such as delays cost overruns quality problems disputes etc Therefore general contractors should be very careful during the subcontractor selection process and select the right subcontractor for the right job to achieve business continuity in such a highly competitive market
In practice general contractors tend to select the subcontractor who offers the lowest bid price (Tserng and Lin 2002 Arslan et al 2008 Mbachu 2008 Hartmann Ling and Tan 2009) or is known from previous projects (Tserng and Lin 2002 Arslan et al 2008 Ulubeyli Manisali and Kazaz 2010 Choudhry et al 2012) However both practices may lead to severe problems in either meeting quality requirements or controlling the cost It is obvious that there is a need for a sound and systematic approach for measuringevaluating the performances of candidate subcontractors and selecting the most appropriate one in order to fulfil the contract requirements and ensure business continuity
General contractors may take into account several tangible and intangible criteria during the subcontractor evaluation and selection process While some of these criteria such as time and cost can be assessed easily as they can be numerically expressed the remaining criteria such as safety and quality performances of the candidate subcontractors cannot be easily assessed as they are highly subjective The quality of construction works is defined as to be fit for use as intended (Trinkūnienė et al 2017) and it is very difficult to estimate and evaluate the quality performance of a subcontractor at the beginning of a construction project Moreover even though subcontractors perform the large portions of the construction works general contractors are liable for the quality of the accomplished works (Enshassi et al 2008) Therefore there is a need for an approach which enables general contractors to measure the quality performances of the candidate subcontractors in an objective systematic and structured manner in order to improve the subcontractor selection process
The main objective of this study is to provide general contractors especially the ones who predominantly operate in international markets with a practical and user-friendly performance measurement framework which assists them in estimating quality performances of candidate subcontractors The proposed framework is based on the most commonly used KPIs The proposed framework also aims to enable general contractors (1) To predict the overall quality performance of the project (2) To achieve quality requirements specified in the contract and (3) To minimise risks resulting from quality problems
PrEVIouS STudIES on PErForMAnCE MEASurEMEnT And SuBConTrACTor SELECTIon In THE ConSTruCTIon InduSTrY
The construction sector is criticised by many researchers for its poor performance (Lee Cooper and Aouad 2000 Kagioglou Cooper and Aouad 2001) Performance
Quality Performances of Turkish Contractors
PENERBIT UNIVERSITI SAINS MALAYSIA165
measurement in the construction sector has scholarly attracted attention with the increasing complexity of construction projects and developments in construction management and technology (Lin and Shen 2007 Yang et al 2010) with studies often focusing on metrics of duration cost and quality objectives (Ward Curtis and Chapman 1991 Kagioglou Cooper and Aouad 2001) Recently new performance indicators such as customer satisfaction business performance safety and environment have gained importance (Yu et al 2007 Yang et al 2010) Performance measurement has been assessed in three levels project organisation and stakeholder
European Foundation for Quality Management (EFQM) balanced scorecard (BSC) model and key performance indicator (KPI) model are three of the most commonly used frameworks for performance measurement in the construction industry (Yang et al 2010) EFQM and BSC models are more suitable for strategic-level performance measurement and company-specific measurement KPI model however is more flexible and can be easily generalised and allows measuring performance at different levels In this study the KPI model is selected to construct a framework for measuring quality performances of subcontractor candidates at two different levels namely project and organisation
In construction management literature many studies focused on the subcontractor selection process Hatush and Skitmore (1997) identified a set of criteria to select eligible subcontractor and proposed a Delphic interview with a small group of construction professionals Mahdi et al (2002) proposed a multi-objective decision making technique for selecting appropriate contractors combining Delphi method with the analytic hierarchy process (AHP) Arslan et al (2008) used cost quality duration and qualification as the main selection criteria in their research which focused on the subcontractor selection problem El-Mashaleh (2009) proposed a data envelopment analysis model with 11 criterias for subcontractor selection Marzouk El Kherbawy and Khalifa (2013) identified 46 factors that can be used in the subcontractor selection process after conducting a questionnaire survey and carrying out statistical analysis to reveal the most significant factors in the selection process
There are also studies focusing on performance measurement in the construction industry Chan and Chan (2004) identified a set of subjective and objective selection criteria to measure project success based on expert opinions Time cost and quality were selected as the most important indicators Luu Kim and Huynh (2008) proposed a conceptual framework with nine main KPIs to improve project management performance of large contractors Their findings concluded that the benchmarking approach could help contractors to improve their performances Enshassi Mohamed and Abushaban (2009) identified indicators to measure the performance of the local projects by consulting important parties of construction projects which are owneremployer consultants and contractor groups A hybrid Delphi method was used by Yasamis-Seproni Lee and Arditi (2012) to determine the quality performance of contractors and an extensive literature review was conducted by Ali Al-Sulaihi and Al-Gahtani (2013) to identify KPIs to measure performances of construction companies at the organisational level in which the most critical KPIs were determined in accordance with relative importance index (RII) Ng and Skitmore (2014) developed a framework to appraise subcontractor using a BSC model and used a case to show the implementation of the proposed framework Their findings illustrated how the BSC model can help to increase the transparency of the subcontractor appraisal
Befrin Neval Bingol and Gul Polat
166PENERBIT UNIVERSITI SAINS MALAYSIA
METHodoLoGY
The methodology of this study has two phases (1) a pre-survey and (2) a survey stage (as shown in Figure 1)
Figure 1 Steps of the Proposed Methodology
Quality Performances of Turkish Contractors
PENERBIT UNIVERSITI SAINS MALAYSIA167
In the pre-survey stage firstly 12 KPIs which can be used to measure quality performance in construction projects were identified in the light of an extensive literature review (as shown in Table 1) Then a questionnaire survey among 40 large scale Turkish contractors most of which are members of TCA and predominantly act as general contractors was conducted to determine the relative importance of these KPIs According to the official figures issued by the Ministry of Labour and Social Security there are 494 large scale construction companies which employ more than 250 labourers in Turkey From these 494 companies 100 of them were selected using the purposive sampling method and were contacted Of the 100 mailed questionnaires 40 were returned duly filled out which corresponds to a response rate of 40 In the questionnaire the respondent companies were asked to rate the relative importance levels of 12 KPIs using typical five-level Likert scale where 1 represents the Least Importance and 5 represents the Highest Importance
Having collected the responses reliability (ie Cronbachs alpha) and ranking (ie RII) analyses were carried out in order to test the internal consistency of the scale used in questionnaire for measuring the perceptions of the respondents and to compute the relative importance of the KPIs respectively
Cronbachs alpha value was found to be 0939 which indicates that the internal consistency of the scale used is excellent (Field 2017) RII is calculated by dividing the arithmetic mean of the responses given for each KPI to the highest importance which is 5 in this study (Chen Okudan and Riley 2010) Based on the findings of the ranking analysis out of 12 KPIs six have High three have High-Medium and three have Medium RII As this study aims to construct an efficient and practical quality performance measurement framework three KPIs with Medium RII namely availability of quality assurance certificate and date of certificate (KPI2) subcontractors management ability of quality assurance and certificate programs (KPI3) and the establishment of quality assurance system and cost for managing it (KPI4) were eliminated The most important nine KPIs with High and High-Medium RIIs were used when constructing the quality performance measurement framework namely adequacy of quality assurance policy (Q1) application-level of the quality management system in projects (Q2) the audit of the quality management system in project level (Q3) construction quality (conformance to the specification) (Q4) the quality of workmanship (Q5) the cost of poor quality resulting from the low standard production (Q6) number of reworks (Q7) percentage of reworks () (Q8) and severity of defect at construction phase (Q9) The findings of the pre-survey phase were extensively reported in Bingol and Polat (2016)
In the survey stage the main objective was to calculate the group decision on the weights of the most important nine KPIs (Qs) used in the quality performance measurement framework on the subcontractor selection process In order to achieve this objective the AHP method was employed The target users of the proposed evaluation framework were the large scale Turkish general contractors who predominantly operate in international markets are listed in ENR Top 250 International Contractors list are the members of the TCA and had management system certificates (ie ISO 90012008 ISO 140012004 OHSAS 180012007) There are 27 Turkish contractors who fulfilled all these criteria Therefore the target population of this research was 27 and all of these companies were contacted Out of these 27 Turkish contractors 11 were accepted to contribute to the research Face-to-face interviews were conducted to construct pairwise comparison matrices The
Befrin Neval Bingol and Gul Polat
168PENERBIT UNIVERSITI SAINS MALAYSIA
individual judgements of these target users were aggregated to reach a group decision
Table 1 Identified KPIs and Their RIIs
KPI Q description references rII
KPI1 Q1 Adequacy of quality assurance policy
Enshassi Mohamed and Abushaban (2009) Yasamis-Speroni Lee and Arditi (2012)
H-M
KPI2 ndash Availability of quality assurance certificate and date of the certificate
Hatush and Skitmore (2010) M
KPI3 ndash Subcontractors management ability of quality assurance and certificate programs
Marzouk El Kherbawy and Khalifa (2013)
M
KPI4 ndash The establishment of a quality assurance system and cost for managing it
Luu Kim and Huynh (2008) M
KPI5 Q2 Application-level of the quality management system in projects
Luu Kim and Huynh (2008) H-M
KPI6 Q3 The audit of the quality management system in project level
Luu Kim and Huynh (2008) H-M
KPI7 Q4 Construction quality (conformance to the specification)
Mahdi et al (2002) Chan and Chan (2004) Luu Kim and Huynh (2008) Arslan et al (2008) El-Mashaleh (2009) Enshassi Mohamed and Abushaban (2009)
H
KPI8 Q5 The quality of workmanship Hatush and Skitmore (1997) Arslan et al (2008) El-Mashaleh (2009)
H
KPI9 Q6 The cost of poor quality resulting from the low standard production
Marzouk El Kherbawy and Khalifa (2013)
H
KPI10 Q7 Number of reworks Ali Al-Sulaihi and Al-Gahtani (2013)
H
KPI11 Q8 Percentage of reworks () Ng and Skitmore (2014) H
KPI12 Q9 The severity of defect at the construction phase
Enshassi Mohamed and Abushaban (2009)
H
Notes RII = L Low (RII lt 02) M-L Medium-Low (02 le RII lt 04) M Medium (04 le RII lt 06) H-M High-Medium (06 le RII lt 08) H High (RII ge 08) Source Chen Okudan and Riley (2010)
AHP was developed by Saaty (1980) It is a basic approach that deals with both the rational and the intuitive decisions to select the most appropriate option
Quality Performances of Turkish Contractors
PENERBIT UNIVERSITI SAINS MALAYSIA169
from several alternatives with respect to several criteria (Saaty and Vargas 2012) Fundamentally the AHP method is based on mathematics and psychology and is the application of an Eigenvalue approach to the pairwise comparisons (Vaidya and Kumar 2006) The simplest form of AHP is composed of a hierarchy consisting of three levels (1) The goal of the decision is at the top level (2) Criteria of the goal are in the second level and (3) Alternatives are located in the third level (Saaty and Vargas 2012)
The AHP methodology relies on pairwise comparison of either criteria or alternatives Decision-makers compare criteriaalternative using actual measurements or a fundamental scale to reflect the relative strength of their preferences and feelings In the pairwise comparison matrices the question of How many times the one criterionalternative is more important or dominant over the other criterionalternative with respect to the goalcriterion should be expressed on a scale of 1 to 9 (as shown in Table 2) (Saaty 2008)
Table 2 Saatys Rating Scale
Intensity of Importance Definition Explanation
1 Equal importance Two factors contribute equally to the objective
3 Somewhat more important
Experience and judgement slightly favour one over the other
5 Much more important
Experience and judgement strongly favour one over the other
7 Very much more important
Experience and judgement very strongly favour one over the other
9 Absolutely more important
The evidence favouring one over the other is one of the highest possible validity
2ndash4ndash6ndash8 Intermediate values When compromise is needed
Reciprocal of above nonzero numbers
If the activity i has one of the above nonzero numbers assigned to it when compared with activity j then j has the reciprocal value when compared to i
Source Saaty (2008)
The constructed pairwise comparison matrices are positive and reciprocal (ie a[ ]ij
1 a ji= ) (as shown in Equation 1)
1
1a
1a a
A
a a
a
a
a12
1 2
2a
n n
n
n
nm
11 12
22
1
=h h
g
g
g
g
h
R
T
SSSSSSSSSSSSS
V
X
WWWWWWWWWWWWW
(Eq 1)
Befrin Neval Bingol and Gul Polat
170PENERBIT UNIVERSITI SAINS MALAYSIA
Saaty (1980) proposed to check the inconsistency of judgements with a measure called the Consistency Index (CI) CI is calculated with the following Equation 2
1CI
nnmax= m
-
-^] g
h (Eq 2)
where maxm is the principal eigenvalue of the judgement matrix and n refers to the number of criteria in this matrix The consistencies of decision-makers evaluation are checked with the consistency ratio (CR) The following equation is used to determine this ratio (as shown in Equation 3)
1CI
nnmax= m
-
-^] g
h (Eq 3)
CR depends on both the CI and the random index The random index values determined based on different numbers are provided in Table 3
Table 3 Random Index
number of Items random Index number of Items random Index
1 0 6 124
2 0 7 132
3 058 8 141
4 090 9 145
5 141 10 149
Source Timor (2011)
The value of CR for comparison matrices should be less than 01 to provide consistency of the decision-maker If not the results of the pairwise comparison need to be re-evaluated to improve consistency
In most real-life decision-making problems decisions are made by several decision makers AHP is a convenient method to be used in group decision making There are two different approaches for combining individual judgements which include (1) aggregating individual judgements and (2) aggregating individual priorities (Escobar Aguaroacuten and Moreno-Jimeacutenez 2004) The weighted geometric mean and the row geometric mean methods are used for combining group decision (Escobar Aguaroacuten and Moreno-Jimeacutenez 2004) According to Saaty (2008) taking the geometric mean of individual judgements is the best way to convert individual preferences into a group decision Usage of 1 to 9 rating scale for individual judgements mainly result in preferring the geometric mean to reach a group decision (Timor 2011 Onder and Onder 2014)
When the individual judgements of the decision-makers are combined with the weighted geometric mean method the final priority is computed via Equation 4
ww ( )ijG
ijd
k 1
m k=
=
m^ h (Eq 4)
Quality Performances of Turkish Contractors
PENERBIT UNIVERSITI SAINS MALAYSIA171
where wijG represents group decision computed with the weighted geometric
mean m represent the number of decision-makers represents the decision matrix of the decision-maker and λk represents the weight of decision-maker
AnALYSIS And FIndInGS
Characteristics of the Interviewed Companies
Out of 27 Turkish contractors 11 accepted to participate in face-to-face interviews corresponding to a response rate of 4074 Interviews were conducted with 11 civil engineers who were in charge of subcontractor evaluation and selection process In these interviews seven questions were asked to reveal the general characteristics of the interviewed companies The findings of the general characteristics of the companies were summarised in Table 4
Table 4 Demographic Characteristics of 11 Contractors
demographic Characteristics N Valid
Experience in the industry 1 to 5 years ndash ndash
6 to 10 years ndash ndash
11 to 15 years ndash ndash
16 to 20 years 2 182
21 to 25 years 3 273
26 to 30 years ndash ndash
gt 30 years 6 545
Total 11 100
Membership of TCA Member 11 100
Not a Member 0 0
Total 11 100
Roles of respondent companies General contractor 11 100
Subcontractor 1 91
Partner of the consortium 1 91
Member of a joint venture 3 273
Consultant companies ndash ndash
Others ndash ndash
The markets that the respondent companies operate predominantly
National (Domestic) ndash ndash
International 8 727
Equally on national and international markets
3 273
(continued on next page)
Befrin Neval Bingol and Gul Polat
172PENERBIT UNIVERSITI SAINS MALAYSIA
demographic Characteristics N Valid
Expertise areas Commercial buildings 7 636
Industrial buildings 7 636
Residential buildings 5 455
Infrastructure and transportation structures
7 636
Others 2 182
Percentages of work capacity transferred to subcontractors
1 to 25 1 91
26 to 50 4 364
51 to 75 5 455
76 to 100 1 91
Total 11 100
Experience of the respondents in the interviewed companies
1 to 4 years 1 909
5 to 9 years 2 1818
10 to 14 years ndash ndash
15 to 19 years 2 1818
20 to 24 years 3 2727
25 to 29 years 2 1818
30 to 34 years ndash ndash
gt 34 years 1 909
Total 11 100
According to the data obtained in the interviews out of the 11 contractors 5454 have 16 to 20 years of experience in the sector while 2727 have six to 10 years and 1818 have one to five years of experience It is observed that 100 of the respondent companies are general contractors where 91 of them are subcontractors 273 of them are a member of joint ventures and 91 are consultant companies in the undertaken projects On the other hand among 11 companies eight (727) were operating only in international markets and three (273) were operating in both national and international markets Based on the responses received from the companies 636 of them are specialised in commercial buildings industrial buildings and infrastructure-transport structures while 455 of them are specialised in residential buildings and 182 of them are specialised in other types of projects Findings revealed that 455 of the companies sublet 51 to 75 of the total work capacity to the subcontractor companies 364 of them sublet 26 to 50 of the total work capacity 91 of them sublet 1 to 25 of the total work capacity and 76 to 100 of the work capacity to the subcontractor companies
Table 4 (continued)
Quality Performances of Turkish Contractors
PENERBIT UNIVERSITI SAINS MALAYSIA173
Group decision on the Weights of the Most Important KPIs (Qs)
Respondents are strategically competitors and the individual preferences of these 11 companies have been taken one by one and then were combined to reach a group decision for the proposed framework The AHP method was applied to determine the weights of the nine KPIs in the quality performance measurement framework In the interviews Saatys (2008) rating scale was used to calculate the relative importance of these nine KPIs
In this step first 11 pairwise comparison matrices were built to understand the individual judgements of each company the weights of nine KPIs in each company were calculated and the consistency index of each comparison matrix was checked (as shown in Table 5)
Then the individual matrices were aggregated using the weighted geometric mean method into a single matrix to reach a group decision (using Equation 4) and the consistency index of the aggregated pairwise comparison matrix was checked The aggregated individual priorities are presented in Table 6 and the aggregated weights of nine KPIs are shown in the last column of Table 5
According to the findings displayed in Table 5 Construction quality (conformance to the specification) (Q4) is the most effective indicator with the weight of 024009 in the developed framework This indicator is followed by The quality of workmanship (Q5) with the weight of 017890 Application-level of the quality management system in projects (Q2) with the weight of 011874 and The audit of the quality management system in project-level (Q3) with the weight of 009979 On the other hand the least effective indicator in the framework is Number of reworks (Q7) with the weight of 005634
development of the Quality Performance Measurement Framework
The proposed quality performance measurement framework consists of three steps which are (1) inputs (2) process and (3) output (as shown in Figure 2)
Figure 2 Framework for Measuring Quality Performance of Subcontractors
Befrin Neval Bingol and Gul Polat
174PENERBIT UNIVERSITI SAINS MALAYSIA
Tabl
e 5
Ind
ivid
ual P
riorit
ies o
f Nin
e KP
Is A
ccor
din
g to
the
11 T
urki
sh G
ener
al C
ontra
ctor
Com
pani
es
wGC
1w
GC
2w
GC
3w
GC
4w
GC
5w
GC
6w
GC
7w
GC
8w
GC
9w
GC10
wGC
11wQG
1
Q1
010
252
010
673
007
935
010
000
027
167
010
605
005
593
008
900
004
907
004
901
002
712
008
881
Q2
010
252
022
065
010
146
010
000
008
751
010
605
005
593
008
900
015
056
004
901
025
479
011
880
Q3
010
252
015
801
014
647
010
000
008
751
010
605
009
904
006
572
015
056
004
901
002
712
009
960
Q4
018
472
015
801
028
382
020
000
027
168
019
915
037
413
013
802
022
251
026
073
017
534
024
070
Q5
018
472
007
485
022
584
020
000
016
496
010
605
028
481
013
802
015
056
026
073
010
653
017
886
Q6
010
252
010
673
005
088
010
000
002
917
010
605
003
254
018
842
002
096
009
416
002
654
006
956
Q7
010
252
005
009
002
669
010
000
002
917
005
853
003
254
001
617
008
525
004
901
010
361
005
623
Q8
006
700
005
009
005
088
005
000
002
917
010
605
003
254
008
724
008
525
009
416
017
534
007
377
Q9
005
096
007
485
003
462
005
000
002
917
010
605
003
254
018
842
008
525
009
416
010
361
007
368
CR
000
890
001
700
001
290
000
000
000
110
000
370
000
900
001
850
000
770
000
090
000
600
Tabl
e 6
An
Agg
rega
ted
Pai
rwise
Com
paris
on M
atrix
of 1
1 Tu
rkish
Con
tract
ors
Q1
Q2
Q3
Q4
Q5
Q6
Q7
Q8
Q9
Q1
10
722
088
160
3537
049
071
3493
158
811
2535
122
11
Q2
138
511
122
110
4847
062
161
7152
204
331
6733
163
01
Q3
113
430
8189
10
4012
053
571
5121
180
81
3493
138
51
Q4
282
72
063
249
221
155
443
3114
389
713
076
301
42
Q5
203
811
6086
186
690
6433
12
5126
332
712
4922
235
04
Q6
074
110
583
066
130
302
039
81
122
110
9638
1
Q7
062
970
4894
055
310
2566
030
060
8189
10
7616
072
2
Q8
079
780
5976
074
110
3251
040
121
0375
131
31
106
5
Q9
081
890
6134
072
20
3318
042
551
138
510
9389
1
Quality Performances of Turkish Contractors
PENERBIT UNIVERSITI SAINS MALAYSIA175
Inputs of the framework include group decision on the weights of the most important KPIs (Qs) which are obtained from AHP calculations measurement scales for each KPI the direction of preference of each KPI (minimum is the most favourable or maximum is the most favourable) and the evaluations of all candidate subcontractors with respect to each KPI
Having determined the inputs values in the process step the performance scores (q) of all candidate subcontractors are calculated by normalising the evaluations concerning each KPI considering the direction of preference If the direction of preference is maximum the quantitative equivalence of the evaluation of a subcontractor candidate for any KPI is divided by the sum of the evaluations of all subcontractors to the KPI in question On the other hand if the direction of preference is minimum the reciprocals of the quantitative equivalences of the evaluations are normalised By this way the subcontractor candidate with the minimum value becomes more favourable
In the output step the overall quality performance index (QPI) of each subcontractor candidate can be calculated using Equation 5
QPI w q1
9
SC iG
iim m=
= (Eq 5)
Where QPISCm represents the overall QPI of the mth subcontractor wiG represents
the aggregated weight of the ith KPI (Qi) based on group decision and qim represents the performance score of the mth subcontractor candidate for the ith KPI (Qi)
An Illustrative Example of the Application of the Proposed Quality Performance Measurement Framework
An illustrative example has been presented to demonstrate how the proposed framework can be used by a Turkish general contractor who intends to evaluate the quality performances of the subcontractor candidates under consideration for an international construction project
In the illustrative example (as shown in Table 7) there are five subcontractor candidates First the general contractor determines the measurement scales for each KPI identifies the direction of preference of each KPI and evaluates all candidate subcontractors for each KPI based on the identified measurement scale The weights of the KPIs are obtained from the AHP calculations presented in the last column of Table 5 Second the general contractor calculates the performance scores (q) of all candidate subcontractors And finally the general contractor computes the overall QPI of all candidate subcontractors In the illustrative example the overall quality performance of the fourth subcontractor candidate (SC_4) is higher than the other candidates
Befrin Neval Bingol and Gul Polat
176PENERBIT UNIVERSITI SAINS MALAYSIA
Tabl
e 7
An
Illust
rativ
e Ex
ampl
e of
the
App
licat
ion
of th
e Pr
opos
ed F
ram
ewor
k
Q
Q D
efini
tion
Mea
sure
men
t Sc
ales
dire
ctio
n of
Pr
efer
ence
sW
eigh
tsEv
alua
tions
of S
ubco
ntra
ctor
Can
dida
tes
Qua
lity
Scor
es o
f Sub
cont
ract
or C
andi
date
s
SC_1
SC_2
SC_3
SC_4
SC_5
q_1
q_2
q_3
q_4
q_5
Q1
Ad
equa
cy o
f qu
ality
ass
uran
ce
polic
y
VBndash
VG
2M
ax
008
881
GV
GM
GV
G0
190
023
80
143
019
00
238
Q2
The
appl
icat
ion
leve
l of t
he q
ualit
y m
anag
emen
t sy
stem
in p
roje
cts
VBndash
VG
Max
0
1188
0G
MM
MG
023
50
176
017
60
176
023
5
Q3
The
aud
it of
th
e qu
ality
m
anag
emen
t sy
stem
in p
roje
ct
leve
l
VBndash
VG
Max
0
0996
0M
GG
VG
M0
158
021
10
211
026
30
158
Q4
Con
stru
ctio
n qu
ality
(c
onfo
rman
ce to
th
e sp
ecifi
catio
n)
VBndash
VG
Max
0
2407
0G
VG
GM
G0
200
025
00
200
015
00
200
Q5
The
qual
ity o
f w
orkm
ansh
ipV
BndashV
GM
ax
017
886
VG
MV
GG
M0
250
015
00
250
020
00
150
Q6
The
cost
of
poor
qua
lity
resu
lting
from
th
e lo
w st
and
ard
pr
oduc
tion
M
in
006
956
12
29
21
11
10
234
009
70
134
028
10
255
Q7
Num
ber o
f rew
orks
Num
ber
Min
0
0562
314
98
411
011
00
171
019
30
386
014
0
Q8
Perc
enta
ge o
f re
wor
ks (
)
Min
0
0737
73
24
44
11
83
30
190
013
80
149
033
80
185
Q9
The
seve
rity
of
def
ect a
t the
co
nstru
ctio
n ph
ase
VLndash
VH
3M
in
007
368
MH
MV
HH
024
40
183
024
40
146
018
3
QPI
020
80
190
019
70
213
019
3
Not
es V
B =
Ver
y Ba
d (1
) B
= Ba
d (2
) M
= M
ediu
m (3
) G
= G
ood
(4)
VG
= V
ery
Goo
d (5
) V
L =
Ver
y Lo
w (1
) L
= Lo
w (2
) M
= M
ediu
m (3
) H
= Hi
gh (4
) V
H =
Ver
y Hi
gh (5
)
Quality Performances of Turkish Contractors
PENERBIT UNIVERSITI SAINS MALAYSIA177
ConCLuSIon
Since most of the international construction projects are highly complex in nature they require the involvement of multiple subcontractors therefore the selection of the most appropriate subcontractor becomes crucial for the overall project success The subcontractor selection process is mostly affected by several compromising and conflicting tangible and intangible criteria While the criteria like cost and time can be numerically measured the criteria like safety and quality cannot be easily measured This study aimed to solve this issue by developing a framework for measuring the quality performances of subcontractor candidates more systematically and rationally way To use the proposed framework subcontractor candidates should be assessed based on the identified nine KPIs After these assessments the quality performance of the candidates can be determined using the proposed framework The measurement framework includes indicators that can be measured quantitatively and qualitatively
The limitations of this study are related to the developed framework relying on the individual preferences of the 11 Turkish companies that are also the target users This potential limitation can be overcome by increasing the sample size Moreover the performance of the proposed framework should be tested with real cases
rEFErEnCES
Ali HAEM Al-Sulaihi IA and Al-Gahtani KS (2013) Indicators for measuring performance of building construction companies in Kingdom of Saudi Arabia Journal of King Saud University ndash Engineering Sciences 25(2) 125ndash134 httpsdoiorg101016jjksues201203002
Arslan G Kivrak S Birgonul MT and Dikmen I (2008) Improving sub-contractor selection process in construction projects Web-based sub-contractor evaluation system (WEBSES) Automation in Construction 17(4) 480ndash488 httpsdoiorg101016jautcon200708004
Bingol BN and Polat G (2016) Measuring quality performances of subcontractors using key performance indicators (KPIs) model Paper presented at the 12th International Congress on Advances in Civil Engineering Istanbul Turkey 21ndash23 September
Chan APC and Chan APL (2004) Key performance indicators for measuring construction success Benchmarking An International Journal 11(2) 203ndash221 httpsdoiorg10110814635770410532624
Chen Y Okudan GE and Riley DR (2010) Sustainable performance criteria for construction method selection in concrete buildings Automation in Construction 19(2) 235ndash244 httpsdoiorg101016jautcon200910004
Choudhry RM Hinze JW Arshad M and Gabriel HF (2012) Subcontracting practices in the construction industry of Pakistan Journal of Construction Engineering and Management 138(12) 1353ndash1359 httpsdoiorg101061(ASCE)CO1943-78620000562
El-Mashaleh MS (2009) A construction subcontractor selection model Jordan Journal of Civil Engineering 3(4) 375ndash383
Enshassi A Choudhry RM Mayer PE and Shoman Y (2008) Safety performance of subcontractors in the Palestinian construction industry Journal of Construction in Developing Countries 13(1) 51ndash62
Befrin Neval Bingol and Gul Polat
178PENERBIT UNIVERSITI SAINS MALAYSIA
Enshassi A Mohamed S and Abushaban S (2009) Factors affecting the performance of construction projects in the Gaza strip Journal of Civil Engineering and Management 15(3) 269ndash280 httpsdoiorg1038461392-3730200915269-280
Escobar MT Aguaroacuten J and Moreno-Jimeacutenez JM (2004) A note on AHP group consistency for the row geometric mean priorization procedure European Journal of Operational Research 153(2) 318ndash322 httpsdoiorg101016S0377-2217(03)00154-1
Field A (2017) Discovering Statistics Using IBM SPSS Statistics North American Edition Thousand Oaks CA SAGE
Hartmann A Ling FYY and Tan JS (2009) Relative importance of subcontractor selection criteria Evidence from Singapore Journal of Construction Engineering and Management 135(9) 826ndash832 httpsdoiorg101061(ASCE)0733-9364(2009)1359(826)
Hatush Z and Skitmore M (1997) Criteria for contractor selection Construction Management and Economics 15(1) 19ndash38 httpsdoiorg101080014461997373088
Kagioglou M Cooper R and Aouad G (2001) Performance management in construction A conceptual framework Construction Management and Economics 19(1) 85ndash95 httpsdoiorg10108001446190010003425
Lee A Cooper R and Aouad G (2000) A methodology for designing performance measures for the UK construction industry Paper presented at the Bizarre Fruit 2000 Postgraduate Research Conference on the Built and Human Environment University of Salford Salford UK 9ndash10 March
Lin G and Shen Q (2007) Measuring the performance of value management studies in construction Critical review Journal of Management in Engineering 23(1) 2ndash9 httpsdoiorg101061(ASCE)0742-597X(2007)231(2)
Luu VT Kim S-Y and Huynh T-A (2008) Improving project management performance of large contractors using benchmarking approach International Journal of Project Management 26(7) 758ndash769 httpsdoiorg 101016jijproman200710002
Mahdi IM Riley MJ Fereig SM and Alex AP (2002) A multi-criteria approach to contractor selection Engineering Construction and Architectural Management 9(1) 29ndash37 httpsdoiorg101108eb021204
Marzouk MM El Kherbawy AA and Khalifa M (2013) Factors influencing sub-contractors selection in construction projects HBRC Journal 9(2) 150ndash158 httpsdoiorg101016jhbrcj201305001
Mbachu J (2008) Conceptual framework for the assessment of subcontractors eligibility and performance in the construction industry Construction Management and Economics 26(5) 471ndash484 httpsdoiorg10108001446190801918730
Ng ST and Skitmore M (2014) Developing a framework for subcontractor appraisal using a balanced scorecard Journal of Civil Engineering and Management 20(2) 149ndash158 httpsdoiorg103846139237302013802705
Onder G and Onder E (2014) AHS In E Oumlnder and BF Yildirim (eds) Ccedilok Kriterli Karar Verme Istanbul Dora Yayincilik 21ndash64
Saaty T (1980) The Analytic Process Planning Priority Setting Resources Allocation London McGraw-Hill
Quality Performances of Turkish Contractors
PENERBIT UNIVERSITI SAINS MALAYSIA179
Saaty TL (2008) Decision making with the analytic hierarchy process International Journal of Services Sciences 1(1) 83ndash98 httpsdoiorg101504IJSSCI2008017590
Saaty TL and Vargas LG (2012) Models Methods Concepts and Applications of the Analytic Hierarchy Process BerlinHeidelberg Springer Science and Business Media 175
Timor M (2011) Analitik Hiyerarsi Prosesi Istanbul Turkmen KitabeviTrinkūnienė E Podvezko V Zavadskas EK Jokšienė I Vinogradova I and
Trinkūnas V (2017) Evaluation of quality assurance in contractor contracts by multi-attribute decision-making methods Economic Research ndash Ekonomska Istraživanja 30(1) 1152ndash1180 httpsdoiorg1010801331677X20171325616
Tserng HP and Lin PH (2002) An accelerated subcontracting and procuring model for construction projects Automation in Construction 11(1) 105ndash125 httpsdoiorg101016S0926-5805(01)00056-5
Turkish Contractors Association (TCA) (2018) Turkish Contractors Association Sector Report Ankara TCA
Ulubeyli S Manisali E and Kazaz A (2010) Subcontractor selection practices in international construction projects Journal of Civil Engineering and Management 16(1) 47ndash56 httpsdoiorg103846jcem201004
Vaidya OS and Kumar S (2006) Analytic hierarchy process An overview of applications European Journal of Operational Research 169(1) 1ndash29 httpsdoiorg101016jejor200404028
Ward S Curtis B and Chapman C (1991) Objectives and performance in construction projects Construction Management and Economics 9(4) 343ndash353 httpsdoiorg10108001446199100000027
Yang H Yeung JF Chan AP Chiang Y and Chan DW (2010) A critical review of performance measurement in construction Journal of Facilities Management 8(4) 269ndash284 httpsdoiorg10110814725961011078981
Yasamis-Speroni F Lee D-E and Arditi D (2012) Evaluating the quality performance of pavement contractors Journal of Construction Engineering and Management 138(10) 1114ndash1124 httpsdoiorg101061(ASCE)CO1943-78620000539
Yu I Kim K Jung Y and Chin S (2007) Comparable performance measurement system for construction companies Journal of Management in Engineering 23(3) 131ndash139 httpsdoiorg101061(ASCE)0742-597X(2007)233(131)
Befrin Neval Bingol and Gul Polat
164PENERBIT UNIVERSITI SAINS MALAYSIA
components and assign subcontractors to them based on their speciality areas In construction projects where large portions of the activities are outsourced numerous subcontractors are obliged to work together which in turn makes construction sites chaotic and complicated In such projects coordinating and controlling the works of these subcontractors is not an easy task for general contractors Since most of the construction activities are carried out by subcontractors and the success of the entire project which is mostly assessed in terms of time cost and quality is determined by their performances working with ineligible subcontractors may bring about failures such as delays cost overruns quality problems disputes etc Therefore general contractors should be very careful during the subcontractor selection process and select the right subcontractor for the right job to achieve business continuity in such a highly competitive market
In practice general contractors tend to select the subcontractor who offers the lowest bid price (Tserng and Lin 2002 Arslan et al 2008 Mbachu 2008 Hartmann Ling and Tan 2009) or is known from previous projects (Tserng and Lin 2002 Arslan et al 2008 Ulubeyli Manisali and Kazaz 2010 Choudhry et al 2012) However both practices may lead to severe problems in either meeting quality requirements or controlling the cost It is obvious that there is a need for a sound and systematic approach for measuringevaluating the performances of candidate subcontractors and selecting the most appropriate one in order to fulfil the contract requirements and ensure business continuity
General contractors may take into account several tangible and intangible criteria during the subcontractor evaluation and selection process While some of these criteria such as time and cost can be assessed easily as they can be numerically expressed the remaining criteria such as safety and quality performances of the candidate subcontractors cannot be easily assessed as they are highly subjective The quality of construction works is defined as to be fit for use as intended (Trinkūnienė et al 2017) and it is very difficult to estimate and evaluate the quality performance of a subcontractor at the beginning of a construction project Moreover even though subcontractors perform the large portions of the construction works general contractors are liable for the quality of the accomplished works (Enshassi et al 2008) Therefore there is a need for an approach which enables general contractors to measure the quality performances of the candidate subcontractors in an objective systematic and structured manner in order to improve the subcontractor selection process
The main objective of this study is to provide general contractors especially the ones who predominantly operate in international markets with a practical and user-friendly performance measurement framework which assists them in estimating quality performances of candidate subcontractors The proposed framework is based on the most commonly used KPIs The proposed framework also aims to enable general contractors (1) To predict the overall quality performance of the project (2) To achieve quality requirements specified in the contract and (3) To minimise risks resulting from quality problems
PrEVIouS STudIES on PErForMAnCE MEASurEMEnT And SuBConTrACTor SELECTIon In THE ConSTruCTIon InduSTrY
The construction sector is criticised by many researchers for its poor performance (Lee Cooper and Aouad 2000 Kagioglou Cooper and Aouad 2001) Performance
Quality Performances of Turkish Contractors
PENERBIT UNIVERSITI SAINS MALAYSIA165
measurement in the construction sector has scholarly attracted attention with the increasing complexity of construction projects and developments in construction management and technology (Lin and Shen 2007 Yang et al 2010) with studies often focusing on metrics of duration cost and quality objectives (Ward Curtis and Chapman 1991 Kagioglou Cooper and Aouad 2001) Recently new performance indicators such as customer satisfaction business performance safety and environment have gained importance (Yu et al 2007 Yang et al 2010) Performance measurement has been assessed in three levels project organisation and stakeholder
European Foundation for Quality Management (EFQM) balanced scorecard (BSC) model and key performance indicator (KPI) model are three of the most commonly used frameworks for performance measurement in the construction industry (Yang et al 2010) EFQM and BSC models are more suitable for strategic-level performance measurement and company-specific measurement KPI model however is more flexible and can be easily generalised and allows measuring performance at different levels In this study the KPI model is selected to construct a framework for measuring quality performances of subcontractor candidates at two different levels namely project and organisation
In construction management literature many studies focused on the subcontractor selection process Hatush and Skitmore (1997) identified a set of criteria to select eligible subcontractor and proposed a Delphic interview with a small group of construction professionals Mahdi et al (2002) proposed a multi-objective decision making technique for selecting appropriate contractors combining Delphi method with the analytic hierarchy process (AHP) Arslan et al (2008) used cost quality duration and qualification as the main selection criteria in their research which focused on the subcontractor selection problem El-Mashaleh (2009) proposed a data envelopment analysis model with 11 criterias for subcontractor selection Marzouk El Kherbawy and Khalifa (2013) identified 46 factors that can be used in the subcontractor selection process after conducting a questionnaire survey and carrying out statistical analysis to reveal the most significant factors in the selection process
There are also studies focusing on performance measurement in the construction industry Chan and Chan (2004) identified a set of subjective and objective selection criteria to measure project success based on expert opinions Time cost and quality were selected as the most important indicators Luu Kim and Huynh (2008) proposed a conceptual framework with nine main KPIs to improve project management performance of large contractors Their findings concluded that the benchmarking approach could help contractors to improve their performances Enshassi Mohamed and Abushaban (2009) identified indicators to measure the performance of the local projects by consulting important parties of construction projects which are owneremployer consultants and contractor groups A hybrid Delphi method was used by Yasamis-Seproni Lee and Arditi (2012) to determine the quality performance of contractors and an extensive literature review was conducted by Ali Al-Sulaihi and Al-Gahtani (2013) to identify KPIs to measure performances of construction companies at the organisational level in which the most critical KPIs were determined in accordance with relative importance index (RII) Ng and Skitmore (2014) developed a framework to appraise subcontractor using a BSC model and used a case to show the implementation of the proposed framework Their findings illustrated how the BSC model can help to increase the transparency of the subcontractor appraisal
Befrin Neval Bingol and Gul Polat
166PENERBIT UNIVERSITI SAINS MALAYSIA
METHodoLoGY
The methodology of this study has two phases (1) a pre-survey and (2) a survey stage (as shown in Figure 1)
Figure 1 Steps of the Proposed Methodology
Quality Performances of Turkish Contractors
PENERBIT UNIVERSITI SAINS MALAYSIA167
In the pre-survey stage firstly 12 KPIs which can be used to measure quality performance in construction projects were identified in the light of an extensive literature review (as shown in Table 1) Then a questionnaire survey among 40 large scale Turkish contractors most of which are members of TCA and predominantly act as general contractors was conducted to determine the relative importance of these KPIs According to the official figures issued by the Ministry of Labour and Social Security there are 494 large scale construction companies which employ more than 250 labourers in Turkey From these 494 companies 100 of them were selected using the purposive sampling method and were contacted Of the 100 mailed questionnaires 40 were returned duly filled out which corresponds to a response rate of 40 In the questionnaire the respondent companies were asked to rate the relative importance levels of 12 KPIs using typical five-level Likert scale where 1 represents the Least Importance and 5 represents the Highest Importance
Having collected the responses reliability (ie Cronbachs alpha) and ranking (ie RII) analyses were carried out in order to test the internal consistency of the scale used in questionnaire for measuring the perceptions of the respondents and to compute the relative importance of the KPIs respectively
Cronbachs alpha value was found to be 0939 which indicates that the internal consistency of the scale used is excellent (Field 2017) RII is calculated by dividing the arithmetic mean of the responses given for each KPI to the highest importance which is 5 in this study (Chen Okudan and Riley 2010) Based on the findings of the ranking analysis out of 12 KPIs six have High three have High-Medium and three have Medium RII As this study aims to construct an efficient and practical quality performance measurement framework three KPIs with Medium RII namely availability of quality assurance certificate and date of certificate (KPI2) subcontractors management ability of quality assurance and certificate programs (KPI3) and the establishment of quality assurance system and cost for managing it (KPI4) were eliminated The most important nine KPIs with High and High-Medium RIIs were used when constructing the quality performance measurement framework namely adequacy of quality assurance policy (Q1) application-level of the quality management system in projects (Q2) the audit of the quality management system in project level (Q3) construction quality (conformance to the specification) (Q4) the quality of workmanship (Q5) the cost of poor quality resulting from the low standard production (Q6) number of reworks (Q7) percentage of reworks () (Q8) and severity of defect at construction phase (Q9) The findings of the pre-survey phase were extensively reported in Bingol and Polat (2016)
In the survey stage the main objective was to calculate the group decision on the weights of the most important nine KPIs (Qs) used in the quality performance measurement framework on the subcontractor selection process In order to achieve this objective the AHP method was employed The target users of the proposed evaluation framework were the large scale Turkish general contractors who predominantly operate in international markets are listed in ENR Top 250 International Contractors list are the members of the TCA and had management system certificates (ie ISO 90012008 ISO 140012004 OHSAS 180012007) There are 27 Turkish contractors who fulfilled all these criteria Therefore the target population of this research was 27 and all of these companies were contacted Out of these 27 Turkish contractors 11 were accepted to contribute to the research Face-to-face interviews were conducted to construct pairwise comparison matrices The
Befrin Neval Bingol and Gul Polat
168PENERBIT UNIVERSITI SAINS MALAYSIA
individual judgements of these target users were aggregated to reach a group decision
Table 1 Identified KPIs and Their RIIs
KPI Q description references rII
KPI1 Q1 Adequacy of quality assurance policy
Enshassi Mohamed and Abushaban (2009) Yasamis-Speroni Lee and Arditi (2012)
H-M
KPI2 ndash Availability of quality assurance certificate and date of the certificate
Hatush and Skitmore (2010) M
KPI3 ndash Subcontractors management ability of quality assurance and certificate programs
Marzouk El Kherbawy and Khalifa (2013)
M
KPI4 ndash The establishment of a quality assurance system and cost for managing it
Luu Kim and Huynh (2008) M
KPI5 Q2 Application-level of the quality management system in projects
Luu Kim and Huynh (2008) H-M
KPI6 Q3 The audit of the quality management system in project level
Luu Kim and Huynh (2008) H-M
KPI7 Q4 Construction quality (conformance to the specification)
Mahdi et al (2002) Chan and Chan (2004) Luu Kim and Huynh (2008) Arslan et al (2008) El-Mashaleh (2009) Enshassi Mohamed and Abushaban (2009)
H
KPI8 Q5 The quality of workmanship Hatush and Skitmore (1997) Arslan et al (2008) El-Mashaleh (2009)
H
KPI9 Q6 The cost of poor quality resulting from the low standard production
Marzouk El Kherbawy and Khalifa (2013)
H
KPI10 Q7 Number of reworks Ali Al-Sulaihi and Al-Gahtani (2013)
H
KPI11 Q8 Percentage of reworks () Ng and Skitmore (2014) H
KPI12 Q9 The severity of defect at the construction phase
Enshassi Mohamed and Abushaban (2009)
H
Notes RII = L Low (RII lt 02) M-L Medium-Low (02 le RII lt 04) M Medium (04 le RII lt 06) H-M High-Medium (06 le RII lt 08) H High (RII ge 08) Source Chen Okudan and Riley (2010)
AHP was developed by Saaty (1980) It is a basic approach that deals with both the rational and the intuitive decisions to select the most appropriate option
Quality Performances of Turkish Contractors
PENERBIT UNIVERSITI SAINS MALAYSIA169
from several alternatives with respect to several criteria (Saaty and Vargas 2012) Fundamentally the AHP method is based on mathematics and psychology and is the application of an Eigenvalue approach to the pairwise comparisons (Vaidya and Kumar 2006) The simplest form of AHP is composed of a hierarchy consisting of three levels (1) The goal of the decision is at the top level (2) Criteria of the goal are in the second level and (3) Alternatives are located in the third level (Saaty and Vargas 2012)
The AHP methodology relies on pairwise comparison of either criteria or alternatives Decision-makers compare criteriaalternative using actual measurements or a fundamental scale to reflect the relative strength of their preferences and feelings In the pairwise comparison matrices the question of How many times the one criterionalternative is more important or dominant over the other criterionalternative with respect to the goalcriterion should be expressed on a scale of 1 to 9 (as shown in Table 2) (Saaty 2008)
Table 2 Saatys Rating Scale
Intensity of Importance Definition Explanation
1 Equal importance Two factors contribute equally to the objective
3 Somewhat more important
Experience and judgement slightly favour one over the other
5 Much more important
Experience and judgement strongly favour one over the other
7 Very much more important
Experience and judgement very strongly favour one over the other
9 Absolutely more important
The evidence favouring one over the other is one of the highest possible validity
2ndash4ndash6ndash8 Intermediate values When compromise is needed
Reciprocal of above nonzero numbers
If the activity i has one of the above nonzero numbers assigned to it when compared with activity j then j has the reciprocal value when compared to i
Source Saaty (2008)
The constructed pairwise comparison matrices are positive and reciprocal (ie a[ ]ij
1 a ji= ) (as shown in Equation 1)
1
1a
1a a
A
a a
a
a
a12
1 2
2a
n n
n
n
nm
11 12
22
1
=h h
g
g
g
g
h
R
T
SSSSSSSSSSSSS
V
X
WWWWWWWWWWWWW
(Eq 1)
Befrin Neval Bingol and Gul Polat
170PENERBIT UNIVERSITI SAINS MALAYSIA
Saaty (1980) proposed to check the inconsistency of judgements with a measure called the Consistency Index (CI) CI is calculated with the following Equation 2
1CI
nnmax= m
-
-^] g
h (Eq 2)
where maxm is the principal eigenvalue of the judgement matrix and n refers to the number of criteria in this matrix The consistencies of decision-makers evaluation are checked with the consistency ratio (CR) The following equation is used to determine this ratio (as shown in Equation 3)
1CI
nnmax= m
-
-^] g
h (Eq 3)
CR depends on both the CI and the random index The random index values determined based on different numbers are provided in Table 3
Table 3 Random Index
number of Items random Index number of Items random Index
1 0 6 124
2 0 7 132
3 058 8 141
4 090 9 145
5 141 10 149
Source Timor (2011)
The value of CR for comparison matrices should be less than 01 to provide consistency of the decision-maker If not the results of the pairwise comparison need to be re-evaluated to improve consistency
In most real-life decision-making problems decisions are made by several decision makers AHP is a convenient method to be used in group decision making There are two different approaches for combining individual judgements which include (1) aggregating individual judgements and (2) aggregating individual priorities (Escobar Aguaroacuten and Moreno-Jimeacutenez 2004) The weighted geometric mean and the row geometric mean methods are used for combining group decision (Escobar Aguaroacuten and Moreno-Jimeacutenez 2004) According to Saaty (2008) taking the geometric mean of individual judgements is the best way to convert individual preferences into a group decision Usage of 1 to 9 rating scale for individual judgements mainly result in preferring the geometric mean to reach a group decision (Timor 2011 Onder and Onder 2014)
When the individual judgements of the decision-makers are combined with the weighted geometric mean method the final priority is computed via Equation 4
ww ( )ijG
ijd
k 1
m k=
=
m^ h (Eq 4)
Quality Performances of Turkish Contractors
PENERBIT UNIVERSITI SAINS MALAYSIA171
where wijG represents group decision computed with the weighted geometric
mean m represent the number of decision-makers represents the decision matrix of the decision-maker and λk represents the weight of decision-maker
AnALYSIS And FIndInGS
Characteristics of the Interviewed Companies
Out of 27 Turkish contractors 11 accepted to participate in face-to-face interviews corresponding to a response rate of 4074 Interviews were conducted with 11 civil engineers who were in charge of subcontractor evaluation and selection process In these interviews seven questions were asked to reveal the general characteristics of the interviewed companies The findings of the general characteristics of the companies were summarised in Table 4
Table 4 Demographic Characteristics of 11 Contractors
demographic Characteristics N Valid
Experience in the industry 1 to 5 years ndash ndash
6 to 10 years ndash ndash
11 to 15 years ndash ndash
16 to 20 years 2 182
21 to 25 years 3 273
26 to 30 years ndash ndash
gt 30 years 6 545
Total 11 100
Membership of TCA Member 11 100
Not a Member 0 0
Total 11 100
Roles of respondent companies General contractor 11 100
Subcontractor 1 91
Partner of the consortium 1 91
Member of a joint venture 3 273
Consultant companies ndash ndash
Others ndash ndash
The markets that the respondent companies operate predominantly
National (Domestic) ndash ndash
International 8 727
Equally on national and international markets
3 273
(continued on next page)
Befrin Neval Bingol and Gul Polat
172PENERBIT UNIVERSITI SAINS MALAYSIA
demographic Characteristics N Valid
Expertise areas Commercial buildings 7 636
Industrial buildings 7 636
Residential buildings 5 455
Infrastructure and transportation structures
7 636
Others 2 182
Percentages of work capacity transferred to subcontractors
1 to 25 1 91
26 to 50 4 364
51 to 75 5 455
76 to 100 1 91
Total 11 100
Experience of the respondents in the interviewed companies
1 to 4 years 1 909
5 to 9 years 2 1818
10 to 14 years ndash ndash
15 to 19 years 2 1818
20 to 24 years 3 2727
25 to 29 years 2 1818
30 to 34 years ndash ndash
gt 34 years 1 909
Total 11 100
According to the data obtained in the interviews out of the 11 contractors 5454 have 16 to 20 years of experience in the sector while 2727 have six to 10 years and 1818 have one to five years of experience It is observed that 100 of the respondent companies are general contractors where 91 of them are subcontractors 273 of them are a member of joint ventures and 91 are consultant companies in the undertaken projects On the other hand among 11 companies eight (727) were operating only in international markets and three (273) were operating in both national and international markets Based on the responses received from the companies 636 of them are specialised in commercial buildings industrial buildings and infrastructure-transport structures while 455 of them are specialised in residential buildings and 182 of them are specialised in other types of projects Findings revealed that 455 of the companies sublet 51 to 75 of the total work capacity to the subcontractor companies 364 of them sublet 26 to 50 of the total work capacity 91 of them sublet 1 to 25 of the total work capacity and 76 to 100 of the work capacity to the subcontractor companies
Table 4 (continued)
Quality Performances of Turkish Contractors
PENERBIT UNIVERSITI SAINS MALAYSIA173
Group decision on the Weights of the Most Important KPIs (Qs)
Respondents are strategically competitors and the individual preferences of these 11 companies have been taken one by one and then were combined to reach a group decision for the proposed framework The AHP method was applied to determine the weights of the nine KPIs in the quality performance measurement framework In the interviews Saatys (2008) rating scale was used to calculate the relative importance of these nine KPIs
In this step first 11 pairwise comparison matrices were built to understand the individual judgements of each company the weights of nine KPIs in each company were calculated and the consistency index of each comparison matrix was checked (as shown in Table 5)
Then the individual matrices were aggregated using the weighted geometric mean method into a single matrix to reach a group decision (using Equation 4) and the consistency index of the aggregated pairwise comparison matrix was checked The aggregated individual priorities are presented in Table 6 and the aggregated weights of nine KPIs are shown in the last column of Table 5
According to the findings displayed in Table 5 Construction quality (conformance to the specification) (Q4) is the most effective indicator with the weight of 024009 in the developed framework This indicator is followed by The quality of workmanship (Q5) with the weight of 017890 Application-level of the quality management system in projects (Q2) with the weight of 011874 and The audit of the quality management system in project-level (Q3) with the weight of 009979 On the other hand the least effective indicator in the framework is Number of reworks (Q7) with the weight of 005634
development of the Quality Performance Measurement Framework
The proposed quality performance measurement framework consists of three steps which are (1) inputs (2) process and (3) output (as shown in Figure 2)
Figure 2 Framework for Measuring Quality Performance of Subcontractors
Befrin Neval Bingol and Gul Polat
174PENERBIT UNIVERSITI SAINS MALAYSIA
Tabl
e 5
Ind
ivid
ual P
riorit
ies o
f Nin
e KP
Is A
ccor
din
g to
the
11 T
urki
sh G
ener
al C
ontra
ctor
Com
pani
es
wGC
1w
GC
2w
GC
3w
GC
4w
GC
5w
GC
6w
GC
7w
GC
8w
GC
9w
GC10
wGC
11wQG
1
Q1
010
252
010
673
007
935
010
000
027
167
010
605
005
593
008
900
004
907
004
901
002
712
008
881
Q2
010
252
022
065
010
146
010
000
008
751
010
605
005
593
008
900
015
056
004
901
025
479
011
880
Q3
010
252
015
801
014
647
010
000
008
751
010
605
009
904
006
572
015
056
004
901
002
712
009
960
Q4
018
472
015
801
028
382
020
000
027
168
019
915
037
413
013
802
022
251
026
073
017
534
024
070
Q5
018
472
007
485
022
584
020
000
016
496
010
605
028
481
013
802
015
056
026
073
010
653
017
886
Q6
010
252
010
673
005
088
010
000
002
917
010
605
003
254
018
842
002
096
009
416
002
654
006
956
Q7
010
252
005
009
002
669
010
000
002
917
005
853
003
254
001
617
008
525
004
901
010
361
005
623
Q8
006
700
005
009
005
088
005
000
002
917
010
605
003
254
008
724
008
525
009
416
017
534
007
377
Q9
005
096
007
485
003
462
005
000
002
917
010
605
003
254
018
842
008
525
009
416
010
361
007
368
CR
000
890
001
700
001
290
000
000
000
110
000
370
000
900
001
850
000
770
000
090
000
600
Tabl
e 6
An
Agg
rega
ted
Pai
rwise
Com
paris
on M
atrix
of 1
1 Tu
rkish
Con
tract
ors
Q1
Q2
Q3
Q4
Q5
Q6
Q7
Q8
Q9
Q1
10
722
088
160
3537
049
071
3493
158
811
2535
122
11
Q2
138
511
122
110
4847
062
161
7152
204
331
6733
163
01
Q3
113
430
8189
10
4012
053
571
5121
180
81
3493
138
51
Q4
282
72
063
249
221
155
443
3114
389
713
076
301
42
Q5
203
811
6086
186
690
6433
12
5126
332
712
4922
235
04
Q6
074
110
583
066
130
302
039
81
122
110
9638
1
Q7
062
970
4894
055
310
2566
030
060
8189
10
7616
072
2
Q8
079
780
5976
074
110
3251
040
121
0375
131
31
106
5
Q9
081
890
6134
072
20
3318
042
551
138
510
9389
1
Quality Performances of Turkish Contractors
PENERBIT UNIVERSITI SAINS MALAYSIA175
Inputs of the framework include group decision on the weights of the most important KPIs (Qs) which are obtained from AHP calculations measurement scales for each KPI the direction of preference of each KPI (minimum is the most favourable or maximum is the most favourable) and the evaluations of all candidate subcontractors with respect to each KPI
Having determined the inputs values in the process step the performance scores (q) of all candidate subcontractors are calculated by normalising the evaluations concerning each KPI considering the direction of preference If the direction of preference is maximum the quantitative equivalence of the evaluation of a subcontractor candidate for any KPI is divided by the sum of the evaluations of all subcontractors to the KPI in question On the other hand if the direction of preference is minimum the reciprocals of the quantitative equivalences of the evaluations are normalised By this way the subcontractor candidate with the minimum value becomes more favourable
In the output step the overall quality performance index (QPI) of each subcontractor candidate can be calculated using Equation 5
QPI w q1
9
SC iG
iim m=
= (Eq 5)
Where QPISCm represents the overall QPI of the mth subcontractor wiG represents
the aggregated weight of the ith KPI (Qi) based on group decision and qim represents the performance score of the mth subcontractor candidate for the ith KPI (Qi)
An Illustrative Example of the Application of the Proposed Quality Performance Measurement Framework
An illustrative example has been presented to demonstrate how the proposed framework can be used by a Turkish general contractor who intends to evaluate the quality performances of the subcontractor candidates under consideration for an international construction project
In the illustrative example (as shown in Table 7) there are five subcontractor candidates First the general contractor determines the measurement scales for each KPI identifies the direction of preference of each KPI and evaluates all candidate subcontractors for each KPI based on the identified measurement scale The weights of the KPIs are obtained from the AHP calculations presented in the last column of Table 5 Second the general contractor calculates the performance scores (q) of all candidate subcontractors And finally the general contractor computes the overall QPI of all candidate subcontractors In the illustrative example the overall quality performance of the fourth subcontractor candidate (SC_4) is higher than the other candidates
Befrin Neval Bingol and Gul Polat
176PENERBIT UNIVERSITI SAINS MALAYSIA
Tabl
e 7
An
Illust
rativ
e Ex
ampl
e of
the
App
licat
ion
of th
e Pr
opos
ed F
ram
ewor
k
Q
Q D
efini
tion
Mea
sure
men
t Sc
ales
dire
ctio
n of
Pr
efer
ence
sW
eigh
tsEv
alua
tions
of S
ubco
ntra
ctor
Can
dida
tes
Qua
lity
Scor
es o
f Sub
cont
ract
or C
andi
date
s
SC_1
SC_2
SC_3
SC_4
SC_5
q_1
q_2
q_3
q_4
q_5
Q1
Ad
equa
cy o
f qu
ality
ass
uran
ce
polic
y
VBndash
VG
2M
ax
008
881
GV
GM
GV
G0
190
023
80
143
019
00
238
Q2
The
appl
icat
ion
leve
l of t
he q
ualit
y m
anag
emen
t sy
stem
in p
roje
cts
VBndash
VG
Max
0
1188
0G
MM
MG
023
50
176
017
60
176
023
5
Q3
The
aud
it of
th
e qu
ality
m
anag
emen
t sy
stem
in p
roje
ct
leve
l
VBndash
VG
Max
0
0996
0M
GG
VG
M0
158
021
10
211
026
30
158
Q4
Con
stru
ctio
n qu
ality
(c
onfo
rman
ce to
th
e sp
ecifi
catio
n)
VBndash
VG
Max
0
2407
0G
VG
GM
G0
200
025
00
200
015
00
200
Q5
The
qual
ity o
f w
orkm
ansh
ipV
BndashV
GM
ax
017
886
VG
MV
GG
M0
250
015
00
250
020
00
150
Q6
The
cost
of
poor
qua
lity
resu
lting
from
th
e lo
w st
and
ard
pr
oduc
tion
M
in
006
956
12
29
21
11
10
234
009
70
134
028
10
255
Q7
Num
ber o
f rew
orks
Num
ber
Min
0
0562
314
98
411
011
00
171
019
30
386
014
0
Q8
Perc
enta
ge o
f re
wor
ks (
)
Min
0
0737
73
24
44
11
83
30
190
013
80
149
033
80
185
Q9
The
seve
rity
of
def
ect a
t the
co
nstru
ctio
n ph
ase
VLndash
VH
3M
in
007
368
MH
MV
HH
024
40
183
024
40
146
018
3
QPI
020
80
190
019
70
213
019
3
Not
es V
B =
Ver
y Ba
d (1
) B
= Ba
d (2
) M
= M
ediu
m (3
) G
= G
ood
(4)
VG
= V
ery
Goo
d (5
) V
L =
Ver
y Lo
w (1
) L
= Lo
w (2
) M
= M
ediu
m (3
) H
= Hi
gh (4
) V
H =
Ver
y Hi
gh (5
)
Quality Performances of Turkish Contractors
PENERBIT UNIVERSITI SAINS MALAYSIA177
ConCLuSIon
Since most of the international construction projects are highly complex in nature they require the involvement of multiple subcontractors therefore the selection of the most appropriate subcontractor becomes crucial for the overall project success The subcontractor selection process is mostly affected by several compromising and conflicting tangible and intangible criteria While the criteria like cost and time can be numerically measured the criteria like safety and quality cannot be easily measured This study aimed to solve this issue by developing a framework for measuring the quality performances of subcontractor candidates more systematically and rationally way To use the proposed framework subcontractor candidates should be assessed based on the identified nine KPIs After these assessments the quality performance of the candidates can be determined using the proposed framework The measurement framework includes indicators that can be measured quantitatively and qualitatively
The limitations of this study are related to the developed framework relying on the individual preferences of the 11 Turkish companies that are also the target users This potential limitation can be overcome by increasing the sample size Moreover the performance of the proposed framework should be tested with real cases
rEFErEnCES
Ali HAEM Al-Sulaihi IA and Al-Gahtani KS (2013) Indicators for measuring performance of building construction companies in Kingdom of Saudi Arabia Journal of King Saud University ndash Engineering Sciences 25(2) 125ndash134 httpsdoiorg101016jjksues201203002
Arslan G Kivrak S Birgonul MT and Dikmen I (2008) Improving sub-contractor selection process in construction projects Web-based sub-contractor evaluation system (WEBSES) Automation in Construction 17(4) 480ndash488 httpsdoiorg101016jautcon200708004
Bingol BN and Polat G (2016) Measuring quality performances of subcontractors using key performance indicators (KPIs) model Paper presented at the 12th International Congress on Advances in Civil Engineering Istanbul Turkey 21ndash23 September
Chan APC and Chan APL (2004) Key performance indicators for measuring construction success Benchmarking An International Journal 11(2) 203ndash221 httpsdoiorg10110814635770410532624
Chen Y Okudan GE and Riley DR (2010) Sustainable performance criteria for construction method selection in concrete buildings Automation in Construction 19(2) 235ndash244 httpsdoiorg101016jautcon200910004
Choudhry RM Hinze JW Arshad M and Gabriel HF (2012) Subcontracting practices in the construction industry of Pakistan Journal of Construction Engineering and Management 138(12) 1353ndash1359 httpsdoiorg101061(ASCE)CO1943-78620000562
El-Mashaleh MS (2009) A construction subcontractor selection model Jordan Journal of Civil Engineering 3(4) 375ndash383
Enshassi A Choudhry RM Mayer PE and Shoman Y (2008) Safety performance of subcontractors in the Palestinian construction industry Journal of Construction in Developing Countries 13(1) 51ndash62
Befrin Neval Bingol and Gul Polat
178PENERBIT UNIVERSITI SAINS MALAYSIA
Enshassi A Mohamed S and Abushaban S (2009) Factors affecting the performance of construction projects in the Gaza strip Journal of Civil Engineering and Management 15(3) 269ndash280 httpsdoiorg1038461392-3730200915269-280
Escobar MT Aguaroacuten J and Moreno-Jimeacutenez JM (2004) A note on AHP group consistency for the row geometric mean priorization procedure European Journal of Operational Research 153(2) 318ndash322 httpsdoiorg101016S0377-2217(03)00154-1
Field A (2017) Discovering Statistics Using IBM SPSS Statistics North American Edition Thousand Oaks CA SAGE
Hartmann A Ling FYY and Tan JS (2009) Relative importance of subcontractor selection criteria Evidence from Singapore Journal of Construction Engineering and Management 135(9) 826ndash832 httpsdoiorg101061(ASCE)0733-9364(2009)1359(826)
Hatush Z and Skitmore M (1997) Criteria for contractor selection Construction Management and Economics 15(1) 19ndash38 httpsdoiorg101080014461997373088
Kagioglou M Cooper R and Aouad G (2001) Performance management in construction A conceptual framework Construction Management and Economics 19(1) 85ndash95 httpsdoiorg10108001446190010003425
Lee A Cooper R and Aouad G (2000) A methodology for designing performance measures for the UK construction industry Paper presented at the Bizarre Fruit 2000 Postgraduate Research Conference on the Built and Human Environment University of Salford Salford UK 9ndash10 March
Lin G and Shen Q (2007) Measuring the performance of value management studies in construction Critical review Journal of Management in Engineering 23(1) 2ndash9 httpsdoiorg101061(ASCE)0742-597X(2007)231(2)
Luu VT Kim S-Y and Huynh T-A (2008) Improving project management performance of large contractors using benchmarking approach International Journal of Project Management 26(7) 758ndash769 httpsdoiorg 101016jijproman200710002
Mahdi IM Riley MJ Fereig SM and Alex AP (2002) A multi-criteria approach to contractor selection Engineering Construction and Architectural Management 9(1) 29ndash37 httpsdoiorg101108eb021204
Marzouk MM El Kherbawy AA and Khalifa M (2013) Factors influencing sub-contractors selection in construction projects HBRC Journal 9(2) 150ndash158 httpsdoiorg101016jhbrcj201305001
Mbachu J (2008) Conceptual framework for the assessment of subcontractors eligibility and performance in the construction industry Construction Management and Economics 26(5) 471ndash484 httpsdoiorg10108001446190801918730
Ng ST and Skitmore M (2014) Developing a framework for subcontractor appraisal using a balanced scorecard Journal of Civil Engineering and Management 20(2) 149ndash158 httpsdoiorg103846139237302013802705
Onder G and Onder E (2014) AHS In E Oumlnder and BF Yildirim (eds) Ccedilok Kriterli Karar Verme Istanbul Dora Yayincilik 21ndash64
Saaty T (1980) The Analytic Process Planning Priority Setting Resources Allocation London McGraw-Hill
Quality Performances of Turkish Contractors
PENERBIT UNIVERSITI SAINS MALAYSIA179
Saaty TL (2008) Decision making with the analytic hierarchy process International Journal of Services Sciences 1(1) 83ndash98 httpsdoiorg101504IJSSCI2008017590
Saaty TL and Vargas LG (2012) Models Methods Concepts and Applications of the Analytic Hierarchy Process BerlinHeidelberg Springer Science and Business Media 175
Timor M (2011) Analitik Hiyerarsi Prosesi Istanbul Turkmen KitabeviTrinkūnienė E Podvezko V Zavadskas EK Jokšienė I Vinogradova I and
Trinkūnas V (2017) Evaluation of quality assurance in contractor contracts by multi-attribute decision-making methods Economic Research ndash Ekonomska Istraživanja 30(1) 1152ndash1180 httpsdoiorg1010801331677X20171325616
Tserng HP and Lin PH (2002) An accelerated subcontracting and procuring model for construction projects Automation in Construction 11(1) 105ndash125 httpsdoiorg101016S0926-5805(01)00056-5
Turkish Contractors Association (TCA) (2018) Turkish Contractors Association Sector Report Ankara TCA
Ulubeyli S Manisali E and Kazaz A (2010) Subcontractor selection practices in international construction projects Journal of Civil Engineering and Management 16(1) 47ndash56 httpsdoiorg103846jcem201004
Vaidya OS and Kumar S (2006) Analytic hierarchy process An overview of applications European Journal of Operational Research 169(1) 1ndash29 httpsdoiorg101016jejor200404028
Ward S Curtis B and Chapman C (1991) Objectives and performance in construction projects Construction Management and Economics 9(4) 343ndash353 httpsdoiorg10108001446199100000027
Yang H Yeung JF Chan AP Chiang Y and Chan DW (2010) A critical review of performance measurement in construction Journal of Facilities Management 8(4) 269ndash284 httpsdoiorg10110814725961011078981
Yasamis-Speroni F Lee D-E and Arditi D (2012) Evaluating the quality performance of pavement contractors Journal of Construction Engineering and Management 138(10) 1114ndash1124 httpsdoiorg101061(ASCE)CO1943-78620000539
Yu I Kim K Jung Y and Chin S (2007) Comparable performance measurement system for construction companies Journal of Management in Engineering 23(3) 131ndash139 httpsdoiorg101061(ASCE)0742-597X(2007)233(131)
Quality Performances of Turkish Contractors
PENERBIT UNIVERSITI SAINS MALAYSIA165
measurement in the construction sector has scholarly attracted attention with the increasing complexity of construction projects and developments in construction management and technology (Lin and Shen 2007 Yang et al 2010) with studies often focusing on metrics of duration cost and quality objectives (Ward Curtis and Chapman 1991 Kagioglou Cooper and Aouad 2001) Recently new performance indicators such as customer satisfaction business performance safety and environment have gained importance (Yu et al 2007 Yang et al 2010) Performance measurement has been assessed in three levels project organisation and stakeholder
European Foundation for Quality Management (EFQM) balanced scorecard (BSC) model and key performance indicator (KPI) model are three of the most commonly used frameworks for performance measurement in the construction industry (Yang et al 2010) EFQM and BSC models are more suitable for strategic-level performance measurement and company-specific measurement KPI model however is more flexible and can be easily generalised and allows measuring performance at different levels In this study the KPI model is selected to construct a framework for measuring quality performances of subcontractor candidates at two different levels namely project and organisation
In construction management literature many studies focused on the subcontractor selection process Hatush and Skitmore (1997) identified a set of criteria to select eligible subcontractor and proposed a Delphic interview with a small group of construction professionals Mahdi et al (2002) proposed a multi-objective decision making technique for selecting appropriate contractors combining Delphi method with the analytic hierarchy process (AHP) Arslan et al (2008) used cost quality duration and qualification as the main selection criteria in their research which focused on the subcontractor selection problem El-Mashaleh (2009) proposed a data envelopment analysis model with 11 criterias for subcontractor selection Marzouk El Kherbawy and Khalifa (2013) identified 46 factors that can be used in the subcontractor selection process after conducting a questionnaire survey and carrying out statistical analysis to reveal the most significant factors in the selection process
There are also studies focusing on performance measurement in the construction industry Chan and Chan (2004) identified a set of subjective and objective selection criteria to measure project success based on expert opinions Time cost and quality were selected as the most important indicators Luu Kim and Huynh (2008) proposed a conceptual framework with nine main KPIs to improve project management performance of large contractors Their findings concluded that the benchmarking approach could help contractors to improve their performances Enshassi Mohamed and Abushaban (2009) identified indicators to measure the performance of the local projects by consulting important parties of construction projects which are owneremployer consultants and contractor groups A hybrid Delphi method was used by Yasamis-Seproni Lee and Arditi (2012) to determine the quality performance of contractors and an extensive literature review was conducted by Ali Al-Sulaihi and Al-Gahtani (2013) to identify KPIs to measure performances of construction companies at the organisational level in which the most critical KPIs were determined in accordance with relative importance index (RII) Ng and Skitmore (2014) developed a framework to appraise subcontractor using a BSC model and used a case to show the implementation of the proposed framework Their findings illustrated how the BSC model can help to increase the transparency of the subcontractor appraisal
Befrin Neval Bingol and Gul Polat
166PENERBIT UNIVERSITI SAINS MALAYSIA
METHodoLoGY
The methodology of this study has two phases (1) a pre-survey and (2) a survey stage (as shown in Figure 1)
Figure 1 Steps of the Proposed Methodology
Quality Performances of Turkish Contractors
PENERBIT UNIVERSITI SAINS MALAYSIA167
In the pre-survey stage firstly 12 KPIs which can be used to measure quality performance in construction projects were identified in the light of an extensive literature review (as shown in Table 1) Then a questionnaire survey among 40 large scale Turkish contractors most of which are members of TCA and predominantly act as general contractors was conducted to determine the relative importance of these KPIs According to the official figures issued by the Ministry of Labour and Social Security there are 494 large scale construction companies which employ more than 250 labourers in Turkey From these 494 companies 100 of them were selected using the purposive sampling method and were contacted Of the 100 mailed questionnaires 40 were returned duly filled out which corresponds to a response rate of 40 In the questionnaire the respondent companies were asked to rate the relative importance levels of 12 KPIs using typical five-level Likert scale where 1 represents the Least Importance and 5 represents the Highest Importance
Having collected the responses reliability (ie Cronbachs alpha) and ranking (ie RII) analyses were carried out in order to test the internal consistency of the scale used in questionnaire for measuring the perceptions of the respondents and to compute the relative importance of the KPIs respectively
Cronbachs alpha value was found to be 0939 which indicates that the internal consistency of the scale used is excellent (Field 2017) RII is calculated by dividing the arithmetic mean of the responses given for each KPI to the highest importance which is 5 in this study (Chen Okudan and Riley 2010) Based on the findings of the ranking analysis out of 12 KPIs six have High three have High-Medium and three have Medium RII As this study aims to construct an efficient and practical quality performance measurement framework three KPIs with Medium RII namely availability of quality assurance certificate and date of certificate (KPI2) subcontractors management ability of quality assurance and certificate programs (KPI3) and the establishment of quality assurance system and cost for managing it (KPI4) were eliminated The most important nine KPIs with High and High-Medium RIIs were used when constructing the quality performance measurement framework namely adequacy of quality assurance policy (Q1) application-level of the quality management system in projects (Q2) the audit of the quality management system in project level (Q3) construction quality (conformance to the specification) (Q4) the quality of workmanship (Q5) the cost of poor quality resulting from the low standard production (Q6) number of reworks (Q7) percentage of reworks () (Q8) and severity of defect at construction phase (Q9) The findings of the pre-survey phase were extensively reported in Bingol and Polat (2016)
In the survey stage the main objective was to calculate the group decision on the weights of the most important nine KPIs (Qs) used in the quality performance measurement framework on the subcontractor selection process In order to achieve this objective the AHP method was employed The target users of the proposed evaluation framework were the large scale Turkish general contractors who predominantly operate in international markets are listed in ENR Top 250 International Contractors list are the members of the TCA and had management system certificates (ie ISO 90012008 ISO 140012004 OHSAS 180012007) There are 27 Turkish contractors who fulfilled all these criteria Therefore the target population of this research was 27 and all of these companies were contacted Out of these 27 Turkish contractors 11 were accepted to contribute to the research Face-to-face interviews were conducted to construct pairwise comparison matrices The
Befrin Neval Bingol and Gul Polat
168PENERBIT UNIVERSITI SAINS MALAYSIA
individual judgements of these target users were aggregated to reach a group decision
Table 1 Identified KPIs and Their RIIs
KPI Q description references rII
KPI1 Q1 Adequacy of quality assurance policy
Enshassi Mohamed and Abushaban (2009) Yasamis-Speroni Lee and Arditi (2012)
H-M
KPI2 ndash Availability of quality assurance certificate and date of the certificate
Hatush and Skitmore (2010) M
KPI3 ndash Subcontractors management ability of quality assurance and certificate programs
Marzouk El Kherbawy and Khalifa (2013)
M
KPI4 ndash The establishment of a quality assurance system and cost for managing it
Luu Kim and Huynh (2008) M
KPI5 Q2 Application-level of the quality management system in projects
Luu Kim and Huynh (2008) H-M
KPI6 Q3 The audit of the quality management system in project level
Luu Kim and Huynh (2008) H-M
KPI7 Q4 Construction quality (conformance to the specification)
Mahdi et al (2002) Chan and Chan (2004) Luu Kim and Huynh (2008) Arslan et al (2008) El-Mashaleh (2009) Enshassi Mohamed and Abushaban (2009)
H
KPI8 Q5 The quality of workmanship Hatush and Skitmore (1997) Arslan et al (2008) El-Mashaleh (2009)
H
KPI9 Q6 The cost of poor quality resulting from the low standard production
Marzouk El Kherbawy and Khalifa (2013)
H
KPI10 Q7 Number of reworks Ali Al-Sulaihi and Al-Gahtani (2013)
H
KPI11 Q8 Percentage of reworks () Ng and Skitmore (2014) H
KPI12 Q9 The severity of defect at the construction phase
Enshassi Mohamed and Abushaban (2009)
H
Notes RII = L Low (RII lt 02) M-L Medium-Low (02 le RII lt 04) M Medium (04 le RII lt 06) H-M High-Medium (06 le RII lt 08) H High (RII ge 08) Source Chen Okudan and Riley (2010)
AHP was developed by Saaty (1980) It is a basic approach that deals with both the rational and the intuitive decisions to select the most appropriate option
Quality Performances of Turkish Contractors
PENERBIT UNIVERSITI SAINS MALAYSIA169
from several alternatives with respect to several criteria (Saaty and Vargas 2012) Fundamentally the AHP method is based on mathematics and psychology and is the application of an Eigenvalue approach to the pairwise comparisons (Vaidya and Kumar 2006) The simplest form of AHP is composed of a hierarchy consisting of three levels (1) The goal of the decision is at the top level (2) Criteria of the goal are in the second level and (3) Alternatives are located in the third level (Saaty and Vargas 2012)
The AHP methodology relies on pairwise comparison of either criteria or alternatives Decision-makers compare criteriaalternative using actual measurements or a fundamental scale to reflect the relative strength of their preferences and feelings In the pairwise comparison matrices the question of How many times the one criterionalternative is more important or dominant over the other criterionalternative with respect to the goalcriterion should be expressed on a scale of 1 to 9 (as shown in Table 2) (Saaty 2008)
Table 2 Saatys Rating Scale
Intensity of Importance Definition Explanation
1 Equal importance Two factors contribute equally to the objective
3 Somewhat more important
Experience and judgement slightly favour one over the other
5 Much more important
Experience and judgement strongly favour one over the other
7 Very much more important
Experience and judgement very strongly favour one over the other
9 Absolutely more important
The evidence favouring one over the other is one of the highest possible validity
2ndash4ndash6ndash8 Intermediate values When compromise is needed
Reciprocal of above nonzero numbers
If the activity i has one of the above nonzero numbers assigned to it when compared with activity j then j has the reciprocal value when compared to i
Source Saaty (2008)
The constructed pairwise comparison matrices are positive and reciprocal (ie a[ ]ij
1 a ji= ) (as shown in Equation 1)
1
1a
1a a
A
a a
a
a
a12
1 2
2a
n n
n
n
nm
11 12
22
1
=h h
g
g
g
g
h
R
T
SSSSSSSSSSSSS
V
X
WWWWWWWWWWWWW
(Eq 1)
Befrin Neval Bingol and Gul Polat
170PENERBIT UNIVERSITI SAINS MALAYSIA
Saaty (1980) proposed to check the inconsistency of judgements with a measure called the Consistency Index (CI) CI is calculated with the following Equation 2
1CI
nnmax= m
-
-^] g
h (Eq 2)
where maxm is the principal eigenvalue of the judgement matrix and n refers to the number of criteria in this matrix The consistencies of decision-makers evaluation are checked with the consistency ratio (CR) The following equation is used to determine this ratio (as shown in Equation 3)
1CI
nnmax= m
-
-^] g
h (Eq 3)
CR depends on both the CI and the random index The random index values determined based on different numbers are provided in Table 3
Table 3 Random Index
number of Items random Index number of Items random Index
1 0 6 124
2 0 7 132
3 058 8 141
4 090 9 145
5 141 10 149
Source Timor (2011)
The value of CR for comparison matrices should be less than 01 to provide consistency of the decision-maker If not the results of the pairwise comparison need to be re-evaluated to improve consistency
In most real-life decision-making problems decisions are made by several decision makers AHP is a convenient method to be used in group decision making There are two different approaches for combining individual judgements which include (1) aggregating individual judgements and (2) aggregating individual priorities (Escobar Aguaroacuten and Moreno-Jimeacutenez 2004) The weighted geometric mean and the row geometric mean methods are used for combining group decision (Escobar Aguaroacuten and Moreno-Jimeacutenez 2004) According to Saaty (2008) taking the geometric mean of individual judgements is the best way to convert individual preferences into a group decision Usage of 1 to 9 rating scale for individual judgements mainly result in preferring the geometric mean to reach a group decision (Timor 2011 Onder and Onder 2014)
When the individual judgements of the decision-makers are combined with the weighted geometric mean method the final priority is computed via Equation 4
ww ( )ijG
ijd
k 1
m k=
=
m^ h (Eq 4)
Quality Performances of Turkish Contractors
PENERBIT UNIVERSITI SAINS MALAYSIA171
where wijG represents group decision computed with the weighted geometric
mean m represent the number of decision-makers represents the decision matrix of the decision-maker and λk represents the weight of decision-maker
AnALYSIS And FIndInGS
Characteristics of the Interviewed Companies
Out of 27 Turkish contractors 11 accepted to participate in face-to-face interviews corresponding to a response rate of 4074 Interviews were conducted with 11 civil engineers who were in charge of subcontractor evaluation and selection process In these interviews seven questions were asked to reveal the general characteristics of the interviewed companies The findings of the general characteristics of the companies were summarised in Table 4
Table 4 Demographic Characteristics of 11 Contractors
demographic Characteristics N Valid
Experience in the industry 1 to 5 years ndash ndash
6 to 10 years ndash ndash
11 to 15 years ndash ndash
16 to 20 years 2 182
21 to 25 years 3 273
26 to 30 years ndash ndash
gt 30 years 6 545
Total 11 100
Membership of TCA Member 11 100
Not a Member 0 0
Total 11 100
Roles of respondent companies General contractor 11 100
Subcontractor 1 91
Partner of the consortium 1 91
Member of a joint venture 3 273
Consultant companies ndash ndash
Others ndash ndash
The markets that the respondent companies operate predominantly
National (Domestic) ndash ndash
International 8 727
Equally on national and international markets
3 273
(continued on next page)
Befrin Neval Bingol and Gul Polat
172PENERBIT UNIVERSITI SAINS MALAYSIA
demographic Characteristics N Valid
Expertise areas Commercial buildings 7 636
Industrial buildings 7 636
Residential buildings 5 455
Infrastructure and transportation structures
7 636
Others 2 182
Percentages of work capacity transferred to subcontractors
1 to 25 1 91
26 to 50 4 364
51 to 75 5 455
76 to 100 1 91
Total 11 100
Experience of the respondents in the interviewed companies
1 to 4 years 1 909
5 to 9 years 2 1818
10 to 14 years ndash ndash
15 to 19 years 2 1818
20 to 24 years 3 2727
25 to 29 years 2 1818
30 to 34 years ndash ndash
gt 34 years 1 909
Total 11 100
According to the data obtained in the interviews out of the 11 contractors 5454 have 16 to 20 years of experience in the sector while 2727 have six to 10 years and 1818 have one to five years of experience It is observed that 100 of the respondent companies are general contractors where 91 of them are subcontractors 273 of them are a member of joint ventures and 91 are consultant companies in the undertaken projects On the other hand among 11 companies eight (727) were operating only in international markets and three (273) were operating in both national and international markets Based on the responses received from the companies 636 of them are specialised in commercial buildings industrial buildings and infrastructure-transport structures while 455 of them are specialised in residential buildings and 182 of them are specialised in other types of projects Findings revealed that 455 of the companies sublet 51 to 75 of the total work capacity to the subcontractor companies 364 of them sublet 26 to 50 of the total work capacity 91 of them sublet 1 to 25 of the total work capacity and 76 to 100 of the work capacity to the subcontractor companies
Table 4 (continued)
Quality Performances of Turkish Contractors
PENERBIT UNIVERSITI SAINS MALAYSIA173
Group decision on the Weights of the Most Important KPIs (Qs)
Respondents are strategically competitors and the individual preferences of these 11 companies have been taken one by one and then were combined to reach a group decision for the proposed framework The AHP method was applied to determine the weights of the nine KPIs in the quality performance measurement framework In the interviews Saatys (2008) rating scale was used to calculate the relative importance of these nine KPIs
In this step first 11 pairwise comparison matrices were built to understand the individual judgements of each company the weights of nine KPIs in each company were calculated and the consistency index of each comparison matrix was checked (as shown in Table 5)
Then the individual matrices were aggregated using the weighted geometric mean method into a single matrix to reach a group decision (using Equation 4) and the consistency index of the aggregated pairwise comparison matrix was checked The aggregated individual priorities are presented in Table 6 and the aggregated weights of nine KPIs are shown in the last column of Table 5
According to the findings displayed in Table 5 Construction quality (conformance to the specification) (Q4) is the most effective indicator with the weight of 024009 in the developed framework This indicator is followed by The quality of workmanship (Q5) with the weight of 017890 Application-level of the quality management system in projects (Q2) with the weight of 011874 and The audit of the quality management system in project-level (Q3) with the weight of 009979 On the other hand the least effective indicator in the framework is Number of reworks (Q7) with the weight of 005634
development of the Quality Performance Measurement Framework
The proposed quality performance measurement framework consists of three steps which are (1) inputs (2) process and (3) output (as shown in Figure 2)
Figure 2 Framework for Measuring Quality Performance of Subcontractors
Befrin Neval Bingol and Gul Polat
174PENERBIT UNIVERSITI SAINS MALAYSIA
Tabl
e 5
Ind
ivid
ual P
riorit
ies o
f Nin
e KP
Is A
ccor
din
g to
the
11 T
urki
sh G
ener
al C
ontra
ctor
Com
pani
es
wGC
1w
GC
2w
GC
3w
GC
4w
GC
5w
GC
6w
GC
7w
GC
8w
GC
9w
GC10
wGC
11wQG
1
Q1
010
252
010
673
007
935
010
000
027
167
010
605
005
593
008
900
004
907
004
901
002
712
008
881
Q2
010
252
022
065
010
146
010
000
008
751
010
605
005
593
008
900
015
056
004
901
025
479
011
880
Q3
010
252
015
801
014
647
010
000
008
751
010
605
009
904
006
572
015
056
004
901
002
712
009
960
Q4
018
472
015
801
028
382
020
000
027
168
019
915
037
413
013
802
022
251
026
073
017
534
024
070
Q5
018
472
007
485
022
584
020
000
016
496
010
605
028
481
013
802
015
056
026
073
010
653
017
886
Q6
010
252
010
673
005
088
010
000
002
917
010
605
003
254
018
842
002
096
009
416
002
654
006
956
Q7
010
252
005
009
002
669
010
000
002
917
005
853
003
254
001
617
008
525
004
901
010
361
005
623
Q8
006
700
005
009
005
088
005
000
002
917
010
605
003
254
008
724
008
525
009
416
017
534
007
377
Q9
005
096
007
485
003
462
005
000
002
917
010
605
003
254
018
842
008
525
009
416
010
361
007
368
CR
000
890
001
700
001
290
000
000
000
110
000
370
000
900
001
850
000
770
000
090
000
600
Tabl
e 6
An
Agg
rega
ted
Pai
rwise
Com
paris
on M
atrix
of 1
1 Tu
rkish
Con
tract
ors
Q1
Q2
Q3
Q4
Q5
Q6
Q7
Q8
Q9
Q1
10
722
088
160
3537
049
071
3493
158
811
2535
122
11
Q2
138
511
122
110
4847
062
161
7152
204
331
6733
163
01
Q3
113
430
8189
10
4012
053
571
5121
180
81
3493
138
51
Q4
282
72
063
249
221
155
443
3114
389
713
076
301
42
Q5
203
811
6086
186
690
6433
12
5126
332
712
4922
235
04
Q6
074
110
583
066
130
302
039
81
122
110
9638
1
Q7
062
970
4894
055
310
2566
030
060
8189
10
7616
072
2
Q8
079
780
5976
074
110
3251
040
121
0375
131
31
106
5
Q9
081
890
6134
072
20
3318
042
551
138
510
9389
1
Quality Performances of Turkish Contractors
PENERBIT UNIVERSITI SAINS MALAYSIA175
Inputs of the framework include group decision on the weights of the most important KPIs (Qs) which are obtained from AHP calculations measurement scales for each KPI the direction of preference of each KPI (minimum is the most favourable or maximum is the most favourable) and the evaluations of all candidate subcontractors with respect to each KPI
Having determined the inputs values in the process step the performance scores (q) of all candidate subcontractors are calculated by normalising the evaluations concerning each KPI considering the direction of preference If the direction of preference is maximum the quantitative equivalence of the evaluation of a subcontractor candidate for any KPI is divided by the sum of the evaluations of all subcontractors to the KPI in question On the other hand if the direction of preference is minimum the reciprocals of the quantitative equivalences of the evaluations are normalised By this way the subcontractor candidate with the minimum value becomes more favourable
In the output step the overall quality performance index (QPI) of each subcontractor candidate can be calculated using Equation 5
QPI w q1
9
SC iG
iim m=
= (Eq 5)
Where QPISCm represents the overall QPI of the mth subcontractor wiG represents
the aggregated weight of the ith KPI (Qi) based on group decision and qim represents the performance score of the mth subcontractor candidate for the ith KPI (Qi)
An Illustrative Example of the Application of the Proposed Quality Performance Measurement Framework
An illustrative example has been presented to demonstrate how the proposed framework can be used by a Turkish general contractor who intends to evaluate the quality performances of the subcontractor candidates under consideration for an international construction project
In the illustrative example (as shown in Table 7) there are five subcontractor candidates First the general contractor determines the measurement scales for each KPI identifies the direction of preference of each KPI and evaluates all candidate subcontractors for each KPI based on the identified measurement scale The weights of the KPIs are obtained from the AHP calculations presented in the last column of Table 5 Second the general contractor calculates the performance scores (q) of all candidate subcontractors And finally the general contractor computes the overall QPI of all candidate subcontractors In the illustrative example the overall quality performance of the fourth subcontractor candidate (SC_4) is higher than the other candidates
Befrin Neval Bingol and Gul Polat
176PENERBIT UNIVERSITI SAINS MALAYSIA
Tabl
e 7
An
Illust
rativ
e Ex
ampl
e of
the
App
licat
ion
of th
e Pr
opos
ed F
ram
ewor
k
Q
Q D
efini
tion
Mea
sure
men
t Sc
ales
dire
ctio
n of
Pr
efer
ence
sW
eigh
tsEv
alua
tions
of S
ubco
ntra
ctor
Can
dida
tes
Qua
lity
Scor
es o
f Sub
cont
ract
or C
andi
date
s
SC_1
SC_2
SC_3
SC_4
SC_5
q_1
q_2
q_3
q_4
q_5
Q1
Ad
equa
cy o
f qu
ality
ass
uran
ce
polic
y
VBndash
VG
2M
ax
008
881
GV
GM
GV
G0
190
023
80
143
019
00
238
Q2
The
appl
icat
ion
leve
l of t
he q
ualit
y m
anag
emen
t sy
stem
in p
roje
cts
VBndash
VG
Max
0
1188
0G
MM
MG
023
50
176
017
60
176
023
5
Q3
The
aud
it of
th
e qu
ality
m
anag
emen
t sy
stem
in p
roje
ct
leve
l
VBndash
VG
Max
0
0996
0M
GG
VG
M0
158
021
10
211
026
30
158
Q4
Con
stru
ctio
n qu
ality
(c
onfo
rman
ce to
th
e sp
ecifi
catio
n)
VBndash
VG
Max
0
2407
0G
VG
GM
G0
200
025
00
200
015
00
200
Q5
The
qual
ity o
f w
orkm
ansh
ipV
BndashV
GM
ax
017
886
VG
MV
GG
M0
250
015
00
250
020
00
150
Q6
The
cost
of
poor
qua
lity
resu
lting
from
th
e lo
w st
and
ard
pr
oduc
tion
M
in
006
956
12
29
21
11
10
234
009
70
134
028
10
255
Q7
Num
ber o
f rew
orks
Num
ber
Min
0
0562
314
98
411
011
00
171
019
30
386
014
0
Q8
Perc
enta
ge o
f re
wor
ks (
)
Min
0
0737
73
24
44
11
83
30
190
013
80
149
033
80
185
Q9
The
seve
rity
of
def
ect a
t the
co
nstru
ctio
n ph
ase
VLndash
VH
3M
in
007
368
MH
MV
HH
024
40
183
024
40
146
018
3
QPI
020
80
190
019
70
213
019
3
Not
es V
B =
Ver
y Ba
d (1
) B
= Ba
d (2
) M
= M
ediu
m (3
) G
= G
ood
(4)
VG
= V
ery
Goo
d (5
) V
L =
Ver
y Lo
w (1
) L
= Lo
w (2
) M
= M
ediu
m (3
) H
= Hi
gh (4
) V
H =
Ver
y Hi
gh (5
)
Quality Performances of Turkish Contractors
PENERBIT UNIVERSITI SAINS MALAYSIA177
ConCLuSIon
Since most of the international construction projects are highly complex in nature they require the involvement of multiple subcontractors therefore the selection of the most appropriate subcontractor becomes crucial for the overall project success The subcontractor selection process is mostly affected by several compromising and conflicting tangible and intangible criteria While the criteria like cost and time can be numerically measured the criteria like safety and quality cannot be easily measured This study aimed to solve this issue by developing a framework for measuring the quality performances of subcontractor candidates more systematically and rationally way To use the proposed framework subcontractor candidates should be assessed based on the identified nine KPIs After these assessments the quality performance of the candidates can be determined using the proposed framework The measurement framework includes indicators that can be measured quantitatively and qualitatively
The limitations of this study are related to the developed framework relying on the individual preferences of the 11 Turkish companies that are also the target users This potential limitation can be overcome by increasing the sample size Moreover the performance of the proposed framework should be tested with real cases
rEFErEnCES
Ali HAEM Al-Sulaihi IA and Al-Gahtani KS (2013) Indicators for measuring performance of building construction companies in Kingdom of Saudi Arabia Journal of King Saud University ndash Engineering Sciences 25(2) 125ndash134 httpsdoiorg101016jjksues201203002
Arslan G Kivrak S Birgonul MT and Dikmen I (2008) Improving sub-contractor selection process in construction projects Web-based sub-contractor evaluation system (WEBSES) Automation in Construction 17(4) 480ndash488 httpsdoiorg101016jautcon200708004
Bingol BN and Polat G (2016) Measuring quality performances of subcontractors using key performance indicators (KPIs) model Paper presented at the 12th International Congress on Advances in Civil Engineering Istanbul Turkey 21ndash23 September
Chan APC and Chan APL (2004) Key performance indicators for measuring construction success Benchmarking An International Journal 11(2) 203ndash221 httpsdoiorg10110814635770410532624
Chen Y Okudan GE and Riley DR (2010) Sustainable performance criteria for construction method selection in concrete buildings Automation in Construction 19(2) 235ndash244 httpsdoiorg101016jautcon200910004
Choudhry RM Hinze JW Arshad M and Gabriel HF (2012) Subcontracting practices in the construction industry of Pakistan Journal of Construction Engineering and Management 138(12) 1353ndash1359 httpsdoiorg101061(ASCE)CO1943-78620000562
El-Mashaleh MS (2009) A construction subcontractor selection model Jordan Journal of Civil Engineering 3(4) 375ndash383
Enshassi A Choudhry RM Mayer PE and Shoman Y (2008) Safety performance of subcontractors in the Palestinian construction industry Journal of Construction in Developing Countries 13(1) 51ndash62
Befrin Neval Bingol and Gul Polat
178PENERBIT UNIVERSITI SAINS MALAYSIA
Enshassi A Mohamed S and Abushaban S (2009) Factors affecting the performance of construction projects in the Gaza strip Journal of Civil Engineering and Management 15(3) 269ndash280 httpsdoiorg1038461392-3730200915269-280
Escobar MT Aguaroacuten J and Moreno-Jimeacutenez JM (2004) A note on AHP group consistency for the row geometric mean priorization procedure European Journal of Operational Research 153(2) 318ndash322 httpsdoiorg101016S0377-2217(03)00154-1
Field A (2017) Discovering Statistics Using IBM SPSS Statistics North American Edition Thousand Oaks CA SAGE
Hartmann A Ling FYY and Tan JS (2009) Relative importance of subcontractor selection criteria Evidence from Singapore Journal of Construction Engineering and Management 135(9) 826ndash832 httpsdoiorg101061(ASCE)0733-9364(2009)1359(826)
Hatush Z and Skitmore M (1997) Criteria for contractor selection Construction Management and Economics 15(1) 19ndash38 httpsdoiorg101080014461997373088
Kagioglou M Cooper R and Aouad G (2001) Performance management in construction A conceptual framework Construction Management and Economics 19(1) 85ndash95 httpsdoiorg10108001446190010003425
Lee A Cooper R and Aouad G (2000) A methodology for designing performance measures for the UK construction industry Paper presented at the Bizarre Fruit 2000 Postgraduate Research Conference on the Built and Human Environment University of Salford Salford UK 9ndash10 March
Lin G and Shen Q (2007) Measuring the performance of value management studies in construction Critical review Journal of Management in Engineering 23(1) 2ndash9 httpsdoiorg101061(ASCE)0742-597X(2007)231(2)
Luu VT Kim S-Y and Huynh T-A (2008) Improving project management performance of large contractors using benchmarking approach International Journal of Project Management 26(7) 758ndash769 httpsdoiorg 101016jijproman200710002
Mahdi IM Riley MJ Fereig SM and Alex AP (2002) A multi-criteria approach to contractor selection Engineering Construction and Architectural Management 9(1) 29ndash37 httpsdoiorg101108eb021204
Marzouk MM El Kherbawy AA and Khalifa M (2013) Factors influencing sub-contractors selection in construction projects HBRC Journal 9(2) 150ndash158 httpsdoiorg101016jhbrcj201305001
Mbachu J (2008) Conceptual framework for the assessment of subcontractors eligibility and performance in the construction industry Construction Management and Economics 26(5) 471ndash484 httpsdoiorg10108001446190801918730
Ng ST and Skitmore M (2014) Developing a framework for subcontractor appraisal using a balanced scorecard Journal of Civil Engineering and Management 20(2) 149ndash158 httpsdoiorg103846139237302013802705
Onder G and Onder E (2014) AHS In E Oumlnder and BF Yildirim (eds) Ccedilok Kriterli Karar Verme Istanbul Dora Yayincilik 21ndash64
Saaty T (1980) The Analytic Process Planning Priority Setting Resources Allocation London McGraw-Hill
Quality Performances of Turkish Contractors
PENERBIT UNIVERSITI SAINS MALAYSIA179
Saaty TL (2008) Decision making with the analytic hierarchy process International Journal of Services Sciences 1(1) 83ndash98 httpsdoiorg101504IJSSCI2008017590
Saaty TL and Vargas LG (2012) Models Methods Concepts and Applications of the Analytic Hierarchy Process BerlinHeidelberg Springer Science and Business Media 175
Timor M (2011) Analitik Hiyerarsi Prosesi Istanbul Turkmen KitabeviTrinkūnienė E Podvezko V Zavadskas EK Jokšienė I Vinogradova I and
Trinkūnas V (2017) Evaluation of quality assurance in contractor contracts by multi-attribute decision-making methods Economic Research ndash Ekonomska Istraživanja 30(1) 1152ndash1180 httpsdoiorg1010801331677X20171325616
Tserng HP and Lin PH (2002) An accelerated subcontracting and procuring model for construction projects Automation in Construction 11(1) 105ndash125 httpsdoiorg101016S0926-5805(01)00056-5
Turkish Contractors Association (TCA) (2018) Turkish Contractors Association Sector Report Ankara TCA
Ulubeyli S Manisali E and Kazaz A (2010) Subcontractor selection practices in international construction projects Journal of Civil Engineering and Management 16(1) 47ndash56 httpsdoiorg103846jcem201004
Vaidya OS and Kumar S (2006) Analytic hierarchy process An overview of applications European Journal of Operational Research 169(1) 1ndash29 httpsdoiorg101016jejor200404028
Ward S Curtis B and Chapman C (1991) Objectives and performance in construction projects Construction Management and Economics 9(4) 343ndash353 httpsdoiorg10108001446199100000027
Yang H Yeung JF Chan AP Chiang Y and Chan DW (2010) A critical review of performance measurement in construction Journal of Facilities Management 8(4) 269ndash284 httpsdoiorg10110814725961011078981
Yasamis-Speroni F Lee D-E and Arditi D (2012) Evaluating the quality performance of pavement contractors Journal of Construction Engineering and Management 138(10) 1114ndash1124 httpsdoiorg101061(ASCE)CO1943-78620000539
Yu I Kim K Jung Y and Chin S (2007) Comparable performance measurement system for construction companies Journal of Management in Engineering 23(3) 131ndash139 httpsdoiorg101061(ASCE)0742-597X(2007)233(131)
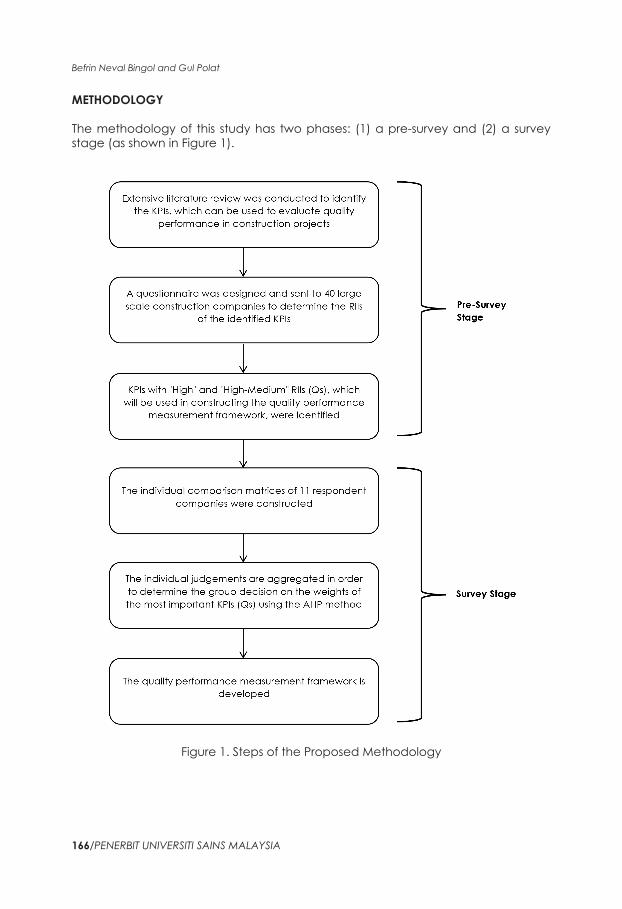
Befrin Neval Bingol and Gul Polat
166PENERBIT UNIVERSITI SAINS MALAYSIA
METHodoLoGY
The methodology of this study has two phases (1) a pre-survey and (2) a survey stage (as shown in Figure 1)
Figure 1 Steps of the Proposed Methodology
Quality Performances of Turkish Contractors
PENERBIT UNIVERSITI SAINS MALAYSIA167
In the pre-survey stage firstly 12 KPIs which can be used to measure quality performance in construction projects were identified in the light of an extensive literature review (as shown in Table 1) Then a questionnaire survey among 40 large scale Turkish contractors most of which are members of TCA and predominantly act as general contractors was conducted to determine the relative importance of these KPIs According to the official figures issued by the Ministry of Labour and Social Security there are 494 large scale construction companies which employ more than 250 labourers in Turkey From these 494 companies 100 of them were selected using the purposive sampling method and were contacted Of the 100 mailed questionnaires 40 were returned duly filled out which corresponds to a response rate of 40 In the questionnaire the respondent companies were asked to rate the relative importance levels of 12 KPIs using typical five-level Likert scale where 1 represents the Least Importance and 5 represents the Highest Importance
Having collected the responses reliability (ie Cronbachs alpha) and ranking (ie RII) analyses were carried out in order to test the internal consistency of the scale used in questionnaire for measuring the perceptions of the respondents and to compute the relative importance of the KPIs respectively
Cronbachs alpha value was found to be 0939 which indicates that the internal consistency of the scale used is excellent (Field 2017) RII is calculated by dividing the arithmetic mean of the responses given for each KPI to the highest importance which is 5 in this study (Chen Okudan and Riley 2010) Based on the findings of the ranking analysis out of 12 KPIs six have High three have High-Medium and three have Medium RII As this study aims to construct an efficient and practical quality performance measurement framework three KPIs with Medium RII namely availability of quality assurance certificate and date of certificate (KPI2) subcontractors management ability of quality assurance and certificate programs (KPI3) and the establishment of quality assurance system and cost for managing it (KPI4) were eliminated The most important nine KPIs with High and High-Medium RIIs were used when constructing the quality performance measurement framework namely adequacy of quality assurance policy (Q1) application-level of the quality management system in projects (Q2) the audit of the quality management system in project level (Q3) construction quality (conformance to the specification) (Q4) the quality of workmanship (Q5) the cost of poor quality resulting from the low standard production (Q6) number of reworks (Q7) percentage of reworks () (Q8) and severity of defect at construction phase (Q9) The findings of the pre-survey phase were extensively reported in Bingol and Polat (2016)
In the survey stage the main objective was to calculate the group decision on the weights of the most important nine KPIs (Qs) used in the quality performance measurement framework on the subcontractor selection process In order to achieve this objective the AHP method was employed The target users of the proposed evaluation framework were the large scale Turkish general contractors who predominantly operate in international markets are listed in ENR Top 250 International Contractors list are the members of the TCA and had management system certificates (ie ISO 90012008 ISO 140012004 OHSAS 180012007) There are 27 Turkish contractors who fulfilled all these criteria Therefore the target population of this research was 27 and all of these companies were contacted Out of these 27 Turkish contractors 11 were accepted to contribute to the research Face-to-face interviews were conducted to construct pairwise comparison matrices The
Befrin Neval Bingol and Gul Polat
168PENERBIT UNIVERSITI SAINS MALAYSIA
individual judgements of these target users were aggregated to reach a group decision
Table 1 Identified KPIs and Their RIIs
KPI Q description references rII
KPI1 Q1 Adequacy of quality assurance policy
Enshassi Mohamed and Abushaban (2009) Yasamis-Speroni Lee and Arditi (2012)
H-M
KPI2 ndash Availability of quality assurance certificate and date of the certificate
Hatush and Skitmore (2010) M
KPI3 ndash Subcontractors management ability of quality assurance and certificate programs
Marzouk El Kherbawy and Khalifa (2013)
M
KPI4 ndash The establishment of a quality assurance system and cost for managing it
Luu Kim and Huynh (2008) M
KPI5 Q2 Application-level of the quality management system in projects
Luu Kim and Huynh (2008) H-M
KPI6 Q3 The audit of the quality management system in project level
Luu Kim and Huynh (2008) H-M
KPI7 Q4 Construction quality (conformance to the specification)
Mahdi et al (2002) Chan and Chan (2004) Luu Kim and Huynh (2008) Arslan et al (2008) El-Mashaleh (2009) Enshassi Mohamed and Abushaban (2009)
H
KPI8 Q5 The quality of workmanship Hatush and Skitmore (1997) Arslan et al (2008) El-Mashaleh (2009)
H
KPI9 Q6 The cost of poor quality resulting from the low standard production
Marzouk El Kherbawy and Khalifa (2013)
H
KPI10 Q7 Number of reworks Ali Al-Sulaihi and Al-Gahtani (2013)
H
KPI11 Q8 Percentage of reworks () Ng and Skitmore (2014) H
KPI12 Q9 The severity of defect at the construction phase
Enshassi Mohamed and Abushaban (2009)
H
Notes RII = L Low (RII lt 02) M-L Medium-Low (02 le RII lt 04) M Medium (04 le RII lt 06) H-M High-Medium (06 le RII lt 08) H High (RII ge 08) Source Chen Okudan and Riley (2010)
AHP was developed by Saaty (1980) It is a basic approach that deals with both the rational and the intuitive decisions to select the most appropriate option
Quality Performances of Turkish Contractors
PENERBIT UNIVERSITI SAINS MALAYSIA169
from several alternatives with respect to several criteria (Saaty and Vargas 2012) Fundamentally the AHP method is based on mathematics and psychology and is the application of an Eigenvalue approach to the pairwise comparisons (Vaidya and Kumar 2006) The simplest form of AHP is composed of a hierarchy consisting of three levels (1) The goal of the decision is at the top level (2) Criteria of the goal are in the second level and (3) Alternatives are located in the third level (Saaty and Vargas 2012)
The AHP methodology relies on pairwise comparison of either criteria or alternatives Decision-makers compare criteriaalternative using actual measurements or a fundamental scale to reflect the relative strength of their preferences and feelings In the pairwise comparison matrices the question of How many times the one criterionalternative is more important or dominant over the other criterionalternative with respect to the goalcriterion should be expressed on a scale of 1 to 9 (as shown in Table 2) (Saaty 2008)
Table 2 Saatys Rating Scale
Intensity of Importance Definition Explanation
1 Equal importance Two factors contribute equally to the objective
3 Somewhat more important
Experience and judgement slightly favour one over the other
5 Much more important
Experience and judgement strongly favour one over the other
7 Very much more important
Experience and judgement very strongly favour one over the other
9 Absolutely more important
The evidence favouring one over the other is one of the highest possible validity
2ndash4ndash6ndash8 Intermediate values When compromise is needed
Reciprocal of above nonzero numbers
If the activity i has one of the above nonzero numbers assigned to it when compared with activity j then j has the reciprocal value when compared to i
Source Saaty (2008)
The constructed pairwise comparison matrices are positive and reciprocal (ie a[ ]ij
1 a ji= ) (as shown in Equation 1)
1
1a
1a a
A
a a
a
a
a12
1 2
2a
n n
n
n
nm
11 12
22
1
=h h
g
g
g
g
h
R
T
SSSSSSSSSSSSS
V
X
WWWWWWWWWWWWW
(Eq 1)
Befrin Neval Bingol and Gul Polat
170PENERBIT UNIVERSITI SAINS MALAYSIA
Saaty (1980) proposed to check the inconsistency of judgements with a measure called the Consistency Index (CI) CI is calculated with the following Equation 2
1CI
nnmax= m
-
-^] g
h (Eq 2)
where maxm is the principal eigenvalue of the judgement matrix and n refers to the number of criteria in this matrix The consistencies of decision-makers evaluation are checked with the consistency ratio (CR) The following equation is used to determine this ratio (as shown in Equation 3)
1CI
nnmax= m
-
-^] g
h (Eq 3)
CR depends on both the CI and the random index The random index values determined based on different numbers are provided in Table 3
Table 3 Random Index
number of Items random Index number of Items random Index
1 0 6 124
2 0 7 132
3 058 8 141
4 090 9 145
5 141 10 149
Source Timor (2011)
The value of CR for comparison matrices should be less than 01 to provide consistency of the decision-maker If not the results of the pairwise comparison need to be re-evaluated to improve consistency
In most real-life decision-making problems decisions are made by several decision makers AHP is a convenient method to be used in group decision making There are two different approaches for combining individual judgements which include (1) aggregating individual judgements and (2) aggregating individual priorities (Escobar Aguaroacuten and Moreno-Jimeacutenez 2004) The weighted geometric mean and the row geometric mean methods are used for combining group decision (Escobar Aguaroacuten and Moreno-Jimeacutenez 2004) According to Saaty (2008) taking the geometric mean of individual judgements is the best way to convert individual preferences into a group decision Usage of 1 to 9 rating scale for individual judgements mainly result in preferring the geometric mean to reach a group decision (Timor 2011 Onder and Onder 2014)
When the individual judgements of the decision-makers are combined with the weighted geometric mean method the final priority is computed via Equation 4
ww ( )ijG
ijd
k 1
m k=
=
m^ h (Eq 4)
Quality Performances of Turkish Contractors
PENERBIT UNIVERSITI SAINS MALAYSIA171
where wijG represents group decision computed with the weighted geometric
mean m represent the number of decision-makers represents the decision matrix of the decision-maker and λk represents the weight of decision-maker
AnALYSIS And FIndInGS
Characteristics of the Interviewed Companies
Out of 27 Turkish contractors 11 accepted to participate in face-to-face interviews corresponding to a response rate of 4074 Interviews were conducted with 11 civil engineers who were in charge of subcontractor evaluation and selection process In these interviews seven questions were asked to reveal the general characteristics of the interviewed companies The findings of the general characteristics of the companies were summarised in Table 4
Table 4 Demographic Characteristics of 11 Contractors
demographic Characteristics N Valid
Experience in the industry 1 to 5 years ndash ndash
6 to 10 years ndash ndash
11 to 15 years ndash ndash
16 to 20 years 2 182
21 to 25 years 3 273
26 to 30 years ndash ndash
gt 30 years 6 545
Total 11 100
Membership of TCA Member 11 100
Not a Member 0 0
Total 11 100
Roles of respondent companies General contractor 11 100
Subcontractor 1 91
Partner of the consortium 1 91
Member of a joint venture 3 273
Consultant companies ndash ndash
Others ndash ndash
The markets that the respondent companies operate predominantly
National (Domestic) ndash ndash
International 8 727
Equally on national and international markets
3 273
(continued on next page)
Befrin Neval Bingol and Gul Polat
172PENERBIT UNIVERSITI SAINS MALAYSIA
demographic Characteristics N Valid
Expertise areas Commercial buildings 7 636
Industrial buildings 7 636
Residential buildings 5 455
Infrastructure and transportation structures
7 636
Others 2 182
Percentages of work capacity transferred to subcontractors
1 to 25 1 91
26 to 50 4 364
51 to 75 5 455
76 to 100 1 91
Total 11 100
Experience of the respondents in the interviewed companies
1 to 4 years 1 909
5 to 9 years 2 1818
10 to 14 years ndash ndash
15 to 19 years 2 1818
20 to 24 years 3 2727
25 to 29 years 2 1818
30 to 34 years ndash ndash
gt 34 years 1 909
Total 11 100
According to the data obtained in the interviews out of the 11 contractors 5454 have 16 to 20 years of experience in the sector while 2727 have six to 10 years and 1818 have one to five years of experience It is observed that 100 of the respondent companies are general contractors where 91 of them are subcontractors 273 of them are a member of joint ventures and 91 are consultant companies in the undertaken projects On the other hand among 11 companies eight (727) were operating only in international markets and three (273) were operating in both national and international markets Based on the responses received from the companies 636 of them are specialised in commercial buildings industrial buildings and infrastructure-transport structures while 455 of them are specialised in residential buildings and 182 of them are specialised in other types of projects Findings revealed that 455 of the companies sublet 51 to 75 of the total work capacity to the subcontractor companies 364 of them sublet 26 to 50 of the total work capacity 91 of them sublet 1 to 25 of the total work capacity and 76 to 100 of the work capacity to the subcontractor companies
Table 4 (continued)
Quality Performances of Turkish Contractors
PENERBIT UNIVERSITI SAINS MALAYSIA173
Group decision on the Weights of the Most Important KPIs (Qs)
Respondents are strategically competitors and the individual preferences of these 11 companies have been taken one by one and then were combined to reach a group decision for the proposed framework The AHP method was applied to determine the weights of the nine KPIs in the quality performance measurement framework In the interviews Saatys (2008) rating scale was used to calculate the relative importance of these nine KPIs
In this step first 11 pairwise comparison matrices were built to understand the individual judgements of each company the weights of nine KPIs in each company were calculated and the consistency index of each comparison matrix was checked (as shown in Table 5)
Then the individual matrices were aggregated using the weighted geometric mean method into a single matrix to reach a group decision (using Equation 4) and the consistency index of the aggregated pairwise comparison matrix was checked The aggregated individual priorities are presented in Table 6 and the aggregated weights of nine KPIs are shown in the last column of Table 5
According to the findings displayed in Table 5 Construction quality (conformance to the specification) (Q4) is the most effective indicator with the weight of 024009 in the developed framework This indicator is followed by The quality of workmanship (Q5) with the weight of 017890 Application-level of the quality management system in projects (Q2) with the weight of 011874 and The audit of the quality management system in project-level (Q3) with the weight of 009979 On the other hand the least effective indicator in the framework is Number of reworks (Q7) with the weight of 005634
development of the Quality Performance Measurement Framework
The proposed quality performance measurement framework consists of three steps which are (1) inputs (2) process and (3) output (as shown in Figure 2)
Figure 2 Framework for Measuring Quality Performance of Subcontractors
Befrin Neval Bingol and Gul Polat
174PENERBIT UNIVERSITI SAINS MALAYSIA
Tabl
e 5
Ind
ivid
ual P
riorit
ies o
f Nin
e KP
Is A
ccor
din
g to
the
11 T
urki
sh G
ener
al C
ontra
ctor
Com
pani
es
wGC
1w
GC
2w
GC
3w
GC
4w
GC
5w
GC
6w
GC
7w
GC
8w
GC
9w
GC10
wGC
11wQG
1
Q1
010
252
010
673
007
935
010
000
027
167
010
605
005
593
008
900
004
907
004
901
002
712
008
881
Q2
010
252
022
065
010
146
010
000
008
751
010
605
005
593
008
900
015
056
004
901
025
479
011
880
Q3
010
252
015
801
014
647
010
000
008
751
010
605
009
904
006
572
015
056
004
901
002
712
009
960
Q4
018
472
015
801
028
382
020
000
027
168
019
915
037
413
013
802
022
251
026
073
017
534
024
070
Q5
018
472
007
485
022
584
020
000
016
496
010
605
028
481
013
802
015
056
026
073
010
653
017
886
Q6
010
252
010
673
005
088
010
000
002
917
010
605
003
254
018
842
002
096
009
416
002
654
006
956
Q7
010
252
005
009
002
669
010
000
002
917
005
853
003
254
001
617
008
525
004
901
010
361
005
623
Q8
006
700
005
009
005
088
005
000
002
917
010
605
003
254
008
724
008
525
009
416
017
534
007
377
Q9
005
096
007
485
003
462
005
000
002
917
010
605
003
254
018
842
008
525
009
416
010
361
007
368
CR
000
890
001
700
001
290
000
000
000
110
000
370
000
900
001
850
000
770
000
090
000
600
Tabl
e 6
An
Agg
rega
ted
Pai
rwise
Com
paris
on M
atrix
of 1
1 Tu
rkish
Con
tract
ors
Q1
Q2
Q3
Q4
Q5
Q6
Q7
Q8
Q9
Q1
10
722
088
160
3537
049
071
3493
158
811
2535
122
11
Q2
138
511
122
110
4847
062
161
7152
204
331
6733
163
01
Q3
113
430
8189
10
4012
053
571
5121
180
81
3493
138
51
Q4
282
72
063
249
221
155
443
3114
389
713
076
301
42
Q5
203
811
6086
186
690
6433
12
5126
332
712
4922
235
04
Q6
074
110
583
066
130
302
039
81
122
110
9638
1
Q7
062
970
4894
055
310
2566
030
060
8189
10
7616
072
2
Q8
079
780
5976
074
110
3251
040
121
0375
131
31
106
5
Q9
081
890
6134
072
20
3318
042
551
138
510
9389
1
Quality Performances of Turkish Contractors
PENERBIT UNIVERSITI SAINS MALAYSIA175
Inputs of the framework include group decision on the weights of the most important KPIs (Qs) which are obtained from AHP calculations measurement scales for each KPI the direction of preference of each KPI (minimum is the most favourable or maximum is the most favourable) and the evaluations of all candidate subcontractors with respect to each KPI
Having determined the inputs values in the process step the performance scores (q) of all candidate subcontractors are calculated by normalising the evaluations concerning each KPI considering the direction of preference If the direction of preference is maximum the quantitative equivalence of the evaluation of a subcontractor candidate for any KPI is divided by the sum of the evaluations of all subcontractors to the KPI in question On the other hand if the direction of preference is minimum the reciprocals of the quantitative equivalences of the evaluations are normalised By this way the subcontractor candidate with the minimum value becomes more favourable
In the output step the overall quality performance index (QPI) of each subcontractor candidate can be calculated using Equation 5
QPI w q1
9
SC iG
iim m=
= (Eq 5)
Where QPISCm represents the overall QPI of the mth subcontractor wiG represents
the aggregated weight of the ith KPI (Qi) based on group decision and qim represents the performance score of the mth subcontractor candidate for the ith KPI (Qi)
An Illustrative Example of the Application of the Proposed Quality Performance Measurement Framework
An illustrative example has been presented to demonstrate how the proposed framework can be used by a Turkish general contractor who intends to evaluate the quality performances of the subcontractor candidates under consideration for an international construction project
In the illustrative example (as shown in Table 7) there are five subcontractor candidates First the general contractor determines the measurement scales for each KPI identifies the direction of preference of each KPI and evaluates all candidate subcontractors for each KPI based on the identified measurement scale The weights of the KPIs are obtained from the AHP calculations presented in the last column of Table 5 Second the general contractor calculates the performance scores (q) of all candidate subcontractors And finally the general contractor computes the overall QPI of all candidate subcontractors In the illustrative example the overall quality performance of the fourth subcontractor candidate (SC_4) is higher than the other candidates
Befrin Neval Bingol and Gul Polat
176PENERBIT UNIVERSITI SAINS MALAYSIA
Tabl
e 7
An
Illust
rativ
e Ex
ampl
e of
the
App
licat
ion
of th
e Pr
opos
ed F
ram
ewor
k
Q
Q D
efini
tion
Mea
sure
men
t Sc
ales
dire
ctio
n of
Pr
efer
ence
sW
eigh
tsEv
alua
tions
of S
ubco
ntra
ctor
Can
dida
tes
Qua
lity
Scor
es o
f Sub
cont
ract
or C
andi
date
s
SC_1
SC_2
SC_3
SC_4
SC_5
q_1
q_2
q_3
q_4
q_5
Q1
Ad
equa
cy o
f qu
ality
ass
uran
ce
polic
y
VBndash
VG
2M
ax
008
881
GV
GM
GV
G0
190
023
80
143
019
00
238
Q2
The
appl
icat
ion
leve
l of t
he q
ualit
y m
anag
emen
t sy
stem
in p
roje
cts
VBndash
VG
Max
0
1188
0G
MM
MG
023
50
176
017
60
176
023
5
Q3
The
aud
it of
th
e qu
ality
m
anag
emen
t sy
stem
in p
roje
ct
leve
l
VBndash
VG
Max
0
0996
0M
GG
VG
M0
158
021
10
211
026
30
158
Q4
Con
stru
ctio
n qu
ality
(c
onfo
rman
ce to
th
e sp
ecifi
catio
n)
VBndash
VG
Max
0
2407
0G
VG
GM
G0
200
025
00
200
015
00
200
Q5
The
qual
ity o
f w
orkm
ansh
ipV
BndashV
GM
ax
017
886
VG
MV
GG
M0
250
015
00
250
020
00
150
Q6
The
cost
of
poor
qua
lity
resu
lting
from
th
e lo
w st
and
ard
pr
oduc
tion
M
in
006
956
12
29
21
11
10
234
009
70
134
028
10
255
Q7
Num
ber o
f rew
orks
Num
ber
Min
0
0562
314
98
411
011
00
171
019
30
386
014
0
Q8
Perc
enta
ge o
f re
wor
ks (
)
Min
0
0737
73
24
44
11
83
30
190
013
80
149
033
80
185
Q9
The
seve
rity
of
def
ect a
t the
co
nstru
ctio
n ph
ase
VLndash
VH
3M
in
007
368
MH
MV
HH
024
40
183
024
40
146
018
3
QPI
020
80
190
019
70
213
019
3
Not
es V
B =
Ver
y Ba
d (1
) B
= Ba
d (2
) M
= M
ediu
m (3
) G
= G
ood
(4)
VG
= V
ery
Goo
d (5
) V
L =
Ver
y Lo
w (1
) L
= Lo
w (2
) M
= M
ediu
m (3
) H
= Hi
gh (4
) V
H =
Ver
y Hi
gh (5
)
Quality Performances of Turkish Contractors
PENERBIT UNIVERSITI SAINS MALAYSIA177
ConCLuSIon
Since most of the international construction projects are highly complex in nature they require the involvement of multiple subcontractors therefore the selection of the most appropriate subcontractor becomes crucial for the overall project success The subcontractor selection process is mostly affected by several compromising and conflicting tangible and intangible criteria While the criteria like cost and time can be numerically measured the criteria like safety and quality cannot be easily measured This study aimed to solve this issue by developing a framework for measuring the quality performances of subcontractor candidates more systematically and rationally way To use the proposed framework subcontractor candidates should be assessed based on the identified nine KPIs After these assessments the quality performance of the candidates can be determined using the proposed framework The measurement framework includes indicators that can be measured quantitatively and qualitatively
The limitations of this study are related to the developed framework relying on the individual preferences of the 11 Turkish companies that are also the target users This potential limitation can be overcome by increasing the sample size Moreover the performance of the proposed framework should be tested with real cases
rEFErEnCES
Ali HAEM Al-Sulaihi IA and Al-Gahtani KS (2013) Indicators for measuring performance of building construction companies in Kingdom of Saudi Arabia Journal of King Saud University ndash Engineering Sciences 25(2) 125ndash134 httpsdoiorg101016jjksues201203002
Arslan G Kivrak S Birgonul MT and Dikmen I (2008) Improving sub-contractor selection process in construction projects Web-based sub-contractor evaluation system (WEBSES) Automation in Construction 17(4) 480ndash488 httpsdoiorg101016jautcon200708004
Bingol BN and Polat G (2016) Measuring quality performances of subcontractors using key performance indicators (KPIs) model Paper presented at the 12th International Congress on Advances in Civil Engineering Istanbul Turkey 21ndash23 September
Chan APC and Chan APL (2004) Key performance indicators for measuring construction success Benchmarking An International Journal 11(2) 203ndash221 httpsdoiorg10110814635770410532624
Chen Y Okudan GE and Riley DR (2010) Sustainable performance criteria for construction method selection in concrete buildings Automation in Construction 19(2) 235ndash244 httpsdoiorg101016jautcon200910004
Choudhry RM Hinze JW Arshad M and Gabriel HF (2012) Subcontracting practices in the construction industry of Pakistan Journal of Construction Engineering and Management 138(12) 1353ndash1359 httpsdoiorg101061(ASCE)CO1943-78620000562
El-Mashaleh MS (2009) A construction subcontractor selection model Jordan Journal of Civil Engineering 3(4) 375ndash383
Enshassi A Choudhry RM Mayer PE and Shoman Y (2008) Safety performance of subcontractors in the Palestinian construction industry Journal of Construction in Developing Countries 13(1) 51ndash62
Befrin Neval Bingol and Gul Polat
178PENERBIT UNIVERSITI SAINS MALAYSIA
Enshassi A Mohamed S and Abushaban S (2009) Factors affecting the performance of construction projects in the Gaza strip Journal of Civil Engineering and Management 15(3) 269ndash280 httpsdoiorg1038461392-3730200915269-280
Escobar MT Aguaroacuten J and Moreno-Jimeacutenez JM (2004) A note on AHP group consistency for the row geometric mean priorization procedure European Journal of Operational Research 153(2) 318ndash322 httpsdoiorg101016S0377-2217(03)00154-1
Field A (2017) Discovering Statistics Using IBM SPSS Statistics North American Edition Thousand Oaks CA SAGE
Hartmann A Ling FYY and Tan JS (2009) Relative importance of subcontractor selection criteria Evidence from Singapore Journal of Construction Engineering and Management 135(9) 826ndash832 httpsdoiorg101061(ASCE)0733-9364(2009)1359(826)
Hatush Z and Skitmore M (1997) Criteria for contractor selection Construction Management and Economics 15(1) 19ndash38 httpsdoiorg101080014461997373088
Kagioglou M Cooper R and Aouad G (2001) Performance management in construction A conceptual framework Construction Management and Economics 19(1) 85ndash95 httpsdoiorg10108001446190010003425
Lee A Cooper R and Aouad G (2000) A methodology for designing performance measures for the UK construction industry Paper presented at the Bizarre Fruit 2000 Postgraduate Research Conference on the Built and Human Environment University of Salford Salford UK 9ndash10 March
Lin G and Shen Q (2007) Measuring the performance of value management studies in construction Critical review Journal of Management in Engineering 23(1) 2ndash9 httpsdoiorg101061(ASCE)0742-597X(2007)231(2)
Luu VT Kim S-Y and Huynh T-A (2008) Improving project management performance of large contractors using benchmarking approach International Journal of Project Management 26(7) 758ndash769 httpsdoiorg 101016jijproman200710002
Mahdi IM Riley MJ Fereig SM and Alex AP (2002) A multi-criteria approach to contractor selection Engineering Construction and Architectural Management 9(1) 29ndash37 httpsdoiorg101108eb021204
Marzouk MM El Kherbawy AA and Khalifa M (2013) Factors influencing sub-contractors selection in construction projects HBRC Journal 9(2) 150ndash158 httpsdoiorg101016jhbrcj201305001
Mbachu J (2008) Conceptual framework for the assessment of subcontractors eligibility and performance in the construction industry Construction Management and Economics 26(5) 471ndash484 httpsdoiorg10108001446190801918730
Ng ST and Skitmore M (2014) Developing a framework for subcontractor appraisal using a balanced scorecard Journal of Civil Engineering and Management 20(2) 149ndash158 httpsdoiorg103846139237302013802705
Onder G and Onder E (2014) AHS In E Oumlnder and BF Yildirim (eds) Ccedilok Kriterli Karar Verme Istanbul Dora Yayincilik 21ndash64
Saaty T (1980) The Analytic Process Planning Priority Setting Resources Allocation London McGraw-Hill
Quality Performances of Turkish Contractors
PENERBIT UNIVERSITI SAINS MALAYSIA179
Saaty TL (2008) Decision making with the analytic hierarchy process International Journal of Services Sciences 1(1) 83ndash98 httpsdoiorg101504IJSSCI2008017590
Saaty TL and Vargas LG (2012) Models Methods Concepts and Applications of the Analytic Hierarchy Process BerlinHeidelberg Springer Science and Business Media 175
Timor M (2011) Analitik Hiyerarsi Prosesi Istanbul Turkmen KitabeviTrinkūnienė E Podvezko V Zavadskas EK Jokšienė I Vinogradova I and
Trinkūnas V (2017) Evaluation of quality assurance in contractor contracts by multi-attribute decision-making methods Economic Research ndash Ekonomska Istraživanja 30(1) 1152ndash1180 httpsdoiorg1010801331677X20171325616
Tserng HP and Lin PH (2002) An accelerated subcontracting and procuring model for construction projects Automation in Construction 11(1) 105ndash125 httpsdoiorg101016S0926-5805(01)00056-5
Turkish Contractors Association (TCA) (2018) Turkish Contractors Association Sector Report Ankara TCA
Ulubeyli S Manisali E and Kazaz A (2010) Subcontractor selection practices in international construction projects Journal of Civil Engineering and Management 16(1) 47ndash56 httpsdoiorg103846jcem201004
Vaidya OS and Kumar S (2006) Analytic hierarchy process An overview of applications European Journal of Operational Research 169(1) 1ndash29 httpsdoiorg101016jejor200404028
Ward S Curtis B and Chapman C (1991) Objectives and performance in construction projects Construction Management and Economics 9(4) 343ndash353 httpsdoiorg10108001446199100000027
Yang H Yeung JF Chan AP Chiang Y and Chan DW (2010) A critical review of performance measurement in construction Journal of Facilities Management 8(4) 269ndash284 httpsdoiorg10110814725961011078981
Yasamis-Speroni F Lee D-E and Arditi D (2012) Evaluating the quality performance of pavement contractors Journal of Construction Engineering and Management 138(10) 1114ndash1124 httpsdoiorg101061(ASCE)CO1943-78620000539
Yu I Kim K Jung Y and Chin S (2007) Comparable performance measurement system for construction companies Journal of Management in Engineering 23(3) 131ndash139 httpsdoiorg101061(ASCE)0742-597X(2007)233(131)
Quality Performances of Turkish Contractors
PENERBIT UNIVERSITI SAINS MALAYSIA167
In the pre-survey stage firstly 12 KPIs which can be used to measure quality performance in construction projects were identified in the light of an extensive literature review (as shown in Table 1) Then a questionnaire survey among 40 large scale Turkish contractors most of which are members of TCA and predominantly act as general contractors was conducted to determine the relative importance of these KPIs According to the official figures issued by the Ministry of Labour and Social Security there are 494 large scale construction companies which employ more than 250 labourers in Turkey From these 494 companies 100 of them were selected using the purposive sampling method and were contacted Of the 100 mailed questionnaires 40 were returned duly filled out which corresponds to a response rate of 40 In the questionnaire the respondent companies were asked to rate the relative importance levels of 12 KPIs using typical five-level Likert scale where 1 represents the Least Importance and 5 represents the Highest Importance
Having collected the responses reliability (ie Cronbachs alpha) and ranking (ie RII) analyses were carried out in order to test the internal consistency of the scale used in questionnaire for measuring the perceptions of the respondents and to compute the relative importance of the KPIs respectively
Cronbachs alpha value was found to be 0939 which indicates that the internal consistency of the scale used is excellent (Field 2017) RII is calculated by dividing the arithmetic mean of the responses given for each KPI to the highest importance which is 5 in this study (Chen Okudan and Riley 2010) Based on the findings of the ranking analysis out of 12 KPIs six have High three have High-Medium and three have Medium RII As this study aims to construct an efficient and practical quality performance measurement framework three KPIs with Medium RII namely availability of quality assurance certificate and date of certificate (KPI2) subcontractors management ability of quality assurance and certificate programs (KPI3) and the establishment of quality assurance system and cost for managing it (KPI4) were eliminated The most important nine KPIs with High and High-Medium RIIs were used when constructing the quality performance measurement framework namely adequacy of quality assurance policy (Q1) application-level of the quality management system in projects (Q2) the audit of the quality management system in project level (Q3) construction quality (conformance to the specification) (Q4) the quality of workmanship (Q5) the cost of poor quality resulting from the low standard production (Q6) number of reworks (Q7) percentage of reworks () (Q8) and severity of defect at construction phase (Q9) The findings of the pre-survey phase were extensively reported in Bingol and Polat (2016)
In the survey stage the main objective was to calculate the group decision on the weights of the most important nine KPIs (Qs) used in the quality performance measurement framework on the subcontractor selection process In order to achieve this objective the AHP method was employed The target users of the proposed evaluation framework were the large scale Turkish general contractors who predominantly operate in international markets are listed in ENR Top 250 International Contractors list are the members of the TCA and had management system certificates (ie ISO 90012008 ISO 140012004 OHSAS 180012007) There are 27 Turkish contractors who fulfilled all these criteria Therefore the target population of this research was 27 and all of these companies were contacted Out of these 27 Turkish contractors 11 were accepted to contribute to the research Face-to-face interviews were conducted to construct pairwise comparison matrices The
Befrin Neval Bingol and Gul Polat
168PENERBIT UNIVERSITI SAINS MALAYSIA
individual judgements of these target users were aggregated to reach a group decision
Table 1 Identified KPIs and Their RIIs
KPI Q description references rII
KPI1 Q1 Adequacy of quality assurance policy
Enshassi Mohamed and Abushaban (2009) Yasamis-Speroni Lee and Arditi (2012)
H-M
KPI2 ndash Availability of quality assurance certificate and date of the certificate
Hatush and Skitmore (2010) M
KPI3 ndash Subcontractors management ability of quality assurance and certificate programs
Marzouk El Kherbawy and Khalifa (2013)
M
KPI4 ndash The establishment of a quality assurance system and cost for managing it
Luu Kim and Huynh (2008) M
KPI5 Q2 Application-level of the quality management system in projects
Luu Kim and Huynh (2008) H-M
KPI6 Q3 The audit of the quality management system in project level
Luu Kim and Huynh (2008) H-M
KPI7 Q4 Construction quality (conformance to the specification)
Mahdi et al (2002) Chan and Chan (2004) Luu Kim and Huynh (2008) Arslan et al (2008) El-Mashaleh (2009) Enshassi Mohamed and Abushaban (2009)
H
KPI8 Q5 The quality of workmanship Hatush and Skitmore (1997) Arslan et al (2008) El-Mashaleh (2009)
H
KPI9 Q6 The cost of poor quality resulting from the low standard production
Marzouk El Kherbawy and Khalifa (2013)
H
KPI10 Q7 Number of reworks Ali Al-Sulaihi and Al-Gahtani (2013)
H
KPI11 Q8 Percentage of reworks () Ng and Skitmore (2014) H
KPI12 Q9 The severity of defect at the construction phase
Enshassi Mohamed and Abushaban (2009)
H
Notes RII = L Low (RII lt 02) M-L Medium-Low (02 le RII lt 04) M Medium (04 le RII lt 06) H-M High-Medium (06 le RII lt 08) H High (RII ge 08) Source Chen Okudan and Riley (2010)
AHP was developed by Saaty (1980) It is a basic approach that deals with both the rational and the intuitive decisions to select the most appropriate option
Quality Performances of Turkish Contractors
PENERBIT UNIVERSITI SAINS MALAYSIA169
from several alternatives with respect to several criteria (Saaty and Vargas 2012) Fundamentally the AHP method is based on mathematics and psychology and is the application of an Eigenvalue approach to the pairwise comparisons (Vaidya and Kumar 2006) The simplest form of AHP is composed of a hierarchy consisting of three levels (1) The goal of the decision is at the top level (2) Criteria of the goal are in the second level and (3) Alternatives are located in the third level (Saaty and Vargas 2012)
The AHP methodology relies on pairwise comparison of either criteria or alternatives Decision-makers compare criteriaalternative using actual measurements or a fundamental scale to reflect the relative strength of their preferences and feelings In the pairwise comparison matrices the question of How many times the one criterionalternative is more important or dominant over the other criterionalternative with respect to the goalcriterion should be expressed on a scale of 1 to 9 (as shown in Table 2) (Saaty 2008)
Table 2 Saatys Rating Scale
Intensity of Importance Definition Explanation
1 Equal importance Two factors contribute equally to the objective
3 Somewhat more important
Experience and judgement slightly favour one over the other
5 Much more important
Experience and judgement strongly favour one over the other
7 Very much more important
Experience and judgement very strongly favour one over the other
9 Absolutely more important
The evidence favouring one over the other is one of the highest possible validity
2ndash4ndash6ndash8 Intermediate values When compromise is needed
Reciprocal of above nonzero numbers
If the activity i has one of the above nonzero numbers assigned to it when compared with activity j then j has the reciprocal value when compared to i
Source Saaty (2008)
The constructed pairwise comparison matrices are positive and reciprocal (ie a[ ]ij
1 a ji= ) (as shown in Equation 1)
1
1a
1a a
A
a a
a
a
a12
1 2
2a
n n
n
n
nm
11 12
22
1
=h h
g
g
g
g
h
R
T
SSSSSSSSSSSSS
V
X
WWWWWWWWWWWWW
(Eq 1)
Befrin Neval Bingol and Gul Polat
170PENERBIT UNIVERSITI SAINS MALAYSIA
Saaty (1980) proposed to check the inconsistency of judgements with a measure called the Consistency Index (CI) CI is calculated with the following Equation 2
1CI
nnmax= m
-
-^] g
h (Eq 2)
where maxm is the principal eigenvalue of the judgement matrix and n refers to the number of criteria in this matrix The consistencies of decision-makers evaluation are checked with the consistency ratio (CR) The following equation is used to determine this ratio (as shown in Equation 3)
1CI
nnmax= m
-
-^] g
h (Eq 3)
CR depends on both the CI and the random index The random index values determined based on different numbers are provided in Table 3
Table 3 Random Index
number of Items random Index number of Items random Index
1 0 6 124
2 0 7 132
3 058 8 141
4 090 9 145
5 141 10 149
Source Timor (2011)
The value of CR for comparison matrices should be less than 01 to provide consistency of the decision-maker If not the results of the pairwise comparison need to be re-evaluated to improve consistency
In most real-life decision-making problems decisions are made by several decision makers AHP is a convenient method to be used in group decision making There are two different approaches for combining individual judgements which include (1) aggregating individual judgements and (2) aggregating individual priorities (Escobar Aguaroacuten and Moreno-Jimeacutenez 2004) The weighted geometric mean and the row geometric mean methods are used for combining group decision (Escobar Aguaroacuten and Moreno-Jimeacutenez 2004) According to Saaty (2008) taking the geometric mean of individual judgements is the best way to convert individual preferences into a group decision Usage of 1 to 9 rating scale for individual judgements mainly result in preferring the geometric mean to reach a group decision (Timor 2011 Onder and Onder 2014)
When the individual judgements of the decision-makers are combined with the weighted geometric mean method the final priority is computed via Equation 4
ww ( )ijG
ijd
k 1
m k=
=
m^ h (Eq 4)
Quality Performances of Turkish Contractors
PENERBIT UNIVERSITI SAINS MALAYSIA171
where wijG represents group decision computed with the weighted geometric
mean m represent the number of decision-makers represents the decision matrix of the decision-maker and λk represents the weight of decision-maker
AnALYSIS And FIndInGS
Characteristics of the Interviewed Companies
Out of 27 Turkish contractors 11 accepted to participate in face-to-face interviews corresponding to a response rate of 4074 Interviews were conducted with 11 civil engineers who were in charge of subcontractor evaluation and selection process In these interviews seven questions were asked to reveal the general characteristics of the interviewed companies The findings of the general characteristics of the companies were summarised in Table 4
Table 4 Demographic Characteristics of 11 Contractors
demographic Characteristics N Valid
Experience in the industry 1 to 5 years ndash ndash
6 to 10 years ndash ndash
11 to 15 years ndash ndash
16 to 20 years 2 182
21 to 25 years 3 273
26 to 30 years ndash ndash
gt 30 years 6 545
Total 11 100
Membership of TCA Member 11 100
Not a Member 0 0
Total 11 100
Roles of respondent companies General contractor 11 100
Subcontractor 1 91
Partner of the consortium 1 91
Member of a joint venture 3 273
Consultant companies ndash ndash
Others ndash ndash
The markets that the respondent companies operate predominantly
National (Domestic) ndash ndash
International 8 727
Equally on national and international markets
3 273
(continued on next page)
Befrin Neval Bingol and Gul Polat
172PENERBIT UNIVERSITI SAINS MALAYSIA
demographic Characteristics N Valid
Expertise areas Commercial buildings 7 636
Industrial buildings 7 636
Residential buildings 5 455
Infrastructure and transportation structures
7 636
Others 2 182
Percentages of work capacity transferred to subcontractors
1 to 25 1 91
26 to 50 4 364
51 to 75 5 455
76 to 100 1 91
Total 11 100
Experience of the respondents in the interviewed companies
1 to 4 years 1 909
5 to 9 years 2 1818
10 to 14 years ndash ndash
15 to 19 years 2 1818
20 to 24 years 3 2727
25 to 29 years 2 1818
30 to 34 years ndash ndash
gt 34 years 1 909
Total 11 100
According to the data obtained in the interviews out of the 11 contractors 5454 have 16 to 20 years of experience in the sector while 2727 have six to 10 years and 1818 have one to five years of experience It is observed that 100 of the respondent companies are general contractors where 91 of them are subcontractors 273 of them are a member of joint ventures and 91 are consultant companies in the undertaken projects On the other hand among 11 companies eight (727) were operating only in international markets and three (273) were operating in both national and international markets Based on the responses received from the companies 636 of them are specialised in commercial buildings industrial buildings and infrastructure-transport structures while 455 of them are specialised in residential buildings and 182 of them are specialised in other types of projects Findings revealed that 455 of the companies sublet 51 to 75 of the total work capacity to the subcontractor companies 364 of them sublet 26 to 50 of the total work capacity 91 of them sublet 1 to 25 of the total work capacity and 76 to 100 of the work capacity to the subcontractor companies
Table 4 (continued)
Quality Performances of Turkish Contractors
PENERBIT UNIVERSITI SAINS MALAYSIA173
Group decision on the Weights of the Most Important KPIs (Qs)
Respondents are strategically competitors and the individual preferences of these 11 companies have been taken one by one and then were combined to reach a group decision for the proposed framework The AHP method was applied to determine the weights of the nine KPIs in the quality performance measurement framework In the interviews Saatys (2008) rating scale was used to calculate the relative importance of these nine KPIs
In this step first 11 pairwise comparison matrices were built to understand the individual judgements of each company the weights of nine KPIs in each company were calculated and the consistency index of each comparison matrix was checked (as shown in Table 5)
Then the individual matrices were aggregated using the weighted geometric mean method into a single matrix to reach a group decision (using Equation 4) and the consistency index of the aggregated pairwise comparison matrix was checked The aggregated individual priorities are presented in Table 6 and the aggregated weights of nine KPIs are shown in the last column of Table 5
According to the findings displayed in Table 5 Construction quality (conformance to the specification) (Q4) is the most effective indicator with the weight of 024009 in the developed framework This indicator is followed by The quality of workmanship (Q5) with the weight of 017890 Application-level of the quality management system in projects (Q2) with the weight of 011874 and The audit of the quality management system in project-level (Q3) with the weight of 009979 On the other hand the least effective indicator in the framework is Number of reworks (Q7) with the weight of 005634
development of the Quality Performance Measurement Framework
The proposed quality performance measurement framework consists of three steps which are (1) inputs (2) process and (3) output (as shown in Figure 2)
Figure 2 Framework for Measuring Quality Performance of Subcontractors
Befrin Neval Bingol and Gul Polat
174PENERBIT UNIVERSITI SAINS MALAYSIA
Tabl
e 5
Ind
ivid
ual P
riorit
ies o
f Nin
e KP
Is A
ccor
din
g to
the
11 T
urki
sh G
ener
al C
ontra
ctor
Com
pani
es
wGC
1w
GC
2w
GC
3w
GC
4w
GC
5w
GC
6w
GC
7w
GC
8w
GC
9w
GC10
wGC
11wQG
1
Q1
010
252
010
673
007
935
010
000
027
167
010
605
005
593
008
900
004
907
004
901
002
712
008
881
Q2
010
252
022
065
010
146
010
000
008
751
010
605
005
593
008
900
015
056
004
901
025
479
011
880
Q3
010
252
015
801
014
647
010
000
008
751
010
605
009
904
006
572
015
056
004
901
002
712
009
960
Q4
018
472
015
801
028
382
020
000
027
168
019
915
037
413
013
802
022
251
026
073
017
534
024
070
Q5
018
472
007
485
022
584
020
000
016
496
010
605
028
481
013
802
015
056
026
073
010
653
017
886
Q6
010
252
010
673
005
088
010
000
002
917
010
605
003
254
018
842
002
096
009
416
002
654
006
956
Q7
010
252
005
009
002
669
010
000
002
917
005
853
003
254
001
617
008
525
004
901
010
361
005
623
Q8
006
700
005
009
005
088
005
000
002
917
010
605
003
254
008
724
008
525
009
416
017
534
007
377
Q9
005
096
007
485
003
462
005
000
002
917
010
605
003
254
018
842
008
525
009
416
010
361
007
368
CR
000
890
001
700
001
290
000
000
000
110
000
370
000
900
001
850
000
770
000
090
000
600
Tabl
e 6
An
Agg
rega
ted
Pai
rwise
Com
paris
on M
atrix
of 1
1 Tu
rkish
Con
tract
ors
Q1
Q2
Q3
Q4
Q5
Q6
Q7
Q8
Q9
Q1
10
722
088
160
3537
049
071
3493
158
811
2535
122
11
Q2
138
511
122
110
4847
062
161
7152
204
331
6733
163
01
Q3
113
430
8189
10
4012
053
571
5121
180
81
3493
138
51
Q4
282
72
063
249
221
155
443
3114
389
713
076
301
42
Q5
203
811
6086
186
690
6433
12
5126
332
712
4922
235
04
Q6
074
110
583
066
130
302
039
81
122
110
9638
1
Q7
062
970
4894
055
310
2566
030
060
8189
10
7616
072
2
Q8
079
780
5976
074
110
3251
040
121
0375
131
31
106
5
Q9
081
890
6134
072
20
3318
042
551
138
510
9389
1
Quality Performances of Turkish Contractors
PENERBIT UNIVERSITI SAINS MALAYSIA175
Inputs of the framework include group decision on the weights of the most important KPIs (Qs) which are obtained from AHP calculations measurement scales for each KPI the direction of preference of each KPI (minimum is the most favourable or maximum is the most favourable) and the evaluations of all candidate subcontractors with respect to each KPI
Having determined the inputs values in the process step the performance scores (q) of all candidate subcontractors are calculated by normalising the evaluations concerning each KPI considering the direction of preference If the direction of preference is maximum the quantitative equivalence of the evaluation of a subcontractor candidate for any KPI is divided by the sum of the evaluations of all subcontractors to the KPI in question On the other hand if the direction of preference is minimum the reciprocals of the quantitative equivalences of the evaluations are normalised By this way the subcontractor candidate with the minimum value becomes more favourable
In the output step the overall quality performance index (QPI) of each subcontractor candidate can be calculated using Equation 5
QPI w q1
9
SC iG
iim m=
= (Eq 5)
Where QPISCm represents the overall QPI of the mth subcontractor wiG represents
the aggregated weight of the ith KPI (Qi) based on group decision and qim represents the performance score of the mth subcontractor candidate for the ith KPI (Qi)
An Illustrative Example of the Application of the Proposed Quality Performance Measurement Framework
An illustrative example has been presented to demonstrate how the proposed framework can be used by a Turkish general contractor who intends to evaluate the quality performances of the subcontractor candidates under consideration for an international construction project
In the illustrative example (as shown in Table 7) there are five subcontractor candidates First the general contractor determines the measurement scales for each KPI identifies the direction of preference of each KPI and evaluates all candidate subcontractors for each KPI based on the identified measurement scale The weights of the KPIs are obtained from the AHP calculations presented in the last column of Table 5 Second the general contractor calculates the performance scores (q) of all candidate subcontractors And finally the general contractor computes the overall QPI of all candidate subcontractors In the illustrative example the overall quality performance of the fourth subcontractor candidate (SC_4) is higher than the other candidates
Befrin Neval Bingol and Gul Polat
176PENERBIT UNIVERSITI SAINS MALAYSIA
Tabl
e 7
An
Illust
rativ
e Ex
ampl
e of
the
App
licat
ion
of th
e Pr
opos
ed F
ram
ewor
k
Q
Q D
efini
tion
Mea
sure
men
t Sc
ales
dire
ctio
n of
Pr
efer
ence
sW
eigh
tsEv
alua
tions
of S
ubco
ntra
ctor
Can
dida
tes
Qua
lity
Scor
es o
f Sub
cont
ract
or C
andi
date
s
SC_1
SC_2
SC_3
SC_4
SC_5
q_1
q_2
q_3
q_4
q_5
Q1
Ad
equa
cy o
f qu
ality
ass
uran
ce
polic
y
VBndash
VG
2M
ax
008
881
GV
GM
GV
G0
190
023
80
143
019
00
238
Q2
The
appl
icat
ion
leve
l of t
he q
ualit
y m
anag
emen
t sy
stem
in p
roje
cts
VBndash
VG
Max
0
1188
0G
MM
MG
023
50
176
017
60
176
023
5
Q3
The
aud
it of
th
e qu
ality
m
anag
emen
t sy
stem
in p
roje
ct
leve
l
VBndash
VG
Max
0
0996
0M
GG
VG
M0
158
021
10
211
026
30
158
Q4
Con
stru
ctio
n qu
ality
(c
onfo
rman
ce to
th
e sp
ecifi
catio
n)
VBndash
VG
Max
0
2407
0G
VG
GM
G0
200
025
00
200
015
00
200
Q5
The
qual
ity o
f w
orkm
ansh
ipV
BndashV
GM
ax
017
886
VG
MV
GG
M0
250
015
00
250
020
00
150
Q6
The
cost
of
poor
qua
lity
resu
lting
from
th
e lo
w st
and
ard
pr
oduc
tion
M
in
006
956
12
29
21
11
10
234
009
70
134
028
10
255
Q7
Num
ber o
f rew
orks
Num
ber
Min
0
0562
314
98
411
011
00
171
019
30
386
014
0
Q8
Perc
enta
ge o
f re
wor
ks (
)
Min
0
0737
73
24
44
11
83
30
190
013
80
149
033
80
185
Q9
The
seve
rity
of
def
ect a
t the
co
nstru
ctio
n ph
ase
VLndash
VH
3M
in
007
368
MH
MV
HH
024
40
183
024
40
146
018
3
QPI
020
80
190
019
70
213
019
3
Not
es V
B =
Ver
y Ba
d (1
) B
= Ba
d (2
) M
= M
ediu
m (3
) G
= G
ood
(4)
VG
= V
ery
Goo
d (5
) V
L =
Ver
y Lo
w (1
) L
= Lo
w (2
) M
= M
ediu
m (3
) H
= Hi
gh (4
) V
H =
Ver
y Hi
gh (5
)
Quality Performances of Turkish Contractors
PENERBIT UNIVERSITI SAINS MALAYSIA177
ConCLuSIon
Since most of the international construction projects are highly complex in nature they require the involvement of multiple subcontractors therefore the selection of the most appropriate subcontractor becomes crucial for the overall project success The subcontractor selection process is mostly affected by several compromising and conflicting tangible and intangible criteria While the criteria like cost and time can be numerically measured the criteria like safety and quality cannot be easily measured This study aimed to solve this issue by developing a framework for measuring the quality performances of subcontractor candidates more systematically and rationally way To use the proposed framework subcontractor candidates should be assessed based on the identified nine KPIs After these assessments the quality performance of the candidates can be determined using the proposed framework The measurement framework includes indicators that can be measured quantitatively and qualitatively
The limitations of this study are related to the developed framework relying on the individual preferences of the 11 Turkish companies that are also the target users This potential limitation can be overcome by increasing the sample size Moreover the performance of the proposed framework should be tested with real cases
rEFErEnCES
Ali HAEM Al-Sulaihi IA and Al-Gahtani KS (2013) Indicators for measuring performance of building construction companies in Kingdom of Saudi Arabia Journal of King Saud University ndash Engineering Sciences 25(2) 125ndash134 httpsdoiorg101016jjksues201203002
Arslan G Kivrak S Birgonul MT and Dikmen I (2008) Improving sub-contractor selection process in construction projects Web-based sub-contractor evaluation system (WEBSES) Automation in Construction 17(4) 480ndash488 httpsdoiorg101016jautcon200708004
Bingol BN and Polat G (2016) Measuring quality performances of subcontractors using key performance indicators (KPIs) model Paper presented at the 12th International Congress on Advances in Civil Engineering Istanbul Turkey 21ndash23 September
Chan APC and Chan APL (2004) Key performance indicators for measuring construction success Benchmarking An International Journal 11(2) 203ndash221 httpsdoiorg10110814635770410532624
Chen Y Okudan GE and Riley DR (2010) Sustainable performance criteria for construction method selection in concrete buildings Automation in Construction 19(2) 235ndash244 httpsdoiorg101016jautcon200910004
Choudhry RM Hinze JW Arshad M and Gabriel HF (2012) Subcontracting practices in the construction industry of Pakistan Journal of Construction Engineering and Management 138(12) 1353ndash1359 httpsdoiorg101061(ASCE)CO1943-78620000562
El-Mashaleh MS (2009) A construction subcontractor selection model Jordan Journal of Civil Engineering 3(4) 375ndash383
Enshassi A Choudhry RM Mayer PE and Shoman Y (2008) Safety performance of subcontractors in the Palestinian construction industry Journal of Construction in Developing Countries 13(1) 51ndash62
Befrin Neval Bingol and Gul Polat
178PENERBIT UNIVERSITI SAINS MALAYSIA
Enshassi A Mohamed S and Abushaban S (2009) Factors affecting the performance of construction projects in the Gaza strip Journal of Civil Engineering and Management 15(3) 269ndash280 httpsdoiorg1038461392-3730200915269-280
Escobar MT Aguaroacuten J and Moreno-Jimeacutenez JM (2004) A note on AHP group consistency for the row geometric mean priorization procedure European Journal of Operational Research 153(2) 318ndash322 httpsdoiorg101016S0377-2217(03)00154-1
Field A (2017) Discovering Statistics Using IBM SPSS Statistics North American Edition Thousand Oaks CA SAGE
Hartmann A Ling FYY and Tan JS (2009) Relative importance of subcontractor selection criteria Evidence from Singapore Journal of Construction Engineering and Management 135(9) 826ndash832 httpsdoiorg101061(ASCE)0733-9364(2009)1359(826)
Hatush Z and Skitmore M (1997) Criteria for contractor selection Construction Management and Economics 15(1) 19ndash38 httpsdoiorg101080014461997373088
Kagioglou M Cooper R and Aouad G (2001) Performance management in construction A conceptual framework Construction Management and Economics 19(1) 85ndash95 httpsdoiorg10108001446190010003425
Lee A Cooper R and Aouad G (2000) A methodology for designing performance measures for the UK construction industry Paper presented at the Bizarre Fruit 2000 Postgraduate Research Conference on the Built and Human Environment University of Salford Salford UK 9ndash10 March
Lin G and Shen Q (2007) Measuring the performance of value management studies in construction Critical review Journal of Management in Engineering 23(1) 2ndash9 httpsdoiorg101061(ASCE)0742-597X(2007)231(2)
Luu VT Kim S-Y and Huynh T-A (2008) Improving project management performance of large contractors using benchmarking approach International Journal of Project Management 26(7) 758ndash769 httpsdoiorg 101016jijproman200710002
Mahdi IM Riley MJ Fereig SM and Alex AP (2002) A multi-criteria approach to contractor selection Engineering Construction and Architectural Management 9(1) 29ndash37 httpsdoiorg101108eb021204
Marzouk MM El Kherbawy AA and Khalifa M (2013) Factors influencing sub-contractors selection in construction projects HBRC Journal 9(2) 150ndash158 httpsdoiorg101016jhbrcj201305001
Mbachu J (2008) Conceptual framework for the assessment of subcontractors eligibility and performance in the construction industry Construction Management and Economics 26(5) 471ndash484 httpsdoiorg10108001446190801918730
Ng ST and Skitmore M (2014) Developing a framework for subcontractor appraisal using a balanced scorecard Journal of Civil Engineering and Management 20(2) 149ndash158 httpsdoiorg103846139237302013802705
Onder G and Onder E (2014) AHS In E Oumlnder and BF Yildirim (eds) Ccedilok Kriterli Karar Verme Istanbul Dora Yayincilik 21ndash64
Saaty T (1980) The Analytic Process Planning Priority Setting Resources Allocation London McGraw-Hill
Quality Performances of Turkish Contractors
PENERBIT UNIVERSITI SAINS MALAYSIA179
Saaty TL (2008) Decision making with the analytic hierarchy process International Journal of Services Sciences 1(1) 83ndash98 httpsdoiorg101504IJSSCI2008017590
Saaty TL and Vargas LG (2012) Models Methods Concepts and Applications of the Analytic Hierarchy Process BerlinHeidelberg Springer Science and Business Media 175
Timor M (2011) Analitik Hiyerarsi Prosesi Istanbul Turkmen KitabeviTrinkūnienė E Podvezko V Zavadskas EK Jokšienė I Vinogradova I and
Trinkūnas V (2017) Evaluation of quality assurance in contractor contracts by multi-attribute decision-making methods Economic Research ndash Ekonomska Istraživanja 30(1) 1152ndash1180 httpsdoiorg1010801331677X20171325616
Tserng HP and Lin PH (2002) An accelerated subcontracting and procuring model for construction projects Automation in Construction 11(1) 105ndash125 httpsdoiorg101016S0926-5805(01)00056-5
Turkish Contractors Association (TCA) (2018) Turkish Contractors Association Sector Report Ankara TCA
Ulubeyli S Manisali E and Kazaz A (2010) Subcontractor selection practices in international construction projects Journal of Civil Engineering and Management 16(1) 47ndash56 httpsdoiorg103846jcem201004
Vaidya OS and Kumar S (2006) Analytic hierarchy process An overview of applications European Journal of Operational Research 169(1) 1ndash29 httpsdoiorg101016jejor200404028
Ward S Curtis B and Chapman C (1991) Objectives and performance in construction projects Construction Management and Economics 9(4) 343ndash353 httpsdoiorg10108001446199100000027
Yang H Yeung JF Chan AP Chiang Y and Chan DW (2010) A critical review of performance measurement in construction Journal of Facilities Management 8(4) 269ndash284 httpsdoiorg10110814725961011078981
Yasamis-Speroni F Lee D-E and Arditi D (2012) Evaluating the quality performance of pavement contractors Journal of Construction Engineering and Management 138(10) 1114ndash1124 httpsdoiorg101061(ASCE)CO1943-78620000539
Yu I Kim K Jung Y and Chin S (2007) Comparable performance measurement system for construction companies Journal of Management in Engineering 23(3) 131ndash139 httpsdoiorg101061(ASCE)0742-597X(2007)233(131)
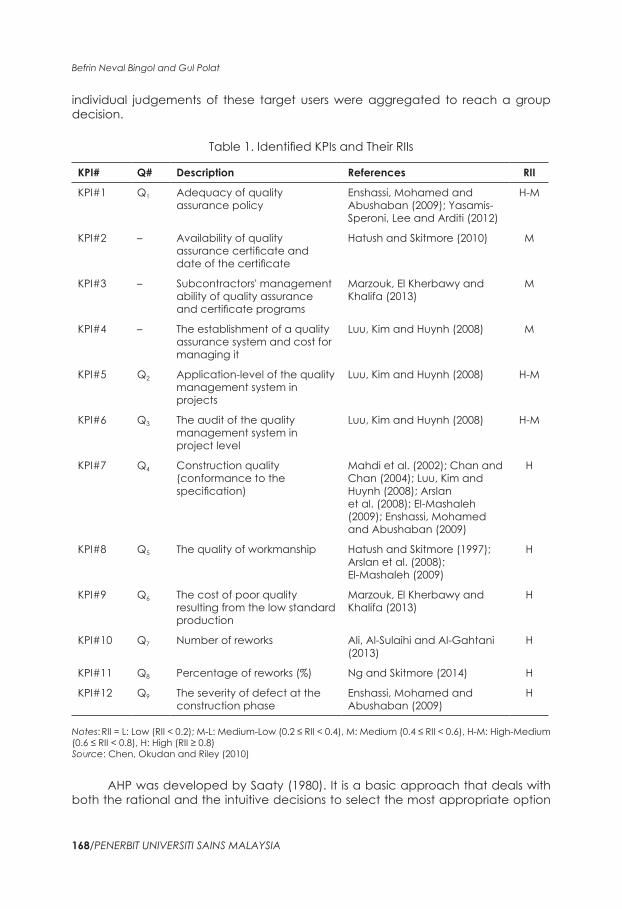
Befrin Neval Bingol and Gul Polat
168PENERBIT UNIVERSITI SAINS MALAYSIA
individual judgements of these target users were aggregated to reach a group decision
Table 1 Identified KPIs and Their RIIs
KPI Q description references rII
KPI1 Q1 Adequacy of quality assurance policy
Enshassi Mohamed and Abushaban (2009) Yasamis-Speroni Lee and Arditi (2012)
H-M
KPI2 ndash Availability of quality assurance certificate and date of the certificate
Hatush and Skitmore (2010) M
KPI3 ndash Subcontractors management ability of quality assurance and certificate programs
Marzouk El Kherbawy and Khalifa (2013)
M
KPI4 ndash The establishment of a quality assurance system and cost for managing it
Luu Kim and Huynh (2008) M
KPI5 Q2 Application-level of the quality management system in projects
Luu Kim and Huynh (2008) H-M
KPI6 Q3 The audit of the quality management system in project level
Luu Kim and Huynh (2008) H-M
KPI7 Q4 Construction quality (conformance to the specification)
Mahdi et al (2002) Chan and Chan (2004) Luu Kim and Huynh (2008) Arslan et al (2008) El-Mashaleh (2009) Enshassi Mohamed and Abushaban (2009)
H
KPI8 Q5 The quality of workmanship Hatush and Skitmore (1997) Arslan et al (2008) El-Mashaleh (2009)
H
KPI9 Q6 The cost of poor quality resulting from the low standard production
Marzouk El Kherbawy and Khalifa (2013)
H
KPI10 Q7 Number of reworks Ali Al-Sulaihi and Al-Gahtani (2013)
H
KPI11 Q8 Percentage of reworks () Ng and Skitmore (2014) H
KPI12 Q9 The severity of defect at the construction phase
Enshassi Mohamed and Abushaban (2009)
H
Notes RII = L Low (RII lt 02) M-L Medium-Low (02 le RII lt 04) M Medium (04 le RII lt 06) H-M High-Medium (06 le RII lt 08) H High (RII ge 08) Source Chen Okudan and Riley (2010)
AHP was developed by Saaty (1980) It is a basic approach that deals with both the rational and the intuitive decisions to select the most appropriate option
Quality Performances of Turkish Contractors
PENERBIT UNIVERSITI SAINS MALAYSIA169
from several alternatives with respect to several criteria (Saaty and Vargas 2012) Fundamentally the AHP method is based on mathematics and psychology and is the application of an Eigenvalue approach to the pairwise comparisons (Vaidya and Kumar 2006) The simplest form of AHP is composed of a hierarchy consisting of three levels (1) The goal of the decision is at the top level (2) Criteria of the goal are in the second level and (3) Alternatives are located in the third level (Saaty and Vargas 2012)
The AHP methodology relies on pairwise comparison of either criteria or alternatives Decision-makers compare criteriaalternative using actual measurements or a fundamental scale to reflect the relative strength of their preferences and feelings In the pairwise comparison matrices the question of How many times the one criterionalternative is more important or dominant over the other criterionalternative with respect to the goalcriterion should be expressed on a scale of 1 to 9 (as shown in Table 2) (Saaty 2008)
Table 2 Saatys Rating Scale
Intensity of Importance Definition Explanation
1 Equal importance Two factors contribute equally to the objective
3 Somewhat more important
Experience and judgement slightly favour one over the other
5 Much more important
Experience and judgement strongly favour one over the other
7 Very much more important
Experience and judgement very strongly favour one over the other
9 Absolutely more important
The evidence favouring one over the other is one of the highest possible validity
2ndash4ndash6ndash8 Intermediate values When compromise is needed
Reciprocal of above nonzero numbers
If the activity i has one of the above nonzero numbers assigned to it when compared with activity j then j has the reciprocal value when compared to i
Source Saaty (2008)
The constructed pairwise comparison matrices are positive and reciprocal (ie a[ ]ij
1 a ji= ) (as shown in Equation 1)
1
1a
1a a
A
a a
a
a
a12
1 2
2a
n n
n
n
nm
11 12
22
1
=h h
g
g
g
g
h
R
T
SSSSSSSSSSSSS
V
X
WWWWWWWWWWWWW
(Eq 1)
Befrin Neval Bingol and Gul Polat
170PENERBIT UNIVERSITI SAINS MALAYSIA
Saaty (1980) proposed to check the inconsistency of judgements with a measure called the Consistency Index (CI) CI is calculated with the following Equation 2
1CI
nnmax= m
-
-^] g
h (Eq 2)
where maxm is the principal eigenvalue of the judgement matrix and n refers to the number of criteria in this matrix The consistencies of decision-makers evaluation are checked with the consistency ratio (CR) The following equation is used to determine this ratio (as shown in Equation 3)
1CI
nnmax= m
-
-^] g
h (Eq 3)
CR depends on both the CI and the random index The random index values determined based on different numbers are provided in Table 3
Table 3 Random Index
number of Items random Index number of Items random Index
1 0 6 124
2 0 7 132
3 058 8 141
4 090 9 145
5 141 10 149
Source Timor (2011)
The value of CR for comparison matrices should be less than 01 to provide consistency of the decision-maker If not the results of the pairwise comparison need to be re-evaluated to improve consistency
In most real-life decision-making problems decisions are made by several decision makers AHP is a convenient method to be used in group decision making There are two different approaches for combining individual judgements which include (1) aggregating individual judgements and (2) aggregating individual priorities (Escobar Aguaroacuten and Moreno-Jimeacutenez 2004) The weighted geometric mean and the row geometric mean methods are used for combining group decision (Escobar Aguaroacuten and Moreno-Jimeacutenez 2004) According to Saaty (2008) taking the geometric mean of individual judgements is the best way to convert individual preferences into a group decision Usage of 1 to 9 rating scale for individual judgements mainly result in preferring the geometric mean to reach a group decision (Timor 2011 Onder and Onder 2014)
When the individual judgements of the decision-makers are combined with the weighted geometric mean method the final priority is computed via Equation 4
ww ( )ijG
ijd
k 1
m k=
=
m^ h (Eq 4)
Quality Performances of Turkish Contractors
PENERBIT UNIVERSITI SAINS MALAYSIA171
where wijG represents group decision computed with the weighted geometric
mean m represent the number of decision-makers represents the decision matrix of the decision-maker and λk represents the weight of decision-maker
AnALYSIS And FIndInGS
Characteristics of the Interviewed Companies
Out of 27 Turkish contractors 11 accepted to participate in face-to-face interviews corresponding to a response rate of 4074 Interviews were conducted with 11 civil engineers who were in charge of subcontractor evaluation and selection process In these interviews seven questions were asked to reveal the general characteristics of the interviewed companies The findings of the general characteristics of the companies were summarised in Table 4
Table 4 Demographic Characteristics of 11 Contractors
demographic Characteristics N Valid
Experience in the industry 1 to 5 years ndash ndash
6 to 10 years ndash ndash
11 to 15 years ndash ndash
16 to 20 years 2 182
21 to 25 years 3 273
26 to 30 years ndash ndash
gt 30 years 6 545
Total 11 100
Membership of TCA Member 11 100
Not a Member 0 0
Total 11 100
Roles of respondent companies General contractor 11 100
Subcontractor 1 91
Partner of the consortium 1 91
Member of a joint venture 3 273
Consultant companies ndash ndash
Others ndash ndash
The markets that the respondent companies operate predominantly
National (Domestic) ndash ndash
International 8 727
Equally on national and international markets
3 273
(continued on next page)
Befrin Neval Bingol and Gul Polat
172PENERBIT UNIVERSITI SAINS MALAYSIA
demographic Characteristics N Valid
Expertise areas Commercial buildings 7 636
Industrial buildings 7 636
Residential buildings 5 455
Infrastructure and transportation structures
7 636
Others 2 182
Percentages of work capacity transferred to subcontractors
1 to 25 1 91
26 to 50 4 364
51 to 75 5 455
76 to 100 1 91
Total 11 100
Experience of the respondents in the interviewed companies
1 to 4 years 1 909
5 to 9 years 2 1818
10 to 14 years ndash ndash
15 to 19 years 2 1818
20 to 24 years 3 2727
25 to 29 years 2 1818
30 to 34 years ndash ndash
gt 34 years 1 909
Total 11 100
According to the data obtained in the interviews out of the 11 contractors 5454 have 16 to 20 years of experience in the sector while 2727 have six to 10 years and 1818 have one to five years of experience It is observed that 100 of the respondent companies are general contractors where 91 of them are subcontractors 273 of them are a member of joint ventures and 91 are consultant companies in the undertaken projects On the other hand among 11 companies eight (727) were operating only in international markets and three (273) were operating in both national and international markets Based on the responses received from the companies 636 of them are specialised in commercial buildings industrial buildings and infrastructure-transport structures while 455 of them are specialised in residential buildings and 182 of them are specialised in other types of projects Findings revealed that 455 of the companies sublet 51 to 75 of the total work capacity to the subcontractor companies 364 of them sublet 26 to 50 of the total work capacity 91 of them sublet 1 to 25 of the total work capacity and 76 to 100 of the work capacity to the subcontractor companies
Table 4 (continued)
Quality Performances of Turkish Contractors
PENERBIT UNIVERSITI SAINS MALAYSIA173
Group decision on the Weights of the Most Important KPIs (Qs)
Respondents are strategically competitors and the individual preferences of these 11 companies have been taken one by one and then were combined to reach a group decision for the proposed framework The AHP method was applied to determine the weights of the nine KPIs in the quality performance measurement framework In the interviews Saatys (2008) rating scale was used to calculate the relative importance of these nine KPIs
In this step first 11 pairwise comparison matrices were built to understand the individual judgements of each company the weights of nine KPIs in each company were calculated and the consistency index of each comparison matrix was checked (as shown in Table 5)
Then the individual matrices were aggregated using the weighted geometric mean method into a single matrix to reach a group decision (using Equation 4) and the consistency index of the aggregated pairwise comparison matrix was checked The aggregated individual priorities are presented in Table 6 and the aggregated weights of nine KPIs are shown in the last column of Table 5
According to the findings displayed in Table 5 Construction quality (conformance to the specification) (Q4) is the most effective indicator with the weight of 024009 in the developed framework This indicator is followed by The quality of workmanship (Q5) with the weight of 017890 Application-level of the quality management system in projects (Q2) with the weight of 011874 and The audit of the quality management system in project-level (Q3) with the weight of 009979 On the other hand the least effective indicator in the framework is Number of reworks (Q7) with the weight of 005634
development of the Quality Performance Measurement Framework
The proposed quality performance measurement framework consists of three steps which are (1) inputs (2) process and (3) output (as shown in Figure 2)
Figure 2 Framework for Measuring Quality Performance of Subcontractors
Befrin Neval Bingol and Gul Polat
174PENERBIT UNIVERSITI SAINS MALAYSIA
Tabl
e 5
Ind
ivid
ual P
riorit
ies o
f Nin
e KP
Is A
ccor
din
g to
the
11 T
urki
sh G
ener
al C
ontra
ctor
Com
pani
es
wGC
1w
GC
2w
GC
3w
GC
4w
GC
5w
GC
6w
GC
7w
GC
8w
GC
9w
GC10
wGC
11wQG
1
Q1
010
252
010
673
007
935
010
000
027
167
010
605
005
593
008
900
004
907
004
901
002
712
008
881
Q2
010
252
022
065
010
146
010
000
008
751
010
605
005
593
008
900
015
056
004
901
025
479
011
880
Q3
010
252
015
801
014
647
010
000
008
751
010
605
009
904
006
572
015
056
004
901
002
712
009
960
Q4
018
472
015
801
028
382
020
000
027
168
019
915
037
413
013
802
022
251
026
073
017
534
024
070
Q5
018
472
007
485
022
584
020
000
016
496
010
605
028
481
013
802
015
056
026
073
010
653
017
886
Q6
010
252
010
673
005
088
010
000
002
917
010
605
003
254
018
842
002
096
009
416
002
654
006
956
Q7
010
252
005
009
002
669
010
000
002
917
005
853
003
254
001
617
008
525
004
901
010
361
005
623
Q8
006
700
005
009
005
088
005
000
002
917
010
605
003
254
008
724
008
525
009
416
017
534
007
377
Q9
005
096
007
485
003
462
005
000
002
917
010
605
003
254
018
842
008
525
009
416
010
361
007
368
CR
000
890
001
700
001
290
000
000
000
110
000
370
000
900
001
850
000
770
000
090
000
600
Tabl
e 6
An
Agg
rega
ted
Pai
rwise
Com
paris
on M
atrix
of 1
1 Tu
rkish
Con
tract
ors
Q1
Q2
Q3
Q4
Q5
Q6
Q7
Q8
Q9
Q1
10
722
088
160
3537
049
071
3493
158
811
2535
122
11
Q2
138
511
122
110
4847
062
161
7152
204
331
6733
163
01
Q3
113
430
8189
10
4012
053
571
5121
180
81
3493
138
51
Q4
282
72
063
249
221
155
443
3114
389
713
076
301
42
Q5
203
811
6086
186
690
6433
12
5126
332
712
4922
235
04
Q6
074
110
583
066
130
302
039
81
122
110
9638
1
Q7
062
970
4894
055
310
2566
030
060
8189
10
7616
072
2
Q8
079
780
5976
074
110
3251
040
121
0375
131
31
106
5
Q9
081
890
6134
072
20
3318
042
551
138
510
9389
1
Quality Performances of Turkish Contractors
PENERBIT UNIVERSITI SAINS MALAYSIA175
Inputs of the framework include group decision on the weights of the most important KPIs (Qs) which are obtained from AHP calculations measurement scales for each KPI the direction of preference of each KPI (minimum is the most favourable or maximum is the most favourable) and the evaluations of all candidate subcontractors with respect to each KPI
Having determined the inputs values in the process step the performance scores (q) of all candidate subcontractors are calculated by normalising the evaluations concerning each KPI considering the direction of preference If the direction of preference is maximum the quantitative equivalence of the evaluation of a subcontractor candidate for any KPI is divided by the sum of the evaluations of all subcontractors to the KPI in question On the other hand if the direction of preference is minimum the reciprocals of the quantitative equivalences of the evaluations are normalised By this way the subcontractor candidate with the minimum value becomes more favourable
In the output step the overall quality performance index (QPI) of each subcontractor candidate can be calculated using Equation 5
QPI w q1
9
SC iG
iim m=
= (Eq 5)
Where QPISCm represents the overall QPI of the mth subcontractor wiG represents
the aggregated weight of the ith KPI (Qi) based on group decision and qim represents the performance score of the mth subcontractor candidate for the ith KPI (Qi)
An Illustrative Example of the Application of the Proposed Quality Performance Measurement Framework
An illustrative example has been presented to demonstrate how the proposed framework can be used by a Turkish general contractor who intends to evaluate the quality performances of the subcontractor candidates under consideration for an international construction project
In the illustrative example (as shown in Table 7) there are five subcontractor candidates First the general contractor determines the measurement scales for each KPI identifies the direction of preference of each KPI and evaluates all candidate subcontractors for each KPI based on the identified measurement scale The weights of the KPIs are obtained from the AHP calculations presented in the last column of Table 5 Second the general contractor calculates the performance scores (q) of all candidate subcontractors And finally the general contractor computes the overall QPI of all candidate subcontractors In the illustrative example the overall quality performance of the fourth subcontractor candidate (SC_4) is higher than the other candidates
Befrin Neval Bingol and Gul Polat
176PENERBIT UNIVERSITI SAINS MALAYSIA
Tabl
e 7
An
Illust
rativ
e Ex
ampl
e of
the
App
licat
ion
of th
e Pr
opos
ed F
ram
ewor
k
Q
Q D
efini
tion
Mea
sure
men
t Sc
ales
dire
ctio
n of
Pr
efer
ence
sW
eigh
tsEv
alua
tions
of S
ubco
ntra
ctor
Can
dida
tes
Qua
lity
Scor
es o
f Sub
cont
ract
or C
andi
date
s
SC_1
SC_2
SC_3
SC_4
SC_5
q_1
q_2
q_3
q_4
q_5
Q1
Ad
equa
cy o
f qu
ality
ass
uran
ce
polic
y
VBndash
VG
2M
ax
008
881
GV
GM
GV
G0
190
023
80
143
019
00
238
Q2
The
appl
icat
ion
leve
l of t
he q
ualit
y m
anag
emen
t sy
stem
in p
roje
cts
VBndash
VG
Max
0
1188
0G
MM
MG
023
50
176
017
60
176
023
5
Q3
The
aud
it of
th
e qu
ality
m
anag
emen
t sy
stem
in p
roje
ct
leve
l
VBndash
VG
Max
0
0996
0M
GG
VG
M0
158
021
10
211
026
30
158
Q4
Con
stru
ctio
n qu
ality
(c
onfo
rman
ce to
th
e sp
ecifi
catio
n)
VBndash
VG
Max
0
2407
0G
VG
GM
G0
200
025
00
200
015
00
200
Q5
The
qual
ity o
f w
orkm
ansh
ipV
BndashV
GM
ax
017
886
VG
MV
GG
M0
250
015
00
250
020
00
150
Q6
The
cost
of
poor
qua
lity
resu
lting
from
th
e lo
w st
and
ard
pr
oduc
tion
M
in
006
956
12
29
21
11
10
234
009
70
134
028
10
255
Q7
Num
ber o
f rew
orks
Num
ber
Min
0
0562
314
98
411
011
00
171
019
30
386
014
0
Q8
Perc
enta
ge o
f re
wor
ks (
)
Min
0
0737
73
24
44
11
83
30
190
013
80
149
033
80
185
Q9
The
seve
rity
of
def
ect a
t the
co
nstru
ctio
n ph
ase
VLndash
VH
3M
in
007
368
MH
MV
HH
024
40
183
024
40
146
018
3
QPI
020
80
190
019
70
213
019
3
Not
es V
B =
Ver
y Ba
d (1
) B
= Ba
d (2
) M
= M
ediu
m (3
) G
= G
ood
(4)
VG
= V
ery
Goo
d (5
) V
L =
Ver
y Lo
w (1
) L
= Lo
w (2
) M
= M
ediu
m (3
) H
= Hi
gh (4
) V
H =
Ver
y Hi
gh (5
)
Quality Performances of Turkish Contractors
PENERBIT UNIVERSITI SAINS MALAYSIA177
ConCLuSIon
Since most of the international construction projects are highly complex in nature they require the involvement of multiple subcontractors therefore the selection of the most appropriate subcontractor becomes crucial for the overall project success The subcontractor selection process is mostly affected by several compromising and conflicting tangible and intangible criteria While the criteria like cost and time can be numerically measured the criteria like safety and quality cannot be easily measured This study aimed to solve this issue by developing a framework for measuring the quality performances of subcontractor candidates more systematically and rationally way To use the proposed framework subcontractor candidates should be assessed based on the identified nine KPIs After these assessments the quality performance of the candidates can be determined using the proposed framework The measurement framework includes indicators that can be measured quantitatively and qualitatively
The limitations of this study are related to the developed framework relying on the individual preferences of the 11 Turkish companies that are also the target users This potential limitation can be overcome by increasing the sample size Moreover the performance of the proposed framework should be tested with real cases
rEFErEnCES
Ali HAEM Al-Sulaihi IA and Al-Gahtani KS (2013) Indicators for measuring performance of building construction companies in Kingdom of Saudi Arabia Journal of King Saud University ndash Engineering Sciences 25(2) 125ndash134 httpsdoiorg101016jjksues201203002
Arslan G Kivrak S Birgonul MT and Dikmen I (2008) Improving sub-contractor selection process in construction projects Web-based sub-contractor evaluation system (WEBSES) Automation in Construction 17(4) 480ndash488 httpsdoiorg101016jautcon200708004
Bingol BN and Polat G (2016) Measuring quality performances of subcontractors using key performance indicators (KPIs) model Paper presented at the 12th International Congress on Advances in Civil Engineering Istanbul Turkey 21ndash23 September
Chan APC and Chan APL (2004) Key performance indicators for measuring construction success Benchmarking An International Journal 11(2) 203ndash221 httpsdoiorg10110814635770410532624
Chen Y Okudan GE and Riley DR (2010) Sustainable performance criteria for construction method selection in concrete buildings Automation in Construction 19(2) 235ndash244 httpsdoiorg101016jautcon200910004
Choudhry RM Hinze JW Arshad M and Gabriel HF (2012) Subcontracting practices in the construction industry of Pakistan Journal of Construction Engineering and Management 138(12) 1353ndash1359 httpsdoiorg101061(ASCE)CO1943-78620000562
El-Mashaleh MS (2009) A construction subcontractor selection model Jordan Journal of Civil Engineering 3(4) 375ndash383
Enshassi A Choudhry RM Mayer PE and Shoman Y (2008) Safety performance of subcontractors in the Palestinian construction industry Journal of Construction in Developing Countries 13(1) 51ndash62
Befrin Neval Bingol and Gul Polat
178PENERBIT UNIVERSITI SAINS MALAYSIA
Enshassi A Mohamed S and Abushaban S (2009) Factors affecting the performance of construction projects in the Gaza strip Journal of Civil Engineering and Management 15(3) 269ndash280 httpsdoiorg1038461392-3730200915269-280
Escobar MT Aguaroacuten J and Moreno-Jimeacutenez JM (2004) A note on AHP group consistency for the row geometric mean priorization procedure European Journal of Operational Research 153(2) 318ndash322 httpsdoiorg101016S0377-2217(03)00154-1
Field A (2017) Discovering Statistics Using IBM SPSS Statistics North American Edition Thousand Oaks CA SAGE
Hartmann A Ling FYY and Tan JS (2009) Relative importance of subcontractor selection criteria Evidence from Singapore Journal of Construction Engineering and Management 135(9) 826ndash832 httpsdoiorg101061(ASCE)0733-9364(2009)1359(826)
Hatush Z and Skitmore M (1997) Criteria for contractor selection Construction Management and Economics 15(1) 19ndash38 httpsdoiorg101080014461997373088
Kagioglou M Cooper R and Aouad G (2001) Performance management in construction A conceptual framework Construction Management and Economics 19(1) 85ndash95 httpsdoiorg10108001446190010003425
Lee A Cooper R and Aouad G (2000) A methodology for designing performance measures for the UK construction industry Paper presented at the Bizarre Fruit 2000 Postgraduate Research Conference on the Built and Human Environment University of Salford Salford UK 9ndash10 March
Lin G and Shen Q (2007) Measuring the performance of value management studies in construction Critical review Journal of Management in Engineering 23(1) 2ndash9 httpsdoiorg101061(ASCE)0742-597X(2007)231(2)
Luu VT Kim S-Y and Huynh T-A (2008) Improving project management performance of large contractors using benchmarking approach International Journal of Project Management 26(7) 758ndash769 httpsdoiorg 101016jijproman200710002
Mahdi IM Riley MJ Fereig SM and Alex AP (2002) A multi-criteria approach to contractor selection Engineering Construction and Architectural Management 9(1) 29ndash37 httpsdoiorg101108eb021204
Marzouk MM El Kherbawy AA and Khalifa M (2013) Factors influencing sub-contractors selection in construction projects HBRC Journal 9(2) 150ndash158 httpsdoiorg101016jhbrcj201305001
Mbachu J (2008) Conceptual framework for the assessment of subcontractors eligibility and performance in the construction industry Construction Management and Economics 26(5) 471ndash484 httpsdoiorg10108001446190801918730
Ng ST and Skitmore M (2014) Developing a framework for subcontractor appraisal using a balanced scorecard Journal of Civil Engineering and Management 20(2) 149ndash158 httpsdoiorg103846139237302013802705
Onder G and Onder E (2014) AHS In E Oumlnder and BF Yildirim (eds) Ccedilok Kriterli Karar Verme Istanbul Dora Yayincilik 21ndash64
Saaty T (1980) The Analytic Process Planning Priority Setting Resources Allocation London McGraw-Hill
Quality Performances of Turkish Contractors
PENERBIT UNIVERSITI SAINS MALAYSIA179
Saaty TL (2008) Decision making with the analytic hierarchy process International Journal of Services Sciences 1(1) 83ndash98 httpsdoiorg101504IJSSCI2008017590
Saaty TL and Vargas LG (2012) Models Methods Concepts and Applications of the Analytic Hierarchy Process BerlinHeidelberg Springer Science and Business Media 175
Timor M (2011) Analitik Hiyerarsi Prosesi Istanbul Turkmen KitabeviTrinkūnienė E Podvezko V Zavadskas EK Jokšienė I Vinogradova I and
Trinkūnas V (2017) Evaluation of quality assurance in contractor contracts by multi-attribute decision-making methods Economic Research ndash Ekonomska Istraživanja 30(1) 1152ndash1180 httpsdoiorg1010801331677X20171325616
Tserng HP and Lin PH (2002) An accelerated subcontracting and procuring model for construction projects Automation in Construction 11(1) 105ndash125 httpsdoiorg101016S0926-5805(01)00056-5
Turkish Contractors Association (TCA) (2018) Turkish Contractors Association Sector Report Ankara TCA
Ulubeyli S Manisali E and Kazaz A (2010) Subcontractor selection practices in international construction projects Journal of Civil Engineering and Management 16(1) 47ndash56 httpsdoiorg103846jcem201004
Vaidya OS and Kumar S (2006) Analytic hierarchy process An overview of applications European Journal of Operational Research 169(1) 1ndash29 httpsdoiorg101016jejor200404028
Ward S Curtis B and Chapman C (1991) Objectives and performance in construction projects Construction Management and Economics 9(4) 343ndash353 httpsdoiorg10108001446199100000027
Yang H Yeung JF Chan AP Chiang Y and Chan DW (2010) A critical review of performance measurement in construction Journal of Facilities Management 8(4) 269ndash284 httpsdoiorg10110814725961011078981
Yasamis-Speroni F Lee D-E and Arditi D (2012) Evaluating the quality performance of pavement contractors Journal of Construction Engineering and Management 138(10) 1114ndash1124 httpsdoiorg101061(ASCE)CO1943-78620000539
Yu I Kim K Jung Y and Chin S (2007) Comparable performance measurement system for construction companies Journal of Management in Engineering 23(3) 131ndash139 httpsdoiorg101061(ASCE)0742-597X(2007)233(131)

Quality Performances of Turkish Contractors
PENERBIT UNIVERSITI SAINS MALAYSIA169
from several alternatives with respect to several criteria (Saaty and Vargas 2012) Fundamentally the AHP method is based on mathematics and psychology and is the application of an Eigenvalue approach to the pairwise comparisons (Vaidya and Kumar 2006) The simplest form of AHP is composed of a hierarchy consisting of three levels (1) The goal of the decision is at the top level (2) Criteria of the goal are in the second level and (3) Alternatives are located in the third level (Saaty and Vargas 2012)
The AHP methodology relies on pairwise comparison of either criteria or alternatives Decision-makers compare criteriaalternative using actual measurements or a fundamental scale to reflect the relative strength of their preferences and feelings In the pairwise comparison matrices the question of How many times the one criterionalternative is more important or dominant over the other criterionalternative with respect to the goalcriterion should be expressed on a scale of 1 to 9 (as shown in Table 2) (Saaty 2008)
Table 2 Saatys Rating Scale
Intensity of Importance Definition Explanation
1 Equal importance Two factors contribute equally to the objective
3 Somewhat more important
Experience and judgement slightly favour one over the other
5 Much more important
Experience and judgement strongly favour one over the other
7 Very much more important
Experience and judgement very strongly favour one over the other
9 Absolutely more important
The evidence favouring one over the other is one of the highest possible validity
2ndash4ndash6ndash8 Intermediate values When compromise is needed
Reciprocal of above nonzero numbers
If the activity i has one of the above nonzero numbers assigned to it when compared with activity j then j has the reciprocal value when compared to i
Source Saaty (2008)
The constructed pairwise comparison matrices are positive and reciprocal (ie a[ ]ij
1 a ji= ) (as shown in Equation 1)
1
1a
1a a
A
a a
a
a
a12
1 2
2a
n n
n
n
nm
11 12
22
1
=h h
g
g
g
g
h
R
T
SSSSSSSSSSSSS
V
X
WWWWWWWWWWWWW
(Eq 1)
Befrin Neval Bingol and Gul Polat
170PENERBIT UNIVERSITI SAINS MALAYSIA
Saaty (1980) proposed to check the inconsistency of judgements with a measure called the Consistency Index (CI) CI is calculated with the following Equation 2
1CI
nnmax= m
-
-^] g
h (Eq 2)
where maxm is the principal eigenvalue of the judgement matrix and n refers to the number of criteria in this matrix The consistencies of decision-makers evaluation are checked with the consistency ratio (CR) The following equation is used to determine this ratio (as shown in Equation 3)
1CI
nnmax= m
-
-^] g
h (Eq 3)
CR depends on both the CI and the random index The random index values determined based on different numbers are provided in Table 3
Table 3 Random Index
number of Items random Index number of Items random Index
1 0 6 124
2 0 7 132
3 058 8 141
4 090 9 145
5 141 10 149
Source Timor (2011)
The value of CR for comparison matrices should be less than 01 to provide consistency of the decision-maker If not the results of the pairwise comparison need to be re-evaluated to improve consistency
In most real-life decision-making problems decisions are made by several decision makers AHP is a convenient method to be used in group decision making There are two different approaches for combining individual judgements which include (1) aggregating individual judgements and (2) aggregating individual priorities (Escobar Aguaroacuten and Moreno-Jimeacutenez 2004) The weighted geometric mean and the row geometric mean methods are used for combining group decision (Escobar Aguaroacuten and Moreno-Jimeacutenez 2004) According to Saaty (2008) taking the geometric mean of individual judgements is the best way to convert individual preferences into a group decision Usage of 1 to 9 rating scale for individual judgements mainly result in preferring the geometric mean to reach a group decision (Timor 2011 Onder and Onder 2014)
When the individual judgements of the decision-makers are combined with the weighted geometric mean method the final priority is computed via Equation 4
ww ( )ijG
ijd
k 1
m k=
=
m^ h (Eq 4)
Quality Performances of Turkish Contractors
PENERBIT UNIVERSITI SAINS MALAYSIA171
where wijG represents group decision computed with the weighted geometric
mean m represent the number of decision-makers represents the decision matrix of the decision-maker and λk represents the weight of decision-maker
AnALYSIS And FIndInGS
Characteristics of the Interviewed Companies
Out of 27 Turkish contractors 11 accepted to participate in face-to-face interviews corresponding to a response rate of 4074 Interviews were conducted with 11 civil engineers who were in charge of subcontractor evaluation and selection process In these interviews seven questions were asked to reveal the general characteristics of the interviewed companies The findings of the general characteristics of the companies were summarised in Table 4
Table 4 Demographic Characteristics of 11 Contractors
demographic Characteristics N Valid
Experience in the industry 1 to 5 years ndash ndash
6 to 10 years ndash ndash
11 to 15 years ndash ndash
16 to 20 years 2 182
21 to 25 years 3 273
26 to 30 years ndash ndash
gt 30 years 6 545
Total 11 100
Membership of TCA Member 11 100
Not a Member 0 0
Total 11 100
Roles of respondent companies General contractor 11 100
Subcontractor 1 91
Partner of the consortium 1 91
Member of a joint venture 3 273
Consultant companies ndash ndash
Others ndash ndash
The markets that the respondent companies operate predominantly
National (Domestic) ndash ndash
International 8 727
Equally on national and international markets
3 273
(continued on next page)
Befrin Neval Bingol and Gul Polat
172PENERBIT UNIVERSITI SAINS MALAYSIA
demographic Characteristics N Valid
Expertise areas Commercial buildings 7 636
Industrial buildings 7 636
Residential buildings 5 455
Infrastructure and transportation structures
7 636
Others 2 182
Percentages of work capacity transferred to subcontractors
1 to 25 1 91
26 to 50 4 364
51 to 75 5 455
76 to 100 1 91
Total 11 100
Experience of the respondents in the interviewed companies
1 to 4 years 1 909
5 to 9 years 2 1818
10 to 14 years ndash ndash
15 to 19 years 2 1818
20 to 24 years 3 2727
25 to 29 years 2 1818
30 to 34 years ndash ndash
gt 34 years 1 909
Total 11 100
According to the data obtained in the interviews out of the 11 contractors 5454 have 16 to 20 years of experience in the sector while 2727 have six to 10 years and 1818 have one to five years of experience It is observed that 100 of the respondent companies are general contractors where 91 of them are subcontractors 273 of them are a member of joint ventures and 91 are consultant companies in the undertaken projects On the other hand among 11 companies eight (727) were operating only in international markets and three (273) were operating in both national and international markets Based on the responses received from the companies 636 of them are specialised in commercial buildings industrial buildings and infrastructure-transport structures while 455 of them are specialised in residential buildings and 182 of them are specialised in other types of projects Findings revealed that 455 of the companies sublet 51 to 75 of the total work capacity to the subcontractor companies 364 of them sublet 26 to 50 of the total work capacity 91 of them sublet 1 to 25 of the total work capacity and 76 to 100 of the work capacity to the subcontractor companies
Table 4 (continued)
Quality Performances of Turkish Contractors
PENERBIT UNIVERSITI SAINS MALAYSIA173
Group decision on the Weights of the Most Important KPIs (Qs)
Respondents are strategically competitors and the individual preferences of these 11 companies have been taken one by one and then were combined to reach a group decision for the proposed framework The AHP method was applied to determine the weights of the nine KPIs in the quality performance measurement framework In the interviews Saatys (2008) rating scale was used to calculate the relative importance of these nine KPIs
In this step first 11 pairwise comparison matrices were built to understand the individual judgements of each company the weights of nine KPIs in each company were calculated and the consistency index of each comparison matrix was checked (as shown in Table 5)
Then the individual matrices were aggregated using the weighted geometric mean method into a single matrix to reach a group decision (using Equation 4) and the consistency index of the aggregated pairwise comparison matrix was checked The aggregated individual priorities are presented in Table 6 and the aggregated weights of nine KPIs are shown in the last column of Table 5
According to the findings displayed in Table 5 Construction quality (conformance to the specification) (Q4) is the most effective indicator with the weight of 024009 in the developed framework This indicator is followed by The quality of workmanship (Q5) with the weight of 017890 Application-level of the quality management system in projects (Q2) with the weight of 011874 and The audit of the quality management system in project-level (Q3) with the weight of 009979 On the other hand the least effective indicator in the framework is Number of reworks (Q7) with the weight of 005634
development of the Quality Performance Measurement Framework
The proposed quality performance measurement framework consists of three steps which are (1) inputs (2) process and (3) output (as shown in Figure 2)
Figure 2 Framework for Measuring Quality Performance of Subcontractors
Befrin Neval Bingol and Gul Polat
174PENERBIT UNIVERSITI SAINS MALAYSIA
Tabl
e 5
Ind
ivid
ual P
riorit
ies o
f Nin
e KP
Is A
ccor
din
g to
the
11 T
urki
sh G
ener
al C
ontra
ctor
Com
pani
es
wGC
1w
GC
2w
GC
3w
GC
4w
GC
5w
GC
6w
GC
7w
GC
8w
GC
9w
GC10
wGC
11wQG
1
Q1
010
252
010
673
007
935
010
000
027
167
010
605
005
593
008
900
004
907
004
901
002
712
008
881
Q2
010
252
022
065
010
146
010
000
008
751
010
605
005
593
008
900
015
056
004
901
025
479
011
880
Q3
010
252
015
801
014
647
010
000
008
751
010
605
009
904
006
572
015
056
004
901
002
712
009
960
Q4
018
472
015
801
028
382
020
000
027
168
019
915
037
413
013
802
022
251
026
073
017
534
024
070
Q5
018
472
007
485
022
584
020
000
016
496
010
605
028
481
013
802
015
056
026
073
010
653
017
886
Q6
010
252
010
673
005
088
010
000
002
917
010
605
003
254
018
842
002
096
009
416
002
654
006
956
Q7
010
252
005
009
002
669
010
000
002
917
005
853
003
254
001
617
008
525
004
901
010
361
005
623
Q8
006
700
005
009
005
088
005
000
002
917
010
605
003
254
008
724
008
525
009
416
017
534
007
377
Q9
005
096
007
485
003
462
005
000
002
917
010
605
003
254
018
842
008
525
009
416
010
361
007
368
CR
000
890
001
700
001
290
000
000
000
110
000
370
000
900
001
850
000
770
000
090
000
600
Tabl
e 6
An
Agg
rega
ted
Pai
rwise
Com
paris
on M
atrix
of 1
1 Tu
rkish
Con
tract
ors
Q1
Q2
Q3
Q4
Q5
Q6
Q7
Q8
Q9
Q1
10
722
088
160
3537
049
071
3493
158
811
2535
122
11
Q2
138
511
122
110
4847
062
161
7152
204
331
6733
163
01
Q3
113
430
8189
10
4012
053
571
5121
180
81
3493
138
51
Q4
282
72
063
249
221
155
443
3114
389
713
076
301
42
Q5
203
811
6086
186
690
6433
12
5126
332
712
4922
235
04
Q6
074
110
583
066
130
302
039
81
122
110
9638
1
Q7
062
970
4894
055
310
2566
030
060
8189
10
7616
072
2
Q8
079
780
5976
074
110
3251
040
121
0375
131
31
106
5
Q9
081
890
6134
072
20
3318
042
551
138
510
9389
1
Quality Performances of Turkish Contractors
PENERBIT UNIVERSITI SAINS MALAYSIA175
Inputs of the framework include group decision on the weights of the most important KPIs (Qs) which are obtained from AHP calculations measurement scales for each KPI the direction of preference of each KPI (minimum is the most favourable or maximum is the most favourable) and the evaluations of all candidate subcontractors with respect to each KPI
Having determined the inputs values in the process step the performance scores (q) of all candidate subcontractors are calculated by normalising the evaluations concerning each KPI considering the direction of preference If the direction of preference is maximum the quantitative equivalence of the evaluation of a subcontractor candidate for any KPI is divided by the sum of the evaluations of all subcontractors to the KPI in question On the other hand if the direction of preference is minimum the reciprocals of the quantitative equivalences of the evaluations are normalised By this way the subcontractor candidate with the minimum value becomes more favourable
In the output step the overall quality performance index (QPI) of each subcontractor candidate can be calculated using Equation 5
QPI w q1
9
SC iG
iim m=
= (Eq 5)
Where QPISCm represents the overall QPI of the mth subcontractor wiG represents
the aggregated weight of the ith KPI (Qi) based on group decision and qim represents the performance score of the mth subcontractor candidate for the ith KPI (Qi)
An Illustrative Example of the Application of the Proposed Quality Performance Measurement Framework
An illustrative example has been presented to demonstrate how the proposed framework can be used by a Turkish general contractor who intends to evaluate the quality performances of the subcontractor candidates under consideration for an international construction project
In the illustrative example (as shown in Table 7) there are five subcontractor candidates First the general contractor determines the measurement scales for each KPI identifies the direction of preference of each KPI and evaluates all candidate subcontractors for each KPI based on the identified measurement scale The weights of the KPIs are obtained from the AHP calculations presented in the last column of Table 5 Second the general contractor calculates the performance scores (q) of all candidate subcontractors And finally the general contractor computes the overall QPI of all candidate subcontractors In the illustrative example the overall quality performance of the fourth subcontractor candidate (SC_4) is higher than the other candidates
Befrin Neval Bingol and Gul Polat
176PENERBIT UNIVERSITI SAINS MALAYSIA
Tabl
e 7
An
Illust
rativ
e Ex
ampl
e of
the
App
licat
ion
of th
e Pr
opos
ed F
ram
ewor
k
Q
Q D
efini
tion
Mea
sure
men
t Sc
ales
dire
ctio
n of
Pr
efer
ence
sW
eigh
tsEv
alua
tions
of S
ubco
ntra
ctor
Can
dida
tes
Qua
lity
Scor
es o
f Sub
cont
ract
or C
andi
date
s
SC_1
SC_2
SC_3
SC_4
SC_5
q_1
q_2
q_3
q_4
q_5
Q1
Ad
equa
cy o
f qu
ality
ass
uran
ce
polic
y
VBndash
VG
2M
ax
008
881
GV
GM
GV
G0
190
023
80
143
019
00
238
Q2
The
appl
icat
ion
leve
l of t
he q
ualit
y m
anag
emen
t sy
stem
in p
roje
cts
VBndash
VG
Max
0
1188
0G
MM
MG
023
50
176
017
60
176
023
5
Q3
The
aud
it of
th
e qu
ality
m
anag
emen
t sy
stem
in p
roje
ct
leve
l
VBndash
VG
Max
0
0996
0M
GG
VG
M0
158
021
10
211
026
30
158
Q4
Con
stru
ctio
n qu
ality
(c
onfo
rman
ce to
th
e sp
ecifi
catio
n)
VBndash
VG
Max
0
2407
0G
VG
GM
G0
200
025
00
200
015
00
200
Q5
The
qual
ity o
f w
orkm
ansh
ipV
BndashV
GM
ax
017
886
VG
MV
GG
M0
250
015
00
250
020
00
150
Q6
The
cost
of
poor
qua
lity
resu
lting
from
th
e lo
w st
and
ard
pr
oduc
tion
M
in
006
956
12
29
21
11
10
234
009
70
134
028
10
255
Q7
Num
ber o
f rew
orks
Num
ber
Min
0
0562
314
98
411
011
00
171
019
30
386
014
0
Q8
Perc
enta
ge o
f re
wor
ks (
)
Min
0
0737
73
24
44
11
83
30
190
013
80
149
033
80
185
Q9
The
seve
rity
of
def
ect a
t the
co
nstru
ctio
n ph
ase
VLndash
VH
3M
in
007
368
MH
MV
HH
024
40
183
024
40
146
018
3
QPI
020
80
190
019
70
213
019
3
Not
es V
B =
Ver
y Ba
d (1
) B
= Ba
d (2
) M
= M
ediu
m (3
) G
= G
ood
(4)
VG
= V
ery
Goo
d (5
) V
L =
Ver
y Lo
w (1
) L
= Lo
w (2
) M
= M
ediu
m (3
) H
= Hi
gh (4
) V
H =
Ver
y Hi
gh (5
)
Quality Performances of Turkish Contractors
PENERBIT UNIVERSITI SAINS MALAYSIA177
ConCLuSIon
Since most of the international construction projects are highly complex in nature they require the involvement of multiple subcontractors therefore the selection of the most appropriate subcontractor becomes crucial for the overall project success The subcontractor selection process is mostly affected by several compromising and conflicting tangible and intangible criteria While the criteria like cost and time can be numerically measured the criteria like safety and quality cannot be easily measured This study aimed to solve this issue by developing a framework for measuring the quality performances of subcontractor candidates more systematically and rationally way To use the proposed framework subcontractor candidates should be assessed based on the identified nine KPIs After these assessments the quality performance of the candidates can be determined using the proposed framework The measurement framework includes indicators that can be measured quantitatively and qualitatively
The limitations of this study are related to the developed framework relying on the individual preferences of the 11 Turkish companies that are also the target users This potential limitation can be overcome by increasing the sample size Moreover the performance of the proposed framework should be tested with real cases
rEFErEnCES
Ali HAEM Al-Sulaihi IA and Al-Gahtani KS (2013) Indicators for measuring performance of building construction companies in Kingdom of Saudi Arabia Journal of King Saud University ndash Engineering Sciences 25(2) 125ndash134 httpsdoiorg101016jjksues201203002
Arslan G Kivrak S Birgonul MT and Dikmen I (2008) Improving sub-contractor selection process in construction projects Web-based sub-contractor evaluation system (WEBSES) Automation in Construction 17(4) 480ndash488 httpsdoiorg101016jautcon200708004
Bingol BN and Polat G (2016) Measuring quality performances of subcontractors using key performance indicators (KPIs) model Paper presented at the 12th International Congress on Advances in Civil Engineering Istanbul Turkey 21ndash23 September
Chan APC and Chan APL (2004) Key performance indicators for measuring construction success Benchmarking An International Journal 11(2) 203ndash221 httpsdoiorg10110814635770410532624
Chen Y Okudan GE and Riley DR (2010) Sustainable performance criteria for construction method selection in concrete buildings Automation in Construction 19(2) 235ndash244 httpsdoiorg101016jautcon200910004
Choudhry RM Hinze JW Arshad M and Gabriel HF (2012) Subcontracting practices in the construction industry of Pakistan Journal of Construction Engineering and Management 138(12) 1353ndash1359 httpsdoiorg101061(ASCE)CO1943-78620000562
El-Mashaleh MS (2009) A construction subcontractor selection model Jordan Journal of Civil Engineering 3(4) 375ndash383
Enshassi A Choudhry RM Mayer PE and Shoman Y (2008) Safety performance of subcontractors in the Palestinian construction industry Journal of Construction in Developing Countries 13(1) 51ndash62
Befrin Neval Bingol and Gul Polat
178PENERBIT UNIVERSITI SAINS MALAYSIA
Enshassi A Mohamed S and Abushaban S (2009) Factors affecting the performance of construction projects in the Gaza strip Journal of Civil Engineering and Management 15(3) 269ndash280 httpsdoiorg1038461392-3730200915269-280
Escobar MT Aguaroacuten J and Moreno-Jimeacutenez JM (2004) A note on AHP group consistency for the row geometric mean priorization procedure European Journal of Operational Research 153(2) 318ndash322 httpsdoiorg101016S0377-2217(03)00154-1
Field A (2017) Discovering Statistics Using IBM SPSS Statistics North American Edition Thousand Oaks CA SAGE
Hartmann A Ling FYY and Tan JS (2009) Relative importance of subcontractor selection criteria Evidence from Singapore Journal of Construction Engineering and Management 135(9) 826ndash832 httpsdoiorg101061(ASCE)0733-9364(2009)1359(826)
Hatush Z and Skitmore M (1997) Criteria for contractor selection Construction Management and Economics 15(1) 19ndash38 httpsdoiorg101080014461997373088
Kagioglou M Cooper R and Aouad G (2001) Performance management in construction A conceptual framework Construction Management and Economics 19(1) 85ndash95 httpsdoiorg10108001446190010003425
Lee A Cooper R and Aouad G (2000) A methodology for designing performance measures for the UK construction industry Paper presented at the Bizarre Fruit 2000 Postgraduate Research Conference on the Built and Human Environment University of Salford Salford UK 9ndash10 March
Lin G and Shen Q (2007) Measuring the performance of value management studies in construction Critical review Journal of Management in Engineering 23(1) 2ndash9 httpsdoiorg101061(ASCE)0742-597X(2007)231(2)
Luu VT Kim S-Y and Huynh T-A (2008) Improving project management performance of large contractors using benchmarking approach International Journal of Project Management 26(7) 758ndash769 httpsdoiorg 101016jijproman200710002
Mahdi IM Riley MJ Fereig SM and Alex AP (2002) A multi-criteria approach to contractor selection Engineering Construction and Architectural Management 9(1) 29ndash37 httpsdoiorg101108eb021204
Marzouk MM El Kherbawy AA and Khalifa M (2013) Factors influencing sub-contractors selection in construction projects HBRC Journal 9(2) 150ndash158 httpsdoiorg101016jhbrcj201305001
Mbachu J (2008) Conceptual framework for the assessment of subcontractors eligibility and performance in the construction industry Construction Management and Economics 26(5) 471ndash484 httpsdoiorg10108001446190801918730
Ng ST and Skitmore M (2014) Developing a framework for subcontractor appraisal using a balanced scorecard Journal of Civil Engineering and Management 20(2) 149ndash158 httpsdoiorg103846139237302013802705
Onder G and Onder E (2014) AHS In E Oumlnder and BF Yildirim (eds) Ccedilok Kriterli Karar Verme Istanbul Dora Yayincilik 21ndash64
Saaty T (1980) The Analytic Process Planning Priority Setting Resources Allocation London McGraw-Hill
Quality Performances of Turkish Contractors
PENERBIT UNIVERSITI SAINS MALAYSIA179
Saaty TL (2008) Decision making with the analytic hierarchy process International Journal of Services Sciences 1(1) 83ndash98 httpsdoiorg101504IJSSCI2008017590
Saaty TL and Vargas LG (2012) Models Methods Concepts and Applications of the Analytic Hierarchy Process BerlinHeidelberg Springer Science and Business Media 175
Timor M (2011) Analitik Hiyerarsi Prosesi Istanbul Turkmen KitabeviTrinkūnienė E Podvezko V Zavadskas EK Jokšienė I Vinogradova I and
Trinkūnas V (2017) Evaluation of quality assurance in contractor contracts by multi-attribute decision-making methods Economic Research ndash Ekonomska Istraživanja 30(1) 1152ndash1180 httpsdoiorg1010801331677X20171325616
Tserng HP and Lin PH (2002) An accelerated subcontracting and procuring model for construction projects Automation in Construction 11(1) 105ndash125 httpsdoiorg101016S0926-5805(01)00056-5
Turkish Contractors Association (TCA) (2018) Turkish Contractors Association Sector Report Ankara TCA
Ulubeyli S Manisali E and Kazaz A (2010) Subcontractor selection practices in international construction projects Journal of Civil Engineering and Management 16(1) 47ndash56 httpsdoiorg103846jcem201004
Vaidya OS and Kumar S (2006) Analytic hierarchy process An overview of applications European Journal of Operational Research 169(1) 1ndash29 httpsdoiorg101016jejor200404028
Ward S Curtis B and Chapman C (1991) Objectives and performance in construction projects Construction Management and Economics 9(4) 343ndash353 httpsdoiorg10108001446199100000027
Yang H Yeung JF Chan AP Chiang Y and Chan DW (2010) A critical review of performance measurement in construction Journal of Facilities Management 8(4) 269ndash284 httpsdoiorg10110814725961011078981
Yasamis-Speroni F Lee D-E and Arditi D (2012) Evaluating the quality performance of pavement contractors Journal of Construction Engineering and Management 138(10) 1114ndash1124 httpsdoiorg101061(ASCE)CO1943-78620000539
Yu I Kim K Jung Y and Chin S (2007) Comparable performance measurement system for construction companies Journal of Management in Engineering 23(3) 131ndash139 httpsdoiorg101061(ASCE)0742-597X(2007)233(131)

Befrin Neval Bingol and Gul Polat
170PENERBIT UNIVERSITI SAINS MALAYSIA
Saaty (1980) proposed to check the inconsistency of judgements with a measure called the Consistency Index (CI) CI is calculated with the following Equation 2
1CI
nnmax= m
-
-^] g
h (Eq 2)
where maxm is the principal eigenvalue of the judgement matrix and n refers to the number of criteria in this matrix The consistencies of decision-makers evaluation are checked with the consistency ratio (CR) The following equation is used to determine this ratio (as shown in Equation 3)
1CI
nnmax= m
-
-^] g
h (Eq 3)
CR depends on both the CI and the random index The random index values determined based on different numbers are provided in Table 3
Table 3 Random Index
number of Items random Index number of Items random Index
1 0 6 124
2 0 7 132
3 058 8 141
4 090 9 145
5 141 10 149
Source Timor (2011)
The value of CR for comparison matrices should be less than 01 to provide consistency of the decision-maker If not the results of the pairwise comparison need to be re-evaluated to improve consistency
In most real-life decision-making problems decisions are made by several decision makers AHP is a convenient method to be used in group decision making There are two different approaches for combining individual judgements which include (1) aggregating individual judgements and (2) aggregating individual priorities (Escobar Aguaroacuten and Moreno-Jimeacutenez 2004) The weighted geometric mean and the row geometric mean methods are used for combining group decision (Escobar Aguaroacuten and Moreno-Jimeacutenez 2004) According to Saaty (2008) taking the geometric mean of individual judgements is the best way to convert individual preferences into a group decision Usage of 1 to 9 rating scale for individual judgements mainly result in preferring the geometric mean to reach a group decision (Timor 2011 Onder and Onder 2014)
When the individual judgements of the decision-makers are combined with the weighted geometric mean method the final priority is computed via Equation 4
ww ( )ijG
ijd
k 1
m k=
=
m^ h (Eq 4)
Quality Performances of Turkish Contractors
PENERBIT UNIVERSITI SAINS MALAYSIA171
where wijG represents group decision computed with the weighted geometric
mean m represent the number of decision-makers represents the decision matrix of the decision-maker and λk represents the weight of decision-maker
AnALYSIS And FIndInGS
Characteristics of the Interviewed Companies
Out of 27 Turkish contractors 11 accepted to participate in face-to-face interviews corresponding to a response rate of 4074 Interviews were conducted with 11 civil engineers who were in charge of subcontractor evaluation and selection process In these interviews seven questions were asked to reveal the general characteristics of the interviewed companies The findings of the general characteristics of the companies were summarised in Table 4
Table 4 Demographic Characteristics of 11 Contractors
demographic Characteristics N Valid
Experience in the industry 1 to 5 years ndash ndash
6 to 10 years ndash ndash
11 to 15 years ndash ndash
16 to 20 years 2 182
21 to 25 years 3 273
26 to 30 years ndash ndash
gt 30 years 6 545
Total 11 100
Membership of TCA Member 11 100
Not a Member 0 0
Total 11 100
Roles of respondent companies General contractor 11 100
Subcontractor 1 91
Partner of the consortium 1 91
Member of a joint venture 3 273
Consultant companies ndash ndash
Others ndash ndash
The markets that the respondent companies operate predominantly
National (Domestic) ndash ndash
International 8 727
Equally on national and international markets
3 273
(continued on next page)
Befrin Neval Bingol and Gul Polat
172PENERBIT UNIVERSITI SAINS MALAYSIA
demographic Characteristics N Valid
Expertise areas Commercial buildings 7 636
Industrial buildings 7 636
Residential buildings 5 455
Infrastructure and transportation structures
7 636
Others 2 182
Percentages of work capacity transferred to subcontractors
1 to 25 1 91
26 to 50 4 364
51 to 75 5 455
76 to 100 1 91
Total 11 100
Experience of the respondents in the interviewed companies
1 to 4 years 1 909
5 to 9 years 2 1818
10 to 14 years ndash ndash
15 to 19 years 2 1818
20 to 24 years 3 2727
25 to 29 years 2 1818
30 to 34 years ndash ndash
gt 34 years 1 909
Total 11 100
According to the data obtained in the interviews out of the 11 contractors 5454 have 16 to 20 years of experience in the sector while 2727 have six to 10 years and 1818 have one to five years of experience It is observed that 100 of the respondent companies are general contractors where 91 of them are subcontractors 273 of them are a member of joint ventures and 91 are consultant companies in the undertaken projects On the other hand among 11 companies eight (727) were operating only in international markets and three (273) were operating in both national and international markets Based on the responses received from the companies 636 of them are specialised in commercial buildings industrial buildings and infrastructure-transport structures while 455 of them are specialised in residential buildings and 182 of them are specialised in other types of projects Findings revealed that 455 of the companies sublet 51 to 75 of the total work capacity to the subcontractor companies 364 of them sublet 26 to 50 of the total work capacity 91 of them sublet 1 to 25 of the total work capacity and 76 to 100 of the work capacity to the subcontractor companies
Table 4 (continued)
Quality Performances of Turkish Contractors
PENERBIT UNIVERSITI SAINS MALAYSIA173
Group decision on the Weights of the Most Important KPIs (Qs)
Respondents are strategically competitors and the individual preferences of these 11 companies have been taken one by one and then were combined to reach a group decision for the proposed framework The AHP method was applied to determine the weights of the nine KPIs in the quality performance measurement framework In the interviews Saatys (2008) rating scale was used to calculate the relative importance of these nine KPIs
In this step first 11 pairwise comparison matrices were built to understand the individual judgements of each company the weights of nine KPIs in each company were calculated and the consistency index of each comparison matrix was checked (as shown in Table 5)
Then the individual matrices were aggregated using the weighted geometric mean method into a single matrix to reach a group decision (using Equation 4) and the consistency index of the aggregated pairwise comparison matrix was checked The aggregated individual priorities are presented in Table 6 and the aggregated weights of nine KPIs are shown in the last column of Table 5
According to the findings displayed in Table 5 Construction quality (conformance to the specification) (Q4) is the most effective indicator with the weight of 024009 in the developed framework This indicator is followed by The quality of workmanship (Q5) with the weight of 017890 Application-level of the quality management system in projects (Q2) with the weight of 011874 and The audit of the quality management system in project-level (Q3) with the weight of 009979 On the other hand the least effective indicator in the framework is Number of reworks (Q7) with the weight of 005634
development of the Quality Performance Measurement Framework
The proposed quality performance measurement framework consists of three steps which are (1) inputs (2) process and (3) output (as shown in Figure 2)
Figure 2 Framework for Measuring Quality Performance of Subcontractors
Befrin Neval Bingol and Gul Polat
174PENERBIT UNIVERSITI SAINS MALAYSIA
Tabl
e 5
Ind
ivid
ual P
riorit
ies o
f Nin
e KP
Is A
ccor
din
g to
the
11 T
urki
sh G
ener
al C
ontra
ctor
Com
pani
es
wGC
1w
GC
2w
GC
3w
GC
4w
GC
5w
GC
6w
GC
7w
GC
8w
GC
9w
GC10
wGC
11wQG
1
Q1
010
252
010
673
007
935
010
000
027
167
010
605
005
593
008
900
004
907
004
901
002
712
008
881
Q2
010
252
022
065
010
146
010
000
008
751
010
605
005
593
008
900
015
056
004
901
025
479
011
880
Q3
010
252
015
801
014
647
010
000
008
751
010
605
009
904
006
572
015
056
004
901
002
712
009
960
Q4
018
472
015
801
028
382
020
000
027
168
019
915
037
413
013
802
022
251
026
073
017
534
024
070
Q5
018
472
007
485
022
584
020
000
016
496
010
605
028
481
013
802
015
056
026
073
010
653
017
886
Q6
010
252
010
673
005
088
010
000
002
917
010
605
003
254
018
842
002
096
009
416
002
654
006
956
Q7
010
252
005
009
002
669
010
000
002
917
005
853
003
254
001
617
008
525
004
901
010
361
005
623
Q8
006
700
005
009
005
088
005
000
002
917
010
605
003
254
008
724
008
525
009
416
017
534
007
377
Q9
005
096
007
485
003
462
005
000
002
917
010
605
003
254
018
842
008
525
009
416
010
361
007
368
CR
000
890
001
700
001
290
000
000
000
110
000
370
000
900
001
850
000
770
000
090
000
600
Tabl
e 6
An
Agg
rega
ted
Pai
rwise
Com
paris
on M
atrix
of 1
1 Tu
rkish
Con
tract
ors
Q1
Q2
Q3
Q4
Q5
Q6
Q7
Q8
Q9
Q1
10
722
088
160
3537
049
071
3493
158
811
2535
122
11
Q2
138
511
122
110
4847
062
161
7152
204
331
6733
163
01
Q3
113
430
8189
10
4012
053
571
5121
180
81
3493
138
51
Q4
282
72
063
249
221
155
443
3114
389
713
076
301
42
Q5
203
811
6086
186
690
6433
12
5126
332
712
4922
235
04
Q6
074
110
583
066
130
302
039
81
122
110
9638
1
Q7
062
970
4894
055
310
2566
030
060
8189
10
7616
072
2
Q8
079
780
5976
074
110
3251
040
121
0375
131
31
106
5
Q9
081
890
6134
072
20
3318
042
551
138
510
9389
1
Quality Performances of Turkish Contractors
PENERBIT UNIVERSITI SAINS MALAYSIA175
Inputs of the framework include group decision on the weights of the most important KPIs (Qs) which are obtained from AHP calculations measurement scales for each KPI the direction of preference of each KPI (minimum is the most favourable or maximum is the most favourable) and the evaluations of all candidate subcontractors with respect to each KPI
Having determined the inputs values in the process step the performance scores (q) of all candidate subcontractors are calculated by normalising the evaluations concerning each KPI considering the direction of preference If the direction of preference is maximum the quantitative equivalence of the evaluation of a subcontractor candidate for any KPI is divided by the sum of the evaluations of all subcontractors to the KPI in question On the other hand if the direction of preference is minimum the reciprocals of the quantitative equivalences of the evaluations are normalised By this way the subcontractor candidate with the minimum value becomes more favourable
In the output step the overall quality performance index (QPI) of each subcontractor candidate can be calculated using Equation 5
QPI w q1
9
SC iG
iim m=
= (Eq 5)
Where QPISCm represents the overall QPI of the mth subcontractor wiG represents
the aggregated weight of the ith KPI (Qi) based on group decision and qim represents the performance score of the mth subcontractor candidate for the ith KPI (Qi)
An Illustrative Example of the Application of the Proposed Quality Performance Measurement Framework
An illustrative example has been presented to demonstrate how the proposed framework can be used by a Turkish general contractor who intends to evaluate the quality performances of the subcontractor candidates under consideration for an international construction project
In the illustrative example (as shown in Table 7) there are five subcontractor candidates First the general contractor determines the measurement scales for each KPI identifies the direction of preference of each KPI and evaluates all candidate subcontractors for each KPI based on the identified measurement scale The weights of the KPIs are obtained from the AHP calculations presented in the last column of Table 5 Second the general contractor calculates the performance scores (q) of all candidate subcontractors And finally the general contractor computes the overall QPI of all candidate subcontractors In the illustrative example the overall quality performance of the fourth subcontractor candidate (SC_4) is higher than the other candidates
Befrin Neval Bingol and Gul Polat
176PENERBIT UNIVERSITI SAINS MALAYSIA
Tabl
e 7
An
Illust
rativ
e Ex
ampl
e of
the
App
licat
ion
of th
e Pr
opos
ed F
ram
ewor
k
Q
Q D
efini
tion
Mea
sure
men
t Sc
ales
dire
ctio
n of
Pr
efer
ence
sW
eigh
tsEv
alua
tions
of S
ubco
ntra
ctor
Can
dida
tes
Qua
lity
Scor
es o
f Sub
cont
ract
or C
andi
date
s
SC_1
SC_2
SC_3
SC_4
SC_5
q_1
q_2
q_3
q_4
q_5
Q1
Ad
equa
cy o
f qu
ality
ass
uran
ce
polic
y
VBndash
VG
2M
ax
008
881
GV
GM
GV
G0
190
023
80
143
019
00
238
Q2
The
appl
icat
ion
leve
l of t
he q
ualit
y m
anag
emen
t sy
stem
in p
roje
cts
VBndash
VG
Max
0
1188
0G
MM
MG
023
50
176
017
60
176
023
5
Q3
The
aud
it of
th
e qu
ality
m
anag
emen
t sy
stem
in p
roje
ct
leve
l
VBndash
VG
Max
0
0996
0M
GG
VG
M0
158
021
10
211
026
30
158
Q4
Con
stru
ctio
n qu
ality
(c
onfo
rman
ce to
th
e sp
ecifi
catio
n)
VBndash
VG
Max
0
2407
0G
VG
GM
G0
200
025
00
200
015
00
200
Q5
The
qual
ity o
f w
orkm
ansh
ipV
BndashV
GM
ax
017
886
VG
MV
GG
M0
250
015
00
250
020
00
150
Q6
The
cost
of
poor
qua
lity
resu
lting
from
th
e lo
w st
and
ard
pr
oduc
tion
M
in
006
956
12
29
21
11
10
234
009
70
134
028
10
255
Q7
Num
ber o
f rew
orks
Num
ber
Min
0
0562
314
98
411
011
00
171
019
30
386
014
0
Q8
Perc
enta
ge o
f re
wor
ks (
)
Min
0
0737
73
24
44
11
83
30
190
013
80
149
033
80
185
Q9
The
seve
rity
of
def
ect a
t the
co
nstru
ctio
n ph
ase
VLndash
VH
3M
in
007
368
MH
MV
HH
024
40
183
024
40
146
018
3
QPI
020
80
190
019
70
213
019
3
Not
es V
B =
Ver
y Ba
d (1
) B
= Ba
d (2
) M
= M
ediu
m (3
) G
= G
ood
(4)
VG
= V
ery
Goo
d (5
) V
L =
Ver
y Lo
w (1
) L
= Lo
w (2
) M
= M
ediu
m (3
) H
= Hi
gh (4
) V
H =
Ver
y Hi
gh (5
)
Quality Performances of Turkish Contractors
PENERBIT UNIVERSITI SAINS MALAYSIA177
ConCLuSIon
Since most of the international construction projects are highly complex in nature they require the involvement of multiple subcontractors therefore the selection of the most appropriate subcontractor becomes crucial for the overall project success The subcontractor selection process is mostly affected by several compromising and conflicting tangible and intangible criteria While the criteria like cost and time can be numerically measured the criteria like safety and quality cannot be easily measured This study aimed to solve this issue by developing a framework for measuring the quality performances of subcontractor candidates more systematically and rationally way To use the proposed framework subcontractor candidates should be assessed based on the identified nine KPIs After these assessments the quality performance of the candidates can be determined using the proposed framework The measurement framework includes indicators that can be measured quantitatively and qualitatively
The limitations of this study are related to the developed framework relying on the individual preferences of the 11 Turkish companies that are also the target users This potential limitation can be overcome by increasing the sample size Moreover the performance of the proposed framework should be tested with real cases
rEFErEnCES
Ali HAEM Al-Sulaihi IA and Al-Gahtani KS (2013) Indicators for measuring performance of building construction companies in Kingdom of Saudi Arabia Journal of King Saud University ndash Engineering Sciences 25(2) 125ndash134 httpsdoiorg101016jjksues201203002
Arslan G Kivrak S Birgonul MT and Dikmen I (2008) Improving sub-contractor selection process in construction projects Web-based sub-contractor evaluation system (WEBSES) Automation in Construction 17(4) 480ndash488 httpsdoiorg101016jautcon200708004
Bingol BN and Polat G (2016) Measuring quality performances of subcontractors using key performance indicators (KPIs) model Paper presented at the 12th International Congress on Advances in Civil Engineering Istanbul Turkey 21ndash23 September
Chan APC and Chan APL (2004) Key performance indicators for measuring construction success Benchmarking An International Journal 11(2) 203ndash221 httpsdoiorg10110814635770410532624
Chen Y Okudan GE and Riley DR (2010) Sustainable performance criteria for construction method selection in concrete buildings Automation in Construction 19(2) 235ndash244 httpsdoiorg101016jautcon200910004
Choudhry RM Hinze JW Arshad M and Gabriel HF (2012) Subcontracting practices in the construction industry of Pakistan Journal of Construction Engineering and Management 138(12) 1353ndash1359 httpsdoiorg101061(ASCE)CO1943-78620000562
El-Mashaleh MS (2009) A construction subcontractor selection model Jordan Journal of Civil Engineering 3(4) 375ndash383
Enshassi A Choudhry RM Mayer PE and Shoman Y (2008) Safety performance of subcontractors in the Palestinian construction industry Journal of Construction in Developing Countries 13(1) 51ndash62
Befrin Neval Bingol and Gul Polat
178PENERBIT UNIVERSITI SAINS MALAYSIA
Enshassi A Mohamed S and Abushaban S (2009) Factors affecting the performance of construction projects in the Gaza strip Journal of Civil Engineering and Management 15(3) 269ndash280 httpsdoiorg1038461392-3730200915269-280
Escobar MT Aguaroacuten J and Moreno-Jimeacutenez JM (2004) A note on AHP group consistency for the row geometric mean priorization procedure European Journal of Operational Research 153(2) 318ndash322 httpsdoiorg101016S0377-2217(03)00154-1
Field A (2017) Discovering Statistics Using IBM SPSS Statistics North American Edition Thousand Oaks CA SAGE
Hartmann A Ling FYY and Tan JS (2009) Relative importance of subcontractor selection criteria Evidence from Singapore Journal of Construction Engineering and Management 135(9) 826ndash832 httpsdoiorg101061(ASCE)0733-9364(2009)1359(826)
Hatush Z and Skitmore M (1997) Criteria for contractor selection Construction Management and Economics 15(1) 19ndash38 httpsdoiorg101080014461997373088
Kagioglou M Cooper R and Aouad G (2001) Performance management in construction A conceptual framework Construction Management and Economics 19(1) 85ndash95 httpsdoiorg10108001446190010003425
Lee A Cooper R and Aouad G (2000) A methodology for designing performance measures for the UK construction industry Paper presented at the Bizarre Fruit 2000 Postgraduate Research Conference on the Built and Human Environment University of Salford Salford UK 9ndash10 March
Lin G and Shen Q (2007) Measuring the performance of value management studies in construction Critical review Journal of Management in Engineering 23(1) 2ndash9 httpsdoiorg101061(ASCE)0742-597X(2007)231(2)
Luu VT Kim S-Y and Huynh T-A (2008) Improving project management performance of large contractors using benchmarking approach International Journal of Project Management 26(7) 758ndash769 httpsdoiorg 101016jijproman200710002
Mahdi IM Riley MJ Fereig SM and Alex AP (2002) A multi-criteria approach to contractor selection Engineering Construction and Architectural Management 9(1) 29ndash37 httpsdoiorg101108eb021204
Marzouk MM El Kherbawy AA and Khalifa M (2013) Factors influencing sub-contractors selection in construction projects HBRC Journal 9(2) 150ndash158 httpsdoiorg101016jhbrcj201305001
Mbachu J (2008) Conceptual framework for the assessment of subcontractors eligibility and performance in the construction industry Construction Management and Economics 26(5) 471ndash484 httpsdoiorg10108001446190801918730
Ng ST and Skitmore M (2014) Developing a framework for subcontractor appraisal using a balanced scorecard Journal of Civil Engineering and Management 20(2) 149ndash158 httpsdoiorg103846139237302013802705
Onder G and Onder E (2014) AHS In E Oumlnder and BF Yildirim (eds) Ccedilok Kriterli Karar Verme Istanbul Dora Yayincilik 21ndash64
Saaty T (1980) The Analytic Process Planning Priority Setting Resources Allocation London McGraw-Hill
Quality Performances of Turkish Contractors
PENERBIT UNIVERSITI SAINS MALAYSIA179
Saaty TL (2008) Decision making with the analytic hierarchy process International Journal of Services Sciences 1(1) 83ndash98 httpsdoiorg101504IJSSCI2008017590
Saaty TL and Vargas LG (2012) Models Methods Concepts and Applications of the Analytic Hierarchy Process BerlinHeidelberg Springer Science and Business Media 175
Timor M (2011) Analitik Hiyerarsi Prosesi Istanbul Turkmen KitabeviTrinkūnienė E Podvezko V Zavadskas EK Jokšienė I Vinogradova I and
Trinkūnas V (2017) Evaluation of quality assurance in contractor contracts by multi-attribute decision-making methods Economic Research ndash Ekonomska Istraživanja 30(1) 1152ndash1180 httpsdoiorg1010801331677X20171325616
Tserng HP and Lin PH (2002) An accelerated subcontracting and procuring model for construction projects Automation in Construction 11(1) 105ndash125 httpsdoiorg101016S0926-5805(01)00056-5
Turkish Contractors Association (TCA) (2018) Turkish Contractors Association Sector Report Ankara TCA
Ulubeyli S Manisali E and Kazaz A (2010) Subcontractor selection practices in international construction projects Journal of Civil Engineering and Management 16(1) 47ndash56 httpsdoiorg103846jcem201004
Vaidya OS and Kumar S (2006) Analytic hierarchy process An overview of applications European Journal of Operational Research 169(1) 1ndash29 httpsdoiorg101016jejor200404028
Ward S Curtis B and Chapman C (1991) Objectives and performance in construction projects Construction Management and Economics 9(4) 343ndash353 httpsdoiorg10108001446199100000027
Yang H Yeung JF Chan AP Chiang Y and Chan DW (2010) A critical review of performance measurement in construction Journal of Facilities Management 8(4) 269ndash284 httpsdoiorg10110814725961011078981
Yasamis-Speroni F Lee D-E and Arditi D (2012) Evaluating the quality performance of pavement contractors Journal of Construction Engineering and Management 138(10) 1114ndash1124 httpsdoiorg101061(ASCE)CO1943-78620000539
Yu I Kim K Jung Y and Chin S (2007) Comparable performance measurement system for construction companies Journal of Management in Engineering 23(3) 131ndash139 httpsdoiorg101061(ASCE)0742-597X(2007)233(131)
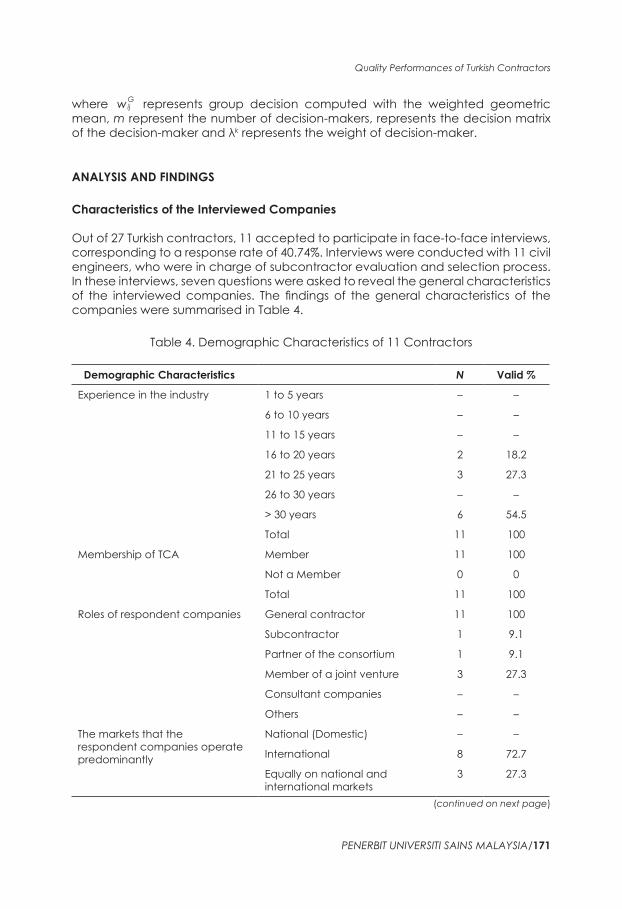
Quality Performances of Turkish Contractors
PENERBIT UNIVERSITI SAINS MALAYSIA171
where wijG represents group decision computed with the weighted geometric
mean m represent the number of decision-makers represents the decision matrix of the decision-maker and λk represents the weight of decision-maker
AnALYSIS And FIndInGS
Characteristics of the Interviewed Companies
Out of 27 Turkish contractors 11 accepted to participate in face-to-face interviews corresponding to a response rate of 4074 Interviews were conducted with 11 civil engineers who were in charge of subcontractor evaluation and selection process In these interviews seven questions were asked to reveal the general characteristics of the interviewed companies The findings of the general characteristics of the companies were summarised in Table 4
Table 4 Demographic Characteristics of 11 Contractors
demographic Characteristics N Valid
Experience in the industry 1 to 5 years ndash ndash
6 to 10 years ndash ndash
11 to 15 years ndash ndash
16 to 20 years 2 182
21 to 25 years 3 273
26 to 30 years ndash ndash
gt 30 years 6 545
Total 11 100
Membership of TCA Member 11 100
Not a Member 0 0
Total 11 100
Roles of respondent companies General contractor 11 100
Subcontractor 1 91
Partner of the consortium 1 91
Member of a joint venture 3 273
Consultant companies ndash ndash
Others ndash ndash
The markets that the respondent companies operate predominantly
National (Domestic) ndash ndash
International 8 727
Equally on national and international markets
3 273
(continued on next page)
Befrin Neval Bingol and Gul Polat
172PENERBIT UNIVERSITI SAINS MALAYSIA
demographic Characteristics N Valid
Expertise areas Commercial buildings 7 636
Industrial buildings 7 636
Residential buildings 5 455
Infrastructure and transportation structures
7 636
Others 2 182
Percentages of work capacity transferred to subcontractors
1 to 25 1 91
26 to 50 4 364
51 to 75 5 455
76 to 100 1 91
Total 11 100
Experience of the respondents in the interviewed companies
1 to 4 years 1 909
5 to 9 years 2 1818
10 to 14 years ndash ndash
15 to 19 years 2 1818
20 to 24 years 3 2727
25 to 29 years 2 1818
30 to 34 years ndash ndash
gt 34 years 1 909
Total 11 100
According to the data obtained in the interviews out of the 11 contractors 5454 have 16 to 20 years of experience in the sector while 2727 have six to 10 years and 1818 have one to five years of experience It is observed that 100 of the respondent companies are general contractors where 91 of them are subcontractors 273 of them are a member of joint ventures and 91 are consultant companies in the undertaken projects On the other hand among 11 companies eight (727) were operating only in international markets and three (273) were operating in both national and international markets Based on the responses received from the companies 636 of them are specialised in commercial buildings industrial buildings and infrastructure-transport structures while 455 of them are specialised in residential buildings and 182 of them are specialised in other types of projects Findings revealed that 455 of the companies sublet 51 to 75 of the total work capacity to the subcontractor companies 364 of them sublet 26 to 50 of the total work capacity 91 of them sublet 1 to 25 of the total work capacity and 76 to 100 of the work capacity to the subcontractor companies
Table 4 (continued)
Quality Performances of Turkish Contractors
PENERBIT UNIVERSITI SAINS MALAYSIA173
Group decision on the Weights of the Most Important KPIs (Qs)
Respondents are strategically competitors and the individual preferences of these 11 companies have been taken one by one and then were combined to reach a group decision for the proposed framework The AHP method was applied to determine the weights of the nine KPIs in the quality performance measurement framework In the interviews Saatys (2008) rating scale was used to calculate the relative importance of these nine KPIs
In this step first 11 pairwise comparison matrices were built to understand the individual judgements of each company the weights of nine KPIs in each company were calculated and the consistency index of each comparison matrix was checked (as shown in Table 5)
Then the individual matrices were aggregated using the weighted geometric mean method into a single matrix to reach a group decision (using Equation 4) and the consistency index of the aggregated pairwise comparison matrix was checked The aggregated individual priorities are presented in Table 6 and the aggregated weights of nine KPIs are shown in the last column of Table 5
According to the findings displayed in Table 5 Construction quality (conformance to the specification) (Q4) is the most effective indicator with the weight of 024009 in the developed framework This indicator is followed by The quality of workmanship (Q5) with the weight of 017890 Application-level of the quality management system in projects (Q2) with the weight of 011874 and The audit of the quality management system in project-level (Q3) with the weight of 009979 On the other hand the least effective indicator in the framework is Number of reworks (Q7) with the weight of 005634
development of the Quality Performance Measurement Framework
The proposed quality performance measurement framework consists of three steps which are (1) inputs (2) process and (3) output (as shown in Figure 2)
Figure 2 Framework for Measuring Quality Performance of Subcontractors
Befrin Neval Bingol and Gul Polat
174PENERBIT UNIVERSITI SAINS MALAYSIA
Tabl
e 5
Ind
ivid
ual P
riorit
ies o
f Nin
e KP
Is A
ccor
din
g to
the
11 T
urki
sh G
ener
al C
ontra
ctor
Com
pani
es
wGC
1w
GC
2w
GC
3w
GC
4w
GC
5w
GC
6w
GC
7w
GC
8w
GC
9w
GC10
wGC
11wQG
1
Q1
010
252
010
673
007
935
010
000
027
167
010
605
005
593
008
900
004
907
004
901
002
712
008
881
Q2
010
252
022
065
010
146
010
000
008
751
010
605
005
593
008
900
015
056
004
901
025
479
011
880
Q3
010
252
015
801
014
647
010
000
008
751
010
605
009
904
006
572
015
056
004
901
002
712
009
960
Q4
018
472
015
801
028
382
020
000
027
168
019
915
037
413
013
802
022
251
026
073
017
534
024
070
Q5
018
472
007
485
022
584
020
000
016
496
010
605
028
481
013
802
015
056
026
073
010
653
017
886
Q6
010
252
010
673
005
088
010
000
002
917
010
605
003
254
018
842
002
096
009
416
002
654
006
956
Q7
010
252
005
009
002
669
010
000
002
917
005
853
003
254
001
617
008
525
004
901
010
361
005
623
Q8
006
700
005
009
005
088
005
000
002
917
010
605
003
254
008
724
008
525
009
416
017
534
007
377
Q9
005
096
007
485
003
462
005
000
002
917
010
605
003
254
018
842
008
525
009
416
010
361
007
368
CR
000
890
001
700
001
290
000
000
000
110
000
370
000
900
001
850
000
770
000
090
000
600
Tabl
e 6
An
Agg
rega
ted
Pai
rwise
Com
paris
on M
atrix
of 1
1 Tu
rkish
Con
tract
ors
Q1
Q2
Q3
Q4
Q5
Q6
Q7
Q8
Q9
Q1
10
722
088
160
3537
049
071
3493
158
811
2535
122
11
Q2
138
511
122
110
4847
062
161
7152
204
331
6733
163
01
Q3
113
430
8189
10
4012
053
571
5121
180
81
3493
138
51
Q4
282
72
063
249
221
155
443
3114
389
713
076
301
42
Q5
203
811
6086
186
690
6433
12
5126
332
712
4922
235
04
Q6
074
110
583
066
130
302
039
81
122
110
9638
1
Q7
062
970
4894
055
310
2566
030
060
8189
10
7616
072
2
Q8
079
780
5976
074
110
3251
040
121
0375
131
31
106
5
Q9
081
890
6134
072
20
3318
042
551
138
510
9389
1
Quality Performances of Turkish Contractors
PENERBIT UNIVERSITI SAINS MALAYSIA175
Inputs of the framework include group decision on the weights of the most important KPIs (Qs) which are obtained from AHP calculations measurement scales for each KPI the direction of preference of each KPI (minimum is the most favourable or maximum is the most favourable) and the evaluations of all candidate subcontractors with respect to each KPI
Having determined the inputs values in the process step the performance scores (q) of all candidate subcontractors are calculated by normalising the evaluations concerning each KPI considering the direction of preference If the direction of preference is maximum the quantitative equivalence of the evaluation of a subcontractor candidate for any KPI is divided by the sum of the evaluations of all subcontractors to the KPI in question On the other hand if the direction of preference is minimum the reciprocals of the quantitative equivalences of the evaluations are normalised By this way the subcontractor candidate with the minimum value becomes more favourable
In the output step the overall quality performance index (QPI) of each subcontractor candidate can be calculated using Equation 5
QPI w q1
9
SC iG
iim m=
= (Eq 5)
Where QPISCm represents the overall QPI of the mth subcontractor wiG represents
the aggregated weight of the ith KPI (Qi) based on group decision and qim represents the performance score of the mth subcontractor candidate for the ith KPI (Qi)
An Illustrative Example of the Application of the Proposed Quality Performance Measurement Framework
An illustrative example has been presented to demonstrate how the proposed framework can be used by a Turkish general contractor who intends to evaluate the quality performances of the subcontractor candidates under consideration for an international construction project
In the illustrative example (as shown in Table 7) there are five subcontractor candidates First the general contractor determines the measurement scales for each KPI identifies the direction of preference of each KPI and evaluates all candidate subcontractors for each KPI based on the identified measurement scale The weights of the KPIs are obtained from the AHP calculations presented in the last column of Table 5 Second the general contractor calculates the performance scores (q) of all candidate subcontractors And finally the general contractor computes the overall QPI of all candidate subcontractors In the illustrative example the overall quality performance of the fourth subcontractor candidate (SC_4) is higher than the other candidates
Befrin Neval Bingol and Gul Polat
176PENERBIT UNIVERSITI SAINS MALAYSIA
Tabl
e 7
An
Illust
rativ
e Ex
ampl
e of
the
App
licat
ion
of th
e Pr
opos
ed F
ram
ewor
k
Q
Q D
efini
tion
Mea
sure
men
t Sc
ales
dire
ctio
n of
Pr
efer
ence
sW
eigh
tsEv
alua
tions
of S
ubco
ntra
ctor
Can
dida
tes
Qua
lity
Scor
es o
f Sub
cont
ract
or C
andi
date
s
SC_1
SC_2
SC_3
SC_4
SC_5
q_1
q_2
q_3
q_4
q_5
Q1
Ad
equa
cy o
f qu
ality
ass
uran
ce
polic
y
VBndash
VG
2M
ax
008
881
GV
GM
GV
G0
190
023
80
143
019
00
238
Q2
The
appl
icat
ion
leve
l of t
he q
ualit
y m
anag
emen
t sy
stem
in p
roje
cts
VBndash
VG
Max
0
1188
0G
MM
MG
023
50
176
017
60
176
023
5
Q3
The
aud
it of
th
e qu
ality
m
anag
emen
t sy
stem
in p
roje
ct
leve
l
VBndash
VG
Max
0
0996
0M
GG
VG
M0
158
021
10
211
026
30
158
Q4
Con
stru
ctio
n qu
ality
(c
onfo
rman
ce to
th
e sp
ecifi
catio
n)
VBndash
VG
Max
0
2407
0G
VG
GM
G0
200
025
00
200
015
00
200
Q5
The
qual
ity o
f w
orkm
ansh
ipV
BndashV
GM
ax
017
886
VG
MV
GG
M0
250
015
00
250
020
00
150
Q6
The
cost
of
poor
qua
lity
resu
lting
from
th
e lo
w st
and
ard
pr
oduc
tion
M
in
006
956
12
29
21
11
10
234
009
70
134
028
10
255
Q7
Num
ber o
f rew
orks
Num
ber
Min
0
0562
314
98
411
011
00
171
019
30
386
014
0
Q8
Perc
enta
ge o
f re
wor
ks (
)
Min
0
0737
73
24
44
11
83
30
190
013
80
149
033
80
185
Q9
The
seve
rity
of
def
ect a
t the
co
nstru
ctio
n ph
ase
VLndash
VH
3M
in
007
368
MH
MV
HH
024
40
183
024
40
146
018
3
QPI
020
80
190
019
70
213
019
3
Not
es V
B =
Ver
y Ba
d (1
) B
= Ba
d (2
) M
= M
ediu
m (3
) G
= G
ood
(4)
VG
= V
ery
Goo
d (5
) V
L =
Ver
y Lo
w (1
) L
= Lo
w (2
) M
= M
ediu
m (3
) H
= Hi
gh (4
) V
H =
Ver
y Hi
gh (5
)
Quality Performances of Turkish Contractors
PENERBIT UNIVERSITI SAINS MALAYSIA177
ConCLuSIon
Since most of the international construction projects are highly complex in nature they require the involvement of multiple subcontractors therefore the selection of the most appropriate subcontractor becomes crucial for the overall project success The subcontractor selection process is mostly affected by several compromising and conflicting tangible and intangible criteria While the criteria like cost and time can be numerically measured the criteria like safety and quality cannot be easily measured This study aimed to solve this issue by developing a framework for measuring the quality performances of subcontractor candidates more systematically and rationally way To use the proposed framework subcontractor candidates should be assessed based on the identified nine KPIs After these assessments the quality performance of the candidates can be determined using the proposed framework The measurement framework includes indicators that can be measured quantitatively and qualitatively
The limitations of this study are related to the developed framework relying on the individual preferences of the 11 Turkish companies that are also the target users This potential limitation can be overcome by increasing the sample size Moreover the performance of the proposed framework should be tested with real cases
rEFErEnCES
Ali HAEM Al-Sulaihi IA and Al-Gahtani KS (2013) Indicators for measuring performance of building construction companies in Kingdom of Saudi Arabia Journal of King Saud University ndash Engineering Sciences 25(2) 125ndash134 httpsdoiorg101016jjksues201203002
Arslan G Kivrak S Birgonul MT and Dikmen I (2008) Improving sub-contractor selection process in construction projects Web-based sub-contractor evaluation system (WEBSES) Automation in Construction 17(4) 480ndash488 httpsdoiorg101016jautcon200708004
Bingol BN and Polat G (2016) Measuring quality performances of subcontractors using key performance indicators (KPIs) model Paper presented at the 12th International Congress on Advances in Civil Engineering Istanbul Turkey 21ndash23 September
Chan APC and Chan APL (2004) Key performance indicators for measuring construction success Benchmarking An International Journal 11(2) 203ndash221 httpsdoiorg10110814635770410532624
Chen Y Okudan GE and Riley DR (2010) Sustainable performance criteria for construction method selection in concrete buildings Automation in Construction 19(2) 235ndash244 httpsdoiorg101016jautcon200910004
Choudhry RM Hinze JW Arshad M and Gabriel HF (2012) Subcontracting practices in the construction industry of Pakistan Journal of Construction Engineering and Management 138(12) 1353ndash1359 httpsdoiorg101061(ASCE)CO1943-78620000562
El-Mashaleh MS (2009) A construction subcontractor selection model Jordan Journal of Civil Engineering 3(4) 375ndash383
Enshassi A Choudhry RM Mayer PE and Shoman Y (2008) Safety performance of subcontractors in the Palestinian construction industry Journal of Construction in Developing Countries 13(1) 51ndash62
Befrin Neval Bingol and Gul Polat
178PENERBIT UNIVERSITI SAINS MALAYSIA
Enshassi A Mohamed S and Abushaban S (2009) Factors affecting the performance of construction projects in the Gaza strip Journal of Civil Engineering and Management 15(3) 269ndash280 httpsdoiorg1038461392-3730200915269-280
Escobar MT Aguaroacuten J and Moreno-Jimeacutenez JM (2004) A note on AHP group consistency for the row geometric mean priorization procedure European Journal of Operational Research 153(2) 318ndash322 httpsdoiorg101016S0377-2217(03)00154-1
Field A (2017) Discovering Statistics Using IBM SPSS Statistics North American Edition Thousand Oaks CA SAGE
Hartmann A Ling FYY and Tan JS (2009) Relative importance of subcontractor selection criteria Evidence from Singapore Journal of Construction Engineering and Management 135(9) 826ndash832 httpsdoiorg101061(ASCE)0733-9364(2009)1359(826)
Hatush Z and Skitmore M (1997) Criteria for contractor selection Construction Management and Economics 15(1) 19ndash38 httpsdoiorg101080014461997373088
Kagioglou M Cooper R and Aouad G (2001) Performance management in construction A conceptual framework Construction Management and Economics 19(1) 85ndash95 httpsdoiorg10108001446190010003425
Lee A Cooper R and Aouad G (2000) A methodology for designing performance measures for the UK construction industry Paper presented at the Bizarre Fruit 2000 Postgraduate Research Conference on the Built and Human Environment University of Salford Salford UK 9ndash10 March
Lin G and Shen Q (2007) Measuring the performance of value management studies in construction Critical review Journal of Management in Engineering 23(1) 2ndash9 httpsdoiorg101061(ASCE)0742-597X(2007)231(2)
Luu VT Kim S-Y and Huynh T-A (2008) Improving project management performance of large contractors using benchmarking approach International Journal of Project Management 26(7) 758ndash769 httpsdoiorg 101016jijproman200710002
Mahdi IM Riley MJ Fereig SM and Alex AP (2002) A multi-criteria approach to contractor selection Engineering Construction and Architectural Management 9(1) 29ndash37 httpsdoiorg101108eb021204
Marzouk MM El Kherbawy AA and Khalifa M (2013) Factors influencing sub-contractors selection in construction projects HBRC Journal 9(2) 150ndash158 httpsdoiorg101016jhbrcj201305001
Mbachu J (2008) Conceptual framework for the assessment of subcontractors eligibility and performance in the construction industry Construction Management and Economics 26(5) 471ndash484 httpsdoiorg10108001446190801918730
Ng ST and Skitmore M (2014) Developing a framework for subcontractor appraisal using a balanced scorecard Journal of Civil Engineering and Management 20(2) 149ndash158 httpsdoiorg103846139237302013802705
Onder G and Onder E (2014) AHS In E Oumlnder and BF Yildirim (eds) Ccedilok Kriterli Karar Verme Istanbul Dora Yayincilik 21ndash64
Saaty T (1980) The Analytic Process Planning Priority Setting Resources Allocation London McGraw-Hill
Quality Performances of Turkish Contractors
PENERBIT UNIVERSITI SAINS MALAYSIA179
Saaty TL (2008) Decision making with the analytic hierarchy process International Journal of Services Sciences 1(1) 83ndash98 httpsdoiorg101504IJSSCI2008017590
Saaty TL and Vargas LG (2012) Models Methods Concepts and Applications of the Analytic Hierarchy Process BerlinHeidelberg Springer Science and Business Media 175
Timor M (2011) Analitik Hiyerarsi Prosesi Istanbul Turkmen KitabeviTrinkūnienė E Podvezko V Zavadskas EK Jokšienė I Vinogradova I and
Trinkūnas V (2017) Evaluation of quality assurance in contractor contracts by multi-attribute decision-making methods Economic Research ndash Ekonomska Istraživanja 30(1) 1152ndash1180 httpsdoiorg1010801331677X20171325616
Tserng HP and Lin PH (2002) An accelerated subcontracting and procuring model for construction projects Automation in Construction 11(1) 105ndash125 httpsdoiorg101016S0926-5805(01)00056-5
Turkish Contractors Association (TCA) (2018) Turkish Contractors Association Sector Report Ankara TCA
Ulubeyli S Manisali E and Kazaz A (2010) Subcontractor selection practices in international construction projects Journal of Civil Engineering and Management 16(1) 47ndash56 httpsdoiorg103846jcem201004
Vaidya OS and Kumar S (2006) Analytic hierarchy process An overview of applications European Journal of Operational Research 169(1) 1ndash29 httpsdoiorg101016jejor200404028
Ward S Curtis B and Chapman C (1991) Objectives and performance in construction projects Construction Management and Economics 9(4) 343ndash353 httpsdoiorg10108001446199100000027
Yang H Yeung JF Chan AP Chiang Y and Chan DW (2010) A critical review of performance measurement in construction Journal of Facilities Management 8(4) 269ndash284 httpsdoiorg10110814725961011078981
Yasamis-Speroni F Lee D-E and Arditi D (2012) Evaluating the quality performance of pavement contractors Journal of Construction Engineering and Management 138(10) 1114ndash1124 httpsdoiorg101061(ASCE)CO1943-78620000539
Yu I Kim K Jung Y and Chin S (2007) Comparable performance measurement system for construction companies Journal of Management in Engineering 23(3) 131ndash139 httpsdoiorg101061(ASCE)0742-597X(2007)233(131)
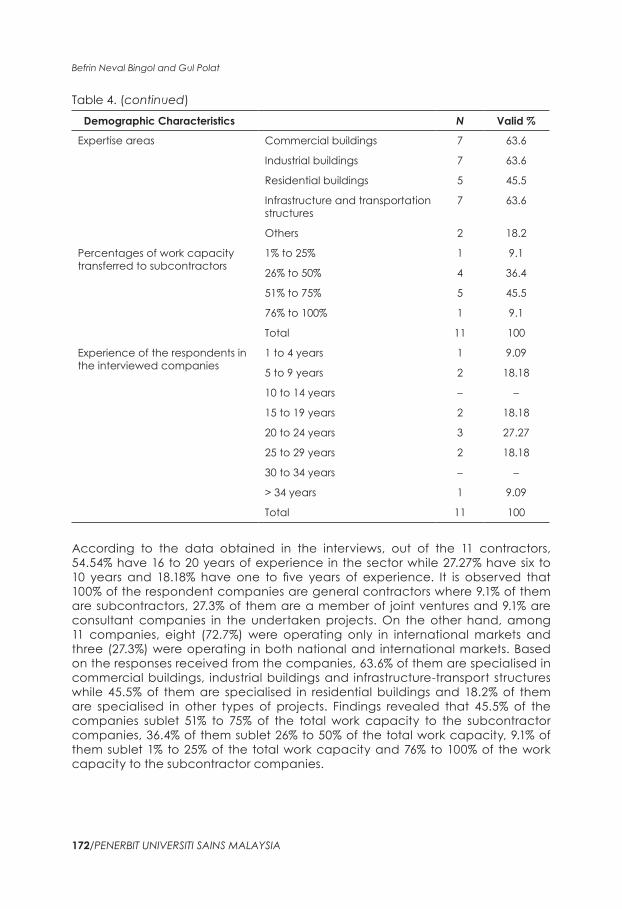
Befrin Neval Bingol and Gul Polat
172PENERBIT UNIVERSITI SAINS MALAYSIA
demographic Characteristics N Valid
Expertise areas Commercial buildings 7 636
Industrial buildings 7 636
Residential buildings 5 455
Infrastructure and transportation structures
7 636
Others 2 182
Percentages of work capacity transferred to subcontractors
1 to 25 1 91
26 to 50 4 364
51 to 75 5 455
76 to 100 1 91
Total 11 100
Experience of the respondents in the interviewed companies
1 to 4 years 1 909
5 to 9 years 2 1818
10 to 14 years ndash ndash
15 to 19 years 2 1818
20 to 24 years 3 2727
25 to 29 years 2 1818
30 to 34 years ndash ndash
gt 34 years 1 909
Total 11 100
According to the data obtained in the interviews out of the 11 contractors 5454 have 16 to 20 years of experience in the sector while 2727 have six to 10 years and 1818 have one to five years of experience It is observed that 100 of the respondent companies are general contractors where 91 of them are subcontractors 273 of them are a member of joint ventures and 91 are consultant companies in the undertaken projects On the other hand among 11 companies eight (727) were operating only in international markets and three (273) were operating in both national and international markets Based on the responses received from the companies 636 of them are specialised in commercial buildings industrial buildings and infrastructure-transport structures while 455 of them are specialised in residential buildings and 182 of them are specialised in other types of projects Findings revealed that 455 of the companies sublet 51 to 75 of the total work capacity to the subcontractor companies 364 of them sublet 26 to 50 of the total work capacity 91 of them sublet 1 to 25 of the total work capacity and 76 to 100 of the work capacity to the subcontractor companies
Table 4 (continued)
Quality Performances of Turkish Contractors
PENERBIT UNIVERSITI SAINS MALAYSIA173
Group decision on the Weights of the Most Important KPIs (Qs)
Respondents are strategically competitors and the individual preferences of these 11 companies have been taken one by one and then were combined to reach a group decision for the proposed framework The AHP method was applied to determine the weights of the nine KPIs in the quality performance measurement framework In the interviews Saatys (2008) rating scale was used to calculate the relative importance of these nine KPIs
In this step first 11 pairwise comparison matrices were built to understand the individual judgements of each company the weights of nine KPIs in each company were calculated and the consistency index of each comparison matrix was checked (as shown in Table 5)
Then the individual matrices were aggregated using the weighted geometric mean method into a single matrix to reach a group decision (using Equation 4) and the consistency index of the aggregated pairwise comparison matrix was checked The aggregated individual priorities are presented in Table 6 and the aggregated weights of nine KPIs are shown in the last column of Table 5
According to the findings displayed in Table 5 Construction quality (conformance to the specification) (Q4) is the most effective indicator with the weight of 024009 in the developed framework This indicator is followed by The quality of workmanship (Q5) with the weight of 017890 Application-level of the quality management system in projects (Q2) with the weight of 011874 and The audit of the quality management system in project-level (Q3) with the weight of 009979 On the other hand the least effective indicator in the framework is Number of reworks (Q7) with the weight of 005634
development of the Quality Performance Measurement Framework
The proposed quality performance measurement framework consists of three steps which are (1) inputs (2) process and (3) output (as shown in Figure 2)
Figure 2 Framework for Measuring Quality Performance of Subcontractors
Befrin Neval Bingol and Gul Polat
174PENERBIT UNIVERSITI SAINS MALAYSIA
Tabl
e 5
Ind
ivid
ual P
riorit
ies o
f Nin
e KP
Is A
ccor
din
g to
the
11 T
urki
sh G
ener
al C
ontra
ctor
Com
pani
es
wGC
1w
GC
2w
GC
3w
GC
4w
GC
5w
GC
6w
GC
7w
GC
8w
GC
9w
GC10
wGC
11wQG
1
Q1
010
252
010
673
007
935
010
000
027
167
010
605
005
593
008
900
004
907
004
901
002
712
008
881
Q2
010
252
022
065
010
146
010
000
008
751
010
605
005
593
008
900
015
056
004
901
025
479
011
880
Q3
010
252
015
801
014
647
010
000
008
751
010
605
009
904
006
572
015
056
004
901
002
712
009
960
Q4
018
472
015
801
028
382
020
000
027
168
019
915
037
413
013
802
022
251
026
073
017
534
024
070
Q5
018
472
007
485
022
584
020
000
016
496
010
605
028
481
013
802
015
056
026
073
010
653
017
886
Q6
010
252
010
673
005
088
010
000
002
917
010
605
003
254
018
842
002
096
009
416
002
654
006
956
Q7
010
252
005
009
002
669
010
000
002
917
005
853
003
254
001
617
008
525
004
901
010
361
005
623
Q8
006
700
005
009
005
088
005
000
002
917
010
605
003
254
008
724
008
525
009
416
017
534
007
377
Q9
005
096
007
485
003
462
005
000
002
917
010
605
003
254
018
842
008
525
009
416
010
361
007
368
CR
000
890
001
700
001
290
000
000
000
110
000
370
000
900
001
850
000
770
000
090
000
600
Tabl
e 6
An
Agg
rega
ted
Pai
rwise
Com
paris
on M
atrix
of 1
1 Tu
rkish
Con
tract
ors
Q1
Q2
Q3
Q4
Q5
Q6
Q7
Q8
Q9
Q1
10
722
088
160
3537
049
071
3493
158
811
2535
122
11
Q2
138
511
122
110
4847
062
161
7152
204
331
6733
163
01
Q3
113
430
8189
10
4012
053
571
5121
180
81
3493
138
51
Q4
282
72
063
249
221
155
443
3114
389
713
076
301
42
Q5
203
811
6086
186
690
6433
12
5126
332
712
4922
235
04
Q6
074
110
583
066
130
302
039
81
122
110
9638
1
Q7
062
970
4894
055
310
2566
030
060
8189
10
7616
072
2
Q8
079
780
5976
074
110
3251
040
121
0375
131
31
106
5
Q9
081
890
6134
072
20
3318
042
551
138
510
9389
1
Quality Performances of Turkish Contractors
PENERBIT UNIVERSITI SAINS MALAYSIA175
Inputs of the framework include group decision on the weights of the most important KPIs (Qs) which are obtained from AHP calculations measurement scales for each KPI the direction of preference of each KPI (minimum is the most favourable or maximum is the most favourable) and the evaluations of all candidate subcontractors with respect to each KPI
Having determined the inputs values in the process step the performance scores (q) of all candidate subcontractors are calculated by normalising the evaluations concerning each KPI considering the direction of preference If the direction of preference is maximum the quantitative equivalence of the evaluation of a subcontractor candidate for any KPI is divided by the sum of the evaluations of all subcontractors to the KPI in question On the other hand if the direction of preference is minimum the reciprocals of the quantitative equivalences of the evaluations are normalised By this way the subcontractor candidate with the minimum value becomes more favourable
In the output step the overall quality performance index (QPI) of each subcontractor candidate can be calculated using Equation 5
QPI w q1
9
SC iG
iim m=
= (Eq 5)
Where QPISCm represents the overall QPI of the mth subcontractor wiG represents
the aggregated weight of the ith KPI (Qi) based on group decision and qim represents the performance score of the mth subcontractor candidate for the ith KPI (Qi)
An Illustrative Example of the Application of the Proposed Quality Performance Measurement Framework
An illustrative example has been presented to demonstrate how the proposed framework can be used by a Turkish general contractor who intends to evaluate the quality performances of the subcontractor candidates under consideration for an international construction project
In the illustrative example (as shown in Table 7) there are five subcontractor candidates First the general contractor determines the measurement scales for each KPI identifies the direction of preference of each KPI and evaluates all candidate subcontractors for each KPI based on the identified measurement scale The weights of the KPIs are obtained from the AHP calculations presented in the last column of Table 5 Second the general contractor calculates the performance scores (q) of all candidate subcontractors And finally the general contractor computes the overall QPI of all candidate subcontractors In the illustrative example the overall quality performance of the fourth subcontractor candidate (SC_4) is higher than the other candidates
Befrin Neval Bingol and Gul Polat
176PENERBIT UNIVERSITI SAINS MALAYSIA
Tabl
e 7
An
Illust
rativ
e Ex
ampl
e of
the
App
licat
ion
of th
e Pr
opos
ed F
ram
ewor
k
Q
Q D
efini
tion
Mea
sure
men
t Sc
ales
dire
ctio
n of
Pr
efer
ence
sW
eigh
tsEv
alua
tions
of S
ubco
ntra
ctor
Can
dida
tes
Qua
lity
Scor
es o
f Sub
cont
ract
or C
andi
date
s
SC_1
SC_2
SC_3
SC_4
SC_5
q_1
q_2
q_3
q_4
q_5
Q1
Ad
equa
cy o
f qu
ality
ass
uran
ce
polic
y
VBndash
VG
2M
ax
008
881
GV
GM
GV
G0
190
023
80
143
019
00
238
Q2
The
appl
icat
ion
leve
l of t
he q
ualit
y m
anag
emen
t sy
stem
in p
roje
cts
VBndash
VG
Max
0
1188
0G
MM
MG
023
50
176
017
60
176
023
5
Q3
The
aud
it of
th
e qu
ality
m
anag
emen
t sy
stem
in p
roje
ct
leve
l
VBndash
VG
Max
0
0996
0M
GG
VG
M0
158
021
10
211
026
30
158
Q4
Con
stru
ctio
n qu
ality
(c
onfo
rman
ce to
th
e sp
ecifi
catio
n)
VBndash
VG
Max
0
2407
0G
VG
GM
G0
200
025
00
200
015
00
200
Q5
The
qual
ity o
f w
orkm
ansh
ipV
BndashV
GM
ax
017
886
VG
MV
GG
M0
250
015
00
250
020
00
150
Q6
The
cost
of
poor
qua
lity
resu
lting
from
th
e lo
w st
and
ard
pr
oduc
tion
M
in
006
956
12
29
21
11
10
234
009
70
134
028
10
255
Q7
Num
ber o
f rew
orks
Num
ber
Min
0
0562
314
98
411
011
00
171
019
30
386
014
0
Q8
Perc
enta
ge o
f re
wor
ks (
)
Min
0
0737
73
24
44
11
83
30
190
013
80
149
033
80
185
Q9
The
seve
rity
of
def
ect a
t the
co
nstru
ctio
n ph
ase
VLndash
VH
3M
in
007
368
MH
MV
HH
024
40
183
024
40
146
018
3
QPI
020
80
190
019
70
213
019
3
Not
es V
B =
Ver
y Ba
d (1
) B
= Ba
d (2
) M
= M
ediu
m (3
) G
= G
ood
(4)
VG
= V
ery
Goo
d (5
) V
L =
Ver
y Lo
w (1
) L
= Lo
w (2
) M
= M
ediu
m (3
) H
= Hi
gh (4
) V
H =
Ver
y Hi
gh (5
)
Quality Performances of Turkish Contractors
PENERBIT UNIVERSITI SAINS MALAYSIA177
ConCLuSIon
Since most of the international construction projects are highly complex in nature they require the involvement of multiple subcontractors therefore the selection of the most appropriate subcontractor becomes crucial for the overall project success The subcontractor selection process is mostly affected by several compromising and conflicting tangible and intangible criteria While the criteria like cost and time can be numerically measured the criteria like safety and quality cannot be easily measured This study aimed to solve this issue by developing a framework for measuring the quality performances of subcontractor candidates more systematically and rationally way To use the proposed framework subcontractor candidates should be assessed based on the identified nine KPIs After these assessments the quality performance of the candidates can be determined using the proposed framework The measurement framework includes indicators that can be measured quantitatively and qualitatively
The limitations of this study are related to the developed framework relying on the individual preferences of the 11 Turkish companies that are also the target users This potential limitation can be overcome by increasing the sample size Moreover the performance of the proposed framework should be tested with real cases
rEFErEnCES
Ali HAEM Al-Sulaihi IA and Al-Gahtani KS (2013) Indicators for measuring performance of building construction companies in Kingdom of Saudi Arabia Journal of King Saud University ndash Engineering Sciences 25(2) 125ndash134 httpsdoiorg101016jjksues201203002
Arslan G Kivrak S Birgonul MT and Dikmen I (2008) Improving sub-contractor selection process in construction projects Web-based sub-contractor evaluation system (WEBSES) Automation in Construction 17(4) 480ndash488 httpsdoiorg101016jautcon200708004
Bingol BN and Polat G (2016) Measuring quality performances of subcontractors using key performance indicators (KPIs) model Paper presented at the 12th International Congress on Advances in Civil Engineering Istanbul Turkey 21ndash23 September
Chan APC and Chan APL (2004) Key performance indicators for measuring construction success Benchmarking An International Journal 11(2) 203ndash221 httpsdoiorg10110814635770410532624
Chen Y Okudan GE and Riley DR (2010) Sustainable performance criteria for construction method selection in concrete buildings Automation in Construction 19(2) 235ndash244 httpsdoiorg101016jautcon200910004
Choudhry RM Hinze JW Arshad M and Gabriel HF (2012) Subcontracting practices in the construction industry of Pakistan Journal of Construction Engineering and Management 138(12) 1353ndash1359 httpsdoiorg101061(ASCE)CO1943-78620000562
El-Mashaleh MS (2009) A construction subcontractor selection model Jordan Journal of Civil Engineering 3(4) 375ndash383
Enshassi A Choudhry RM Mayer PE and Shoman Y (2008) Safety performance of subcontractors in the Palestinian construction industry Journal of Construction in Developing Countries 13(1) 51ndash62
Befrin Neval Bingol and Gul Polat
178PENERBIT UNIVERSITI SAINS MALAYSIA
Enshassi A Mohamed S and Abushaban S (2009) Factors affecting the performance of construction projects in the Gaza strip Journal of Civil Engineering and Management 15(3) 269ndash280 httpsdoiorg1038461392-3730200915269-280
Escobar MT Aguaroacuten J and Moreno-Jimeacutenez JM (2004) A note on AHP group consistency for the row geometric mean priorization procedure European Journal of Operational Research 153(2) 318ndash322 httpsdoiorg101016S0377-2217(03)00154-1
Field A (2017) Discovering Statistics Using IBM SPSS Statistics North American Edition Thousand Oaks CA SAGE
Hartmann A Ling FYY and Tan JS (2009) Relative importance of subcontractor selection criteria Evidence from Singapore Journal of Construction Engineering and Management 135(9) 826ndash832 httpsdoiorg101061(ASCE)0733-9364(2009)1359(826)
Hatush Z and Skitmore M (1997) Criteria for contractor selection Construction Management and Economics 15(1) 19ndash38 httpsdoiorg101080014461997373088
Kagioglou M Cooper R and Aouad G (2001) Performance management in construction A conceptual framework Construction Management and Economics 19(1) 85ndash95 httpsdoiorg10108001446190010003425
Lee A Cooper R and Aouad G (2000) A methodology for designing performance measures for the UK construction industry Paper presented at the Bizarre Fruit 2000 Postgraduate Research Conference on the Built and Human Environment University of Salford Salford UK 9ndash10 March
Lin G and Shen Q (2007) Measuring the performance of value management studies in construction Critical review Journal of Management in Engineering 23(1) 2ndash9 httpsdoiorg101061(ASCE)0742-597X(2007)231(2)
Luu VT Kim S-Y and Huynh T-A (2008) Improving project management performance of large contractors using benchmarking approach International Journal of Project Management 26(7) 758ndash769 httpsdoiorg 101016jijproman200710002
Mahdi IM Riley MJ Fereig SM and Alex AP (2002) A multi-criteria approach to contractor selection Engineering Construction and Architectural Management 9(1) 29ndash37 httpsdoiorg101108eb021204
Marzouk MM El Kherbawy AA and Khalifa M (2013) Factors influencing sub-contractors selection in construction projects HBRC Journal 9(2) 150ndash158 httpsdoiorg101016jhbrcj201305001
Mbachu J (2008) Conceptual framework for the assessment of subcontractors eligibility and performance in the construction industry Construction Management and Economics 26(5) 471ndash484 httpsdoiorg10108001446190801918730
Ng ST and Skitmore M (2014) Developing a framework for subcontractor appraisal using a balanced scorecard Journal of Civil Engineering and Management 20(2) 149ndash158 httpsdoiorg103846139237302013802705
Onder G and Onder E (2014) AHS In E Oumlnder and BF Yildirim (eds) Ccedilok Kriterli Karar Verme Istanbul Dora Yayincilik 21ndash64
Saaty T (1980) The Analytic Process Planning Priority Setting Resources Allocation London McGraw-Hill
Quality Performances of Turkish Contractors
PENERBIT UNIVERSITI SAINS MALAYSIA179
Saaty TL (2008) Decision making with the analytic hierarchy process International Journal of Services Sciences 1(1) 83ndash98 httpsdoiorg101504IJSSCI2008017590
Saaty TL and Vargas LG (2012) Models Methods Concepts and Applications of the Analytic Hierarchy Process BerlinHeidelberg Springer Science and Business Media 175
Timor M (2011) Analitik Hiyerarsi Prosesi Istanbul Turkmen KitabeviTrinkūnienė E Podvezko V Zavadskas EK Jokšienė I Vinogradova I and
Trinkūnas V (2017) Evaluation of quality assurance in contractor contracts by multi-attribute decision-making methods Economic Research ndash Ekonomska Istraživanja 30(1) 1152ndash1180 httpsdoiorg1010801331677X20171325616
Tserng HP and Lin PH (2002) An accelerated subcontracting and procuring model for construction projects Automation in Construction 11(1) 105ndash125 httpsdoiorg101016S0926-5805(01)00056-5
Turkish Contractors Association (TCA) (2018) Turkish Contractors Association Sector Report Ankara TCA
Ulubeyli S Manisali E and Kazaz A (2010) Subcontractor selection practices in international construction projects Journal of Civil Engineering and Management 16(1) 47ndash56 httpsdoiorg103846jcem201004
Vaidya OS and Kumar S (2006) Analytic hierarchy process An overview of applications European Journal of Operational Research 169(1) 1ndash29 httpsdoiorg101016jejor200404028
Ward S Curtis B and Chapman C (1991) Objectives and performance in construction projects Construction Management and Economics 9(4) 343ndash353 httpsdoiorg10108001446199100000027
Yang H Yeung JF Chan AP Chiang Y and Chan DW (2010) A critical review of performance measurement in construction Journal of Facilities Management 8(4) 269ndash284 httpsdoiorg10110814725961011078981
Yasamis-Speroni F Lee D-E and Arditi D (2012) Evaluating the quality performance of pavement contractors Journal of Construction Engineering and Management 138(10) 1114ndash1124 httpsdoiorg101061(ASCE)CO1943-78620000539
Yu I Kim K Jung Y and Chin S (2007) Comparable performance measurement system for construction companies Journal of Management in Engineering 23(3) 131ndash139 httpsdoiorg101061(ASCE)0742-597X(2007)233(131)
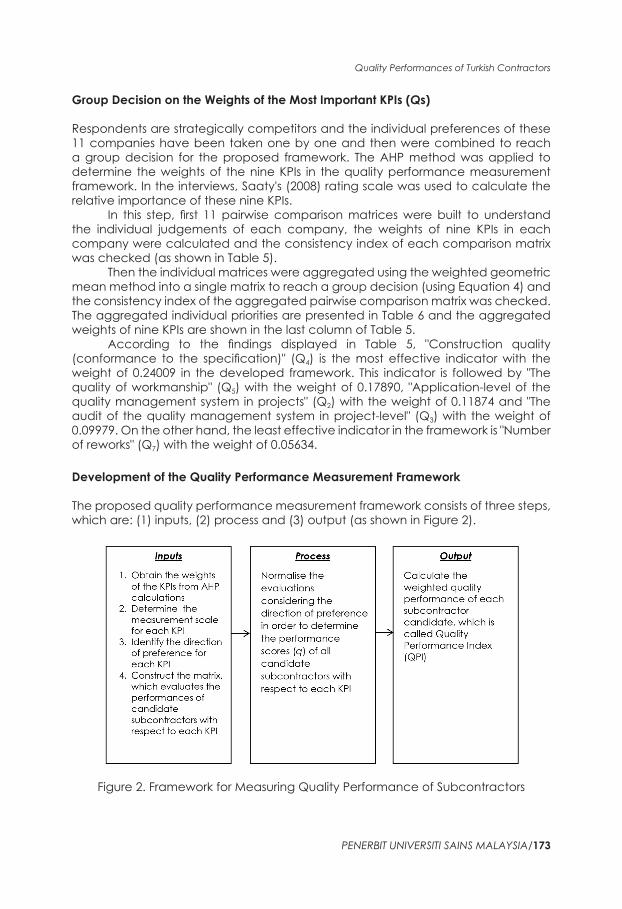
Quality Performances of Turkish Contractors
PENERBIT UNIVERSITI SAINS MALAYSIA173
Group decision on the Weights of the Most Important KPIs (Qs)
Respondents are strategically competitors and the individual preferences of these 11 companies have been taken one by one and then were combined to reach a group decision for the proposed framework The AHP method was applied to determine the weights of the nine KPIs in the quality performance measurement framework In the interviews Saatys (2008) rating scale was used to calculate the relative importance of these nine KPIs
In this step first 11 pairwise comparison matrices were built to understand the individual judgements of each company the weights of nine KPIs in each company were calculated and the consistency index of each comparison matrix was checked (as shown in Table 5)
Then the individual matrices were aggregated using the weighted geometric mean method into a single matrix to reach a group decision (using Equation 4) and the consistency index of the aggregated pairwise comparison matrix was checked The aggregated individual priorities are presented in Table 6 and the aggregated weights of nine KPIs are shown in the last column of Table 5
According to the findings displayed in Table 5 Construction quality (conformance to the specification) (Q4) is the most effective indicator with the weight of 024009 in the developed framework This indicator is followed by The quality of workmanship (Q5) with the weight of 017890 Application-level of the quality management system in projects (Q2) with the weight of 011874 and The audit of the quality management system in project-level (Q3) with the weight of 009979 On the other hand the least effective indicator in the framework is Number of reworks (Q7) with the weight of 005634
development of the Quality Performance Measurement Framework
The proposed quality performance measurement framework consists of three steps which are (1) inputs (2) process and (3) output (as shown in Figure 2)
Figure 2 Framework for Measuring Quality Performance of Subcontractors
Befrin Neval Bingol and Gul Polat
174PENERBIT UNIVERSITI SAINS MALAYSIA
Tabl
e 5
Ind
ivid
ual P
riorit
ies o
f Nin
e KP
Is A
ccor
din
g to
the
11 T
urki
sh G
ener
al C
ontra
ctor
Com
pani
es
wGC
1w
GC
2w
GC
3w
GC
4w
GC
5w
GC
6w
GC
7w
GC
8w
GC
9w
GC10
wGC
11wQG
1
Q1
010
252
010
673
007
935
010
000
027
167
010
605
005
593
008
900
004
907
004
901
002
712
008
881
Q2
010
252
022
065
010
146
010
000
008
751
010
605
005
593
008
900
015
056
004
901
025
479
011
880
Q3
010
252
015
801
014
647
010
000
008
751
010
605
009
904
006
572
015
056
004
901
002
712
009
960
Q4
018
472
015
801
028
382
020
000
027
168
019
915
037
413
013
802
022
251
026
073
017
534
024
070
Q5
018
472
007
485
022
584
020
000
016
496
010
605
028
481
013
802
015
056
026
073
010
653
017
886
Q6
010
252
010
673
005
088
010
000
002
917
010
605
003
254
018
842
002
096
009
416
002
654
006
956
Q7
010
252
005
009
002
669
010
000
002
917
005
853
003
254
001
617
008
525
004
901
010
361
005
623
Q8
006
700
005
009
005
088
005
000
002
917
010
605
003
254
008
724
008
525
009
416
017
534
007
377
Q9
005
096
007
485
003
462
005
000
002
917
010
605
003
254
018
842
008
525
009
416
010
361
007
368
CR
000
890
001
700
001
290
000
000
000
110
000
370
000
900
001
850
000
770
000
090
000
600
Tabl
e 6
An
Agg
rega
ted
Pai
rwise
Com
paris
on M
atrix
of 1
1 Tu
rkish
Con
tract
ors
Q1
Q2
Q3
Q4
Q5
Q6
Q7
Q8
Q9
Q1
10
722
088
160
3537
049
071
3493
158
811
2535
122
11
Q2
138
511
122
110
4847
062
161
7152
204
331
6733
163
01
Q3
113
430
8189
10
4012
053
571
5121
180
81
3493
138
51
Q4
282
72
063
249
221
155
443
3114
389
713
076
301
42
Q5
203
811
6086
186
690
6433
12
5126
332
712
4922
235
04
Q6
074
110
583
066
130
302
039
81
122
110
9638
1
Q7
062
970
4894
055
310
2566
030
060
8189
10
7616
072
2
Q8
079
780
5976
074
110
3251
040
121
0375
131
31
106
5
Q9
081
890
6134
072
20
3318
042
551
138
510
9389
1
Quality Performances of Turkish Contractors
PENERBIT UNIVERSITI SAINS MALAYSIA175
Inputs of the framework include group decision on the weights of the most important KPIs (Qs) which are obtained from AHP calculations measurement scales for each KPI the direction of preference of each KPI (minimum is the most favourable or maximum is the most favourable) and the evaluations of all candidate subcontractors with respect to each KPI
Having determined the inputs values in the process step the performance scores (q) of all candidate subcontractors are calculated by normalising the evaluations concerning each KPI considering the direction of preference If the direction of preference is maximum the quantitative equivalence of the evaluation of a subcontractor candidate for any KPI is divided by the sum of the evaluations of all subcontractors to the KPI in question On the other hand if the direction of preference is minimum the reciprocals of the quantitative equivalences of the evaluations are normalised By this way the subcontractor candidate with the minimum value becomes more favourable
In the output step the overall quality performance index (QPI) of each subcontractor candidate can be calculated using Equation 5
QPI w q1
9
SC iG
iim m=
= (Eq 5)
Where QPISCm represents the overall QPI of the mth subcontractor wiG represents
the aggregated weight of the ith KPI (Qi) based on group decision and qim represents the performance score of the mth subcontractor candidate for the ith KPI (Qi)
An Illustrative Example of the Application of the Proposed Quality Performance Measurement Framework
An illustrative example has been presented to demonstrate how the proposed framework can be used by a Turkish general contractor who intends to evaluate the quality performances of the subcontractor candidates under consideration for an international construction project
In the illustrative example (as shown in Table 7) there are five subcontractor candidates First the general contractor determines the measurement scales for each KPI identifies the direction of preference of each KPI and evaluates all candidate subcontractors for each KPI based on the identified measurement scale The weights of the KPIs are obtained from the AHP calculations presented in the last column of Table 5 Second the general contractor calculates the performance scores (q) of all candidate subcontractors And finally the general contractor computes the overall QPI of all candidate subcontractors In the illustrative example the overall quality performance of the fourth subcontractor candidate (SC_4) is higher than the other candidates
Befrin Neval Bingol and Gul Polat
176PENERBIT UNIVERSITI SAINS MALAYSIA
Tabl
e 7
An
Illust
rativ
e Ex
ampl
e of
the
App
licat
ion
of th
e Pr
opos
ed F
ram
ewor
k
Q
Q D
efini
tion
Mea
sure
men
t Sc
ales
dire
ctio
n of
Pr
efer
ence
sW
eigh
tsEv
alua
tions
of S
ubco
ntra
ctor
Can
dida
tes
Qua
lity
Scor
es o
f Sub
cont
ract
or C
andi
date
s
SC_1
SC_2
SC_3
SC_4
SC_5
q_1
q_2
q_3
q_4
q_5
Q1
Ad
equa
cy o
f qu
ality
ass
uran
ce
polic
y
VBndash
VG
2M
ax
008
881
GV
GM
GV
G0
190
023
80
143
019
00
238
Q2
The
appl
icat
ion
leve
l of t
he q
ualit
y m
anag
emen
t sy
stem
in p
roje
cts
VBndash
VG
Max
0
1188
0G
MM
MG
023
50
176
017
60
176
023
5
Q3
The
aud
it of
th
e qu
ality
m
anag
emen
t sy
stem
in p
roje
ct
leve
l
VBndash
VG
Max
0
0996
0M
GG
VG
M0
158
021
10
211
026
30
158
Q4
Con
stru
ctio
n qu
ality
(c
onfo
rman
ce to
th
e sp
ecifi
catio
n)
VBndash
VG
Max
0
2407
0G
VG
GM
G0
200
025
00
200
015
00
200
Q5
The
qual
ity o
f w
orkm
ansh
ipV
BndashV
GM
ax
017
886
VG
MV
GG
M0
250
015
00
250
020
00
150
Q6
The
cost
of
poor
qua
lity
resu
lting
from
th
e lo
w st
and
ard
pr
oduc
tion
M
in
006
956
12
29
21
11
10
234
009
70
134
028
10
255
Q7
Num
ber o
f rew
orks
Num
ber
Min
0
0562
314
98
411
011
00
171
019
30
386
014
0
Q8
Perc
enta
ge o
f re
wor
ks (
)
Min
0
0737
73
24
44
11
83
30
190
013
80
149
033
80
185
Q9
The
seve
rity
of
def
ect a
t the
co
nstru
ctio
n ph
ase
VLndash
VH
3M
in
007
368
MH
MV
HH
024
40
183
024
40
146
018
3
QPI
020
80
190
019
70
213
019
3
Not
es V
B =
Ver
y Ba
d (1
) B
= Ba
d (2
) M
= M
ediu
m (3
) G
= G
ood
(4)
VG
= V
ery
Goo
d (5
) V
L =
Ver
y Lo
w (1
) L
= Lo
w (2
) M
= M
ediu
m (3
) H
= Hi
gh (4
) V
H =
Ver
y Hi
gh (5
)
Quality Performances of Turkish Contractors
PENERBIT UNIVERSITI SAINS MALAYSIA177
ConCLuSIon
Since most of the international construction projects are highly complex in nature they require the involvement of multiple subcontractors therefore the selection of the most appropriate subcontractor becomes crucial for the overall project success The subcontractor selection process is mostly affected by several compromising and conflicting tangible and intangible criteria While the criteria like cost and time can be numerically measured the criteria like safety and quality cannot be easily measured This study aimed to solve this issue by developing a framework for measuring the quality performances of subcontractor candidates more systematically and rationally way To use the proposed framework subcontractor candidates should be assessed based on the identified nine KPIs After these assessments the quality performance of the candidates can be determined using the proposed framework The measurement framework includes indicators that can be measured quantitatively and qualitatively
The limitations of this study are related to the developed framework relying on the individual preferences of the 11 Turkish companies that are also the target users This potential limitation can be overcome by increasing the sample size Moreover the performance of the proposed framework should be tested with real cases
rEFErEnCES
Ali HAEM Al-Sulaihi IA and Al-Gahtani KS (2013) Indicators for measuring performance of building construction companies in Kingdom of Saudi Arabia Journal of King Saud University ndash Engineering Sciences 25(2) 125ndash134 httpsdoiorg101016jjksues201203002
Arslan G Kivrak S Birgonul MT and Dikmen I (2008) Improving sub-contractor selection process in construction projects Web-based sub-contractor evaluation system (WEBSES) Automation in Construction 17(4) 480ndash488 httpsdoiorg101016jautcon200708004
Bingol BN and Polat G (2016) Measuring quality performances of subcontractors using key performance indicators (KPIs) model Paper presented at the 12th International Congress on Advances in Civil Engineering Istanbul Turkey 21ndash23 September
Chan APC and Chan APL (2004) Key performance indicators for measuring construction success Benchmarking An International Journal 11(2) 203ndash221 httpsdoiorg10110814635770410532624
Chen Y Okudan GE and Riley DR (2010) Sustainable performance criteria for construction method selection in concrete buildings Automation in Construction 19(2) 235ndash244 httpsdoiorg101016jautcon200910004
Choudhry RM Hinze JW Arshad M and Gabriel HF (2012) Subcontracting practices in the construction industry of Pakistan Journal of Construction Engineering and Management 138(12) 1353ndash1359 httpsdoiorg101061(ASCE)CO1943-78620000562
El-Mashaleh MS (2009) A construction subcontractor selection model Jordan Journal of Civil Engineering 3(4) 375ndash383
Enshassi A Choudhry RM Mayer PE and Shoman Y (2008) Safety performance of subcontractors in the Palestinian construction industry Journal of Construction in Developing Countries 13(1) 51ndash62
Befrin Neval Bingol and Gul Polat
178PENERBIT UNIVERSITI SAINS MALAYSIA
Enshassi A Mohamed S and Abushaban S (2009) Factors affecting the performance of construction projects in the Gaza strip Journal of Civil Engineering and Management 15(3) 269ndash280 httpsdoiorg1038461392-3730200915269-280
Escobar MT Aguaroacuten J and Moreno-Jimeacutenez JM (2004) A note on AHP group consistency for the row geometric mean priorization procedure European Journal of Operational Research 153(2) 318ndash322 httpsdoiorg101016S0377-2217(03)00154-1
Field A (2017) Discovering Statistics Using IBM SPSS Statistics North American Edition Thousand Oaks CA SAGE
Hartmann A Ling FYY and Tan JS (2009) Relative importance of subcontractor selection criteria Evidence from Singapore Journal of Construction Engineering and Management 135(9) 826ndash832 httpsdoiorg101061(ASCE)0733-9364(2009)1359(826)
Hatush Z and Skitmore M (1997) Criteria for contractor selection Construction Management and Economics 15(1) 19ndash38 httpsdoiorg101080014461997373088
Kagioglou M Cooper R and Aouad G (2001) Performance management in construction A conceptual framework Construction Management and Economics 19(1) 85ndash95 httpsdoiorg10108001446190010003425
Lee A Cooper R and Aouad G (2000) A methodology for designing performance measures for the UK construction industry Paper presented at the Bizarre Fruit 2000 Postgraduate Research Conference on the Built and Human Environment University of Salford Salford UK 9ndash10 March
Lin G and Shen Q (2007) Measuring the performance of value management studies in construction Critical review Journal of Management in Engineering 23(1) 2ndash9 httpsdoiorg101061(ASCE)0742-597X(2007)231(2)
Luu VT Kim S-Y and Huynh T-A (2008) Improving project management performance of large contractors using benchmarking approach International Journal of Project Management 26(7) 758ndash769 httpsdoiorg 101016jijproman200710002
Mahdi IM Riley MJ Fereig SM and Alex AP (2002) A multi-criteria approach to contractor selection Engineering Construction and Architectural Management 9(1) 29ndash37 httpsdoiorg101108eb021204
Marzouk MM El Kherbawy AA and Khalifa M (2013) Factors influencing sub-contractors selection in construction projects HBRC Journal 9(2) 150ndash158 httpsdoiorg101016jhbrcj201305001
Mbachu J (2008) Conceptual framework for the assessment of subcontractors eligibility and performance in the construction industry Construction Management and Economics 26(5) 471ndash484 httpsdoiorg10108001446190801918730
Ng ST and Skitmore M (2014) Developing a framework for subcontractor appraisal using a balanced scorecard Journal of Civil Engineering and Management 20(2) 149ndash158 httpsdoiorg103846139237302013802705
Onder G and Onder E (2014) AHS In E Oumlnder and BF Yildirim (eds) Ccedilok Kriterli Karar Verme Istanbul Dora Yayincilik 21ndash64
Saaty T (1980) The Analytic Process Planning Priority Setting Resources Allocation London McGraw-Hill
Quality Performances of Turkish Contractors
PENERBIT UNIVERSITI SAINS MALAYSIA179
Saaty TL (2008) Decision making with the analytic hierarchy process International Journal of Services Sciences 1(1) 83ndash98 httpsdoiorg101504IJSSCI2008017590
Saaty TL and Vargas LG (2012) Models Methods Concepts and Applications of the Analytic Hierarchy Process BerlinHeidelberg Springer Science and Business Media 175
Timor M (2011) Analitik Hiyerarsi Prosesi Istanbul Turkmen KitabeviTrinkūnienė E Podvezko V Zavadskas EK Jokšienė I Vinogradova I and
Trinkūnas V (2017) Evaluation of quality assurance in contractor contracts by multi-attribute decision-making methods Economic Research ndash Ekonomska Istraživanja 30(1) 1152ndash1180 httpsdoiorg1010801331677X20171325616
Tserng HP and Lin PH (2002) An accelerated subcontracting and procuring model for construction projects Automation in Construction 11(1) 105ndash125 httpsdoiorg101016S0926-5805(01)00056-5
Turkish Contractors Association (TCA) (2018) Turkish Contractors Association Sector Report Ankara TCA
Ulubeyli S Manisali E and Kazaz A (2010) Subcontractor selection practices in international construction projects Journal of Civil Engineering and Management 16(1) 47ndash56 httpsdoiorg103846jcem201004
Vaidya OS and Kumar S (2006) Analytic hierarchy process An overview of applications European Journal of Operational Research 169(1) 1ndash29 httpsdoiorg101016jejor200404028
Ward S Curtis B and Chapman C (1991) Objectives and performance in construction projects Construction Management and Economics 9(4) 343ndash353 httpsdoiorg10108001446199100000027
Yang H Yeung JF Chan AP Chiang Y and Chan DW (2010) A critical review of performance measurement in construction Journal of Facilities Management 8(4) 269ndash284 httpsdoiorg10110814725961011078981
Yasamis-Speroni F Lee D-E and Arditi D (2012) Evaluating the quality performance of pavement contractors Journal of Construction Engineering and Management 138(10) 1114ndash1124 httpsdoiorg101061(ASCE)CO1943-78620000539
Yu I Kim K Jung Y and Chin S (2007) Comparable performance measurement system for construction companies Journal of Management in Engineering 23(3) 131ndash139 httpsdoiorg101061(ASCE)0742-597X(2007)233(131)

Befrin Neval Bingol and Gul Polat
174PENERBIT UNIVERSITI SAINS MALAYSIA
Tabl
e 5
Ind
ivid
ual P
riorit
ies o
f Nin
e KP
Is A
ccor
din
g to
the
11 T
urki
sh G
ener
al C
ontra
ctor
Com
pani
es
wGC
1w
GC
2w
GC
3w
GC
4w
GC
5w
GC
6w
GC
7w
GC
8w
GC
9w
GC10
wGC
11wQG
1
Q1
010
252
010
673
007
935
010
000
027
167
010
605
005
593
008
900
004
907
004
901
002
712
008
881
Q2
010
252
022
065
010
146
010
000
008
751
010
605
005
593
008
900
015
056
004
901
025
479
011
880
Q3
010
252
015
801
014
647
010
000
008
751
010
605
009
904
006
572
015
056
004
901
002
712
009
960
Q4
018
472
015
801
028
382
020
000
027
168
019
915
037
413
013
802
022
251
026
073
017
534
024
070
Q5
018
472
007
485
022
584
020
000
016
496
010
605
028
481
013
802
015
056
026
073
010
653
017
886
Q6
010
252
010
673
005
088
010
000
002
917
010
605
003
254
018
842
002
096
009
416
002
654
006
956
Q7
010
252
005
009
002
669
010
000
002
917
005
853
003
254
001
617
008
525
004
901
010
361
005
623
Q8
006
700
005
009
005
088
005
000
002
917
010
605
003
254
008
724
008
525
009
416
017
534
007
377
Q9
005
096
007
485
003
462
005
000
002
917
010
605
003
254
018
842
008
525
009
416
010
361
007
368
CR
000
890
001
700
001
290
000
000
000
110
000
370
000
900
001
850
000
770
000
090
000
600
Tabl
e 6
An
Agg
rega
ted
Pai
rwise
Com
paris
on M
atrix
of 1
1 Tu
rkish
Con
tract
ors
Q1
Q2
Q3
Q4
Q5
Q6
Q7
Q8
Q9
Q1
10
722
088
160
3537
049
071
3493
158
811
2535
122
11
Q2
138
511
122
110
4847
062
161
7152
204
331
6733
163
01
Q3
113
430
8189
10
4012
053
571
5121
180
81
3493
138
51
Q4
282
72
063
249
221
155
443
3114
389
713
076
301
42
Q5
203
811
6086
186
690
6433
12
5126
332
712
4922
235
04
Q6
074
110
583
066
130
302
039
81
122
110
9638
1
Q7
062
970
4894
055
310
2566
030
060
8189
10
7616
072
2
Q8
079
780
5976
074
110
3251
040
121
0375
131
31
106
5
Q9
081
890
6134
072
20
3318
042
551
138
510
9389
1
Quality Performances of Turkish Contractors
PENERBIT UNIVERSITI SAINS MALAYSIA175
Inputs of the framework include group decision on the weights of the most important KPIs (Qs) which are obtained from AHP calculations measurement scales for each KPI the direction of preference of each KPI (minimum is the most favourable or maximum is the most favourable) and the evaluations of all candidate subcontractors with respect to each KPI
Having determined the inputs values in the process step the performance scores (q) of all candidate subcontractors are calculated by normalising the evaluations concerning each KPI considering the direction of preference If the direction of preference is maximum the quantitative equivalence of the evaluation of a subcontractor candidate for any KPI is divided by the sum of the evaluations of all subcontractors to the KPI in question On the other hand if the direction of preference is minimum the reciprocals of the quantitative equivalences of the evaluations are normalised By this way the subcontractor candidate with the minimum value becomes more favourable
In the output step the overall quality performance index (QPI) of each subcontractor candidate can be calculated using Equation 5
QPI w q1
9
SC iG
iim m=
= (Eq 5)
Where QPISCm represents the overall QPI of the mth subcontractor wiG represents
the aggregated weight of the ith KPI (Qi) based on group decision and qim represents the performance score of the mth subcontractor candidate for the ith KPI (Qi)
An Illustrative Example of the Application of the Proposed Quality Performance Measurement Framework
An illustrative example has been presented to demonstrate how the proposed framework can be used by a Turkish general contractor who intends to evaluate the quality performances of the subcontractor candidates under consideration for an international construction project
In the illustrative example (as shown in Table 7) there are five subcontractor candidates First the general contractor determines the measurement scales for each KPI identifies the direction of preference of each KPI and evaluates all candidate subcontractors for each KPI based on the identified measurement scale The weights of the KPIs are obtained from the AHP calculations presented in the last column of Table 5 Second the general contractor calculates the performance scores (q) of all candidate subcontractors And finally the general contractor computes the overall QPI of all candidate subcontractors In the illustrative example the overall quality performance of the fourth subcontractor candidate (SC_4) is higher than the other candidates
Befrin Neval Bingol and Gul Polat
176PENERBIT UNIVERSITI SAINS MALAYSIA
Tabl
e 7
An
Illust
rativ
e Ex
ampl
e of
the
App
licat
ion
of th
e Pr
opos
ed F
ram
ewor
k
Q
Q D
efini
tion
Mea
sure
men
t Sc
ales
dire
ctio
n of
Pr
efer
ence
sW
eigh
tsEv
alua
tions
of S
ubco
ntra
ctor
Can
dida
tes
Qua
lity
Scor
es o
f Sub
cont
ract
or C
andi
date
s
SC_1
SC_2
SC_3
SC_4
SC_5
q_1
q_2
q_3
q_4
q_5
Q1
Ad
equa
cy o
f qu
ality
ass
uran
ce
polic
y
VBndash
VG
2M
ax
008
881
GV
GM
GV
G0
190
023
80
143
019
00
238
Q2
The
appl
icat
ion
leve
l of t
he q
ualit
y m
anag
emen
t sy
stem
in p
roje
cts
VBndash
VG
Max
0
1188
0G
MM
MG
023
50
176
017
60
176
023
5
Q3
The
aud
it of
th
e qu
ality
m
anag
emen
t sy
stem
in p
roje
ct
leve
l
VBndash
VG
Max
0
0996
0M
GG
VG
M0
158
021
10
211
026
30
158
Q4
Con
stru
ctio
n qu
ality
(c
onfo
rman
ce to
th
e sp
ecifi
catio
n)
VBndash
VG
Max
0
2407
0G
VG
GM
G0
200
025
00
200
015
00
200
Q5
The
qual
ity o
f w
orkm
ansh
ipV
BndashV
GM
ax
017
886
VG
MV
GG
M0
250
015
00
250
020
00
150
Q6
The
cost
of
poor
qua
lity
resu
lting
from
th
e lo
w st
and
ard
pr
oduc
tion
M
in
006
956
12
29
21
11
10
234
009
70
134
028
10
255
Q7
Num
ber o
f rew
orks
Num
ber
Min
0
0562
314
98
411
011
00
171
019
30
386
014
0
Q8
Perc
enta
ge o
f re
wor
ks (
)
Min
0
0737
73
24
44
11
83
30
190
013
80
149
033
80
185
Q9
The
seve
rity
of
def
ect a
t the
co
nstru
ctio
n ph
ase
VLndash
VH
3M
in
007
368
MH
MV
HH
024
40
183
024
40
146
018
3
QPI
020
80
190
019
70
213
019
3
Not
es V
B =
Ver
y Ba
d (1
) B
= Ba
d (2
) M
= M
ediu
m (3
) G
= G
ood
(4)
VG
= V
ery
Goo
d (5
) V
L =
Ver
y Lo
w (1
) L
= Lo
w (2
) M
= M
ediu
m (3
) H
= Hi
gh (4
) V
H =
Ver
y Hi
gh (5
)
Quality Performances of Turkish Contractors
PENERBIT UNIVERSITI SAINS MALAYSIA177
ConCLuSIon
Since most of the international construction projects are highly complex in nature they require the involvement of multiple subcontractors therefore the selection of the most appropriate subcontractor becomes crucial for the overall project success The subcontractor selection process is mostly affected by several compromising and conflicting tangible and intangible criteria While the criteria like cost and time can be numerically measured the criteria like safety and quality cannot be easily measured This study aimed to solve this issue by developing a framework for measuring the quality performances of subcontractor candidates more systematically and rationally way To use the proposed framework subcontractor candidates should be assessed based on the identified nine KPIs After these assessments the quality performance of the candidates can be determined using the proposed framework The measurement framework includes indicators that can be measured quantitatively and qualitatively
The limitations of this study are related to the developed framework relying on the individual preferences of the 11 Turkish companies that are also the target users This potential limitation can be overcome by increasing the sample size Moreover the performance of the proposed framework should be tested with real cases
rEFErEnCES
Ali HAEM Al-Sulaihi IA and Al-Gahtani KS (2013) Indicators for measuring performance of building construction companies in Kingdom of Saudi Arabia Journal of King Saud University ndash Engineering Sciences 25(2) 125ndash134 httpsdoiorg101016jjksues201203002
Arslan G Kivrak S Birgonul MT and Dikmen I (2008) Improving sub-contractor selection process in construction projects Web-based sub-contractor evaluation system (WEBSES) Automation in Construction 17(4) 480ndash488 httpsdoiorg101016jautcon200708004
Bingol BN and Polat G (2016) Measuring quality performances of subcontractors using key performance indicators (KPIs) model Paper presented at the 12th International Congress on Advances in Civil Engineering Istanbul Turkey 21ndash23 September
Chan APC and Chan APL (2004) Key performance indicators for measuring construction success Benchmarking An International Journal 11(2) 203ndash221 httpsdoiorg10110814635770410532624
Chen Y Okudan GE and Riley DR (2010) Sustainable performance criteria for construction method selection in concrete buildings Automation in Construction 19(2) 235ndash244 httpsdoiorg101016jautcon200910004
Choudhry RM Hinze JW Arshad M and Gabriel HF (2012) Subcontracting practices in the construction industry of Pakistan Journal of Construction Engineering and Management 138(12) 1353ndash1359 httpsdoiorg101061(ASCE)CO1943-78620000562
El-Mashaleh MS (2009) A construction subcontractor selection model Jordan Journal of Civil Engineering 3(4) 375ndash383
Enshassi A Choudhry RM Mayer PE and Shoman Y (2008) Safety performance of subcontractors in the Palestinian construction industry Journal of Construction in Developing Countries 13(1) 51ndash62
Befrin Neval Bingol and Gul Polat
178PENERBIT UNIVERSITI SAINS MALAYSIA
Enshassi A Mohamed S and Abushaban S (2009) Factors affecting the performance of construction projects in the Gaza strip Journal of Civil Engineering and Management 15(3) 269ndash280 httpsdoiorg1038461392-3730200915269-280
Escobar MT Aguaroacuten J and Moreno-Jimeacutenez JM (2004) A note on AHP group consistency for the row geometric mean priorization procedure European Journal of Operational Research 153(2) 318ndash322 httpsdoiorg101016S0377-2217(03)00154-1
Field A (2017) Discovering Statistics Using IBM SPSS Statistics North American Edition Thousand Oaks CA SAGE
Hartmann A Ling FYY and Tan JS (2009) Relative importance of subcontractor selection criteria Evidence from Singapore Journal of Construction Engineering and Management 135(9) 826ndash832 httpsdoiorg101061(ASCE)0733-9364(2009)1359(826)
Hatush Z and Skitmore M (1997) Criteria for contractor selection Construction Management and Economics 15(1) 19ndash38 httpsdoiorg101080014461997373088
Kagioglou M Cooper R and Aouad G (2001) Performance management in construction A conceptual framework Construction Management and Economics 19(1) 85ndash95 httpsdoiorg10108001446190010003425
Lee A Cooper R and Aouad G (2000) A methodology for designing performance measures for the UK construction industry Paper presented at the Bizarre Fruit 2000 Postgraduate Research Conference on the Built and Human Environment University of Salford Salford UK 9ndash10 March
Lin G and Shen Q (2007) Measuring the performance of value management studies in construction Critical review Journal of Management in Engineering 23(1) 2ndash9 httpsdoiorg101061(ASCE)0742-597X(2007)231(2)
Luu VT Kim S-Y and Huynh T-A (2008) Improving project management performance of large contractors using benchmarking approach International Journal of Project Management 26(7) 758ndash769 httpsdoiorg 101016jijproman200710002
Mahdi IM Riley MJ Fereig SM and Alex AP (2002) A multi-criteria approach to contractor selection Engineering Construction and Architectural Management 9(1) 29ndash37 httpsdoiorg101108eb021204
Marzouk MM El Kherbawy AA and Khalifa M (2013) Factors influencing sub-contractors selection in construction projects HBRC Journal 9(2) 150ndash158 httpsdoiorg101016jhbrcj201305001
Mbachu J (2008) Conceptual framework for the assessment of subcontractors eligibility and performance in the construction industry Construction Management and Economics 26(5) 471ndash484 httpsdoiorg10108001446190801918730
Ng ST and Skitmore M (2014) Developing a framework for subcontractor appraisal using a balanced scorecard Journal of Civil Engineering and Management 20(2) 149ndash158 httpsdoiorg103846139237302013802705
Onder G and Onder E (2014) AHS In E Oumlnder and BF Yildirim (eds) Ccedilok Kriterli Karar Verme Istanbul Dora Yayincilik 21ndash64
Saaty T (1980) The Analytic Process Planning Priority Setting Resources Allocation London McGraw-Hill
Quality Performances of Turkish Contractors
PENERBIT UNIVERSITI SAINS MALAYSIA179
Saaty TL (2008) Decision making with the analytic hierarchy process International Journal of Services Sciences 1(1) 83ndash98 httpsdoiorg101504IJSSCI2008017590
Saaty TL and Vargas LG (2012) Models Methods Concepts and Applications of the Analytic Hierarchy Process BerlinHeidelberg Springer Science and Business Media 175
Timor M (2011) Analitik Hiyerarsi Prosesi Istanbul Turkmen KitabeviTrinkūnienė E Podvezko V Zavadskas EK Jokšienė I Vinogradova I and
Trinkūnas V (2017) Evaluation of quality assurance in contractor contracts by multi-attribute decision-making methods Economic Research ndash Ekonomska Istraživanja 30(1) 1152ndash1180 httpsdoiorg1010801331677X20171325616
Tserng HP and Lin PH (2002) An accelerated subcontracting and procuring model for construction projects Automation in Construction 11(1) 105ndash125 httpsdoiorg101016S0926-5805(01)00056-5
Turkish Contractors Association (TCA) (2018) Turkish Contractors Association Sector Report Ankara TCA
Ulubeyli S Manisali E and Kazaz A (2010) Subcontractor selection practices in international construction projects Journal of Civil Engineering and Management 16(1) 47ndash56 httpsdoiorg103846jcem201004
Vaidya OS and Kumar S (2006) Analytic hierarchy process An overview of applications European Journal of Operational Research 169(1) 1ndash29 httpsdoiorg101016jejor200404028
Ward S Curtis B and Chapman C (1991) Objectives and performance in construction projects Construction Management and Economics 9(4) 343ndash353 httpsdoiorg10108001446199100000027
Yang H Yeung JF Chan AP Chiang Y and Chan DW (2010) A critical review of performance measurement in construction Journal of Facilities Management 8(4) 269ndash284 httpsdoiorg10110814725961011078981
Yasamis-Speroni F Lee D-E and Arditi D (2012) Evaluating the quality performance of pavement contractors Journal of Construction Engineering and Management 138(10) 1114ndash1124 httpsdoiorg101061(ASCE)CO1943-78620000539
Yu I Kim K Jung Y and Chin S (2007) Comparable performance measurement system for construction companies Journal of Management in Engineering 23(3) 131ndash139 httpsdoiorg101061(ASCE)0742-597X(2007)233(131)
Quality Performances of Turkish Contractors
PENERBIT UNIVERSITI SAINS MALAYSIA175
Inputs of the framework include group decision on the weights of the most important KPIs (Qs) which are obtained from AHP calculations measurement scales for each KPI the direction of preference of each KPI (minimum is the most favourable or maximum is the most favourable) and the evaluations of all candidate subcontractors with respect to each KPI
Having determined the inputs values in the process step the performance scores (q) of all candidate subcontractors are calculated by normalising the evaluations concerning each KPI considering the direction of preference If the direction of preference is maximum the quantitative equivalence of the evaluation of a subcontractor candidate for any KPI is divided by the sum of the evaluations of all subcontractors to the KPI in question On the other hand if the direction of preference is minimum the reciprocals of the quantitative equivalences of the evaluations are normalised By this way the subcontractor candidate with the minimum value becomes more favourable
In the output step the overall quality performance index (QPI) of each subcontractor candidate can be calculated using Equation 5
QPI w q1
9
SC iG
iim m=
= (Eq 5)
Where QPISCm represents the overall QPI of the mth subcontractor wiG represents
the aggregated weight of the ith KPI (Qi) based on group decision and qim represents the performance score of the mth subcontractor candidate for the ith KPI (Qi)
An Illustrative Example of the Application of the Proposed Quality Performance Measurement Framework
An illustrative example has been presented to demonstrate how the proposed framework can be used by a Turkish general contractor who intends to evaluate the quality performances of the subcontractor candidates under consideration for an international construction project
In the illustrative example (as shown in Table 7) there are five subcontractor candidates First the general contractor determines the measurement scales for each KPI identifies the direction of preference of each KPI and evaluates all candidate subcontractors for each KPI based on the identified measurement scale The weights of the KPIs are obtained from the AHP calculations presented in the last column of Table 5 Second the general contractor calculates the performance scores (q) of all candidate subcontractors And finally the general contractor computes the overall QPI of all candidate subcontractors In the illustrative example the overall quality performance of the fourth subcontractor candidate (SC_4) is higher than the other candidates
Befrin Neval Bingol and Gul Polat
176PENERBIT UNIVERSITI SAINS MALAYSIA
Tabl
e 7
An
Illust
rativ
e Ex
ampl
e of
the
App
licat
ion
of th
e Pr
opos
ed F
ram
ewor
k
Q
Q D
efini
tion
Mea
sure
men
t Sc
ales
dire
ctio
n of
Pr
efer
ence
sW
eigh
tsEv
alua
tions
of S
ubco
ntra
ctor
Can
dida
tes
Qua
lity
Scor
es o
f Sub
cont
ract
or C
andi
date
s
SC_1
SC_2
SC_3
SC_4
SC_5
q_1
q_2
q_3
q_4
q_5
Q1
Ad
equa
cy o
f qu
ality
ass
uran
ce
polic
y
VBndash
VG
2M
ax
008
881
GV
GM
GV
G0
190
023
80
143
019
00
238
Q2
The
appl
icat
ion
leve
l of t
he q
ualit
y m
anag
emen
t sy
stem
in p
roje
cts
VBndash
VG
Max
0
1188
0G
MM
MG
023
50
176
017
60
176
023
5
Q3
The
aud
it of
th
e qu
ality
m
anag
emen
t sy
stem
in p
roje
ct
leve
l
VBndash
VG
Max
0
0996
0M
GG
VG
M0
158
021
10
211
026
30
158
Q4
Con
stru
ctio
n qu
ality
(c
onfo
rman
ce to
th
e sp
ecifi
catio
n)
VBndash
VG
Max
0
2407
0G
VG
GM
G0
200
025
00
200
015
00
200
Q5
The
qual
ity o
f w
orkm
ansh
ipV
BndashV
GM
ax
017
886
VG
MV
GG
M0
250
015
00
250
020
00
150
Q6
The
cost
of
poor
qua
lity
resu
lting
from
th
e lo
w st
and
ard
pr
oduc
tion
M
in
006
956
12
29
21
11
10
234
009
70
134
028
10
255
Q7
Num
ber o
f rew
orks
Num
ber
Min
0
0562
314
98
411
011
00
171
019
30
386
014
0
Q8
Perc
enta
ge o
f re
wor
ks (
)
Min
0
0737
73
24
44
11
83
30
190
013
80
149
033
80
185
Q9
The
seve
rity
of
def
ect a
t the
co
nstru
ctio
n ph
ase
VLndash
VH
3M
in
007
368
MH
MV
HH
024
40
183
024
40
146
018
3
QPI
020
80
190
019
70
213
019
3
Not
es V
B =
Ver
y Ba
d (1
) B
= Ba
d (2
) M
= M
ediu
m (3
) G
= G
ood
(4)
VG
= V
ery
Goo
d (5
) V
L =
Ver
y Lo
w (1
) L
= Lo
w (2
) M
= M
ediu
m (3
) H
= Hi
gh (4
) V
H =
Ver
y Hi
gh (5
)
Quality Performances of Turkish Contractors
PENERBIT UNIVERSITI SAINS MALAYSIA177
ConCLuSIon
Since most of the international construction projects are highly complex in nature they require the involvement of multiple subcontractors therefore the selection of the most appropriate subcontractor becomes crucial for the overall project success The subcontractor selection process is mostly affected by several compromising and conflicting tangible and intangible criteria While the criteria like cost and time can be numerically measured the criteria like safety and quality cannot be easily measured This study aimed to solve this issue by developing a framework for measuring the quality performances of subcontractor candidates more systematically and rationally way To use the proposed framework subcontractor candidates should be assessed based on the identified nine KPIs After these assessments the quality performance of the candidates can be determined using the proposed framework The measurement framework includes indicators that can be measured quantitatively and qualitatively
The limitations of this study are related to the developed framework relying on the individual preferences of the 11 Turkish companies that are also the target users This potential limitation can be overcome by increasing the sample size Moreover the performance of the proposed framework should be tested with real cases
rEFErEnCES
Ali HAEM Al-Sulaihi IA and Al-Gahtani KS (2013) Indicators for measuring performance of building construction companies in Kingdom of Saudi Arabia Journal of King Saud University ndash Engineering Sciences 25(2) 125ndash134 httpsdoiorg101016jjksues201203002
Arslan G Kivrak S Birgonul MT and Dikmen I (2008) Improving sub-contractor selection process in construction projects Web-based sub-contractor evaluation system (WEBSES) Automation in Construction 17(4) 480ndash488 httpsdoiorg101016jautcon200708004
Bingol BN and Polat G (2016) Measuring quality performances of subcontractors using key performance indicators (KPIs) model Paper presented at the 12th International Congress on Advances in Civil Engineering Istanbul Turkey 21ndash23 September
Chan APC and Chan APL (2004) Key performance indicators for measuring construction success Benchmarking An International Journal 11(2) 203ndash221 httpsdoiorg10110814635770410532624
Chen Y Okudan GE and Riley DR (2010) Sustainable performance criteria for construction method selection in concrete buildings Automation in Construction 19(2) 235ndash244 httpsdoiorg101016jautcon200910004
Choudhry RM Hinze JW Arshad M and Gabriel HF (2012) Subcontracting practices in the construction industry of Pakistan Journal of Construction Engineering and Management 138(12) 1353ndash1359 httpsdoiorg101061(ASCE)CO1943-78620000562
El-Mashaleh MS (2009) A construction subcontractor selection model Jordan Journal of Civil Engineering 3(4) 375ndash383
Enshassi A Choudhry RM Mayer PE and Shoman Y (2008) Safety performance of subcontractors in the Palestinian construction industry Journal of Construction in Developing Countries 13(1) 51ndash62
Befrin Neval Bingol and Gul Polat
178PENERBIT UNIVERSITI SAINS MALAYSIA
Enshassi A Mohamed S and Abushaban S (2009) Factors affecting the performance of construction projects in the Gaza strip Journal of Civil Engineering and Management 15(3) 269ndash280 httpsdoiorg1038461392-3730200915269-280
Escobar MT Aguaroacuten J and Moreno-Jimeacutenez JM (2004) A note on AHP group consistency for the row geometric mean priorization procedure European Journal of Operational Research 153(2) 318ndash322 httpsdoiorg101016S0377-2217(03)00154-1
Field A (2017) Discovering Statistics Using IBM SPSS Statistics North American Edition Thousand Oaks CA SAGE
Hartmann A Ling FYY and Tan JS (2009) Relative importance of subcontractor selection criteria Evidence from Singapore Journal of Construction Engineering and Management 135(9) 826ndash832 httpsdoiorg101061(ASCE)0733-9364(2009)1359(826)
Hatush Z and Skitmore M (1997) Criteria for contractor selection Construction Management and Economics 15(1) 19ndash38 httpsdoiorg101080014461997373088
Kagioglou M Cooper R and Aouad G (2001) Performance management in construction A conceptual framework Construction Management and Economics 19(1) 85ndash95 httpsdoiorg10108001446190010003425
Lee A Cooper R and Aouad G (2000) A methodology for designing performance measures for the UK construction industry Paper presented at the Bizarre Fruit 2000 Postgraduate Research Conference on the Built and Human Environment University of Salford Salford UK 9ndash10 March
Lin G and Shen Q (2007) Measuring the performance of value management studies in construction Critical review Journal of Management in Engineering 23(1) 2ndash9 httpsdoiorg101061(ASCE)0742-597X(2007)231(2)
Luu VT Kim S-Y and Huynh T-A (2008) Improving project management performance of large contractors using benchmarking approach International Journal of Project Management 26(7) 758ndash769 httpsdoiorg 101016jijproman200710002
Mahdi IM Riley MJ Fereig SM and Alex AP (2002) A multi-criteria approach to contractor selection Engineering Construction and Architectural Management 9(1) 29ndash37 httpsdoiorg101108eb021204
Marzouk MM El Kherbawy AA and Khalifa M (2013) Factors influencing sub-contractors selection in construction projects HBRC Journal 9(2) 150ndash158 httpsdoiorg101016jhbrcj201305001
Mbachu J (2008) Conceptual framework for the assessment of subcontractors eligibility and performance in the construction industry Construction Management and Economics 26(5) 471ndash484 httpsdoiorg10108001446190801918730
Ng ST and Skitmore M (2014) Developing a framework for subcontractor appraisal using a balanced scorecard Journal of Civil Engineering and Management 20(2) 149ndash158 httpsdoiorg103846139237302013802705
Onder G and Onder E (2014) AHS In E Oumlnder and BF Yildirim (eds) Ccedilok Kriterli Karar Verme Istanbul Dora Yayincilik 21ndash64
Saaty T (1980) The Analytic Process Planning Priority Setting Resources Allocation London McGraw-Hill
Quality Performances of Turkish Contractors
PENERBIT UNIVERSITI SAINS MALAYSIA179
Saaty TL (2008) Decision making with the analytic hierarchy process International Journal of Services Sciences 1(1) 83ndash98 httpsdoiorg101504IJSSCI2008017590
Saaty TL and Vargas LG (2012) Models Methods Concepts and Applications of the Analytic Hierarchy Process BerlinHeidelberg Springer Science and Business Media 175
Timor M (2011) Analitik Hiyerarsi Prosesi Istanbul Turkmen KitabeviTrinkūnienė E Podvezko V Zavadskas EK Jokšienė I Vinogradova I and
Trinkūnas V (2017) Evaluation of quality assurance in contractor contracts by multi-attribute decision-making methods Economic Research ndash Ekonomska Istraživanja 30(1) 1152ndash1180 httpsdoiorg1010801331677X20171325616
Tserng HP and Lin PH (2002) An accelerated subcontracting and procuring model for construction projects Automation in Construction 11(1) 105ndash125 httpsdoiorg101016S0926-5805(01)00056-5
Turkish Contractors Association (TCA) (2018) Turkish Contractors Association Sector Report Ankara TCA
Ulubeyli S Manisali E and Kazaz A (2010) Subcontractor selection practices in international construction projects Journal of Civil Engineering and Management 16(1) 47ndash56 httpsdoiorg103846jcem201004
Vaidya OS and Kumar S (2006) Analytic hierarchy process An overview of applications European Journal of Operational Research 169(1) 1ndash29 httpsdoiorg101016jejor200404028
Ward S Curtis B and Chapman C (1991) Objectives and performance in construction projects Construction Management and Economics 9(4) 343ndash353 httpsdoiorg10108001446199100000027
Yang H Yeung JF Chan AP Chiang Y and Chan DW (2010) A critical review of performance measurement in construction Journal of Facilities Management 8(4) 269ndash284 httpsdoiorg10110814725961011078981
Yasamis-Speroni F Lee D-E and Arditi D (2012) Evaluating the quality performance of pavement contractors Journal of Construction Engineering and Management 138(10) 1114ndash1124 httpsdoiorg101061(ASCE)CO1943-78620000539
Yu I Kim K Jung Y and Chin S (2007) Comparable performance measurement system for construction companies Journal of Management in Engineering 23(3) 131ndash139 httpsdoiorg101061(ASCE)0742-597X(2007)233(131)

Befrin Neval Bingol and Gul Polat
176PENERBIT UNIVERSITI SAINS MALAYSIA
Tabl
e 7
An
Illust
rativ
e Ex
ampl
e of
the
App
licat
ion
of th
e Pr
opos
ed F
ram
ewor
k
Q
Q D
efini
tion
Mea
sure
men
t Sc
ales
dire
ctio
n of
Pr
efer
ence
sW
eigh
tsEv
alua
tions
of S
ubco
ntra
ctor
Can
dida
tes
Qua
lity
Scor
es o
f Sub
cont
ract
or C
andi
date
s
SC_1
SC_2
SC_3
SC_4
SC_5
q_1
q_2
q_3
q_4
q_5
Q1
Ad
equa
cy o
f qu
ality
ass
uran
ce
polic
y
VBndash
VG
2M
ax
008
881
GV
GM
GV
G0
190
023
80
143
019
00
238
Q2
The
appl
icat
ion
leve
l of t
he q
ualit
y m
anag
emen
t sy
stem
in p
roje
cts
VBndash
VG
Max
0
1188
0G
MM
MG
023
50
176
017
60
176
023
5
Q3
The
aud
it of
th
e qu
ality
m
anag
emen
t sy
stem
in p
roje
ct
leve
l
VBndash
VG
Max
0
0996
0M
GG
VG
M0
158
021
10
211
026
30
158
Q4
Con
stru
ctio
n qu
ality
(c
onfo
rman
ce to
th
e sp
ecifi
catio
n)
VBndash
VG
Max
0
2407
0G
VG
GM
G0
200
025
00
200
015
00
200
Q5
The
qual
ity o
f w
orkm
ansh
ipV
BndashV
GM
ax
017
886
VG
MV
GG
M0
250
015
00
250
020
00
150
Q6
The
cost
of
poor
qua
lity
resu
lting
from
th
e lo
w st
and
ard
pr
oduc
tion
M
in
006
956
12
29
21
11
10
234
009
70
134
028
10
255
Q7
Num
ber o
f rew
orks
Num
ber
Min
0
0562
314
98
411
011
00
171
019
30
386
014
0
Q8
Perc
enta
ge o
f re
wor
ks (
)
Min
0
0737
73
24
44
11
83
30
190
013
80
149
033
80
185
Q9
The
seve
rity
of
def
ect a
t the
co
nstru
ctio
n ph
ase
VLndash
VH
3M
in
007
368
MH
MV
HH
024
40
183
024
40
146
018
3
QPI
020
80
190
019
70
213
019
3
Not
es V
B =
Ver
y Ba
d (1
) B
= Ba
d (2
) M
= M
ediu
m (3
) G
= G
ood
(4)
VG
= V
ery
Goo
d (5
) V
L =
Ver
y Lo
w (1
) L
= Lo
w (2
) M
= M
ediu
m (3
) H
= Hi
gh (4
) V
H =
Ver
y Hi
gh (5
)
Quality Performances of Turkish Contractors
PENERBIT UNIVERSITI SAINS MALAYSIA177
ConCLuSIon
Since most of the international construction projects are highly complex in nature they require the involvement of multiple subcontractors therefore the selection of the most appropriate subcontractor becomes crucial for the overall project success The subcontractor selection process is mostly affected by several compromising and conflicting tangible and intangible criteria While the criteria like cost and time can be numerically measured the criteria like safety and quality cannot be easily measured This study aimed to solve this issue by developing a framework for measuring the quality performances of subcontractor candidates more systematically and rationally way To use the proposed framework subcontractor candidates should be assessed based on the identified nine KPIs After these assessments the quality performance of the candidates can be determined using the proposed framework The measurement framework includes indicators that can be measured quantitatively and qualitatively
The limitations of this study are related to the developed framework relying on the individual preferences of the 11 Turkish companies that are also the target users This potential limitation can be overcome by increasing the sample size Moreover the performance of the proposed framework should be tested with real cases
rEFErEnCES
Ali HAEM Al-Sulaihi IA and Al-Gahtani KS (2013) Indicators for measuring performance of building construction companies in Kingdom of Saudi Arabia Journal of King Saud University ndash Engineering Sciences 25(2) 125ndash134 httpsdoiorg101016jjksues201203002
Arslan G Kivrak S Birgonul MT and Dikmen I (2008) Improving sub-contractor selection process in construction projects Web-based sub-contractor evaluation system (WEBSES) Automation in Construction 17(4) 480ndash488 httpsdoiorg101016jautcon200708004
Bingol BN and Polat G (2016) Measuring quality performances of subcontractors using key performance indicators (KPIs) model Paper presented at the 12th International Congress on Advances in Civil Engineering Istanbul Turkey 21ndash23 September
Chan APC and Chan APL (2004) Key performance indicators for measuring construction success Benchmarking An International Journal 11(2) 203ndash221 httpsdoiorg10110814635770410532624
Chen Y Okudan GE and Riley DR (2010) Sustainable performance criteria for construction method selection in concrete buildings Automation in Construction 19(2) 235ndash244 httpsdoiorg101016jautcon200910004
Choudhry RM Hinze JW Arshad M and Gabriel HF (2012) Subcontracting practices in the construction industry of Pakistan Journal of Construction Engineering and Management 138(12) 1353ndash1359 httpsdoiorg101061(ASCE)CO1943-78620000562
El-Mashaleh MS (2009) A construction subcontractor selection model Jordan Journal of Civil Engineering 3(4) 375ndash383
Enshassi A Choudhry RM Mayer PE and Shoman Y (2008) Safety performance of subcontractors in the Palestinian construction industry Journal of Construction in Developing Countries 13(1) 51ndash62
Befrin Neval Bingol and Gul Polat
178PENERBIT UNIVERSITI SAINS MALAYSIA
Enshassi A Mohamed S and Abushaban S (2009) Factors affecting the performance of construction projects in the Gaza strip Journal of Civil Engineering and Management 15(3) 269ndash280 httpsdoiorg1038461392-3730200915269-280
Escobar MT Aguaroacuten J and Moreno-Jimeacutenez JM (2004) A note on AHP group consistency for the row geometric mean priorization procedure European Journal of Operational Research 153(2) 318ndash322 httpsdoiorg101016S0377-2217(03)00154-1
Field A (2017) Discovering Statistics Using IBM SPSS Statistics North American Edition Thousand Oaks CA SAGE
Hartmann A Ling FYY and Tan JS (2009) Relative importance of subcontractor selection criteria Evidence from Singapore Journal of Construction Engineering and Management 135(9) 826ndash832 httpsdoiorg101061(ASCE)0733-9364(2009)1359(826)
Hatush Z and Skitmore M (1997) Criteria for contractor selection Construction Management and Economics 15(1) 19ndash38 httpsdoiorg101080014461997373088
Kagioglou M Cooper R and Aouad G (2001) Performance management in construction A conceptual framework Construction Management and Economics 19(1) 85ndash95 httpsdoiorg10108001446190010003425
Lee A Cooper R and Aouad G (2000) A methodology for designing performance measures for the UK construction industry Paper presented at the Bizarre Fruit 2000 Postgraduate Research Conference on the Built and Human Environment University of Salford Salford UK 9ndash10 March
Lin G and Shen Q (2007) Measuring the performance of value management studies in construction Critical review Journal of Management in Engineering 23(1) 2ndash9 httpsdoiorg101061(ASCE)0742-597X(2007)231(2)
Luu VT Kim S-Y and Huynh T-A (2008) Improving project management performance of large contractors using benchmarking approach International Journal of Project Management 26(7) 758ndash769 httpsdoiorg 101016jijproman200710002
Mahdi IM Riley MJ Fereig SM and Alex AP (2002) A multi-criteria approach to contractor selection Engineering Construction and Architectural Management 9(1) 29ndash37 httpsdoiorg101108eb021204
Marzouk MM El Kherbawy AA and Khalifa M (2013) Factors influencing sub-contractors selection in construction projects HBRC Journal 9(2) 150ndash158 httpsdoiorg101016jhbrcj201305001
Mbachu J (2008) Conceptual framework for the assessment of subcontractors eligibility and performance in the construction industry Construction Management and Economics 26(5) 471ndash484 httpsdoiorg10108001446190801918730
Ng ST and Skitmore M (2014) Developing a framework for subcontractor appraisal using a balanced scorecard Journal of Civil Engineering and Management 20(2) 149ndash158 httpsdoiorg103846139237302013802705
Onder G and Onder E (2014) AHS In E Oumlnder and BF Yildirim (eds) Ccedilok Kriterli Karar Verme Istanbul Dora Yayincilik 21ndash64
Saaty T (1980) The Analytic Process Planning Priority Setting Resources Allocation London McGraw-Hill
Quality Performances of Turkish Contractors
PENERBIT UNIVERSITI SAINS MALAYSIA179
Saaty TL (2008) Decision making with the analytic hierarchy process International Journal of Services Sciences 1(1) 83ndash98 httpsdoiorg101504IJSSCI2008017590
Saaty TL and Vargas LG (2012) Models Methods Concepts and Applications of the Analytic Hierarchy Process BerlinHeidelberg Springer Science and Business Media 175
Timor M (2011) Analitik Hiyerarsi Prosesi Istanbul Turkmen KitabeviTrinkūnienė E Podvezko V Zavadskas EK Jokšienė I Vinogradova I and
Trinkūnas V (2017) Evaluation of quality assurance in contractor contracts by multi-attribute decision-making methods Economic Research ndash Ekonomska Istraživanja 30(1) 1152ndash1180 httpsdoiorg1010801331677X20171325616
Tserng HP and Lin PH (2002) An accelerated subcontracting and procuring model for construction projects Automation in Construction 11(1) 105ndash125 httpsdoiorg101016S0926-5805(01)00056-5
Turkish Contractors Association (TCA) (2018) Turkish Contractors Association Sector Report Ankara TCA
Ulubeyli S Manisali E and Kazaz A (2010) Subcontractor selection practices in international construction projects Journal of Civil Engineering and Management 16(1) 47ndash56 httpsdoiorg103846jcem201004
Vaidya OS and Kumar S (2006) Analytic hierarchy process An overview of applications European Journal of Operational Research 169(1) 1ndash29 httpsdoiorg101016jejor200404028
Ward S Curtis B and Chapman C (1991) Objectives and performance in construction projects Construction Management and Economics 9(4) 343ndash353 httpsdoiorg10108001446199100000027
Yang H Yeung JF Chan AP Chiang Y and Chan DW (2010) A critical review of performance measurement in construction Journal of Facilities Management 8(4) 269ndash284 httpsdoiorg10110814725961011078981
Yasamis-Speroni F Lee D-E and Arditi D (2012) Evaluating the quality performance of pavement contractors Journal of Construction Engineering and Management 138(10) 1114ndash1124 httpsdoiorg101061(ASCE)CO1943-78620000539
Yu I Kim K Jung Y and Chin S (2007) Comparable performance measurement system for construction companies Journal of Management in Engineering 23(3) 131ndash139 httpsdoiorg101061(ASCE)0742-597X(2007)233(131)

Quality Performances of Turkish Contractors
PENERBIT UNIVERSITI SAINS MALAYSIA177
ConCLuSIon
Since most of the international construction projects are highly complex in nature they require the involvement of multiple subcontractors therefore the selection of the most appropriate subcontractor becomes crucial for the overall project success The subcontractor selection process is mostly affected by several compromising and conflicting tangible and intangible criteria While the criteria like cost and time can be numerically measured the criteria like safety and quality cannot be easily measured This study aimed to solve this issue by developing a framework for measuring the quality performances of subcontractor candidates more systematically and rationally way To use the proposed framework subcontractor candidates should be assessed based on the identified nine KPIs After these assessments the quality performance of the candidates can be determined using the proposed framework The measurement framework includes indicators that can be measured quantitatively and qualitatively
The limitations of this study are related to the developed framework relying on the individual preferences of the 11 Turkish companies that are also the target users This potential limitation can be overcome by increasing the sample size Moreover the performance of the proposed framework should be tested with real cases
rEFErEnCES
Ali HAEM Al-Sulaihi IA and Al-Gahtani KS (2013) Indicators for measuring performance of building construction companies in Kingdom of Saudi Arabia Journal of King Saud University ndash Engineering Sciences 25(2) 125ndash134 httpsdoiorg101016jjksues201203002
Arslan G Kivrak S Birgonul MT and Dikmen I (2008) Improving sub-contractor selection process in construction projects Web-based sub-contractor evaluation system (WEBSES) Automation in Construction 17(4) 480ndash488 httpsdoiorg101016jautcon200708004
Bingol BN and Polat G (2016) Measuring quality performances of subcontractors using key performance indicators (KPIs) model Paper presented at the 12th International Congress on Advances in Civil Engineering Istanbul Turkey 21ndash23 September
Chan APC and Chan APL (2004) Key performance indicators for measuring construction success Benchmarking An International Journal 11(2) 203ndash221 httpsdoiorg10110814635770410532624
Chen Y Okudan GE and Riley DR (2010) Sustainable performance criteria for construction method selection in concrete buildings Automation in Construction 19(2) 235ndash244 httpsdoiorg101016jautcon200910004
Choudhry RM Hinze JW Arshad M and Gabriel HF (2012) Subcontracting practices in the construction industry of Pakistan Journal of Construction Engineering and Management 138(12) 1353ndash1359 httpsdoiorg101061(ASCE)CO1943-78620000562
El-Mashaleh MS (2009) A construction subcontractor selection model Jordan Journal of Civil Engineering 3(4) 375ndash383
Enshassi A Choudhry RM Mayer PE and Shoman Y (2008) Safety performance of subcontractors in the Palestinian construction industry Journal of Construction in Developing Countries 13(1) 51ndash62
Befrin Neval Bingol and Gul Polat
178PENERBIT UNIVERSITI SAINS MALAYSIA
Enshassi A Mohamed S and Abushaban S (2009) Factors affecting the performance of construction projects in the Gaza strip Journal of Civil Engineering and Management 15(3) 269ndash280 httpsdoiorg1038461392-3730200915269-280
Escobar MT Aguaroacuten J and Moreno-Jimeacutenez JM (2004) A note on AHP group consistency for the row geometric mean priorization procedure European Journal of Operational Research 153(2) 318ndash322 httpsdoiorg101016S0377-2217(03)00154-1
Field A (2017) Discovering Statistics Using IBM SPSS Statistics North American Edition Thousand Oaks CA SAGE
Hartmann A Ling FYY and Tan JS (2009) Relative importance of subcontractor selection criteria Evidence from Singapore Journal of Construction Engineering and Management 135(9) 826ndash832 httpsdoiorg101061(ASCE)0733-9364(2009)1359(826)
Hatush Z and Skitmore M (1997) Criteria for contractor selection Construction Management and Economics 15(1) 19ndash38 httpsdoiorg101080014461997373088
Kagioglou M Cooper R and Aouad G (2001) Performance management in construction A conceptual framework Construction Management and Economics 19(1) 85ndash95 httpsdoiorg10108001446190010003425
Lee A Cooper R and Aouad G (2000) A methodology for designing performance measures for the UK construction industry Paper presented at the Bizarre Fruit 2000 Postgraduate Research Conference on the Built and Human Environment University of Salford Salford UK 9ndash10 March
Lin G and Shen Q (2007) Measuring the performance of value management studies in construction Critical review Journal of Management in Engineering 23(1) 2ndash9 httpsdoiorg101061(ASCE)0742-597X(2007)231(2)
Luu VT Kim S-Y and Huynh T-A (2008) Improving project management performance of large contractors using benchmarking approach International Journal of Project Management 26(7) 758ndash769 httpsdoiorg 101016jijproman200710002
Mahdi IM Riley MJ Fereig SM and Alex AP (2002) A multi-criteria approach to contractor selection Engineering Construction and Architectural Management 9(1) 29ndash37 httpsdoiorg101108eb021204
Marzouk MM El Kherbawy AA and Khalifa M (2013) Factors influencing sub-contractors selection in construction projects HBRC Journal 9(2) 150ndash158 httpsdoiorg101016jhbrcj201305001
Mbachu J (2008) Conceptual framework for the assessment of subcontractors eligibility and performance in the construction industry Construction Management and Economics 26(5) 471ndash484 httpsdoiorg10108001446190801918730
Ng ST and Skitmore M (2014) Developing a framework for subcontractor appraisal using a balanced scorecard Journal of Civil Engineering and Management 20(2) 149ndash158 httpsdoiorg103846139237302013802705
Onder G and Onder E (2014) AHS In E Oumlnder and BF Yildirim (eds) Ccedilok Kriterli Karar Verme Istanbul Dora Yayincilik 21ndash64
Saaty T (1980) The Analytic Process Planning Priority Setting Resources Allocation London McGraw-Hill
Quality Performances of Turkish Contractors
PENERBIT UNIVERSITI SAINS MALAYSIA179
Saaty TL (2008) Decision making with the analytic hierarchy process International Journal of Services Sciences 1(1) 83ndash98 httpsdoiorg101504IJSSCI2008017590
Saaty TL and Vargas LG (2012) Models Methods Concepts and Applications of the Analytic Hierarchy Process BerlinHeidelberg Springer Science and Business Media 175
Timor M (2011) Analitik Hiyerarsi Prosesi Istanbul Turkmen KitabeviTrinkūnienė E Podvezko V Zavadskas EK Jokšienė I Vinogradova I and
Trinkūnas V (2017) Evaluation of quality assurance in contractor contracts by multi-attribute decision-making methods Economic Research ndash Ekonomska Istraživanja 30(1) 1152ndash1180 httpsdoiorg1010801331677X20171325616
Tserng HP and Lin PH (2002) An accelerated subcontracting and procuring model for construction projects Automation in Construction 11(1) 105ndash125 httpsdoiorg101016S0926-5805(01)00056-5
Turkish Contractors Association (TCA) (2018) Turkish Contractors Association Sector Report Ankara TCA
Ulubeyli S Manisali E and Kazaz A (2010) Subcontractor selection practices in international construction projects Journal of Civil Engineering and Management 16(1) 47ndash56 httpsdoiorg103846jcem201004
Vaidya OS and Kumar S (2006) Analytic hierarchy process An overview of applications European Journal of Operational Research 169(1) 1ndash29 httpsdoiorg101016jejor200404028
Ward S Curtis B and Chapman C (1991) Objectives and performance in construction projects Construction Management and Economics 9(4) 343ndash353 httpsdoiorg10108001446199100000027
Yang H Yeung JF Chan AP Chiang Y and Chan DW (2010) A critical review of performance measurement in construction Journal of Facilities Management 8(4) 269ndash284 httpsdoiorg10110814725961011078981
Yasamis-Speroni F Lee D-E and Arditi D (2012) Evaluating the quality performance of pavement contractors Journal of Construction Engineering and Management 138(10) 1114ndash1124 httpsdoiorg101061(ASCE)CO1943-78620000539
Yu I Kim K Jung Y and Chin S (2007) Comparable performance measurement system for construction companies Journal of Management in Engineering 23(3) 131ndash139 httpsdoiorg101061(ASCE)0742-597X(2007)233(131)


