Fragility Curves for Limited Ductile Reinforced Concrete ...
16
Australian Earthquake Engineering Society 2018 Conference, Nov. 1618, Perth Fragility Curves for Limited Ductile Reinforced Concrete Buildings E. Lumantarna 1,4 , N. Lam 1,4 , H.H. Tsang 2,4 , J. Wilson 3,4 , E. Gad 2,4 and H. Goldsworthy 1,4 1 Department of Infrastructure Engineering, The University of Melbourne, Parkville, Victoria, Australia 2 Faculty of Science, Engineering and Technology, Swinburne University of Technology, Melbourne, Victoria, Australia 3 Swinburne University of Technology, Sarawak Campus, Kuching, Sarawak, Malaysia 4 Bushfire and Natural Hazards Cooperative Research Centre (BNHCRC) ABSTRACT Reinforced concrete buildings make up the majority of Australian building stocks. Structural elements of these buildings are often designed with limited to nonductile detailing. With a very low building replacement rate many of the Australian buildings are vulnerable to major earthquakes and pose significant risk to lives, properties and economic activities. This paper presents studies on seismic vulnerability assessments of limited ductile reinforced concrete buildings. Fragility curves have been developed for three types of buildings, buildings that are mainly supported by shear or core walls, buildings that are supported by shear walls and moment resisting frames and podium-tower buildings featuring a transfer structure. The studies form a part of a collaborative research under the Bushfire and Natural Hazards Cooperative Research Centre (BNHCRC) on “cost-effective mitigation strategy development for building related earthquake risk”. Keywords: fragility curves, limited ductile reinforced concrete, seismic vulnerability assessment 1 Introduction The project “Cost-Effective Mitigation Strategy Development for Building Related Earthquake Risk” under the Bushfire and Natural Hazards Cooperative Research Centre (BNHCRC) aims to develop knowledge to facilitate evidence-based informed decision making in relation to the need for seismic retrofitting, revision of codified design requirement, and insurance policy. Cost-benefit analysis will be used as a standard tool to facilitate informed decision making. Apart from developing socio-economic loss models which are relevant to costing, seismic vulnerability assessment of different forms of structures is an essential component of the project. The current platform used in Australia for earthquake loss estimation is the Earthquake Risk Model (EQRM) (Robinson et al., 2005), which adopts the methodology used by HASUS (FEMA, 2010). However, buildings in Australia are usually designed with little to no consideration for ductile detailing and are generally more vulnerable than buildings in more seismically active regions (Edwards et al., 2004).
Transcript of Fragility Curves for Limited Ductile Reinforced Concrete ...

Australian Earthquake Engineering Society 2018 Conference, Nov. 1618, Perth
Fragility Curves for Limited Ductile Reinforced Concrete Buildings
E. Lumantarna1,4, N. Lam1,4, H.H. Tsang2,4, J. Wilson3,4, E. Gad2,4 and H. Goldsworthy1,4
1 Department of Infrastructure Engineering, The University of Melbourne, Parkville,
Victoria, Australia
2 Faculty of Science, Engineering and Technology, Swinburne University of Technology,
Melbourne, Victoria, Australia
3 Swinburne University of Technology, Sarawak Campus, Kuching, Sarawak, Malaysia
4 Bushfire and Natural Hazards Cooperative Research Centre (BNHCRC)
ABSTRACT
Reinforced concrete buildings make up the majority of Australian building stocks. Structural
elements of these buildings are often designed with limited to nonductile detailing. With a very
low building replacement rate many of the Australian buildings are vulnerable to major
earthquakes and pose significant risk to lives, properties and economic activities.
This paper presents studies on seismic vulnerability assessments of limited ductile reinforced
concrete buildings. Fragility curves have been developed for three types of buildings, buildings
that are mainly supported by shear or core walls, buildings that are supported by shear walls
and moment resisting frames and podium-tower buildings featuring a transfer structure. The
studies form a part of a collaborative research under the Bushfire and Natural Hazards
Cooperative Research Centre (BNHCRC) on “cost-effective mitigation strategy development
for building related earthquake risk”.
Keywords: fragility curves, limited ductile reinforced concrete, seismic vulnerability
assessment
1 Introduction
The project “Cost-Effective Mitigation Strategy Development for Building Related Earthquake
Risk” under the Bushfire and Natural Hazards Cooperative Research Centre (BNHCRC) aims
to develop knowledge to facilitate evidence-based informed decision making in relation to the
need for seismic retrofitting, revision of codified design requirement, and insurance policy.
Cost-benefit analysis will be used as a standard tool to facilitate informed decision making.
Apart from developing socio-economic loss models which are relevant to costing, seismic
vulnerability assessment of different forms of structures is an essential component of the
project. The current platform used in Australia for earthquake loss estimation is the Earthquake
Risk Model (EQRM) (Robinson et al., 2005), which adopts the methodology used by HASUS
(FEMA, 2010). However, buildings in Australia are usually designed with little to no
consideration for ductile detailing and are generally more vulnerable than buildings in more
seismically active regions (Edwards et al., 2004).

Australian Earthquake Engineering Society 2018 Conference, Nov. 1618, Perth
This paper presents a summary of the studies conducted by the project team in conjunction
with PhD students who are financially supported by the BNHCRC project. Sets of fragility
curves which are essential inputs to cost-benefit analysis are presented for limited-ductile
reinforced concrete (RC) buildings typical of Australian constructions: i) fragility curves for
RC buildings that are primarily supported by limited-ductile RC shear walls (referred to RC
shear walls buildings herein); ii) fragility curves for RC buildings that are supported by
limited-ductile RC walls and frames (referred to RC frames buildings herein); and iii) fragility
curves for podium-tower RC buildings. For full details, the readers are referred to
Amirsardari (2018), Hoult et al. (2018a) and Yacoubian (2018). The details of the buildings
are presented in Section 2 and the modelling of the buildings for non-linear analyses are
presented in Section 3. The selection of ground motion inputs for the analyses is presented in
Section 4. The development of the fragility curves is presented in Section 5.
2 Description of buildings
The following sections present the configuration of buildings and design of structural elements
adopted in this study.
2.1 RC shear walls buildings
Four idealised reinforced concrete shear walls buildings, laterally supported by rectangular
and/or RC walls, were used in the assessment. The four configurations considered are presented
in Figure 1. The height of the buildings varies from 2-storey to 12-storey high. The type of RC
shear wall configuration was selected for each building depending on the capability of the walls
in resisting earthquake and wind load in accordance with Australian Standard (AS1170.4-2007;
AS1170.2:2011).
(a) Type 1 (b) Type 2
(c) Type 3 (d) Type 4
Figure 1 Idealised RC shear walls buildings

Australian Earthquake Engineering Society 2018 Conference, Nov. 1618, Perth
Table 1 presents the building types (according to the wall configuration) and the associated
minimum and maximum number of storeys that can be supported by each building type. The
definition of the low-rise, mid-rise and high-rise corresponds to the number of storeys has been
adopted from (FEMA, 2010). This definition has also been adopted in Geoscience Australia’s
Earthquake Risk Model (EQRM) (Robinson, 2005).
The building parameters such as the axial load ratio (ALR), dead (G) and live (Q) load, inter-
storey height (hs) and longitudinal reinforcement ratio (ρwv) were varied between the maximum
and minimum values summarised in Table 2. The length of the rectangular walls (Lw) was
selected randomly between a value of 0.17B and 0.33B, where the width of the building (B).
The dimensions of the C-shaped walls for Building Types 2, 3 and 4 in Figure 1 were based on
the number of storeys and are presented in Table 3.
Table 1 Building Types with limiting number of storeys (n)
Building Type minimum n maximum n Rise
1 2 4 Low, Mid
2 2 3 Low
3 2 7 Low, Mid
4 4 12 Mid, High
Table 2 Wall parameters and values considered for the assessment
Parameter μ σ min max Constant Units
ALR - - 0.01 0.1a/0.05b -
G - - 4 8 kPa
Q - - 1 4 kPa
hs - - 3.0 3.5 M
ρwv - - 0.19% 1.00% - a = Rectangular walls b = C-shaped Walls
Table 3 Dimensions of the C-shaped walls
Wall tw (mm) Lweb (mm) Lflange (mm) Lreturn (mm)
Low-rise 200 3600 2000 600
Medium-rise 200 6200 2200 600
High-rise 250 8500 2500 600
2.2 RC frames buildings
Three reinforced concrete buildings were assessed which are 2-storey, 5-storey and 9-storey
high, representing low-, medium- and high-rise buildings. The buildings are representative of
older RC buildings constructed in Australia prior to the requirement for seismic load and design
to be mandated on a national basis. The buildings have been designed in accordance with
AS 3600:1988 Concrete Structures Standard, AS 1170.2:1983 Wind Actions Standard, and
guidance from experienced practicing structural engineers. The frames were designed as
ordinary moment resisting frames (OMRFs). The core walls have low longitudinal
reinforcement ratio (approximately 0.23 %) with no confinement. The building plans are
provided in Figure 2. The gravity load resisting system of the buildings constructed in the 1980s
typically included perimeter frames with deep beams (600-900 mm deep) to satisfy fire design
Australian Earthquake Engineering Society 2018 Conference, Nov. 1618, Perth
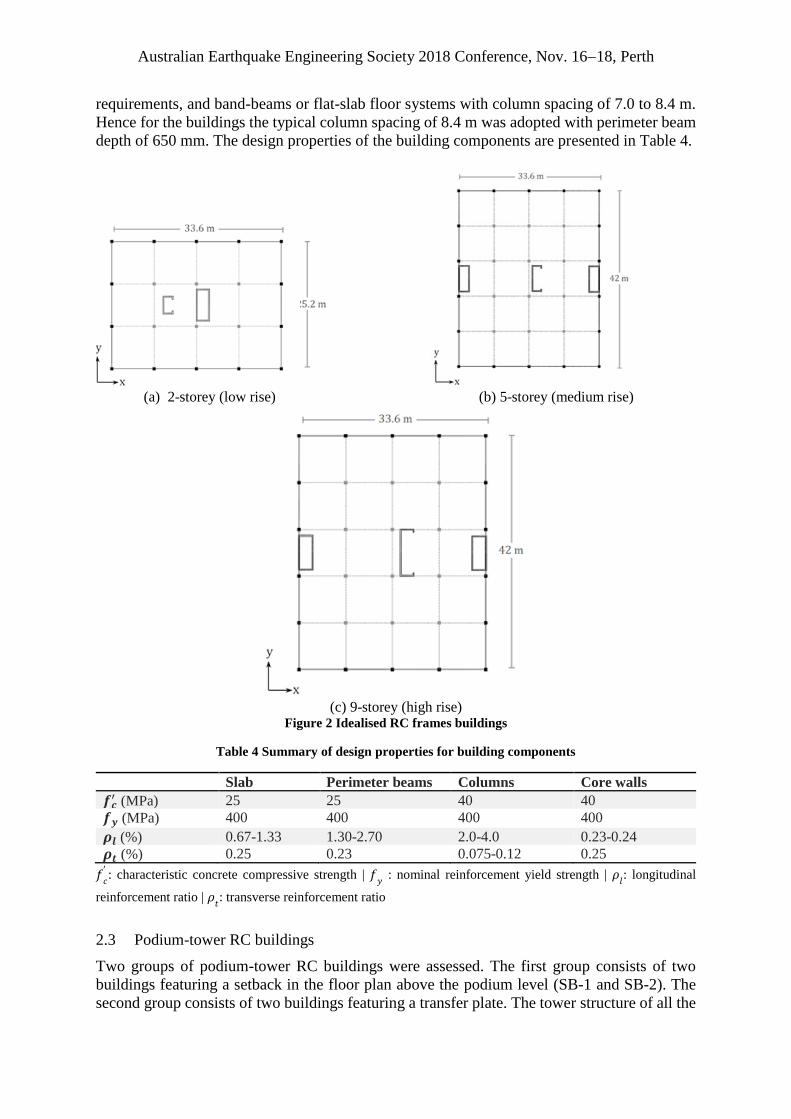
requirements, and band-beams or flat-slab floor systems with column spacing of 7.0 to 8.4 m.
Hence for the buildings the typical column spacing of 8.4 m was adopted with perimeter beam
depth of 650 mm. The design properties of the building components are presented in Table 4.
(a) 2-storey (low rise) (b) 5-storey (medium rise)
(c) 9-storey (high rise)
Figure 2 Idealised RC frames buildings
Table 4 Summary of design properties for building components
Slab Perimeter beams Columns Core walls
𝒇𝒄′ (MPa) 25 25 40 40
𝒇𝒚 (MPa) 400 400 400 400
𝝆𝒍 (%) 0.67-1.33 1.30-2.70 2.0-4.0 0.23-0.24
𝝆𝒕 (%) 0.25 0.23 0.075-0.12 0.25
𝑓𝑐′ : characteristic concrete compressive strength | 𝑓
𝑦 : nominal reinforcement yield strength | 𝜌
𝑙: longitudinal
reinforcement ratio | 𝜌𝑡: transverse reinforcement ratio
2.3 Podium-tower RC buildings
Two groups of podium-tower RC buildings were assessed. The first group consists of two
buildings featuring a setback in the floor plan above the podium level (SB-1 and SB-2). The
second group consists of two buildings featuring a transfer plate. The tower structure of all the

Australian Earthquake Engineering Society 2018 Conference, Nov. 1618, Perth
building models comprises of three walls connected by floor slabs. The elevation views of the
buildings are shown in Figure 3. In the first group (setback buildings), the tower structure is
continued to the podium levels. Building model SB-1 has a tower structure that is centred on
the supporting podium. Building model SB-2 has the tower structure at an offset from the centre
of the building. For the second group (transfer structure), some or all of the structural elements
at the tower structure are discontinued at the transfer floor level. Building model TS-1 has a
continuous central wall which forms the primary lateral load resisting elements whilst the other
walls are discontinued at the transfer floor level. In building TS-2, all three tower walls are
discontinued at the transfer floor level. The podium structure of TS-2 consists of the stiff
columns that are also coupled by floor slabs. Summary of the design properties of the building
component are presented in Figure 4.
(a) SB-1 and SB-2
(b) TS-1 and TS-2
Figure 3 Elevation views of the podium-tower RC buildings
RC walls Section A-A RC walls Section B-B

Australian Earthquake Engineering Society 2018 Conference, Nov. 1618, Perth
RC columns Section C-C RC columns Section D-D
Figure 4 Details of typical structural elements
3 Modelling for non-linear analyses
The following sections present the modelling and analysis approach adopted to construct
fragility curves of the limited ductile reinforced concrete buildings.
3.1 RC shear walls buildings
A large number of analyses for the RC shear walls buildings were undertaken using the capacity
spectrum method. The method involves comparing the capacity curve of a structure to the
seismic demand in the format of an acceleration-displacement response spectrum (ADRS) as
illustrated schematically in Figure 5. The performance point (or “demand point” in Figure 5)
is the location at which the two curves (with the same effective damping) intersects. This point
provides an estimation of both the inelastic acceleration and displacement demand of a
structure with a given earthquake.
The capacity curve of the walls for each building was constructed using moment-curvature
analyses, based on the stress-strain (σ-ε) relationships given in Popovics (1973) and Seckin
(1981), for concrete (normal and high strength concrete) and steel reinforcement, respectively.
The moment-curvature analyses were used to obtain the ultimate moment, as well as curvature
and moment values at different levels of strains associated with different performance levels.
Based on the moment-curvature values at different performance levels, plastic hinge analyses
were conducted to obtain the force displacement capacities of the walls. The calculations to
determine the yield displacement (Δy) and plastic displacement (Δp) were based on the plastic
hinge length (Lp) expressions derived by Hoult et al. (2018b; 2018c; 2017).
The demand curve was constructed from individual earthquake ground motions in the
acceleration and displacement demand format. The displacement capacity was used to modify
the elastic acceleration and displacement demand spectra by the expressions of equivalent
damping and spectral reduction factor from Priestley et al. (2007).
3.2 RC frames buildings
The assessment for RC frames buildings was performed using nonlinear dynamic time history
analysis (NDTHA). The nonlinear models for the buildings presented in Figure 2 were created
in the finite element analysis package OpenSEES (McKenna et al., 2000).
The concrete fibres were modelled using the Popovics (1973) uniaxial concrete stress-strain
material model which is available in OpenSees as Concrete04 and the reinforcement bars were
modelled using the Giuffré-Menegotto-Pinto uniaxial material model (Menegotto & Pinto,
1973) which is available as Steel02 model in OpenSEES. The material properties are based on
the reported values from the experiments and are presented in Table 5.

Australian Earthquake Engineering Society 2018 Conference, Nov. 1618, Perth
Table 5 Input parameters adopted for Concrete04 material model
Input parameter Unconfined concrete Confined concrete
Concrete compressive
strength
𝑓𝑐 Confined concrete compressive strength:
𝑓𝑐𝑐 = 𝐾𝑓𝑐
where 𝐾 is the confinement factor according
to Mander et al., (1988)
Strain at maximum
strength 𝜀𝑐0 = 0.002 𝜀𝑐𝑐0 = 𝜀𝑐0(1 + 5(𝐾 − 1))
(Mander et al, 1988)
Strain at crushing
strain 𝜀𝑐𝑢 = 0.012 − 0.0001𝑓𝑐
(Reddiar, 2009)
𝜀𝑐𝑐𝑢 = 5𝜀𝑐𝑐0 + 0.004
(Reddiar, 2009)
Initial stiffness 𝐸 = 5000√𝑓𝑐 𝐸 = 5000√𝑓𝑐
Maximum tensile
strength 𝑓𝑐𝑡 = 0.6√𝑓𝑐
(AS 3600: 2009)
𝑓𝑐𝑡 = 0.6√𝑓𝑐
(AS 3600: 2009)
Ultimate tensile strain 𝜀𝑡 = 0.1𝜀𝑐𝑢 𝜀𝑡 = 0.1𝜀𝑐𝑢
The columns, beams, and walls were modelled using lumped plasticity elements and the beam-
column joint response was modelled using the scissor’s model with rigid links approach. The
walls and the columns were assumed to be fixed to the ground. Furthermore, a rigid diaphragm
was also assumed. Pinching4 material model has been adopted to define the hysteretic
behaviour of the structural elements. The values of the parameters defining the model were
determined by calibration to experimental results published in the literature. Full details of the
hysteretic modelling of the structural elements and the calibration can be found in Amirsardari
(2018)
(a) lumped plasticity elements with the scissors model (b) Moment-rotation spring response using
Pinching4 material model
Figure 5 Non-linear modelling of beam and columns (Amirsardari, 2018)
3.3 Podium-tower RC buildings
The assessment of podium-tower RC buildings was conducted using NDTHA. The inelastic
numerical models of the buildings have been constructed on the SeismoStruct program
(SeismoSoft, 2016). The distributed plasticity modelling approach using fibre-based inelastic
frame element has been adopted in the modelling of the flexural response of the walls and the
floors slabs. The fibre-based approach is able to preserve the axial-flexural interaction in the
response behaviour of the members, which were particularly important for the modelling of the
floor slabs and tower walls.
The reinforced concrete walls have been modelled with a combination of inelastic fibre-based
elements and zero-length lumped shear springs that are connected in series as shown

Australian Earthquake Engineering Society 2018 Conference, Nov. 1618, Perth
schematically in Figure 6. The inelastic frame elements have been discretised at the sectional
level (into various fibres) and at the elemental level. The tri-linear model recommended in
ASCE41-13 (2013) and FEMA 356 (2000), which consists of three main phases, uncracked,
post-cracked and post-peak behaviour, as shown schematically in Figure 6. The hysteretic
behaviour of the shear sub-element (with tri-linear shear backbone) has been defined by the
model developed by Sivalsevan and Reinhorn (2000). The pinching effect, which commonly
characterises the shear response behaviour of shear-critical walls, was modelled by the slip
parameter of 0.3 based on recommendations by Mergos and Beyer (2014). The Mander
concrete constitutive model (Mander et al., 1988) has been adopted for modelling the uni-axial
response behaviour of confined and unconfined concrete (fibres) whereas the modified
Menegotto-Pinto (1973) constitutive relationship is adopted for the reinforcing steel. Expected
material strength values were used instead of the design lower characteristic strength for both
the concrete and steel. The values of the expected strengths are 1.3𝑓′𝑐 and 1.17 𝑓𝑦 for concrete
and steel respectively as recommended by the LATBSDC (2005) and PEER/ATC 72-1 (2017)
guidelines.
Figure 6 Non-linear modelling of shear walls
The fibre-based inelastic elements were used for modelling the floor slabs and the transfer
plate. Only the effective widths (𝑏𝑒𝑓𝑓) of the floor slabs have been modelled using the effective
width formulae proposed by Grossman (1997). The computed effective width values were
found to be approximately 40% of the length of the span in the transverse direction (which is
6.0 m and 8.0 m in the tower and the podium, respectively). The inelastic response behaviour
of the floors slabs is characterised by the uni-axial (material) model of the individual fibres.
Where concentrations of inelastic demands are anticipated to occur in certain locations along
the length of the span, a finer fibre section meshing of the element was adopted (about 20% of
the length of the span) as shown in Figure 7a. Conversely, a coarse element discretisation in
the rest of the slab (Figure 7a) was used to reduce computational demands. The floor slabs were
linked to the walls by means of rigid arms (Figure 7b) as recommended by PEER/ATC 72-1
(2010). Further details on the modelling of load deformation and hysteretic behaviour of the
walls, slabs and plates can be found in Yacoubian (2018).

Australian Earthquake Engineering Society 2018 Conference, Nov. 1618, Perth
(a) Fibre-meshing of the slabs
(b) Plan-view of the slab showing rigid arm
Figure 7 Modelling of slabs
4 Ground motion inputs
Ground motion inputs were collated to represent a wide range of intensity of Australian
earthquakes. The records selected are a combination of: (i) stochastically generated records
obtained using the program GENQKE (Lam, 1999) which is capable of producing ground
motions that are representative of Australian earthquakes, and (ii) historical records with
characteristics that are representative of Australian earthquakes, including shallow earthquakes
with reverse fault mechanisms (Brown & Gibson, 2004).
Ground motions on soil were also included in the assessment of RC walls and RC frames
buildings. Ground motions on soil were generated by using equivalent linear (Ordonez, 2013)
and non-linear site response program DEEPSOIL (Hashash et al., 2016), using generated and
historical rock records as input ground motions. It is noted that DEEPSOIL, which is capable
of conducting nonlinear analysis, was used for the input records that may have caused the soil
strain to exceed the limits for which equivalent linear analyses are valid. The shear wave
velocity profiles used to generate the ground motions were obtained from published literature
(Roberts et al., 2004; Mc Pherson and Hall, 2007; Kayen et al., 2015).
5 Development of fragility curves
Seismic fragility functions define the building’s probability of exceeding a damage limit state
as a function of ground motion intensity measure (IM). The fragility function is defined by
Equation (1):
𝑃[Y > 1|𝐼𝑀] = 𝜙ln(𝜂Y|𝐼𝑀)
√βY|𝐼𝑀2 + 𝛽𝐶
2 + 𝛽𝑀2
(1)

Australian Earthquake Engineering Society 2018 Conference, Nov. 1618, Perth
where, 𝜼𝐘|𝑰𝑴 is the median critical demand-to-capacity ratio (Y) as a function IM. The demand-
to-capacity ratio (Y) is greater than 1.0 when the damage limit based on the performance levels
(defined in Section 5.2) has been exceeded. 𝜷𝐘|𝑰𝑴 is the dispersion (logarithmic standard
deviation) of the critical demand-to-capacity ratio as a function of IM. 𝜷𝑪 is the capacity
uncertainty and 𝜷𝑴 is the modelling uncertainty. In this paper, both 𝜷𝑪 and 𝜷𝑴 were set to
zero.
The construction of the fragility functions for the RC shear walls buildings include the variation
building type (Figure 1) and the parameters defining the response of the RC walls (Tables 1
and 2), along with the variation in ground motions. The dispersion in the fragility functions for
the RC frames buildings and the podium-tower RC buildings was caused by the variation in
the ground motions. The median 𝜼𝐘|𝑰𝑴 and dispersion 𝜷𝐘|𝑰𝑴 values of the critical demand-to-
capacity ratio were obtained following the Multiple Stripe Analysis technique (Baker, 2015)
for the RC shear walls and tower-podium RC buildings and the cloud analysis (Jalayer, 2003)
for the RC frames buildings.
5.1 Ground motion Intensity Measure (IM)
The development of fragility curves involves conditioning the structural response on the
ground motion intensity measure (IM). It is critical that the IM selected shows a strong
correlation between the seismic intensity and the structural response to reduce the uncertainty
in the seismic assessment. In addition, the IM needs to effectively represent the level of seismic
hazard, i.e., it needs to correlate well to earthquake return periods. Traditionally, the IM that
has been commonly used for seismic assessment has been peak ground acceleration (PGA). It
is the parameter which is typically used to represent hazard on seismic hazard maps, including
AS1170.4-2007. However, the seismic hazard factor (Z) in AS 1170.4 is a nominal value
obtained from dividing the Peak Ground Velocity (PGV) values (in millimetres per second) by
750 (Wilson and Lam, 2007). This is because PGV is considered to provide a better indication
of the level of structural damage since it is related to the energy in the ground motion. In this
paper, PGV was used as ground motion IM.
5.2 Definition of Performance levels
There are many different performance levels defined in the literature and codes, each with
different acceptance criteria. In this paper, four performance levels were considered: i) slight
damage (also often referred to as operational, serviceability or immediate occupancy limit
state); ii) moderate damage (also often referred to as damage control or repairable damage limit
state); iii) extensive damage (also often referred to as life safety limit state); and iv) complete
damage (also often referred to collapse prevention limit state). A summary of the adopted
performance levels is provided in Table 6. More details can be found in Amirsardari (2018),
Hoult et al. (2018) and Yacoubian (2018).

Australian Earthquake Engineering Society 2018 Conference, Nov. 1618, Perth
Table 6 Summary of the adopted performance levels
(a) For RC shear walls buildings (Hoult et al., 2018a)
Performance limit Primary structure
Slight Damage /
Serviceability (S)
Wall reaching a compressive strain of 0.001, or tensile strain of
0.005, whichever occurs first
Moderate Damage/
Damage Control (DC)
Wall reaching a compressive strain of 0.002, or tensile strain of
0.01, whichever occurs first
Extensive Damage/
Life Safety (LS)
Wall reaching ultimate rotational limit, corresponding to a
compressive strain of 0.003, or tensile strain of 0.6𝜀𝑠𝑢,
whichever occurs first
Complete Damage/
Collapse Prevention (CP)
NA
(b) For RC frames buildings (Amirsardari, 2018)
Performance level Limits
Primary structure Secondary structure Non-structural limit
Slight Damage /
Serviceability (S)
Wall reaching initial yield limit Frame component reaching
nominal yield rotational limit
ISD reaching 0.004
Moderate Damage/
Damage Control
(DC)
Wall reaching a compressive
strain of 0.002, or tensile strain of
0.015, whichever occurs first
Frame component reaching
rotation which is at mid-point
between yield and ultimate
rotational limits
ISD reaching 0.008
Extensive Damage/
Life Safety (LS)
Wall reaching ultimate rotational
limit, corresponding to a
compressive strain of 0.004, or
tensile strain of 0.6𝜀𝑠𝑢, whichever
occurs first
Frame component reaches the
rotation corresponding to
shear failure
ISD reaching 0.015
Complete Damage/
Collapse Prevention
(CP)
NA Frame component reaches the
rotation corresponding to 50
% reduction in ultimate lateral
strength
ISD reaching 0.002
NA: Not applicable ISD: Inter-storey drift
(c) For podium-tower RC buildings (Yacoubian, 2018)
Performance level Limits
Slight Damage /
Serviceability
ISD corresponding to the first occurrence of flexural yielding in the RC
walls making up the building (in the tower or the podium).
Moderate Damage /
Damage Control (DC)
NA
Extensive Damage /
Life Safety (LS)
Life safety limit state is defined as the ISD corresponding to:
1- Flexural yielding of all the tower walls above the podium
interface level (or TFL)
2- Onset of nominal shear force capacity in the tower walls
3- Flexural yielding of the transfer plate (in building models TS-1
and TS-2)
Whichever occurs first

Australian Earthquake Engineering Society 2018 Conference, Nov. 1618, Perth
Complete Damage /
Collapse Prevention (CP)
Collapse prevention limit state is defined as the ISD corresponding to
1. Onset of crushing compression strain in the confined core of
the RC tower walls εcu = −0.003
2. 50% loss of lateral strength in the tower walls (Walls 1 & 2)
3. Onset of nominal shear strength capacity of the central wall
(ultimate strength)
4. Onset of ultimate tensile strain (εsu = 0.03) in the
reinforcement.
Whichever occurs first
ISD: Inter-storey drift
5.3 Fragility curves
Based on the median 𝜼𝐘|𝑰𝑴 and dispersion 𝜷𝐘|𝑰𝑴values, obtained following the Multiple Stripe
Analysis technique for the RC shear walls and tower-podium buildings and the cloud analysis
for the RC frames buildings, the fragility curve can be derived using Equation (1). The equation
calculates the probability of a certain damage limit state being exceeded at a given ground
motion intensity (IM) level. The fragility curves for the three types of RC buildings are
presented in Figures 8 to 10.
Although different approach in modelling and different parameters have been adopted in the
construction of these fragility curves, it can be generally deducted that RC frames buildings
are more vulnerable than RC shear walls and podium-tower RC buildings. The height of the
buildings was not found to have significant impact on the behaviour of the RC shear walls
buildings whilst it has moderate impact on the RC frames buildings (Figures 8 and 9). Podium-
tower RC buildings featuring a distinct change in the form of lateral load resisting elements
and a transfer structure (TS-1 and TS-2) were found to be more vulnerable than to those with
the lateral load resisting elements continuing to the podium levels (SB-1 and SB-2). The higher
vulnerability of TS-1 and TS-2 are caused by the adverse effects of the flexibility of the transfer
plates on the shear force demand on the tower walls immediately above the transfer plates.
(a) Slight Damage (b) Moderate Damage
(c) Extensive Damage
Figure 8 Fragility curve for RC wall buildings
0
0.2
0.4
0.6
0.8
1
0 100 200 300 400 500
Pro
bab
ility
of
exce
edan
ce
PGV (mm/sec)
low rise medium rise high rise
0
0.2
0.4
0.6
0.8
1
0 100 200 300 400 500
Pro
bab
ility
of
exce
edan
ce
PGV (mm/sec)
low rise medium rise high rise
0
0.2
0.4
0.6
0.8
1
0 100 200 300 400 500
Pro
bab
ility
of
exce
edan
ce
PGV (mm/sec)
low rise medium rise high rise

Australian Earthquake Engineering Society 2018 Conference, Nov. 1618, Perth
(a) Slight Damage (b) Moderate Damage
(c) Extensive Damage (d) Complete Damage
Figure 9 Fragility curves for RC frames building
(a) Slight Damage (b) Moderate Damage
(c) Extensive Damage
Figure 10 Fragility curves for podium-tower RC buildings
To provide an indication of the performance of the buildings under to a 500 and 2500-year
return period event, the PGV values associated with the events were calculated in accordance
with AS1170.4-2007. The PGV values are presented in Table 7 for class A to Class D. The
0
0.2
0.4
0.6
0.8
1
0 100 200 300 400 500Pro
bab
ility
of
exce
edan
ce
PGV (mm/sec )
low rise medium rise high rise
0
0.2
0.4
0.6
0.8
1
0 100 200 300 400 500Pro
bab
ility
of
exce
edan
ce
PGV (mm/sec )
low rise medium rise high rise
0
0.2
0.4
0.6
0.8
1
0 100 200 300 400 500Pro
bab
ility
of
exce
edan
ce
PGV (mm/sec )
low rise medium rise high rise
0
0.2
0.4
0.6
0.8
1
0 100 200 300 400 500Pro
bab
ility
of
exce
edan
ce
PGV (mm/sec )
low rise medium rise high rise
0
0.2
0.4
0.6
0.8
1
0 100 200 300 400 500Pro
bab
ility
of
exce
edan
ce
PGV (mm/sec)
SB1 SB2 TS1 TS2
0
0.2
0.4
0.6
0.8
1
0 100 200 300 400 500Pro
bab
ility
of
exce
edan
ce
PGV (mm/sec)
SB1 SB2 TS1 TS2
0
0.2
0.4
0.6
0.8
1
0 100 200 300 400 500Pro
bab
ility
of
exce
edan
ce
PGV (mm/sec)
SB1 SB2 TS1 TS2

Australian Earthquake Engineering Society 2018 Conference, Nov. 1618, Perth
probability of exceedance of a certain damage level associated with PGV values listed in
Table 7 are presented in Table 8 for the three types of buildings investigated. It is shown that
the slight damage limit is expected to be exceeded under a 500- and 2500-year event for the
RC frames and RC shear walls buildings, whilst the probability of the damage level to be
exceeded is much lower for the podium-tower RC buildings. Both RC shear walls and RC
frames building are shown to have a high probability of the extensive damage limit being
exceeded (for the most onerous soil site) under the 2500-year return period event. It is noted
that vulnerability of the buildings can be exacerbated by plan asymmetry in the building, which
is outside the scope of this paper.
Table 7 PGV values calculated in accordance with AS1170.4-2007 for 500- and 2500-year RP event
Site condition PGV (cm/s) 500 YRP 2500 YRP
Class A 61 110 Class B 76 137 Class C 108 195 Class D 172 309
Table 8 Probability of exceedance under 500- and 2500-year RP event
(a) RC shear walls buildings
Site condition Limited Damage Moderate Damage Extensive Damage 500 YRP 2500 YRP 500 YRP 2500 YRP 500 YRP 2500 YRP
Class A 0.30 0.55 0.20 0.40 0.10 0.20 Class B 0.40 0.65 0.25 0.45 0.10 0.25 Class C 0.50 0.75 0.35 0.60 0.20 0.35 Class D 0.80 0.90 0.55 0.75 0.30 0.50
(b) RC frames building
Site condition
Limited Damage
Moderate Damage Extensive Damage Complete Damage
500 YRP
2500 YRP
500 YRP
2500 YRP
500 YRP
2500 YRP
500 YRP
2500 YRP
Class A 1.0 1.0 0.20 0.95 0.0 0.0 0.0 0.0 Class B 1.0 1.0 0.55 1.0 0.0 0.04 0.0 0.0 Class C 1.0 1.0 0.95 1.0 0.0 0.40 0.0 0.0 Class D 1.0 1.0 1.0 1.0 0.20 0.95 0.0 0.03
(c) Tower-podium building
Site condition Limited Damage Moderate Damage Extensive Damage 500 YRP 2500 YRP 500 YRP 2500 YRP 500 YRP 2500 YRP
Class A 0.0 0.0 0.0 0.0 0.0 0.0 Class B 0.0 0.0 0.0 0.0 0.0 0.0 Class C 0.0 0.15 0.0 0.0 0.0 0.0 Class D 0.02 0.75 0.01 0.10 0.0 0.04
6 Concluding Remarks
This paper presents sets of fragility curves for limited ductile reinforced concrete buildings.
Fragility curves were presented for limited-ductile reinforced concrete (RC) buildings typical
of Australian constructions: i) fragility curves for RC buildings that are primarily supported by
limited-ductile RC shear wall (referred to RC shear walls buildings in this paper); ii) fragility
curves for RC buildings that are supported by limited-ductile RC walls and frames (referred to
RC frames buildings in this paper); and iii) fragility curves for podium-tower RC buildings.

Australian Earthquake Engineering Society 2018 Conference, Nov. 1618, Perth
The assessment was conducted by performing nonlinear analyses using the capacity spectrum
method and time history analyses of the nonlinear building models. Ground motion records
have been selected from a combination of stochastically generated records, historical records
with characteristics representative of Australian earthquakes and simulated records on soil
conditions. The multi-stripe and cloud analyses have been adopted to compute the fragility
functions. The fragility curves for the three types of buildings have been presented in the forms
of peak ground velocity as an intensity measure. Although the approach and parameters
adopted are different between the three types of buildings, hence the outcomes are not directly
comparable, it is shown that RC frames buildings are generally more vulnerable in an
earthquake compared to RC shear walls and podium-tower RC buildings. The fragility curves
indicate that RC frames and RC shear walls buildings are expected to experience extensive
damage under a 2500-year return period earthquake event.
Acknowledgement
The support of the Commonwealth Australia through the Cooperative Research Centre
program
References
American Society of Civil Engineers (ASCE/SEI). (2013). ASCE 41-13: Seismic evaluation and retrofit
of existing buildings. Reston, Virginia: American Society of Civil Engineers Standard Reston,
Virginia.
Amirsardari, A. (2018). Seismic assessment of reinforced concrete buildings in Australia including the
response of gravity frames. PhD Thesis. Melbourne: The University of Melbourne.
Baker, J.W. (2015). Efficient analytical fragility function fitting using dynamic structural analysis.
Earthquake Spectra, 31(1), 579-599.
Brown, A., & Gibson, G. (2004). A multi-tiered earthquake hazard model for Australia.
Tectonophysics, 390(1-4), 25-43. doi: 10.1016/j.tecto.2004.03.019
Edwards, M., Robinson, D., McAneney, K., & Schneider, J. (2004). Vulnerability of residential
structures in Australia. Paper presented at the 13th World Conference on Earthquake
Engineering, Vancouver.
Federal Emergency Management Agency (FEMA). (2010). HAZUS-MH MR5 Technical Manual -
Earthquake Model. Washington, D.C.: U.S. Department of Homeland Security.
Federal Emergency Management Agency (FEMA). (2000). FEMA 356, Prestandard and commentary
Grossman, J.S. (1997). Verification of proposed design methodologies for effective width of slabs in
slab-column frames. ACI Structural Journal, 94(2), 181-196.
Hashash, Y.M.A., Musgrove, M.I., Harmon, J.A., Groholski, D R., Phillips, C.A., & Park, D. (2016).
DEEPSOIL 6.1. Retrieved from http://deepsoil.cee.illinois.edu/
Hoult, R., Goldsworthy, H., & Lumantarna, E. (2017a). Displacement Capacity of Lightly Reinforced
and Unconfined Concrete Structural Walls. Manuscript submitted for publication.
Hoult, R., Goldsworthy, H., & Lumantarna, E. (2017b). Plastic Hinge Length for Lightly Reinforced
Rectangular Concrete Walls. Journal of Earthquake Engineering.
doi:10.1080/13632469.2017.1286619
Hoult, R., Goldsworthy, H., & Lumantarna, E. (2018a). Fragility Functions for RC Shear Wall
Buildings in Australia. Earthquake Spectra.
Hoult, R. D., Goldsworthy, H., & Lumantarna, E. (2018b). Plastic hinge length for lightly reinforced
C-shaped concrete walls. Journal of Earthquake Engineering, 1-32.
Hoult, R., Goldsworthy, H., & Lumantarna, E. (2018c). Plastic hinge length for lightly reinforced
rectangular concrete walls. Journal of Earthquake Engineering, 22(8), 1447-1478.
Jalayer, F. (2003). Direct probabilistic seismic anaysis: implementing non-linear dynamic assessments.
PhD Dissertation, Stanford University.
Kayen, R.E., Carkin, B.A., Allen, T., Collins, C., McPherson, A., & Minasian, D.L. (2015). Shear-wave
velocity and site-amplification factors for 50 Australian sites determined by the spectral

Australian Earthquake Engineering Society 2018 Conference, Nov. 1618, Perth
analysis of surface waves method: U.S. Geological Survey Open-File Report 2014-1264. doi:
http:/dx.doi.org/10.3133/ofr20141264
Lam, N.T.K. (1999). "GENQKE" User's Guide: Program for generating synthetic earthquake
accelerograms based on stochastic simulations of seismological models. Department of Civil
and Environmental Engineering, The University of Melbourne, Australia.
Mander, J.B., Priestley, M.J., & Park, R. (1988). Theoretical stress-strain model for confined concrete.
Journal of structural engineering, 114(8), 1804-1826.
McKenna, F., Fenves, G.L., Scott, M.N., & Jeremic, B. (2000). Open System for Earthquake
Engineering Simulation (OpenSEES) (Version 2.4.5, 2013): Pacific Earthquake Engineering
Research Center, University of California, Berkeley, CA. Retrieved from
http://opensees.berkeley.edu/
McPherson, A.A., & Hall, L.S. (2007). Development of the Australian national regolith site
classification map (pp. 37): Geoscience Australia Record 2007/07.
Menegotto, M., & Pinto, P.E. (1973). Method of analysis of cyclically loaded R. C. frames including
changes in geometry and non-elastic behavior of elements under combined normal force and
bending moment. IABSE Proc.
Mergos, P., & Beyer, K. (2014). Modelling shear–flexure interaction in equivalent frame models of
slender reinforced concrete walls. The Structural Design of Tall and Special Buildings, 23(15),
1171-1189.
Ordonez, G.A. (2013). SHAKE2000 (Version 9.99.2 - July 2013). Retrieved from
http://www.geomotions.com
PEER/ATC72-1. (2010). Modeling and acceptance criteria for seismic design and analysis of tall
buildings. Redwood City, CA: Applied Technology Council in cooperation with the Pacific
Earthquake Engineering Research Center.
Popovics, S. (1973). A numerical approach to the complete stress-strain curve of concrete. Cement and
concrete research, 3(5), 583-599.
Priestley, M.J.N., Calvi, G.M., & Kowalsky, M.J. (2007). Displacement-based seismic design of
structures. Pavia, Italy: IUSS Press.
Reddiar, M.K.M. (2009). Stress-strain model of unconfined and confined concrete and stress-block
parameters. M.S. Dissertation. Texas, U.S.A: Texas A&M University.
Robinson, D., Fulford, G., & Dhu, T. (2005). EQRM: Geoscience Australia's Earthquake Risk Model.
Technical Manual Version 3.0: Record 2005/01: Geoscience Australia: Canberra.
Roberts, J., Asten, M., Tsang, H. H., Venkatesan, S., & Lam, N. (2004). Shear wave velocity profiling
in Melbourne silurian mudstone using the SPAC method. Paper presented at the Australian
Earthquake Engineering Society 2004 Conference, Mt Gambier, SA.
Seckin, M. (1981). Hysteretic Behaviour of Cast-in-Place Exterior Beam-Column-Slab Subassemblies.
Ph.D. Thesis. Toronto: University of Toronto.
SeismoSoft. (2016). A computer program for static and dynamic nonlinear analysis of framed
structures. Retrieved from www.seismosoft.com
Sivaselvan, M.V., & Reinhorn, A.M. (2000). Hysteretic models for deteriorating inelastic structures.
Journal of Engineering Mechanics, 126(6), 633-640.
Standards Australia. (1983). Minimum design loads on structures - Wind loads. Sydney, NSW:
Standards Association of Australia.
Standards Australia. (1988). AS 3600-1988: Concrete structures. Sydney, NSW: Standards Association
of Australia.
Standards Australia. (2007). AS 1170.4-2007: Structural design actions, Part 4: Earthquake actions in
Australia. Sydney, NSW: SAI Global.
Standards Australia. (2011). AS 1170.2-2011: Structural design actions, Part 2: Wind Actions. Sydney,
NSW: SAI Global.
Wilson, J., & Lam, N. (2007). AS 1170.4 Supp1-2007 Commentary to Structural Design Actions Part
4: Earthquake Actions in Australia.
Yacoubian, M. (2018). Podium and transfer structure interference on seismic shear demands of tower
walls in buildings. PhD Thesis, Melbourne: The University of Melbourne.
![Development of fragility curves for existing residential ...scientiairanica.sharif.edu/article_21498_1b4140b0a40ae864af4f4741123bf662.pdfthree-dimensionally in OpenSees [18]. E ort](https://static.fdocuments.net/doc/165x107/6049a4e6007677277e1f9238/development-of-fragility-curves-for-existing-residential-three-dimensionally.jpg)