Fracture Toughness and Crack Growth Rates of Irradiated ... · iii Fracture Toughness and Crack...
104
NUREG/CR–6826 ANL–03/22 Fracture Toughness and Crack Growth Rates of Irradiated Austenitic Stainless Steels Manuscript Completed: March 2003 Date Published: August 2003 Prepared by O. K. Chopra, E. E. Gruber, and W. J. Shack Argonne National Laboratory 9700 South Cass Avenue Argonne, IL 60439 W. H. Cullen, Jr., and C. E. Moyer, NRC Project Managers Prepared for Division of Engineering Technology Office of Nuclear Regulatory Research U.S. Nuclear Regulatory Commission Washington, DC 20555–0001 NRC Job Code Y6388
Transcript of Fracture Toughness and Crack Growth Rates of Irradiated ... · iii Fracture Toughness and Crack...

NUREG/CR–6826ANL–03/22
Fracture Toughness andCrack Growth Rates ofIrradiated Austenitic Stainless Steels
Manuscript Completed: March 2003Date Published: August 2003
Prepared byO. K. Chopra, E. E. Gruber, and W. J. Shack
Argonne National Laboratory9700 South Cass AvenueArgonne, IL 60439
W. H. Cullen, Jr., and C. E. Moyer, NRC Project Managers
Prepared for Division of Engineering TechnologyOffice of Nuclear Regulatory ResearchU.S. Nuclear Regulatory CommissionWashington, DC 20555–0001NRC Job Code Y6388

ii

iii
Fracture Toughness and Crack Growth Ratesof Irradiated Austenitic Stainless Steels
by
O. K. Chopra, E. E. Gruber, and W. J. Shack
Abstract
Austenitic stainless steels (SSs) are used extensively as structural alloys in the internalcomponents of reactor pressure vessels because of their superior fracture toughnessproperties. However, exposure to high levels of neutron irradiation for extended periods leadsto significant reduction in the fracture resistance of these steels. Experimental data arepresented on fracture toughness and crack growth rates (CGRs) of austenitic SSs irradiated tofluence levels up to 2.0 x 10²¹ n/cm2 (E > 1 MeV) (ª3.0 dpa) at ª288°C. Crack growth testswere conducted under cycling loading and long hold time trapezoidal loading in simulatedboiling water reactor (BWR) environments, and fracture toughness tests were conducted in air.Neutron irradiation at 288°C decreases the fracture toughness of the steels; the data fromcommercial heats fall within the scatter band for the data obtained at higher temperatures. Inaddition, the results indicate significant enhancement of CGRs of the irradiated steels innormal water chemistry BWR environment; the CGRs for irradiated steels are a factor of ª5higher than the disposition curve proposed for sensitized austenitic SSs. The rates decreasedby more than an order of magnitude in low–dissolved–oxygen BWR environment.

iv

v
Contents
Abstract.................................................................................................................................... iii
Executive Summary................................................................................................................. xiii
Acknowledgments .................................................................................................................... xv
1. Introduction .................................................................................................................... 1
2. Experimental................................................................................................................... 3
2.1 J–R Curve Characterization................................................................................ 6
2.2 Crack Growth Rate Tests.................................................................................... 11
2.2.1 Procedure............................................................................................. 11
2.2.2 Data Qualification ............................................................................... 12
2.2.3 Effect of Specimen Size........................................................................ 13
3. Results............................................................................................................................. 15
3.1 Fracture Toughness............................................................................................ 15
3.1.1 Nonirradiated Type 304 Stainless Steel.............................................. 15
3.1.2 Irradiated Type 304 Stainless Steels................................................... 18
3.2 Crack Growth Tests on Irradiated Stainless Steels in BWR Environments...... 21
3.2.1 Specimen C3-B Irradiated to 0.9 x 10²¹ n/cm2 ................................. 22
3.2.2 Specimen C3-C Irradiated to 2.0 x 10²¹ n/cm2 ................................. 26
3.2.3 Specimen C16-B Irradiated to 2.0 x 10²¹ n/cm2 ............................... 29
3.2.4 Specimen C3-A Irradiated to 0.3 x 10²¹ n/cm2 ................................. 34
3.2.5 CGRs of Irradiated Austenitic SSs under Continuous Cycling .......... 37
3.2.6 CGRs of Irradiated Austenitic SSs under Cycling with Long HoldPeriods ................................................................................................. 38
4. Summary......................................................................................................................... 39
References ................................................................................................................................ 41
Appendix .................................................................................................................................. 45

vi
Figures
1. Fracture toughness JIc as a function of neutron exposure for austeniticTypes 304 and 316 SS ............................................................................................... 1
2. Configuration of compact–tension specimen used for this study............................. 3
3. Schematic representation of hot–cell J–R test facility............................................... 3
4. Schematic of the actuator, load cell, test train, autoclave, and furnace.................. 4
5. Schematic diagram of recirculating water system .................................................... 5
6. Examples of load-vs.-loadline displacement curves for irradiated specimens ofHeats C19 and L20 of Type 304 SS tested at 288°C................................................. 7
7. Fracture toughness J–R curves obtained from DC potential and elasticunloading compliance methods for specimens Y4–02 and Y4–03 of thermallyaged cast CF–8M SS................................................................................................... 9
8. Fracture toughness J–R curves obtained from DC potential and elasticunloading compliance methods for thermally aged Heat 75 of cast CF–8M SS;specimen 75–03T, 75–04T, and 75–10T.................................................................... 10
9. Fracture toughness J–R curves obtained from DC potential and elasticunloading compliance methods for 50% cold–worked Type 316NG; specimen184–38 and 184–40.................................................................................................... 10
10. Fracture toughness J–R curves for 1/4–T and 1–T CT specimens of aged Heat 75of CF–8M cast stainless steel at 288°C...................................................................... 11
11. Crack growth rate data under continuous cycling for thermally aged cast SS and50% cold–worked Type 316LN SS in high–purity water at 289°C. ........................... 13
12. Stress corrosion cracking data for austenitic stainless steels in high–DO water at289°C.......................................................................................................................... 14
13. Fracture toughness J–R curve obtained by DC potential and unloadingcompliance methods for nonirradiated specimens L2–C and L2–E of Heat L2 ofType 304 SS at 288°C. ............................................................................................... 15
14. Fracture toughness J–R curve obtained by DC potential and unloadingcompliance methods for nonirradiated specimen L20–D of Heat L20 ofType 304 SS at 288°C. ............................................................................................... 16
15. Fracture toughness J–R curve obtained by DC potential and unloadingcompliance methods for nonirradiated specimens C16–C and C16–D of Heat C16of Type 316 SS at 288°C. ........................................................................................... 16
16. Fracture toughness J–R curve obtained by DC potential and unloadingcompliance methods for nonirradiated specimen C19–D of Heat C19 ofType 304 SS at 288°C. ............................................................................................... 17

vii
17. Fracture toughness J–R curves for nonirradiated Type 304 stainless steelsat 288°C...................................................................................................................... 17
18. Photomicrographs of fracture surfaces of nonirradiated specimens of Heats L2and L20 tested at 288°C. ........................................................................................... 17
19. Photomicrograph of fracture surface of nonirradiated specimen of Heat C19tested at 288°C........................................................................................................... 18
20. Photomicrograph of MnS inclusions on the fracture surface of nonirradiatedspecimen of Heat L2 tested at 288°C......................................................................... 18
21. Fracture toughness J–R curve obtained by DC potential and unloadingcompliance methods at 288°C for Heat C19 of Type 304 SS irradiated to afluence level of 0.3, 0.9, and 2.0 x 10²¹ n/cm2. ....................................................... 19
22. Fracture toughness J–R curve obtained by DC potential and unloadingcompliance methods at 288°C for Heat C16 of Type 316 SS irradiated to afluence level of 0.9 x 10²¹ n/cm2.............................................................................. 20
23. Fracture toughness J–R curve obtained by DC potential and unloadingcompliance methods at 288°C for Heat L20 of Type 304 SS irradiated to afluence level of 0.3 and 0.9 x 10²¹ n/cm2................................................................. 20
24. Fracture toughness J–R curve obtained by DC potential and unloadingcompliance methods at 288°C for Heat L2 of Type 304 SS irradiated to a fluencelevel of 0.9 x 10²¹ n/cm2........................................................................................... 21
25. Fracture toughness JIc of austenitic stainless steels as a function of neutronexposure at 288°C...................................................................................................... 21
26. Changes in crack length and ECP after the dissolved oxygen level in thefeedwater was decreased from ª500 to 10 ppb and increased from ª10 to300 ppb ...................................................................................................................... 23
27. Photomicrographs of the fracture surface of specimen C3–B tested in high–puritywater at 289°C............................................................................................................ 23
28. Crack–length–vs.–time plots for irradiated Type 304 SS in high–purity water at289°C during test periods 2–5, 6, 7–8, 9–12, and 14–15.......................................... 24
29. Change in crack length and ECP of Pt and SS electrodes for Specimen C3–Cafter the dissolved oxygen level in the feedwater was decreased from ª300 to10 ppb......................................................................................................................... 27
30. Photomicrographs of the fracture surface of Specimen C3–C .................................. 27
31. Crack–length–vs.–time plots for irradiated Type 304 SS in high–purity water at289°C during test periods 1–2, 3–5, 6–7, and 7–8 .................................................... 28
32. Change in crack length and ECP of Pt and SS electrodes when the DO level infeedwater was decreased from ª300 to <40 ppb and increased from <40 toª300 ppb..................................................................................................................... 30

viii
33. Photomicrographs of the fracture surface of Specimen C16–B ................................ 31
34. Crack–length–vs.–time plots for irradiated Type 316 SS in high–purity water at289°C during test periods up to 1, 2–3, 4–5, 6–7, 8–10, 11–12, and 13–15. ........... 31
35. Photomicrographs of the fracture surface of Specimen C3–A................................... 35
36. Crack–length–vs.–time plots for irradiated Type 316 SS in high–purity water at289°C during test periods 1–2, 3–5, 6–7, 8–10, and 11–12...................................... 35
37. CGR data for irradiated austenitic SSs under continuous cycling at 289°C inhigh–purity water with ª300 ppb and <30 ppb dissolved oxygen. ........................... 37
38. CGR data under constant load with periodic partial unloads for irradiatedaustenitic SSs in high–purity water at 289°C ........................................................... 38
A-1.1. Load-vs.-loadline displacement curve for specimen Y4–03 of thermally agedCF–8M cast SS tested at 288°C ................................................................................. 48
A-1.2. Fracture surface of specimen Y4–03 tested at 288°C ............................................... 48
A-2.1. Load-vs.-loadline displacement curve for specimen Y4–02 of thermally agedCF–8M cast SS tested at 288°C ................................................................................. 50
A-2.2. Fracture surface of specimen Y4–02 tested at 288°C ............................................... 50
A-3.1. Load-vs.-loadline displacement curve for specimen 75–03T of thermally agedCF–8M cast SS tested at 288°C ................................................................................. 52
A-3.2. Fracture surface of specimen 75–03T tested at 288°C ............................................. 52
A-4.1. Load-vs.-loadline displacement curve for specimen 75–04T of thermally agedCF–8M cast SS tested at 288°C ................................................................................. 54
A-4.2. Fracture surface of specimen 75–04T tested at 288°C ............................................. 54
A-5.1. Load-vs.-loadline displacement curve for specimen 75–10T of thermally agedCF–8M cast SS tested at 288°C ................................................................................. 56
A-5.2. Fracture surface of specimen 75–10T tested at 288°C ............................................. 56
A-6.1. Load-vs.-loadline displacement curve for specimen 184–38 of 50% cold–workedType 316NG SS tested at 288°C ................................................................................ 58
A-6.2. Fracture surface of specimen 184–38 tested at 288°C ............................................. 58
A-7.1. Load-vs.-loadline displacement curve for specimen 184–40 of 50% cold–workedType 316NG SS tested at 288°C ................................................................................ 60
A-7.2. Fracture surface of specimen 184–40 tested at 288°C ............................................. 60
A-8.1. Load-vs.-loadline displacement curve for specimen C19–D of nonirradiatedType 304 SS tested at 288°C ..................................................................................... 62

ix
A-8.2. Fracture surface of specimen C19–D tested at 288°C .............................................. 62
A-9.1. Load-vs.-loadline displacement curve for specimen C16–C of nonirradiatedType 316 SS tested at 288°C ..................................................................................... 64
A-9.2. Fracture surface of specimen C16–C tested at 288°C............................................... 64
A-10.1. Load-vs.-loadline displacement curve for specimen C16–D of nonirradiatedType 316 SS tested at 288°C ..................................................................................... 66
A-10.2. Fracture surface of specimen C16–D tested at 288°C .............................................. 66
A-11.1. Load-vs.-loadline displacement curve for specimen L20–D of nonirradiatedType 304 SS tested at 288°C ..................................................................................... 68
A-11.2. Fracture surface of specimen L20–D tested at 288°C............................................... 68
A-12.1. Load-vs.-loadline displacement curve for specimen L2–C of nonirradiatedType 304 SS tested at 288°C ..................................................................................... 70
A-12.2. Fracture surface of specimen L2–C tested at 288°C................................................. 70
A-13.1. Load-vs.-loadline displacement curve for specimen L2–E of nonirradiatedType 304 SS tested at 288°C ..................................................................................... 72
A-13.2. Fracture surface of specimen L2–E tested at 288°C ................................................. 72
A-14.1 Load-vs.-loadline displacement curve for specimen C19–A of irradiatedType 304 SS tested at 288°C ..................................................................................... 74
A-14.2 Fracture surface of specimen C19–A tested at 288°C............................................... 74
A-15.1 Load-vs.-loadline displacement curve for specimen C19–B of irradiatedType 304 SS tested at 288°C ..................................................................................... 76
A-15.2 Fracture surface of specimen C19–B tested at 288°C............................................... 76
A-16.1 Load-vs.-loadline displacement curve for specimen C19–C of irradiatedType 304 SS tested at 288°C ..................................................................................... 78
A-16.2 Fracture surface of specimen C19–C tested at 288°C............................................... 78
A-17.1 Load-vs.-loadline displacement curve for specimen C16–A of irradiatedType 316 SS tested at 288°C ..................................................................................... 80
A-17.2 Fracture surface of specimen C16–A tested at 288°C............................................... 80
A-18.1. Load-vs.-loadline displacement curve for specimen L20–A of irradiatedType 304 SS tested at 288°C ..................................................................................... 82
A-18.2. Fracture surface of specimen L20–A tested at 288°C ............................................... 82
A-19.1. Load-vs.-loadline displacement curve for specimen L20–B of irradiatedType 304 SS tested at 288°C ..................................................................................... 84

x
A-19.2. Fracture surface of specimen L20–B tested at 288°C............................................... 84
A-20.1. Load-vs.-loadline displacement curve for specimen L2–A of irradiatedType 304 SS tested at 288°C ..................................................................................... 86
A-20.2. Fracture surface of specimen L2–A tested at 288°C ................................................. 86
Tables
1. Composition of austenitic stainless steels irradiated in the Halden reactor............ 6
2. Tensile properties of irradiated austenitic stainless steels at 288°C........................ 6
3. Crack growth results for Specimen C3–B of Type 304 SS in high–purity waterat 289°C...................................................................................................................... 22
4. Crack growth results for Specimen C3–C of Type 304 SS in high–purity waterat 289°C...................................................................................................................... 26
5. Crack growth results for Specimen C16–B of Type 316 SS in high–purity waterat 289°C...................................................................................................................... 29
6. Crack growth results for Specimen C3–A of Type 304 SS in high–purity waterat 289°C...................................................................................................................... 34
A-1. Test data for specimen Y4–03 of thermally aged CF–8M cast SS tested at288°C.......................................................................................................................... 47
A-2. Test data for specimen Y4–02 of thermally aged CF–8M cast SS tested at288°C.......................................................................................................................... 49
A-3. Test data for specimen 75–03T of thermally aged CF–8M cast SS tested at288°C.......................................................................................................................... 51
A-4. Test data for specimen 75–04T of thermally aged CF–8M cast SS tested at288°C.......................................................................................................................... 53
A-5. Test data for specimen 75–10T of thermally aged CF–8M cast SS tested at288°C.......................................................................................................................... 55
A-6. Test data for specimen 184–38 of 50% cold–worked Type 316NG SS tested at288°C.......................................................................................................................... 57
A-7. Test data for specimen 184–40 of 50% cold–worked Type 316NG SS tested at288°C.......................................................................................................................... 59
A-8. Test data for specimen C19–D of nonirradiated Type 304 SS tested at 288°C........ 61
A-9. Test data for specimen C16–C of nonirradiated Type 316 SS tested at 288°C ........ 63

xi
A-10. Test data for specimen C16–D of nonirradiated Type 316 SS tested at 288°C........ 65
A-11. Test data for specimen L20–D of nonirradiated Type 304 SS tested at 288°C......... 67
A-12. Test data for specimen L2–C of nonirradiated Type 304 SS tested at 288°C........... 69
A-13. Test data for specimen L2–E of nonirradiated Type 304 SS tested at 288°C........... 71
A-14. Test data for specimen C19–A of irradiated Type 304 SS tested at 288°C............... 73
A-15. Test data for specimen C19–B of irradiated Type 304 SS tested at 288°C............... 75
A-16. Test data for specimen C19–C of irradiated Type 304 SS tested at 288°C .............. 77
A-17. Test data for specimen C16–A of irradiated Type 316 SS tested at 288°C............... 79
A-18. Test data for specimen L20–A of irradiated Type 304 SS tested at 288°C ............... 81
A-19. Test data for specimen L20–B of irradiated Type 304 SS tested at 288°C............... 83
A-20. Test data for specimen L2–A of irradiated Type 304 SS tested at 288°C ................. 85

xii

xiii
Executive Summary
Austenitic stainless steels (SSs) are used extensively as structural alloys in the internalcomponents of reactor pressure vessels because of their high strength, ductility, and fracturetoughness. Fracture of these steels occurs by stable tearing at stresses well above the yieldstress, and tearing instabilities require extensive plastic deformation. However, exposure toneutron irradiation for extended periods changes the microstructure and degrades the fractureproperties of these steels. Irradiation leads to a significant increase in yield strength andreduction in ductility and fracture resistance of austenitic SSs. Existing data on fracturetoughness of austenitic SSs indicate substantial decrease in toughness at exposures of1–10 dpa; the effect is largest in high–toughness steels. However, most of the existing fracturetoughness test data have been obtained at temperatures above 350°C; fracture toughnessresults that are relevant to light water reactors (LWRs) are very limited.
In addition, radiation can exacerbate the corrosion fatigue and stress corrosion cracking(SCC) behavior of SSs by affecting the material microchemistry, e.g., radiation–inducedsegregation; material microstructure, e.g., radiation hardening; and water chemistry, e.g.,radiolysis. Service failures in core components of several operating reactors have beenattributed to irradiation assisted stress corrosion cracking (IASCC). While initially consideredas a unique form of cracking that would not occur in the absence of radiation, IASCC is nowgenerally considered as a radiation accelerated environmental cracking process. It has beentermed as premature subcritical cracking of materials exposed to ionizing irradiation. Thefactors that influence SCC susceptibility of materials include neutron fluence, cold work,corrosion potential, water purity, temperature, and loading.
This report presents experimental data on fracture toughness and crack growth rate(CGR) for austenitic Types 304 and 316 SS that were irradiated to fluence levels of ª0.3, 0.9,and 2.0 x 10²¹ n/cm2 (E > 1 MeV) (ª0.45, 1.35, and 3.0 dpa) at ª288°C. The irradiations werecarried out in a He environment in the Halden heavy water boiling reactor. Fracture toughnesstests were conducted in air and CGR tests in normal water chemistry (NWC) and hydrogenwater chemistry (HWC) BWR environments at ª288°C. All tests were performed on 1/4–Tcompact tension specimens.
Neutron irradiation at 288°C to 2.0 x 10²¹ n/cm2 (E > 1 MeV) (3.0 dpa) decreased thefracture toughness of all of the steels. In general, fracture toughness of the commercial HeatsC16 and C19 is superior to that of the laboratory Heats L20 and L2. These differences ariseprimarily from differences in toughness of the nonirradiated steels, i.e., the fracture toughnessof the laboratory heats is significantly lower than that of the commercial heats. The fracturetoughness J–R curves for irradiated Types 304 and 316 SS are comparable. The data fromcommercial heats fall within the scatter band for the data obtained at higher temperatures.For Heat C19 of Type 304 SS irradiated to 0.3, 0.9, and 2.0 x 10²¹ n/cm2, the JIc values are507, 313, and 188 kJ/m2, respectively.
The results indicate significant enhancement of CGRs of irradiated steel in the NWC BWRenvironment. The CGRs of irradiated steels are a factor of ª5 higher than the disposition curveproposed in NUREG–0313 for sensitized austenitic SSs in water with 8 ppm dissolved oxygen(DO). The CGRs of Type 304 SS irradiated to 0.9 and 2.0 x 10²¹ n/cm2 and of Types 304 and316 SS irradiated to 2.0 x 10²¹ n/cm2 are comparable.

xiv
In low–DO BWR environments, the CGRs of the irradiated steels decreased by an order ofmagnitude in some tests, e.g., Heat C3 of Type 304 SS irradiated to 0.9 x 10²¹ n/cm2 and HeatC16 of Type 316 SS irradiated to 2 x 10²¹ n/cm2. The beneficial effect of decreased DO wasnot observed for Heat C3 of Type 304 SS irradiated to 2 x 10²¹ n/cm2; it is possible that thisdifferent behavior is associated with the loss of constraint in the specimen due to the highapplied load.
Type 304 SS irradiated to 0.3 x 10²¹ n/cm2 shows very little environmental enhancementof CGRs in the NWC BWR environment; the CGRs under SCC conditions are below thedisposition curve for sensitized SSs in water with 8 ppm DO given in NUREG–0313.

xv
Acknowledgments
The authors thank T. M. Galvin, L. A. Knoblich, E. J. Listwan, and R. W. Clark for theircontributions to the experimental effort. This work is sponsored by the Office of NuclearRegulatory Research, U.S. Nuclear Regulatory Commission, under Job Code Y6388; ProjectManager: W. H. Cullen, Jr. and C. E. Moyer.

xvi

1
1. Introduction
Austenitic stainless steels (SSs) are used extensively as structural alloys in reactorpressure vessel internal components because of their high strength, ductility, and fracturetoughness. Fracture of these steels occurs by stable tearing at stresses well above the yieldstress, and tearing instabilities require extensive plastic deformation. However, exposure toneutron irradiation for extended periods changes the microstructure and degrades the fractureproperties of these steels. Irradiation leads to a significant increase in yield strength andreduction in ductility and fracture resistance of austenitic SSs.1–3 Changes in mechanicalproperties are known to influence fatigue or corrosion fatigue properties of irradiatedmaterials.4 Irradiation assisted stress corrosion cracking (IASCC) is another degradationprocess that affects light water reactor (LWR) internals exposed to fast neutron radiation.1,5,6
Neutron irradiation of austenitic SSs at temperatures below 400°C leads to the formationof a substructure with very fine defects that consist of small (<5 nm) vacancy and interstitialloops or “black spots” and larger (>5 nm) faulted interstitial loops.7–9 The latter are obstaclesto dislocation motion and lead to matrix strengthening and increase in tensile strength. Also,irradiation–induced defects cause loss of ductility and reduced strain-hardening capacity of thematerial. The effects of radiation on various austenitic SSs vary significantly and appear to berelated to minor differences in the chemical composition of the steels;1 the chemicalcomposition can influence the stacking fault energy and/or irradiation–inducedmicrostructure. As yield strength approaches ultimate strength, planar slip or dislocationchanneling is promoted and leads to pronounced degradation in the fracture resistance ofthese steels.3 In general, higher stacking–fault energy enhances and cold working inhibitsdislocation channeling.1
0
200
400
600
800
1000
1200
0 5 10 15 20 25
Michel & Gray, 1987Van Osch et al., 1997Dufresne et al., 1979
Mills et al., 1985Mills, 1988
Bernard & Verzeletti, 1985Picker et al., 1983Ould et al., 1988J I
c (k
J/m
2)
Neutron Exposure (dpa)
Types 304 & 316 SSIrradiation Temp: 350 - 450°CTest Temp: 350 - 427°C
Figure 1.Fracture toughness JIc as a function ofneutron exposure for austenitic Types 304and 316 SS
The effect of neutron exposure on the fracture toughness JIc of austenitic SSs irradiatedat 350–450°C is shown in Fig. 1.10–18 The effects of irradiation may be divided into threeregimes: little or no loss of toughness below a threshold exposure of ª1 dpa, substantial

2
decrease in toughness at exposures of 1–10 dpa, and no further reduction in toughness abovea saturation exposure of 10 dpa. The effect is largest in high–toughness steels. Thedegradation in fracture properties saturates at a JIc value of ª30 kJ/m2 (or equivalent criticalstress intensity factor KJc of 70 MPa m0.5). Also, the failure mode changes from dimplefracture to channel fracture. However, most of the existing fracture toughness test data havebeen obtained at temperatures above 350°C; fracture toughness results that are relevant toLWRs are very limited.2
Radiation can exacerbate the corrosion fatigue and stress corrosion cracking (SCC)behavior of SSs by affecting the material microchemistry, e.g., radiation–induced segregation;material microstructure, e.g., radiation hardening; and water chemistry, e.g., radiolysis.5
Service failures in core components of several boiling water reactors (BWRs)1 9,20 andpressurized water reactors (PWRs)4,21 have been attributed to IASCC. While initiallyconsidered as a unique form of cracking that would not occur in the absence of radiation,IASCC is now generally considered as a radiation accelerated environmental cracking process.It has been termed as premature subcritical cracking of materials exposed to ionizingirradiation.
The factors that influence SCC susceptibility of materials include neutron fluence, coldwork, corrosion potential, water purity, temperature, and loading. The effects of neutronfluence on IASCC of austenitic SSs has been investigated for BWR control blade sheaths20 andlaboratory tests on BWR–irradiated material;5,22–24 the extent of intergranular SCC increaseswith fluence. Although a threshold fluence level of 5 x 10²⁰ n/cm2 (E >1 MeV) has beenreported for austenitic SSs in BWR environment, the experimental data show an increase inintergranular cracking above a fluence of ª2 x 10²⁰ n/cm2 (E >1 MeV) (ª0.3 dpa). The resultsalso show the beneficial effect of reducing the corrosion potential of the environment.25,26
However, low corrosion potential does not provide immunity to IASCC, e.g., intergranular SCChas been observed in cold worked, irradiated SS baffle bolts in PWRs. The threshold fluencefor IASCC is higher under low potential conditions such as HWC in BWRs or PWR primarywater chemistry.
This report presents experimental data on fracture toughness, corrosion fatigue, andstress corrosion cracking (SCC) of austenitic SSs that were irradiated to fluence levels of ª0.3,0.9, and 2.0 x 10²¹ n/cm2 (E > 1 MeV) (ª0.45, 1.35, and 3.0 dpa) at ª288°C. The irradiationswere carried out in a He environment in the Halden heavy water boiling reactor. Fracturetoughness tests were conducted in air and CGR tests in normal water chemistry (NWC) andlow–DO BWR environments at 288°C. The results are compared with the existing dataobtained from irradiated reactor internal components removed from operating plants andmaterials irradiated in test reactors.

3
2. Experimental
Fracture toughness J–R curve and crack growth rate (CGR) tests have been conducted at288°C on several austenitic SSs that were irradiated up to 2.0 x 10²¹ n/cm2 (E > 1 MeV)(ª3.0 dpa) at ª288°C in a helium environment in the Halden boiling heavy water reactor. Thetests were performed on 1/4–T compact tension (CT) specimens; the J–R curve tests wereperformed in air and CGR tests in BWR environments. A modified configuration of the CTspecimen geometry, Fig. 2, was used in the present study. Crack extensions were determinedby both DC potential and elastic unloading compliance techniques.
'C'
7.00
7.00
3.30
3.30
.794CENTERED
3.00 DIA.2 THRU HOLES
+.05- .00
15.00
14.00
6.50
'M'
A .02A
A .02
B
B .02
A .02
A .02
6.00
12.00
2.00
1.53 DIA2 THRU HOLES
2.00
2.00
1.45
3.25
1.45
#56 (1.19) DIA. DRILL 3.25 DP.#0-80 UNF-2B TAP 2.17 ±.06 DP. 2
XXX-X
SPECIMEN ID
C
C .02
C .02
.45 R
.45
DETAIL 'M'
Figure 2. Configuration of compact–tension specimen used for this study (dimensions in mm)
HydraulicActuator
Furnace
Load Cell
PneumaticCyl inder
Figure 3. Schematic representation of hot–cell J–R test facility
The facility for conducting the tests is designed for in–cell testing, with the test train,furnace, and other required equipment mounted on top of a portable wheeled cart that can beeasily rolled into the cell. A schematic representation of the system is shown in Fig. 3. A small

4
autoclave is installed inside the furnace for conducting tests in simulated BWR environments.Water is circulated through a port in the autoclave cover plate that serves both as inlet andoutlet. The hydraulic actuator is mounted on top of the frame, with the test train componentssuspended beneath it. A drawing of the actuator, load cell, test train, autoclave, and furnaceare shown in Fig. 4. The 22–kN (5–kip) load cell is at the top of the pull rod. The furnace ismounted on a pneumatic cylinder and can be raised to enclose the autoclave with the load cageand the specimen during the test. An Instron Model 8500+ Dynamic Materials Testing Systemis used for performing the tests.
The load cage that contains the test specimen consists of the cover plate of a 1–liter SSautoclave (from PARR Associates) and a 12.7–mm–thick bottom plate separated by fourcompression rods. The lower two–piece clevis assembly is fastened to the bottom plate of thecage with the two sections connected by an oxidized zircalloy pin, electrically insulated withmica washers. The same arrangement is used for the upper clevice assembly, connected to thepull rod. A 1/4–T CT specimen is mounted in the clevises with Inconel pins. Platinum wiresare used for the current and potential leads. The current leads are attached to SS split pinsthat are inserted into the holes at the top and bottom of the specimen. The potential leads areattached by screwing short SS pins into threaded holes in the specimen and attaching theplatinum wires with in–line SS crimps.
Furnace
Load Cage
Actuator
Load Cell
CompressionColumns (4)
LVDT
Pull Rod
Autoclave
Specimen
Figure 4. Schematic of the actuator, load cell, test train, autoclave, and furnace
The recirculating water system consists of a storage tank, high pressure pump,regenerative heat exchanger, autoclave preheater, test autoclave, electrochemical potential(ECP) cell preheater, ECP cell, regenerative heat exchanger, Mity MiteTM back-pressureregulator, an ion–exchange cartridge, a 0.2 micron filter, a demineralizer resin bed, another

5
0.2 micron filter, and return line to the tank. A schematic diagram of the recirculating watersystem is shown in Fig. 5. Water is circulated at low flow rates, e.g., ª10 mL/min.
The BWR environments comprise high–purity–deionized water that contains eitherª300 ppb or <30 ppb DO resulting in ECPs for SS that range from 160 to -500 mV. Thefeedwater is stored in a 135–L SS tank manufactured by Filpaco Industries. The tank isdesigned for vacuum and over pressure to 60 psig. The deionized water is prepared by passingpurified water through a set of filters that comprise a carbon filter, an Organex–Q filter, two ionexchangers, and a 0.2–mm capsule filter. Water samples are taken periodically to measure pH,resistivity, and DO concentration. The DO level in water is established by bubbling nitrogenthat contains ª1% oxygen through the deionized water in the supply tank. The DO is reducedto <10 ppb by bubbling nitrogen through the water; a vacuum is drawn on the tank cover gasto speed deoxygenation. The cover gas of the storage tank is nitrogen plus 1% oxygen forhigh–DO environment, and either pure nitrogen or nitrogen plus 5% hydrogen for low–DOenvironment.
1. COVER GAS SUPPLY TANK 2. HIGH-PRESSURE REGULATOR WITH FLASH ARRESTOR 3. LOW-PRESSURE REGULATOR 4. FLOW METER 5. GAS PURIFIER 6. PRESSURE GAUGE 7. PRESSURE RELIEF VALVE 8. VENT TO AIR WITH FLASH ARRESTOR 9. FEEDWATER STORAGE TANK10. SPARGE TUBE11. FEEDWATER FILL PORT12. WATER SAMPLE PORT13. SOLENOID VALVE14. 0.2–MICRON FILTER15. HIGH-PRESSURE PUMP
16. CHECK VALVE17. RUPTURE DISK18. HEAT EXCHANGER19. SYSTEM BLEED PORT20. HIGH-PRESSURE GAUGE21. AUTOCLAVE PREHEATER22. PARR AUTOCLAVE23. THERMOCOUPLE WELL24. ECP CELL PREHEATER25. ECP CELL26. ECP CELL BYPASS LINE27. BACK–PRESSURE RELIEF VAVLE28. ION EXCHANGE CARTRIDGE29. RECIRCULATING PUMP30. DEMINERALIZER31. DEMINERALIZER BYPASS LINE
20
12
19
30
147
5
6
8
9
10
11
13
1517
21
23
24
OUTSIDE CELL INSIDE CELLV1
V3 V6
V7
V8
V17
22
V2
25
14
16
19
27
712
V12
V13
2829
V9
1826
V10
V11V16
V4
V15
14V14
V5
1
2 34
31
Figure 5. Schematic diagram of recirculating water system
The fracture toughness J–R curve tests were performed in accordance with therequirements of ASTM Specification E 1737 for “J–Integral Characterization of FractureToughness.” The CGR tests were performed in accordance with ASTM E–647 “Standard TestMethod for Measurement of Fatigue Crack Growth Rates” and ASTM E–1681 “Standard TestMethod for Determining a Threshold Stress Intensity Factor for Environment–Assisted

6
Cracking of Metallic Materials Under Constant Load.” The composition of the various heats ofirradiated austenitic SSs is presented in Table 1. The tensile yield and ultimate stress for thevarious SSs irradiated to the three fluence levels and in the nonirradiated condition27,28 aregiven in Table 2.
Table 1. Composition (wt.%) of austenitic stainless steels irradiated in the Halden reactor
AlloyIDa
VendorHeat ID Analysis Ni Si P S Mn C N Cr Mo Ob
Type 304 SSC3 PNL-C-6 Vendor 8.91 0.46 0.019 0.004 1.81 0.016 0.083 18.55
ANL 9.10 0.45 0.020 0.003 1.86 0.024 0.074 18.93 144C19 DAN–74827 Vendor 8.08 0.45 0.031 0.003 0.99 0.060 0.070 18.21 –
ANL 8.13 0.51 0.028 0.008 1.00 0.060 0.068 18.05 200L2 BPC–4–111 Vendor 10.50 0.82 0.080 0.034 1.58 0.074 0.102 17.02 66L20 BPC–4–101 Vendor 8.91 0.17 0.010 0.004 0.41 0.002 0.002 18.10 –
ANL 8.88 0.10 0.020 0.005 0.47 0.009 0.036 18.06 940Type 316 SS
C16 PNL–SS–14 Vendor 12.90 0.38 0.014 0.002 1.66 0.020 0.011 16.92 –ANL 12.32 0.42 0.026 0.003 1.65 0.029 0.011 16.91 2.18 157
aFirst letters “C” and “L” denote commercial and laboratory heats, respectively.bIn wppm.
Table 2. Tensile propertiesa of irradiated austenitic stainless steels at 288°C
Fluence (E >1 MeV)
Nonirradiated 0.3 x 10²¹ n/cm2 0.9 x 10²¹ n/cm2 2.0 x 10²¹ n/cm2
Steel Type(Heat)
Yield(MPa)
Ultimate(MPa)
Yield(MPa)
Ultimate(MPa)
Yield(MPa)
Ultimate(MPa)
Yield(MPa)
Ultimate(MPa)
304 SS (C3) (154) (433) 338 491 632 668 796 826304 SS (C19) 178 501 554 682 750 769 787 801304 SS (L2) 193 348 – – 839 849 – –304 SS (L20) – – 454 552 670
632743697
– –
316 SS (C16) (189) (483) 370 527 562 618 766 803aEstimated values within parentheses.
The experimental data for the fracture toughness J–R curves are compiled in theAppendix. Some of the results have been presented earlier.29–32 Because tensile properties ofthe material were not available for some irradiation conditions, estimated values of flow stresswere used in the earlier presentations. In the present report, the fracture toughness resultshave been reevaluated using tensile properties determined from comparably irradiated tensilespecimens.27,28
Also, in earlier publications,29–33 Heat C16 was erroneously identified as Type 304 SS.Because the flow stress for solution annealed Type 316 SS is typically higher than that forsolution annealed Type 304 SS, the experimental data for nonirradiated Heat C16 have beencorrected in the present report; the difference is essentially in the slope of the blunting line.
2.1 J–R Curve Characterization
Before testing, the specimens were fatigue–precracked in air at room temperature. Theprecracked specimens were then tested at 288°C at a constant extension rate; tests wereinterrupted periodically to determine the crack length. Specimens were held at constantextension to measure crack length by both the DC potential drop and elastic unloadingcompliance techniques. For most steels, load relaxation occurs during the hold period or
7
unloading, which causes a time-dependent nonlinearity in the unloading curve. Consequently,before unloading, the specimen was held for ª1 min to allow load relaxation. Elastic unloadingand reloading was carried out in the load control mode.
Specimen extension was monitored and controlled outside the high–temperature zone.The displacement of load points was determined by subtracting the extension of the load trainfrom the measured extension. The load train displacement was determined as a function ofapplied load using a very stiff specimen. The load–line displacements determined by thismethod were compared with actual displacements measured optically during J–R curve tests atroom temperature. The measured and estimated values were in very good agreement; forload–line displacements up to 2 mm, the error in the estimated values was <0.02 mm.33
Examples of load-vs.-loadline displacement curves for irradiated SS are shown in Fig. 6.
The J–integral was calculated from the load–vs.–loadline displacement curves accordingto the correlations for DC(T) specimens in ASTM Specification E 1737. The followingcorrelation, obtained from the best–fit of the experimental data, was used to determine cracklengths by the unloading compliance method.
ai/W = 1.2011 – 7.1572 ux + 16.87 ux2 – 13.527 ux
3, (1)
where
ux = 1 / [(BefEefCci)1/2 + 1], (2)
Bef = B –(B – BN)2 / B, (3)
Eef = E / (1 –u2), (4)
W is the specimen width, B is the specimen thickness, BN is the net specimen thickness ordistance between the roots of the side grooves, E is the elastic modulus, u is Poisson's ratio,and Cci is the specimen elastic compliance corrected for rotation of the crack centerline. Theeffective elastic modulus Eef was adjusted with the measured initial crack length ai, i.e., Eefwas determined from Eqs. 1 and 2 by using the measured fatigue precrack length ai and thecorresponding corrected specimen elastic compliance Cci.
0.0
0.5
1.0
1.5
2.0
2.5
3.0
3.5
4.0
0 0.5 1 1.5 2 2.5 3 3.5 4
Measured ExtensionLoading–Pin Displacement
Load
(kN
)
Displacement (mm)
Test JRI-21288°C
Specimen C19–A0.3 x 102 1 n cm– 2
0.0
0.5
1.0
1.5
2.0
2.5
3.0
3.5
4.0
0 0.5 1 1.5 2 2.5
Measured ExtensionLoading–Pin Displacement
Load
(kN
)
Displacement (mm)
Test JRI-22288°C
Specimen L20–A0.3 x 10-21 n cm – 2
(a) (b)Figure 6. Examples of load-vs.-loadline displacement curves for irradiated specimens of Heats
(a) C19 and (b) L20 of Type 304 SS tested at 288°C

8
The following correlation, obtained from the best–fit of the experimental data fornormalized crack length and normalized DC potential, was used to determine crack lengths bythe DC potential method.
a
W
U
Ui = -
Ê
ËÁ
ˆ
¯˜
È
ÎÍÍ
˘
˚˙˙
0 28887 0 50
0 34775
. .
.
, (5)
where W is the specimen width, and U and U0 are the current and initial potentials.Equation 5 is comparable to the ASTM E 1737 correlation for a CT specimen with currentinputs at the W/4 position and DC potential lead connections at the W/3 position.
The DC potential data were corrected for the effects of plasticity on the measuredpotential, i.e., large crack–tip plasticity can increase measured potentials due to resistivityincreases without crack extension. As per ASTM E 1737, the change in potential before crackinitiation was ignored, and the remainder of the potential change was used to establish the J–Rcurve. A plot of normalized potential vs. loadline displacement generally remains linear untilthe onset of crack extension. For all data within the linear portion of the curve, crackextension was calculated from the blunting–line relationship Da = J/(4sf), where sf is the flowstress defined as the average of the 0.2% offset yield stress and ultimate tensile stress. Theexclusion lines are parallel to the blunting line intersecting the abscissa at 0.15 and 1.50 mm.
Although ASTM E 813 specifies a slope of two times the effective yield stress (or flowstress) for the offset line, a slope of four times the flow stress was used to define the offset andexclusion lines. For high–strain–hardening materials, e.g., nonirradiated austenitic SSs, aslope that is four times the flow stress (4sf) represents the blunting line better than the slope of2sf defined in ASTM E 1737.3 In irradiated materials, the increase in yield stress is primarilydue to a high density of barriers to dislocation motion. During deformation as dislocationssweep through the irradiated matrix, they annihilate the very fine scale of barriers, thuscreating a “channel” for easy dislocation motion. This may result in marked work softening.To account for possible strain softening that may occur in irradiated materials, an effective flowstress defined as the average of the nonirradiated and irradiated flow stress was used in J–Rcurve data analysis. Because the effective flow stress discounts the irradiation–inducedincrease in flow stress by a factor of 2, the slope of the blunting line was defined as 4sf even forthe irradiated materials.
The final crack size was marked by fatigue cycling at room temperature. The specimenswere then fractured and the initial (i.e., fatigue precrack) and final (test) crack lengths of bothhalves of the fractured specimen were measured optically. The crack lengths were determinedby the 9/8 averaging technique, i.e., the two near–surface measurements were averaged andthe resultant value was averaged with the remaining seven measurements.
The elastic unloading compliance measurements were adjusted only with the measuredinitial crack length, whereas the crack length measurements obtained by the DC potential–droptechnique were adjusted with both the initial and final crack lengths. The two-point pinningmethod was used to correct the measured potentials from the test data. The correctednormalized potentials NP are expressed in terms of the measured normalized potentials NP(U/U0 in Eq. 5) by the relationship

9
NPNP P
P P= -
-1
2 1
. (6)
The variables P1 and P2 are solutions of the expressions
NPNP P
P Pii i= --2 1
, (7)
and
NPNP P
P Pff i=
--2 1
, (8)
where NPi and NPf are normalized potentials that correspond to initial and final crack lengthsdetermined from Eq. 5, and NPi and NPf are the measured values. The fracture toughness JIcvalues were determined from ASTM E–813 as the intersection of the 0.2–mm offset line with thepower law fit (of the form J = Dan) of the test data between the 0.15– and 1.50–mm exclusionlines.
Several fracture toughness J–R curve tests were conducted at room temperature and288°C on thermally aged CF–8M cast SS and on a 50% cold–worked (CW) Type 316LN SS todevelop correlations for estimating crack lengths and to validate the test procedure.Experimental data for the tests at 288°C are given in the Appendix, Tables A–1 to A–7.
For materials with relatively low fracture toughness, e.g., JIc <300 kJ/m2, themeasurements of crack extension by the elastic unloading compliance method showedexcellent agreement with those obtained by DC potential methods. The J–R curves obtainedfrom DC potential and elastic unloading compliance methods for thermally aged cast CF–8MSSs and 50% cold–worked Type 316NG SS at 288°C are shown in Figs. 7–9. Replicate tests ondifferent specimens of the same material show good reproducibility of the J–R curves.
0
100
200
300
400
500
0 0.5 1 1.5 2 2.5 3 3.5
DC PotentialElastic Unloading
Def
orm
atio
n J
(kJ/
m2)
Crack Extension (mm)
CF–8M (Specimen Y4–02)Aged 700 h at 400°C288°C
0
100
200
300
400
500
0 0.5 1 1.5 2 2.5 3 3.5
DC PotentialElastic Unloading
Def
orm
atio
n J
(kJ/
m2 )
Crack Extension (mm)
CF–8M (Specimen Y4–03)Aged 700 h at 400°C288°C
(a) (b)Figure 7. Fracture toughness J–R curves obtained from DC potential and elastic unloading compliance
methods for specimens (a) Y4–02 and (b) Y4–03 of thermally aged cast CF–8M SS

10
0
100
200
300
400
500
0 0.5 1 1.5 2 2.5 3 3.5
DC PotentialElastic Unloading
Def
orm
atio
n J
(kJ/
m2 )
Crack Extension (mm)
CF–8M (Specimen 75–03T)Aged 10,000 h at 400°C288°C
0
100
200
300
400
500
0 0.5 1 1.5 2 2.5 3 3.5
DC PotentialElastic Unloading
Def
orm
atio
n J
(kJ/
m2 )
Crack Extension (mm)
CF–8M (Specimen 75–04T)Aged 10,000 h at 400°C288°C
(a) (b)
0
100
200
300
400
500
0 0.5 1 1.5 2 2.5 3 3.5
DC PotentialElastic Unloading
Def
orm
atio
n J
(kJ/
m2 )
Crack Extension (mm)
CF–8M (Specimen 75–10T)Aged 10,000 h at 400°C288°C
Figure 8.Fracture toughness J–R curves obtained from DCpotential and elastic unloading compliancemethods for thermally aged Heat 75 of castCF–8M SS; specimen (a) 75–03T, (b) 75–04T,and (c) 75–10T
(c)
0
100
200
300
400
500
0 0.5 1 1.5 2 2.5 3 3.5
DC PotentialElastic Unloading
Def
orm
atio
n J
(kJ/
m2)
Crack Extension (mm)
Type 316NG SS (Specimen 184–38)50% Cold Worked288°C
0
100
200
300
400
500
0 0.5 1 1.5 2 2.5 3 3.5
DC PotentialElastic Unloading
Def
orm
atio
n J
(kJ/
m2)
Crack Extension (mm)
Type 316NG SS (Specimen 184–40)50% Cold Worked288°C
(a) (b)
Figure 9. Fracture toughness J–R curves obtained from DC potential and elastic unloading compliancemethods for 50% cold–worked Type 316NG; specimen (a) 184–38 and (b) 184–40
The J–R curves obtained from 1/4–T CT specimens of thermally aged Heat 75 of CF–8Mcast SS are compared with those obtained from 1–T CT specimens of the same heat in Fig. 10.The curves for the 1/4–T CT specimens show good agreement with the curve for the 1–T CTspecimen with the same orientation, e.g., transverse orientation.

11
0
100
200
300
400
500
0 0.5 1 1.5 2 2.5 3 3.5
751-02T75-03T75-04T75-10T
Def
orm
atio
n J
(kJ/
m2 )
Crack Extension (mm)
288°C, CF–8M (Heat 75)Aged 10,000 h at 400°C
Open Symbols: 1/4–T CTClosed Symbols: 1–T CT
Specimen #
Figure 10.Fracture toughness J–R curves for 1/4–T and 1–TCT specimens of aged Heat 75 of CF–8M caststainless steel at 288°C. The last digit in thespecimen number represents orientation; T = transverse.
2.2 Crack Growth Rate Tests
2.2.1 Procedure
All specimens were fatigue precracked in the test environment at temperature and loadratio R = 0.2, ª1 Hz frequency, and maximum stress intensity factor Kmax ª15 MPa m1/2. Afterª0.5–mm extension, R was increased incrementally to 0.7, and the loading waveform changedto a slow/fast sawtooth with rise times of 30–1000 s. Constant–load tests were conducted withthe trapezoidal waveform, R = 0.7, 1– or 2–h hold period at peak, and either 4– or 24–sunload/reload period. During individual test periods, Kmax was maintained approximatelyconstant by periodic load shedding (less than 2% decrease in load at any given time).
The stress intensity factor range DK was calculated as follows:
D DK
P
BB W
a
W
a
W
fa
WN
=( )
+ÊËÁ
ˆ¯
-ÊËÁ
ˆ¯
ÊËÁ
ˆ¯1 2 3 2
2
1/ /
(9)
DP P P= -max min for R > 0 (10)
fa
W
a
W
a
W
a
W
a
W
ÊËÁ
ˆ¯
= +ÊËÁ
ˆ¯
-ÊËÁ
ˆ¯
+ÊËÁ
ˆ¯
-ÊËÁ
ˆ¯
0 886 4 64 13 32 14 72 5 62 3 4
. . . . . . (11)
where Pmax and Pmin are maximum and minimum applied load, a is crack length, W is thespecimen width, and effective thickness Beff = (B BN)0.5. Also, because a modified configurationof disc–shaped CT specimen was used in the present study, crack length was calculated fromEq. 5 that was developed from the best fit of the experimental data for normalized crack lengthand normalized DC potential.
Under cyclic loading, the CGR (m/s) can be expressed as the superposition of the rate inair (i.e., mechanical fatigue) and the rates due to corrosion fatigue and SCC, given as
˙ ˙ ˙ ˙a a a aenv air cf scc= + + . (12)

12
During crack growth tests in high–temperature water, environmental enhancement of CGRsdoes not occur from the start of the test. Under more rapid cyclic loading, the crack growth isdominated by mechanical fatigue. The CGRs during precracking and initial periods of cyclicloading were primarily due to mechanical fatigue. For the present tests on irradiated SSs,environmental enhancement typically was observed under loading conditions that would leadto CGRs between 10-10 and 10–9 m/s in air. For Kmax values of 15–18 MPa m1/2, these valuescorrespond to a load ratio R ≥ 0.5 and rise time ≥ 30 s.
All tests were started in high–purity water that contained 250–300 ppb DO (i.e., NWCBWR environment). The ECPs of a Pt electrode and a SS sample located at the exit of theautoclave were monitored continuously during the test while the water DO level andconductivity were determined periodically. After data were obtained for high–DO water, the DOlevel in the feedwater was decreased to <30 ppb by sparging the feedwater with pure N2, and insome cases, this was followed by sparging with N2 + 5% H2 [to simulate hydrogen waterchemistry (HWC) BWR environment]. Because of the very low water flow rates, it took severaldays for the environmental conditions to stabilize. In general, the changes in ECP of the SSsample were slower than in the ECP of the Pt electrode.
After the test the final crack size was marked by fatigue cycling in air at roomtemperature. The specimens were then fractured, and the fracture surface of both halves ofthe specimen was photographed with a telephoto lens through the hot cell window. The finalcrack length of each half of the fractured specimen was measured from the photograph by the9/8 averaging technique.
2.2.2 Data Qualification
The ASTM specifications for specimen K/size criteria are intended to ensure applicabilityand transferability of the cracking behavior of a component or specimen of a given thicknessunder a specific loading condition to a crack associated with a different geometry, thickness,and loading condition.
The CGR test results were validated in accordance with the specimen size criteria ofASTM E 1681 and E 647. These criteria require that the plastic zone at the tip of a fatiguecrack is small relative to the specimen geometry. For constant load tests, ASTM E 1681requires that
Beff and (W–a) ≥2.5 (K/sys)2, (13)
and for cyclic loading ASTM 647 requires that
(W–a) ≥(4/p) (K/sys)2, (14)
where K is the applied stress intensity factor, and s ys is the yield stress of the material. For
tests on irradiated material, side grooved specimens are strongly recommended, with a depthfor each side groove between 5 and 10% of the specimen thickness. The effective thickness Beffof side–grooved specimen should be calculated as a root mean square, i.e., (B·BN)0.5. Inhigh–temperature water, because the primary mechanism for crack growth during continuouscycling is not mechanical fatigue, Eq. 13 is probably the more appropriate criterion, but Eq. 14may give acceptable results. For high–strain hardening materials, i.e., materials with an

13
ultimate to yield stress ratio (sult/sys) ≥1.3, both criteria allow the use of the flow stress definedas sf = (sult + sys)/2 rather than the yield stress.
The K/size criteria were developed for materials that show work hardening and, therefore,may not be valid for materials irradiated to fluence levels where, on a local level, they do notstrain harden. This lack of strain hardening, or strain softening, is most dramatic whendislocation channeling occurs but may also occur at lower fluences. For moderate to highlyirradiated material, it has been suggested that an effective yield stress, defined as the averageof the nonirradiated and irradiated yield stresses, be used;34 this discounts theirradiation–induced increase in yield stress by a factor of 2. This modification of the K/sizecriteria has been used in the current analysis.
2.2.3 Effect of Specimen Size
Several CGR tests were conducted on thermally aged CF–8M cast SS and on a 50% CWType 316LN SS in BWR environments to establish the test procedures and determine thepossible effect of specimen size. The experimental CGRs for the materials in water and thosepredicted in air for the same loading conditions are plotted in Fig. 11. The results obtainedearlier on a 1–T CT specimen of the same heat of 50% CW Type 316LN SS and Heat 75 ofCF8M cast SS in high–DO water are also included in the figure.35 The CGRs in air, aair (m/s),were determined from the correlations developed by James and Jones;36 it is expressed as
aair = CSS S(R) DK3.3/TR , (15)
where R is the load ratio (Kmin/Kmax), DK is Kmax – Kmin in MPa m1/2, TR is the rise time (s) ofthe loading waveform, and function S(R) is expressed in terms of the load ratio R as follows:
S(R) = 1.0 R <0S(R) = 1.0 + 1.8R 0 <R <0.79S(R) = -43.35 + 57.97R 0.79 <R <1.0, (16)
10-13
10-12
10-11
10-10
10-9
10-8
10-7
10-13 10-12 10-11 10-10 10-9 10-8 10-7
Heat 4331, 1/4-T CT700 h at 400°CHeat 75, 1-T CT10,000 h at 400°C or30,000 h at 350°CHeat 75 1/4-T CT10,000 h at 400°C
8 ppm DO0.3 ppm DO
CG
Ren
v (m
/s)
CGRair (m/s)
CF8M Cast SS289°C Open Symbols: ª0.3 ppm DOClosed Symbols: ª4.0 ppm DO
Shack/Kassner Model for
10-13
10-12
10-11
10-10
10-9
10-8
10-7
10-13 10-12 10-11 10-10 10-9 10-8 10-7
1/4-T CT, ª0.55 ppm DO
1-T CT, ª7.7 ppm DO1/4 T-CT , <0.04 ppm DO
8 ppm DO0.3 ppm DO
CG
Ren
v (m
/s)
CGRair (m/s)
50% Cold WorkedType 316LN SS289°C
Shack/Kassner Model for
Figure 11. Crack growth rate data under continuous cycling for thermally aged cast SS and 50%cold–worked Type 316LN SS in high–purity water at 289°C.

14
and function CSS is given by a third–order polynomial of temperature T (°C), expressed as
CSS = 1.9142 x 10⁻¹² + 6.7911 x 10⁻¹⁵ T – 1.6638 x 10⁻¹⁷ T2 + 3.9616 x 10⁻²⁰ T3. (17)
The two curves in the figure represent the best–fit curves for sensitized austenitic SSs inhigh–purity water at 289°C.35 The CGRs in water with ª0.3 ppm DO are given by theexpression
aenv = aair + 4.5 x 10⁻⁵ ( aair )0.5 (18)
and in water with ª8 ppm DO by the expression
aenv = aair + 1.5 x 10⁻⁴ ( aair )0.5. (19)
The experimental CGRs for the 1/4–T CT specimen of Heat 4331 are in good agreementwith the data obtained on the 1–T CT specimen of Heat 75. The rates for the 1/4–T CTspecimen of Heat 75 and 50% CW Type 316LN SS are somewhat higher. However, the K/sizecriteria were generally exceeded for these tests, i.e., the values of Kmax were higher than thoseallowed by Eqs. 13 or 14.
For the 50% CW Type 316LN SS, the CGR under constant load conditions in high–DOwater at 289°C is plotted in Fig. 12; the maximum stress intensity for the test was within theK/size–validity criteria. Data obtained earlier on 1–T CT specimens of several heats ofTypes 304 and 316 SS are also included in the figure. In ª250–ppb–DO water, the CGRs for a1/4–T CT specimen of 50% CW Type 316LN SS are higher than those for a 1–T CT specimen ofsensitized Type 304 SS. Rates for the 1/4–T specimen are comparable to those of sensitizedType 304 SS in very high–DO water (>6000 ppb DO).
10-12
10-11
10-10
10-9
10-8
0 10 20 30 40 50
304 SS Heat 30956 (Sensitized)304 SS Heat 10285 (Sensitized)316NG Heat P91576
50% CW 316LN Heat 18474
Exp
erim
enta
l CG
R (
m/s
)
Stress Intensity K (MPa·m1/2)
Austenitic SSsHigh DO Environment289°C
Open Symbols: ª250 ppb DOClosed Symbols: ≥6000 ppb DO
NUREG-0313
1-T CT Specimen
1/4-T CT Specimen
Figure 12.Stress corrosion cracking data for austeniticstainless steels in high–DO water at 289°C.

15
3. Results
3.1 Fracture Toughness
3.1.1 Nonirradiated Type 304 Stainless Steel
The fracture toughness J–R curves for nonirradiated specimens of Heats L2, L20, C16,and C19, obtained in air by the DC potential and elastic unloading compliance methods, areshown in Figs. 13–16; experimental data for the tests are given in the Appendix. Duplicatetests were conducted for Heats L2 and C16. The results indicate that the fracture toughness ofthe laboratory Heats L2 and L20 is very low. The J–R curves are significantly lower than thosetypically observed for Type 304 SSs, Fig. 17.15,38–41 For wrought austenitic SSs,3 the JIcvalues at temperatures up to 550°C are typically >400 kJ/m2; experimental JIc for Heats L2and L20 is in the range of 150–230 and 80–120 kJ/m2, respectively. The commercial HeatsC16 and C19 show the very high fracture toughnesses expected for Type 304 SSs. For bothsteels, the J–R curve could not be obtained; the experimental curve is composed only of theblunting line. Fracture toughness JIc is >830 kJ/m2 for C19, and it could not be determinedfor Heat C16.
0
100
200
300
400
500
600
700
800
0 0.5 1 1.5 2 2.5 3 3.5
Def
orm
atio
n J
(kJ/
m2 )
Crack Extension (mm)
J = 243Da0.27
JIC = 186 kJ/m2
288°CDC Potential
Specimen L2-CNonirradiated
0
100
200
300
400
500
600
700
800
0 0.5 1 1.5 2 2.5 3 3.5
Def
orm
atio
n J
(kJ/
m2 )
Crack Extension (mm)
J = 283Da0.20
JIC = 237 kJ/m2
Closed Symbol: Measured Crack
288°CUnloading Compliance
Specimen L2-CNonirradiated
0
100
200
300
400
500
600
700
800
0 0.5 1 1.5 2 2.5 3 3.5
Def
orm
atio
n J
(kJ/
m2 )
Crack Extension (mm)
J = 268Da0.49
JIC = 159 kJ/m2
288°CDC Potential
Specimen L2-ENonirradiated
0
100
200
300
400
500
600
700
800
0 0.5 1 1.5 2 2.5 3 3.5
Def
orm
atio
n J
(kJ/
m2 )
Crack Extension (mm)
J = 275Da0.54
JIC = 154 kJ/m2Closed Symbol: Measured Crack
288°CUnloading Compliance
Specimen L2-ENonirradiated
Figure 13. Fracture toughness J–R curve obtained by DC potential and unloading compliance methodsfor nonirradiated specimens L2–C and L2–E of Heat L2 of Type 304 SS at 288°C.

16
0
100
200
300
400
500
600
700
800
0 0.5 1 1.5 2 2.5 3 3.5
Def
orm
atio
n J
(kJ/
m2 )
Crack Extension (mm)
J = 174Da 0.60
JIC = 78 kJ/m2
288°CDC Potential
Specimen L20-DNonirradiated
0
100
200
300
400
500
600
700
800
0 0.5 1 1.5 2 2.5 3 3.5
Def
orm
atio
n J
(kJ/
m2 )
Crack Extension (mm)
J = 236Da0.56
JIC = 119 kJ/m2
Closed Symbol: Measured Crack
288°CUnloading Compliance
Specimen L20-DNonirradiated
Figure 14. Fracture toughness J–R curve obtained by DC potential and unloading compliance methodsfor nonirradiated specimen L20–D of Heat L20 of Type 304 SS at 288°C.
0
200
400
600
800
1000
0 0.5 1 1.5 2 2.5 3 3.5
Def
orm
atio
n J
(kJ/
m2 )
Crack Extension (mm)
288°CDC PotentialSpecimen C16-CNonirradiated
0
200
400
600
800
1000
0 0.5 1 1.5 2 2.5 3 3.5
Def
orm
atio
n J
(kJ/
m2 )
Crack Extension (mm)
288°CUnloading Compliance
Specimen C16-CNonirradiated
0
200
400
600
800
1000
0 0.5 1 1.5 2 2.5 3 3.5
Def
orm
atio
n J
(kJ/
m2 )
Crack Extension (mm)
288°CDC PotentialSpecimen C16-DNonirradiated
0
200
400
600
800
1000
0 0.5 1 1.5 2 2.5 3 3.5
Def
orm
atio
n J
(kJ/
m2 )
Crack Extension (mm)
288°CUnloading Compliance
Specimen C16-DNonirradiated
Figure 15. Fracture toughness J–R curve obtained by DC potential and unloading compliance methodsfor nonirradiated specimens C16–C and C16–D of Heat C16 of Type 316 SS at 288°C.

17
0
200
400
600
800
1000
0 0.5 1 1.5 2 2.5 3 3.5
Def
orm
atio
n J
(kJ/
m2 )
Crack Extension (mm)
JIC = 835 kJ/m2
288°CDC PotentialSpecimen C19-DNonirradiated
0
200
400
600
800
1000
0 0.5 1 1.5 2 2.5 3 3.5
Def
orm
atio
n J
(kJ/
m2 )
Crack Extension (mm)
288°CUnloading Compliance
Specimen C19-DNonirradiated
Figure 16. Fracture toughness J–R curve obtained by DC potential and unloading compliance methodsfor nonirradiated specimen C19–D of Heat C19 of Type 304 SS at 288°C.
0
500
1000
1500
2000
0 1 2 3 4 5
PipePlate
Def
orm
atio
n J
(kJ/
m2 )
Crack Extension (mm)
Type 304 SS288°C
Figure 17.Fracture toughness J–R curves fornonirradiated Type 304 stainless steels at288°C.
The differences between the fracture toughness of laboratory and commercial heats arereflected in their fracture behavior. Photomicrographs of the fracture surface of brokennonirradiated specimens of laboratory Heats L2 and L20 and commercial Heat C19 are shownin Figs. 18 and 19, respectively. Heat L2 contains relatively high S and P contents and manyclusters of MnS inclusions. Failure occurs primarily via grain–boundary separation, which is
(a) (b)
Figure 18. Photomicrographs of fracture surfaces of nonirradiated specimens of Heats (a) L2 and(b) L20 tested at 288°C.

18
accompanied by some plastic deformation and decohesion along the MnS clusters (Fig. 20).Heat L20 exhibits a dimple fracture; failure occurs by nucleation and growth of microvoids andrupture of remaining ligaments. Heat L20 contains relatively high oxygen and many oxideparticle inclusions. In Fig. 18b, nearly every dimple appears to have been initiated bydecohesion of an oxide inclusion. An identical fracture behavior was observed for Heat L20irradiated to 0.9 x 10²¹ n◊cm–2 (1.35 dpa). In contrast, commercial heats exhibit ductile failurewith some dimple fracture, as shown for Heat C19 in Fig. 19.
Figure 19.Photomicrograph of fracture surface ofnonirradiated specimen of Heat C19 tested at288°C.
Figure 20.Photomicrograph of MnS inclusions on thefracture surface of nonirradiated specimen ofHeat L2 tested at 288°C.
3.1.2 Irradiated Type 304 Stainless Steels
Fracture toughness J–R curve tests were conducted at 288°C on Heats C19, L20, and L2of Type 304 SS and Heat C16 of Type 316 SS irradiated to 2.0 x 10²¹ n◊cm–2 (E > 1 MeV)(3.0 dpa). The J–R curves for the various steels are shown in Figs. 21–24; experimental datafor the tests are given in the Appendix. For specimen C19–C, the J–R curve could not bedetermined from the DC potential method because of broken potential leads. Note that therather flat J–R curve determined for specimen C19–A most likely is due to the small specimensize used in these tests; the maximum allowed J values were exceeded for the test.
Neutron irradiation at 288°C decreases the fracture toughness of all steels. In general,fracture toughness of the commercial Heats C16 and C19 is superior to that of the laboratoryHeats L20 and L2. These differences arise primarily from differences in toughness of thenonirradiated steels, i.e., the fracture toughness of the laboratory heats is significantly lowerthan that of the commercial heats. The fracture toughness J–R curves for irradiated Types 304and 316 SS are comparable.

19
0
100
200
300
400
500
600
700
800
0 0.5 1 1.5 2 2.5 3 3.5
Def
orm
atio
n J
(kJ/
m2 )
Crack Extension (mm)
J = 579Da0.17
JIC = 507 kJ/m2
288°CDC Potential
Specimen C19-A
0.3 x 10²¹ n cm–2
0
100
200
300
400
500
600
700
800
0 0.5 1 1.5 2 2.5 3 3.5
Def
orm
atio
n J
(kJ/
m2 )
Crack Extension (mm)
J = 661Da0.15
JIC = 599 kJ/m2
Closed Symbol: Measured Crack
288°CUnloading Compliance
Specimen C19-A
0.3 x 10²¹ n cm–2
(a)
0
100
200
300
400
500
600
700
800
0 0.5 1 1.5 2 2.5 3 3.5
Def
orm
atio
n J
(kJ/
m2 )
Crack Extension (mm)
J = 442Da 0.32
JIC = 313 kJ/m2
288°CDC Potential
Specimen C19-B
0.9 x 10²¹ n cm-2
0
100
200
300
400
500
600
700
800
0 0.5 1 1.5 2 2.5 3 3.5
Def
orm
atio
n J
(kJ/
m2 )
Crack Extension (mm)
J = 513Da 0.33
JIC = 368 kJ/m2
Closed Symbol: Measured Crack
288°CUnloading Compliance
Specimen C19-B
0.9 x 10²¹ n cm-2
(b)
Specimen C19–C – DC Potential methodData not obtained
0
100
200
300
400
500
600
700
800
0 0.5 1 1.5 2 2.5 3 3.5
Def
orm
atio
n J
(kJ/
m2 )
Crack Extension (mm)
J = 268Da0.28
JIC = 188 kJ/m2Closed Symbol: Measured Crack
288°CUnloading Compliance
Specimen C19-C
2.0 x 10²¹ n cm-2
(c)Figure 21. Fracture toughness J–R curve obtained by DC potential and unloading compliance methods
at 288°C for Heat C19 of Type 304 SS irradiated to a fluence level of (a) 0.3, (b) 0.9, and(c) 2.0 x 10²¹ n/cm2.

20
0
100
200
300
400
500
600
700
800
0 0.5 1 1.5 2 2.5 3 3.5
Def
orm
atio
n J
(kJ/
m2 )
Crack Extension (mm)
Specimen C16-A
0.9 x 10²¹ n cm-2
J = 491D a0.45
JIC = 315 kJ/m2
288°CDC Potential
0
100
200
300
400
500
600
700
800
0 0.5 1 1.5 2 2.5 3 3.5
Def
orm
atio
n J
(kJ/
m2 )
Crack Extension (mm)
Specimen C16-A
0.9 x 10²¹ n cm-2
J = 607Da0.52
JIC = 378 kJ/m2
Closed Symbol: Measured Crack
288°CUnloading Compliance
Figure 22. Fracture toughness J–R curve obtained by DC potential and unloading compliance methodsat 288°C for Heat C16 of Type 316 SS irradiated to a fluence level of 0.9 x 10²¹ n/cm2.
0
50
100
150
200
0 0.5 1 1.5 2 2.5 3 3.5
Def
orm
atio
n J
(kJ/
m2 )
Crack Extension (mm)
Specimen L20-A
0.3 x 10²¹ n cm-2
J = 100Da0.34
JIC = 62 kJ/m2
Closed Symbol: Measured Crack
288°CUnloading Compliance
0
50
100
150
200
0 0.5 1 1.5 2 2.5 3 3.5
Def
orm
atio
n J
(kJ/
m2 )
Crack Extension (mm)
Specimen L20-A
0.3 x 10²¹ n cm-2
J = 104Da 0.36
JIC = 62 kJ/m2
288°CDC Potential
(a)
0
50
100
150
200
0 0.5 1 1.5 2 2.5 3 3.5
Def
orm
atio
n J
(kJ/
m2 )
Crack Extension (mm)
Specimen L20-B
0.9 x 10²¹ n cm-2
J = 55 Da0.22
JIC = 39 kJ/m2
288°CDC Potential
0
50
100
150
200
0 0.5 1 1.5 2 2.5 3 3.5
Def
orm
atio
n J
(kJ/
m2 )
Crack Extension (mm)
Specimen L20-B
0.9 x 10²¹ n cm-2
J = 45Da0.12
JIC = 37 kJ/m2
Closed Symbol: Measured Crack
288°CUnloading Compliance
(b)Figure 23. Fracture toughness J–R curve obtained by DC potential and unloading compliance methods
at 288°C for Heat L20 of Type 304 SS irradiated to a fluence level of (a) 0.3 and(b) 0.9 x 10²¹ n/cm2.

21
0
50
100
150
200
0 0.5 1 1.5 2 2.5 3 3.5
Def
orm
atio
n J
(kJ/
m2 )
Crack Extension (mm)
Specimen L2-A
0.9 x 10²¹ n cm-2
J = 52 Da0.22
JIC = 38 kJ/m2
288°CDC Potential
0
50
100
150
200
0 0.5 1 1.5 2 2.5 3 3.5
Def
orm
atio
n J
(kJ/
m2 )
Crack Extension (mm)
Specimen L2-A
0.9 x 10²¹ n cm-2
J = 51Da0.24
JIC = 35 kJ/m2
Closed Symbol: Measured Crack
288°CUnloading Compliance
Figure 24. Fracture toughness J–R curve obtained by DC potential and unloading compliance methodsat 288°C for Heat L2 of Type 304 SS irradiated to a fluence level of 0.9 x 10²¹ n/cm2.
The experimental JIc values for the two commercial heats of austenitic SSs are plotted asa function of neutron exposure in Fig. 25. Results from tests on Type 304 SS reactor internalmaterials from operating BWRs2 are also included in the figure. All CT specimen data fromcommercial heats fall within the scatter band for the data obtained at temperatures higherthan 288°C.
0
100
200
300
400
500
600
0 5 10 15 20 25
C19C16
Bend BarCT SpecimenShort Rod
CT Specimen
J Ic
(kJ/
m2)
Neutron Exposure (dpa)
Types 304 SSIrradiation Temp: 288°CTest Temp: 288°C
ANL Heats
JAPEIC Data
GE Data
835 kJ/cm2
Figure 25.Fracture toughness JIc of austenitic stainlesssteels as a function of neutron exposure at288°C. Dashed lines represent upper andlower bounds for change in JIc for austeniticSSs irradiated at 350–450°C. JAPEIC = Japan Power Engineering andInspection Corporation, GE = General ElectricNuclear Energy
3.2 Crack Growth Tests on Irradiated Stainless Steels in BWR Environments
Crack growth tests have been completed at 289°C on 1/4–T CT specimens of Type 304 SS(Heat C3) irradiated to 0.3, 0.9, and 2.0 x 10²¹ n/cm2 and Type 316 SS (Heat C16) irradiatedto 2.0 x 10²¹ n/cm2. The significant results for the various tests are summarized below.

22
3.2.1 Specimen C3-B Irradiated to 0.9 x 10²¹ n/cm2
The environmental and loading conditions, experimental CGRs, allowed Kmax from K/sizecriterion in Eq. 13, and the deviation of applied Kmax from the allowed value are given inTable 3. Allowed Kmax was determined using effective yield stress in Eq. 13. Precracking wasinitiated at R = 0.2 and Kmax = 16 MPa m1/2. During most test periods, Kmax was maintainedapproximately constant by periodic load shedding.
Table 3. Crack growth results for Specimen C3–B of Type 304 SSa in high–purity water at 289°C
TestTest
Time,ECP
mV (SHE)bO2
Conc.,b LoadRise
Time,DownTime,
HoldTime, Kmax, DK,
GrowthRate,
Kmax fromEq. 13
Deviationin Kmax,
Period h Pt Steel ppb Ratio s s s MPa·m1/2MPa·m1/2 m/s MPa m1/2 %
1 28 230 154 300 0.20 0.5 0.5 0 19.14 15.31 6.83E-08 18.4 42 172 239 189 300 0.51 60 2 0 18.96 9.29 1.75E-10 18.3 33 287 233 187 300 0.70 300 2 0 19.79 5.94 6.38E-10 18.0 104 335 235 191 300 0.70 2 2 7200 20.10 0 1.06E-09 17.7 145 376 238 195 300 0.70 2 2 7200 22.07 0 1.04E-09 17.4 276 624 -475 –595 ª10 0.70 2 2 7200 22.27 0 4.02E-11 17.2 307 696 -482 –607 ª10 0.70 300 2 0 22.10 6.63 8.56E-11 17.1 298 935 -495 –614 ª10 0.70 2 2 3600 22.66 0 6.42E-12 17.1 329 1031 -499 –609 ª10 0.70 300 2 0 22.53 6.76 3.37E-11 17.1 32
10a 1127 -495 –613 ª10 0.70 1000 2 0 22.19 6.66 negligible 17.1 3010b 1271 -507 –620 ª10 0.70 1000 2 0 23.04 6.91 1.20E-11 17.1 3511 1295 -507 –624 ª10 0.70 30 2 0 22.87 6.86 5.17E-11 17.1 3412 1343 -498 –617 ª10 0.70 300 2 0 23.10 6.93 1.55E-11 17.1 3614 1608 248 151 250 0.70 1000 2 0 24.17 7.25 5.93E-10 16.7 4515 1655 244 155 250 0.70 2 2 3600 24.42 0 8.70E-10 16.4 49
a Heat C3, irradiated to 0.9 x 10²¹ n cm-2.bRepresents values in the effluent.
Conductivity was 0.07 and 0.3–0.45 mS/cm in feedwater and effluent, respectively. Feedwater pH at roomtemperature was 6.5.
The test was initiated in high–purity water with ª300 ppb DO. After ª375 h, the DO levelin the feedwater was decreased to ª10 ppb by sparging it with pure nitrogen. After 1380 h, theDO level was increased from ª10 to ª300 ppb by sparging the feedwater with nitrogen plus 1%oxygen gas mixture. Because of the very low flow rates for the recirculating water system ittook several days for the environmental conditions to stabilize. Changes in crack length andECP of Pt and SS electrodes during these transient periods are shown in Fig. 26. During thetransition periods, changes in the steel ECP were slower than those in the Pt ECP. Forexample, in Fig. 26a, although the Pt ECP decreased below –400 mV (SHE) within 40 h, it tookmore than 150 h for the steel ECP to decrease below –400 mV. Also, because of an unexpectedpower bump the test tripped after ª1390 h (during the second transition period); it wasrestarted at 1470 h. The ECPs of both electrodes were below –200 mV before the interruptionand above 100 mV after the test was restarted.
A photomicrograph of the fracture surface of both halves of the specimen is shown inFig. 27. The final crack length, determined from the photograph, showed very good agreementwith the value estimated from the DC potential measurements. Changes in crack length andKmax with time during various test periods are shown in Fig. 28a–e. In general, the DCpotential measurements show very little scatter, particularly for measured growth rates>5 x 10–11 m/s. Some fluctuations in DC potential measurements were observed when eitherthe autoclave temperature varied ±3°C (e.g., 170–260 h) or the DO level in the water was beingchanged (e.g., 450–530 h and 1370–1510 h).

23
7.30
7.35
7.40
7.45
7.50
7.55
7.60
-800
-600
-400
-200
0
200
400
350 400 450 500 550 600 650
Crack Length
Pt ECP
Steel ECP
Cra
ck L
engt
h (m
m)
EC
P [m
V (
SH
E)]
Time (h)
Type 304 SS (Heat C3)Test CGRI–07 (Spec. C3-B)
Fluence 0.9 x 10²¹ n/cm2
289°CHigh–Purity Water
DO <30 ppbCGR= 4.02 x 10⁻¹¹ m/s
Kmax
= 22.3 MPa m0.5
R = 1.0
(a)
7.50
7.55
7.60
7.65
7.70
7.75
7.80
-800
-600
-400
-200
0
200
400
1350 1400 1450 1500 1550 1600
Crack Length
Pt ECP
Steel ECP
Cra
ck L
engt
h (m
m)
EC
P [m
V (
SH
E)]
Time (h)
Type 304 SS (Heat C3)Test CGRI–07 (Spec. C3-B)
Fluence 0.9 x 10²¹ n/cm2
289°CHigh–Purity Water
DO changed from ª10 to 250 ppb
(b)Figure 26. Changes in crack length and ECP after the dissolved oxygen level in the feedwater was
(a) decreased from ª500 to 10 ppb and (b) increased from ª10 to 300 ppb
Figure 27. Photomicrographs of the fracture surface of specimen C3–Btested in high–purity water at 289°C

24
6.6
6.8
7.0
7.2
7.4
15
20
25
30
35
100 150 200 250 300 350 400
Cra
ck L
engt
h (m
m)
Km
ax (
MP
a m
0.5 )
Time (h)
Type 304 SS (Heat C3)Test CGRI–07 (Spec. C3-B)
Fluence 0.9 x 10²¹ n/cm2
289°CHigh–Purity Water
CGR = 1.75 x 10⁻¹⁰ m/s
Kmax
= 19.0 MPa m0.5
R = 0.5, Rise Time 60 s
KmaxCrack Length
DO ª250 ppbSteel ECP 190 mV (SHE)
DO <30 ppb
1.06 x 10 –9 m/s
20.1 MPa m0.5
R = 1.0
1.04 x 10 –9 m/s
22.1 MPa m0.5
R = 1.0
CGR = 6.38 x 10⁻¹⁰ m/s
Kmax
= 19.8 MPa m0.5
R = 0.7, Rise Time 300 s
Constant LoadUnload to R = 0.7 every 2 h
(a)
7.40
7.45
7.50
7.55
7.60
15
20
25
30
35
480 520 560 600
Cra
ck L
engt
h (m
m)
Km
ax (
MP
a m
0.5 )
Time (h)
Type 304 SS (Heat C3)Test CGRI–07 (Spec. C3-B)
Fluence 0.9 x 10²¹ n/cm2
289°CHigh–Purity Water, DO <30 ppb
Steel ECP –300 to –600 mV (SHE)
KmaxCrack Length
CGR = 4.02 x 10⁻¹¹ m/s
Kmax
= 22.3 MPa m0.5
R = 1.0
(b)
7.45
7.50
7.55
7.60
15
20
25
30
35
600 650 700 750 800 850 900 950
Cra
ck L
engt
h (m
m)
Km
ax (
MP
a m
0.5 )
Time (h)
Type 304 SS (Heat C3)Test CGRI–07 (Spec. C3-B)
Fluence 0.9 x 10²¹ n/cm2
289°CHigh–Purity Water, DO ª10 ppb
Steel ECP –610 mV (SHE)
Kmax
Crack Length
CGR = 8.56 x 10⁻¹¹ m/s
Kmax
= 22.1 MPa m0.5
CGR = 6.42 x 10⁻¹² m/s
Kmax
= 22.7 MPa m0.5
R = 1.0Constant LoadUnload to R = 0.7 every 1 or 2 hR = 0.7
Rise Time 300 s
(c)Figure 28. Crack–length–vs.–time plots for irradiated Type 304 SS (Heat C3) in high–purity water at
289°C during test periods (a) 2–5, (b) 6, (c) 7–8, (d) 9–12, and (e) 14–15

25
7.50
7.52
7.54
7.56
7.58
7.60
15
20
25
30
35
1000 1100 1200 1300 1400
Cra
ck L
engt
h (m
m)
Km
ax (
MP
a m
0.5 )
Time (h)
Type 304 SS (Heat C3)Test CGRI–07 (Spec. C3-B)
Fluence 0.9 x 10²¹ n/cm2
289°CHigh–Purity Water DO ª10 ppb
Steel ECP –610 mV (SHE)
KmaxCrack Length
3.37 x 10⁻¹¹ m/s
22.6 MPa m0.5
0.7, 300 s
1.55 x 10⁻¹¹ m/s
23.1 MPa m0.5
0.7, 300 s
5.17 x 10⁻¹¹ m/s
22.9 MPa m0.5
0.7, 30 sCGR = 1.20 x 10⁻¹¹ m/s
Kmax
= 23.1 MPa m0.5
R = 0.7, Rise Time = 1000 s
no growth
22.2 MPa m0.5
0.7, 1000 s
(d)
7.50
7.60
7.70
7.80
7.90
8.00
15
20
25
30
35
1500 1550 1600 1650
Cra
ck L
engt
h (m
m)
Km
ax (
MP
a m
0.5 )
Time (h)
Type 304 SS (Heat C3)Test CGRI–07 (Spec. C3-B)
Fluence 0.9 x 10²¹ n/cm2
289°CHigh–Purity Water DO ª250 ppb
Steel ECP 155 mV (SHE)
Kmax
Crack Length
8.70 x 10 –10 m/s
24.4 MPa m0.5
CGR = 5.93 x 10⁻¹¹ m/s
Kmax
= 24.2 MPa m0.5
Constant load Unload to R = 0.7 every 1 h
R = 0.7Rise Time = 1000 s
(e)Figure 28. (Cont’d.)
For this specimen, environmental enhancement occurred after ª170 h (Fig. 28a), whenthe load ratio and rise time, respectively, were changed from 0.5 and 60 s to 0.7 and 300 s.For the new loading condition, although the predicted CGR in air decreased by a factor of ª15(Eqs. 15–17), the measured rate in the environment increased by a factor of ª3. The resultsindicate the benefit of low–DO environment on growth rates; CGRs decreased by more than anorder of magnitude when the DO level was decreased to <10 ppb and increased when the DOlevel was raised back to ª300 ppb.
The results also suggest a possible effect of loading history on growth rates, e.g., duringtest periods 6 and 8, the CGRs under the same trapezoidal waveform were 4.0 x 10⁻¹¹ and6.4 x 10–12 m/s, respectively. The higher rate was observed following a long period of growthat a higher ECP under a trapezoidal waveform. The lower rate was observed following cyclingunder a sawtooth waveform with a 300–s rise time at low DO. It is possible that the cyclicloading changed the mode of fracture. The reason for such apparent differences in CGRsunder similar loading conditions will be investigated by metallographic evaluation of thefracture surfaces; if a transition in fracture mode is observed, additional precautions to avoidsuch transitions will be observed in future tests.

26
For specimen C3–B, during Test Periods 1–4 the experimental Kmax values were 4–14%higher than the allowable value based on the effective yield stress and 30–50% higher duringPeriods 5–15. For this specimen, loading conditions for all test periods would satisfy the K/sizecriterion of Eq. 13 if the actual yield stress instead of effective yield stress is used. Thecrack–length–vs.–time plots in Figs. 26a and 28a and b show that environmental factors stillstrongly influenced the CGR at these K levels. For example, the CGRs decreased by a factor ofª20 when the DO level was decreased from ª300 to 10 ppb. Thus in this case, it is not clearthat the violation of the K size criterion after Test Period 3 actually led to a significant loss ofspecimen constraint.
3.2.2 Specimen C3-C Irradiated to 2.0 x 10²¹ n/cm2
The environmental and loading conditions, experimental CGRs, allowed Kmax from K/sizecriterion in Eq. 13, and the deviation of applied Kmax from the allowed value are given inTable 4. Allowed Kmax was determined using effective yield stress. Precracking was carried outat R = 0.3 and Kmax = 17 MPa m1/2; the applied Kmax was maintained approximately constantduring individual test periods by periodic load shedding. The test was initiated in high–puritywater with ª300 ppb DO. After ª240 h, the DO level in the feedwater was decreased to ª10 ppbby sparging the feedwater tank first with pure nitrogen and then with nitrogen plus 5%hydrogen. The changes in crack length and ECP of Pt and SS electrodes during the transientperiod are shown in Fig. 29. As seen earlier for Specimen C3–B, it took several days for the DOlevel to decrease below 20 ppb, and changes in the steel ECP were slower than that in the PtECP. For example, the Pt ECP decreased to –450 mV (SHE) within a couple of days while thesteel ECP remained above –250 mV for a long time; it decreased below –400 mV only after thefeedwater tank was sparged with nitrogen plus 5% hydrogen gas mixture. The test wasterminated after 810 h because the range of valid Kmax was significantly exceeded.
Table 4. Crack growth results for Specimen C3–C of Type 304 SSa in high–purity water at 289°C
TestTest
Time,ECP
mV (SHE)bO2
Conc.,b LoadRise
Time,DownTime,
HoldTime, Kmax, DK,
GrowthRate,
Kmax fromEq. 13
Deviationin Kmax,
Period h Pt Steel ppb Ratio s s s MPa·m1/2 MPa·m1/2 m/s MPa m1/2 %
1 46 241 164 300 0.26 2 2 0 17.89 13.24 2.00E-08 22.4 -202 71 223 155 300 0.53 30 2 0 18.40 8.65 2.22E-09 22.1 -173 99 235 167 300 0.70 300 2 0 18.80 5.64 1.73E-09 21.8 -144 142 232 164 300 0.69 1000 2 0 19.21 5.96 1.25E-09 21.4 -105 191 233 164 300 0.70 2 2 3600 19.42 0 6.83E-10 21.1 -86 311 -450 7 100 0.70 2 2 3600 23.67 0 5.07E-10 20.5 167 560 -547 -294 10 0.70 2 2 3600 27.49 0 6.91E-10 19.1 448 706 -551 -502 10 0.70 2 2 3600 34.74 0 2.04E-09 16.4 1119 724 -557 -457 10 0.70 2 2 3600 36.96 0 3.70E-09 15.8 134
aHeat C3, irradiated to 2.0 x 10²¹ n/cm2.bRepresents values in the effluent.Conductivity was 0.07 and 0.3–0.45 mS/cm in feedwater and effluent, respectively. Feedwater pH at roomtemperature was 6.5.
A photomicrograph of the fracture surface of both halves of the specimen is shown inFig. 30. The final crack length was determined from the photograph of both halves of thefractured specimen. Several unbroken ligaments can be seen extending back from the finalcrack front. Because of these unbroken ligaments the crack lengths were determined from anaverage of 16 evenly spaced measurements. A total 17 measurements were made, the twonear–surface measurements were averaged, and the resultant value was averaged with theremaining 15 measurements. The actual crack extension was ª40% greater than the value

27
determined from the DC potential measurements. This difference is larger than is typicallyobserved in most of our CGR tests, and is most likely due to the presence of the unbrokenligaments. Crack extensions estimated from the DC potential method were scaledproportionately. The values given in Table 4 are the corrected values of Kmax and growth rate.
The changes in the (corrected) crack length and Kmax with time during various testperiods are shown in Figs. 31a–d. For this specimen, significant environmental enhancementoccurred after ª100 h (Fig. 31b) during continuous cycling at R = 0.7 when the rise time waschanged from 30 s to 300 s. For the new loading condition, although the predicted CGR in airdecreased by a factor of ª10, the rate in water did not change.
Figure 30. Photomicrographs of the fracture surface of Specimen C3–C
Figures 29 and 31c show that when the DO level was decreased from ª300 to 10 ppb, thesteel ECP decreased from ª240 to -255 mV (SHE), but the CGR did not decrease. For a similardecrease in DO, the CGR of specimen C3–B, irradiated to 0.9 x 10²¹ n/cm2, decreased by morethan an order of magnitude. For specimen C3–C, the CGR actually increased at ª570 h whenthe cover gas was changed from pure nitrogen to nitrogen plus 5% hydrogen and the steel ECPdecreased below –500 mV (Fig. 31d). However, during the whole time at low ECP, the specimenK/size criteria were exceeded. Thus the apparent absence of a beneficial effect of reduced DOcontent on growth rates thus may be a test artifact.
7.40
7.60
7.80
8.00
8.20
8.40
8.60
-800
-600
-400
-200
0
200
400
200 300 400 500 600
Crack Length
Pt ECPSteel ECPC
rack
Len
gth
(mm
)
EC
P [m
V (
SH
E)]
Time (h)
Type 304 SS (Heat C3)Test CGRI–08 (Spec. C3-C)
Fluence 2.0 x 10²¹ n/cm2
289°CHigh–Purity Water
Constant Loadperiodic unloading to R = 0.7 every 1 h
<80 ppb DO
<20 ppb DO
ª400 ppb DO
N2 + 5% H
2
Figure 29. Change in crack length and ECP of Pt and SS electrodes for Specimen C3–C after thedissolved oxygen level in the feedwater was decreased from ª300 to 10 ppb

28
6.00
6.20
6.40
6.60
6.80
7.00
5
10
15
20
25
30
20 30 40 50 60 70 80
Cra
ck L
engt
h (m
m)
Km
ax (
MP
a m
0.5 )
Time (h)
Type 304 SS (Heat C3)Test CGRI–08 (Spec. C3-C)
Fluence 2.0 x 10²¹ n/cm2
289°CHigh–Purity Water, DO ª300 ppb
Steel ECP 165 mV (SHE)
Kmax
Crack Length
CGR = 2.00 x 10⁻⁸ m/sKmax = 17.9 MPa m0.5
R = 0.26, Rise Time 2 s
CGR = 2.22 x 10⁻⁹ m/sKmax = 18.4 MPa m0.5
R = 0.53, Rise Time 30 s
(a)
6.80
6.90
7.00
7.10
7.20
7.30
7.40
5
10
15
20
25
30
80 100 120 140 160 180
Cra
ck L
engt
h (m
m)
Km
ax (
MP
a m
0.5 )
Time (h)
Type 304 SS (Heat C3)Test CGRI–08 (Spec. C3-C)
Fluence 2.0 x 10²¹ n/cm2
289°CHigh–Purity Water, DO ª300 ppb
Steel ECP 165 mV (SHE)
Kmax
Crack Length
CGR = 1.25 x 10⁻⁹ m/sKmax = 19.2 MPa m0.5
R = 0.69, Rise Time 1000 s
CGR = 1.73 x 10⁻⁹ m/sKmax = 18.8 MPa m0.5
R = 0.70, Rise Time 300 s
CGR = 6.83 x 10⁻¹⁰ m/sKmax = 19.4 MPa m0.5
Constant load, periodic unload to R = 0.7 every 1 h
(b)
7.20
7.40
7.60
7.80
8.00
8.20
20
25
30
35
40
45
200 240 280 320 360 400 440 480 520
Cra
ck L
engt
h (m
m)
Km
ax (
MP
a m
0.5 )
Time (h)
Type 304 SS (Heat C3)Test CGRI–08 (Spec. C3-C)
Fluence 2.0 x 10²¹ n/cm2
289°CConstant Load, periodic unloading
to R = 0.7 every 1 hKmax
Crack Length
CGR = 6.91 x 10⁻¹⁰ m/sKmax = 27.5 MPa m0.5
Steel ECP -294 mV (SHE)
5.07 x 10⁻¹⁰ m/s23.7 MPa m0.5
Steel ECP 165 – 10 mV (SHE)
ª400 ppb DOª80 ppb DO
ª20 ppb DO
(c)Figure 31. Crack–length–vs.–time plots for irradiated Type 304 SS (Heat C3) in high–purity water at
289°C during test periods (a) 1–2, (b) 3–5, (c) 6–7, and (d) 7–8
29
7.80
8.00
8.20
8.40
8.60
8.80
9.00
9.20
9.40
20
25
30
35
40
45
450 500 550 600 650 700
Cra
ck L
engt
h (m
m)
Km
ax (
MP
a m
0.5 )
Time (h)
Type 304 SS (Heat C3)Test CGRI–08 (Spec. C3-C)
Fluence 2.0 x 10²¹ n/cm2
289°CHigh–Purity Water ª10 ppb DO
Constant Load, periodic unloading to R = 0.7 every 1 h
Kmax
Crack Length
N2 + 5% H
2
Pure N2
CGR = 6.91 x 10⁻¹⁰ m/sKmax = 27.5 MPa m0.5
Steel ECP -254 mV (SHE)
CGR = 2.04 x 10⁻⁹ m/sKmax = 34.7 MPa m0.5
Steel ECP -502 mV (SHE)
(d)Figure 31. (Cont’d.)
3.2.3 Specimen C16-B Irradiated to 2.0 x 10²¹ n/cm2
The environmental and loading conditions, experimental CGRs, allowed Kmax from K/sizecriterion in Eq. 13, and the deviation of applied Kmax from the allowed value are given inTable 5. Allowed Kmax was determined using effective yield stress in Eq. 13. Precracking wasinitiated at R = 0.3 and Kmax = 14 MPa m1/2. After ª0.4 mm advance, R was increasedincrementally to 0.7, and rise time increased to 30 s. The maximum stress intensity factorKmax was maintained approximately constant by periodic load shedding. After ª265 h, the DOlevel in the feedwater was decreased from ª250 ppb to <30 ppb by sparging the feedwater tankinitially with pure nitrogen and then with nitrogen plus 5% hydrogen gas mixture. After 780 h,
Table 5. Crack growth results for Specimen C16–B of Type 316 SSa in high–purity water at 289°C
TestTest
Time,ECP b
mV (SHE)O2
Conc.,b LoadRise
Time,DownTime,
HoldTime, Kmax, DK,
GrowthRate,
Kmax fromEq. 13
Deviationin Kmax,
Period h Pt Steel ppb Ratio s s s MPa·m1/2 MPa·m1/2 m/s MPa m1/2 %
Pre a 6 – – 250 0.32 1 1 0 14.3 9.8 1.75E-08Pre b 30 232 144 250 0.30 2 2 0 14.0 9.8 7.54E-09Pre c 52 227 144 250 0.31 2 2 0 14.2 9.8 8.94E-09
1 94 224 148 250 0.56 12 2 0 14.6 6.4 4.94E-10 22.2 -352 132 226 147 250 0.73 30 2 0 14.8 4.0 8.65E-10 22.0 -333 173 228 151 250 0.71 300 2 0 15.0 4.4 8.16E-10 21.8 -314 198 224 153 250 0.70 1000 12 0 15.0 4.5 7.33E-10 21.7 -315 265 162 117 250 0.70 12 12 3600 15.2 0 4.62E-10 21.4 -296 410 -547 -298 <30 0.70 12 12 3600 15.2 0 1.90E-11 21.3 -287 504 -562 -410 <30 0.70 1000 12 0 15.2 4.54 2.76E-11 21.3 -298 527 -560 -449 <30 0.73 30 2 0 15.2 4.10 6.07E-11 21.3 -299 552 -557 -502 <30 0.70 30 2 0 17.3 5.18 2.51E-10 21.2 -18
10 600 -554 -545 <30 0.69 1000 12 0 17.2 5.34 3.59E-11 21.2 -1911 672 -557 -554 <30 0.70 12 12 3600 17.3 0 1.73E-11 21.1 -1812 792 -438 -597 <30 0.70 12 12 3600 19.7 0 4.11E-11 21.1 -713 866 219 139 250 0.70 12 12 3600 19.6 0 7.14E-10 21.0 -714 871 224 148 250 0.70 12 12 3600 21.9 0 1.10E-09 20.9 515 888 224 148 250 1.00c 0 0 – 21.9 – 5.27E-10 20.9 5
aHeat C16, irradiated to 2.0 x 10²¹ n/cm2.bRepresents values in the effluent. Effluent conductivity was ª0.45 mS/cm and DO was ª250 ppb during high–DO test
and <40 ppb during low–DO test. Feedwater conductivity was 0.07 mS/cm and pH at room temperature was 6.5.cConstant displacement test.

30
the DO level was increased back to ª250 ppb by sparging the feedwater with nitrogen plus 1%oxygen. Change in crack length and ECP of Pt and SS electrodes during the transient periodsare shown in Fig. 32. In both cases, it took more than 100 h for the changes to occur.
A photomicrograph of the fracture surface of both halves of the specimen is shown inFig. 33. The final crack length, determined from the photograph, showed very good agreementwith the value estimated from the DC potential measurement. Also, the results in Table 5indicate that for specimen C16–B, loading conditions for all test periods satisfied the K/sizecriterion of Eq. 13.
The changes in corrected crack length and Kmax with time during various test periods areshown in Figs. 34a–g. For this specimen, environmental enhancement occurred at ª150 h(Fig. 34b) during continuous cycling at R = 0.7 when the rise time was changed from 30 s to300 s. For the new loading condition, although the predicted CGR in air decreased by a factorof ª10, the rate in water did not change.
6.75
6.80
6.85
6.90
6.95
-800
-600
-400
-200
0
200
400
200 250 300 350 400
Crack Length
Pt ECPSteel ECP
Cra
ck L
engt
h (m
m)
EC
P [m
V (
SH
E)]
Time (h)
Type 316 SS (Heat C16)Test CGRI–09 (Spec. C16-B)
Fluence 2.0 x 10²¹ n/cm2
289°C, High–Purity WaterConstant Load. periodic
unloading to R = 0.7 every 1 h
Kmax
= 15.2 MPa m1/2
CGR = 1.90 x 10⁻¹¹ m/sSteel ECP -300 mV (SHE)
Kmax
= 15.2 MPa m1/2
CGR = 4.62 x 10⁻¹⁰ m/sSteel ECP 150 mV (SHE)
250 ppb DO
<40 ppb DO
(a)
6.96
6.98
7.00
7.02
7.04
7.06
7.08
-800
-600
-400
-200
0
200
400
650 700 750 800 850
Crack Length
Pt ECPSteel ECP
Cra
ck L
engt
h (m
m)
EC
P [m
V (
SH
E)]
Time (h)
Type 316 SS (Heat C16)Test CGRI–09 (Spec. C16-B)
Fluence 2.0 x 10²¹ n/cm2
289°C, High–Purity WaterConstant Load. periodic
unloading to R = 0.7 every 1 h
Kmax
= 19.6 MPa m1/2
CGR = 4.11 x 10⁻¹¹ m/sSteel ECP -590 mV (SHE)K
max = 17.3 MPa m1/2
CGR = 1.73 x 10⁻¹¹ m/sSteel ECP -550 mV (SHE)
Kmax
= 19.6 MPa m1/2
CGR = 7.14 x 10⁻¹⁰ m/sSteel ECP 139 mV (SHE)
(b)Figure 32. Change in crack length and ECP of Pt and SS electrodes when the DO level in feedwater
was (a) decreased from ª300 to <40 ppb and (b) increased from <40 to ª300 ppb.

31
Figure 33. Photomicrographs of the fracture surface of Specimen C16–B
6.00
6.10
6.20
6.30
6.40
6.50
10
12
14
16
18
20
0 20 40 60 80 100
Cra
ck L
engt
h (m
m)
Km
ax (
MP
a m
0.5 )
Time (h)
Type 304 SS (Heat C16)Test CGRI–09 (Spec. C16-B)
Fluence 2.0 x 10²¹ n/cm2
289°CHigh–Purity Water, DO ª250 ppb
Steel ECP 165 mV (SHE)
Kmax
Crack Length
CGR = 1.75 x 10⁻⁹ m/sKmax = 14.3 MPa m0.5
R = 0.32, Rise Time 2 s
5.15 x 10⁻¹⁰ m/s14.7 MPa m0.5
0.54, 12 s Rise8.94 x 10–9 m/s14.2 MPa m0.5
0.31, 2 s Rise
7.54 x 10⁻⁹ m/s14.0 MPa m0.5
0.30, 2 s Rise
(a)
6.40
6.45
6.50
6.55
6.60
6.65
6.70
10
12
14
16
18
20
100 120 140 160 180
Cra
ck L
engt
h (m
m)
Km
ax (
MP
a m
0.5 )
Time (h)
Type 304 SS (Heat C16)Test CGRI–09 (Spec. C16-B)
Fluence 2.0 x 10²¹ n/cm2
289°CHigh–Purity Water, DO ª250 ppb
Steel ECP 165 mV (SHE)
Kmax
Crack Length
CGR = 8.65 x 10⁻¹⁰ m/sKmax = 14.8 MPa m0.5
R = 0.73, Rise Time 30 s
CGR = 8.16 x 10⁻¹⁰ m/sKmax = 15.0 MPa m0.5
R = 0.71, Rise Time 300 s
(b)Figure 34. Crack–length–vs.–time plots for irradiated Type 316 SS (Heat C16) in high–purity water at
289°C during test periods (a) up to 1, (b) 2–3, (c) 4–5, (d) 6–7, (e) 8–10, (f) 11–12, and(g) 13–15.

32
6.60
6.65
6.70
6.75
6.80
6.85
6.90
6.95
7.00
10
12
14
16
18
20
180 200 220 240 260 280
Cra
ck L
engt
h (m
m)
Km
ax (
MP
a m
0.5 )
Time (h)
Type 304 SS (Heat C16)Test CGRI–09 (Spec. C16-B)
Fluence 2.0 x 10²¹ n/cm2
289°CHigh–Purity Water, DO ª250 ppb
Steel ECP 165 mV (SHE)
Kmax
Crack Length
CGR = 7.32 x 10⁻¹⁰ m/sKmax = 15.0 MPa m0.5
R = 0.70, Rise Time 1000 s
CGR = 4.62 x 10⁻¹⁰ m/sKmax = 15.2 MPa m0.5
Constant Load, periodic unloading to R = 0.7 every 1 h
DO decreased to <30 ppb
(c)
6.84
6.86
6.88
6.90
6.92
6.94
10
12
14
16
18
20
300 350 400 450 500
Cra
ck L
engt
h (m
m)
Km
ax (
MP
a m
0.5 )
Time (h)
Type 304 SS (Heat C16)Test CGRI–09 (Spec. C16-B)
Fluence 2.0 x 10²¹ n/cm2
289°CHigh–Purity Water, DO <40 ppb
Kmax
Crack Length
CGR = 2.76 x 10⁻¹¹ m/sKmax = 15.1 MPa m0.5
R = 0.70, Rise Time 1000 s
CGR = 1.90 x 10⁻¹¹ m/sKmax = 15.3 MPa m0.5
Constant Load, periodic unloading to R = 0.7 every 1 h
(d)
6.90
6.92
6.94
6.96
6.98
7.00
12
14
16
18
20
22
500 520 540 560 580 600
Cra
ck L
engt
h (m
m)
Km
ax (
MP
a m
0.5 )
Time (h)
Type 304 SS (Heat C16)Test CGRI–09 (Spec. C16-B)
Fluence 2.0 x 10²¹ n/cm2
289°CHigh–Purity Water, DO <40 ppb
Steel ECP -500 mV (SHE)
Kmax
Crack Length
CGR = 3.59 x 10⁻¹¹ m/sKmax = 17.2 MPa m0.5
R = 0.69, Rise Time 1000 sCGR = 2.51 x 10⁻¹⁰ m/sKmax = 17.3 MPa m0.5
R = 0.70, Rise Time 30 s
CGR = 6.07 x 10⁻¹¹ m/sKmax = 15.2 MPa m0.5
R = 0.73, Rise Time 30 s
(e)Figure 34. (Cont’d.)
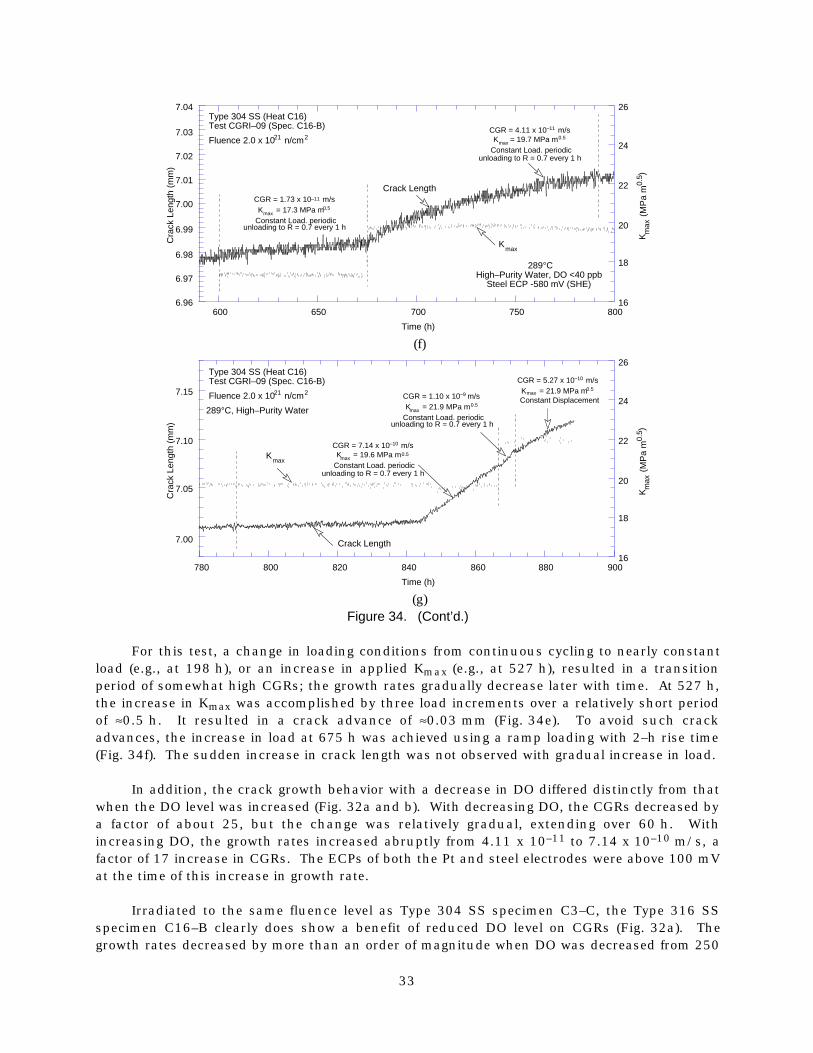
33
6.96
6.97
6.98
6.99
7.00
7.01
7.02
7.03
7.04
16
18
20
22
24
26
600 650 700 750 800
Cra
ck L
engt
h (m
m)
Km
ax (
MP
a m
0.5 )
Time (h)
Type 304 SS (Heat C16)Test CGRI–09 (Spec. C16-B)
Fluence 2.0 x 10²¹ n/cm2
289°CHigh–Purity Water, DO <40 ppb
Steel ECP -580 mV (SHE)
Kmax
Crack Length
CGR = 4.11 x 10⁻¹¹ m/sKmax = 19.7 MPa m0.5
Constant Load. periodicunloading to R = 0.7 every 1 h
CGR = 1.73 x 10⁻¹¹ m/sKmax = 17.3 MPa m0.5
Constant Load. periodicunloading to R = 0.7 every 1 h
(f)
7.00
7.05
7.10
7.15
16
18
20
22
24
26
780 800 820 840 860 880 900
Cra
ck L
engt
h (m
m)
Km
ax (
MP
a m
0.5 )
Time (h)
Type 304 SS (Heat C16)Test CGRI–09 (Spec. C16-B)
Fluence 2.0 x 10²¹ n/cm2
289°C, High–Purity Water
Kmax
Crack Length
CGR = 1.10 x 10⁻⁹ m/sKmax = 21.9 MPa m0.5
Constant Load. periodicunloading to R = 0.7 every 1 h
CGR = 7.14 x 10⁻¹⁰ m/sKmax = 19.6 MPa m0.5
Constant Load. periodicunloading to R = 0.7 every 1 h
CGR = 5.27 x 10⁻¹⁰ m/sKmax = 21.9 MPa m0.5
Constant Displacement
(g)Figure 34. (Cont’d.)
For this test, a change in loading conditions from continuous cycling to nearly constantload (e.g., at 198 h), or an increase in applied Kmax (e.g., at 527 h), resulted in a transitionperiod of somewhat high CGRs; the growth rates gradually decrease later with time. At 527 h,the increase in Kmax was accomplished by three load increments over a relatively short periodof ª0.5 h. It resulted in a crack advance of ª0.03 mm (Fig. 34e). To avoid such crackadvances, the increase in load at 675 h was achieved using a ramp loading with 2–h rise time(Fig. 34f). The sudden increase in crack length was not observed with gradual increase in load.
In addition, the crack growth behavior with a decrease in DO differed distinctly from thatwhen the DO level was increased (Fig. 32a and b). With decreasing DO, the CGRs decreased bya factor of about 25, but the change was relatively gradual, extending over 60 h. Withincreasing DO, the growth rates increased abruptly from 4.11 x 10⁻¹¹ to 7.14 x 10⁻¹⁰ m/s, afactor of 17 increase in CGRs. The ECPs of both the Pt and steel electrodes were above 100 mVat the time of this increase in growth rate.
Irradiated to the same fluence level as Type 304 SS specimen C3–C, the Type 316 SSspecimen C16–B clearly does show a benefit of reduced DO level on CGRs (Fig. 32a). Thegrowth rates decreased by more than an order of magnitude when DO was decreased from 250

34
to <30 ppb. Additional data will be obtained to establish the effect of decreased DO level on theCGRs of irradiated austenitic SSs from testing samples from the Halden II irradiation.
3.2.4 Specimen C3-A Irradiated to 0.3 x 10²¹ n/cm2
The environmental and loading conditions, experimental CGRs, allowed Kmax from K/sizecriterion in Eq. 13, and the deviation of applied Kmax from the allowed value are given inTable 6. For this specimen, because the ultimate–to–yield stress ratio was >1.3 (Table 2),effective flow stress instead of effective yield stress was used to determine the allowed Kmaxfrom Eq. 13. The test was started in a high–DO environment (ª300 ppb DO in effluent), andthe water flow rate was ª10 mL/min. The ECPs of Pt and SS electrodes in the effluent streamwere monitored continuously. Precracking was carried out at R = 0.3 and Kmax = 13–14 MPam1/2. After ª0.3 mm crack advance, R was increased incrementally to 0.7, and the waveformwas changed from triangular to saw-tooth with rise times of 12–500 s.
A photomicrograph of the fracture surface of both halves of the specimen is shown inFig. 35. The final crack length, determined from the photograph, showed very good agreementwith the value estimated from the DC potential measurement. Also, the results in Table 6indicate that for specimen C3–A, loading conditions for all test periods, except 11 and 12,satisfied the K/size criterion of Eq. 13.
The changes in crack length and Kmax with time during various test periods are shown inFigs. 36a–e. For this specimen, crack growth could not be maintained for loading conditionswith high values of R and relatively low Kmax. For example, at Kmax = 14 MPa m1/2 increasingR from 0.3 to 0.5 essentially stopped crack growth (Fig. 36a). Changing R back to the earliervalue did not restore crack growth; Kmax had to be increased to start crack growth. To promoteenvironmentally enhanced crack growth, the rise time for the cyclic loading at R = 0.3 wasincreased from 0.5 to 300 s before increasing R (Fig. 36b). For R = 0.7, crack growth occurredonly at Kmax greater than 17 MPa m1/2.
Table 6. Crack growth results for Specimen C3–A of Type 304 SSa in high–purity water at 289°C
TestTest
Time,ECP b
mV (SHE)O2
Conc.,b LoadRise
Time,DownTime,
HoldTime, Kmax, DK,
GrowthRate,
Kmax fromEq. 13
Deviationin Kmax,
Period h Pt Steel ppb Ratio s s s MPa·m1/2 MPa·m1/2 m/s MPa m1/2 %
Pre 55 226 167 300 0.31 0.5 0.5 0 12.9 8.9 2.94E-09 18.4 -301 165 212 166 300 0.30 0.5 0.5 0 14.0 9.8 8.37E-09 17.9 -22
2a 189 221 169 300 0.50 5 5 0 13.9 6.9 negligible 17.9 -232b 193 211 169 300 0.50 0.5 0.5 0 13.8 6.9 negligible 17.9 -232c 214 209 161 300 0.30 0.5 0.5 0 13.9 9.7 negligible 17.9 -232d 219 211 163 300 0.30 0.5 0.5 0 15.0 10.5 1.48E-08 17.7 -153 364 218 171 300 0.30 1 1 0 15.9 11.1 1.39E-08 17.5 -94 380 218 171 300 0.30 30 4 0 16.0 11.2 1.33E-09 17.4 -85 404 219 177 300 0.29 300 4 0 15.9 11.3 3.29E-10 17.4 -86 479 204 173 300 0.48 300 4 0 15.7 8.2 4.75E-11 17.4 -107 596 235 187 300 0.70 12 12 0 15.7 4.7 negligible 17.4 -108 670 228 188 300 0.70 12 12 0 17.6 5.3 6.23E-11 17.3 29 717 231 186 300 0.70 12 12 3600 17.8 – – 17.3 3
10 910 234 197 300 0.70 500 12 3600 17.9 – 8.65E-11 17.2 411 1080 232 200 300 0.70 500 12 3600 22.0 – 1.11E-10 17.1 2912 1175 226 203 300 0.70 500 1 9500 22.3 – 1.28E-10 17.0 31
aHeat C3, irradiated to 2.0 x 10²¹ n/cm2.bRepresents values in the effluent. Conductivity was 0.07 and 0.3–0.45 mS/cm in feedwater and effluent, respectively.Feedwater pH at room temperature was 6.5.

35
Figure 35. Photomicrographs of the fracture surface of Specimen C3–A
6.00
6.10
6.20
6.30
6.40
6.50
6.60
10
12
14
16
18
20
140 160 180 200 220 240
Cra
ck L
engt
h (m
m)
Km
ax (
MP
a m
0.5 )
Time (h)
Type 304 SS (Heat C3)Test CGRI–12 (Spec. C3-A)
Fluence 0.3 x 10²¹ n/cm2
289°CHigh–Purity Water, DO ª250 ppb
Steel ECP 170 mV (SHE)
Kmax
Crack Length
8.37 x 10⁻⁹ m/s14.0 MPa m0.5
0.3, 1 Hz 13.9 MPa m0.5
0.5, 0.1 Hz13.9 MPa m0.5
0.3, 1 Hz
13.8 MPa m0.5
0.5, 1 Hz
1.48 x 10⁻⁸ m/s15.0 MPa m0.5
0.3, 1 Hz
14.1 MPa m0.5
0.5, Rise time 12 s
(a)
6.40
6.45
6.50
6.55
6.60
6.65
6.70
6.75
6.80
10
12
14
16
18
20
280 300 320 340 360 380 400
Cra
ck L
engt
h (m
m)
Km
ax (
MP
a m
0.5 )
Time (h)
Type 304 SS (Heat C3)Test CGRI–12 (Spec. C3-A)
Fluence 0.3 x 10²¹ n/cm2
289°CHigh–Purity Water, DO ª300 ppb
Steel ECP 170 mV (SHE)
Kmax
Crack Length
1.39 x 10⁻⁸ m/s15.9 MPa m0.5
0.3, 0.5 Hz
1.33 x 10⁻⁹ m/s16.0 MPa m0.5
0.3, 30 s rise time
3.29 x 10⁻¹⁰ m/s15.9 MPa m0.5
0.3, 300 s rise time
(b)Figure 36. Crack–length–vs.–time plots for irradiated Type 316 SS (Heat C16) in high–purity water at
289°C during test periods (a) 1–2, (b) 3–5, (c) 6–7, (d) 8–10, and (e) 11–12.

36
6.60
6.65
6.70
6.75
6.80
6.85
6.90
10
12
14
16
18
20
400 450 500 550 600
Cra
ck L
engt
h (m
m)
Km
ax (
MP
a m
0.5 )
Time (h)
Type 304 SS (Heat C3)Test CGRI–12 (Spec. C3-A)
Fluence 0.3 x 10²¹ n/cm2
289°CHigh–Purity Water, DO ª300 ppb
Steel ECP 180 mV (SHE)
Kmax
Crack Length 4.75 x 10⁻¹¹ m/s15.7 MPa m0.5
0.48, 300 s rise time
negligible growth0.7, 12 s rise time
(c)
6.60
6.65
6.70
6.75
6.80
6.85
6.90
16
18
20
22
24
600 650 700 750 800 850 900
Cra
ck L
engt
h (m
m)
Km
ax (
MP
a m
0.5 )
Time (h)
Type 304 SS (Heat C3)Test CGRI–12 (Spec. C3-A)
Fluence 0.3 x 10²¹ n/cm2
289°CHigh–Purity Water, DO ª250 ppb
Steel ECP 210 mV (SHE)Kmax
Crack Length6.23 x 10–11 m/s17.6 MPa m0.5
0.70, 12 s rise time
CGR not determined17.9 MPa m0.5
0.70, 12 s rise time3600 s hold
8.65 x 10U-11 m/s
17.9 MPa m0.5
0.70, 500 s rise time3600 s hold
(d)
6.70
6.75
6.80
6.85
6.90
6.95
7.00
20
22
24
26
28
900 950 1000 1050 1100 1150 1200
Cra
ck L
engt
h (m
m)
Km
ax (
MP
a m
0.5 )
Time (h)
Type 304 SS (Heat C3)Test CGRI–12 (Spec. C3-A)
Fluence 0.3 x 10²¹ n/cm2
289°CHigh–Purity Water, DO ª250 ppb
Steel ECP 218 mV (SHE)Kmax
Crack Length
1.11 x 10U-10 m/s
22.0 MPa m0.5
0.70, 500 s rise time3600 s hold
1.13 x 10U-10 m/s
22.3 MPa m0.5
0.70, 500 s rise time9500 s hold
(e)Figure 36. (Cont’d)

37
Crack growth rates could not be measured during test period 9 because of significantvariations in the autoclave temperature, which resulted in large fluctuations in the DCpotential measurements (Fig. 36d). Also, during test period 11 (Fig. 36e), applied Kmaxgradually decreased from the desired value of 22 to 20.5 MPa m1/2 over a 50–h period becauseof faulty back–pressure regulator. Specimen C3–A irradiated to 0.3 x 10²¹ n/cm2 showed verylittle environmental enhancement of CGRs both under continuous cycling and SCC conditions.There was no change in CGR when the hold time was increased from 3600 to 9500 s (Fig. 36etest period 11 and 12).
3.2.5 CGRs of Irradiated Austenitic SSs under Continuous Cycling
For continuous cyclic loading, the experimental CGRs for irradiated austenitic SSs inhigh– and low–DO environments and those predicted in air for the same loading conditions areplotted in Fig. 37. The curves represent the Shack/Kassner model for nonirradiated austeniticSSs in high–purity water with either 8 or 0.2 ppm DO (Eqs. 18 and 19, respectively) and areincluded to provide a comparison with the irradiated CGR data. The CGRs in air aair (m/s)were determined from the correlations developed by James and Jones,36 e.g., Eqs. 15–17.
The results for SSs irradiated to 0.9 or 2.0 x 10²¹ n/cm2 (1.35 or 3.0 dpa) indicatesignificant enhancement of the CGRs in high–DO water under cyclic loading with long risetimes. The CGRs for Type 304 SS irradiated to either 0.9 or 2.0 x 10²¹ n◊cm–2, and Type 316SS irradiated to 2.0 x 10²¹ n◊cm–2 are comparable. For these irradiation conditions, the CGRsin water with ª 300 ppb DO are slightly higher than the rates predicted by the Shack/Kassnermodel for nonirradiated austenitic SSs in high–purity water with 8 ppm DO (Fig. 37a).
Type 304 SS irradiated to 0.3 x 10²¹ n/cm2 (0.45 dpa) shows very little environmentalenhancement of CGRs in high–DO water (open diamonds in Fig. 37a); the CGRs in water withª 300 ppb DO may be represented by the Shack/Kassner model for nonirradiated austeniticSSs in high–purity water with 0.2 ppm DO.
10-12
10-11
10-10
10-9
10-8
10-7
10-12 10-11 10-10 10-9 10-8 10-7
304 SS 0.3x10²¹ n/cm2
304 SS 0.9x10²¹ n/cm2
304 SS 2.0x10²¹ n/cm2
316 SS 2.0x10²¹ n/cm2
CG
Ren
v (m
/s)
CGRair (m/s)
Austenitic SSs, 289°Cª300 ppb Dissolved Oxygen
Shack/Kassner Model 0.2 ppm DO
CGRair
+4.5x10⁻⁵CGRair
0.5
1-h hold
Shack/Kassner Model 8 ppm DO
CGRair +1.5x10⁻⁴CGRair0.5
10-12
10-11
10-10
10-9
10-8
10-7
10-12 10-11 10-10 10-9 10-8 10-7
Heat C3 0.9x10²¹ n/cm2
Heat C16 2.0x10²¹ n/cm2
ª30 ppb dissolved H
CG
Ren
v (m
/s)
CGRair (m/s)
Austenitic SSs289°C<30 ppb Dissolved Oxygen
Shack/Kassner Model 0.2 ppm DO
CGRair
+4.5x10⁻⁵CGRair
0.5
(a) (b)Figure 37. CGR data for irradiated austenitic SSs under continuous cycling at 289°C in high–purity water
with (a) ª300 ppb and (b) <30 ppb dissolved oxygen.

38
For continuous cyclic loading, decreasing the DO level has a beneficial effect on CGRs,e.g., decreasing the DO from ª300 ppb DO to <30 ppb DO results in a factor of 25 decrease inthe CGR. The growth rates are slightly lower for the irradiated steels in water with <30 ppb DOthan for nonirradiated austenitic SSs in high–purity water with 0.2 ppm DO (Fig. 37b). TheCGR data in low–DO environment was not obtained for Type 304 SS specimen C3–C irradiatedto 2 x 10²¹ n/cm2. As discussed below, a benefit of reduced DO environment was not observedfor this specimen under SCC conditions.
3.2.6 CGRs of Irradiated Austenitic SSs under Cycling with Long Hold Periods
For CGR tests with a trapezoidal waveform (i.e., constant load with periodic partialunloading), the experimental CGRs for irradiated SSs in high– and low–DO water are plotted inFig. 38. In high–DO water, the CGRs obtained in the present study of Types 304 and 316 SSirradiated to either 0.9 or 2.0 x 10²¹ n/cm2 are a factor of ª5 higher than the disposition curvefor sensitized SSs in water with 8 ppm DO given in NUREG–0313.37 The growth rates for thetwo steels at the same fluence level, as well as those for Type 304 SS irradiated to 0.9 and2.0 x 1021 n/cm2 fluence levels, are comparable. In high–DO water, the CGRs for Type 304irradiated to 0.3 x 10²¹ n/cm2 are below the disposition curve for sensitized SSs in water with8 ppm DO given in NUREG–0313.
The results also indicate a benefit from a low–DO environment. For Heat C3 irradiated to0.9 x 1021 n/cm2 and Heat C16 irradiated to 2.0 x 10²¹ n/cm2 (circles and open diamonds inFig. 38), the CGRs decreased more than an order of magnitude when the DO level wasdecreased from ª300 to <30 ppb.
No benefit of low–DO environment was observed for Heat C3 irradiated to 2.0 x10²¹ n/cm2 (open and closed triangles in Fig. 38). However, the applied Kmax for the testperiod in low–DO water was 44% greater than the allowable value based on the K/size criterionin Eq. 13. Additional data will be obtained on Type 316 SS Heat C21 irradiated to 0.3, 0.9, and2.0 x 1021 n/cm2, to better establish the effect of decreased DO level on the CGRs of irradiatedaustenitic SSs.
10-12
10-11
10-10
10-9
10-8
10-7
5 10 15 20 25 30
304 SS 0.9x10²¹ n/cm2
304 SS 2.0x10²¹ n/cm2
316 SS 2.0x10²¹ n/cm2
304 SS 0.3x10²¹ n/cm2
Exp
erim
enta
l CG
R (
m/s
)
Stress Intensity K (MPa·m1/2)
289°C
Open Symbols: High–DOClosed Symbols: Low–DO
NUREG–0313Curve
5 x NUREG 0313
Curve
Figure 38.CGR data under constant load with periodicpartial unloads for irradiated austenitic SSs inhigh–purity water at 289°C

39
4. Summary
Fracture toughness J–R curve tests have been conducted on four heats of Type 304 SSthat were irradiated to fluence levels of ª0.3, 0.9, and 2.0 x 10²¹ n/cm2 (E > 1 MeV) (ª0.45,1.35, 3.00 dpa) at ª288°C in a helium environment in the Halden boiling heavy water reactor.The tests were performed on 1/4–T compact tension specimens in air at 288°C; crackextensions were determined by both DC potential and elastic unloading compliance techniques.
Neutron irradiation at 288°C to 2.0 x 10²¹ n/cm2 (E > 1 MeV) (3.0 dpa) decreased thefracture toughness of all of the steels. For these materials, minor differences in the chemicalcomposition of the steels, e.g., differences in nickel content for Heats C16 and C19 or siliconcontent for heats L2 and L20, have little or no effect on the fracture toughness of irradiatedsteels.
In general, fracture toughness of the commercial Heats C16 and C19 is superior to that ofthe laboratory Heats L20 and L2. These differences arise primarily from differences intoughness of the nonirradiated steels, i.e., the fracture toughness of the laboratory heats issignificantly lower than that of the commercial heats. The fracture toughness J–R curves forirradiated Types 304 and 316 SS are comparable. The data from commercial heats fall withinthe scatter band for the data obtained at higher temperatures. For Heat C19 of Type 304 SSirradiated to 0.3, 0.9, and 2.0 x 10²¹ n/cm2, the JIc values are 507, 313, and 188 kJ/m2,respectively.
Crack growth tests have been performed in simulated BWR environments at ª289°C onType 304 SS (Heat C3) irradiated to 0.3, 0.9, and 2.0 x 10²¹ n/cm2 and Type 316 SS (HeatC16) irradiated to 2.0 x 10²¹ n/cm2 at ª288°C in a helium environment. The tests wereconducted under cyclic loading with a slow/fast sawtooth waveform and long rise times or atrapezoidal waveform. The latter essentially represents constant load with periodic partialunloads.
The results for the steels irradiated to either 0.9 or 2.0 x 10²¹ n/cm2 indicate significantenhancement of CGRs in the NWC BWR environment. For these irradiation conditions, theCGRs under continuous cycling are slightly higher than the rates predicted by theShack/Kassner model for nonirradiated austenitic SSs in high–purity water with 8 ppm DO.The CGRs under SCC conditions are a factor of ª5 higher than the disposition curve proposedin NUREG–0313 for sensitized austenitic SSs. The CGRs of Type 304 SS irradiated to 0.9 and2.0 x 1021 n/cm2 and of Types 304 and 316 SS irradiated to 2.0 x 10²¹ n/cm2 are comparable.
In low–DO BWR environments, the CGRs of the irradiated steels decreased by an order ofmagnitude in tests where K values clearly met the validity criteria, e.g., Heat C3 of Type 304 SSirradiated to 0.9 x 10²¹ n/cm2 and Heat C16 of Type 316 SS irradiated to 2 x 10²¹ n/cm2. Thebeneficial effect of decreased DO was not observed for Heat C3 of Type 304 SS irradiated to2 x 1021 n/cm2; it is possible that this different behavior is associated with the loss ofconstraint in the specimen due to the high K.
Type 304 SS irradiated to 0.3 x 10²¹ n/cm2 (0.45 dpa) shows very little environmentalenhancement of CGRs in the NWC BWR environment; under continuous cycling, the CGRs arecomparable to those predicted by the Shack/Kassner model for nonirradiated austenitic SSs in

40
high–purity water with 0.2 ppm DO. The CGRs for Type 304 irradiated to 0.3 x 10²¹ n/cm2
under SCC conditions are below the disposition curve for sensitized SSs in water with 8 ppmDO given in NUREG–0313.

41
References
1. S. M. Bruemmer et al., “Critical Issue Reviews for the Understanding and Evaluation ofIrradiation–Assisted Stress Corrosion Cracking,” EPRI TR–107159, Electric PowerResearch Institute, Palo Alto, CA (1996).
2. M. L. Herrera, et al., “Evaluation of the Effects of Irradiation on the Fracture Toughness ofBWR Internal Components,” in Proc. ASME/JSME 4th Intl. Conf. on Nucl. Eng.(ICONE–4) Vol. 5, A. S. Rao, R. M. Duffey, and D. Elias, eds., American Society ofMechanical Engineers, New York, pp. 245–251 (1996).
3. W. J. Mills, “Fracture Toughness of Type 304 and 316 Stainless Steels and their Welds,”Intl. Mater. Rev. 42, 45–82 (1997).
4. H. Kanasaki, I. Satoh, M. Koyama, T. Okubo, T. R. Mager, and R. G. Lott, “Fatigue andStress Corrosion Cracking Behaviors of Irradiated Stainless Steels in PWR PrimaryWater,” Proc. 5th Intl. Conf. On Nuclear Engineering, ICONE5-2372, pp. 1–7 (1997).
5. P. L. Andresen, F. P. Ford, S. M. Murphy, and J. M. Perks, “State of Knowledge ofRadiation Effects on Environmental Cracking in Light Water Reactor Core Materials,”Proc. 4th Intl. Symp. on Environmental Degradation of Materials in Nuclear PowerSystems – Water Reactors, NACE, pp. 1.83–1.121 (1990).
6. A. Jenssen and L. G. Ljungberg, “Irradiation Assisted Stress Corrosion Cracking ofStainless Alloys in BWR Normal Water Chemistry and Hydrogen Water Chemistry,” Proc.Sixth Intl. Symp. on Environmental Degradation of Materials in Nuclear Power Systems –Water Reactor, R. E. Gold and E. P. Simonen, eds., Minerals, Metals & Materials Society,547–553 (1993).
7. P. J. Maziasz and C. J. McHargue, “Microstructural Evolution in Annealed AusteniticSteels during Neutron Irradiation,” Int. Met. Rev. 32, 190 (1987).
8. P. J. Maziasz, “Overview of Microstructural Evolution in Neutron–Irradiated AusteniticStainless Steels,” J. Nucl. Mater. 205, 118–145 (1993).
9. F. A. Garner, “Evolution of Microstructures in Face–Centered Cubic Metals duringNeutron Irradiation,” J. Nucl. Mater. 205, 98–111 (1993).
10. J. Dufresne, B. Henry, and H. Larsson, “Fracture Toughness of Irradiated AISI 304 and316L Stainless Steels,” in Effects of Radiation on Structural Materials, ASTM STP 683,J. A. Sprague and D. Kramer, eds., American Society for Testing and Materials,Philadelphia, pp. 511–528 (1979).
11. C. Picker, A. L. Stott, and H. Cocks, “Effects of Low–Dose Fast Neutron Irradiation on theFracture Toughness of Type 316 Stainless Steel and Weld Metal,” in Proc. SpecialistsMeeting on Mechanical Properties of Fast Reactor Structural Materials, Chester, UK,Paper IWGFR 49/440–4 (1983).

42
12. F. H. Huang, “The Fracture Characterization of Highly Irradiated Type 316 StainlessSteel,” Int. J. Fracture 25, 181–193 (1984).
13. J. Bernard and G. Verzeletti, “Elasto–Plastic Fracture Mechanics Characterization ofType 316H Irradiated Stainless Steel up to 1 dpa,” in Effects of Radiation on Materials:12th Intl. Symp., ASTM STP 870, F. A. Garner and J. S. Perrin, eds., American Society forTesting and Materials, Philadelphia, pp. 619–641 (1985).
14. W. J. Mills, L. A. James, and L. D. Blackburn, 1985, “Results of Fracture Mechanics Testson PNC SU 304 Plate,” Westinghouse Hanford Report HEDL–7544, Hanford EngineeringDevelopment Laboratory, Richland, WA.
15. W. J. Mills, “Fracture Toughness of Irradiated Stainless Steel Alloys,” Nucl. Technol. 82,290–303 (1988).
16. D. J. Michel and R. A. Gray, “Effects of Irradiation on the Fracture Toughness of FBRStructural Materials,” J. Nucl. Mater. 148, 194–203 (1987).
17. P. Ould, P. Balladon, and Y. Meyzaud, Bull. Cercle Etud. Metaux 15, 31.1–31.12 (1988).
18. E. V. Van Osch, M. G. Horsten, and M. I. De Vries, “Fracture Toughness of PWRInternals,” ECN Contribution to CEC Contract on PWR Internals–Part 2(ETNU/CT/94/0136–F), ECN–I–97–010 (71747/NUC/EvO/mh/006274), NetherlandsEnergy Research Foundation ECN, Petten, the Netherlands (1997).
19. K. S. Brown and G. M. Gordon, “Effects of BWR Coolant Chemistry on the Propensity forIGSCC Initiation and Growth in Creviced Reactor Internals Components,” Proc. Third Intl.Symp. on Environmental Degradation of Materials in Nuclear Power Systems – WaterReactor, AIME, pp. 243–248 (1987).
20. G. M. Gordon and K. S. Brown, “Dependence of Creviced BWR Component IGSCCBehavior on Coolant Chemistry,” Proc. 4th Intl. Symp. on Environmental Degradation ofMaterials in Nuclear Power Systems – Water Reactor, Daniel Cubicciotti, ed., NACE,pp. 14.46–14.61 (1990).
21. F. Garzarolli, D. Alter, and P. Dewes, “Deformability of Austenitic Stainless Steels andNickel–Base Alloys in the Core of a Boiling and a Pressurized Water Reactor,” Proc. Intl.Symp. on Environmental Degradation of Materials in Nuclear Power Systems – WaterReactor, ANS, pp. 131–138 (1986).
22. M. Kodama et al., “IASCC Susceptibility of Austenitic Stainless Steels Irradiated to HighNeutron Fluence,” Proc. Sixth Intl. Symp. on Environmental Degradation of Materials inNuclear Power Systems – Water Reactor, R. E. Gold and E. P. Simonen, eds., Minerals,Metals & Materials Society, pp. 583–588 (1993).
23. M. Kodama et al., “Effects of Fluence and Dissolved Oxygen on IASCC in AusteniticStainless Steels,” Proc. Fifth Intl. Symp. on Environmental Degradation of Materials inNuclear Power Systems – Water Reactor, American Nuclear Society, pp. 948–954 (1991).

43
24. W. L. Clark and A. J. Jacobs, “Effect of Radiation Environment on SCC of AusteniticMaterials,” Proc. First Intl. Symp. on Environmental Degradation of Materials in NuclearPower Systems – Water Reactor, NACE, p. 451 (1983).
25. A. Jenssen and L. G. Ljungberg, “Irradiation Assisted Stress Corrosion Cracking ofStainless Alloys in BWR Normal Water Chemistry and Hydrogen Water Chemistry,” Proc.Sixth Intl. Symp. on Environmental Degradation of Materials in Nuclear Power Systems –Water Reactor, R. E. Gold and E. P. Simonen, eds., Minerals, Metals & Materials Society,pp. 547–553 (1993).
26. A. Jenssen and L. G. Ljungberg, “Irradiation Assisted Stress Corrosion Cracking. PostIrradiation CERT Tests of Stainless Steels in a BWR Test Loop,” Proc. Seventh Intl. Symp.on Environmental Degradation of Materials in Nuclear Power Systems – Water Reactor,G. Airey et al., eds., NACE, pp. 1043–1052 (1995).
27. H. M. Chung, W. E. Ruther, R. V. Strain, and W. J. Shack, “Irradiated–Assisted StressCorrosion Cracking of Model Austenitic Stainless Steel Alloys,” NUREG/CR–6687,ANL–00/21 (Oct. 2000).
28. H. M. Chung, R. V. Strain, and R. W. Clark, “Slow–Strain–Rate–Tensile Test of ModelAustenitic Stainless Steels Irradiated in the Halden Reactor,” in Environmentally AssistedCracking in Light Water Reactors Annual Report January–December 2001,NUREG/CR–4667, Vol. 32, ANL–02/33, pp. 19–28 (2003).
29. O. K. Chopra, E. E. Gruber, and W. J. Shack, “Fracture Toughness Characterization ofType 304 Stainless Steel Irradiated in the Halden Reactor,” Proc. of the 8th Intl. Conf. onNuclear Engineering, ICONE8–8301, ASME (2000).
30. E. E. Gruber and O. K. Chopra, “Fracture Toughness J–R Test of Austenitic StainlessSteels Irradiated in Halden Reactor,” in Environmentally Assisted Cracking in Light WaterReactors Semiannual Report January 1999–June 1999, NUREG/CR–4667, Vol. 28,ANL–00/7, pp. 27–35 (July 2000).
31. E. E. Gruber and O. K. Chopra, “Fracture Toughness J–R Test of Austenitic StainlessSteels Irradiated in Halden Reactor,” in Environmentally Assisted Cracking in Light WaterReactors Semiannual Report July 1999–December 1999, NUREG/CR–4667, Vol. 29,ANL–00/23, pp. 30–38 (Nov. 2000).
32. E. E. Gruber and O. K. Chopra, “Fracture Toughness J–R Test of Austenitic StainlessSteels Irradiated in Halden Reactor,” in Environmentally Assisted Cracking in Light WaterReactors Semiannual Report July 1998–December 1998, NUREG/CR–4667, Vol. 31,ANL–01/09, pp. 33–37 (April 2002).
33. E. E. Gruber and O. K. Chopra, “Fracture Toughness J–R Test of Austenitic StainlessSteels Irradiated in Halden Reactor,” in Environmentally Assisted Cracking in Light WaterReactors Semiannual Report July 1998–December 1998, NUREG/CR–4667, Vol. 27,ANL–99/11, pp. 39–45 (Oct. 1999).

44
34. P. L. Andresen, “Similarity of Cold Work and Radiation Hardening in Enhancing YieldStrength and SCC Growth of Stainless Steel in Hot Water,” Corrosion/02, Paper 02509,NACE (2002).
35. W. J. Shack and T. F. Kassner, “Review of Environmental Effects on Fatigue CrackGrowth of Austenitic Stainless Steels,” NUREG/CR–6176, ANL–94/1 (May 1994).
36. L. A. James and D. P. Jones, “Fatigue Crack Growth Correlation for Austenitic StainlessSteels in Air,” Proc. Conf. on Predictive Capabilities in Environmentally–AssistedCracking, PVP Vol. 99, R. Rungta, ed., American Society of Mechanical Engineers,New York, pp. 363–414 (1985).
37. W. S. Hazelton and W. H. Koo, “Technical Report on Material Selection and ProcessingGuidelines for BWR Coolant Pressure Boundary Piping, Final Report,” NUREG–0313,Rev. 2 (1988).
38. A. L. Hiser, “Fracture Toughness Characterization of Nuclear Piping Steels,”NUREG/CR–5118, MEA–2325, Materials Engineering Associates, Inc., Lanham, MD(1989).
39. G. M. Wilkowski et al., “Degraded Piping Program – Phase II, Semiannual Report,”NUREG/CR–4082, Vol. 2 (1985).
40. Mills, W. J., “Heat–to–Heat Variations in the Fracture Toughness of Austenitic StainlessSteels,” Eng. Fracture Mech. 30, 469–492 (1988).
41. M. G. Vassilaros, R. A. Hays, and J. P. Gudas, “Investigation of the Ductile FractureProperties of Type 304 Stainless Steel Plate, Welds, and 4–Inch Pipe,” in Proc. 12th WaterReactor Safety Information Meeting, NUREG/CP–0058, Vol. 4, U.S. Nuclear RegulatoryCommission, pp. 176–189 (1985).

45
Appendix

46

47
Table A-1. Test data for specimen Y4–03 of thermally aged CF–8M cast SS tested at 288°C
Test Number : JR–18 Test Temp. : 288°CMaterial Type : CF–8M Cast SS Heat Number : 4331Aging Temp. : 400°C Aging Time : 700 hIrradiation Temp. : – Fluence : –Thickness : 6.515 mm Net Thickness : 5.879 mmWidth : 12.005 mm Flow Stress : 410.5 MPaModulus E : 180 GPaInitial Crack : 7.43 mm Init. a/W : 0.62 (Measured)Final Crack : 8.90 mm Final a/W : 0.74 (Measured)Final Crack : 8.97 mm Final a/W : 0.75 (Compliance)
Load Deflection Unloading Compliance DC Potential MethodNo. (kN) (mm) J (kJ/m2) Da (mm) J (kJ/m2) Da (mm)
0 0.0885 0.0001 1.6352 0.309 34.5 0.103 32.9 0.0212 1.7575 0.398 48.6 0.016 45.6 0.0303 1.8598 0.490 63.3 -0.030 59.3 0.0394 1.9474 0.583 76.7 0.042 74.0 0.0475 2.0168 0.678 93.2 -0.001 89.5 0.0576 2.0747 0.774 110.1 -0.014 105.7 0.0677 2.1142 0.871 126.9 -0.013 120.7 0.1598 2.1325 0.971 144.1 -0.003 136.2 0.2119 2.1641 1.069 158.8 0.061 152.2 0.26210 2.1930 1.169 175.9 0.077 168.6 0.30911 2.1907 1.269 192.1 0.120 185.0 0.36512 2.1627 1.373 205.9 0.209 200.2 0.45113 2.1592 1.475 220.9 0.266 215.4 0.51714 2.1463 1.577 235.9 0.325 230.8 0.58415 2.1369 1.679 251.6 0.370 245.9 0.65216 2.1329 1.781 266.0 0.432 261.3 0.71217 2.1169 1.884 282.4 0.468 276.9 0.77118 2.0898 1.988 293.2 0.569 291.6 0.84119 2.0822 2.091 307.6 0.621 306.6 0.89720 2.0395 2.196 321.1 0.688 321.9 0.95621 1.9870 2.302 331.2 0.781 335.5 1.02722 1.9336 2.408 337.5 0.903 347.7 1.10423 1.8696 2.515 345.5 1.004 359.9 1.17424 1.8184 2.621 348.7 1.139 371.5 1.24325 1.7353 2.731 347.2 1.309 382.5 1.31626 1.6788 2.837 348.2 1.444 390.6 1.39927 1.6272 2.943 354.2 1.541 399.1 1.471
Power–Law Fit J = C(DDDDa)n
Unloading Compliance JIc : 258 kJ/m2 (15 Data)Coeff. C : 334 kJ/m2 Exponent n : 0.25 Fit Coeff. R : 0.907DC Potential Method JIc : 162 kJ/m2 (20 Data)Coeff. C : 324 kJ/m2 Exponent n : 0.57 Fit Coeff. R : 0.997

48
0.0
0.5
1.0
1.5
2.0
2.5
3.0
0 0.5 1 1.5 2 2.5 3 3.5
MeasuredCorrected
Load
(kN
)
Displacement (mm)
Test JR-18Specimen Y4-03288°CCF–8M (Heat 4331) Aged 700 h at 400°C
Load–LoadlineDisplacement
Figure A-1.1. Load-vs.-loadline displacement curve for specimen Y4–03of thermally aged CF–8M cast SS tested at 288°C
Figure A-1.2. Fracture surface of specimen Y4–03 tested at 288°C

49
Table A-2. Test data for specimen Y4–02 of thermally aged CF–8M cast SS tested at 288°C
Test Number : JR–10 Test Temp. : 288°CMaterial Type : CF–8M Cast SS Heat Number : 4331Aging Temp. : 400°C Aging Time : 700 hIrradiation Temp. : – Fluence : –Thickness : 6.515 mm Net Thickness : 5.857 mmWidth : 12.003 mm Flow Stress : 410.5 MPaModulus E : 180 GPaInitial Crack : 7.51 mm Init. a/W : 0.63 (Measured)Final Crack : 9.32 mm Final a/W : 0.78 (Measured)Final Crack : 9.79 mm Final a/W : 0.82 (Compliance)
Load Deflection Unloading Compliance DC Potential MethodNo. (kN) (mm) J (kJ/m2) Da (mm) J (kJ/m2) Da (mm)
0 0.0454 0.0001 1.3318 0.126 11.3 0.090 10.2 0.0062 1.5435 0.207 21.7 0.135 20.3 0.0123 1.8447 0.380 49.2 -0.127 45.7 0.0274 1.9550 0.471 61.3 0.015 60.3 0.0365 2.2615 0.846 129.8 -0.147 127.6 0.0766 2.3153 0.942 142.5 -0.003 146.1 0.0877 2.3602 1.039 158.0 0.075 165.0 0.0988 2.3776 1.139 174.3 0.158 183.5 0.1489 2.3923 1.240 190.4 0.245 201.3 0.20210 2.4221 1.338 207.1 0.313 218.4 0.25911 2.4132 1.440 224.0 0.395 236.7 0.31112 2.4189 1.537 242.1 0.441 253.7 0.36713 2.4221 1.638 263.4 0.454 270.7 0.43314 2.3963 1.741 284.2 0.479 287.4 0.50215 2.3313 1.846 304.8 0.504 303.1 0.58116 2.2815 1.951 325.9 0.516 317.4 0.66817 2.2210 2.056 338.7 0.607 331.3 0.75018 2.1712 2.161 356.1 0.644 344.9 0.82819 2.0689 2.270 353.6 0.856 357.3 0.92020 1.9830 2.379 359.4 0.981 366.8 1.02321 1.8812 2.488 347.5 1.245 374.5 1.13322 1.7815 2.597 343.0 1.435 380.2 1.24523 1.7143 2.704 345.7 1.569 385.9 1.34724 1.6143 2.815 335.4 1.797 389.5 1.46525 1.5329 2.923 333.6 1.950 394.1 1.56026 1.4724 3.029 337.5 2.060 397.5 1.65827 1.4208 3.136 338.5 2.188 402.4 1.74028 1.3745 3.241 343.7 2.284 408.5 1.813
Power–Law Fit J = C(DDDDa)n
Unloading Compliance JIc : 252 kJ/m2 (14 Data)Coeff. C : 341 kJ/m2 Exponent n : 0.29 Fit Coeff. R : 0.620DC Potential Method JIc : 254 kJ/m2 (14 Data)Coeff. C : 351 kJ/m2 Exponent n : 0.31 Fit Coeff. R : 0.976

50
0.0
0.5
1.0
1.5
2.0
2.5
3.0
0 0.5 1 1.5 2 2.5 3 3.5
MeasuredCorrected
Load
(kN
)
Displacement (mm)
Test JR-10288°CCF–8M (Heat 4331) Aged 700 h at 400°C
Load–LoadlineDisplacement
Figure A-2.1. Load-vs.-loadline displacement curve for specimen Y4–02of thermally aged CF–8M cast SS tested at 288°C
Figure A-2.2. Fracture surface of specimen Y4–02 tested at 288°C
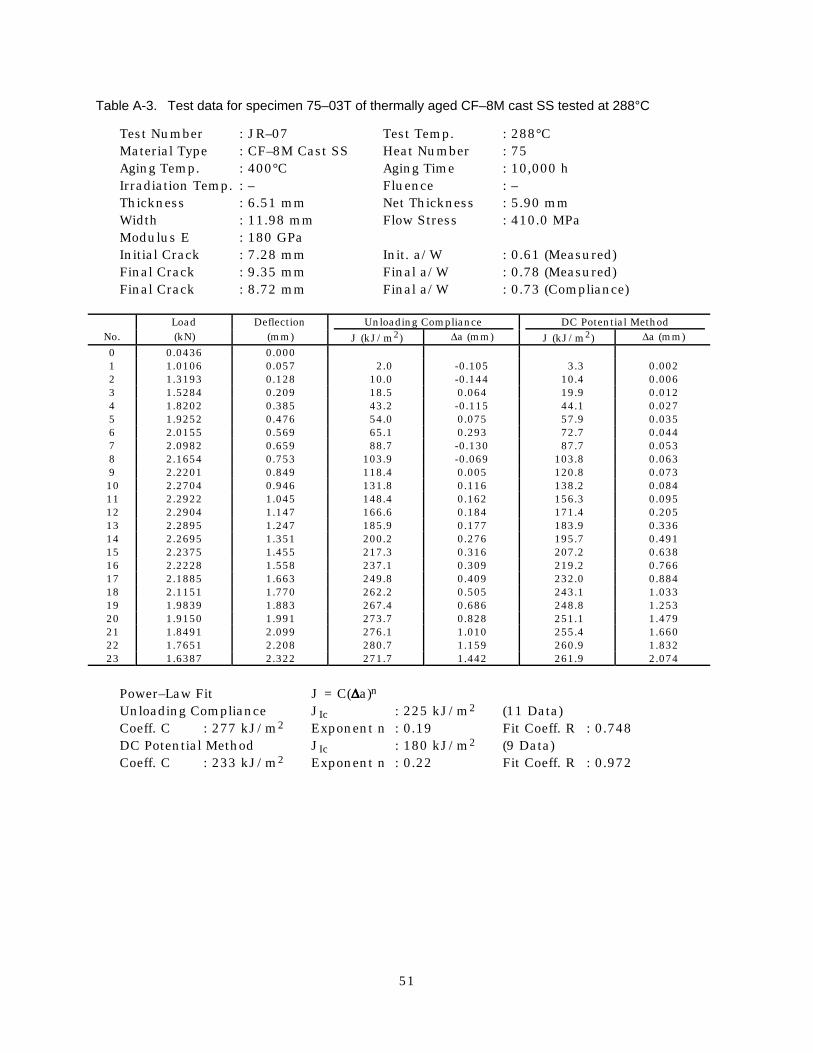
51
Table A-3. Test data for specimen 75–03T of thermally aged CF–8M cast SS tested at 288°C
Test Number : JR–07 Test Temp. : 288°CMaterial Type : CF–8M Cast SS Heat Number : 75Aging Temp. : 400°C Aging Time : 10,000 hIrradiation Temp. : – Fluence : –Thickness : 6.51 mm Net Thickness : 5.90 mmWidth : 11.98 mm Flow Stress : 410.0 MPaModulus E : 180 GPaInitial Crack : 7.28 mm Init. a/W : 0.61 (Measured)Final Crack : 9.35 mm Final a/W : 0.78 (Measured)Final Crack : 8.72 mm Final a/W : 0.73 (Compliance)
Load Deflection Unloading Compliance DC Potential MethodNo. (kN) (mm) J (kJ/m2) Da (mm) J (kJ/m2) Da (mm)
0 0.0436 0.0001 1.0106 0.057 2.0 -0.105 3.3 0.0022 1.3193 0.128 10.0 -0.144 10.4 0.0063 1.5284 0.209 18.5 0.064 19.9 0.0124 1.8202 0.385 43.2 -0.115 44.1 0.0275 1.9252 0.476 54.0 0.075 57.9 0.0356 2.0155 0.569 65.1 0.293 72.7 0.0447 2.0982 0.659 88.7 -0.130 87.7 0.0538 2.1654 0.753 103.9 -0.069 103.8 0.0639 2.2201 0.849 118.4 0.005 120.8 0.07310 2.2704 0.946 131.8 0.116 138.2 0.08411 2.2922 1.045 148.4 0.162 156.3 0.09512 2.2904 1.147 166.6 0.184 171.4 0.20513 2.2895 1.247 185.9 0.177 183.9 0.33614 2.2695 1.351 200.2 0.276 195.7 0.49115 2.2375 1.455 217.3 0.316 207.2 0.63816 2.2228 1.558 237.1 0.309 219.2 0.76617 2.1885 1.663 249.8 0.409 232.0 0.88418 2.1151 1.770 262.2 0.505 243.1 1.03319 1.9839 1.883 267.4 0.686 248.8 1.25320 1.9150 1.991 273.7 0.828 251.1 1.47921 1.8491 2.099 276.1 1.010 255.4 1.66022 1.7651 2.208 280.7 1.159 260.9 1.83223 1.6387 2.322 271.7 1.442 261.9 2.074
Power–Law Fit J = C(DDDDa)n
Unloading Compliance JIc : 225 kJ/m2 (11 Data)Coeff. C : 277 kJ/m2 Exponent n : 0.19 Fit Coeff. R : 0.748DC Potential Method JIc : 180 kJ/m2 (9 Data)Coeff. C : 233 kJ/m2 Exponent n : 0.22 Fit Coeff. R : 0.972

52
0.0
0.5
1.0
1.5
2.0
2.5
3.0
0 0.5 1 1.5 2 2.5 3 3.5
MeasuredCorrected
Load
(kN
)
Displacement (mm)
CF–8M (Spec. #75–03T) Aged 10,000 h at 400°C288°C
Load–LoadlineDisplacement
Figure A-3.1. Load-vs.-loadline displacement curve for specimen75–03T of thermally aged CF–8M cast SS tested at 288°C
Figure A-3.2. Fracture surface of specimen 75–03T tested at 288°C

53
Table A-4. Test data for specimen 75–04T of thermally aged CF–8M cast SS tested at 288°C
Test Number : JR–08 Test Temp. : 288°CMaterial Type : CF–8M Cast SS Heat Number : 75Aging Temp. : 400°C Aging Time : 10,000 hIrradiation Temp. : – Fluence : –Thickness : 6.51 mm Net Thickness : 5.87 mmWidth : 11.98 mm Flow Stress : 410.0 MPaModulus E : 180 GPaInitial Crack : 7.79 mm Init. a/W : 0.65 (Measured)Final Crack : 9.89 mm Final a/W : 0.83 (Measured)Final Crack : 10.07 mm Final a/W : 0.84 (Compliance)
Load Deflection Unloading Compliance DC Potential MethodNo. (kN) (mm) J (kJ/m2) Da (mm) J (kJ/m2) Da (mm)
0 0.0436 0.0001 0.4938 0.033 0.9 -0.198 1.0 0.0002 1.9252 0.829 92.5 -0.063 99.8 0.0623 2.0155 0.978 111.2 0.062 121.8 0.1514 2.0982 1.128 131.3 0.171 142.9 0.2465 2.1654 1.279 154.1 0.238 164.1 0.3476 2.2201 1.436 179.8 0.284 185.3 0.4587 2.2704 1.592 203.9 0.348 203.5 0.5958 2.2922 1.752 222.6 0.474 220.4 0.7389 2.2904 1.911 234.5 0.648 232.7 0.90810 2.2895 2.071 240.6 0.857 245.4 1.04811 2.2695 2.230 248.0 1.027 258.4 1.17512 2.2375 2.387 254.8 1.188 269.7 1.29913 2.2228 2.544 268.4 1.278 283.7 1.39014 2.1885 2.705 265.5 1.531 295.1 1.52015 2.1151 2.866 265.4 1.694 301.9 1.65116 1.9839 3.032 255.1 1.968 304.6 1.81917 1.9150 3.192 241.8 2.176 300.8 1.97818 1.8491 3.351 242.7 2.283 299.1 2.108
Power–Law Fit J = C(DDDDa)n
Unloading Compliance JIc : 197 kJ/m2 (10 Data)Coeff. C : 248 kJ/m2 Exponent n : 0.20 Fit Coeff. R : 0.931DC Potential Method JIc : 154 kJ/m2 (10 Data)Coeff. C : 246 kJ/m2 Exponent n : 0.39 Fit Coeff. R : 0.997

54
0.0
0.5
1.0
1.5
2.0
2.5
3.0
0 0.5 1 1.5 2 2.5 3 3.5
MeasuredCorrected
Load
(kN
)
Displacement (mm)
CF–8M (Spec. #75–04T) Aged 10,000 h at 400°C288°C
Load–LoadlineDisplacement
Figure A-4.1. Load-vs.-loadline displacement curve for specimen75–04T of thermally aged CF–8M cast SS tested at 288°C
Figure A-4.2. Fracture surface of specimen 75–04T tested at 288°C

55
Table A-5. Test data for specimen 75–10T of thermally aged CF–8M cast SS tested at 288°C
Test Number : JR–32 Test Temp. : 288°CMaterial Type : CF–8M Cast SS Heat Number : 75Aging Temp. : 400°C Aging Time : 10,000 hIrradiation Temp. : – Fluence : –Thickness : 6.50 mm Net Thickness : 5.82 mmWidth : 12.01 mm Flow Stress : 410.0 MPaModulus E : 180 GPaInitial Crack : 6.08 mm Init. a/W : 0.51 (Measured)Final Crack : 8.75 mm Final a/W : 0.73 (Measured)Final Crack : 8.81 mm Final a/W : 0.72 (Compliance)
Load Deflection Unloading Compliance DC Potential MethodNo. (kN) (mm) J (kJ/m2) Da (mm) J (kJ/m2) Da (mm)
0 0.0885 0.0001 2.7615 0.368 58.5 -0.496 55.8 0.0382 2.9091 0.458 69.1 -0.195 73.0 0.0443 3.0341 0.550 85.9 -0.051 91.6 0.0554 3.1404 0.642 98.7 0.264 110.7 0.0625 3.2116 0.739 118.4 0.331 128.6 0.1956 3.2370 0.838 142.7 0.266 146.8 0.3097 3.2792 0.937 167.1 0.209 164.9 0.4268 3.3219 1.035 178.9 0.461 183.9 0.5149 3.3099 1.135 204.2 0.415 203.3 0.60910 3.2659 1.240 216.2 0.654 221.5 0.74711 3.2468 1.345 232.5 0.794 239.6 0.86512 3.1347 1.454 258.7 0.787 257.3 0.99913 2.9554 1.567 269.0 1.005 270.9 1.18514 2.8420 1.677 282.7 1.143 282.5 1.36315 2.7179 1.788 287.7 1.380 294.9 1.51116 2.6173 1.896 296.5 1.552 306.6 1.65617 2.4656 2.008 294.4 1.841 316.7 1.81218 2.2673 2.123 305.2 1.977 322.8 2.00019 2.1098 2.235 304.0 2.215 325.3 2.19420 1.9790 2.345 308.0 2.383 327.9 2.36721 1.8358 2.458 307.8 2.581 330.7 2.53022 1.7366 2.567 311.3 2.731 334.8 2.667
Power–Law Fit J = C(DDDDa)n
Unloading Compliance JIc : 181 kJ/m2 (11 Data)Coeff. C : 258 kJ/m2 Exponent n : 0.30 Fit Coeff. R : 0.914DC Potential Method JIc : 146 kJ/m2 (11 Data)Coeff. C : 246 kJ/m2 Exponent n : 0.42 Fit Coeff. R : 0.989

56
0.0
1.0
2.0
3.0
4.0
5.0
0 0.5 1 1.5 2 2.5 3
Measured ExtensionLoading–Pin Displacement
Load
(kN
)
Displacement (mm)
Test JR-32288°C
Specimen 75-10TCF-8M Heat 75 (28% Ferrite)Aged 10,000 h at 400°C
Figure A-5.1. Load-vs.-loadline displacement curve for specimen75–10T of thermally aged CF–8M cast SS tested at 288°C
Figure A-5.2. Fracture surface of specimen 75–10T tested at 288°C

57
Table A-6. Test data for specimen 184–38 of 50% cold–worked Type 316NG SS tested at 288°C
Test Number : JR–12 Test Temp. : 288°CMaterial Type : 50% CW 316NG SS Heat Number : 18474Aging Temp. : – Aging Time : –Irradiation Temp. : – Fluence : –Thickness : 6.497 mm Net Thickness : 5.819 mmWidth : 12.032 mm Flow Stress : 861.0 MPaModulus E : 175 GPaInitial Crack : 7.14 mm Init. a/W : 0.59 (Measured)Final Crack : 10.30 mm Final a/W : 0.86 (Measured)Final Crack : 9.64 mm Final a/W : 0.80 (Compliance)
Load Deflection Unloading Compliance DC Potential MethodNo. (kN) (mm) J (kJ/m2) Da (mm) J (kJ/m2) Da (mm)
0 0.0445 0.0001 1.2522 0.045 2.1 0.048 2.1 0.0012 1.9296 0.093 7.8 0.055 7.9 0.0023 2.5430 0.148 17.4 0.023 17.4 0.0054 3.0577 0.208 30.1 0.184 30.2 0.0095 3.4665 0.274 45.8 0.169 48.0 0.0926 3.2041 0.389 72.5 0.522 79.8 0.5897 2.9932 0.505 93.9 0.779 99.0 1.0698 2.2784 0.658 115.2 1.169 118.1 1.7339 1.8362 0.792 121.5 1.594 121.3 2.25710 1.5115 0.919 136.3 1.903 126.9 2.72811 1.2219 1.046 113.0 2.501 134.4 3.160
Power–Law Fit J = C(DDDDa)n
Unloading Compliance JIc : 51 kJ/m2 (5 Data)Coeff. C : 102 kJ/m2 Exponent n : 0.46 Fit Coeff. R : 0.989DC Potential Method JIc : 61 kJ/m2 (5 Data)Coeff. C : 97 kJ/m2 Exponent n : 0.30 Fit Coeff. R : 0.995

58
0.0
1.0
2.0
3.0
4.0
5.0
0 0.2 0.4 0.6 0.9 1.1 1.3 1.5
MeasuredAdjusted
Load
(kN
)
Displacement (mm)
Test JR-12288°C50% CW 316NG
Load–LoadlineDisplacement
Figure A-6.1. Load-vs.-loadline displacement curve for specimen 184–38of 50% cold–worked Type 316NG SS tested at 288°C
Figure A-6.2. Fracture surface of specimen 184–38 tested at 288°C
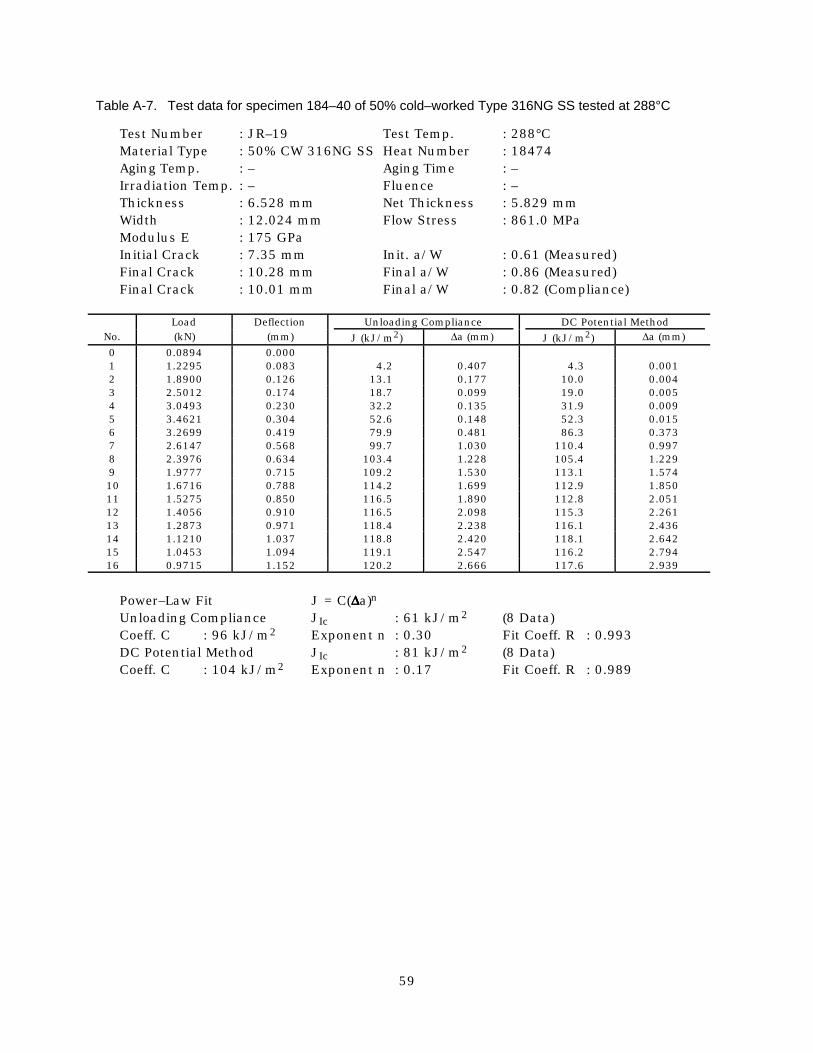
59
Table A-7. Test data for specimen 184–40 of 50% cold–worked Type 316NG SS tested at 288°C
Test Number : JR–19 Test Temp. : 288°CMaterial Type : 50% CW 316NG SS Heat Number : 18474Aging Temp. : – Aging Time : –Irradiation Temp. : – Fluence : –Thickness : 6.528 mm Net Thickness : 5.829 mmWidth : 12.024 mm Flow Stress : 861.0 MPaModulus E : 175 GPaInitial Crack : 7.35 mm Init. a/W : 0.61 (Measured)Final Crack : 10.28 mm Final a/W : 0.86 (Measured)Final Crack : 10.01 mm Final a/W : 0.82 (Compliance)
Load Deflection Unloading Compliance DC Potential MethodNo. (kN) (mm) J (kJ/m2) Da (mm) J (kJ/m2) Da (mm)
0 0.0894 0.0001 1.2295 0.083 4.2 0.407 4.3 0.0012 1.8900 0.126 13.1 0.177 10.0 0.0043 2.5012 0.174 18.7 0.099 19.0 0.0054 3.0493 0.230 32.2 0.135 31.9 0.0095 3.4621 0.304 52.6 0.148 52.3 0.0156 3.2699 0.419 79.9 0.481 86.3 0.3737 2.6147 0.568 99.7 1.030 110.4 0.9978 2.3976 0.634 103.4 1.228 105.4 1.2299 1.9777 0.715 109.2 1.530 113.1 1.57410 1.6716 0.788 114.2 1.699 112.9 1.85011 1.5275 0.850 116.5 1.890 112.8 2.05112 1.4056 0.910 116.5 2.098 115.3 2.26113 1.2873 0.971 118.4 2.238 116.1 2.43614 1.1210 1.037 118.8 2.420 118.1 2.64215 1.0453 1.094 119.1 2.547 116.2 2.79416 0.9715 1.152 120.2 2.666 117.6 2.939
Power–Law Fit J = C(DDDDa)n
Unloading Compliance JIc : 61 kJ/m2 (8 Data)Coeff. C : 96 kJ/m2 Exponent n : 0.30 Fit Coeff. R : 0.993DC Potential Method JIc : 81 kJ/m2 (8 Data)Coeff. C : 104 kJ/m2 Exponent n : 0.17 Fit Coeff. R : 0.989

60
0.0
0.5
1.0
1.5
2.0
2.5
3.0
3.5
4.0
0 0.5 1 1.5 2
MeasuredCorrected
Load
(kN
)
Displacement (mm)
Test JR-19Specimen 184-40288°C50% CW Type 316NG
Load–LoadlineDisplacement
Figure A-7.1. Load-vs.-loadline displacement curve for specimen 184–40of 50% cold–worked Type 316NG SS tested at 288°C
Figure A-7.2. Fracture surface of specimen 184–40 tested at 288°C

61
Table A-8. Test data for specimen C19–D of nonirradiated Type 304 SS tested at 288°C
Test Number : JR–27 Test Temp. : 288°CMaterial Type : Type 304 SS Heat Number : C19Aging Temp. : – Aging Time : –Irradiation Temp. : – Fluence : –Thickness : 6.480 mm Net Thickness : 5.890 mmWidth : 12.000 mm Flow Stress : 339.5 MPaModulus E : 175 GPaInitial Crack : 7.28 mm Init. a/W : 0.61 (Measured)Final Crack : 7.63 mm Final a/W : 0.64 (Measured)Final Crack : 7.70 mm Final a/W : 0.64 (Compliance)
Load Deflection Unloading Compliance DC Potential MethodNo. (kN) (mm) J (kJ/m2) Da (mm) J (kJ/m2) Da (mm)
0 0.089 0.0001 1.214 0.247 21.8 -0.001 21.8 0.0162 1.279 0.342 31.5 -0.027 31.2 0.0233 1.346 0.435 40.3 0.056 40.9 0.0304 1.407 0.582 56.5 0.070 57.0 0.0425 1.515 0.774 80.0 0.033 79.3 0.0596 1.607 0.969 102.8 0.087 103.2 0.0767 1.674 1.166 125.6 0.181 128.6 0.0928 1.790 1.562 183.4 0.172 182.4 0.1359 1.852 1.761 210.0 0.232 210.9 0.15510 1.931 1.956 247.1 0.134 239.4 0.18211 2.025 2.355 300.5 0.254 301.1 0.22112 2.153 2.852 392.9 0.152 381.1 0.28913 2.221 3.150 433.5 0.253 432.1 0.31914 2.294 3.449 464.5 0.434 485.7 0.34215 2.439 4.045 587.5 0.418 590.0 0.43316 2.536 4.524 673.8 0.51917 2.617 5.046 765.5 0.62518 2.670 5.550 834.9 0.811
Power–Law Fit J = C(DDDDa)n
Unloading Compliance JIc : 695 kJ/m2 (9 Data)Coeff. C : 765 kJ/m2 Exponent n : 0.28 Fit Coeff. R : 0.338DC Potential Method (information could not be determined)

62
0.0
0.5
1.0
1.5
2.0
2.5
3.0
0 1 2 3 4 5 6
Measured ExtensionLoading–Pin Displacement
Load
(kN
)
Displacement (mm)
Test JR-27288°CSpecimen C19–DNonirradiated
Figure A-8.1. Load-vs.-loadline displacement curve for specimen C19–Dof nonirradiated Type 304 SS tested at 288°C
Figure A-8.2. Fracture surface of specimen C19–D tested at 288°C

63
Table A-9. Test data for specimen C16–C of nonirradiated Type 316 SS tested at 288°C
Test Number : JR–31 Test Temp. : 288°CMaterial Type : Type 316 SS Heat Number : C16Aging Temp. : – Aging Time : –Irradiation Temp. : – Fluence : –Thickness : 6.500 mm Net Thickness : 5.810 mmWidth : 11.990 mm Flow Stress : 336.0 MPa (estimated)Modulus E : 175 GPaInitial Crack : 7.30 mm Init. a/W : 0.61 (Measured)Final Crack : 7.96 mm Final a/W : 0.66 (Measured)Final Crack : 7.65 mm Final a/W : 0.64 (Compliance)
Load Deflection Unloading Compliance DC Potential MethodNo. (kN) (mm) J (kJ/m2) Da (mm) J (kJ/m2) Da (mm)
0 0.065 0.000 0.0 0.0001 1.207 0.208 18.9 -0.002 19.0 0.0142 1.293 0.412 40.2 -0.064 39.5 0.0303 1.370 0.618 60.7 0.023 61.5 0.0454 1.426 0.826 82.5 0.103 84.7 0.0615 1.492 1.023 108.6 0.041 107.8 0.0816 1.555 1.220 129.2 0.146 132.0 0.0967 1.620 1.417 152.1 0.219 157.0 0.1138 1.674 1.615 178.7 0.236 182.9 0.1339 1.784 2.012 251.4 0.077 236.3 0.18710 1.831 2.211 278.6 0.095 264.8 0.20711 1.877 2.410 310.1 0.082 293.7 0.23112 1.925 2.609 338.6 0.112 323.6 0.25213 1.977 2.808 373.7 0.081 353.6 0.27814 2.023 3.007 413.8 0.015 384.0 0.30815 2.060 3.207 439.0 0.083 416.3 0.32716 2.100 3.407 469.7 0.108 448.6 0.34917 2.140 3.607 503.6 0.114 481.1 0.37518 2.180 3.807 520.0 0.243 515.9 0.38719 2.219 4.007 555.5 0.249 549.1 0.41320 2.259 4.207 601.8 0.197 581.4 0.44821 2.298 4.406 632.6 0.239 616.3 0.47122 2.330 4.607 646.5 0.371 654.1 0.48123 2.359 4.808 689.0 0.356 688.2 0.513
Power–Law Fit J = C(DDDDa)n
(information could not be determined)
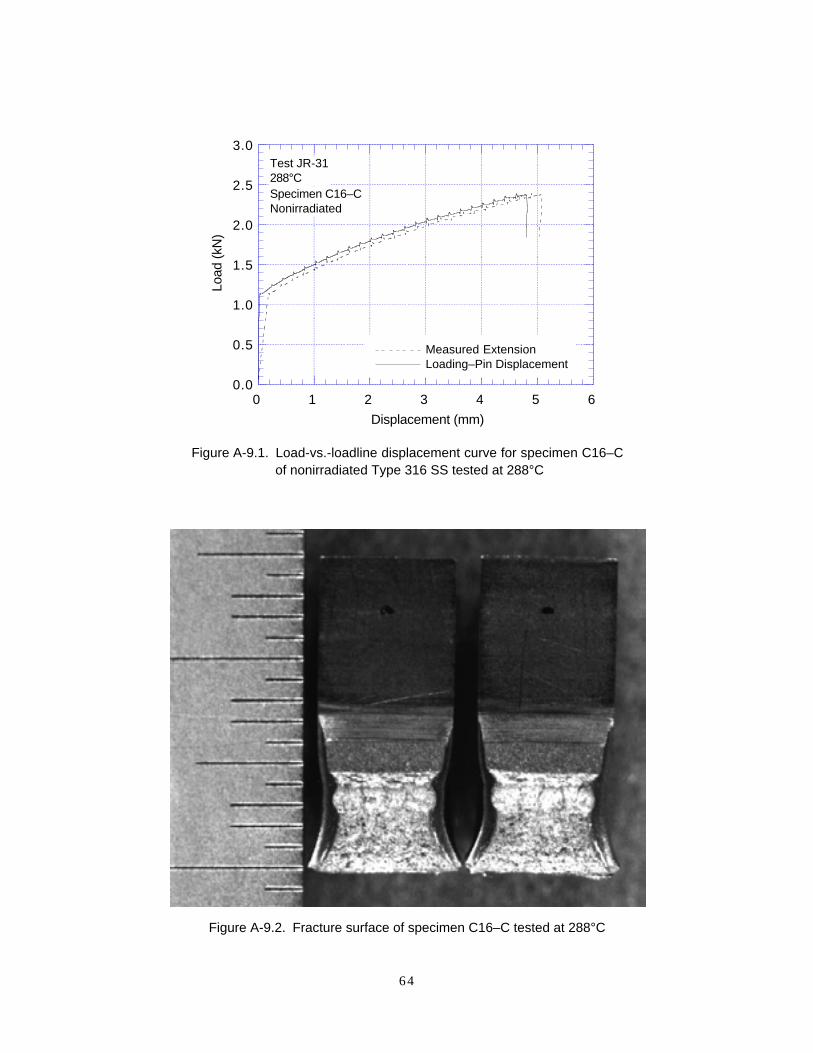
64
0.0
0.5
1.0
1.5
2.0
2.5
3.0
0 1 2 3 4 5 6
Measured ExtensionLoading–Pin Displacement
Load
(kN
)
Displacement (mm)
Test JR-31288°CSpecimen C16–CNonirradiated
Figure A-9.1. Load-vs.-loadline displacement curve for specimen C16–Cof nonirradiated Type 316 SS tested at 288°C
Figure A-9.2. Fracture surface of specimen C16–C tested at 288°C

65
Table A-10. Test data for specimen C16–D of nonirradiated Type 316 SS tested at 288°C
Test Number : JR–28 Test Temp. : 288°CMaterial Type : Type 316 SS Heat Number : C16Aging Temp. : – Aging Time : –Irradiation Temp. : – Fluence : –Thickness : 6.470 mm Net Thickness : 5.90 mmWidth : 11.980 mm Flow Stress : 336.0 MPa (estimated)Modulus E : 175 GPaInitial Crack : 7.41 mm Init. a/W : 0.62 (Measured)Final Crack : 7.83 mm Final a/W : 0.65 (Measured)Final Crack : 7.60 mm Final a/W : 0.63 (Compliance)
Load Deflection Unloading Compliance DC Potential MethodNo. (kN) (mm) J (kJ/m2) Da (mm) J (kJ/m2) Da (mm)
0 0.088 0.000 0.0 0.0001 1.218 0.247 22.5 0.059 23.0 0.0172 1.304 0.441 43.5 0.007 42.9 0.0323 1.373 0.637 63.8 0.072 64.1 0.0474 1.439 0.834 85.4 0.129 86.5 0.0645 1.501 1.031 109.2 0.140 109.9 0.0816 1.567 1.228 138.6 0.026 134.1 0.1037 1.621 1.426 170.1 -0.096 159.3 0.1278 1.672 1.625 192.1 -0.014 185.7 0.1439 1.725 1.823 204.8 0.230 213.3 0.15210 1.772 2.023 230.1 0.287 241.3 0.17111 1.818 2.222 260.1 0.295 269.7 0.19412 1.865 2.421 310.7 0.068 297.6 0.23113 1.908 2.621 332.8 0.169 327.7 0.24814 1.949 2.820 368.4 0.134 357.8 0.27415 1.982 3.020 400.4 0.141 388.8 0.29816 2.019 3.221 428.9 0.182 420.6 0.31917 2.055 3.420 467.3 0.148 452.3 0.34818 2.088 3.621 495.4 0.195 484.8 0.369
Power–Law Fit J = C(DDDDa)n
(information could not be determined)

66
0.0
0.5
1.0
1.5
2.0
2.5
3.0
0 1 2 3 4 5 6
Measured ExtensionLoading–Pin Displacement
Load
(kN
)
Displacement (mm)
Test JR-28288°CSpecimen C16–DNonirradiated
Figure A-10.1. Load-vs.-loadline displacement curve for specimenC16–D of nonirradiated Type 316 SS tested at 288°C
Figure A-10.2. Fracture surface of specimen C16–D tested at 288°C

67
Table A-11. Test data for specimen L20–D of nonirradiated Type 304 SS tested at 288°C
Test Number : JR–29 Test Temp. : 288°CMaterial Type : Type 304L SS (HP) Heat Number : L20Aging Temp. : – Aging Time : –Irradiation Temp. : – Fluence : –Thickness : 6.50 mm Net Thickness : 5.89 mmWidth : 12.00 mm Flow Stress : 307.0 MPa (estimated)Modulus E : 175 GPaInitial Crack : 7.22 mm Init. a/W : 0.60 (Measured)Final Crack : 9.52 mm Final a/W : 0.79 (Measured)Final Crack : 8.84 mm Final a/W : 0.74 (Compliance)
Load Deflection Unloading Compliance DC Potential MethodNo. (kN) (mm) J (kJ/m2) Da (mm) J (kJ/m2) Da (mm)
0 0.0000 0.0001 1.2384 0.028 3.3 -0.704 3.4 0.0032 1.4995 0.103 8.4 -0.481 11.4 0.0073 1.6414 0.190 17.4 -0.170 22.1 0.0144 1.7179 0.285 28.9 0.082 33.0 0.0245 1.8211 0.581 78.1 0.072 74.0 0.1436 1.8264 0.682 88.5 0.184 86.6 0.2327 1.8069 0.786 102.8 0.204 98.4 0.3668 1.7975 0.888 117.5 0.209 110.0 0.4739 1.7949 0.991 125.9 0.397 121.8 0.57610 1.7917 1.092 138.0 0.460 134.0 0.65911 1.7704 1.196 153.0 0.473 146.4 0.74812 1.7468 1.300 169.2 0.460 158.1 0.84313 1.7148 1.405 175.8 0.635 169.6 0.94014 1.6761 1.510 192.7 0.600 180.3 1.04415 1.6365 1.615 203.1 0.686 190.0 1.15316 1.5991 1.720 212.3 0.774 199.3 1.26317 1.5627 1.825 224.8 0.808 208.5 1.36318 1.5440 1.929 225.6 0.999 217.8 1.45519 1.5088 2.033 240.6 0.990 227.2 1.54420 1.4684 2.139 243.0 1.150 235.9 1.64121 1.4354 2.244 253.0 1.200 243.8 1.73722 1.4021 2.349 266.8 1.211 252.5 1.81523 1.3652 2.454 272.8 1.306 260.8 1.90224 1.3260 2.559 283.3 1.344 267.3 2.00025 1.2886 2.665 293.3 1.386 272.9 2.09826 1.2517 2.770 289.9 1.550 278.1 2.19427 1.2104 2.876 294.9 1.626 281.8 2.302
Power–Law Fit J = C(DDDDa)n
Unloading Compliance JIc : 119 kJ/m2 (19 Data)Coeff. C : 236 kJ/m2 Exponent n : 0.56 Fit Coeff. R : 0.948DC Potential Method JIc : 78 kJ/m2 (21 Data)Coeff. C : 174 kJ/m2 Exponent n : 0.60 Fit Coeff. R : 0.998
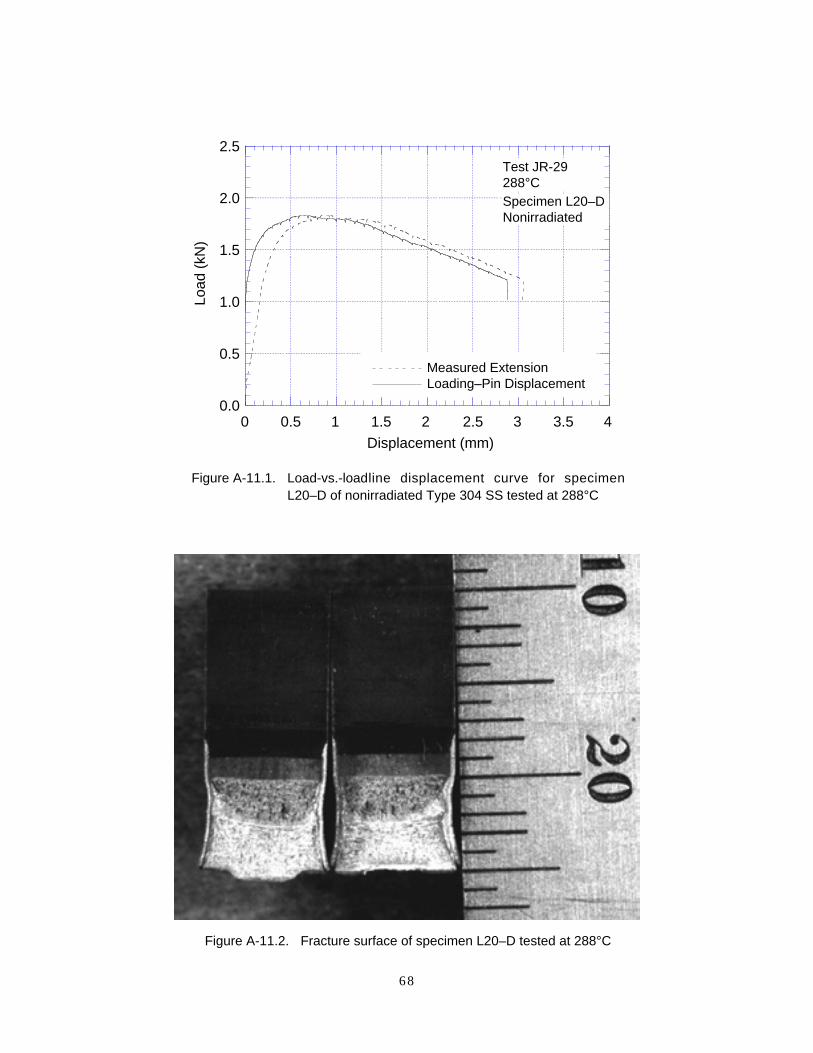
68
0.0
0.5
1.0
1.5
2.0
2.5
0 0.5 1 1.5 2 2.5 3 3.5 4
Measured ExtensionLoading–Pin Displacement
Load
(kN
)
Displacement (mm)
Test JR-29288°CSpecimen L20–DNonirradiated
Figure A-11.1. Load-vs.-loadline displacement curve for specimenL20–D of nonirradiated Type 304 SS tested at 288°C
Figure A-11.2. Fracture surface of specimen L20–D tested at 288°C

69
Table A-12. Test data for specimen L2–C of nonirradiated Type 304 SS tested at 288°C
Test Number : JR–20 Test Temp. : 288°CMaterial Type : Type 304 SS Heat Number : L2Aging Temp. : – Aging Time : –Irradiation Temp. : – Fluence : –Thickness : 6.51 mm Net Thickness : 5.84 mmWidth : 11.98 mm Flow Stress : 270.5 MPaModulus E : 175 GPaInitial Crack : 7.38 mm Init. a/W : 0.61 (Measured)Final Crack : 9.17 mm Final a/W : 0.76 (Measured)Final Crack : 8.08 mm Final a/W : 0.75 (Compliance)
Load Deflection Unloading Compliance DC Potential MethodNo. (kN) (mm) J (kJ/m2) Da (mm) J (kJ/m2) Da (mm)
0 0.089 0.0001 1.300 0.080 6.5 0.237 6.5 0.0062 1.453 0.169 18.9 0.152 17.1 0.0163 1.529 0.265 30.2 0.155 29.3 0.0284 1.596 0.361 43.7 0.126 41.9 0.0405 1.648 0.459 58.7 0.041 55.2 0.0546 1.685 0.556 72.5 0.015 68.9 0.0677 1.717 0.656 87.4 0.027 83.2 0.0808 1.741 0.756 101.7 0.040 97.7 0.0939 1.754 0.857 117.1 0.027 112.4 0.10710 1.769 0.958 130.1 0.082 127.1 0.11911 1.774 1.059 144.7 0.101 142.1 0.13212 1.780 1.160 159.9 0.104 157.0 0.14613 1.775 1.275 176.7 0.120 171.1 0.23414 1.759 1.379 191.6 0.136 181.6 0.33915 1.734 1.482 203.5 0.200 192.3 0.43216 1.708 1.586 214.2 0.277 201.9 0.54217 1.692 1.688 227.3 0.310 211.0 0.65118 1.666 1.793 238.6 0.372 220.9 0.74719 1.619 1.898 243.2 0.518 230.0 0.85020 1.580 2.001 252.5 0.593 237.2 0.97321 1.544 2.105 260.8 0.676 244.9 1.07522 1.504 2.209 265.5 0.798 253.0 1.17323 1.461 2.315 275.3 0.859 259.4 1.28924 1.411 2.470 283.6 1.006 270.8 1.42925 1.353 2.627 292.9 1.132 280.0 1.57726 1.280 2.785 299.8 1.271 286.5 1.74127 1.219 2.942 304.8 1.417 292.3 1.893
Power–Law Fit J = C(DDDDa)n
Unloading Compliance JIc : 237 kJ/m2 (13 Data)Coeff. C : 283 kJ/m2 Exponent n : 0.20 Fit Coeff. R : 0.988DC Potential Method JIc : 186 kJ/m2 (15 Data)Coeff. C : 243 kJ/m2 Exponent n : 0.27 Fit Coeff. R : 0.996

70
0.0
0.5
1.0
1.5
2.0
2.5
3.0
0 0.5 1 1.5 2 2.5 3 3.5 4
Measured ExtensionLoading–Pin Displacement
Load
(kN
)
Displacement (mm)
Test JR-20288°C
Specimen L2-CNonirradiated
Figure A-12.1. Load-vs.-loadline displacement curve for specimen L2–Cof nonirradiated Type 304 SS tested at 288°C
Figure A-12.2. Fracture surface of specimen L2–C tested at 288°C

71
Table A-13. Test data for specimen L2–E of nonirradiated Type 304 SS tested at 288°C
Test Number : JR–30 Test Temp. : 288°CMaterial Type : Type 304 SS Heat Number : L2Aging Temp. : – Aging Time : –Irradiation Temp. : – Fluence : –Thickness : 6.49 mm Net Thickness : 5.87 mmWidth : 12.03 mm Flow Stress : 270.5 MPaModulus E : 175 GPaInitial Crack : 7.38 mm Init. a/W : 0.61 (Measured)Final Crack : 9.17 mm Final a/W : 0.76 (Measured)Final Crack : 8.08 mm Final a/W : 0.75 (Compliance)
Load Deflection Unloading Compliance DC Potential MethodNo. (kN) (mm) J (kJ/m2) Da (mm) J (kJ/m2) Da (mm)
0 0.0885 0.0001 1.1441 0.052 4.2 0.027 4.2 0.0042 1.2273 0.144 13.0 0.049 13.1 0.0123 1.3033 0.238 23.0 -0.020 22.6 0.0214 1.3669 0.334 32.8 0.057 32.9 0.0305 1.4225 0.430 44.4 -0.014 43.7 0.0416 1.4741 0.527 55.9 -0.022 55.0 0.0527 1.5226 0.624 65.5 0.102 66.7 0.0618 1.5627 0.722 78.0 0.088 78.8 0.0729 1.6022 0.820 88.5 0.185 91.2 0.08210 1.6347 0.918 99.6 0.261 102.2 0.17311 1.6534 1.019 116.8 0.150 114.1 0.21812 1.6743 1.118 123.1 0.371 126.3 0.26613 1.6908 1.219 142.0 0.244 138.8 0.31214 1.7019 1.320 147.3 0.468 151.2 0.36215 1.7095 1.421 159.3 0.523 163.8 0.41116 1.7166 1.522 175.1 0.512 176.2 0.46317 1.7192 1.630 185.8 0.619 189.7 0.51218 1.7143 1.732 203.4 0.584 201.9 0.56819 1.6899 1.835 211.2 0.715 213.6 0.63320 1.6690 1.938 228.6 0.688 224.1 0.70921 1.6561 2.041 255.8 0.535 235.1 0.77122 1.6458 2.143 242.8 0.899 246.1 0.83523 1.6276 2.246 263.8 0.819 256.8 0.89924 1.6009 2.350 277.7 0.848 266.7 0.97125 1.5867 2.453 284.1 0.949 276.6 1.03726 1.5529 2.557 307.0 0.874 285.8 1.11327 1.5280 2.661 305.2 1.049 294.6 1.18528 1.4928 2.765 318.5 1.064 302.9 1.26129 1.4599 2.870 314.4 1.244 310.9 1.33530 1.4265 2.975 322.2 1.307 316.6 1.41231 1.3963 3.080 335.2 1.329 325.3 1.48932 1.3705 3.184 341.3 1.406 332.3 1.55933 1.3300 3.289 334.7 1.579 339.7 1.62734 1.2771 3.396 340.4 1.649 345.0 1.71035 1.2371 3.501 348.0 1.706 349.1 1.792
Power–Law Fit J = C(DDDDa)n
Unloading Compliance JIc : 154 kJ/m2 (25 Data)Coeff. C : 275 kJ/m2 Exponent n : 0.54 Fit Coeff. R : 0.866DC Potential Method JIc : 159 kJ/m2 (19 Data)Coeff. C : 268 kJ/m2 Exponent n : 0.49 Fit Coeff. R : 0.997

72
0.0
0.5
1.0
1.5
2.0
2.5
0 0.5 1 1.5 2 2.5 3 3.5 4
Measured ExtensionLoading–Pin Displacement
Load
(kN
)
Displacement (mm)
Test JR-30288°C
Specimen L2-ENonirradiated
Figure A-13.1. Load-vs.-loadline displacement curve for specimen L2–Eof nonirradiated Type 304 SS tested at 288°C
Figure A-13.2. Fracture surface of specimen L2–E tested at 288°C

73
Table A-14. Test data for specimen C19–A of irradiated Type 304 SS tested at 288°C
Test Number : JRI–21 Test Temp. : 288°CMaterial Type : Type 304 SS Heat Number : C19Aging Temp. : – Aging Time : –Irradiation Temp. : 288°C Fluence : 0.3 x 10²¹ n/cm2
Thickness : 6.50 mm Net Thickness : 5.85 mmWidth : 12.00 mm Flow Stress : 618.0 MPaModulus E : 175 GPa Effective Flow Stress : 478.8 MPaInitial Crack : 7.45 mm Init. a/W : 0.62 (Measured)Final Crack : 8.84 mm Final a/W : 0.74 (Measured)Final Crack : 8.32 mm Final a/W : 0.69 (Compliance)
Load Deflection Unloading Compliance DC Potential MethodNo. (kN) (mm) J (kJ/m2) Da (mm) J (kJ/m2) Da (mm)
0 0.088 0.0001 2.618 1.094 204.8 0.000 204.3 0.1072 2.637 1.194 226.8 0.000 226.0 0.1183 2.658 1.295 249.3 0.000 248.1 0.1304 2.673 1.395 271.4 0.000 270.1 0.1405 2.687 1.497 294.4 0.000 292.7 0.1536 2.702 1.597 316.8 0.000 314.9 0.1647 2.701 1.699 339.5 0.000 337.1 0.1798 2.706 1.802 356.2 0.068 360.2 0.1889 2.705 1.902 372.4 0.132 382.8 0.19610 2.708 2.004 405.3 0.044 405.0 0.21311 2.705 2.104 427.5 0.050 430.1 0.22712 2.698 2.207 438.3 0.152 453.5 0.23213 2.680 2.310 461.9 0.149 475.0 0.25114 2.666 2.414 486.0 0.147 487.4 0.33615 2.645 2.516 507.6 0.158 499.7 0.41516 2.613 2.619 522.2 0.215 510.7 0.50217 2.589 2.723 545.4 0.215 521.8 0.58718 2.562 2.827 566.4 0.227 531.2 0.68119 2.526 2.931 585.2 0.252 544.1 0.74820 2.460 3.037 570.7 0.467 555.4 0.82921 2.425 3.143 580.0 0.541 565.2 0.91322 2.395 3.246 587.8 0.623 575.7 0.98723 2.354 3.351 608.1 0.639 586.4 1.06224 2.332 3.454 637.1 0.607 595.9 1.13825 2.267 3.561 633.3 0.741 604.7 1.22026 2.218 3.666 652.0 0.757 611.3 1.30727 2.166 3.771 649.6 0.874 617.3 1.393
Power–Law Fit J = C(DDDDa)n
Unloading Compliance JIc : 599 kJ/m2 (15 Data)Coeff. C : 661 kJ/m2 Exponent n : 0..15 Fit Coeff. R : 0.834DC Potential Method JIc : 507 kJ/m2 (17 Data)Coeff. C : 579 kJ/m2 Exponent n : 0.17 Fit Coeff. R : 0.975

74
0.0
0.5
1.0
1.5
2.0
2.5
3.0
3.5
4.0
0 0.5 1 1.5 2 2.5 3 3.5 4
Measured ExtensionLoading–Pin Displacement
Load
(kN
)
Displacement (mm)
Test JRI-21288°C
Specimen C19–A
0.3 x 10²¹ n cm–2
Figure A-14.1 Load-vs.-loadline displacement curve for specimenC19–A of irradiated Type 304 SS tested at 288°C
Figure A-14.2 Fracture surface of specimen C19–A tested at 288°C

75
Table A-15. Test data for specimen C19–B of irradiated Type 304 SS tested at 288°C
Test Number : JRI–23 Test Temp. : 288°CMaterial Type : Type 304 SS Heat Number : C19Aging Temp. : – Aging Time : –Irradiation Temp. : 288°C Fluence : 0.9 x 10²¹ n/cm2
Thickness : 6.50 mm Net Thickness : 5.85 mmWidth : 12.00 mm Flow Stress : 759.5 MPaModulus E : 175 GPa Effective Flow Stress : 549.5 MPaInitial Crack : 7.36 mm Init. a/W : 0.61 (Measured)Final Crack : 9.40 mm Final a/W : 0.78 (Measured)Final Crack : 9.01 mm Final a/W : 0.75 (Compliance)
Load Deflection Unloading Compliance DC Potential MethodNo. (kN) (mm) J (kJ/m2) Da (mm) J (kJ/m2) Da (mm)
0 0.088 0.0001 1.971 0.125 9.7 -0.014 9.8 0.0042 2.630 0.176 19.2 -0.376 19.1 0.0073 3.185 0.236 26.7 -0.041 33.1 0.0104 3.544 0.311 52.4 0.055 53.7 0.0205 3.643 0.404 78.0 0.081 80.5 0.0306 3.636 0.519 110.5 0.159 114.3 0.0437 3.589 0.624 142.0 0.119 144.7 0.0558 3.527 0.729 172.2 0.155 174.6 0.0679 3.469 0.836 205.8 0.095 204.6 0.08010 3.426 0.941 233.9 0.143 233.5 0.09111 3.341 1.047 259.4 0.199 262.3 0.10112 3.266 1.153 281.3 0.294 285.4 0.21013 3.195 1.259 309.3 0.296 304.8 0.30914 3.124 1.366 335.0 0.334 324.7 0.39715 3.058 1.472 357.7 0.390 344.5 0.47916 2.959 1.581 384.2 0.405 363.8 0.56617 2.880 1.689 404.9 0.467 381.4 0.65718 2.793 1.796 416.2 0.590 397.9 0.74619 2.709 1.903 440.3 0.599 413.7 0.83220 2.647 2.009 461.1 0.640 428.7 0.91821 2.539 2.169 486.0 0.730 452.1 1.04022 2.431 2.329 508.4 0.819 471.2 1.16923 2.284 2.491 524.1 0.941 487.7 1.30124 2.184 2.649 538.6 1.048 503.1 1.41625 2.060 2.811 550.1 1.167 515.4 1.55026 1.951 2.970 552.7 1.318 522.6 1.69427 1.834 3.131 559.7 1.436 529.4 1.82328 1.743 3.290 569.4 1.534 537.1 1.93929 1.657 3.449 574.7 1.647 546.4 2.041
Power–Law Fit J = C(DDDDa)n
Unloading Compliance JIc : 368 kJ/m2 (16 Data)Coeff. C : 513 kJ/m2 Exponent n : 0.33 Fit Coeff. R : 0.948DC Potential Method JIc : 313 kJ/m2 (17 Data)Coeff. C : 442 kJ/m2 Exponent n : 0.32 Fit Coeff. R : 0.996
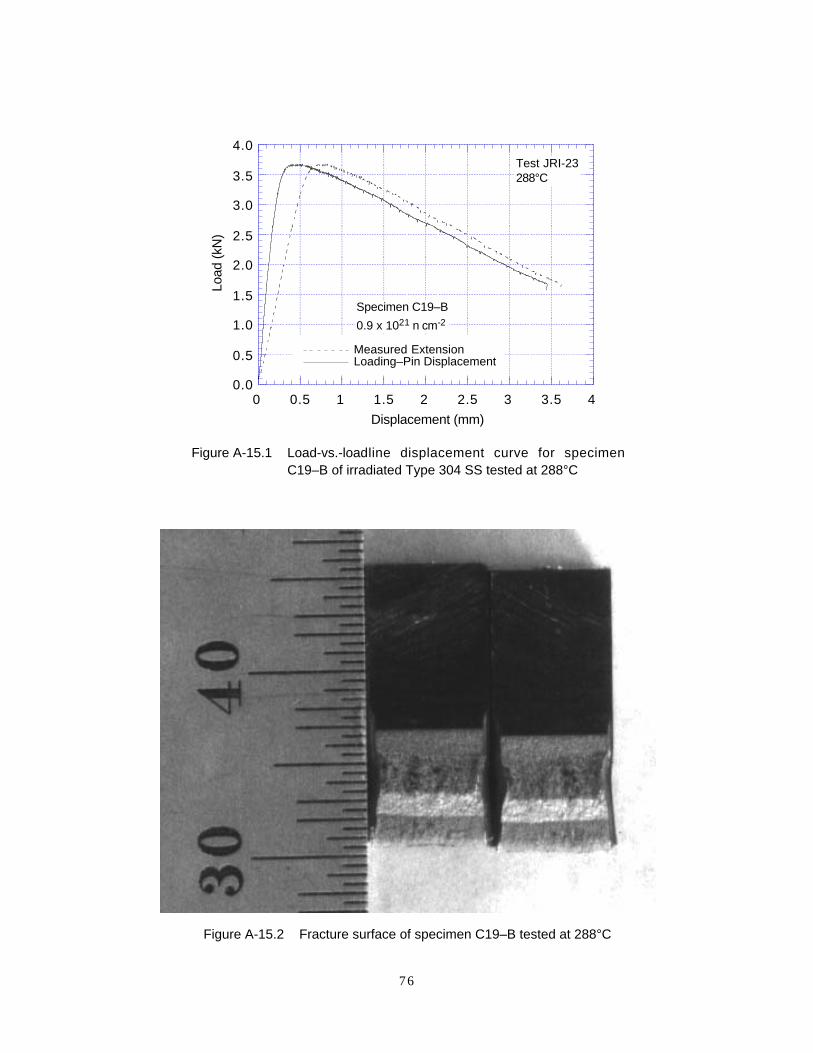
76
0.0
0.5
1.0
1.5
2.0
2.5
3.0
3.5
4.0
0 0.5 1 1.5 2 2.5 3 3.5 4
Measured ExtensionLoading–Pin Displacement
Load
(kN
)
Displacement (mm)
Test JRI-23288°C
Specimen C19–B
0.9 x 10²¹ n cm-2
Figure A-15.1 Load-vs.-loadline displacement curve for specimenC19–B of irradiated Type 304 SS tested at 288°C
Figure A-15.2 Fracture surface of specimen C19–B tested at 288°C

77
Table A-16. Test data for specimen C19–C of irradiated Type 304 SS tested at 288°C
Test Number : JRI–33 Test Temp. : 288°CMaterial Type : Type 304 SS Heat Number : C19Aging Temp. : – Aging Time : –Irradiation Temp. : 288°C Fluence : 2.0 x 10²¹ n/cm2
Thickness : 6.50 mm Net Thickness : 5.85 mmWidth : 12.00 mm Flow Stress : 794.0 MPaModulus E : 175 GPa Effective Flow Stress : 566.8 MPaInitial Crack : 7.38 mm Init. a/W : 0.61 (Measured)Final Crack : 9.20 mm Final a/W : 0.77 (Measured)Final Crack : 9.13 mm Final a/W : 0.76 (Compliance)
Load Deflection Unloading Compliance DC Potential MethodNo. (kN) (mm) J (kJ/m2) Da (mm) J (kJ/m2) Da (mm)
0 0.089 0.0001 0.621 0.040 1.1 -0.2542 0.930 0.061 2.1 -0.0113 1.251 0.082 4.3 0.0474 1.586 0.106 7.3 -0.0345 1.911 0.129 10.3 -0.0786 2.234 0.156 14.3 -0.1037 2.543 0.182 19.2 -0.3818 2.839 0.210 23.2 -0.3889 3.108 0.240 29.1 -0.25310 3.352 0.273 35.0 -0.17611 3.540 0.310 42.9 -0.09012 3.668 0.350 52.3 -0.04413 3.718 0.397 64.4 0.03814 3.691 0.449 78.8 0.00315 3.627 0.504 96.1 0.00616 3.546 0.558 110.7 0.07217 3.412 0.668 140.4 0.10218 3.232 0.781 168.7 0.16819 3.070 0.893 190.6 0.31120 2.926 1.004 212.8 0.38721 2.746 1.118 228.3 0.57522 2.569 1.232 239.9 0.76223 2.426 1.343 248.2 0.95624 2.294 1.453 256.6 1.12225 2.166 1.564 269.5 1.23026 2.073 1.672 280.5 1.35127 1.963 1.780 297.9 1.44528 1.871 1.889 306.0 1.52329 1.795 1.997 318.9 1.59930 1.700 2.105 329.9 1.68031 1.625 2.212 340.0 1.757
Power–Law Fit J = C(DDDDa)n
Unloading Compliance JIc : 188 kJ/m2 (15 Data)Coeff. C : 268 kJ/m2 Exponent n : 0.28 Fit Coeff. R : 0.967DC Potential Method (information could not be determined)

78
0.0
1.0
2.0
3.0
4.0
5.0
0 0.5 1 1.5 2 2.5 3
Measured ExtensionLoading–Pin Displacement
Load
(kN
)
Displacement (mm)
Test JR-32288°C
Specimen C19-C
2 x 10²¹ n cm-2
Figure A-16.1 Load-vs.-loadline displacement curve for specimenC19–C of irradiated Type 304 SS tested at 288°C
Figure A-16.2 Fracture surface of specimen C19–C tested at 288°C

79
Table A-17. Test data for specimen C16–A of irradiated Type 316 SS tested at 288°C
Test Number : JR–26 Test Temp. : 288°CMaterial Type : Type 316 SS Heat Number : C16Aging Temp. : – Aging Time : –Irradiation Temp. : 288°C Fluence : 0.9 x 10²¹ n/cm2
Thickness : 6.50 mm Net Thickness : 5.85 mmWidth : 12.00 mm Flow Stress : 590.0 MPaModulus E : 175 GPa Effective Flow Stress : 463.0 MPaInitial Crack : 7.28 mm Init. a/W : 0.61 (Measured)Final Crack : 8.73 mm Final a/W : 0.73 (Measured)Final Crack : 8.36 mm Final a/W : 0.70 (Compliance)
Load Deflection Unloading Compliance DC Potential MethodNo. (kN) (mm) J (kJ/m2) Da (mm) J (kJ/m2) Da (mm)
0 0.089 0.0001 2.527 0.212 33.3 0.054 26.6 0.0152 2.702 0.275 42.4 0.066 39.8 0.0193 2.755 0.347 59.3 0.004 55.6 0.0264 2.785 0.421 74.5 0.024 72.0 0.0335 2.807 0.496 89.8 0.097 88.7 0.0396 2.810 0.572 106.4 0.099 105.4 0.0477 2.812 0.649 123.1 0.136 122.8 0.0548 2.821 0.725 141.0 0.117 139.8 0.0629 2.832 0.801 159.6 0.097 156.9 0.07010 2.818 0.880 176.6 0.126 174.5 0.07711 2.823 0.955 191.1 0.184 191.4 0.08412 2.821 1.031 207.2 0.202 208.3 0.09113 2.800 1.136 230.7 0.217 230.0 0.13914 2.805 1.236 255.9 0.189 249.9 0.18315 2.784 1.338 279.1 0.198 269.6 0.23416 2.785 1.441 294.0 0.310 289.0 0.29017 2.770 1.544 313.2 0.356 307.9 0.34618 2.745 1.647 343.0 0.293 327.1 0.39719 2.720 1.751 354.0 0.430 345.8 0.45620 2.693 1.853 378.8 0.410 363.3 0.51521 2.655 1.957 402.9 0.413 380.8 0.57622 2.619 2.063 414.2 0.521 398.1 0.63823 2.573 2.169 430.2 0.580 414.7 0.70324 2.539 2.273 455.9 0.561 430.3 0.76725 2.512 2.378 479.9 0.561 445.4 0.83426 2.480 2.482 498.3 0.595 461.4 0.88827 2.444 2.588 513.3 0.648 477.9 0.94128 2.393 2.693 512.5 0.796 493.9 0.99429 2.351 2.797 532.4 0.807 506.3 1.05130 2.292 2.904 550.9 0.836 521.0 1.11131 2.230 3.010 560.4 0.911 532.4 1.18832 2.180 3.117 568.0 0.989 543.1 1.26033 2.128 3.223 584.6 1.016 554.5 1.32534 2.081 3.328 596.2 1.068 565.4 1.39035 2.040 3.429 613.3 1.086 575.4 1.453
Power–Law Fit J = C(DDDDa)n
Unloading Compliance JIc : 353 kJ/m2 (12 Data)Coeff. C : 607 kJ/m2 Exponent n : 0.52 Fit Coeff. R : 0.848DC Potential Method JIc : 299 kJ/m2 (14 Data)Coeff. C : 490 kJ/m2 Exponent n : 0.45 Fit Coeff. R : 0.997

80
0.0
0.5
1.0
1.5
2.0
2.5
3.0
3.5
4.0
0 0.5 1 1.5 2 2.5 3 3.5 4
Measured ExtensionLoading–Pin Displacement
Load
(kN
)
Displacement (mm)
Test JRI-26288°C
Specimen C16–A
0.9 x 10²¹ n cm-2
Figure A-17.1 Load-vs.-loadline displacement curve for specimenC16–A of irradiated Type 316 SS tested at 288°C
Figure A-17.2 Fracture surface of specimen C16–A tested at 288°C

81
Table A-18. Test data for specimen L20–A of irradiated Type 304 SS tested at 288°C
Test Number : JR–22 Test Temp. : 288°CMaterial Type : Type 304 SS Heat Number : L20Aging Temp. : – Aging Time : –Irradiation Temp. : 288°C Fluence : 0.3 x 10²¹ n/cm2
Thickness : 6.50 mm Net Thickness : 5.85 mmWidth : 2.00 mm Flow Stress : 270.5 MPaModulus E : 175 GPaInitial Crack : 7.38 mm Init. a/W : 0.61 (Measured)Final Crack : 9.17 mm Final a/W : 0.76 (Measured)Final Crack : 8.08 mm Final a/W : 0.75 (Compliance)
Load Deflection Unloading Compliance DC Potential MethodNo. (kN) (mm) J (kJ/m2) Da (mm) J (kJ/m2) Da (mm)
0 0.089 0.0001 1.300 0.080 6.5 0.237 6.5 0.0062 1.453 0.169 18.9 0.152 17.1 0.0163 1.529 0.265 30.2 0.155 29.3 0.0284 1.596 0.361 43.7 0.126 41.9 0.0405 1.648 0.459 58.7 0.041 55.2 0.0546 1.685 0.556 72.5 0.015 68.9 0.0677 1.717 0.656 87.4 0.027 83.2 0.0808 1.741 0.756 101.7 0.040 97.7 0.0939 1.754 0.857 117.1 0.027 112.4 0.10710 1.769 0.958 130.1 0.082 127.1 0.11911 1.774 1.059 144.7 0.101 142.1 0.13212 1.780 1.160 159.9 0.104 157.0 0.14613 1.775 1.275 176.7 0.120 171.1 0.23414 1.759 1.379 191.6 0.136 181.6 0.33915 1.734 1.482 203.5 0.200 192.3 0.43216 1.708 1.586 214.2 0.277 201.9 0.54217 1.692 1.688 227.3 0.310 211.0 0.65118 1.666 1.793 238.6 0.372 220.9 0.74719 1.619 1.898 243.2 0.518 230.0 0.85020 1.580 2.001 252.5 0.593 237.2 0.97321 1.544 2.105 260.8 0.676 244.9 1.07522 1.504 2.209 265.5 0.798 253.0 1.17323 1.461 2.315 275.3 0.859 259.4 1.28924 1.411 2.470 283.6 1.006 270.8 1.42925 1.353 2.627 292.9 1.132 280.0 1.57726 1.280 2.785 299.8 1.271 286.5 1.74127 1.219 2.942 304.8 1.417 292.3 1.893
Power–Law Fit J = C(DDDDa)n
Unloading Compliance JIc : 237 kJ/m2 (13 Data)Coeff. C : 283 kJ/m2 Exponent n : 0.20 Fit Coeff. R : 0.988DC Potential Method JIc : 186 kJ/m2 (15 Data)Coeff. C : 243 kJ/m2 Exponent n : 0.27 Fit Coeff. R : 0.996

82
0.0
0.5
1.0
1.5
2.0
2.5
3.0
0 0.5 1 1.5 2 2.5 3 3.5 4
Measured ExtensionLoading–Pin Displacement
Load
(kN
)
Displacement (mm)
Test JR-20288°C
Specimen L2-CNonirradiated
Figure A-18.1. Load-vs.-loadline displacement curve for specimenL20–A of irradiated Type 304 SS tested at 288°C
Figure A-18.2. Fracture surface of specimen L20–A tested at 288°C

83
Table A-19. Test data for specimen L20–B of irradiated Type 304 SS tested at 288°C
Test Number : JR–24 Test Temp. : 288°CMaterial Type : Type 304 SS Heat Number : L20Aging Temp. : – Aging Time : –Irradiation Temp. : 288°C Fluence : 0.9 x 10²¹ n/cm2
Thickness : 6.51 mm Net Thickness : 5.84 mmWidth : 11.98 mm Flow Stress : 270.5 MPaModulus E : 175 GPaInitial Crack : 7.38 mm Init. a/W : 0.61 (Measured)Final Crack : 9.17 mm Final a/W : 0.76 (Measured)Final Crack : 8.08 mm Final a/W : 0.75 (Compliance)
Load Deflection Unloading Compliance DC Potential MethodNo. (kN) (mm) J (kJ/m2) Da (mm) J (kJ/m2) Da (mm)
0 0.089 0.0001 1.300 0.080 6.5 0.237 6.5 0.0062 1.453 0.169 18.9 0.152 17.1 0.0163 1.529 0.265 30.2 0.155 29.3 0.0284 1.596 0.361 43.7 0.126 41.9 0.0405 1.648 0.459 58.7 0.041 55.2 0.0546 1.685 0.556 72.5 0.015 68.9 0.0677 1.717 0.656 87.4 0.027 83.2 0.0808 1.741 0.756 101.7 0.040 97.7 0.0939 1.754 0.857 117.1 0.027 112.4 0.10710 1.769 0.958 130.1 0.082 127.1 0.11911 1.774 1.059 144.7 0.101 142.1 0.13212 1.780 1.160 159.9 0.104 157.0 0.14613 1.775 1.275 176.7 0.120 171.1 0.23414 1.759 1.379 191.6 0.136 181.6 0.33915 1.734 1.482 203.5 0.200 192.3 0.43216 1.708 1.586 214.2 0.277 201.9 0.54217 1.692 1.688 227.3 0.310 211.0 0.65118 1.666 1.793 238.6 0.372 220.9 0.74719 1.619 1.898 243.2 0.518 230.0 0.85020 1.580 2.001 252.5 0.593 237.2 0.97321 1.544 2.105 260.8 0.676 244.9 1.07522 1.504 2.209 265.5 0.798 253.0 1.17323 1.461 2.315 275.3 0.859 259.4 1.28924 1.411 2.470 283.6 1.006 270.8 1.42925 1.353 2.627 292.9 1.132 280.0 1.57726 1.280 2.785 299.8 1.271 286.5 1.74127 1.219 2.942 304.8 1.417 292.3 1.893
Power–Law Fit J = C(DDDDa)n
Unloading Compliance JIc : 237 kJ/m2 (13 Data)Coeff. C : 283 kJ/m2 Exponent n : 0.20 Fit Coeff. R : 0.988DC Potential Method JIc : 186 kJ/m2 (15 Data)Coeff. C : 243 kJ/m2 Exponent n : 0.27 Fit Coeff. R : 0.996
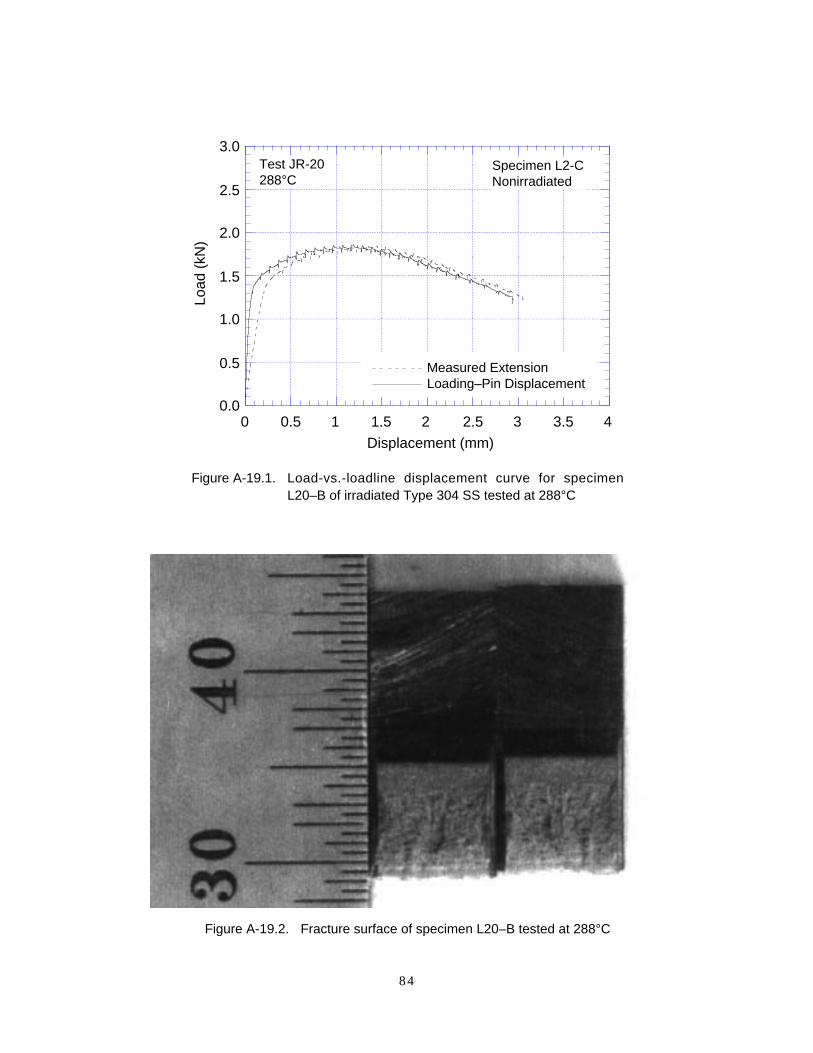
84
0.0
0.5
1.0
1.5
2.0
2.5
3.0
0 0.5 1 1.5 2 2.5 3 3.5 4
Measured ExtensionLoading–Pin Displacement
Load
(kN
)
Displacement (mm)
Test JR-20288°C
Specimen L2-CNonirradiated
Figure A-19.1. Load-vs.-loadline displacement curve for specimenL20–B of irradiated Type 304 SS tested at 288°C
Figure A-19.2. Fracture surface of specimen L20–B tested at 288°C

85
Table A-20. Test data for specimen L2–A of irradiated Type 304 SS tested at 288°C
Test Number : JR–25 Test Temp. : 288°CMaterial Type : Type 304 SS Heat Number : L2Aging Temp. : – Aging Time : –Irradiation Temp. : 288°C Fluence : 0.9 x 10²¹ n/cm2
Thickness : 6.51 mm Net Thickness : 5.84 mmWidth : 11.98 mm Flow Stress : 270.5 MPaModulus E : 175 GPaInitial Crack : 7.38 mm Init. a/W : 0.61 (Measured)Final Crack : 9.17 mm Final a/W : 0.76 (Measured)Final Crack : 8.08 mm Final a/W : 0.75 (Compliance)
Load Deflection Unloading Compliance DC Potential MethodNo. (kN) (mm) J (kJ/m2) Da (mm) J (kJ/m2) Da (mm)
0 0.089 0.0001 1.300 0.080 6.5 0.237 6.5 0.0062 1.453 0.169 18.9 0.152 17.1 0.0163 1.529 0.265 30.2 0.155 29.3 0.0284 1.596 0.361 43.7 0.126 41.9 0.0405 1.648 0.459 58.7 0.041 55.2 0.0546 1.685 0.556 72.5 0.015 68.9 0.0677 1.717 0.656 87.4 0.027 83.2 0.0808 1.741 0.756 101.7 0.040 97.7 0.0939 1.754 0.857 117.1 0.027 112.4 0.10710 1.769 0.958 130.1 0.082 127.1 0.11911 1.774 1.059 144.7 0.101 142.1 0.13212 1.780 1.160 159.9 0.104 157.0 0.14613 1.775 1.275 176.7 0.120 171.1 0.23414 1.759 1.379 191.6 0.136 181.6 0.33915 1.734 1.482 203.5 0.200 192.3 0.43216 1.708 1.586 214.2 0.277 201.9 0.54217 1.692 1.688 227.3 0.310 211.0 0.65118 1.666 1.793 238.6 0.372 220.9 0.74719 1.619 1.898 243.2 0.518 230.0 0.85020 1.580 2.001 252.5 0.593 237.2 0.97321 1.544 2.105 260.8 0.676 244.9 1.07522 1.504 2.209 265.5 0.798 253.0 1.17323 1.461 2.315 275.3 0.859 259.4 1.28924 1.411 2.470 283.6 1.006 270.8 1.42925 1.353 2.627 292.9 1.132 280.0 1.57726 1.280 2.785 299.8 1.271 286.5 1.74127 1.219 2.942 304.8 1.417 292.3 1.893
Power–Law Fit J = C(DDDDa)n
Unloading Compliance JIc : 237 kJ/m2 (13 Data)Coeff. C : 283 kJ/m2 Exponent n : 0.20 Fit Coeff. R : 0.988DC Potential Method JIc : 186 kJ/m2 (15 Data)Coeff. C : 243 kJ/m2 Exponent n : 0.27 Fit Coeff. R : 0.996

86
0.0
0.5
1.0
1.5
2.0
2.5
3.0
0 0.5 1 1.5 2 2.5 3 3.5 4
Measured ExtensionLoading–Pin Displacement
Load
(kN
)
Displacement (mm)
Test JR-20288°C
Specimen L2-CNonirradiated
Figure A-20.1. Load-vs.-loadline displacement curve for specimen L2–Aof irradiated Type 304 SS tested at 288°C
Figure A-20.2. Fracture surface of specimen L2–A tested at 288°C

NRC FORM 335(2–89)NRCM 1102,3201, 3202
U. S. NUCLEAR REGULATORY COMMISSION
BIBLIOGRAPHIC DATA SHEET(See instructions on the reverse)
2. TITLE AND SUBTITLE
1. REPORT NUMBER (Assigned by NRC. Add Vol., Supp., Rev., and Addendum Numbers, if any.)
NUREG/CR–6826ANL–03/22
3. DATE REPORT PUBLISHED
MONTH YEAR
August 2003
4. FIN OR GRANT NUMBER
Fracture Toughness and Crack Growth Rates of Irradiated
Austenitic Stainless Steels
Y6388
5. AUTHOR(S) 6. TYPE OF REPORT
Technical
7. PERIOD COVERED (Inclusive Dates)
O. K. Chopra, E. E. Gruber, and W. J. Shack
8. PERFORMING ORGANIZATION – NAME AND ADDRESS (If NRC, provide Division, Office or Region, U.S. Nuclear Regulatory Commission, and mailing address; ifcontractor, provide name and mailing address.)
Argonne National Laboratory9700 South Cass AvenueArgonne, IL 60439
9. SPONSORING ORGANIZATION – NAME AND ADDRESS (If NRC, type “Same as above”: if contractor, provide NRC Division, Office or Region, U.S. NuclearRegulatory Commission, and mailing address.)
Division of Engineering TechnologyOffice of Nuclear Regulatory ResearchU.S. Nuclear Regulatory CommissionWashington, DC 20555–0001
10. SUPPLEMENTARY NOTES
William H. Cullen, Jr., and Carol E. Moyer, NRC Project Managers
11. ABSTRACT (200 words or less)
Austenitic stainless steels (SSs) are used extensively as structural alloys in the internal components of reactor pressure
vessels because of their superior fracture toughness properties. However, exposure to high levels of neutron irradiation for
extended periods leads to significant reduction in the fracture resistance of these steels. Experimental data are presented on
fracture toughness and crack growth rates (CGRs) of austenitic SSs irradiated to fluence levels up to 2.0 x 10²¹ n/cm2 (E > 1
MeV) (ª3.0 dpa) at ª288°C. Crack growth tests were conducted under cycling loading and long hold time trapezoidal loading
in simulated boiling water reactor (BWR) environments, and fracture toughness tests were conducted in air. Neutron
irradiation at 288°C decreases the fracture toughness of the steels; the data from commercial heats fall within the scatter
band for the data obtained at higher temperatures. In addition, the results indicate significant enhancement of CGRs of the
irradiated steels in normal water chemistry BWR environment; the CGRs for irradiated steels are a factor of ª5 higher than
the disposition curve proposed for sensitized austenitic SSs. The rates decreased by more than an order of magnitude in
low–dissolved–oxygen BWR environment.
12. KEY WORDS/DESCRIPTORS (List words or phrases that will assist researchers in locating this report.) 13. AVAILABILITY STATEMENT
Unlimited14. SECURITY CLASSIFICATION
(This Page)
Unclassified
(This Report)
Unclassified15. NUMBER OF PAGES
Fracture Toughness
J–R Curve
Crack Growth Rate
Neutron Irradiation
BWR Environment
Dissolved Oxygen
Austenitic Stainless Steels16.ICE PR
NRC FORM 335 (2–89)