size effect in compression fracture: splitting crack band propagation
Fracture and Crack Propagation in Weldments.
A Fracture Mechanics PerspectiveA Fracture Mechanics Perspective
Uwe Zerbst, BAM Berlin
Outline
� Specific aspects of weldments
� Determination of fracture toughness
� Determination of the crack driving force
� Shallow crack propagation and fatigue strength� Shallow crack propagation and fatigue strength
Outline
���� Specific aspects of weldments
� Determination of fracture toughness
� Determination of the crack driving force
� Shallow crack propagation and fatigue strength� Shallow crack propagation and fatigue strength

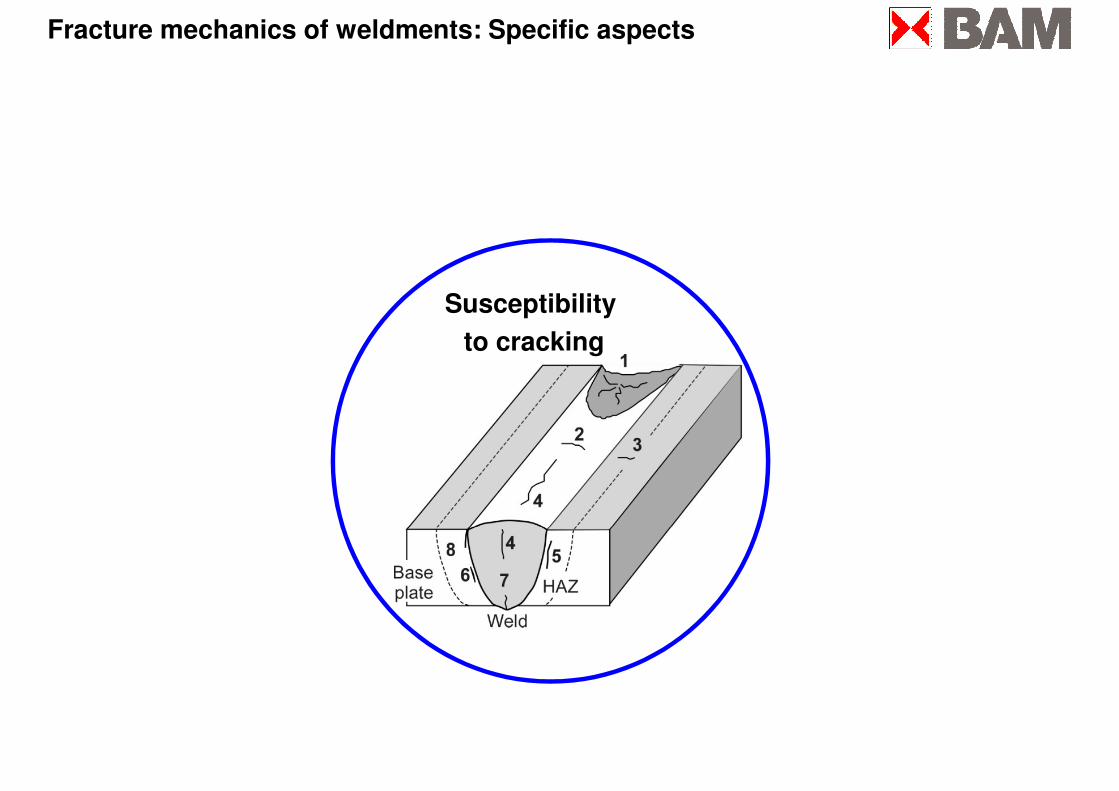
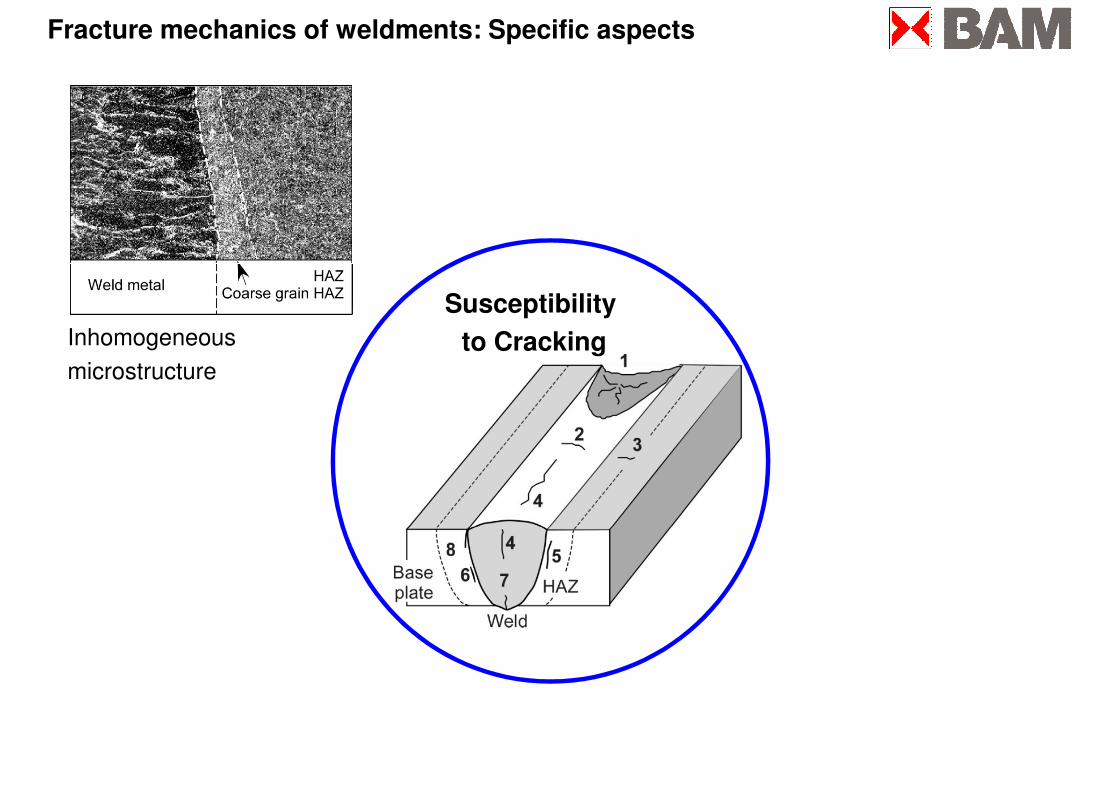
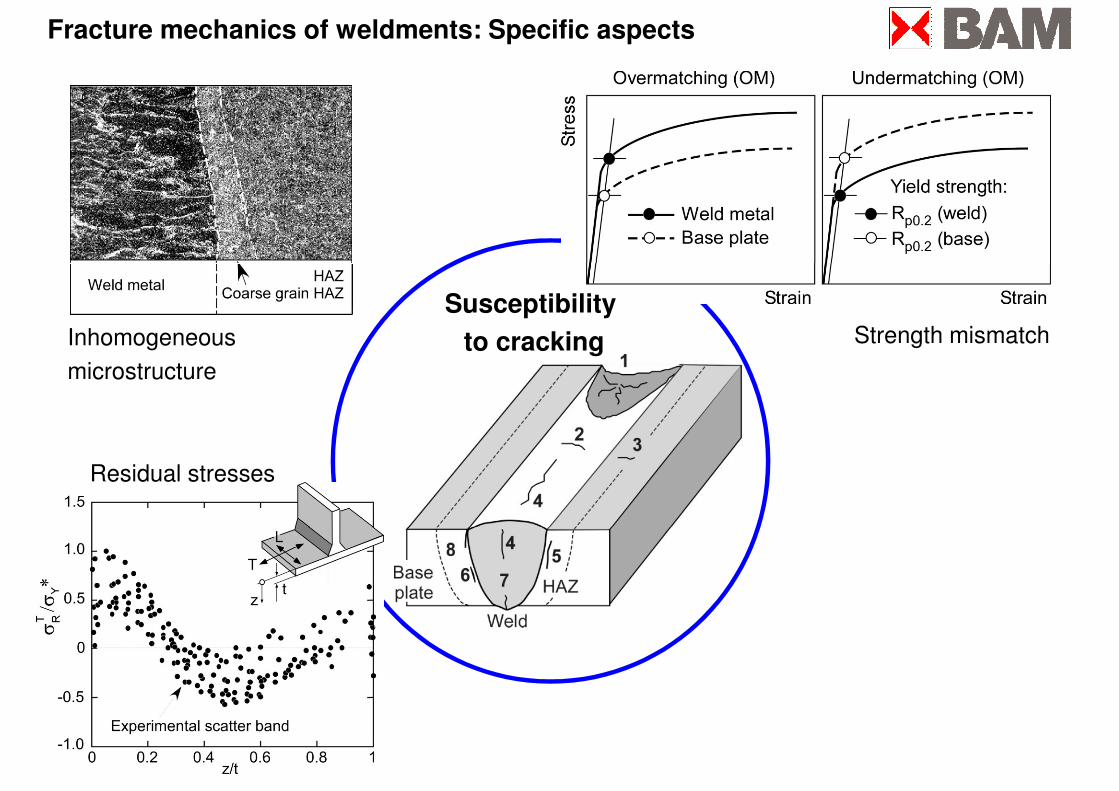
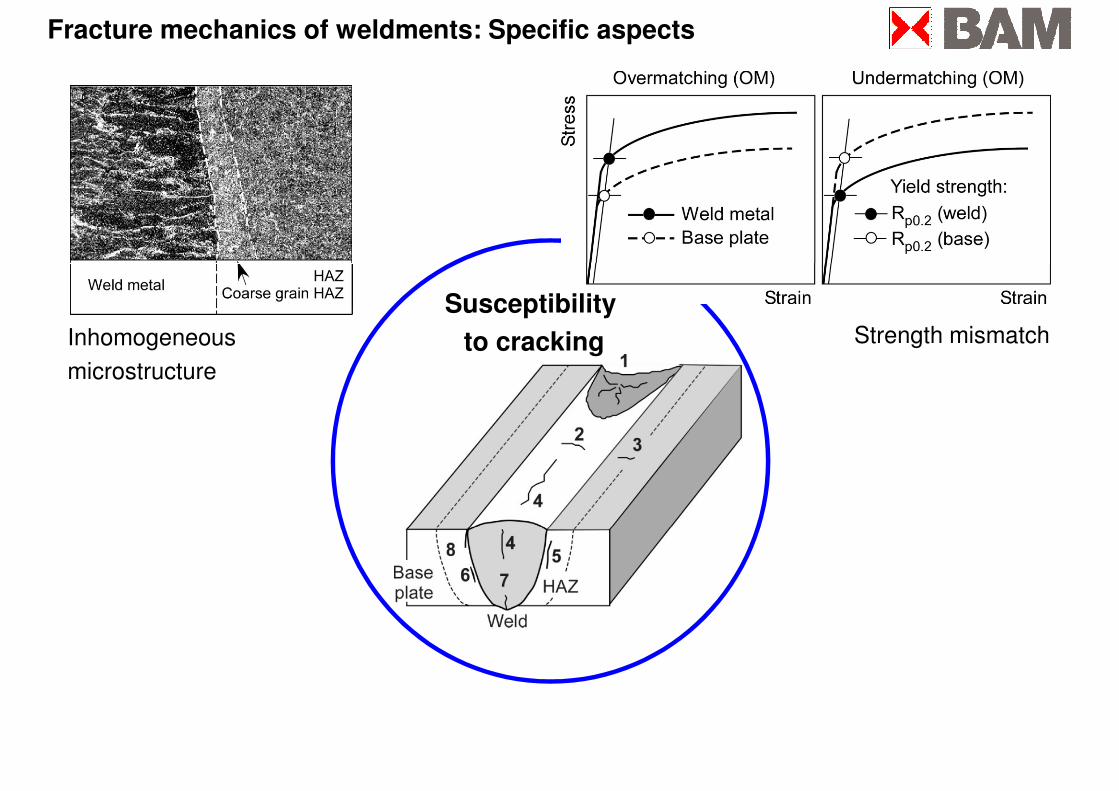
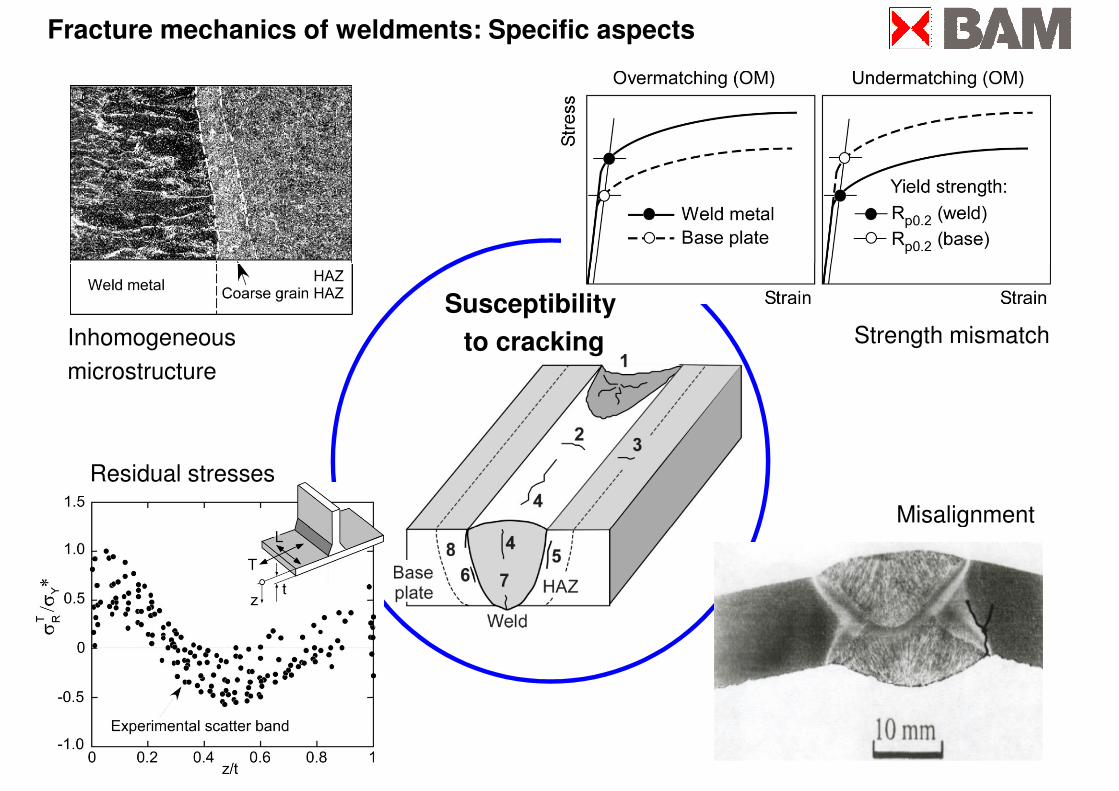
Fracture mechanics of weldments: Specific aspects
Inhomogeneous
microstructure
Residual stresses
Misalignment
Strength mismatch
Susceptibility
to cracking
Misalignment
Fracture mechanics of weldments: Specific aspects
Susceptibility
to cracking
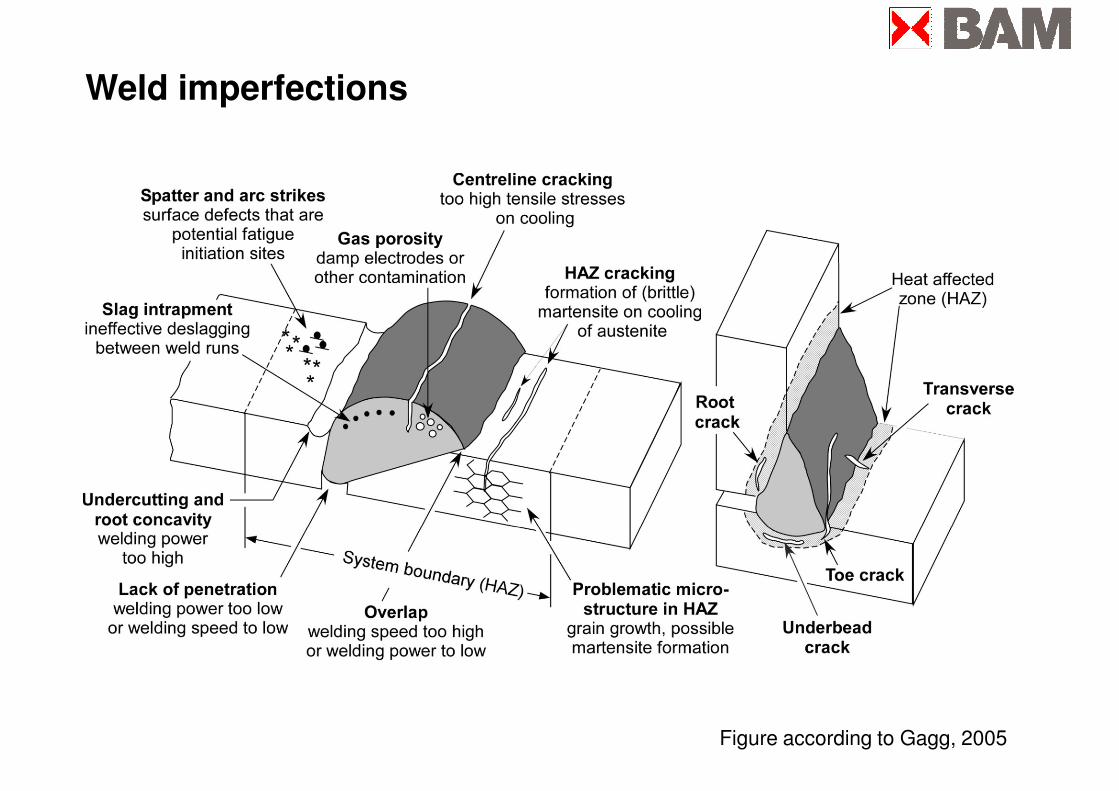
Weld imperfections
Figure according to Gagg, 2005
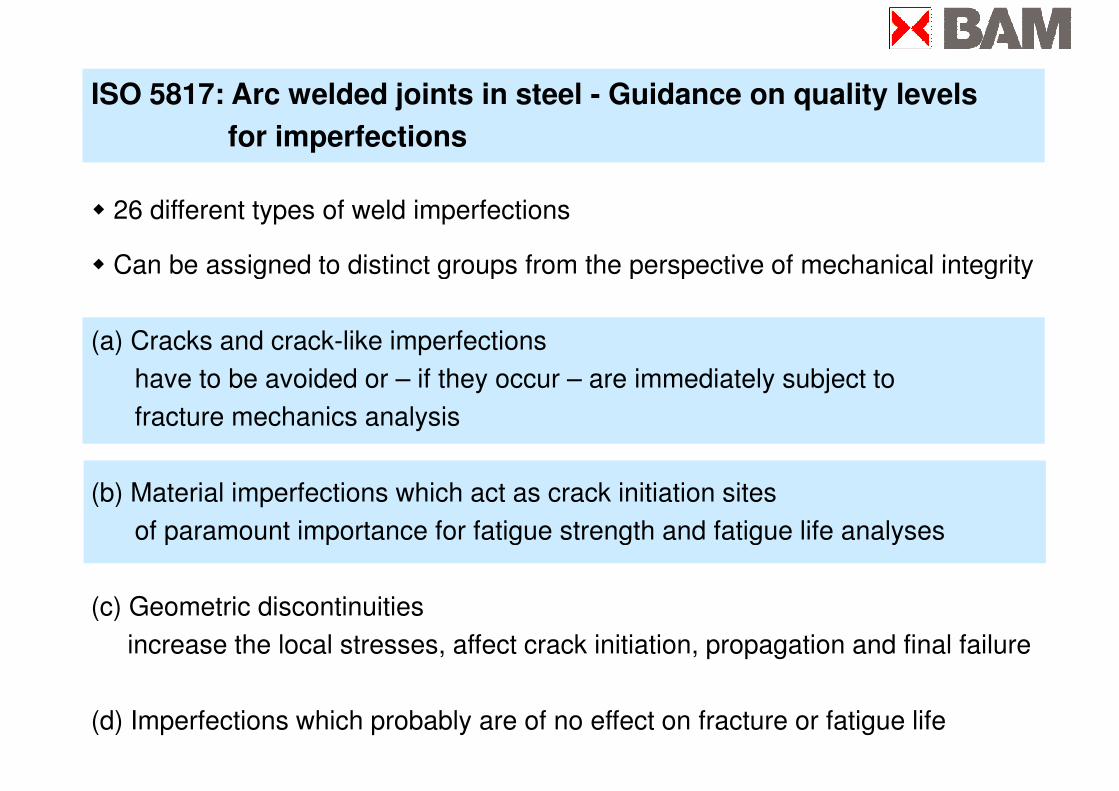
ISO 5817: Arc welded joints in steel - Guidance on quality levels
for imperfections
� 26 different types of weld imperfections
� Can be assigned to distinct groups from the perspective of mechanical integrity� Can be assigned to distinct groups from the perspective of mechanical integrity
(a) Cracks and crack-like imperfections
have to be avoided or – if they occur – are immediately subject to
fracture mechanics analysis
(b) Material imperfections which act as crack initiation sites
of paramount importance for fatigue strength and fatigue life analysesof paramount importance for fatigue strength and fatigue life analyses
(c) Geometric discontinuities
increase the local stresses, affect crack initiation, propagation and final failure
(d) Imperfections which probably are of no effect on fracture or fatigue life
Fracture mechanics of weldments: Specific aspects
Inhomogeneous
microstructure
Susceptibility
to Cracking
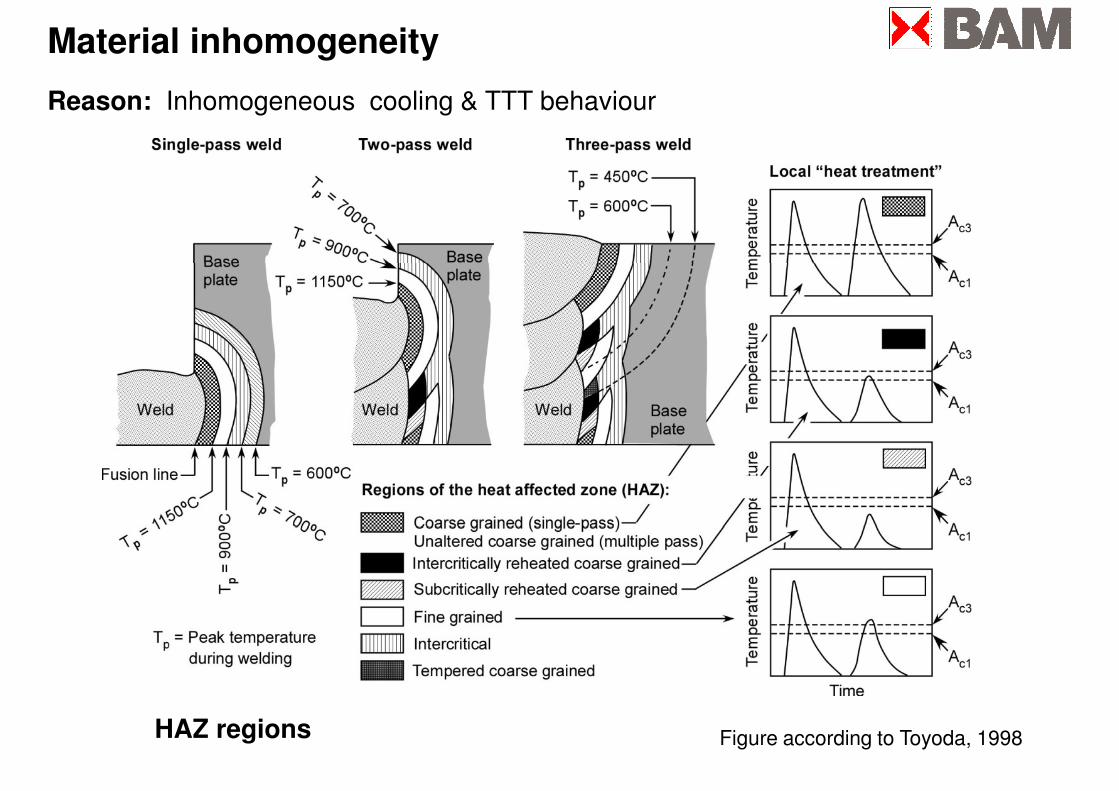
Material inhomogeneity
Reason: Inhomogeneous cooling & TTT behaviour
Figure according to Toyoda, 1998HAZ regions
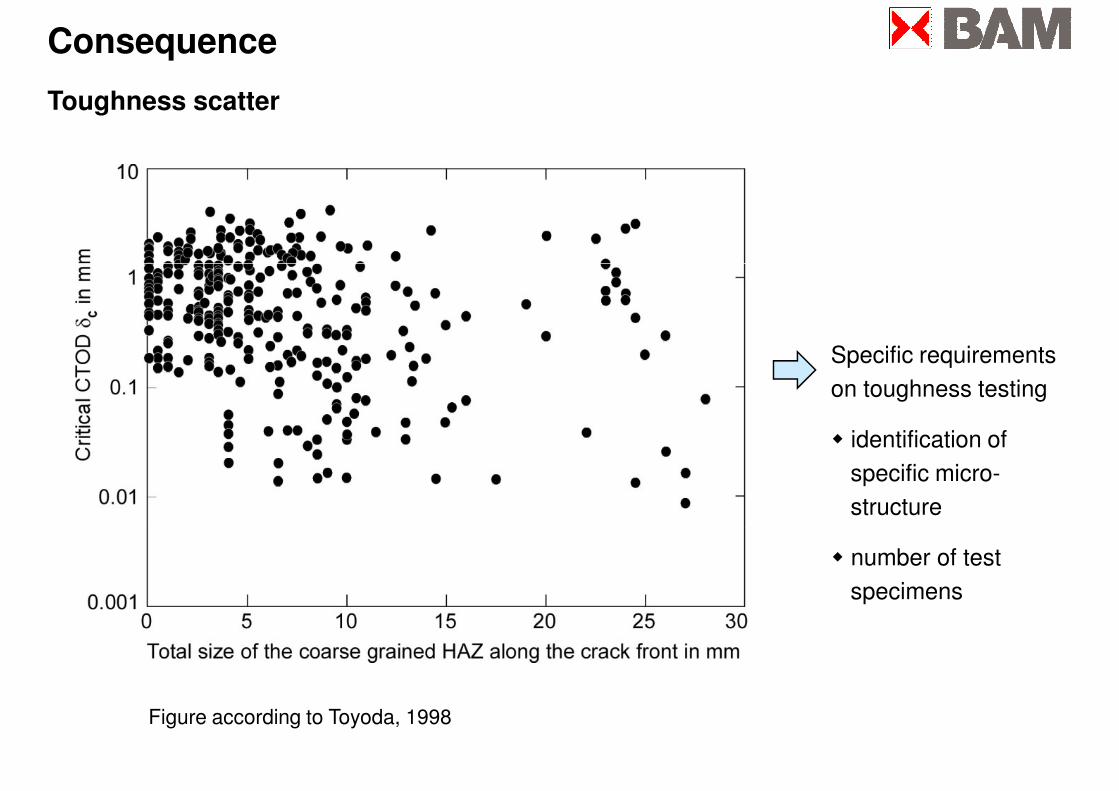
Consequence
Toughness scatter
Specific requirements
on toughness testing
� identification of
specific micro-
structure
Figure according to Toyoda, 1998
� number of test
specimens

Fracture mechanics of weldments: Specific aspects
Inhomogeneous
microstructure
Strength mismatch
Susceptibility
to cracking
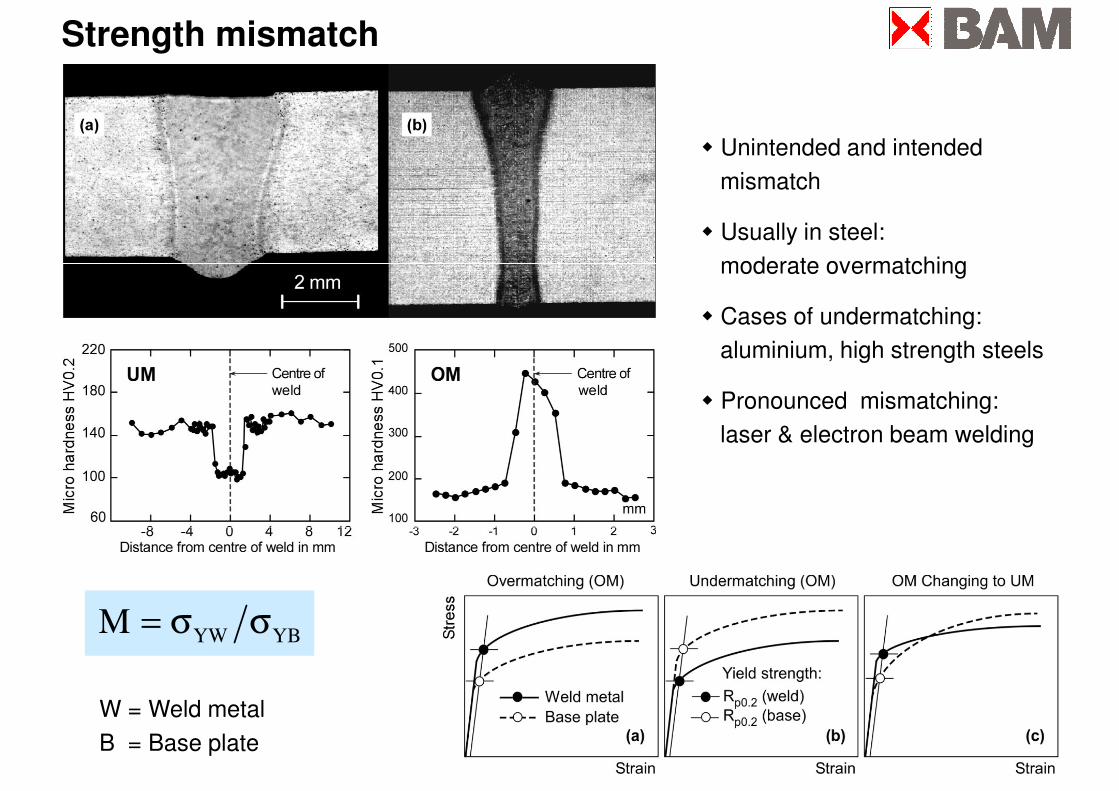
� Unintended and intended
mismatch
� Usually in steel:
moderate overmatching
Strength mismatch
moderate overmatching
� Cases of undermatching:
aluminium, high strength steels
� Pronounced mismatching:
laser & electron beam welding
YW YBM = σ σ
W = Weld metal
B = Base plate
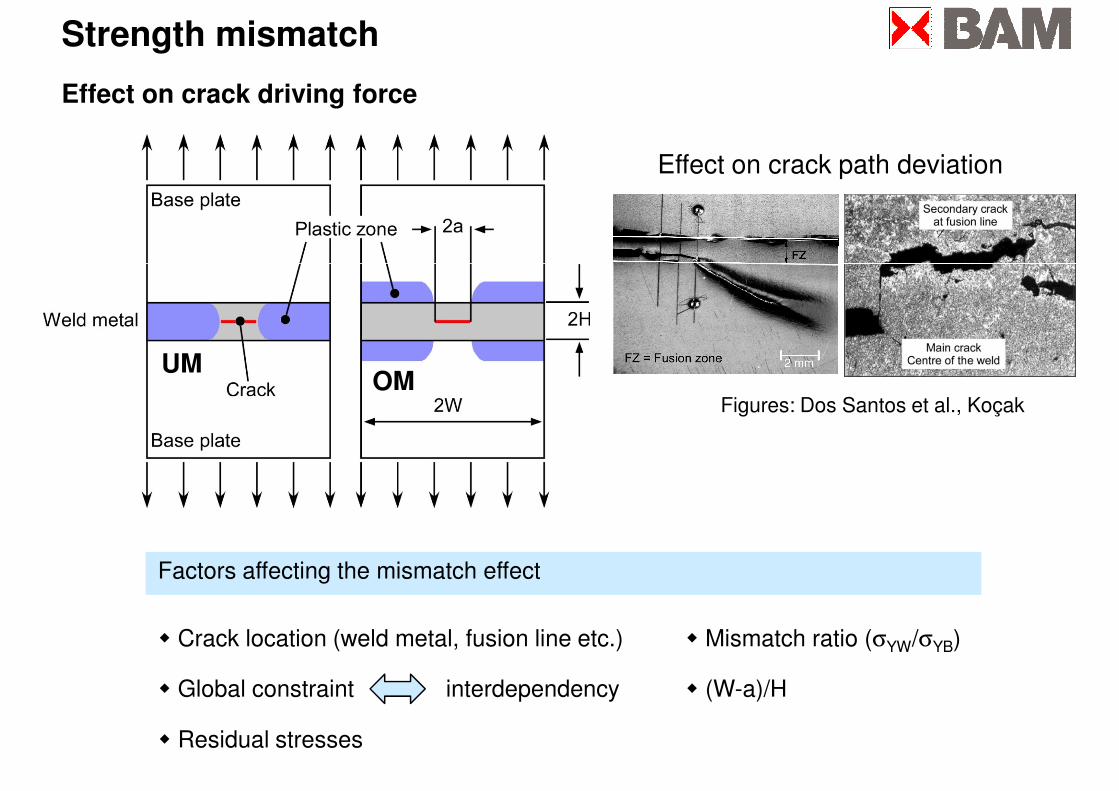
Strength mismatch
Effect on crack driving force
Effect on crack path deviation
Figures: Dos Santos et al., Koçak
UMOM
Factors affecting the mismatch effect
� Crack location (weld metal, fusion line etc.) � Mismatch ratio (σYW/σYB)
� Global constraint interdependency � (W-a)/H
� Residual stresses
Fracture mechanics of weldments: Specific aspects
Inhomogeneous
microstructure
Residual stresses
Strength mismatch
Susceptibility
to cracking
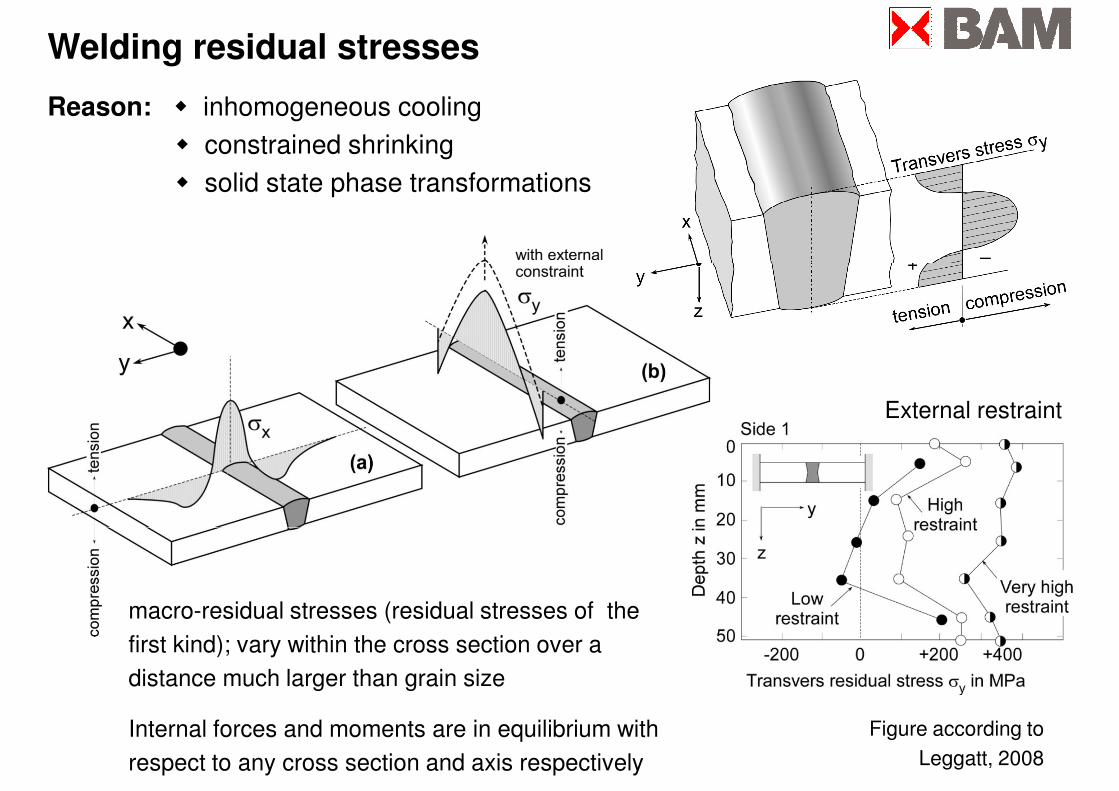
Welding residual stresses
Reason: � inhomogeneous cooling
� constrained shrinking
� solid state phase transformations
External restraint
macro-residual stresses (residual stresses of the
first kind); vary within the cross section over a
distance much larger than grain size
Internal forces and moments are in equilibrium with
respect to any cross section and axis respectively
Figure according to
Leggatt, 2008
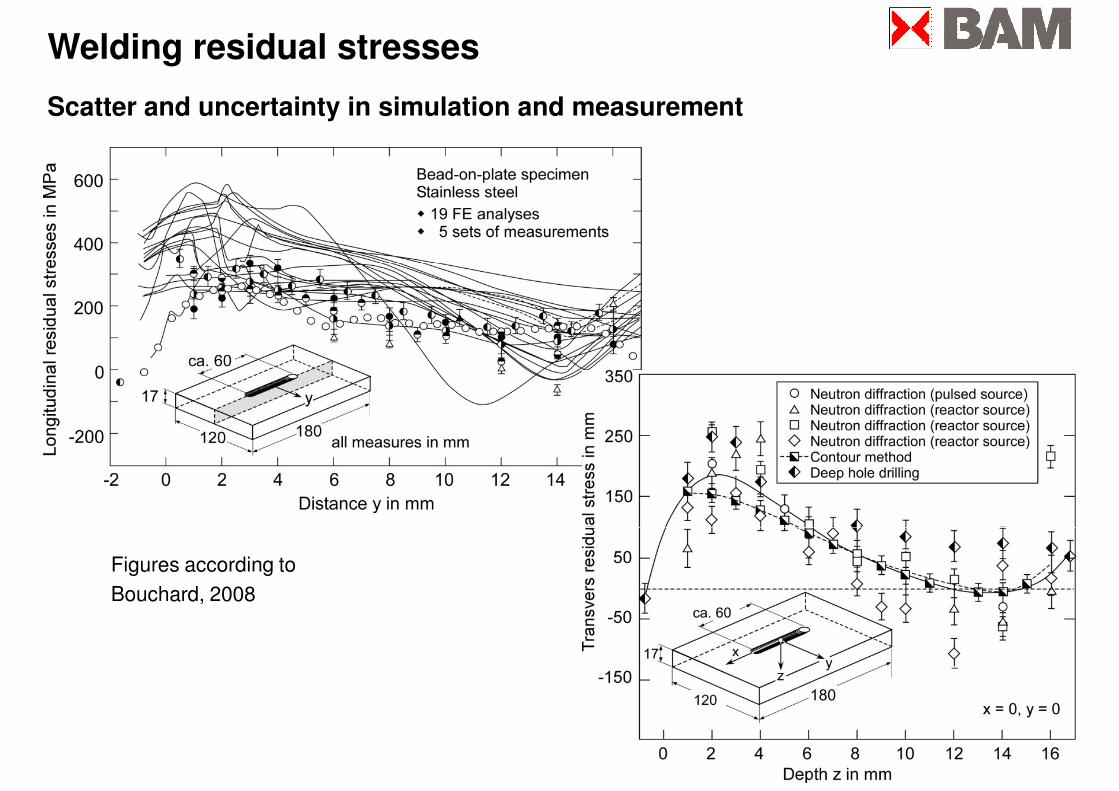
Welding residual stresses
Scatter and uncertainty in simulation and measurement
Figures according to
Bouchard, 2008
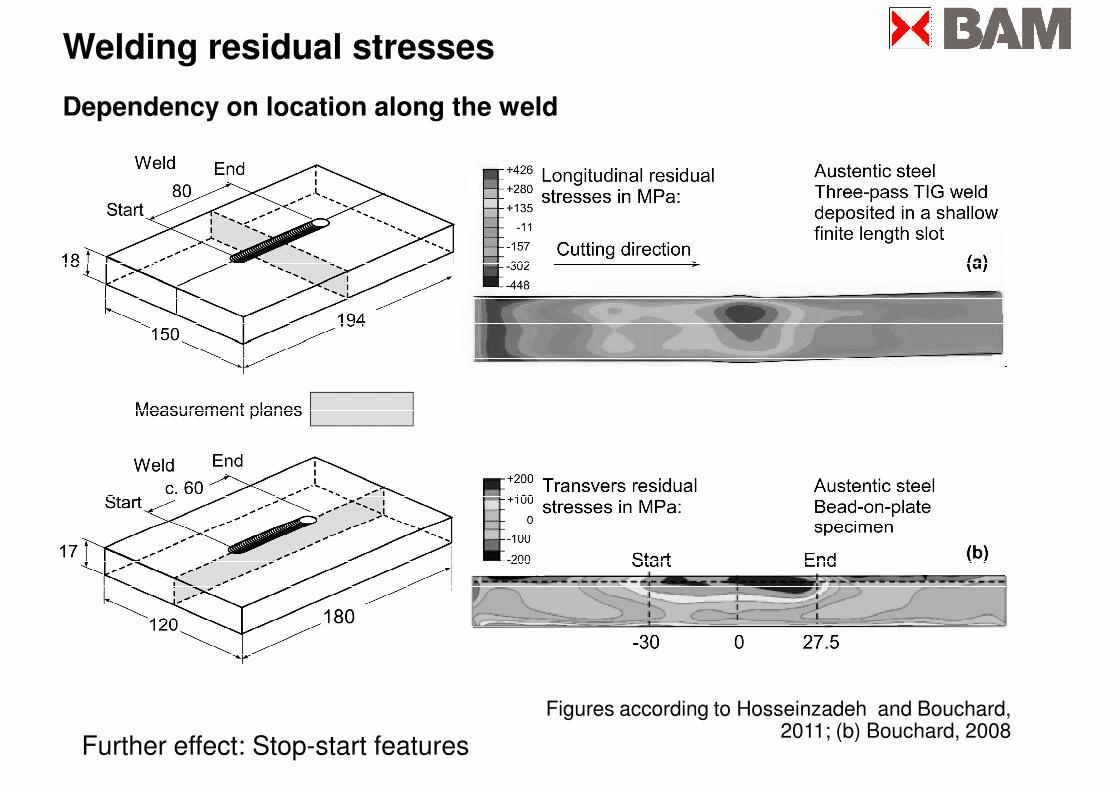
Welding residual stresses
Dependency on location along the weld
Further effect: Stop-start features
Figures according to Hosseinzadeh and Bouchard, 2011; (b) Bouchard, 2008
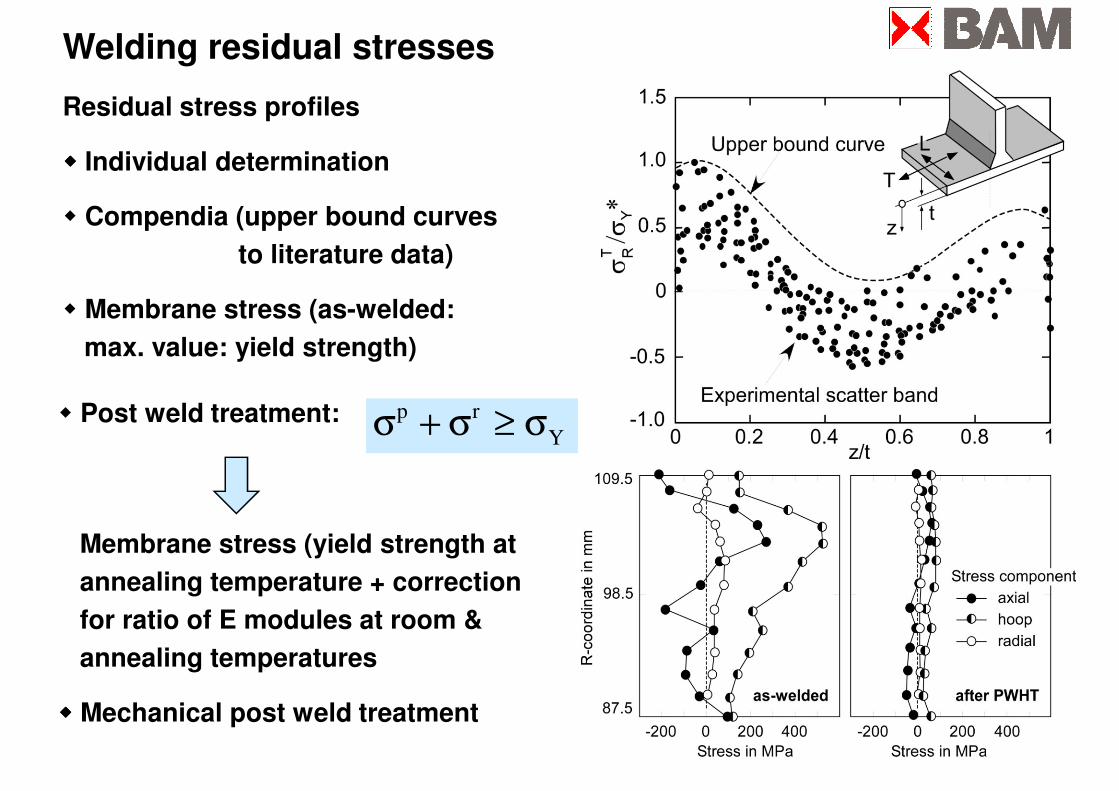
Welding residual stresses
Residual stress profiles
���� Individual determination
� Compendia (upper bound curves
to literature data)to literature data)
� Membrane stress (as-welded:
max. value: yield strength)
p r
Yσ + σ ≥ σ� Post weld treatment:
Membrane stress (yield strength at
annealing temperature + correction
for ratio of E modules at room &
annealing temperatures
���� Mechanical post weld treatment

Fracture mechanics of weldments: Specific aspects
Inhomogeneous
microstructure
Residual stresses
Misalignment
Strength mismatch
Susceptibility
to cracking
Misalignment
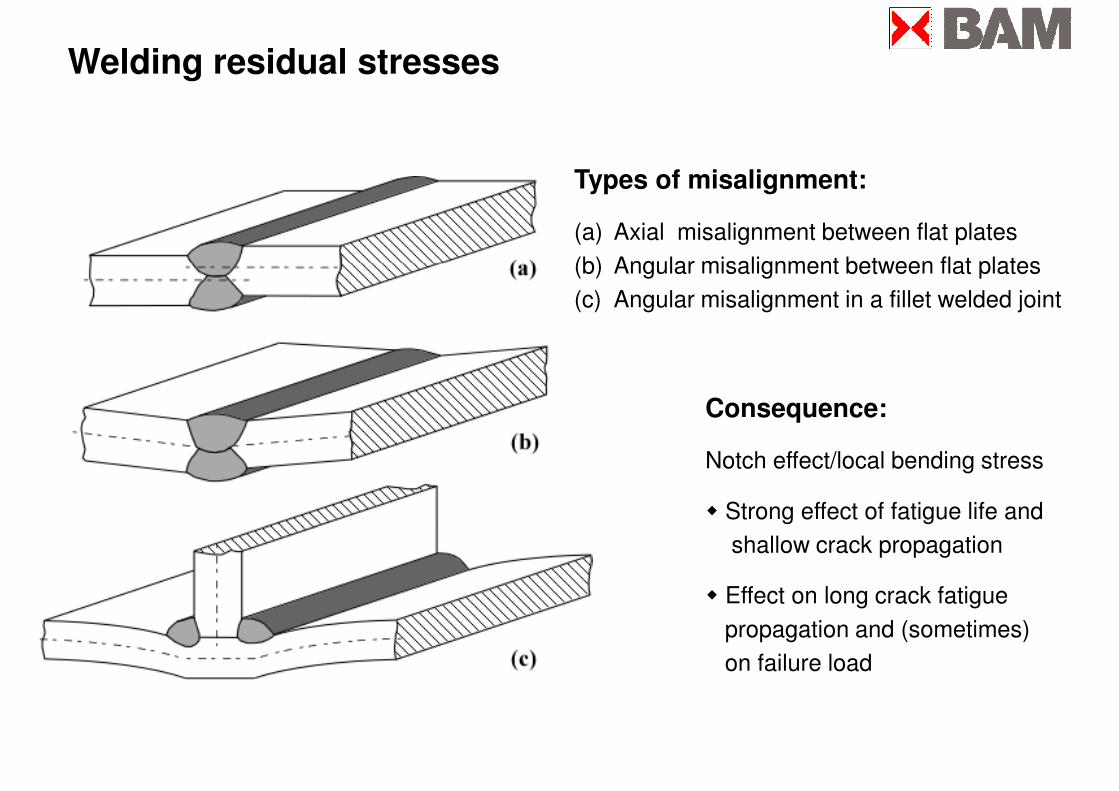
Types of misalignment:
(a) Axial misalignment between flat plates
(b) Angular misalignment between flat plates
Welding residual stresses
(b) Angular misalignment between flat plates
(c) Angular misalignment in a fillet welded joint
Consequence:
Notch effect/local bending stress
� Strong effect of fatigue life and
shallow crack propagation
� Effect on long crack fatigue
propagation and (sometimes)
on failure load
Outline
� Specific aspects of weldments
���� Determination of fracture toughness
� Determination of the crack driving force
� Shallow crack propagation and fatigue strength� Shallow crack propagation and fatigue strength
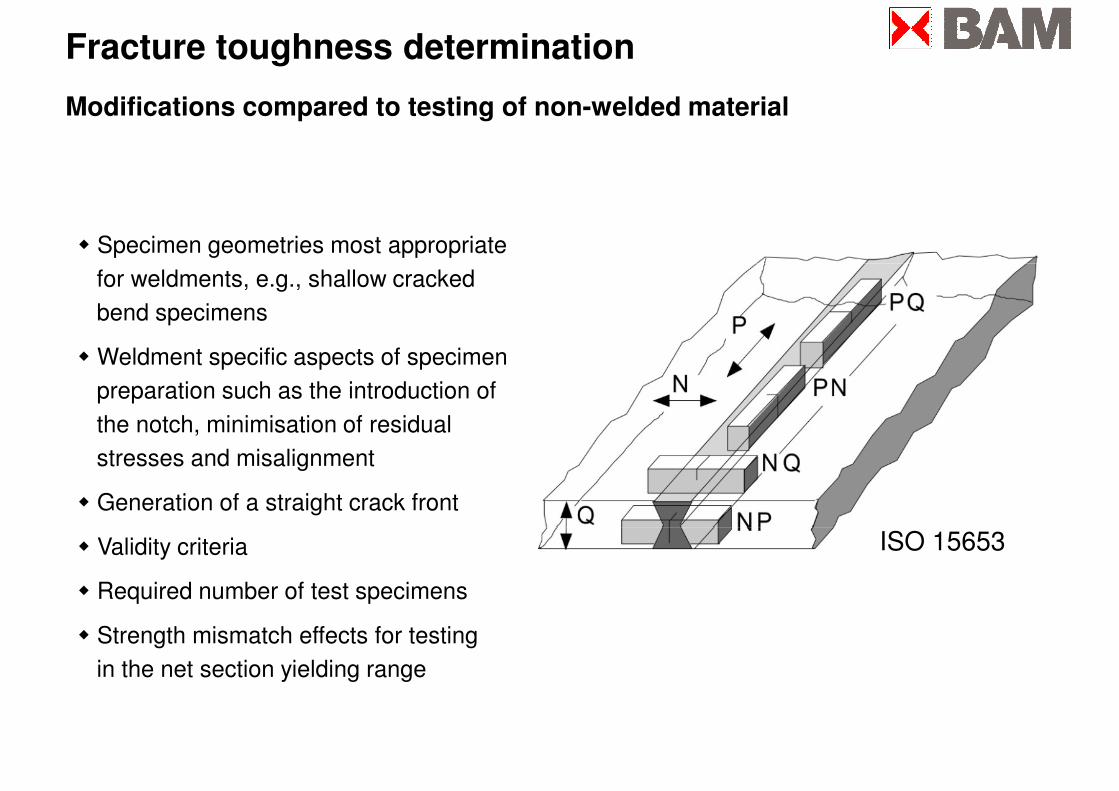
� Specimen geometries most appropriate
Fracture toughness determination
Modifications compared to testing of non-welded material
for weldments, e.g., shallow cracked
bend specimens
� Weldment specific aspects of specimen
preparation such as the introduction of
the notch, minimisation of residual
stresses and misalignment
� Generation of a straight crack front
ISO 15653� Validity criteria
� Required number of test specimens
� Strength mismatch effects for testing
in the net section yielding range
ISO 15653
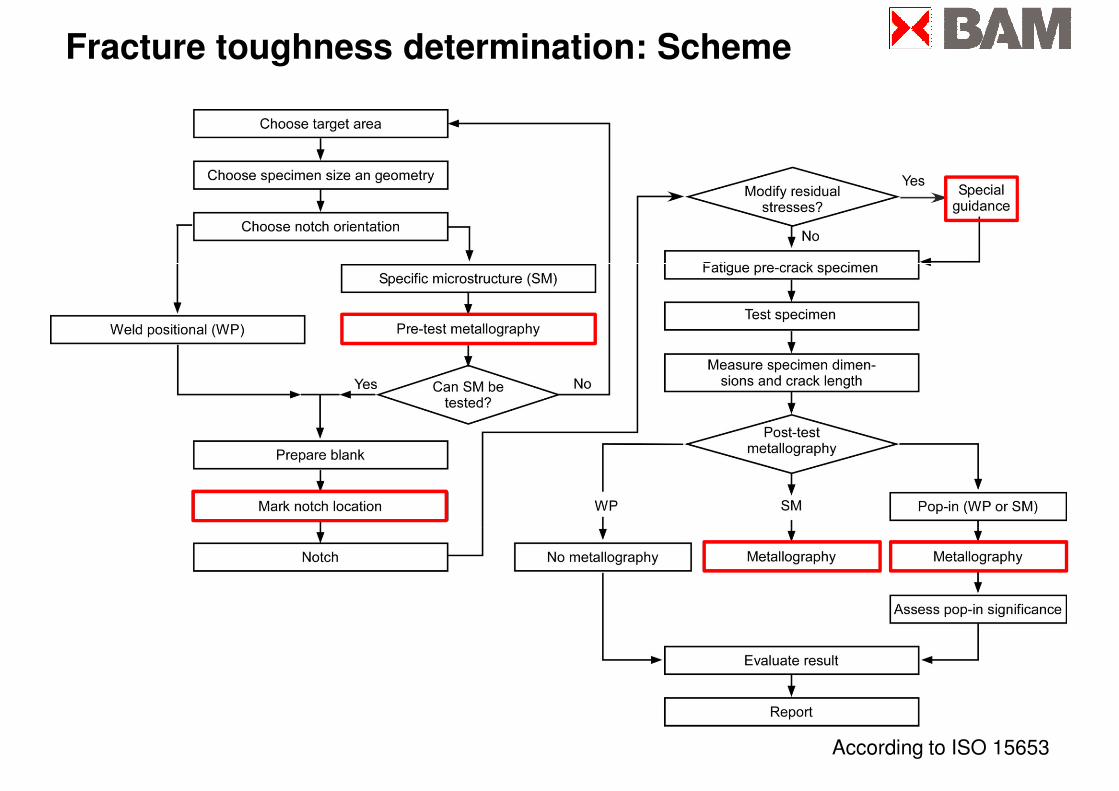
Fracture toughness determination: Scheme
According to ISO 15653
Fracture toughness determination
Adapted testing
Perform test as much as possible representative with respect to the component
in service. Relevant factors and parameters are:
� Welding process including filler material
� Base plate composition
� Joint thickness
� Preheat and interpass temperatures
� Heat input
� Detailed welding procedure
� Joint configuration
� Restraint
� Postweld treatment
� Time between welding and testing
� Environment
� Test temperature
Hydrogen release heat treatment
prior to testing can be necessary
when the time between welding
and the beginning of service is
much longer than those between
welding and testing.

Fracture mechanics of weldments: Specific aspects
Inhomogeneous
microstructure
Susceptibility
to cracking
Fracture toughness determination
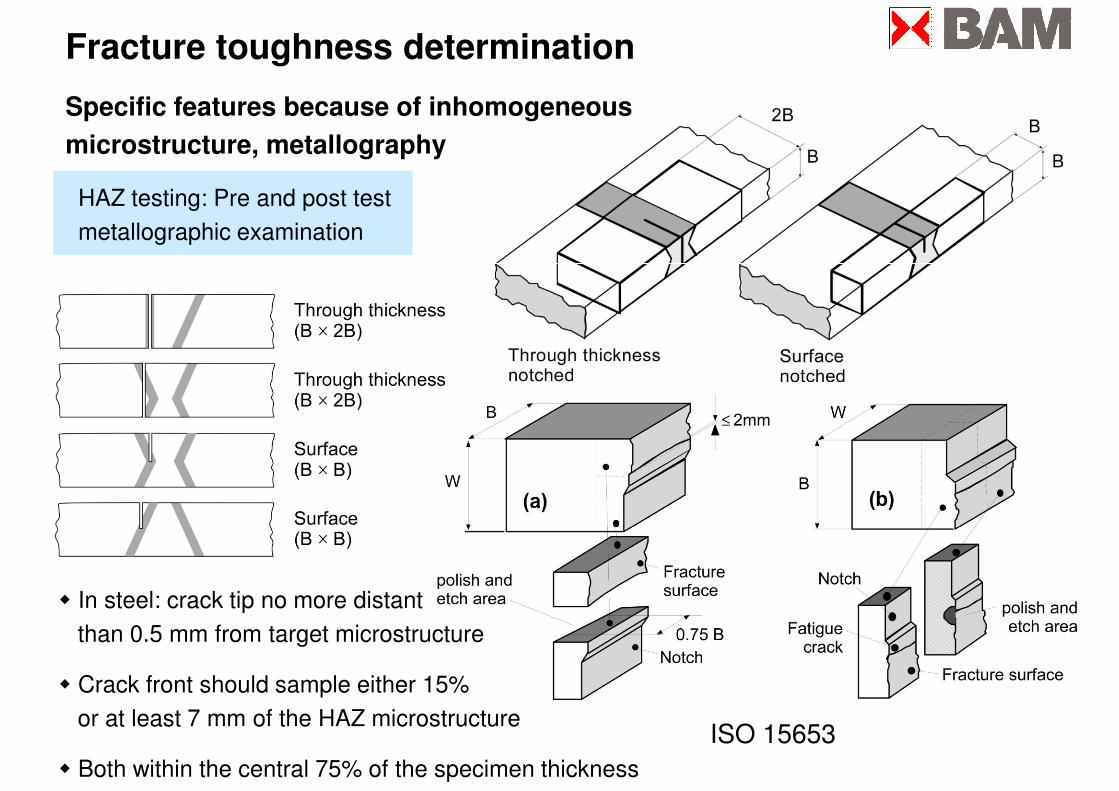
Specific features because of inhomogeneous
microstructure, metallography
HAZ testing: Pre and post test
metallographic examination
� In steel: crack tip no more distant
than 0.5 mm from target microstructure
� Crack front should sample either 15%
or at least 7 mm of the HAZ microstructure
� Both within the central 75% of the specimen thickness
ISO 15653
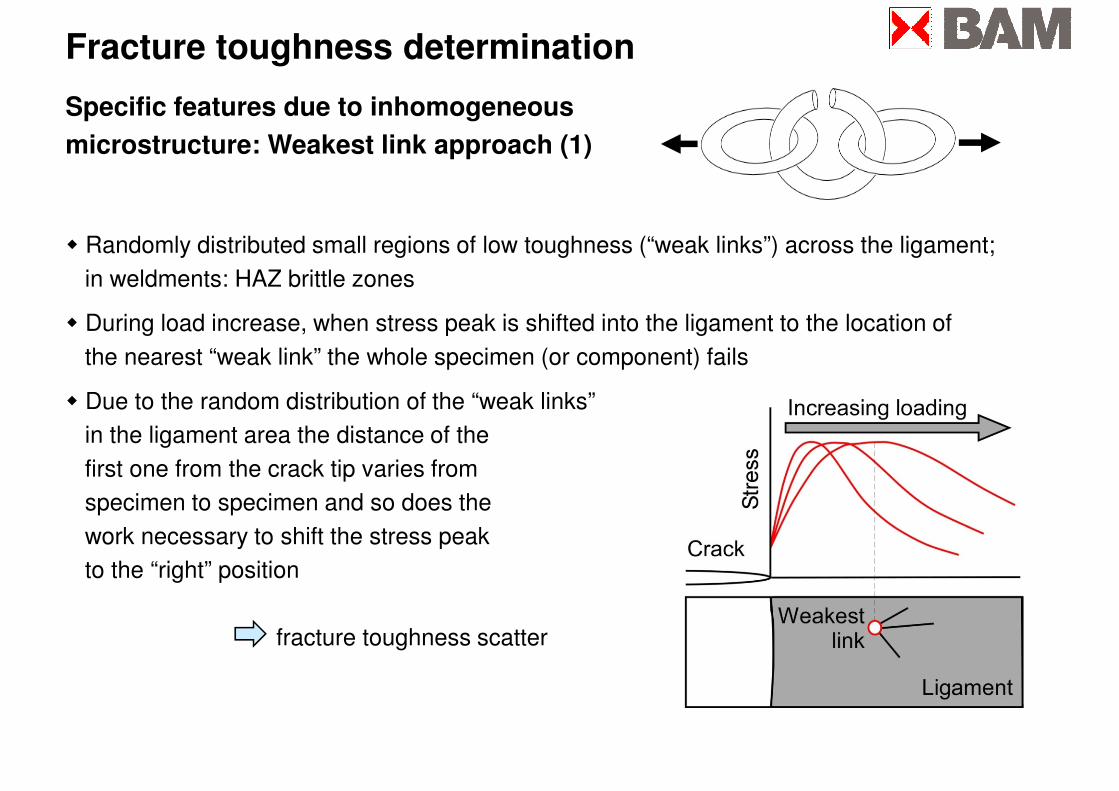
� Randomly distributed small regions of low toughness (“weak links”) across the ligament;
Fracture toughness determination
Specific features due to inhomogeneous
microstructure: Weakest link approach (1)
in weldments: HAZ brittle zones
� During load increase, when stress peak is shifted into the ligament to the location of
the nearest “weak link” the whole specimen (or component) fails
� Due to the random distribution of the “weak links”
in the ligament area the distance of the
first one from the crack tip varies from
specimen to specimen and so does the
work necessary to shift the stress peak work necessary to shift the stress peak
to the “right” position
fracture toughness scatter
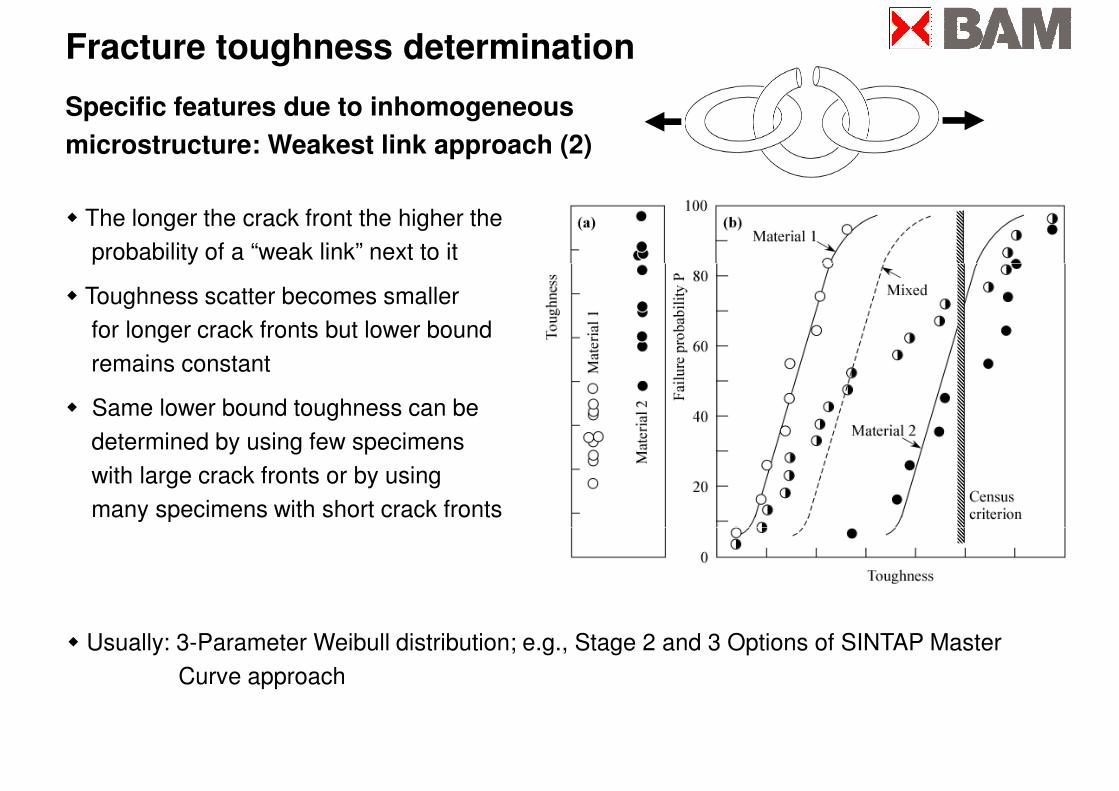
� The longer the crack front the higher the
probability of a “weak link” next to it
Fracture toughness determination
Specific features due to inhomogeneous
microstructure: Weakest link approach (2)
probability of a “weak link” next to it
� Toughness scatter becomes smaller
for longer crack fronts but lower bound
remains constant
� Same lower bound toughness can be
determined by using few specimens
with large crack fronts or by using
many specimens with short crack fronts
� Usually: 3-Parameter Weibull distribution; e.g., Stage 2 and 3 Options of SINTAP Master
Curve approach
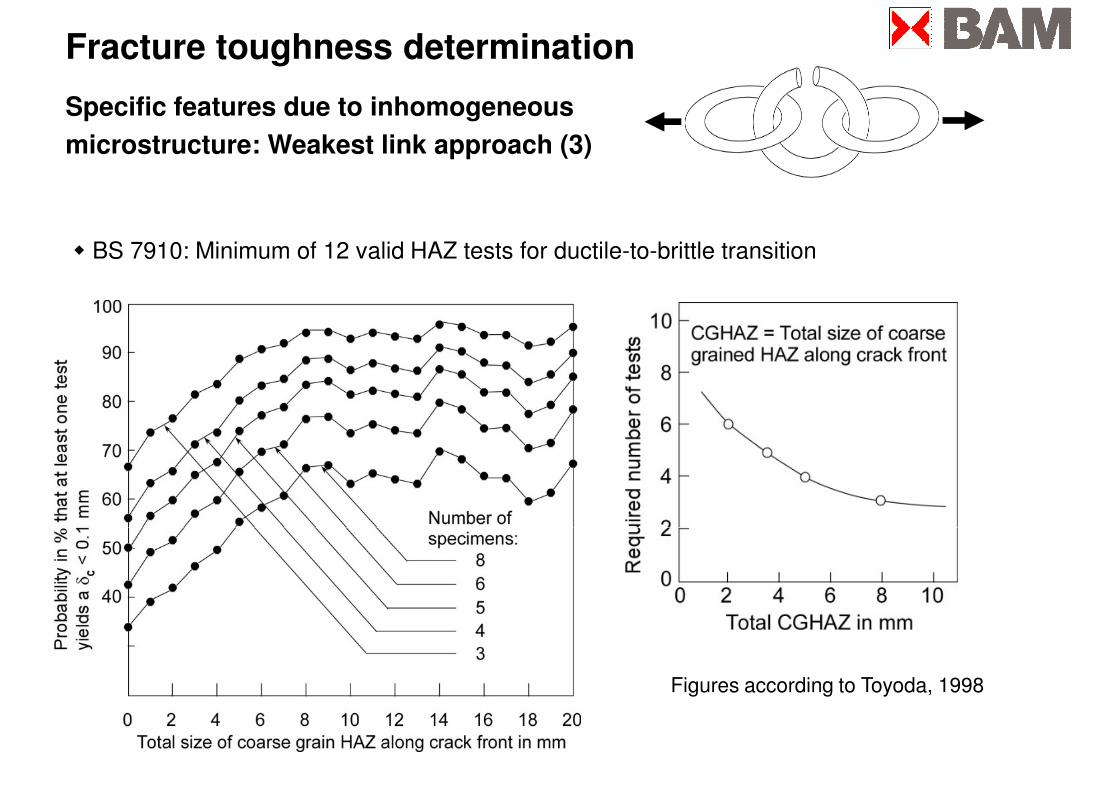
Fracture toughness determination
Specific features due to inhomogeneous
microstructure: Weakest link approach (3)
� BS 7910: Minimum of 12 valid HAZ tests for ductile-to-brittle transitionBS 7910: Minimum of 12 valid HAZ tests for ductile-to-brittle transition
Figures according to Toyoda, 1998
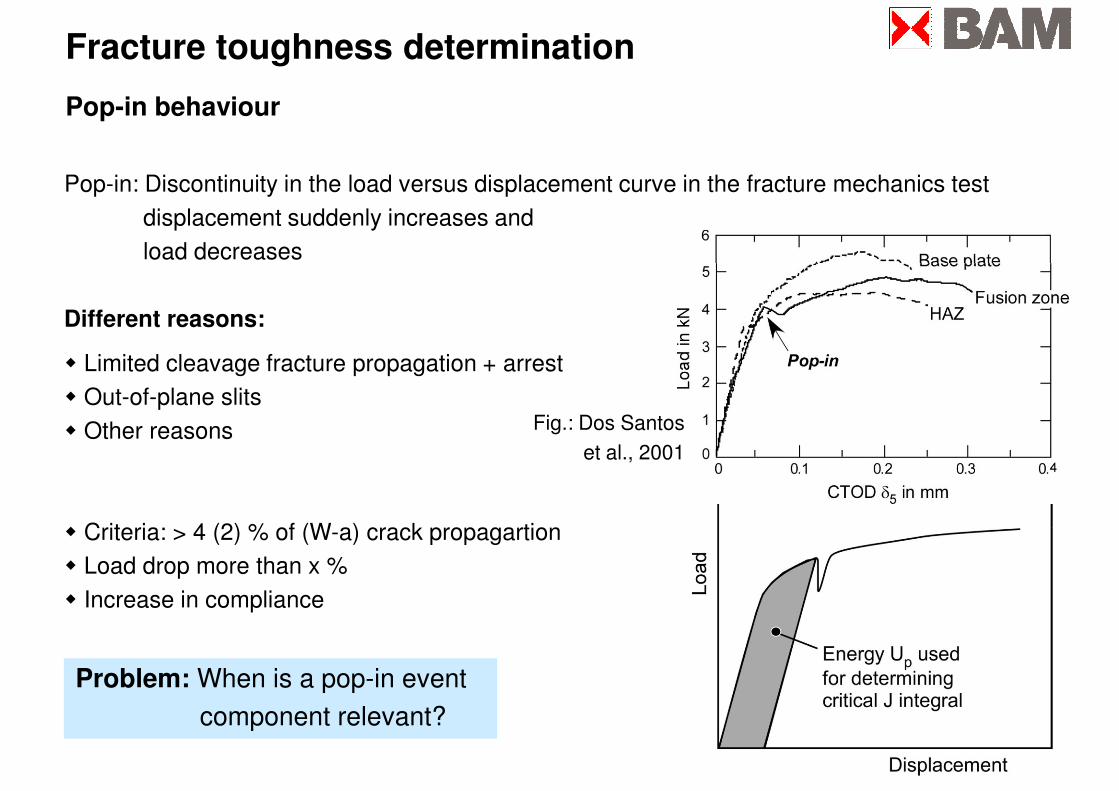
Fracture toughness determination
Pop-in behaviour
Pop-in: Discontinuity in the load versus displacement curve in the fracture mechanics test
displacement suddenly increases and
load decreases load decreases
Different reasons:
� Limited cleavage fracture propagation + arrest
� Out-of-plane slits
� Other reasons
� Criteria: > 4 (2) % of (W-a) crack propagartion
Fig.: Dos Santos
et al., 2001
� Criteria: > 4 (2) % of (W-a) crack propagartion
� Load drop more than x %
� Increase in compliance
Problem: When is a pop-in event
component relevant?
Fracture mechanics of weldments: Specific aspects
Inhomogeneous
microstructure
Strength mismatch
Susceptibility
to cracking
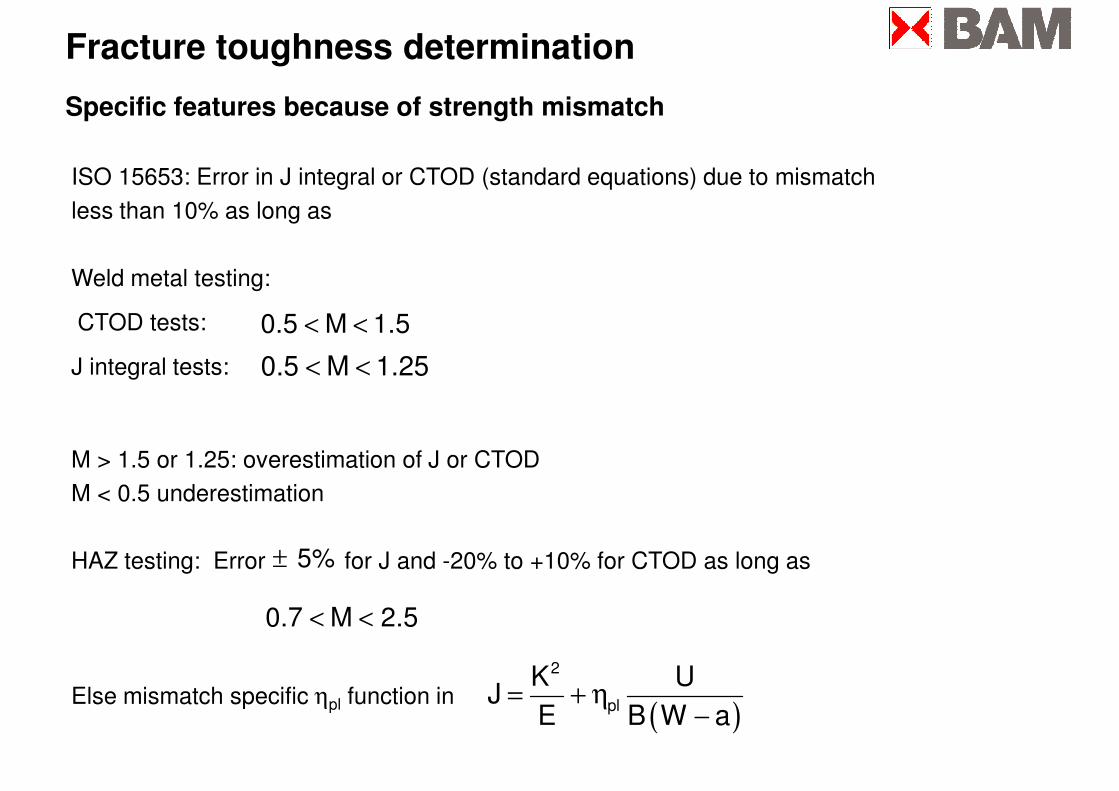
Fracture toughness determination
Specific features because of strength mismatch
ISO 15653: Error in J integral or CTOD (standard equations) due to mismatch
less than 10% as long as
Weld metal testing:
CTOD tests:
J integral tests:
M > 1.5 or 1.25: overestimation of J or CTOD
M < 0.5 underestimation
< <0.5 M 1.5
< <0.5 M 1.25
HAZ testing: Error for J and -20% to +10% for CTOD as long as
Else mismatch specific ηpl function in
< <0.7 M 2.5
± 5%
( )= + η
−
2
pl
K UJ
E B W a
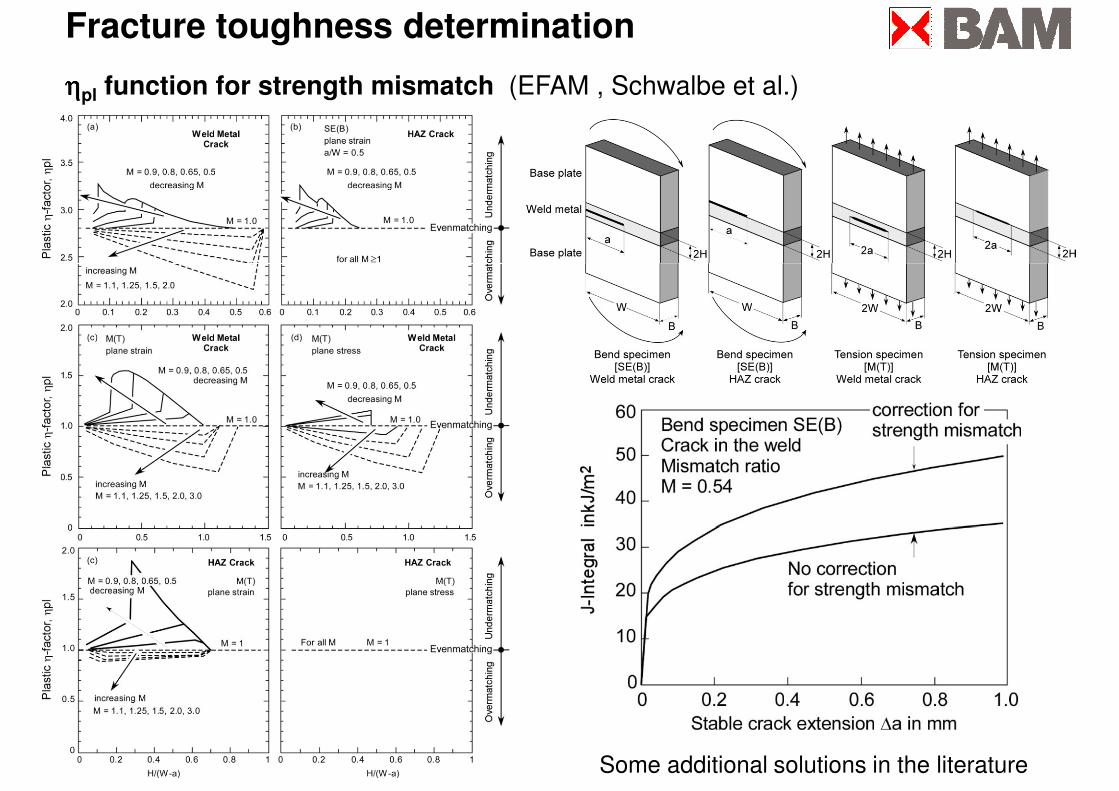
Fracture toughness determination
ηηηηpl function for strength mismatch (EFAM , Schwalbe et al.)
Some additional solutions in the literature
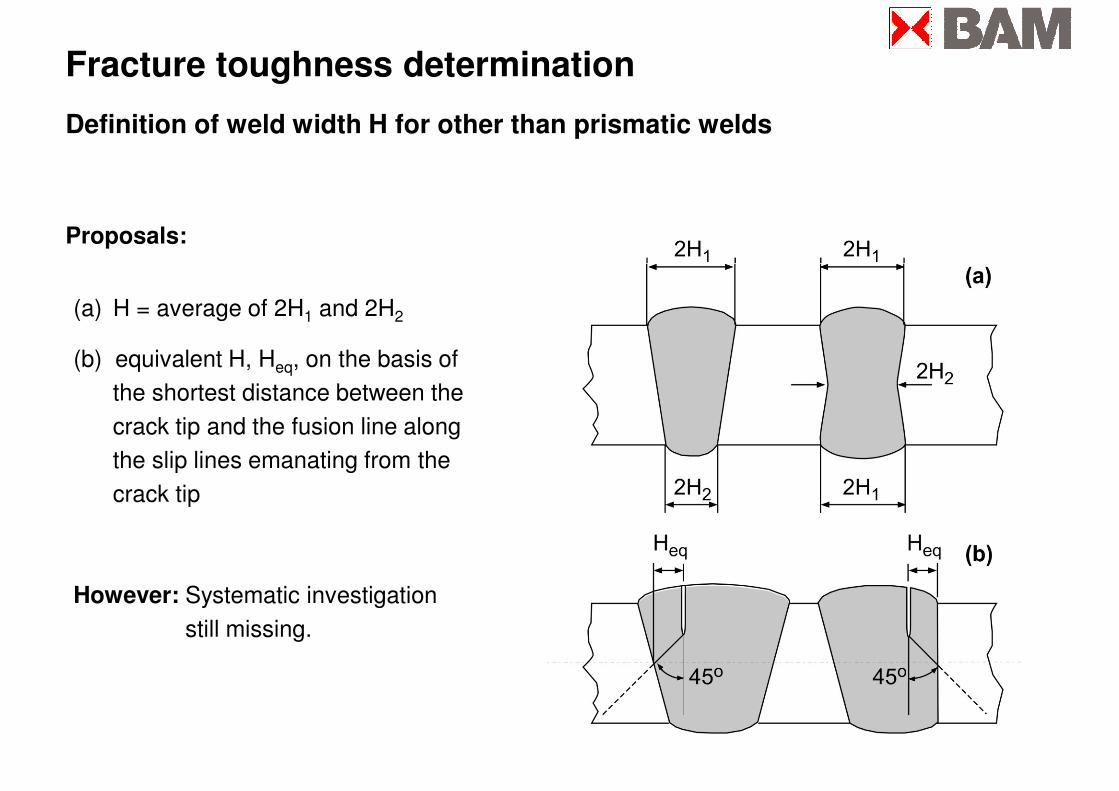
Fracture toughness determination
Definition of weld width H for other than prismatic welds
Proposals:
(a) H = average of 2H1 and 2H2
(b) equivalent H, Heq, on the basis of
the shortest distance between the
crack tip and the fusion line along
the slip lines emanating from the
crack tip
However: Systematic investigation
still missing.
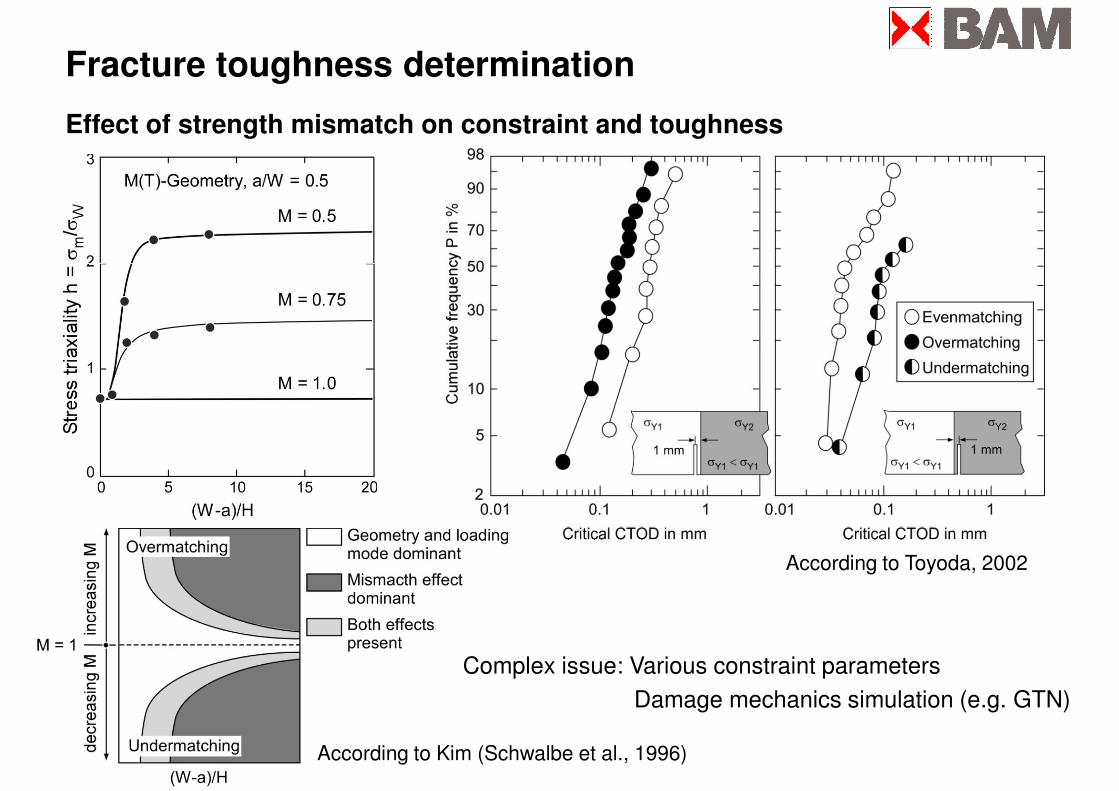
Fracture toughness determination
Effect of strength mismatch on constraint and toughness
According to Toyoda, 2002
According to Kim (Schwalbe et al., 1996)
Complex issue: Various constraint parameters
Damage mechanics simulation (e.g. GTN)
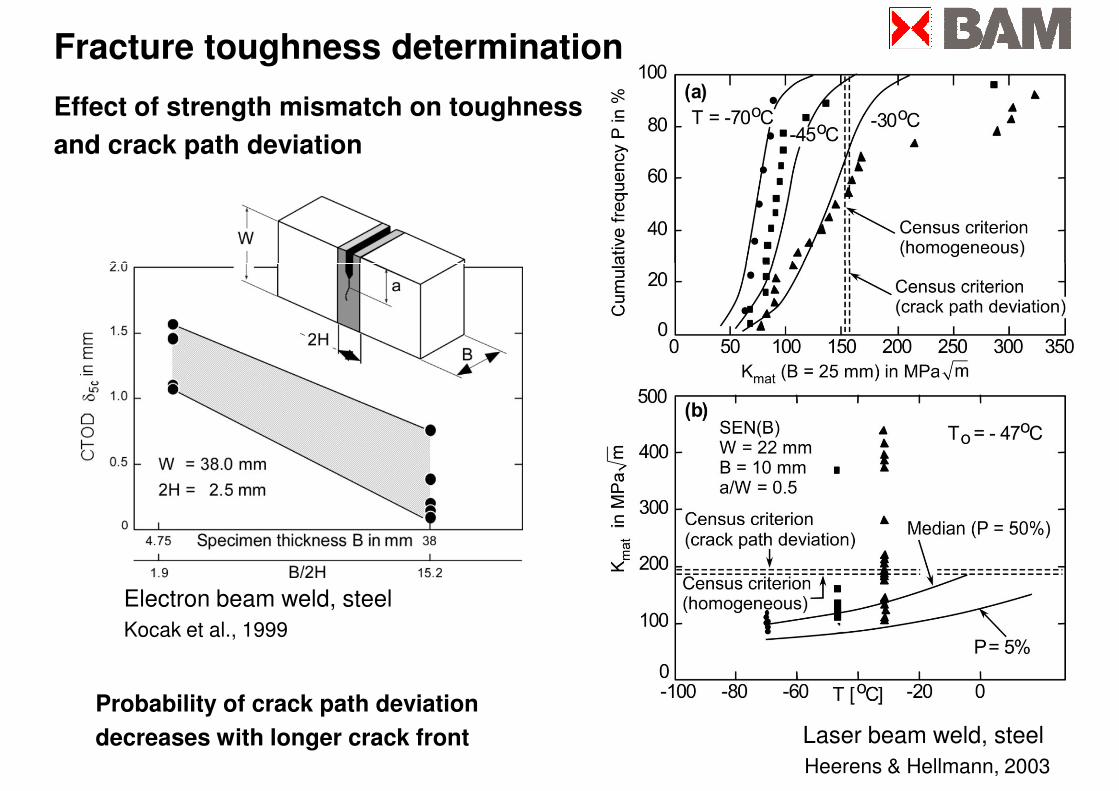
Fracture toughness determination
Effect of strength mismatch on toughness
and crack path deviation
Electron beam weld, steel
Kocak et al., 1999
Probability of crack path deviation
decreases with longer crack front Laser beam weld, steel
Heerens & Hellmann, 2003
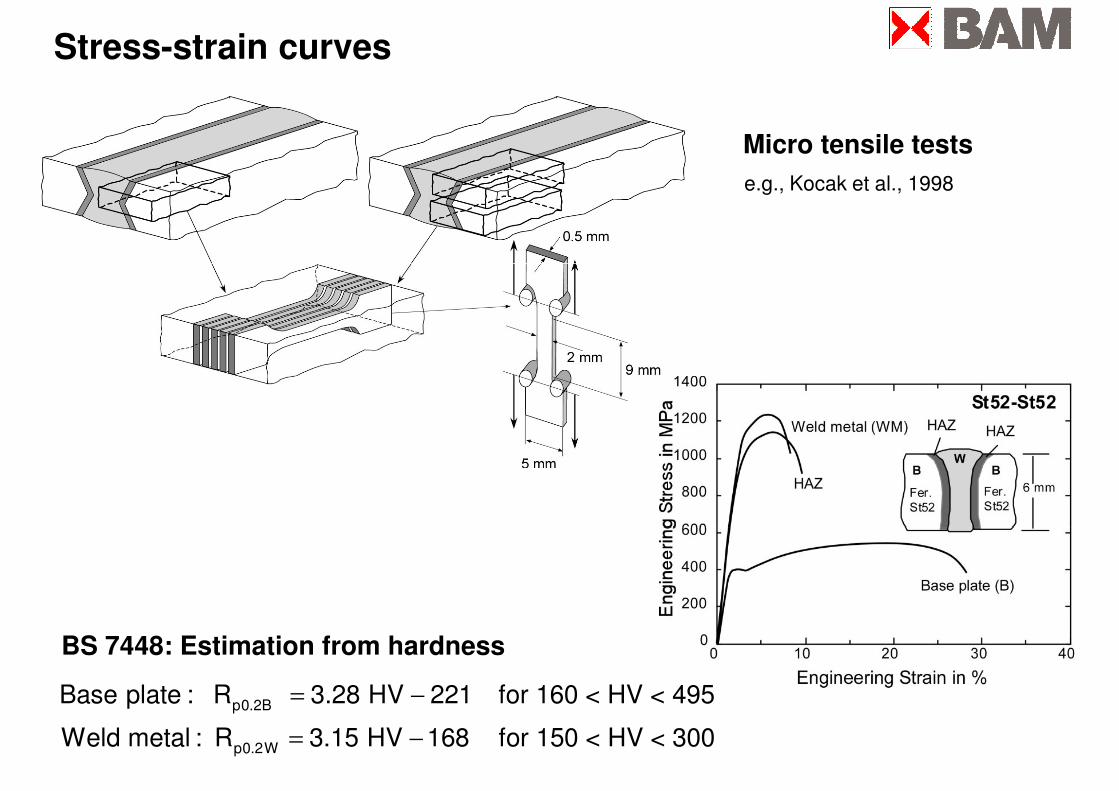
Stress-strain curves
Micro tensile tests
e.g., Kocak et al., 1998
BS 7448: Estimation from hardness
p0.2B
p0.2W
Base plate : R 3.28 HV 221 for 160 < HV < 495
Weld metal : R 3.15 HV 168 for 150 < HV < 300
= −
= −

Fracture mechanics of weldments: Specific aspects
Inhomogeneous
microstructure
Residual stresses
Strength mismatch
Susceptibility
to cracking
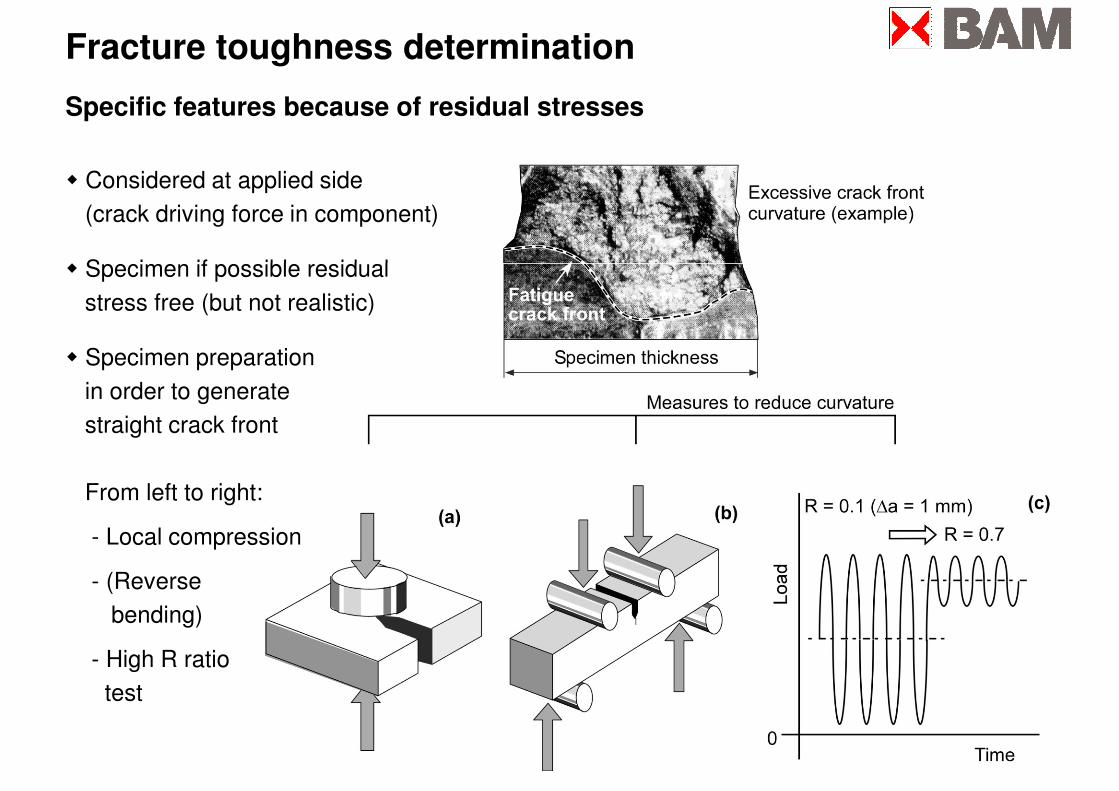
Fracture toughness determination
Specific features because of residual stresses
� Considered at applied side
(crack driving force in component)
� Specimen if possible residual � Specimen if possible residual
stress free (but not realistic)
� Specimen preparation
in order to generate
straight crack front
From left to right:
- Local compression- Local compression
- (Reverse
bending)
- High R ratio
test

Fracture mechanics of weldments: Specific aspects
Inhomogeneous
microstructure
Residual stresses
Misalignment
Strength mismatch
Susceptibility
to cracking
Misalignment
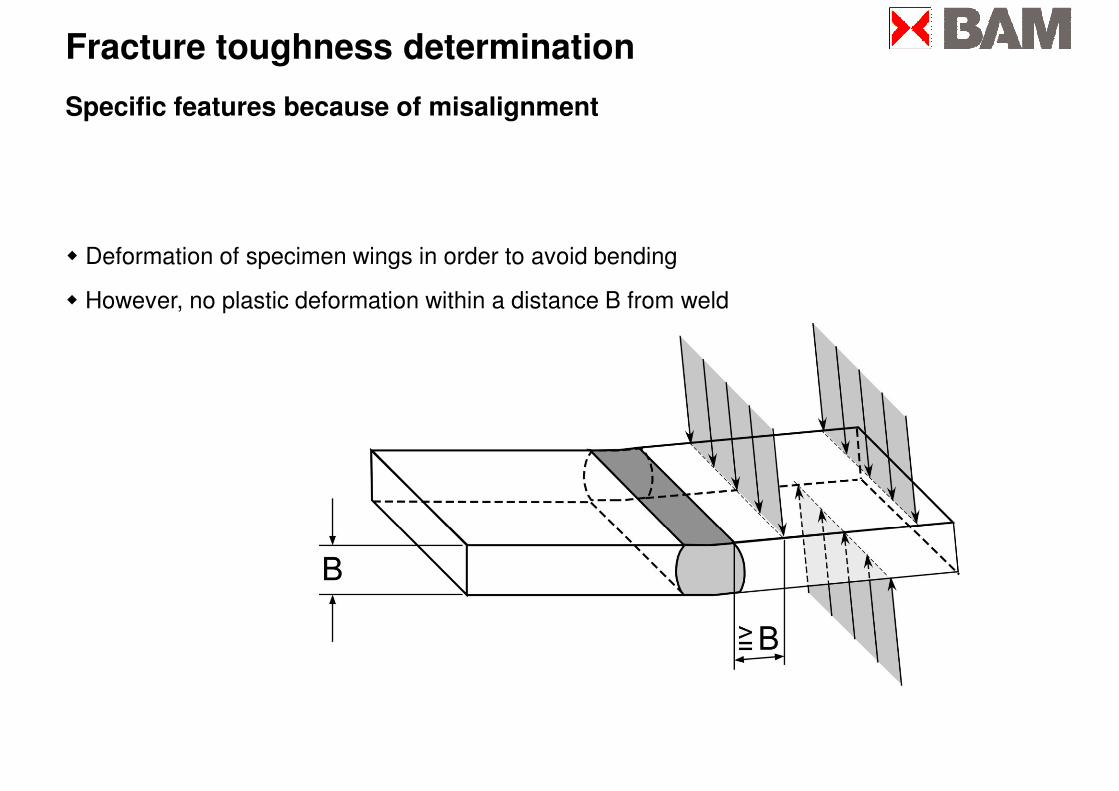
Fracture toughness determination
Specific features because of misalignment
� Deformation of specimen wings in order to avoid bending� Deformation of specimen wings in order to avoid bending
� However, no plastic deformation within a distance B from weld
Outline
� Specific aspects of weldments
� Determination of fracture toughness
���� Determination of the crack driving force
� Shallow crack propagation and fatigue strength� Shallow crack propagation and fatigue strength

Fracture mechanics of weldments: Specific aspects
Inhomogeneous
microstructure
Strength mismatch
Susceptibility
to cracking
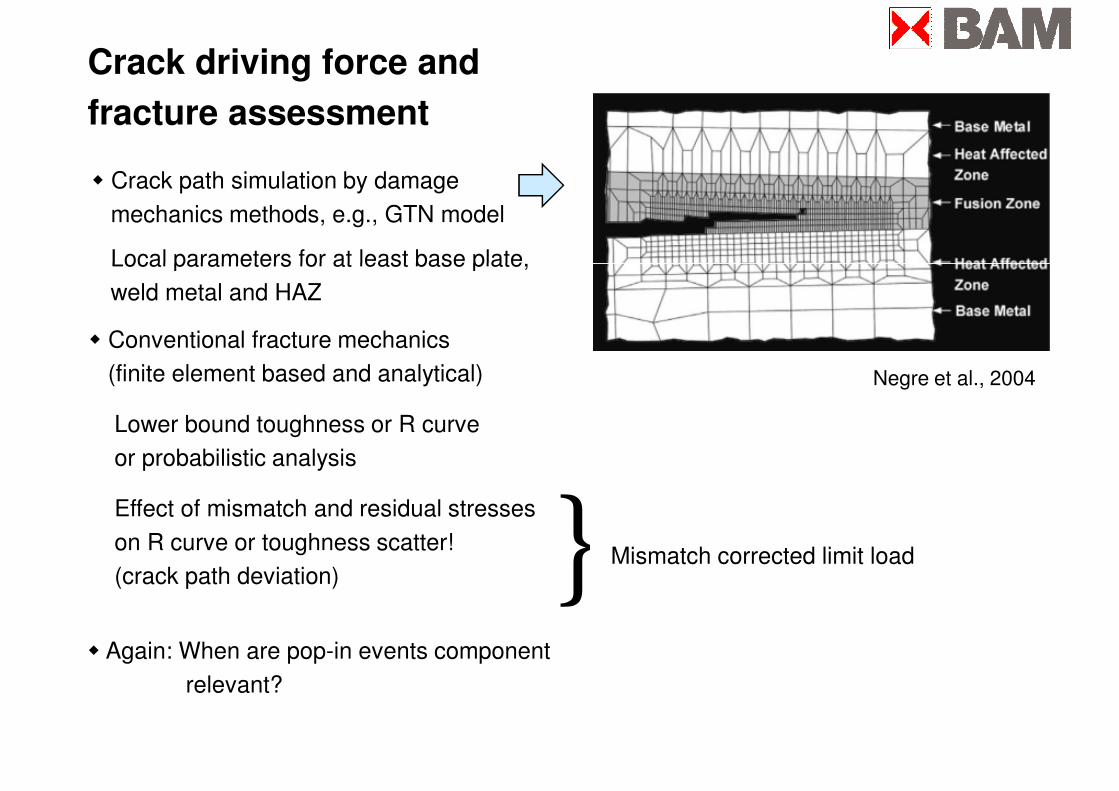
� Crack path simulation by damage
mechanics methods, e.g., GTN model
Local parameters for at least base plate,
Crack driving force and
fracture assessment
Local parameters for at least base plate,
weld metal and HAZ
Negre et al., 2004
}
� Conventional fracture mechanics
(finite element based and analytical)
Lower bound toughness or R curve
or probabilistic analysis
Effect of mismatch and residual stresses
} Mismatch corrected limit loadon R curve or toughness scatter!
(crack path deviation)
� Again: When are pop-in events component
relevant?
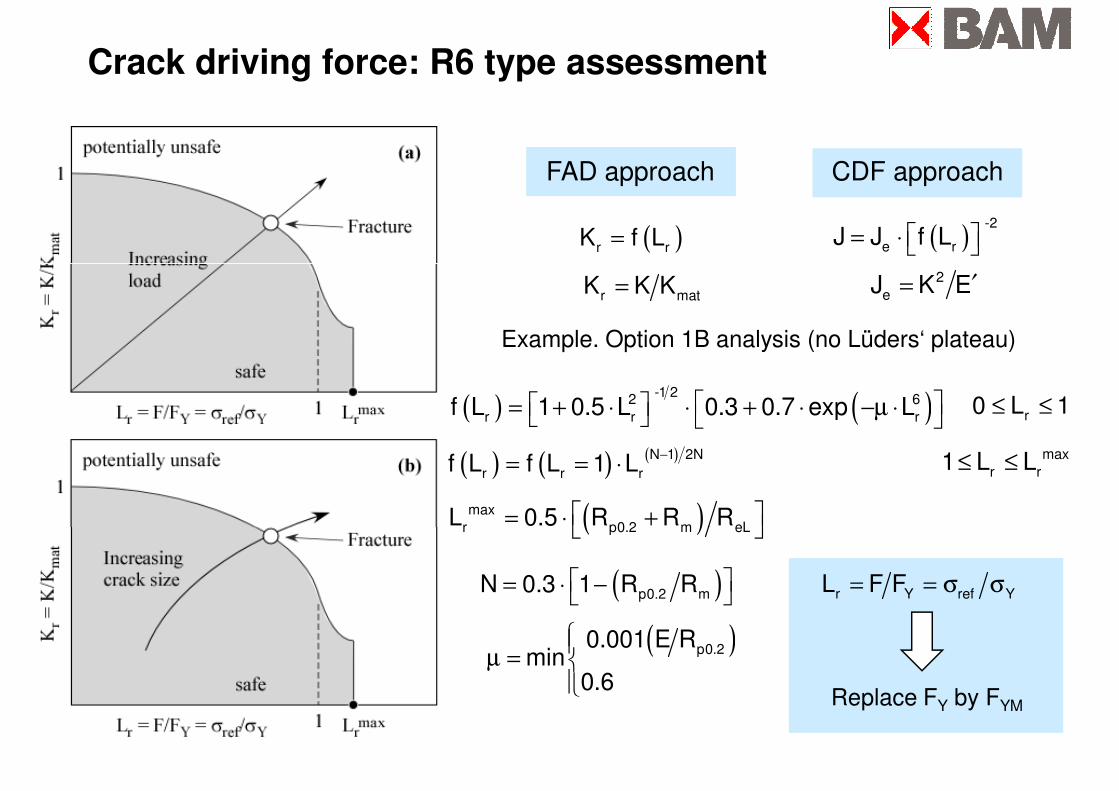
( ) -2
e rJ J f L = ⋅ ( )r rK f L=
Crack driving force: R6 type assessment
FAD approach CDF approach
2
eJ K E′=r matK K K=
( ) ( ) -1 2
2 6
r r rf L 1 0.5 L 0.3 0.7 exp L = + ⋅ ⋅ + ⋅ −µ ⋅ r0 L 1≤ ≤
( ) ( ) ( )N 1 2N
r r rf L f L 1 L−
= = ⋅max
r r1 L L≤ ≤
( )max
r p0.2 m eLL 0.5 R R R = ⋅ +
Example. Option 1B analysis (no Lüders‘ plateau)
r Y ref YL F F= = σ σ
( )p0.20.001 E Rmin
0.6
µ =
( )p0.2 mN 0.3 1 R R = ⋅ −
( )r p0.2 m eLL 0.5 R R R = ⋅ +
Replace FY by FYM
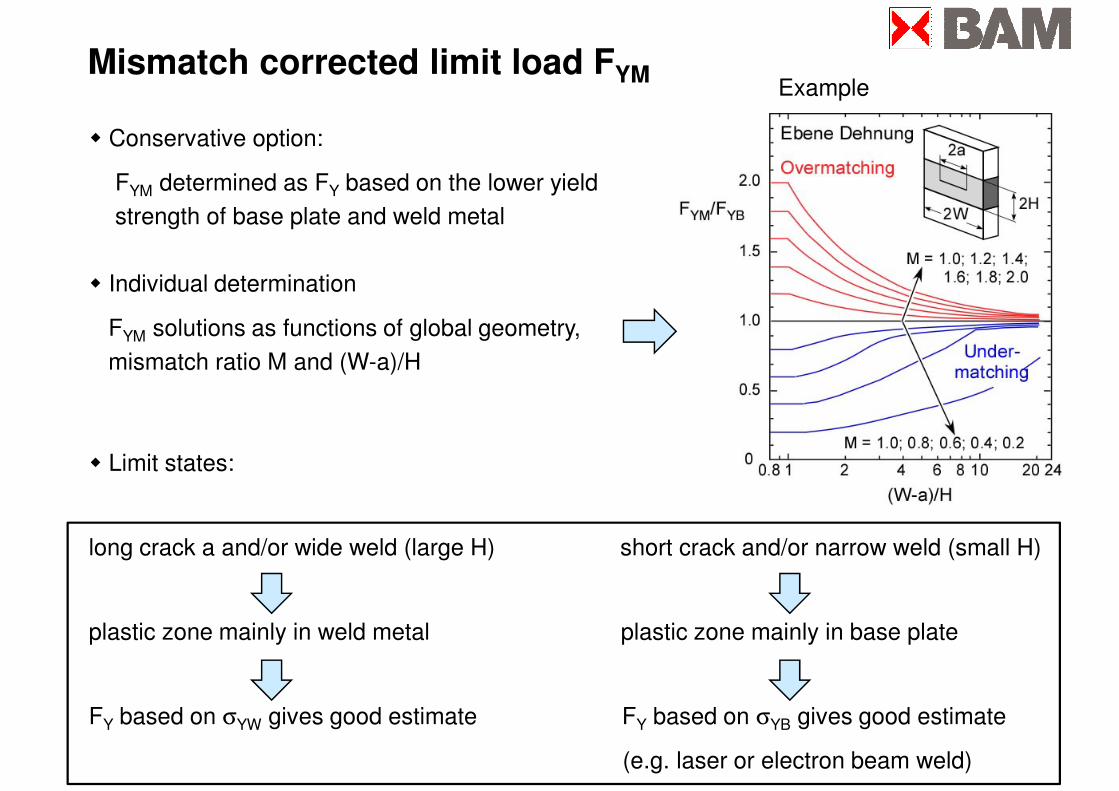
Mismatch corrected limit load FYMExample
� Conservative option:
FYM determined as FY based on the lower yield
strength of base plate and weld metal
� Individual determination
FYM solutions as functions of global geometry,
mismatch ratio M and (W-a)/H
� Limit states:
long crack a and/or wide weld (large H) short crack and/or narrow weld (small H)
plastic zone mainly in weld metal plastic zone mainly in base plate
FY based on σYW gives good estimate FY based on σYB gives good estimate
(e.g. laser or electron beam weld)
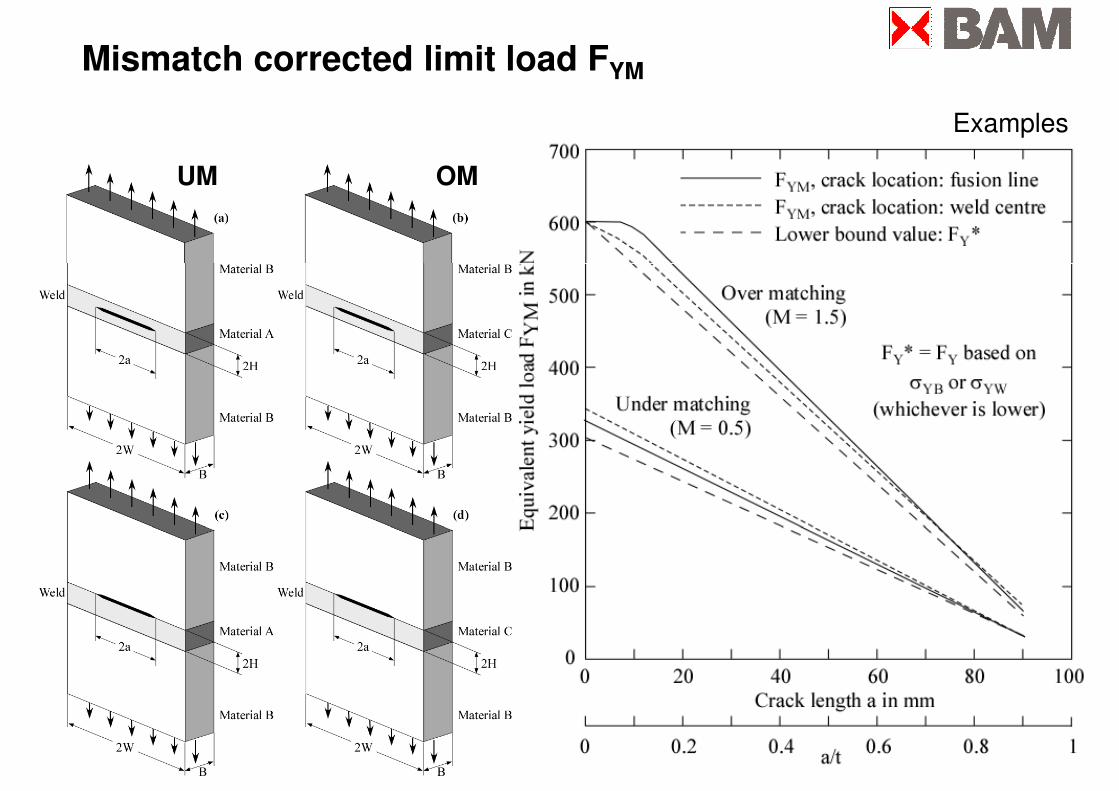
Mismatch corrected limit load FYM
Examples
UM OM
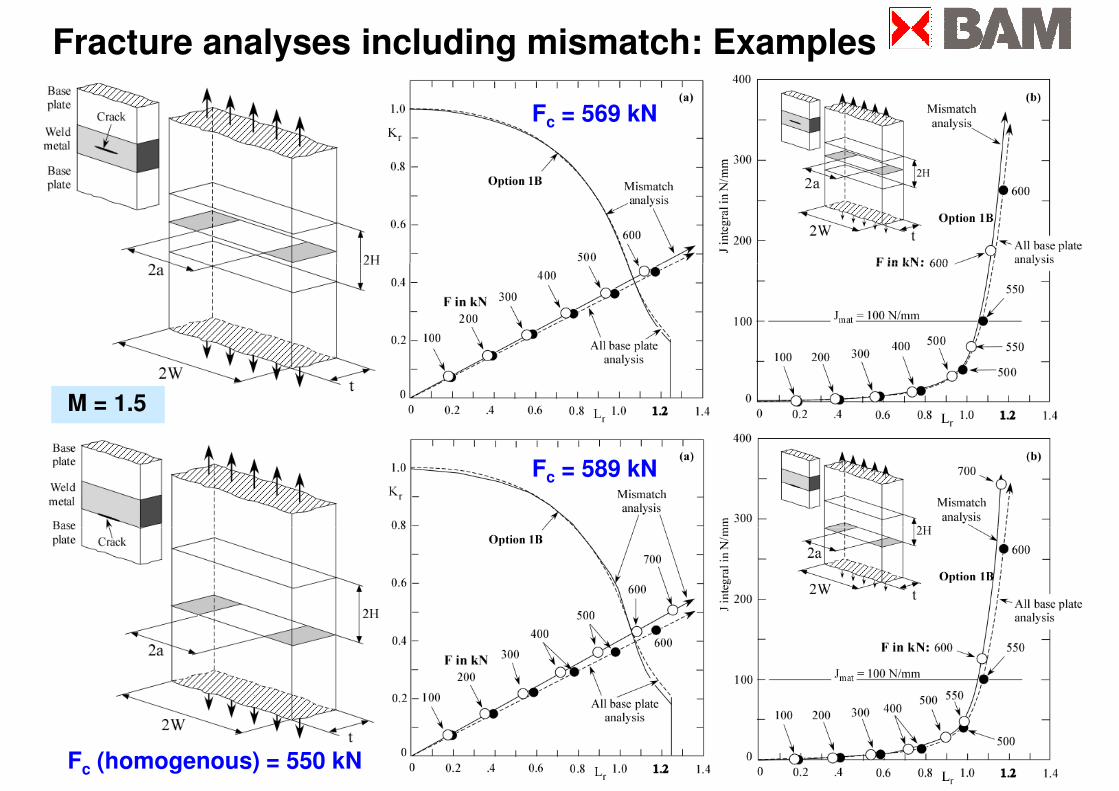
Fracture analyses including mismatch: Examples
Fc = 569 kN
Fc = 589 kN
M = 1.5
Fc (homogenous) = 550 kN

Fracture mechanics of weldments: Specific aspects
Inhomogeneous
microstructure
Residual stresses
Strength mismatch
Susceptibility
to cracking
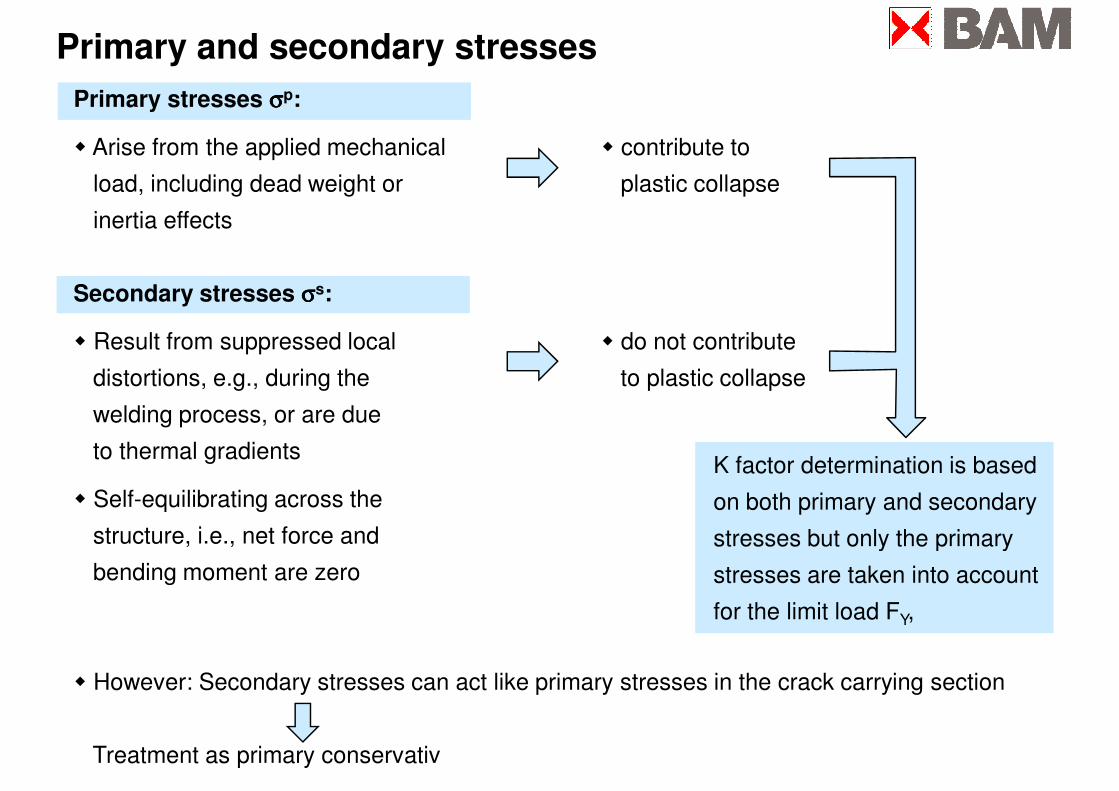
Primary stresses σσσσp:
� Arise from the applied mechanical � contribute to
load, including dead weight or plastic collapse
inertia effects
Primary and secondary stresses
Secondary stresses σσσσs:
� Result from suppressed local � do not contribute
distortions, e.g., during the to plastic collapse
welding process, or are due
to thermal gradients
� Self-equilibrating across the
structure, i.e., net force and
K factor determination is based
on both primary and secondary
stresses but only the primarystructure, i.e., net force and
bending moment are zero
� However: Secondary stresses can act like primary stresses in the crack carrying section
Treatment as primary conservativ
stresses but only the primary
stresses are taken into account
for the limit load FY,
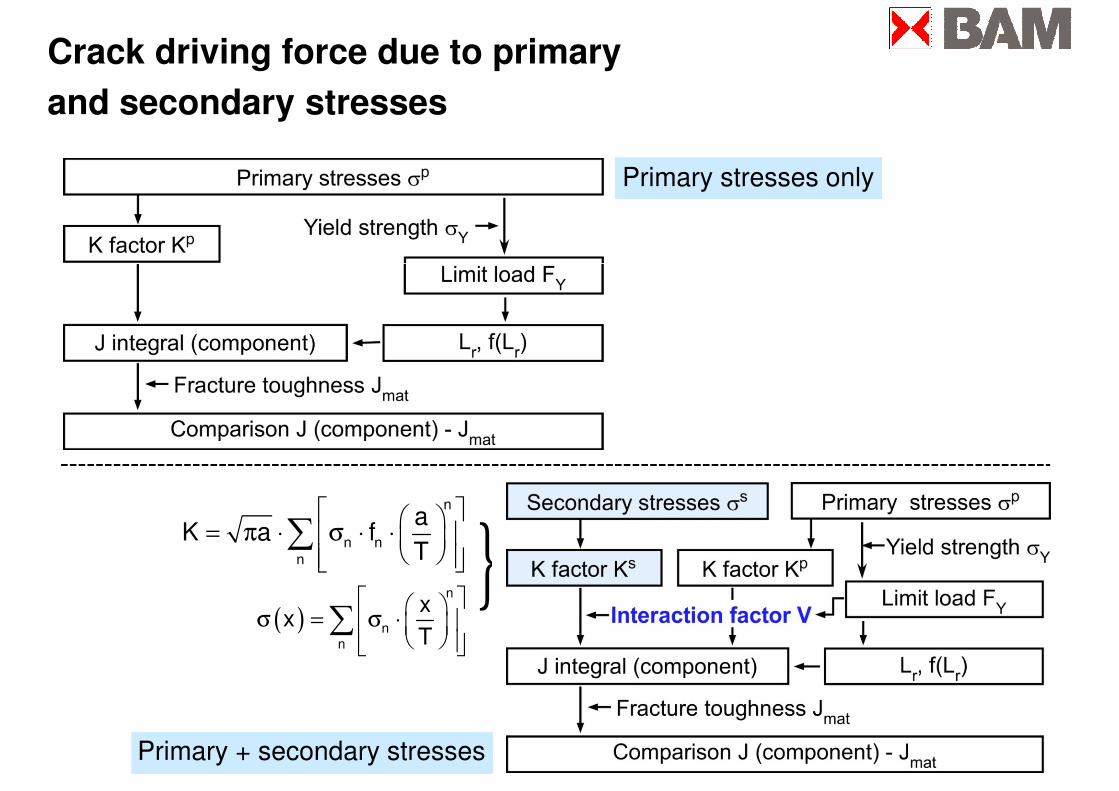
Crack driving force due to primary
and secondary stresses
Primary stresses only
na
K a f
= π ⋅ σ ⋅ ⋅ ∑ }
Primary + secondary stresses
n nn
aK a f
T
= π ⋅ σ ⋅ ⋅
∑
( )n
nn
xx
T
σ = σ ⋅
∑
}
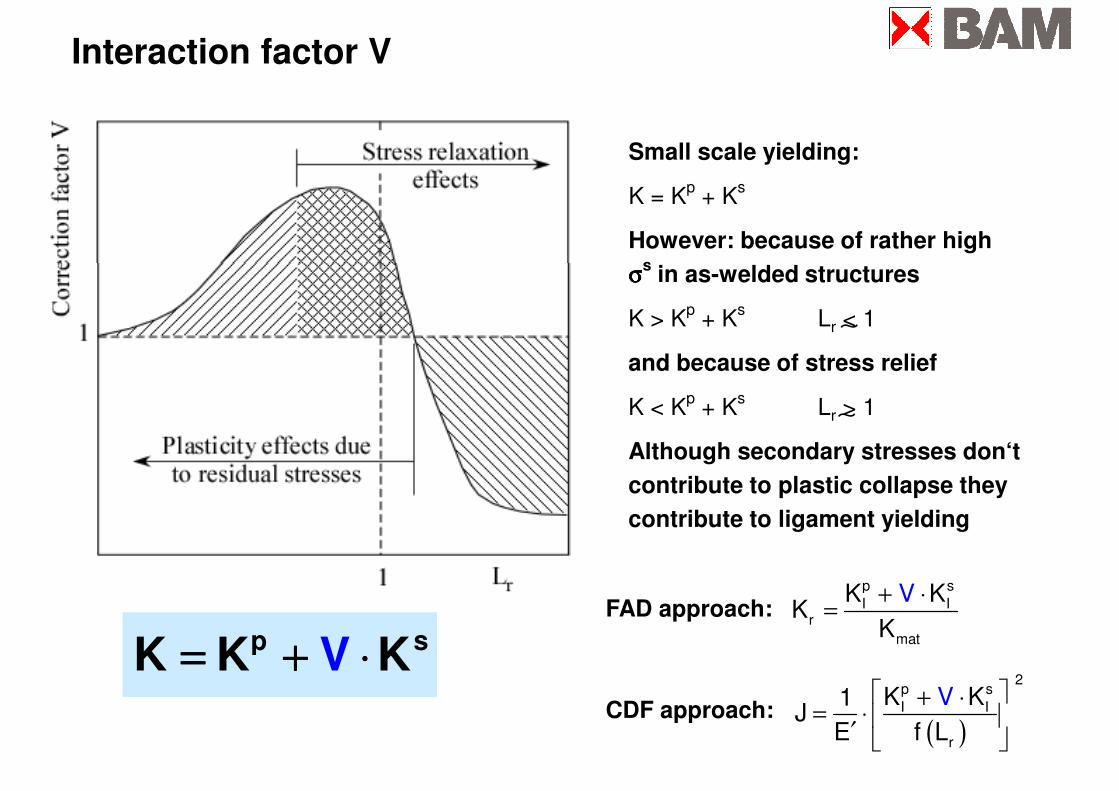
Interaction factor V
Small scale yielding:
K = Kp
+ Ks
However: because of rather high
σσσσs
in as-welded structuresσσσσs
in as-welded structures
K > Kp
+ Ks
Lr < 1
and because of stress relief
K < Kp
+ Ks
Lr > 1
Although secondary stresses don‘t
contribute to plastic collapse they
contribute to ligament yielding
∼
∼
contribute to ligament yielding
p s
I Ir
mat
VK KK
K
+ ⋅=
( )
2p s
I I
r
K K1J
E f L
V + ⋅= ⋅
′
FAD approach:
CDF approach:
p sK K KV= + ⋅= + ⋅= + ⋅= + ⋅
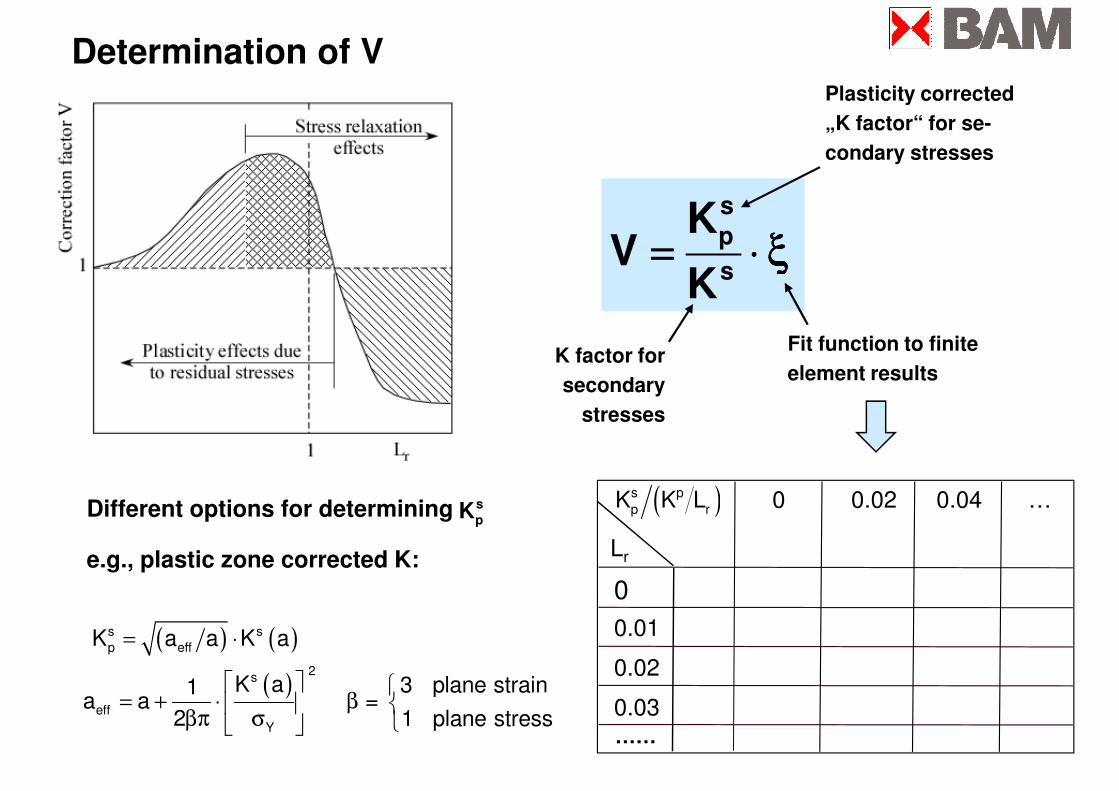
s
p
s
KV
K= ⋅ ξ= ⋅ ξ= ⋅ ξ= ⋅ ξ
Plasticity corrected
„K factor“ for se-
condary stresses
Determination of V
sV
K= ⋅ ξ= ⋅ ξ= ⋅ ξ= ⋅ ξ
K factor for
secondary
stresses
Fit function to finite
element results
Different options for determining s
pK ( )s p
p rK K L 0 0.02 0.04 …
e.g., plastic zone corrected K:
p
( ) ( )s s
p eff K a a K a= ⋅
Lr
0
0.01
0.02
0.03……
( ) 2
s
eff
Y
K a 3 plane strain 1a a =
2 1 plane stress
= + ⋅ β
βπ σ
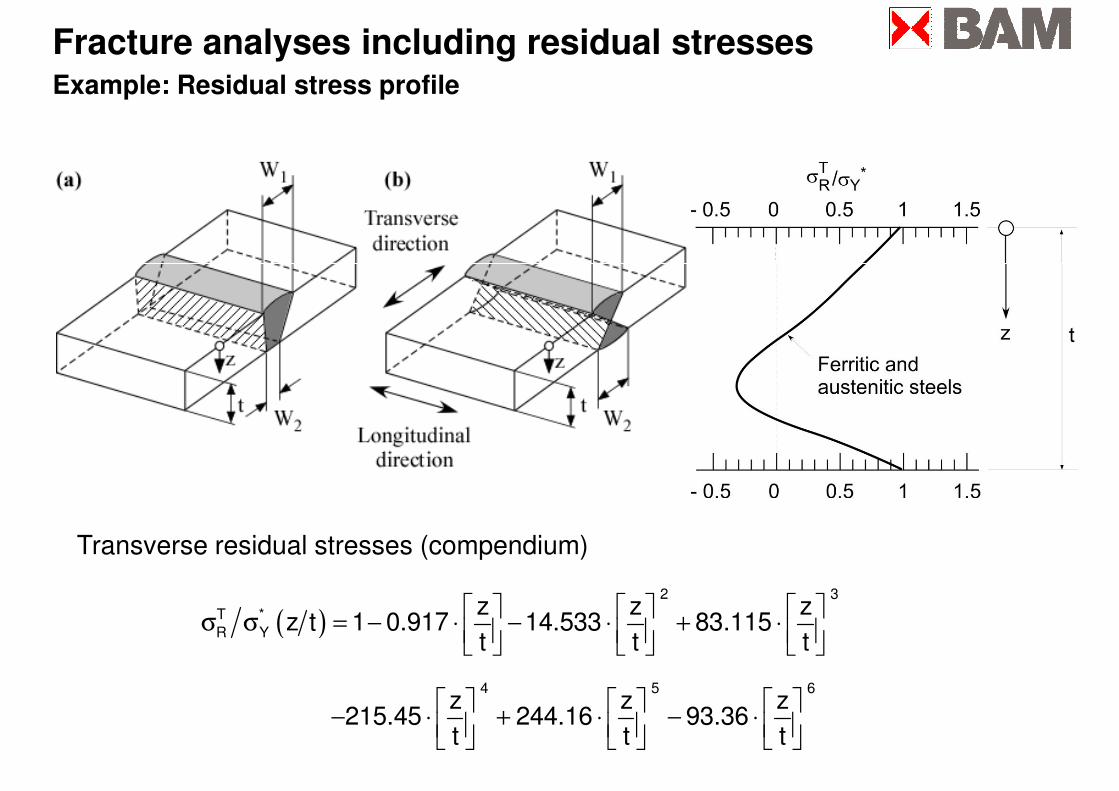
Fracture analyses including residual stressesExample: Residual stress profile
( ) 2 3
T *
R Y
z z zz t 1 0.917 14.533 83.115
t t t
σ σ = − ⋅ − ⋅ + ⋅
4 5 6z z z
215.45 244.16 93.36t t t
− ⋅ + ⋅ − ⋅
Transverse residual stresses (compendium)
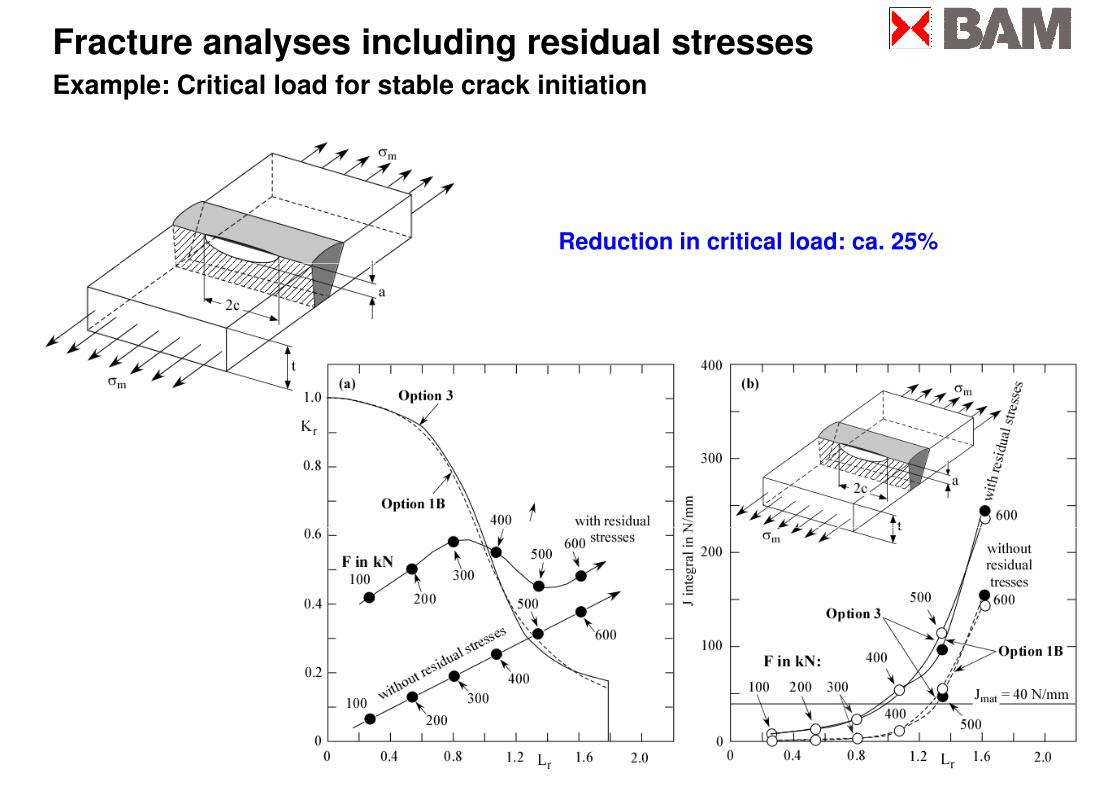
Fracture analyses including residual stressesExample: Critical load for stable crack initiation
Reduction in critical load: ca. 25%
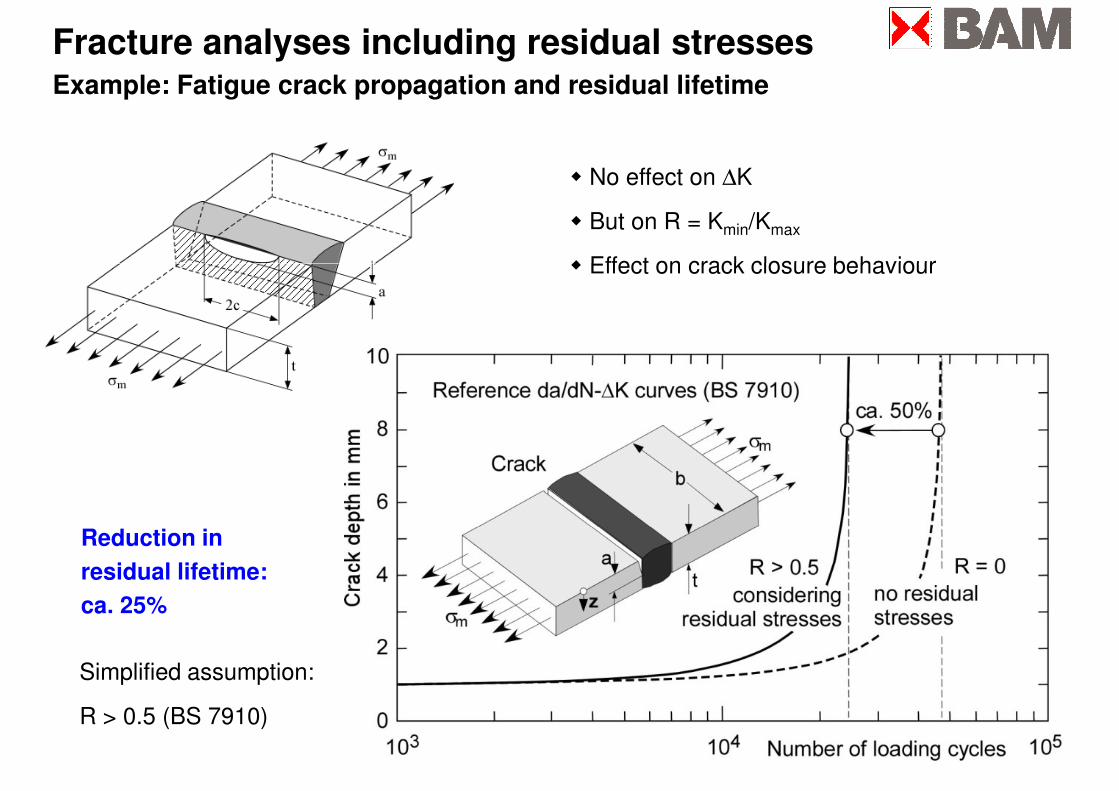
Fracture analyses including residual stressesExample: Fatigue crack propagation and residual lifetime
� No effect on ∆K
� But on R = Kmin/Kmax
� Effect on crack closure behaviour
Reduction in
� Effect on crack closure behaviour
Reduction in
residual lifetime:
ca. 25%
Simplified assumption:
R > 0.5 (BS 7910)
Fracture analyses including residual stresses
Ongoing discussion on
less conservative deter-
mination of V factor
This workshop
Including solutions
� Without elastic follow-up� Without elastic follow-up
� Large elastic follow-up
� for application to short crack propagation problems
Fracture mechanics of weldments: Specific aspects
Inhomogeneous
microstructure
Residual stresses
Misalignment
Strength mismatch
Susceptibility
to cracking
Misalignment
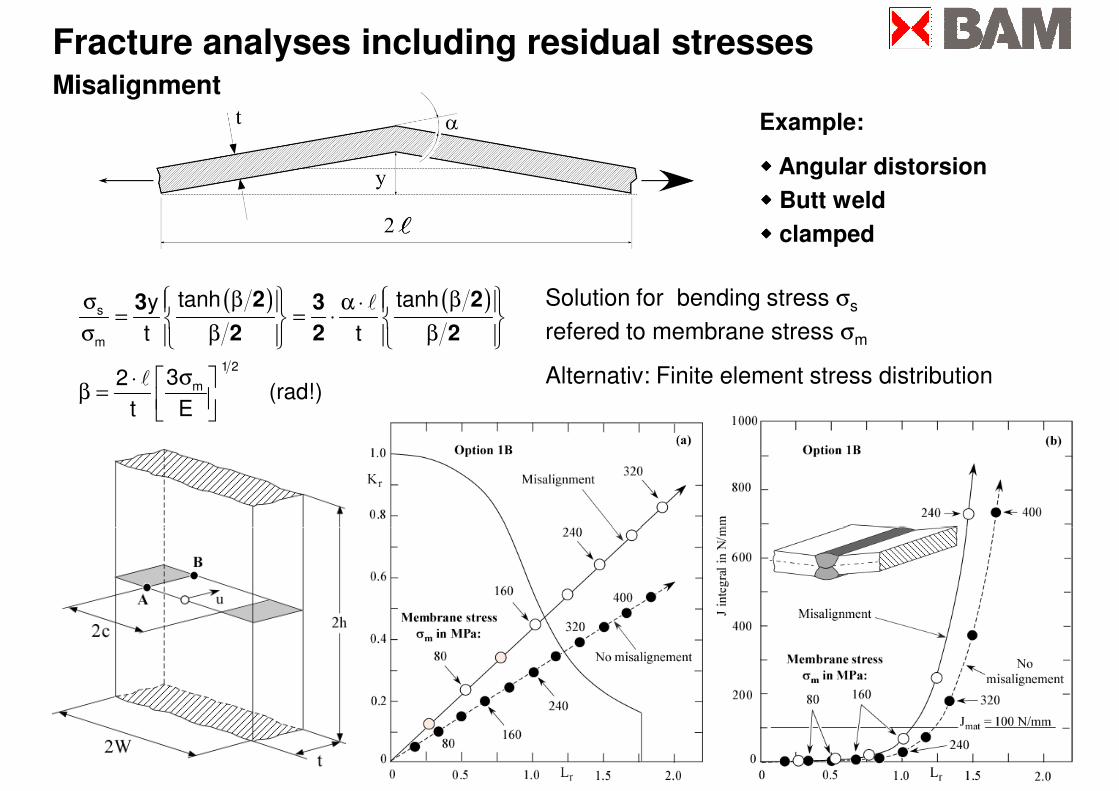
Example:
���� Angular distorsion
���� Butt weld
���� clamped
Fracture analyses including residual stressesMisalignment
( ) ( )s
m
tanh tanhy
t t
β βσ α ⋅ = = ⋅
σ β β
ℓ2 23 3
2 2 2
Solution for bending stress σs
refered to membrane stress σm
Alternativ: Finite element stress distribution 1 2
m32 (rad!)
t E
σ⋅ β =
ℓ
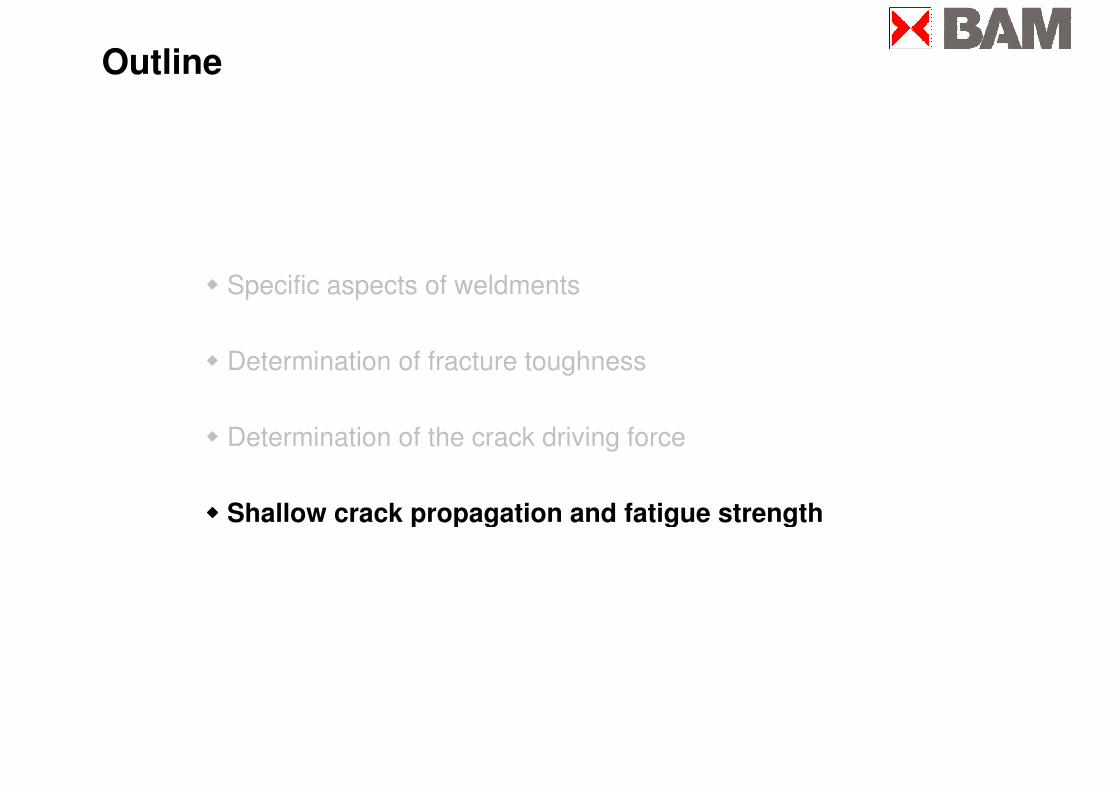
Outline
� Specific aspects of weldments
� Determination of fracture toughness
� Determination of the crack driving force
���� Shallow crack propagation and fatigue strength���� Shallow crack propagation and fatigue strength
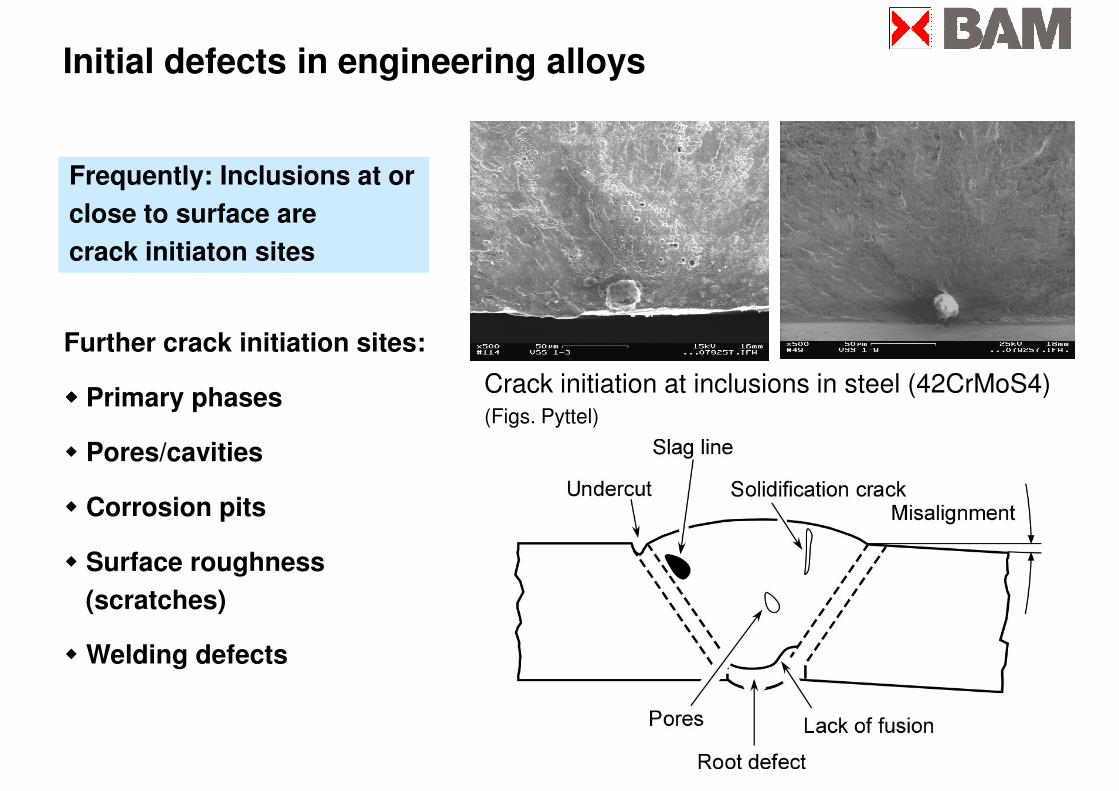
Frequently: Inclusions at or
close to surface are
crack initiaton sites
Initial defects in engineering alloys
crack initiaton sites
Further crack initiation sites:
���� Primary phases
� Pores/cavities
� Corrosion pits
Crack initiation at inclusions in steel (42CrMoS4)(Figs. Pyttel)
� Surface roughness
(scratches)
� Welding defects
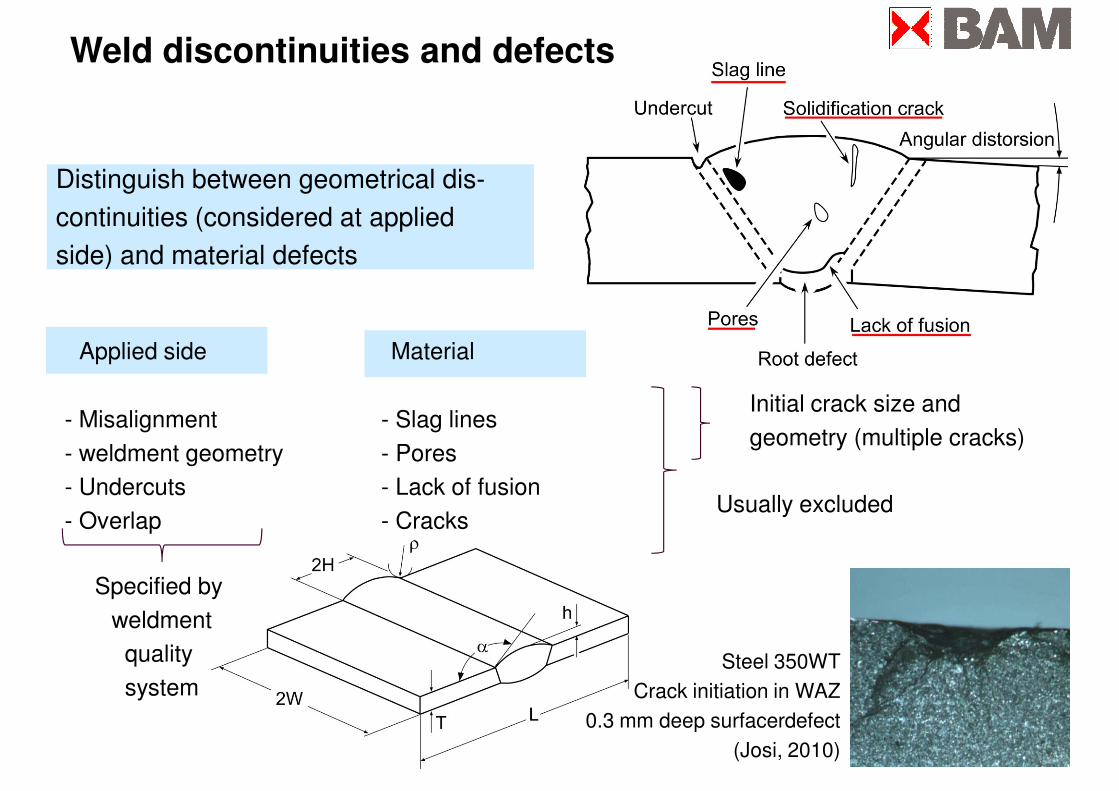
Distinguish between geometrical dis-
continuities (considered at applied
side) and material defects
Weld discontinuities and defects
side) and material defects
Applied side Material
- Misalignment - Slag lines
- weldment geometry - Pores
- Undercuts - Lack of fusion
- Overlap - Cracks
Initial crack size and
geometry (multiple cracks)
Usually excluded- Overlap - Cracks
Specified by
weldment
quality
systemSteel 350WT
Crack initiation in WAZ
0.3 mm deep surfacerdefect
(Josi, 2010)
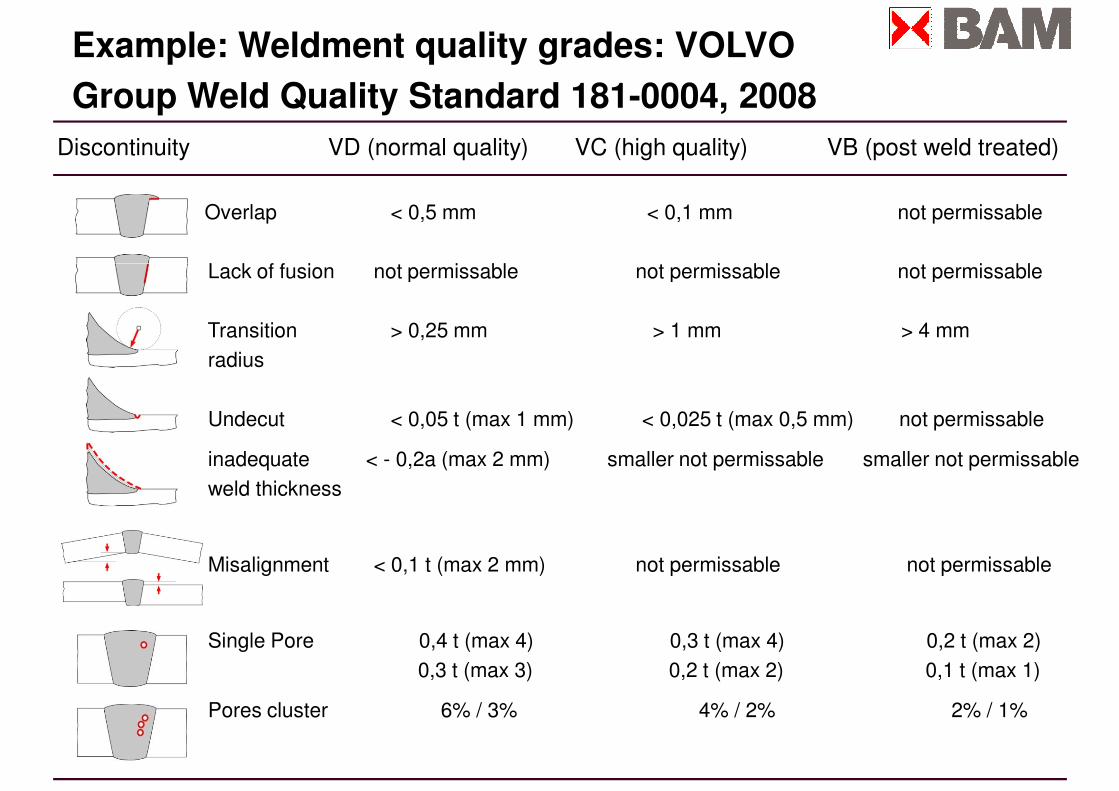
Discontinuity VD (normal quality) VC (high quality) VB (post weld treated)
Overlap < 0,5 mm < 0,1 mm not permissable
Lack of fusion not permissable not permissable not permissable
Example: Weldment quality grades: VOLVO
Group Weld Quality Standard 181-0004, 2008
Lack of fusion not permissable not permissable not permissable
Transition > 0,25 mm > 1 mm > 4 mm
radius
Undecut < 0,05 t (max 1 mm) < 0,025 t (max 0,5 mm) not permissable
inadequate < - 0,2a (max 2 mm) smaller not permissable smaller not permissable
weld thickness
Misalignment < 0,1 t (max 2 mm) not permissable not permissable
Single Pore 0,4 t (max 4) 0,3 t (max 4) 0,2 t (max 2)
0,3 t (max 3) 0,2 t (max 2) 0,1 t (max 1)
Pores cluster 6% / 3% 4% / 2% 2% / 1%
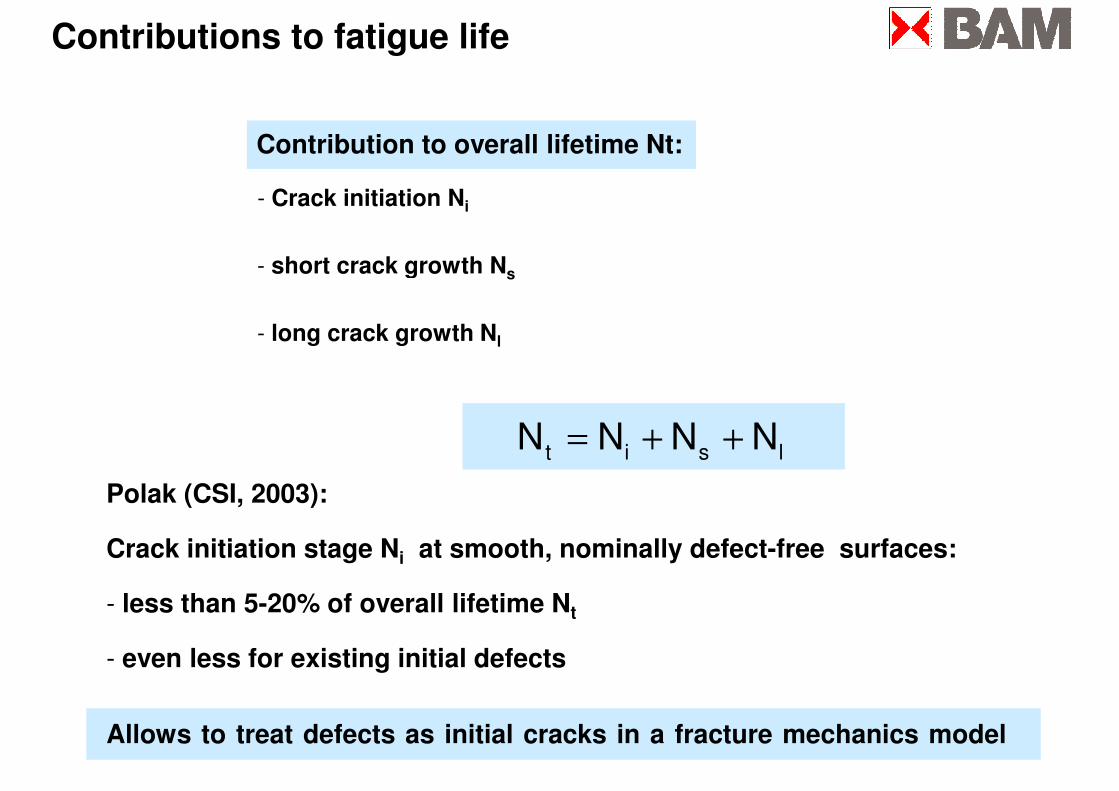
- Crack initiation Ni
- short crack growth N
Contributions to fatigue life
Contribution to overall lifetime Nt:
Polak (CSI, 2003):
- short crack growth Ns
- long crack growth Nl
t i s lN N N N= + +
Crack initiation stage Ni at smooth, nominally defect-free surfaces:
- less than 5-20% of overall lifetime Nt
- even less for existing initial defects
Allows to treat defects as initial cracks in a fracture mechanics model
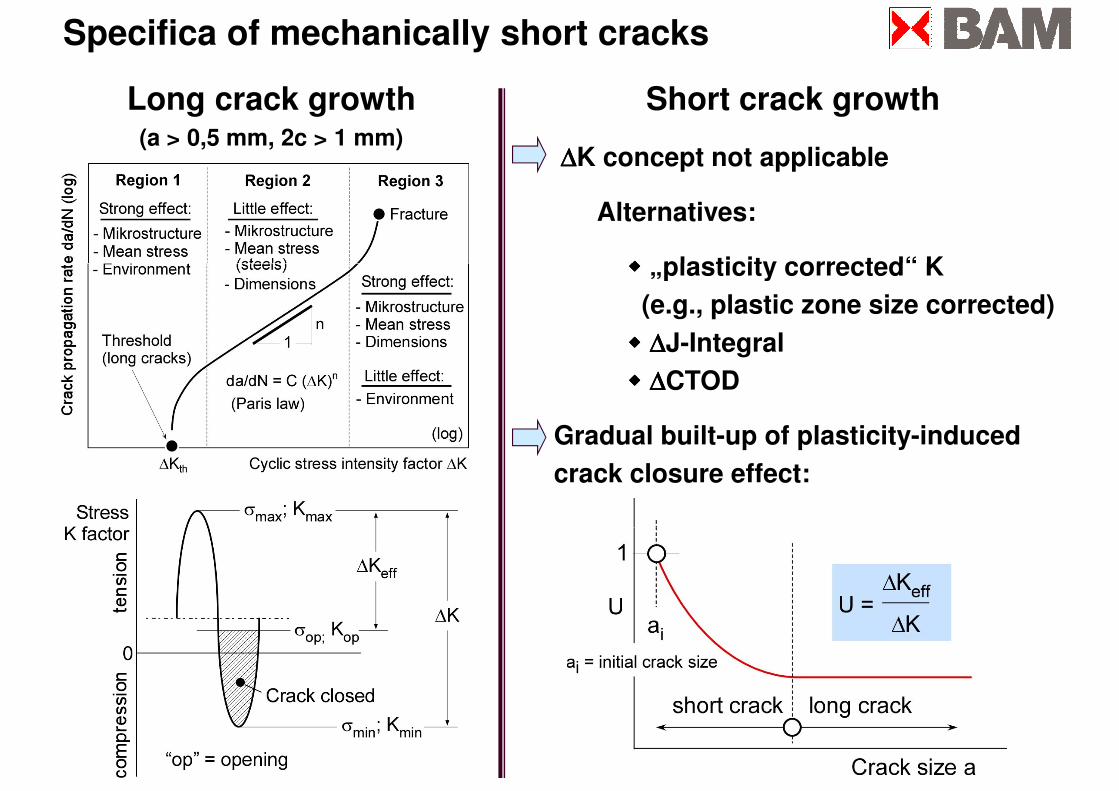
Long crack growth(a > 0,5 mm, 2c > 1 mm)
Short crack growth
∆∆∆∆K concept not applicable
Alternatives:
���� „plasticity corrected“ K
Specifica of mechanically short cracks
���� „plasticity corrected“ K
(e.g., plastic zone size corrected)
���� ∆∆∆∆J-Integral
���� ∆∆∆∆CTOD
Gradual built-up of plasticity-induced
crack closure effect:
Fracture and Crack Propagation in Weldments.
A Fracture Mechanics PerspectiveA Fracture Mechanics Perspective
���� Specific aspects of weldments
���� Determination of fracture toughness
���� Determination of the crack driving force
���� Determination of the crack driving force
���� Shallow crack propagation and fatigue strength