FRACTAL DIMENSION AS AN INDICATOR OF … et al..pdf · PROBABILITY FOR LANDSLIDES IN NORTH...
15
5 Štefan Majtán, Hiroshi Omura, Koichi Morita* FRACTAL DIMENSION AS AN INDICATOR OF PROBABILITY FOR LANDSLIDES IN NORTH MATSUURA, JAPAN Š. Majtán, H. Omura, K. Morita: Fractal dimension as an indicator of prob- ability for landslides in north Matsuura, Japan. Geografický časopis, 54, 2002, 1, 5 figs., 2 tabs., 17 refs. Fractal dimension as an indicator of similarity, density, complexity and frequency seems to be useful for analysing susceptibility assessment, distribution pattern. It can also be used as a comparable factor. To indicate the spatial distribution of the shallow landslide quantitatively, their fractal dimensions and probabilities were estimated in an landslide area north of Nagasaki in Japan. In order to calculate the fractal dimension, capacity and information dimensions were selected. Landslides were grouped on the basis of surface geometry analysis and geology of the study area. The probability of occurrence of landslides in an individual landslides group was calculated on the basis of the relationship between the ratio of the average landslide area and area of the landslide group and fractal dimension. Key words: surface analysis, distribution, landslide, fractal dimension, probabil- ity INTRODUCTION The concept of fractals has found wide applicability, since its original intro- duction by Mandelbrot (1967). Fractals are easy to understand, but sometimes, they seem to be chaotic and very complex. “Fractal dimension” is based on a mathematical theory which describes the quality of complex shape or degree of _______________ * Kyushu University, Faculty of Agriculture, Department of Forestry, Soil and Water Conservation Labora- tory, Hakozaki, 6-10-1, Higashi-ku, 812-8581 Fukuoka, Japan 5
Transcript of FRACTAL DIMENSION AS AN INDICATOR OF … et al..pdf · PROBABILITY FOR LANDSLIDES IN NORTH...

5
Štefan Majtán, Hiroshi Omura, Koichi Morita*
FRACTAL DIMENSION AS AN INDICATOR OF
PROBABILITY FOR LANDSLIDES IN NORTH MATSUURA,JAPAN
Š. Majtán, H. Omura, K. Morita: Fractal dimension as an indicator of prob-ability for landslides in north Matsuura, Japan. Geografický časopis, 54, 2002, 1, 5 figs., 2 tabs., 17 refs. Fractal dimension as an indicator of similarity, density, complexity and frequency seems to be useful for analysing susceptibility assessment, distribution pattern. It can also be used as a comparable factor. To indicate the spatial distribution of the shallow landslide quantitatively, their fractal dimensions and probabilities were estimated in an landslide area north of Nagasaki in Japan. In order to calculate the fractal dimension, capacity and information dimensions were selected. Landslides were grouped on the basis of surface geometry analysis and geology of the study area. The probability of occurrence of landslides in an individual landslides group was calculated on the basis of the relationship between the ratio of the average landslide area and area of the landslide group and fractal dimension. Key words: surface analysis, distribution, landslide, fractal dimension, probabil-ity
INTRODUCTION
The concept of fractals has found wide applicability, since its original intro-duction by Mandelbrot (1967). Fractals are easy to understand, but sometimes, they seem to be chaotic and very complex. “Fractal dimension” is based on a mathematical theory which describes the quality of complex shape or degree of _______________ * Kyushu University, Faculty of Agriculture, Department of Forestry, Soil and Water Conservation Labora-
tory, Hakozaki, 6-10-1, Higashi-ku, 812-8581 Fukuoka, Japan
5

6
irregularity (Mandelbrot 1967). A summary treatment of fractals from the appli-cation point of view has been given by Feder (1988). The fundametal principles of fractals, chaos, and aspects of dynamical systems in the context of geological and geophysical problems have been introduced by Turcotte (1992 and 1997) and Pelletier (1997).
In the last years, many authors have shown interest in the calculation of qualitative distribution of landslides based on fractals (Kubota 1994, Omura and Hicks 1994, Omura 1995, Tarutani, Majtan, Morita, Omura 2000). Fractal di-mension as the indicator of similarity, density, complexity and frequency seems to be useful for analysing susceptibility assessment, distribution pattern and can also be used as a comparative factor.
The purpose of this paper is to use the method of fractal dimension with its relation to geometrical parameters of relief and geology as the basis for assess-ment of landslide susceptibility. The geometric parameters of relief were calcu-lated as is described in the works of Krcho (1990), Mitašová and Hofierka (1993), Zlocha (1996).
FRACTAL DIMENSION ANALYSIS
In order to calculate the fractal dimension of the spatial distribution of land-slides, capacity and information dimensions were selected. The general equation of fractal dimension can be expressed as follows:
where N is the total number of self-similar pieces, S is the magnification factor and D is the fractal dimension.
Fractal dimension depends on the number of self-similar pieces as well as on the magnification factor (equal to scale). The number of self-similar pieces means the number of scale units, which are occupied by landslides. Due to the limited number of landslides, fractal dimension was calculated with certain limitation of scale and iterations.
Limitation of the scale ● The magnitude of the scale ranges between minimal and maximal distances
of individual landslides in this study. ● The maximun size of the scale is equal to half the maximum distance be-
tween landslides in this study. ● The other sizes of the scale are decreasing continuously by two in arith-
metical order. ● The iteration is possible, if the regression coefficient of the magnification
factor and the number of self-similar pieces is higher or equal to “0.99”. Landslides in a group have sufficient self-similarity, through their power re-
lationship of the spatial distribution of the landslides with respect to the differ-ent magnitude, and can have a fractal dimension (Kubota 1996). Therefore, the landslides studied were grouped on the basis of geometrical analysis and the ge-ology of the study area. The procedures result in six groups from the elevation
DN S≈ (1)
7
and slope points of view, in four groups from the geometric form and aspect points of view and in three groups from the geological point of view, as shown in Tab. 1.
Tab. 1. Range of categories choosen from different geomorphological points of
view and geology
Capacity dimension
The capacity dimension is also named the box-counting dimension (Voss 1986, Turcote 1997). By this method a mesh (equal to magnitude) of size ε is first placed on the distribution map of landslides, over the landslide group of which the capacity dimension DC is to be calculated. The first mesh size is equal to the maximum size of scale. Then the number of meshes containing the sketch of the landslide group, N(ε) is counted. The process is repeated for different size of mesh up to limitation of scale as mentioned above.
After that, logarithmic values of scales and numbers are fitted by linear re-gression calculated by the least square method (from Ezekiel and Fox 1959). The absolute value of the slope of this fit is the capacity dimension of the land-slide group and can be mathematically expressed in the following equation 2 (from Ezekiel and Fox 1959),
where S is the scale, N is the sum of the occupied meshes, n is the number of iteration and MS and MN are the mean of scale and sum of the occupied meshes, respectively.
Information dimension
The centroids of the landslide group of which the information dimension is to be calculated, are covered by a set of N meshes of size ε. The mesh size and number of iteration has been limited by the same way as the previous method. To calculate the information dimension, we have to calculate the number of landslides as Ni in each of the N cells and determine the probability of finding a landslide in that cell Pi (eq. 3)
Categories Elevation [m]
Slope [°]
Aspect Geometric form
Geology
1 <= 100 <= 5 North Fcc Holocene
2 101-200 6-10 East Fcx Late Miocene
3 201-300 11-15 South Fxc Early Miocene
4 301-400 16-20 West Fxx -
5 401-500 21-25 - - -
6 > 500 > 25 - - -
2 2
( ),
( ) ( )
S Nc
S
SN nM MD
S n M
−=
−
∑∑
(2)

8
where N0 is the total number of landslides in the landslide group. The information entropy is defined by the expression (4) (Morse 1969). The values of the information entropy and logarithmic values of scales are
fitted by linear regression calculated by the least square method. The absolute value of the slope of this fit is the information dimension of landslide group and can be mathematically expressed in equation 5 (from Ezekiel and Fox 1959).
where S is the scale, I is the sum of the information entropy of the scale S, n is the number of iteration and MS and MI are means of the scales and information entropy respectively.
APPLICATION OF FRACTAL DIMENSION
The fractal dimension is not only expressed in terms of similarity, complex-ity and density of the area, but also in terms of the probability information. Omura (1995) studied the relationship between landslide density and fractal di-mension as follows. The number of landslides in the mesh has the relation with fractal dimension as given in equation 6
where ρ is the density of landslides in an area S, D is the fractal dimension and k is the constant of proportionality. The area ratio R of landslides was selected as a basic parameter for the calculation of the probability of a landslide based on the fractal dimension. Using the following equation 7, the area ratio can be calculated.
where R is the area ratio of landslides in an area S, N is the number of landslides and ā is the average area of the landslides. After substitution of equation 6 for equation 7, the ratio was calculated from equation 8
0 1
, 1,N
ii i
NP P
N= =∑ (3)
1
( ) log .N
i iI P Pε = −∑ (4)
2 2
( ),
( ) ( )
S II
S
SI nM MD
S n M
−=
−
∑∑
(5)
22
,DNkS
Sρ
−= = (6)
2,
aNR
S= (7)
2 .DR akS −= (8)
9
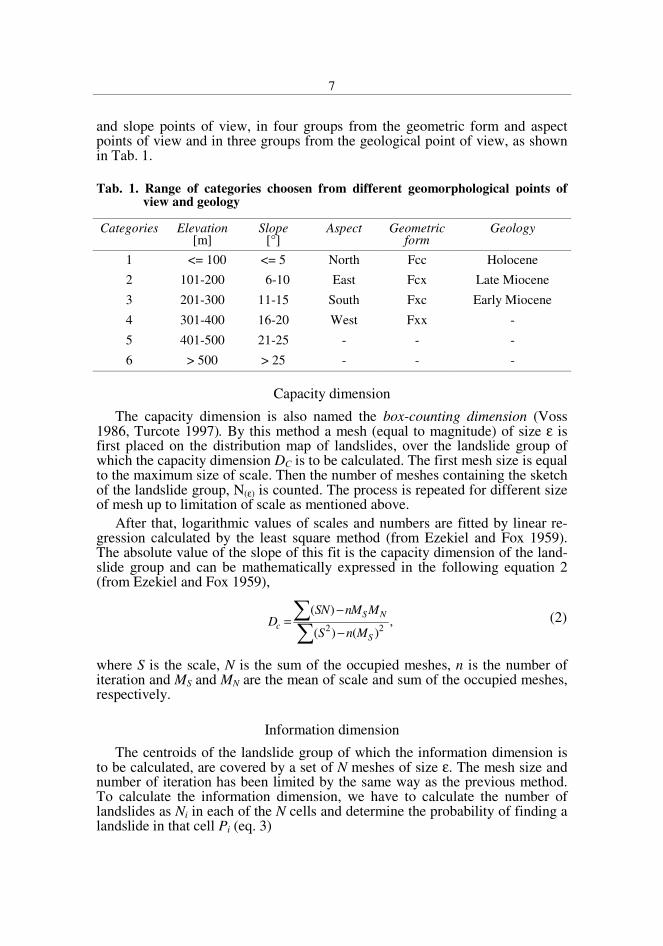
If the area S is fixed at the constant value S0 (equal to the average area of geomorphometric groups) we can get the relationship between the probability and fractal dimension as shown in Figure 1. If the regional tendency is kept for a short time into the near future, the probability of potential landslides can be suggested through the parameter R. Generally, the area of the higher value of fractal dimension also has a higher potentiality for development of landslides.
EXAMPLE OF APPLICATION
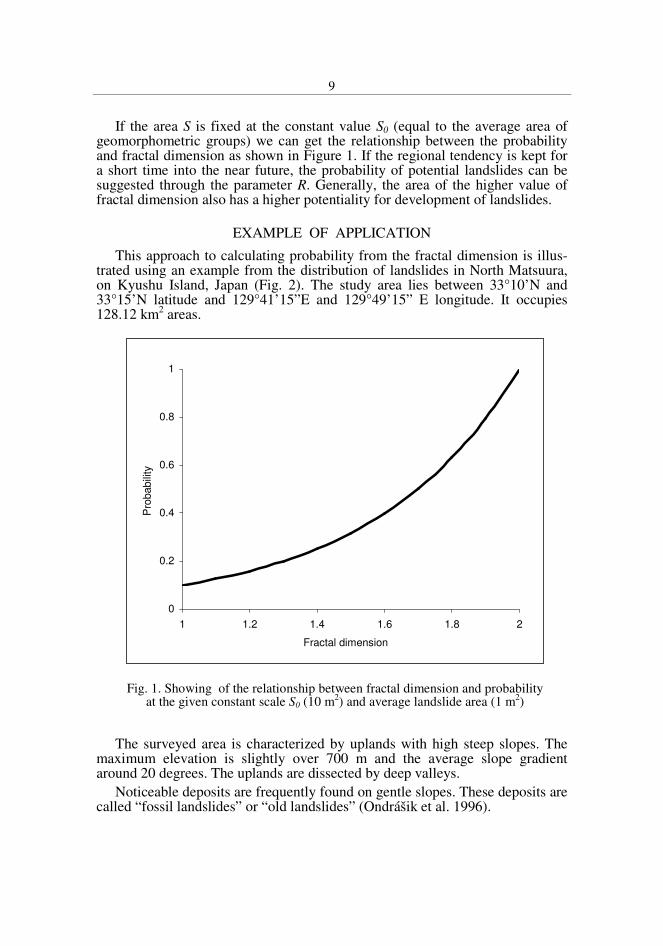
This approach to calculating probability from the fractal dimension is illus-trated using an example from the distribution of landslides in North Matsuura, on Kyushu Island, Japan (Fig. 2). The study area lies between 33°10’N and 33°15’N latitude and 129°41’15”E and 129°49’15” E longitude. It occupies 128.12 km2 areas.
The surveyed area is characterized by uplands with high steep slopes. The
maximum elevation is slightly over 700 m and the average slope gradient around 20 degrees. The uplands are dissected by deep valleys.
Noticeable deposits are frequently found on gentle slopes. These deposits are called “fossil landslides” or “old landslides” (Ondrášik et al. 1996).
0
0.2
0.4
0.6
0.8
1
1 1.2 1.4 1.6 1.8 2
Fractal dimension
Pro
babili
ty
Fig. 1. Showing of the relationship between fractal dimension and probability at the given constant scale S0 (10 m2) and average landslide area (1 m2)
10
Geologically, the area is mainly composed of the Sasebo Group and the Kita-Matsuura Basalt of Miocene age, but also partly of Holocene gravels, sands and clays. The bottom Early Miocene Sasebo Group consists of regular cyclic sediments from sandstone to mudstone of which the upper part is interca-lated with coal seams sandwiching a clay layer of tuff origin. On the other hand, the upper Late Miocene Kita-Matsuura Basalt layers consist of alcalic, tholeiitic and high-alumina basalt. The thickness of these layers is several tens of meters. Both of them are covered by highly weathered rock, residual soil and colluvial deposits from several meters up to more than 10 meters in thickness.
Geomorphological analysis
The gradient of the slope and geometric forms of georelief correspond to the elevation. Generally, the inclination of the slope increases with the elevation. In the case of the geometric forms, they fluently pass from concave-concave through concave-convex, convex-concave to convex-convex forms with in-creasing elevation. The slopes toward the south are relatively equally distributed in the individual elevation categories. The frequency of north and west slopes slightly increases with increasing elevation, while slopes toward the east de-crease with increasing elevation. Due to subordinate occurrence of the linear geometric forms of georelief, these were excluded from the evaluation. Higher values for the density of landslides were observed in the categories in which the slope inclination is higher, oriented toward the south and have the convex-concave geometric form of georelief. Generally, in the case of the slope layer, the area decreases with increasing of inclination. In the case of the aspect layer, east and west slopes have densities of landslides around 1.5 per square kilome-ter. North and south slopes have slightly over 2.0 per square kilometer. The
Fig. 2. Location of study area. Kita Matsuura on Kyushu island, Japan

11
geometric forms layer of georelief has the minimal range for the landslide den-sity value. That means landslides are rather uniformly distributed in them.
Fractal analysis
The location of the landslides, of which the fractal dimension is calculated, were taken from the series of the black and white aerial photographs at the scale 1:25 000. The landslide distribution map was corrected by reconnaissance in the field.
The fractal dimension of the whole study area was calculated from 243 data points, which represent the centroid of the landslides, by equation 2 and 5. The calculation results in two values of fractal dimension. The capacity dimension and the information dimension are estimated for the whole study area as 1.55 (Fig. 3). The landslides with fractal dimension close to 1 have the linear rela-tionship with the scale. Therefore, if we want to forecast the susceptible area, we can consider an increasing number of landslides with increasing area along some natural lineament such as rivers, faults, ridges, gullies (Omura 1995). Whereas, the landslides with fractal dimension close to 2 have relatively ho-mogenous distribution and should reflect specific tectonic structures such as two fault systems perpendicular to each other. The fractal dimension around 1.5 looks as the most dangerous, because the distribution is very chaotic and hetero-geneous. A landslide can be developed in unexpected places. Thus, the land-slide’s distribution pattern in the study area as a whole seems very dangerous.
Fig. 3. Dependence of the number of self-similar pieces on the magnitude factor calcu-lated by methods of box-counting and the entropy for all landslides in the study area
12
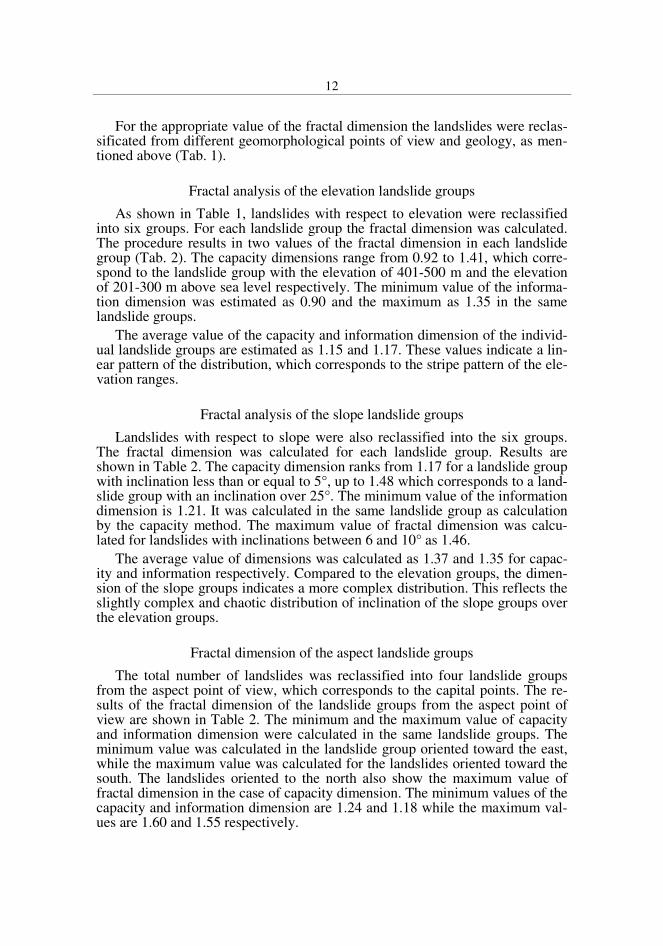
For the appropriate value of the fractal dimension the landslides were reclas-sificated from different geomorphological points of view and geology, as men-tioned above (Tab. 1).
Fractal analysis of the elevation landslide groups
As shown in Table 1, landslides with respect to elevation were reclassified into six groups. For each landslide group the fractal dimension was calculated. The procedure results in two values of the fractal dimension in each landslide group (Tab. 2). The capacity dimensions range from 0.92 to 1.41, which corre-spond to the landslide group with the elevation of 401-500 m and the elevation of 201-300 m above sea level respectively. The minimum value of the informa-tion dimension was estimated as 0.90 and the maximum as 1.35 in the same landslide groups.
The average value of the capacity and information dimension of the individ-ual landslide groups are estimated as 1.15 and 1.17. These values indicate a lin-ear pattern of the distribution, which corresponds to the stripe pattern of the ele-vation ranges.
Fractal analysis of the slope landslide groups
Landslides with respect to slope were also reclassified into the six groups. The fractal dimension was calculated for each landslide group. Results are shown in Table 2. The capacity dimension ranks from 1.17 for a landslide group with inclination less than or equal to 5°, up to 1.48 which corresponds to a land-slide group with an inclination over 25°. The minimum value of the information dimension is 1.21. It was calculated in the same landslide group as calculation by the capacity method. The maximum value of fractal dimension was calcu-lated for landslides with inclinations between 6 and 10° as 1.46.
The average value of dimensions was calculated as 1.37 and 1.35 for capac-ity and information respectively. Compared to the elevation groups, the dimen-sion of the slope groups indicates a more complex distribution. This reflects the slightly complex and chaotic distribution of inclination of the slope groups over the elevation groups.
Fractal dimension of the aspect landslide groups
The total number of landslides was reclassified into four landslide groups from the aspect point of view, which corresponds to the capital points. The re-sults of the fractal dimension of the landslide groups from the aspect point of view are shown in Table 2. The minimum and the maximum value of capacity and information dimension were calculated in the same landslide groups. The minimum value was calculated in the landslide group oriented toward the east, while the maximum value was calculated for the landslides oriented toward the south. The landslides oriented to the north also show the maximum value of fractal dimension in the case of capacity dimension. The minimum values of the capacity and information dimension are 1.24 and 1.18 while the maximum val-ues are 1.60 and 1.55 respectively.

13
The average value is 1.49 for capacity and 1.39 for information dimension. These values for dimension reflect a complex distribution in space.
Tab. 2. Capacity and information dimension with the ±2σσσσ errors, corresponding to a 95% confidence interval in individual geometric and geological groups
Elevation group Capacity dimension Information dimension
[m]
<= 100 1.13 ± 0.0776 1.29 ± 0.1031
101-200 1.28 ± 0.0591 1.26 ± 0.0539
201-300 1.41 ± 0.0815 1.35 ± 0.0676
301-400 1.04 ± 0.0558 1.17 ± 0.0639
401-500 0.92 ± 0.0801 0.90 ± 0.0902
> 500 1.11 ± 0.0939 1.05 ± 0.0777
Slope group
[°]
< 5 1.17 ± 0.0776 1.21 ± 0.0653
6-10 1.43 ± 0.0659 1.46 ± 0.0366
11-15 1.32 ± 0.0742 1.31 ± 0.0624
16-20 1.32 ± 0.0700 1.29 ± 0.0516
21-25 1.47 ± 0.0797 1.45 ± 0.0468
> 25 1.48 ± 0.1414 1.40 ± 0.1079
Aspect group
North 1.60 ± 0.0807 1.47 ± 0.0682
West 1.50 ± 0.0832 1.36 ± 0.0541
South 1.60 ± 0.0867 1.55 ± 0.0478
East 1.24 ± 0.0928 1.18 ± 0.0718
Geoforms group
Fcc 1.48 ± 0.0947 1.46 ± 0.0795
Fcx 1.53 ± 0.0720 1.51 ± 0.0506
Fxc 1.38 ± 0.0856 1.35 ± 0.0691
Fxx 1.52 ± 0.0714 1.45 ± 0.0571
Geology group
Holocene 1.05 ± 0.0576 1.04 ± 0.0467
Late Miocene 1.29 ± 0.0630 1.38 ± 0.0482
Early Miocene 1.33 ± 0.0694 1.33 ± 0.0498
14
Fractal dimension of the geometric forms landslide groups
In order to get the value of fractal dimension from geometric forms of geore-lief point of view, the landslides were reclassified into four geometric groups, which represent combinations of the concave and convex forms in the vertical and horizontal directions, respectively (Tab. 2). The minimum and maximum values of dimension were calculated in the same landslide group for both types of dimension. The capacity dimension was estimated in the range between 1.38 and 1.53 for the landslide groups with georelief of convex-concave and con-cave-convex geometric forms respectively. From the information dimension point of view, the minimal dimension was calculated as 1.35 and the maximum dimension as 1.51 for the same landslide groups.
The average dimension is 1.48 for capacity and 1.44 for the information di-mension. Likewise, as in the previous landslide group, the higher values of di-mension indicate a complex, dense as well as chaotic distribution of the land-slides in space.
Fractal dimensions of the geological landslide groups
For the calculation of the fractal dimension from the geological point of view, three landslide groups were classified: the Holocene, Early and Late Mio-cene landslide groups (Tab. 2). The minimum value for capacity as well as the information dimension was found in Holocene landslide group, while the maxi-mum values for the capacity and information dimension were estimated in the Early Miocene and Late Miocene landslide group repectively. The values of the dimension are 1.05, 1.33 and 1.04, 1.38 in order of capacity and information di-mension.
The average values for both dimensions are 1.22 and 1.25 respectively. The results show a relatively complex distribution. The close value of fractal dime-sion in the Early and Late Miocene landslide group indicates that the landslides may have developed on the margin of these two stratigraphic units.
Probability analysis based on fractal dimension
In order to calculate probability from fractal dimension analysis, the average landslide area as well as average area of the groups So of individual morphomet-rical parameters and geology were calculated. After substitution, So and the cor-responding value of fractal dimension into equation 8, the ratio R was calcu-lated. The results show a ratio R of the average landslides area to the average area of the groups for each geomorphometric group with dependency to the fractal dimension. This calculation was caried out for all morphometric parame-ters. In order to get the effective value of ratio for the concrete geomorphomet-ric group, the corresponding calculated value of the ratio R was weighted with the ratio of the average area So of the morphometric parameter to the area of the corresponding geomorphometric group Si (eq. 9)
.o
ii
SR R
S=
(9)
15
This means that the ratio of the geomorphometric group increases if the av-erage area So of the morphometric parameter is bigger than the area of the geo-morphometric group S and vice versa.
On the basis of this parameter, the probability from the individual morpho-logical point of view was calculated using equation 10.
where PQi is probability and RQi is the ratio in i geomorphometric group of the Q morphometric parameter.
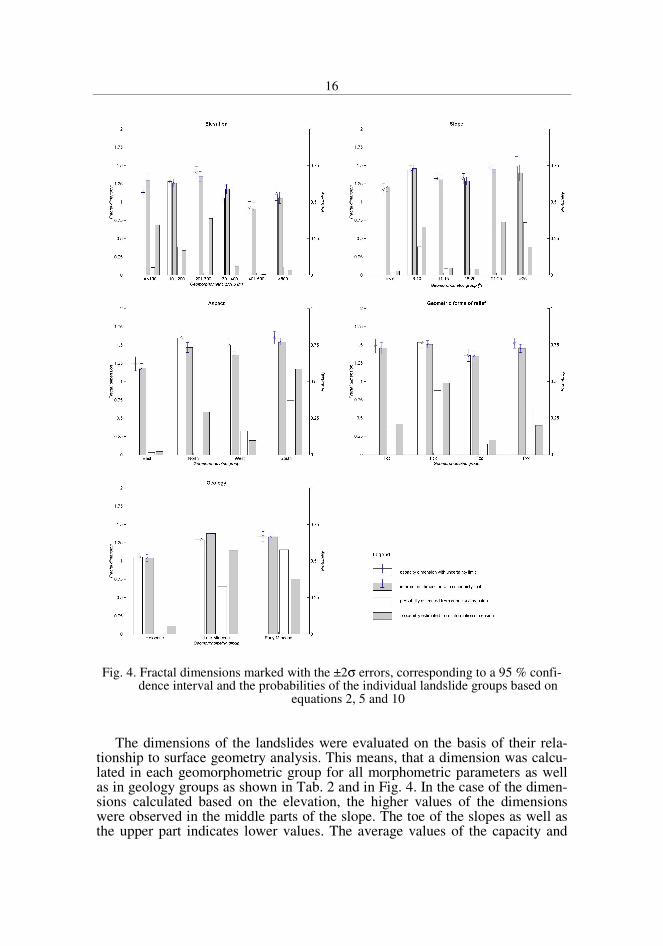
The procedures resulted in two values of the probabilities in each landslide group. The Fig. 4 shows the dimensions and probabilities in individual landslide group including ±2σ errors, corresponding to a 95 % confidence interval. In the case of elevation the high potentiality of landslides was observed in the eleva-tion range from 201 to 300 m above sea level and can be clearly distinguished. The higher values of the probabilities, in the case of the slope landslide groups, were observed between 21 and 25 degrees as well as on the slope with inclina-tion over 25 degrees. From the aspect point of view, the higher values probabili-ties were observed on the slope toward the south and the north. From geometric forms and geology the highest values of the probability were observed in con-cave-convex and Early Miocene landslide groups.
The representative value of the landslide susceptibility assessment based on the fractal dimension in each grid cell was calculated as an average of individ-ual probabilities in each grid cell. For this calculation the equation 10 was used. On the basis of these calculations, the potentiality map of landslide occurrence was prepared from the fractal analysis point of view.
where Pi is the landslide susceptibility assessment in “i” grid cell, is the sum of probabilities from elevation, slope, aspect, geometric forms and geological lay-ers respectively in “i” grid cell, and nS is number of layers.
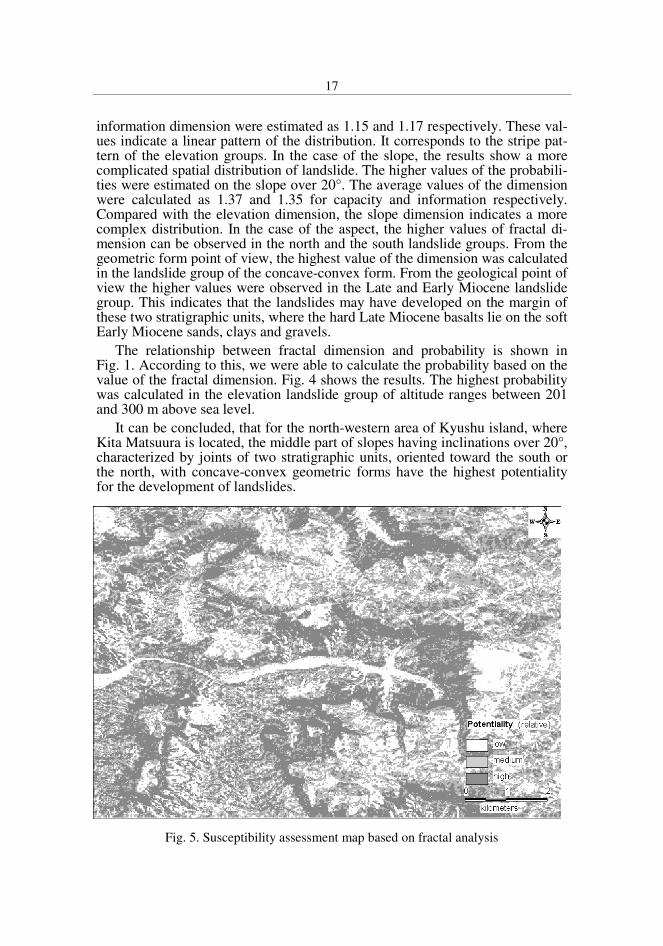
The occurrence probability of landslides ranges from 0.05 to 0.46. In order to clearly distinguish the area with lower and higher values of probability, the occurrence of probabilities were divided into three equal categories based on percentual distribution. That means one third of the whole study area is occu-pied by each of the categories. These categories indicate relatively low, medium and high areas of potentiality respectively from the geomorphometric analysis point of view. This map is based on uniformity of area, which means that areas with similar values of probability have the same category. The result is shown in Fig. 5.
CONCLUSION
In order to get an appropriate value of the fractal dimension of the land-slides, the capacity and the information methods were selected.
,QiQi
Qi
RP
R=
∑(10)
,Qi
is
PP
n=∑ (11)
16
The dimensions of the landslides were evaluated on the basis of their rela-tionship to surface geometry analysis. This means, that a dimension was calcu-lated in each geomorphometric group for all morphometric parameters as well as in geology groups as shown in Tab. 2 and in Fig. 4. In the case of the dimen-sions calculated based on the elevation, the higher values of the dimensions were observed in the middle parts of the slope. The toe of the slopes as well as the upper part indicates lower values. The average values of the capacity and
Fig. 4. Fractal dimensions marked with the ±2σ errors, corresponding to a 95 % confi-
dence interval and the probabilities of the individual landslide groups based on equations 2, 5 and 10
17
information dimension were estimated as 1.15 and 1.17 respectively. These val-ues indicate a linear pattern of the distribution. It corresponds to the stripe pat-tern of the elevation groups. In the case of the slope, the results show a more complicated spatial distribution of landslide. The higher values of the probabili-ties were estimated on the slope over 20°. The average values of the dimension were calculated as 1.37 and 1.35 for capacity and information respectively. Compared with the elevation dimension, the slope dimension indicates a more complex distribution. In the case of the aspect, the higher values of fractal di-mension can be observed in the north and the south landslide groups. From the geometric form point of view, the highest value of the dimension was calculated in the landslide group of the concave-convex form. From the geological point of view the higher values were observed in the Late and Early Miocene landslide group. This indicates that the landslides may have developed on the margin of these two stratigraphic units, where the hard Late Miocene basalts lie on the soft Early Miocene sands, clays and gravels.
The relationship between fractal dimension and probability is shown in Fig. 1. According to this, we were able to calculate the probability based on the value of the fractal dimension. Fig. 4 shows the results. The highest probability was calculated in the elevation landslide group of altitude ranges between 201 and 300 m above sea level.
It can be concluded, that for the north-western area of Kyushu island, where Kita Matsuura is located, the middle part of slopes having inclinations over 20°, characterized by joints of two stratigraphic units, oriented toward the south or the north, with concave-convex geometric forms have the highest potentiality for the development of landslides.
Fig. 5. Susceptibility assessment map based on fractal analysis
18
The susceptibility assessment map based on fractal analysis with respect to surface geometry analysis is shown in Fig. 5.
REFERENCES
EZEKIEL, M., FOX, K. A. (1959). Methods of correlation and regression analysis –
linear and curvilinear. New York (Wiley). FEDER, J. (1988). Fractals. New York (Plenum Press). KRCHO, J. (1990). Morfometrická analýza a digitálne modely georeliéfu. Bratislava
(Veda). KUBOTA, T. (1994). A study of fractal dimension of landslides. Journal of Japan
Landslide Society, 31-3, 9-15. KUBOTA, T. (1996). A study of fractal dimensions and geological conditions of land-
slides. Journal of Japan Landslide Society, 33-1. MANDELBROT, B. B. (1967). How long is the coast of Britain? Statistical self-
similarity and fractal dimension. Science, 156, 636-8. MITÁŠOVÁ, H., HOFIERKA, J. (1993). Interpolation by regularized spline with ten-
sion: II. Application to terrain modeling and surface geometry analysis. Mathemati-cal Geology, 25, 657-669.
MORSE, P. M. (1969). Thermal physics. New York (W. A. Benjamin). OMURA, H., HICKS, L. D. (1994). Fractal dimension analysis on shallow landslide
and channel net system in small watershed, In Ochiai, R., ed. Proceeding of the in-ternational symposium on forest hydrology. Tokio (IUFRO), pp. 407-414.
OMURA, H. (1995). Fractal dimension analysis on spatial distribution of shallow land-slides triggered by heavy rainfall. In Sassa, K., ed. Proceeding of the IUFRO World Congress. Tampere (IUFRO), pp. 97-104.
ONDRÁŠIK, R., JANSKÝ, L., IWAO, Y., OMURA, H. (1996). Research of geological hazard in Japan. Acta Geologica, Comenius University, 51, 5-15.
PELLETIER, J. D. (1997). Fractal models in geology. Dissertation, Faculty of the Graduate School, Cornell University.
TARUTANI, N., MAJTAN, S., MORITA, K., OMURA, H. (2000). Spatial distribution pattern of rapid shallow landslides in Amakasa island. In Zollinger, F., Fiebeger, G., eds. Proceeding of the Interpreevent 2000. Villach (INTERPRAEVENT), pp. 317-323.
TURCOTTE, D. L. (1992). Fractals and chaos in geology and geophysics. New York (Cambridge University Press).
TURCOTTE, D. L. (1997). Fractals and chaos in geology and geophysics. New York (Cambridge University Press).
VOSS, R. (1986). Random fractals: characterization and measurement. In Pynn, R., Skejeltorp, A., eds. Scaling phenomena in disordered systems. New York (Plenum Press), pp. 1-11.
ZLOCHA, M. (1996). Interpolation, morphometric analysis and geo-models. PhD. The-sis, Faculty of Natural Sciences, Comenius University, Bratislava.
Štefan M a j t á n, Hiroshi O m u r a, Koichi M o r i t a
FRAKTÁLNA DIMENZIA AKO INDIKÁTOR NÁCHYLNOSTI
ÚZEMIA NA ZOSÚVANIE V SEVERNEJ MATSUURE V JAPONSKU
Cieľom štúdie bolo poukázať na možnosti aplikácie fraktálnej dimenzie pri zhoto-
vení mapy náchylnosti územia na zosúvanie. Práca bola zameraný na sledovanie vzťahu fraktálnej dimenzie ku geomorfologickým parametrom reliéfu a geológii územia.
19
Na výpočet fraktálnej dimenzie zosuvov boli použité dve metódy, mriežková (box-counting) a informačná (information). Zosuvy boli zoskupené na základe výsledkov analýzy digitálneho modelu reliéfu a geológie. Výsledkom zoskupenia bolo šesť skupín zosuvov pri použití elevačného a sklonitostného parametra reliéfu, štyri skupiny pri použití orientácie sklonu svahu a geometrických foriem reliéfu a tri skupiny z hľadiska geológie. V každej skupine bola počítaná fraktálna dimenzia.
Vypočítaná fraktálna dimenzia kolísala v rozmedzí od 0,92 do 1,60 pri použití mriežkovej a od 0,90 do 1,55 pri použití informačnej metódy. Všeobecne môžeme povedať, že hodnota fraktálnej dimenzie odzrkadľuje podobnosť, hustotu, zložitosť a frekvenciu distribúcie zosuvov. Hodnota fraktálnej dimenzie 1 zodpovedá lineárnej a hodnota 2 homogénnej priestorovej distribúcii zosuvov. Fraktálna dimenzia blízko hodnoty 1,5 poukazuje na heterogénnu, chaotickú distribúciu zosuvov v priestore.
Na základe vzťahu priemernej plochy zosuvu k celkovej ploche danej skupiny zosuvov a fraktálnej dimenzie bola počítaná pravdepodobnosť P v zodpovedajúcom území. Ak by v krátkom období bol regionálny trend územia stály, potom by parameter P mohol odzrkadľovať pravdepodobnosť výskytu zosuvov na danom území. Najvyššia pravdepodobnosť výskytu zosuvov bola vypočítaná pre skupinu zosuvov reprezentujúcu územie s nadmorskou výškou od 201 do 300 m nad morom.
Záverom môžeme konštatovať, že fraktálna dimenzia sa dá použiť ako parameter na zhodnotenie náchylnosti územia na zosúvanie. Dôkazom môže byť praktický príklad zo severozápadnej časti Kyushu, kde stredná časť svahov s inklináciou nad 20 stupňov, charakterizovaná kontaktom dvoch stratigrafických jednotiek s orientáciou na sever alebo na juh, konkávno-konvexnou formou reliéfu má najväčšiu pravdepodobnosť pre rozvoj a výskyt zosuvov.