
Fractal and multifractal analysis: A revie · 2010-10-20 · whereK is a constant and D is known as...
16
Fractal and multifractal analysis: A review R. Lopes a,b , N. Betrouni a, * a Inserm, U703, Pavillon Vancostenobel, CHRU Lille, Lille Cedex 59037, France b Laboratoire d’automatique LAGIS, CNRS UMR 8146, USTL, Bâtiment P2, Villeneuve d’Ascq 59655, France article info Article history: Received 8 November 2007 Received in revised form 1 April 2009 Accepted 15 May 2009 Available online 27 May 2009 Keywords: Fractal analysis Fractal dimension Multifractal analysis Multifractal spectrum Texture Characterization abstract Over the last years, fractal and multifractal geometries were applied extensively in many medical signal (1D, 2D or 3D) analysis applications like pattern recognition, texture analysis and segmentation. Applica- tion of this geometry relies heavily on the estimation of the fractal features. Various methods were pro- posed to estimate the fractal dimension or multifractal spectral of a signal. This article presents an overview of these algorithms, the way they work, their benefits and their limits. The aim of this review is to explain and to categorize the various algorithms into groups and their application in the field of medical signal analysis. Ó 2009 Elsevier B.V. All rights reserved. 1. Introduction The idea of describing natural phenomena by studying statisti- cal scaling laws is not recent. Indeed, many studies were carried out on this topic (Bachelier, 1900; Frish, 1995; Kolmogorov, 1941; Mandelbrot, 1963). However, there has been a recent resur- gence of interest in this approach. A great number of physical sys- tems tend to present similar behaviours on different scales of observation. In the 1960s, the mathematician Benoît Mandelbrot used the adjective ‘‘fractal” to indicate objects whose complex geometry cannot be characterized by an integral dimension. The main attraction of fractal geometry stems from its ability to describe the irregular or fragmented shape of natural features as well as other complex objects that traditional Euclidean geometry fails to analyse. This phenomenon is often expressed by spatial or time-domain statistical scaling laws and is mainly characterized by the power-law behaviour of real-world physical systems. This con- cept enables a simple, geometrical interpretation and is frequently encountered in a variety of fields, such as geophysics, biology or fluid mechanics. To this end, Mandelbrot introduced the notion of fractal sets (Mandelbrot, 1977), which enables to take into ac- count the degree of regularity of the organizational structure re- lated to the physical system’s behaviour. Fractal geometry is widely used in image analysis problems in general and especially in the medical field. It is applied in different ways with different results. However, there has been no review pa- per to digest these different methods and their application. The purpose of this paper is to provide a survey of these methods and to discuss the principal results. This research may provide assistance to researchers aiming to use this geometry in medical imaging applications. It is organised as follow: in the next section, we introduce more formally the fractals; Section 3 discusses the relevance of fractals in image analysis. Section 4 gives the survey of the methods, their principles and limitations. Sections 5 and 6 are respectively reserved to multifractal analysis and the associ- ated algorithms. Section 7 discusses the main applications of frac- tals/multifractals in the medical image analysis procedures and the methods used. 2. Fractals and dimensions A definition that can illustrate the notion of fractal can be as fol- lows: consider an object. One has to take an element of this object. One has to surround it with a sphere of a given radius R and count the amount of object elements R inside the sphere. The measure of R can be arbitrary. Here, of importance is only the dependence of R on the sphere radius after averaging over the element put in its ori- gin. This definition takes into account the fact that the relevant dimension of an object depends on the spatial scale. A fundamental characteristic of fractal objects is that their mea- sured metric properties, such as length or area, are a function of the scale of measurement. A classical example to illustrate this prop- erty is the ‘‘length” of a coastline (Mandelbrot, 1967). When mea- sured at a given spatial scale d, the total length of a crooked coastline L(d) is estimated as a set of N straightline segments of 1361-8415/$ - see front matter Ó 2009 Elsevier B.V. All rights reserved. doi:10.1016/j.media.2009.05.003 * Corresponding author. Tel.: +33 320 446 7 22; fax: +33 320 446 715. E-mail address: [email protected] (N. Betrouni). Medical Image Analysis 13 (2009) 634–649 Contents lists available at ScienceDirect Medical Image Analysis journal homepage: www.elsevier.com/locate/media
Transcript of Fractal and multifractal analysis: A revie · 2010-10-20 · whereK is a constant and D is known as...

Medical Image Analysis 13 (2009) 634–649
Contents lists available at ScienceDirect
Medical Image Analysis
journal homepage: www.elsevier .com/locate /media
Fractal and multifractal analysis: A review
R. Lopes a,b, N. Betrouni a,*
a Inserm, U703, Pavillon Vancostenobel, CHRU Lille, Lille Cedex 59037, Franceb Laboratoire d’automatique LAGIS, CNRS UMR 8146, USTL, Bâtiment P2, Villeneuve d’Ascq 59655, France
a r t i c l e i n f o
Article history:Received 8 November 2007Received in revised form 1 April 2009Accepted 15 May 2009Available online 27 May 2009
Keywords:Fractal analysisFractal dimensionMultifractal analysisMultifractal spectrumTextureCharacterization
1361-8415/$ - see front matter � 2009 Elsevier B.V. Adoi:10.1016/j.media.2009.05.003
* Corresponding author. Tel.: +33 320 446 7 22; faxE-mail address: [email protected] (N. Betrou
a b s t r a c t
Over the last years, fractal and multifractal geometries were applied extensively in many medical signal(1D, 2D or 3D) analysis applications like pattern recognition, texture analysis and segmentation. Applica-tion of this geometry relies heavily on the estimation of the fractal features. Various methods were pro-posed to estimate the fractal dimension or multifractal spectral of a signal. This article presents anoverview of these algorithms, the way they work, their benefits and their limits. The aim of this reviewis to explain and to categorize the various algorithms into groups and their application in the field ofmedical signal analysis.
� 2009 Elsevier B.V. All rights reserved.
1. Introduction
The idea of describing natural phenomena by studying statisti-cal scaling laws is not recent. Indeed, many studies were carriedout on this topic (Bachelier, 1900; Frish, 1995; Kolmogorov,1941; Mandelbrot, 1963). However, there has been a recent resur-gence of interest in this approach. A great number of physical sys-tems tend to present similar behaviours on different scales ofobservation. In the 1960s, the mathematician Benoît Mandelbrotused the adjective ‘‘fractal” to indicate objects whose complexgeometry cannot be characterized by an integral dimension.
The main attraction of fractal geometry stems from its ability todescribe the irregular or fragmented shape of natural features aswell as other complex objects that traditional Euclidean geometryfails to analyse. This phenomenon is often expressed by spatial ortime-domain statistical scaling laws and is mainly characterized bythe power-law behaviour of real-world physical systems. This con-cept enables a simple, geometrical interpretation and is frequentlyencountered in a variety of fields, such as geophysics, biology orfluid mechanics. To this end, Mandelbrot introduced the notionof fractal sets (Mandelbrot, 1977), which enables to take into ac-count the degree of regularity of the organizational structure re-lated to the physical system’s behaviour.
Fractal geometry is widely used in image analysis problems ingeneral and especially in the medical field. It is applied in differentways with different results. However, there has been no review pa-
ll rights reserved.
: +33 320 446 715.ni).
per to digest these different methods and their application. Thepurpose of this paper is to provide a survey of these methodsand to discuss the principal results. This research may provideassistance to researchers aiming to use this geometry in medicalimaging applications. It is organised as follow: in the next section,we introduce more formally the fractals; Section 3 discusses therelevance of fractals in image analysis. Section 4 gives the surveyof the methods, their principles and limitations. Sections 5 and 6are respectively reserved to multifractal analysis and the associ-ated algorithms. Section 7 discusses the main applications of frac-tals/multifractals in the medical image analysis procedures and themethods used.
2. Fractals and dimensions
A definition that can illustrate the notion of fractal can be as fol-lows: consider an object. One has to take an element of this object.One has to surround it with a sphere of a given radius R and countthe amount of object elements R inside the sphere. The measure ofR can be arbitrary. Here, of importance is only the dependence of Ron the sphere radius after averaging over the element put in its ori-gin. This definition takes into account the fact that the relevantdimension of an object depends on the spatial scale.
A fundamental characteristic of fractal objects is that their mea-sured metric properties, such as length or area, are a function of thescale of measurement. A classical example to illustrate this prop-erty is the ‘‘length” of a coastline (Mandelbrot, 1967). When mea-sured at a given spatial scale d, the total length of a crookedcoastline L(d) is estimated as a set of N straightline segments of

R. Lopes, N. Betrouni / Medical Image Analysis 13 (2009) 634–649 635
length d. Because small details of the coastline not recognized atlower spatial resolutions become apparent at higher spatial resolu-tions, the measured length L(d) increases as the scale of measure-ment d increases. Thus, in fractal geometry, the Euclidean conceptof ‘‘length” becomes a process rather than an event, and this pro-cess is controlled by a constant parameter (Fig. 1).
More formally, Mandelbrot (1983) defined a fractal set as a setfor which the Hausdorff dimension (Dh) is greater than its topolog-ical dimension (DT). With:
The Hausdorff–Besicovitch dimension Dh is defined as the loga-rithmic ratio between the number N of an object’s internalhomotheties and the reciprocal of the common ratio r of thishomothety:
Dh ¼lnðNÞln 1
r
� � ð1Þ
The homothety term could be associated to a reduction term. Forexample, a fractal respecting Eq. (1) will be constituted of N pat-terns of which the size has been reduced of a factor r (forhomothety).
The topological dimension DT (defined by recurrence) of an ob-ject corresponds to the number of independent variables needed todescribe it. Thus, a point has a 0-dimensional, a curve has a 1-dimensional, a plane has a 2-dimensional, and in general euclideanspace Rn has n-dimensional.
Still according to Mandelbrot (1967), analytically, the relation-ship between the measuring scale d and the length L can be ex-pressed as:
LðdÞ ¼ K � dð1� DÞ ð2Þ
where K is a constant and D is known as the fractal dimension, a noninteger number (fractional). It is the main tool used to describe thefractal geometry and the heterogeneity of irregular shapes. It allowscapturing what is lost in traditional geometrical representation ofshapes. In Euclidean geometry, topological dimensions (DT) of formsremain constant and do not provide detail about the irregularity ofthe form. For instance, in 1D, DT is unable to distinguish a straightline and a crooked line.
From another side, fractals are considered as self-similar ob-jects. This last feature is a key issue in fractals. It implies that theobject looks similar to its zoomed part. Formally, self-similarityis defined as a property where a subset, when magnified to the sizeof the whole, is indistinguishable from the whole (Mandelbrot,1967).
In the same context, fractals are said self-affine if the variationin one direction scales differently than the variation in anotherdirection (Mandelbrot, 1985). Whereas, self-similar objects areisotropic.
3. Fractals and image analysis
The diagnostic interpretation of medical images is a multi-stepstask where the aim is the detection of potential abnormalities. Thisgoal is accurately achieved when the clinician integrates two pro-cesses. The first is the image perception to recognize unique imagepatterns and the second is the identification of the relationship be-tween perceived patterns and possible diagnoses. The success ofthese two steps relies heavily on the clinician skill. One of the usedfeatures in this process is texture which is a rich source of visual
Fig. 1. The first iterations to build a fractal structure.
information and is a key component in image analysis and under-standing in humans. Texture is known to provide cues about scenicdepth and surface orientation and, as such, describes the content ofboth natural and artificial images. Also, there is evidence of percep-tual learning in texture-coding mechanisms and in textural dis-crimination (Tourassi, 1999).
In light of this, many studies were conducted to develop algo-rithms that can quantify the textural properties of an image. How-ever, the exciting evolution of both texture analysis algorithms andcomputer technology revived researchers’ interest in applicationsfor medical imaging in recent years. During the past decade, resultsfrom numerous published articles have shown the ability of tex-ture analysis algorithms to extract diagnostically meaningful infor-mation from medical images that were obtained with variousimaging modalities, such as chest radiography, mammography,ultrasound (US), computed tomography (CT), single photon emis-sion computed tomography (SPECT), positron emission tomogra-phy (PET) and magnetic resonance imaging (MRI).
The applicability and the relevance of fractal geometry in med-ical image analysis is justified by the fact that self-similarity canhardly be verified in biological objects imaged with a finite resolu-tion. Indeed, the images are not only spectrally and spatially com-plex, but they often exhibit certain similarities at different spatialscales. This assertion induces that spatially complex patterns couldbe described by simple texture features. In fact, the problem of fea-tures definition for texture analysis in image understanding andpattern recognition was an increasing research domain for manyyears (Haralick et al., 1973; Pratt et al., 1978). Precisely, fractalgeometry offers the ability to describe and to characterize the com-plexity of the images or more precisely of their texturecomposition.
4. Fractal dimension computing methods
When applied in image analysis, fractal geometry is oftenbrought to the evaluation of the fractal dimension (referred to asFD or D). Many methods exist to compute this dimension; eachmethod has its own theoretic basis. This fact often leads to obtaindifferent dimensions by different methods for the same feature.These differences appear because the Hausdorff–Besicovitchdimension (Eq. (1)) is not computable in this form in most cases.Thus, the methods approximate it using different algorithms toestimate the parameter N.
Although, the applied algorithms differ, they obey to the samebasis summarized by the three steps:
– Measure the quantities of the object using various step sizes.– Plot log (measured quantities) versus log (step sizes) and fit a
least-squares regression line through the data points.– Estimate FD as the slope of the regression line.
In the next paragraph, we present and classify the most wide-spread literature methods grouped into three classes: box-count-ing methods; fractional Brownian motion (fBm) methods, andarea measurement methods.
The first methods were the box-counting methods. In thesemethods the signals are represented on a finite scale grid and thegrid effects interplayed with the computing fractal dimension.For this reason, other methods have been defined to remove thegrid effects such as the fBm methods.
4.1. Box-counting methods
Methods in this class share the following steps: each algorithmrequires a meshing of the signal, formulation of a probability in

636 R. Lopes, N. Betrouni / Medical Image Analysis 13 (2009) 634–649
each generated box and the estimation of the FD by a least-squareslinear fitting as last step. The box-counting methods have been thefirst methods to compute the FD of a signal. Their principles weresimple and easy to develop, but, as it will be shown below, theypresent some drawbacks.
4.1.1. Box-counting method (BC)This method was defined by Russel et al. (1980), it is the most
frequently used and most popular method. By covering a binarysignal with boxes of length r, the FD is estimated as:
FD ¼ � limr!0
logðNðrÞÞlogðrÞ ð3Þ
where N(r) is number of boxes needed to completely cover thesignal.
This method has many limitations because it requires signalbinarization. Later on, Normant and Tricot (1991) showed that thismethod is not theoretically well founded and is valid only for sta-tistically self-similar signals.
Moreover, as the reiteration for different sizes of r can producevarious sizes of Nr, the grid should be randomly relocated at eachiteration (Appleby, 1996). More recently, Pruess (2007) showedthat the computation of the FD is box size sensitive.
Always in the box-counting methods class, the compass methoddefined by Mandelbrot (1983) and the yardstick method definedby Sanderson and Goulding (1990) in 1990 presented the samedrawbacks.
4.1.2. Differential box-counting method (DBCM)Differential box-counting method (DBCM) is an adaptation of
the box-counting method. It was proposed by Chaudhuri and Sar-kar (1995) to solve some of limitations of the BM method. It has theadvantage to work on grey-scale images and thus the binarizationstep is avoided. The signal is partitioned into boxes of various size rand N(r) is computed like the difference between the minimumand the maximum grey levels in the (i, j)th box. This step is re-peated for all boxes and the FD is estimated as in Eq. (3).
An important limit of the box-counting methods is the choice ofthe box size. Many studies were done to find the upper and lowerbounds for the box size and in this regard (Chen et al., 1993) pro-posed a theoretical justification for a restriction on the smallestbox size inspired by the work of Pickover and Khorasani (1986).Also Bisoi and Mishra (2001) established a lower bound of thebox size to ensure accurate results. They showed that, with a toolow box size, the maximum number of boxes above the grid wouldbe more than the number of available intensity levels. The result-ing unaccounted boxes would lead to an underestimation of FD. Inthe same manner, for a too high box size, the number of boxeswould be much less than the number of intensity levels.
Asvestas et al. (1998) showed that this method was not numer-ically stable. Indeed they tested this method on a set of imagesgenerated by the random midpoint displacement method. Theyhighlighted the fact that the method underestimates the true valueof FD.
Improvements of the ‘‘differential box-counting” method aredescribed in (Biswas et al., 1998; Jin et al., 1995).
4.1.3. ‘‘Extended counting” method (XCM)The extended counting method ‘‘XCM” (Sandau and Kurz, 1997)
was proposed as an alternative to the BCM. The principle of theXCM can be formulated as follows: The BCM is applied to manysubsets of a fractal set and the maximum of the subsets’ dimen-sions is taken as the FD of the set. On the other hand, the BCM,as it is used for subsets, it is extremely simplified (a box-countingregression line is built only on the basis of two points).
This method can be compared to the BCM because the FD iscomputed on binary signals. Although the BCM is the most wide-spread, Sandau and Kurz (1997) showed that the XCM presentssome benefits. Indeed, XCM, in contrast to BCM, calculates a mea-sure of complexity without regression. Hence, this measure growsmonotonously with complexity and is determined by the mostcomplex region of the signal. This corresponds to an important fea-ture of FD, the maximum property, which is approximately fulfilledby XCM, but not by BCM. Also, XCM is less sensitive to the signalrotation and translation influence.
The drawbacks of this method are that it can only be applied tobinary signals. Hence, it is often used to compute the FD of a skel-etonized image (Chung et al., 2002). Moreover XCM has tendencyto overestimate the FD. Finally, Prigarin et al. (2008) tested XCMon fractional Brownian signals and concluded that the XCM isnot suitable for these signals.
4.2. Fractional Brownian motion (fBm) methods
The fractal model based on fBm is a non-stationary model and isoften used to describe random phenomenon. Pentland (1984)showed that most fractals encountered in physical models are frac-tal Brownian functions (fBfs). An fBf (Mandelbrot, 1975) f is a gen-eralization of Brownian motion where the expected value of theintensity difference between two points is zero but where thesquare of the difference is proportional to the distance betweenthe points at a power 2H.
The FD of an n-dimension fBf is defined by:
FD ¼ nþ 1� H ð4Þ
Fractal Brownian functions are statistically self-affine (Mandelbrot,1983). It follows that linear transformations and scalings of a fBf donot affect its FD. With this formalism, the FD of a fractal Brownianfunction is invariant with transformations.
Two algorithms are commonly used to estimate the FD of animage considered to be a 2D fractal Brownian function. They arebased either on the variogram or the Fourier transform of theimage.
4.2.1. Variogram methodThe variogram method is based on the statistical Gaussian mod-
elling of images. Given a FD, it is possible to use fractional Brown-ian motion modelling to create a corresponding image. Thismethod attempts to solve the inverse problem: given an image,the FD is estimated by assuming that it is derived from a fractionalBrownian motion (Goodchild, 1980).
This algorithm provides robust estimations of the FD (Soille andRivest, 1996). Indeed the advantages of the variogram method areits applicability to irregularly distributed data sets and to surfaceswith an underlying trend, as commonly occur in topography. Forsurfaces with a trend of higher than linear order, the residual vari-ogram is preferable. Although the theoretical derivation assumessecond-order stationarity, the surface does not need to be station-ary to use the variogram method. However it was shown thatdividing a signal into an insufficient number of clusters makesthe variogram method enable to estimate the FD, but when a suf-ficient large number of clusters is used it is possible to detect a verysharp drop toward the correct value, followed by slow convergence(Kolibal and Monde, 1998).
On the other hand, the variogram method yields accurate re-sults only for low dimensions surfaces. For higher dimensions sur-faces, the method is unstable (Lam et al., 2002).
4.2.2. The power spectrumPower spectrum method (Pentland, 1984) is based on the power
spectrum dependence of fractional Brownian motion. In this

R. Lopes, N. Betrouni / Medical Image Analysis 13 (2009) 634–649 637
method, each image line is Fourier transformed, the power spec-trum is evaluated and then all these power spectra are averaged.FD is computed as the slope.
The Fourier method is ideal for the self-affine surfaces analysisand for simulation. Unfortunately, the method is slow and requiresgridded data. The radial calculation scheme works only for isotro-pic surfaces.
Asvestas et al. (1998) defined a modified version to estimate theFD of a two variable fBm functions from its average power spec-trum. The method is called Power Differentiation method. Theauthors showed that their method is more robust in the presenceof white noise.
The main drawback is that the method is efficient only with sur-faces exhibiting an exponential power spectrum. In general, thisrestriction imposed on the shape of the power spectrum is not va-lid and this may cause errors in the calculation of FD (Osborne andProvenzale, 1989).
4.3. Area measurement methods
Area measurement methods use structuring elements (triangle,erosion, dilatation, . . .) of various scales r and compute the areaA(r) of the signal intensity surface at scale r. The FD is obtainedby the slope of the best fitting line at the points (log(r), log(A(r))).In this methods class, three algorithms are the most used:
4.3.1. Isarithm method (IM)The idea of the isarithm method (Shelberg et al., 1983) is to de-
fine the complexity of isarithm or contour lines, needed to approx-imate the complexity of a surface. This method is only defined forthe 2D case. A series of isarithms (e.g., contours) based on the datavalues are formed on the image. The FD of each isarithm can beestimated with the walking divider method and the FD of the im-age is the average FD of the isarithms plus one.
Shelberg et al. (1983) showed that the method can be used toestimate the FD for the non self-similar surfaces. It is an importantkey, because others methods, like BCM, are only appropriate forself-similar surfaces. Furthermore, the method was found to be ro-bust to random noise (Qiu et al., 1999).
However, Lam and De Cola (2002) noted that real data aregenerally anisotropic and therefore the computed FD will varydepending on whether it is measured along rows, columns, orin a non-cardinal direction. Moreover, conflicting results onthe performance of the isarithm method have been reported.Lam et al. (1997) found that the isarithm method performedwell in returning FD values close to those of true surfacedimensions, whereas Klinkenberg and Goodchild (1992) foundresults with this method to be poor. Clarke (1986) criticizedthe isarithm method because the resulting dimension waslikely to depend on the values of the isarithms and isarithminterval.
4.3.2. Blanket method (BM)The blanket algorithm was originally devised by Peleg et al.
(1984) in order to calculate the area of a gray level surface and thusthe FD of a 3D structure. The algorithm is based upon Mandelbrot’smethod and ultimately upon Minkowski’s sausage logic. In thealgorithm, Peleg et al. considered all the points in 3D space at a dis-tance e from the surface, covering the surface with a ‘‘blanket” ofthickness 2e. This blanket is defined by two surfaces, an upper sur-face and a lower surface (defined by dilatation and erosion of theimage).
One of the advantages of the method is it robustness againstgray levels changes. Another benefit is that the use of asymmetricstructuring elements allowed the identification of anisotropicstructures within the image (Chappard et al., 2001).
Asvestas et al. (1998) showed that the BM is efficient only whenthe theoretical value of the FD is relatively low. Experiments weredone one noise free and noised data. For the first case, the methodunderestimated the high FD and for the second case, it underesti-mated the low FD.
4.3.3. Triangular prism method (TPM)The triangular prism method compares the surface areas of tri-
angular prisms with the pixels area (step size squared) in log–logform (Clarke, 1986). The method derives a relationship betweenthe surface area of triangular prisms defined by the grey-level val-ues of the image and the step size of the grid used to measure theprism surface area.
(De Jong and Burrough, 1995) reported that TPM method under-estimates the FD. An improvement, introduced by Qiu et al., 1999allowed to the algorithm to correct this error.
Moreover the TPM was also found to be sensitive to noise or ex-treme grey-level values. However, beyond these limits, the methodis the fastest and gives more accurate results than the BM and IMmethods (Kolibal and Monde, 1998). The accuracy and efficiency ofthe three methods were evaluated on images from the Cantor set.
In 2006 Sun (2006) proposed three new methods to computethe fractal dimension based on Clarke’s TPM method, called themax-difference method, the mean-difference method and theeight-pixel method. The proposed methods have been tested usingboth simulated fractal surfaces and real images. Results showedthat the methods are more robust than the Clarke’s method forsynthetic images with complex textures.
5. Multifractal analysis
Multifractals could be seen as an extension of fractals. A multi-fractal object is more complex in the sense that it is always invari-ant by translation, although the dilatation factor needed to be ableto distinguish the detail from the whole object depends on the de-tail being observed.
Multifractal analysis initially appeared with multiplicatives cas-cades models of Mandelbrot for the study of energy dissipation inthe context of the fully developed turbulence then it was appliedfor the measurement of the turbulent flow velocity in the 1980s.In this latter situation, the velocity has a very complex structure;in particular, irregular behaviour occurs at ‘‘infrequent” places inthe sense of a Lebesgue measurement in R3. A signal treatment ap-proach has been then developed which consisted to study the reg-ularity of a signal with a velocity v. The aim is to define in eachsignal point x0 the velocity variation law to deduce the punctualHölder exponent h(x0).
Afterwards points with the same exponent h are grouped to-gether into sets Sh. These sets might have a null Lebesgue measure.However if they are not significant in measure term, their topolog-ical dimension can be. Thus, physicists searched to compute theHausdorff dimension Dh of Sh. The function h ? Dh was called thesingularity spectrum.
The direct determination by numerical computing of the singu-larity spectrum of a real signal proves to be difficult because thenumber of definitions to compute it is infinite. A formula, named‘‘multifractal formalism” has been established by Parisi and Frischin order to compute this spectrum. The multifractal formalism wasthen defined by:
DðhÞ ¼ infqðq � h� sðqÞ þ cÞ ð5Þ
where q is a real, c is a constant and s(q) is called the partitionfunction.
This formula is still difficult to apply for real signals, for this rea-son the topic of many works was the implementation of methods

638 R. Lopes, N. Betrouni / Medical Image Analysis 13 (2009) 634–649
to evaluate the generalized multifractal dimensions spectrum Dq,q 2 R. The parameter q serves as a ‘‘microscope” for exploring dif-ferent regions of the singular measurement. For q > 1, Dq repre-sents the more singular regions, for q < 1, it accentuates the lesssingular regions and for q = 1, it represents the informationdimension.
However, an alternative description can be formulated. Indeed,a multifractal structure can be considered as a superposition ofhomogeneous monofractal structures. Let us consider the set E(h)of Hölder exponents h of particles with values in the interval[h, h + Dh]. F(h) is defined as the FD of the set E(h), which has amonofractal structure. The pairs (q, s(q)) and (h, F(h)) are linkedby the Legendre transform:
sðqÞ ¼ q � hðqÞ � FðhÞ
hðqÞ ffi aðqÞ ¼ dsðqÞdq
ð6Þ
where a is an approximation of the Hölder coefficient h.For a multifractal structure, the dimensions Dq are decreasing
functions of q, and h ? F(h) is a convex function whose maximumcorresponds to the Hausdorff dimension Dh.
6. Multifractal spectrum computing methods
As for FD estimation, many methods exist to approximate themultifractal spectrum. We divided this description into two clas-ses: first the methods said box-counting and the methods basedon wavelets.
6.1. Box-counting methods
The methods of this class are based on the same principles thanthe methods for FD evaluation in Section 4.1. The signal is meshedwith various boxes size r and a normalized measure is computed ineach box.
6.1.1. Generalized fractal dimensions and multifractal spectrumStandard box-counting techniques are used to analyse point’s
sets. Each set is described by an infinite number of generalizeddimensions, Dq, also called ‘‘Renyi’s dimensions” (Renyi, 1955),and by the multifractal spectrum f(a) (Halsey et al., 1986). The gen-eralized dimensions Dq are computed as a function of the order ofthe probability moment q and then the multifractal spectrum canbe obtained by Legendre transform.
The Legendre transform could lead to some errors (Venezianoet al., 1995). In 1989, Chhabra and Jensen defined a method forthe direct estimation of the multifractal spectrum (Chhabra andJensen, 1989). This method is widely used (Cuevas, 2003; Perrieret al., 2006; Wang et al., 2005).
These methods have the drawbacks of the box-counting meth-ods but several computational refinements were reported (Blocket al., 1990; Hou et al., 1990; Molteno, 1993).
Besides problems arising when the boxes contain few points,the algorithms are characterized by low statistics, emphasized bythe negative exponents (q < 0); this, in turn, makes the measureto diverge exponentially (Feeny, 2000).
6.1.2. The ‘‘sand box” or cumulative mass methodThe sandbox method, introduced by Tél et al. (1989) and devel-
oped by Vicsek (1990), is useful for the assessment of the general-ized fractal dimensions for both positive and negative momentorders, q, permitting the reconstruction of the complete multifrac-tal spectrum.
This method consists in randomly selecting N points belongingto the structure and then counting, for each point i, the number of
pixels Mi(r) that belong to the structure inside a disk of diameter rcentred at this point. The generalized dimensions Dq are obtainedusing the mean of M(r) for various r.
The advantage of this method is that the boxes are centred onthe structure, so there are no boxes with too few elements (i.e. pix-els) inside. Indeed, for q < 0, boxes that contain a small number ofelements (because they barely overlap with the cluster) giveanomalously large contributions.
The sandbox procedure represents a solution to the border ef-fect problem (i.e. the presence of almost empty cells containingfew points not centred in them), permitting the reconstruction ofthe multifractal spectrum also for negative q (De Bartolo et al.,2004).
Finally, we can quote that this method has just been developedfor binarized signals.
6.1.3. The large-deviation multifractal spectrumWhen the multifractal spectrum is estimated using the above-
mentioned methods, its shape is always concave. The advantageof the large-deviation multifractal spectrum is that it will not al-ways be concave and so less information loss will occur. However,much more numerical computation is required and the method be-comes difficult to apply in 2D and 3D. Indeed, the algorithm neces-sitates the calculation of two limits, instead of just one as for thetwo previous methods.
In view of the high computation cost, this method is primarilyused for 1D signals (Broniatowski and Mignot, 2001; Touchetteand Beck, 2005). This spectrum can also be applied to image seg-mentation (Abadi and Grandchamp, 2006).
6.2. Wavelet methods
The second class of methods are based on the wavelet trans-form. The wavelet transform of a signal is used like an ‘‘oscillating”box to represent its components. Therefore there is no need tomesh the signal.
Some methods use the discrete wavelet transform and othersare based on the continuous wavelet transform.
6.2.1. Methods based on the discrete wavelet transformThe properties of multifractal formalism (based on discrete
wavelet coefficients) were established by Jaffard (1997). This tech-nique is founded upon result of Meyer (1998) showing that undermild regularity conditions on the paths of the process x(t), the localHölder exponent can be computed from size estimates of thewavelet coefficients Wj,k:
aðt0Þ ¼ limk2�j!t0
�1j
log2jWj;kj ð7Þ
where k2�j ? t0 means that t0 belongs to [2�jk, 2�j(k + 1)] as j ?1.As with any working framework, multifractal formalism has a
number of limitations. Firstly, q negative order exponents aremeaningless. Indeed, there is no reason why discrete wavelet coef-ficients should be non-zero, and in practice they can have valuesvery close to zero. Secondly, this formalism fails for signals whichcontain oscillating singularities (Meyer, 1998). Such oscillating sin-gularities are shown to appear generically in local self-similarfunctions which are invariant under a nonhyperbolic mapping(Arneodo et al., 1995).
6.2.2. The wavelet transform modulus maxima (WTMM) methodThis method is also based on the concept of wavelets in general
and the use of the continuous wavelet transform in particular. It hasbeen developed and used in one and two dimensions in severalworks (Bhatti et al., 2007; Enescu et al., 2006; Khalil et al., 2006;

R. Lopes, N. Betrouni / Medical Image Analysis 13 (2009) 634–649 639
Klapetek and Ohlidal, 2005). The method is more numerically stablethan other methods for 1D and 2D dimensional multifractal spec-trum calculation (such as the use of fractional Brownian motions,for example (Brodu, 2005). In (Kestener and Arneodo, 2003), themethod was applied in 3D and the authors showed its robustnessusing simulated 3D multifractal models. The algorithm is basedon the construction of wavelet transform modulus maxima chains.
The method presents some limits. It is more difficult to imple-ment than the previous methods. It has some freedom degrees, likethe wavelet choice and the scales number. However Kestener andArneodo (2003) showed that it is more effective than the ‘‘box-counting” methods.
6.2.3. The wavelet leaders methodThis method is a recent technique. It is based on the definition
of wavelet leaders obtained by the discrete wavelet transform.Although there is no study showing its effectiveness, it presents
some benefits. Indeed, the estimated multifractal formalism has amathematical validity and the right part of spectrum is valid(q < 0), meaning that the partition function (obtained by waveletleaders) is also valid when q < 0. This formalism was theoreticallyproven by Jaffard et al. (2005) and then developed in 1D by Lasher-mes et al. (2005) for applications in fully developed turbulence.
7. Applications
Over the last years, fractal and multifractal analysis have beenapplied extensively in medical signals analysis. In this section,we classify and summarize these applications in many clinical pro-cedures where 1D, 2D and 3D signals were involved.
Applications are grouped into the two main recurrent classesnamely segmentation and characterization.
7.1. Segmentation
In many clinical applications, image segmentation is an impor-tant task which depends strongly on the signatures used to charac-terize a given region of the image. These signatures can be ofseveral types; for example, one can characterize the pixels distri-bution heterogeneity of a region of the image. Multifractal modelsenable to describe the scale-to-scale propagation of this heteroge-neity (Martinez et al., 1997).
Texture segmentation methods using the fractal and multifrac-tal geometry can be divided into two classes:
– Methods based only on fractal and/or multifractal features.– Methods that combine fractal and/or multifractal features with
other texture features.
Fractal analysis can be used alone in texture segmentation. Kel-ler et al. (1989) were the first to propose a method for texture seg-mentation using fractal geometry. Subsequently, a number ofworks (Hsu et al., 2007; Kikuchi et al., 2005; Zhuang and Meng,2004) examined several fractal parameters.
Other methods were motivated by the use of some fractalgeometry derived features, such as lacunarity and signatures (Dub-uisson and Dubes, 1994). In fact, Espinal and Chandran (1998)demonstrated that a wavelet-based fractal signature was a veryaccurate and robust method for grey-scale texture classificationand segmentation.
Kaplan (1999) introduced multiscale Hurst parameters for thecharacterization of various natural textures. The precision of thisalgorithm was notably assessed on mosaic texture images.
Ida and Sambonsugi (1998) applied fractal coding for imagesegmentation. The encoding method was the same as in the con-
ventional fractal coding method. An image can be segmented bycalculating bases on a dynamic system parameterized by fractalcoding. The authors showed that the method was able to segmentregions that have fine, clustered pixel patterns.
Lastly, the local FD was used with success to segment textures.The local FD is either computed for each pixel in the image or inlocal windows (Maeda et al., 1998). For instance, Novianto et al.(2003) presented an algorithm based on 3 � 3 windows.
In the second class of methods, fractal analysis is combinedwith other texture parameters like the Fourier spectrum, firstand second-order statistics (the co-occurrence matrix), . . . (Guoet al., 2007).
Lee et al. (2005) developed an unsupervised segmentation algo-rithm for ultrasonic liver images based on the multiresolution frac-tal feature vector.
One drawback of these methods is that they require classifica-tion (clustering); it is thus important to estimate the number oftextures present in the image. In most cases, this estimation is dif-ficult or even impossible to perform.
In some cases, fractal analysis does not perform correct imagesegmentation. Indeed, some images are complex to study becausethey present irregularities and more regular zones at all scales,without following a clear law. To recover information from suchsingular images, multifractal formalism suggests studying theway in which the image’s singularities are distributed, i.e. the sin-gularity spectrum, equivalent to the entropy. Thus, a number of re-cent studies have focused on texture segmentation usingmultifractal analysis (Abadi and Grandchamp, 2006; Xia et al.,2006) with application to MR and US images (Ezekiel, 2003).
Zhuang and Meng (2004) segmented ultrasound images usingthe local FD (Fig. 2). Lévy-Véhel et al. (1992) segmented MR imagesusing a generalization of Chhabra’s method and the results wereconclusive (Fig. 3).
Xia et al. (2006) presented a novel multifractal estimationalgorithm based on mathematical morphology and a set of newmultifractal descriptors, namely the local morphological multi-fractal exponents. The latter are used to characterize the localscaling properties of the texture. Both the proposed algorithmand the box-counting based methods have been applied to thesegmentation of texture mosaics and real images. Comparisonof the results showed that morphological multifractal estimationcan differentiate texture images more efficiently and providemore robust segmentations than do the box-counting basedmethods.
Brief summary: Image segmentation is a key step in many med-ical imaging based procedures. Many research groups worked tosolve specific medical image segmentation problems, with good re-sults (Duncan and Ayache, 2000; Pham et al., 1999); however, untilnow, the generalization of these systems to a wider range of appli-cations has not been successful. For this reason, research groupsstill work on this application.
Fractal features are used, in this field, as additional textureparameters. Indeed, the FD showed interesting results in some im-age modalities like MR, CT and US. However, considered alone, itcannot provide a precise method of segmentation, since it is calcu-lated on windows of the image.
In conclusion, the FD can be introduced as a feature in a classi-fication algorithm. For example, it can add information in statisti-cal-model-based algorithms.
From another side, multifractal analysis seems more adaptedthan the FD to the texture segmentation. Its advantage is tocharacterize the local scales properties in addition to the globalproperties. So it makes it possible to quantify the distributionof the local singularities (local morphological multifractalexponents).

Fig. 2. Ultrasound image segmentation (a) the original image, (b) a local fractal dimension map and (c) the segmentation result (Zhuang and Meng, 2004).
Fig. 3. MR image of the eye and the corresponding segmentation (Lévy-Véhel et al. (1992)).
640 R. Lopes, N. Betrouni / Medical Image Analysis 13 (2009) 634–649
7.2. Characterization
Fractal and multifractal analyses have been used to study and tocharacterize a wide range of signals in biology and medicine (Ken-kel and Walker, 1996; Landini and Rippin, 1996; Oczeretko et al.,2001). In this section, we limit our review to four main fields ofapplication:
– electrocardiogram (ECG) and electroencephalogram (EEG)signals,
– brain imaging,– mammography, and– bone imaging.
In each field, applications in control group versus patient groupcharacterization and abnormalities detection will be highlighted.
Before detailing the above applications, we discuss some otherapplications. Indeed, fractal geometry was used to characterizeand quantify the response for cancer treatment (Imre and Bogaert,2004; Jain et al., 2002; Wax et al., 2003). It was also used to de-scribe spectral data used to study blood flow in the lungs (Glennyand Robertson, 1991), where the heterogeneity of pulmonaryblood flow is not adequately described by gravitational forcesalone. Krenz et al. (1992) used a fractal analysis to correlate themorphometric data from the intrapulmonary arteries with func-tional measurements of blood flow, in order to represent the hae-modynamic consequences of the pulmonary arterial tree structure.The basis of myocardial flow heterogeneities (Bassingthwaighteet al., 1990) can be described by a natural fractal. There is also afractal analysis of radiographs of the peridental alveolar bone (Rut-timan et al., 1992).
Spine neurons have been described in terms of FD. Keough et al.(1991) used fractal analysis to study electron micrographs of dif-ferent cell types by using micrographs obtained at various magni-fications and subsequently enlarged by different amounts. Crosset al. (1993) used a fractal analysis of renal angiograms to studythe morphological complexity of the renal arterial tree and also(Cross et al., 1994) histological sections from molar and non-molarpregnancies and partial hydatidiform moles to determine whetherthe FD was discriminating between-groups.
Lastly, Stosic and Stosic (2006) showed that the vascularstructures of human retina represented geometrical multifractalscharacterized by a hierarchy of exponents, rather than a singleFD.
7.2.1. 1D EEG/ECG signalsFractal analysis applied to medical signals is an active field of
research. Indeed, some signals have a fractal character; this is par-ticularly the case for repeated sequences, like palindromes (localrepetitions) and homologies between two different nucleotide se-quences (motifs along the genome) composing a self-similar (frac-tal) pattern in mitochondrial DNA (Oiwa and Glazier, 2004).
The FD has also been used to characterize two states or to pre-dict a phenomenon. It is usually applied to ECG and EEG signals(Phothisonothai and Nakagawa, 2007; Smrcka et al., 2003) usingthe box-counting method.
To model an EEG, the signal is considered as a series of sine andcosine waves of constant amplitude (John and Bradford, 1993). Inorder to distinguish the classes of time series (EEG), which corre-late to brain activities, fractal analysis is often used.
Fractal interpolation can also be used for ECG data compression(Jun et al., 1994).

R. Lopes, N. Betrouni / Medical Image Analysis 13 (2009) 634–649 641
FD can also be used as a method for discriminating between twostates (Esteller et al., 2004; Li et al., 2005; Spasic et al., 2005).
Anderson et al. (1997) showed that the FD can be predictive forarrhythmic (but not non-arrhythmic) death in a large post-infarc-tion cohort. Pereda et al. (1998) found in their study on human EEG(awake and sleep stages of the patient) that EEG exhibits randomfractal structure with 1/f�b spectrum, where the b exponent wasbetween 1 and 3. More than the correlation dimension (D2), bexponent is appropriate to correlate with the behaviour of EEGwaves. Murali (2005) showed that FD was more sensitive than Fou-rier transform for applications in the prediction. Woyshville andCalabrese (1994) used fractal dimension in their studies on quan-tification of occipital EEG with respect to the Alzheimer diseasefor the three conditions defined as (1) controls, (2) probable Alz-heimer disease and (3) autopsy-confirmed Alzheimer disease. Theyconcluded that fractal dimensions clearly describe the EEG pathol-ogy and suggested that they have a potential clinical utility.
Recently, Hsu et al. (2007) presented a new electroencephalo-gram (EEG) analysis system using active segment selection andmultiresolution fractal features (notably the differential box-counting method).
Multifractal algorithms have also been used (Li et al., 2005; Mu-noz et al., 2005; Xia et al., 2006; Yum and Kim, 2002). The principalapplication is discrimination between two states (Munoz et al.,2005; Wang et al., 2006). Wang et al. (2007) showed that the areavalue of the ventricular fibrillation singularity spectrum (VF)tended to be higher than the area value of the ventricular tachycar-dia singularity spectrum (VT), by using the direct determinationmethod for the singularity spectrum f(a). This latter study is partic-ularly interesting because it demonstrates the effectiveness ofmultifractal analysis comparing to other methods. Indeed, con-cerning VF and VT classification, several quantitative analysis tech-niques have been suggested, such as a sequential hypothesistesting algorithm (Thakor et al., 1990), a method based on com-plexity measurement (Zhang et al., 1999), a qualitative chaos anal-ysis based on symbolic complexity (Zhang et al., 2002), thecorrelation dimension method (Small et al., 2002), the Lyapunovexponent method (Owis et al., 2002), and the entropy approxima-tion method (Caswell Schuckers, 1998). However, none of thesemethods was able to distinguish VF from VT.
The generalized fractal dimensions have been used by Kulishet al. (2006) to show that these dimensions contain information re-lated to both frequency and amplitude characteristics of the EEGsignals.
Multifractal analysis can also be used to show the monofractalor multifractal nature of medical signals (Yum and Kim, 2002). Inthis case, the WTMM method is the most appropriate because itis the most numerically stable (Arneodo et al., 1998). The methodprovided good results with EEG signals (Popivanov et al., 2005;Shimizu et al., 2004).
Brief summary: The FD clearly has an advantage in the study ofEEG signals, since these signals exhibited random fractal structure.As reported in this section, in a large number of applications (epi-lepsy, sleeping disorder, Alzheimer disease), FD showed its useful-ness. Several methods for FD calculation are used and, even themethods with many limits like the ‘‘box-counting” methods, pro-vided satisfactory results. Until now, there is no comparative studyof the methods to highlight to most effective one for these signals.However, the FD clearly showed its advantage compared to othermethods, like the Fourier transform. Recently, many reports onfractal dimension and fractal spectra analysis predicted the brainactivities more precisely than Fourier transform. Even fractal spec-tra analysis has limitations in analysing stationary brain waves,multiple brain activities, . . .
Multifractal analysis is also used successfully in various applica-tions concerning the use of EEG signals. A numerically stable meth-
od (WTMM method) showed monofractal and multifractalcharacters of signals and provided good performances in the clas-sification of two states. Thus, this method will continue to be animportant area of research in study of EEG signals.
7.2.2. Brain imagingFractal dimension is the most frequently applied features in this
field of application. One important early observation was that FD isnot discriminative on MR brain images. Indeed, whole brainimages from healthy subjects and patients have similar FD values(Cook et al., 1995; Free et al., 1996). In the first work, FD was com-puted using the box-counting method and in the second, it wascomputed for the contours of the brain using the morphologicaloperator method. However, FDs were successfully used to quantifycells morphologies in the brain (Kalmanti and Maris, 2007; Smithet al., 1993; Smith and Behar, 1994; Soltys et al., 2001) and thebrain shape (Blanton et al., 2001; Gorski and Skrzat, 2006; Iftekha-ruddin et al., 2000; Kedzia et al., 2002; Pereira et al., 2000; Rybac-zuk et al., 1996; Thompson et al., 1996).
Some works were carried on the grey matter (GM) (Blantonet al., 2001; Liu et al., 2003; Sato et al., 1996; Sisodiya and Free,1997), others focused on the white matter (Free et al., 1996; Liuet al., 2003; Shan et al., 2006).
Using MR images of the human brain, Bullmore et al. (1994)measured the boundary between the cerebral cortex and whitematter, with application to the characterization of schizophrenics,manic-depressives and controls. The mean FD (computed by thebox-counting method) was greater in boundaries extracted frommanic-depressive patients than in those extracted from controls,whereas it was lower in schizophrenics than in controls. It wassuggested that the FD is a useful measure of clinically relevant dif-ferences in the complexity of MRI boundaries.
Blanton et al. (2001) examined the influence of age and genderon the structural complexity and asymmetry of primary corticalsulci in normally developing children by computing the FD forthe contour surface between the sulcus and the gyrus on brainMR images. The method was based on the algorithm presentedby Thompson et al. (1996).
Kedzia et al. (2002) studied the microarchitecture of foetal brainblood vessels during pregnancy; they showed that the mean FD(computed by the box-counting method) was 1.26 during thefourth month, increased to 1.53 during the fifth month and thengrew even more rapidly until the sixth and seventh months. Thissuggested an increased level of complexity and feed volume inthe brain.
Liu et al. (2003) skeletonized the human cerebellum andshowed that it has a highly fractal structure, with a FD (computedusing the box-counting method) of 2.57. There were no significantdifferences between men and women in terms of the cerebellumFD.
Zhang et al., 2006 were the first to introduce a method tocompute the 3D FD of three features of the human’s brain: whitematter, the interior structure, the surface (i.e. the interface be-tween GM and WM) and the overall structure (the whole WMvoxel set). The structural complexity of the WM declined withage in all anatomical structures analysed (whole brain and hemi-spheres). Age-related asymmetrical changes were found in theWM’s interior structure: the complexity of the WM’s interiorstructure decreased in the left hemisphere in men and in theright hemisphere in women. White matter structures in menwere more complex (i.e. they had a higher FD) than in women.Lastly, an asymmetric complexity pattern (right side greater thanleft side) was observed for the WM interior and general struc-tures, whereas the complexity of the WM surface was symmetri-cal. No significant age-related WM volume reductions wereobserved.

642 R. Lopes, N. Betrouni / Medical Image Analysis 13 (2009) 634–649
Fractal analysis has also been used for brain tumor detection(Iftekharuddin et al., 2003; Mansury and Deisboeck, 2004; Pennet al., 1999). Iftekharuddin et al. (2000) used the FD value to detectand locate brain tumors. The FD was computed using the fBf vari-ance model method and used to extract information on tumor pro-gression relative to normal brain data. Zook and Iftekharuddin(2005) presented an algorithm for brain tumor detection on 2DMR images. The principle was as follows: the FD of the left halfof the brain was compared with that of the right half (assumingthat the tumor is located in one half only). The authors found thatthe FD of tumor regions is usually lower than that of non-tumorregions. The authors also compared the efficiency of differentmethods of FD computation (piecewise modified box counting(PMBC) – piecewise triangular prism surface-area method (PTPSA)– blanket algorithm). Some of results are presented in Fig. 4. PMBCmethod detected the tumor inner as high FD in a 32 � 32neighbourhood, while PMBC detected tumor edges as high FD ina 64 � 64 neighbourhood (Fig. 4b and c). For the same image,PTPSA detected the tumor as slightly higher FD and blanket algo-rithm detected part of the tumor as higher FD (Fig. 4d and e). Spe-cifically, in this study, the PTPSA algorithm was more predictive atlower resolutions and the blanket algorithm was more predictiveat higher resolutions. Furthermore, in a 8 � 8 neighbourhood, thePTPSA algorithm offered the best tumor detection performance.
Moreover, results concerning the 3D fractal analysis used inbrain single photon emission computed tomography (SPECT) forthe characterization of Alzheimer’s disease were presented (Nagaoand Murase, 2002; Takahashi et al., 2006; Yoshikawa et al., 2003).The FD is estimated by a method which lacks a true theoretical ba-sis, a generalization of the box-counting method. Indeed, thismethod was refuted by (Chung, 2003) because the FDs obtainedwere between 1 and 2, whereas they should be between 3 and 4.In another study, (Lopes et al., 2007a) used a 3D adaptation ofthe differential box-counting method to derive the 3D FD and ap-plied it for the characterization of epilepsy in SPECT imaging.
There are fewer published works on multifractal analysis.Takahashi et al. (2006) used the Chhabra spectrum to quantita-tively evaluate white matter hyperintensity. Lopes et al. (2008)used a 3D adaptation of Chhabra’s method to characterize the localchanges in homogeneity in brain SPECT images. There was a statis-tically significant difference between the control group and thepathological group.
Brief summary: The studies are mainly done on brain magneticresonance imaging (MRI). The use of FD on the brain MRI requireda special attention, since two studies showed that the FD did notmake it possible statistically to separate the healthy subjects andthe patients. However this remark can be discussed, for examplethe first study used the box-counting method, therefore therewas a binarization in pre-processing and this step could remove
Fig. 4. (a) A T1 MR image with contrast agent. Also shown are positive FD difference resIftekharuddin, 2005).
important information. Then there have been only a few fractalstudies on non-linear structures observed by brain magnetic reso-nance imaging, and the contents of these studies have been mostlylimited to extraction of fractal structures (white matter surface,cortical/subcortical boundary). However the FD proved to be a dis-criminating tool for some structures.
The FD has also been used for brain tumor detection with lim-ited results. Indeed the information brought by the FD was inter-esting, but it would be necessary to add other information for abetter segmentation. Thus, the FD can be used like an additionalfeature in segmentation algorithms.
Finally first works concerning the use of the multifractal analy-sis were interesting, but they used ‘‘box-counting” methods, it willbe interesting to see the influence of a wavelet-based method.
7.2.3. Bone trabeculationIt was already well known that both trabecular bone density
and structure affect overall bone quality and strength (Cooper,1993; Dempster et al., 1993; Ott, 1986; Uitewaal et al., 1987). In-deed in biomechanical terms, fracture risk for an osteoporotic isdetermined by the combination of factors inherent to the bonequality (e.g. cortical thickness, mineral contents, trabecular bonedensity and microarchitecture). One of the most important factorscontributing to bone strength is its complex structure. Bone hastwo components: an outer part consisting of a tube of very densematerial and an inside that looks like a sea sponge, filled with fi-nely interlaced struts, called trabeculae, which are about as wideas a human hair.
The first computerized analysis for trabecular architecturequantification was done by the use of morphological measures.These measures showed moderate to good relationship with BoneMineral Density (BMD) (Link et al., 1997; Ouyang et al., 1998), butnot many of the measures significantly complement BMD to theprediction of biomechanical properties. The idea has also beento use measures of second-order statistics, especially the fractalanalysis. Many studies were done to validate the use of fractalanalysis in this application. The early studies were concerned withestablishing methodology or determining if cancellous bone is in-deed fractal in nature. One of the properties of theoretical fractalshapes is that they have an indeterminate perimeter. Cancellousbone has been showed to have this property (Parkinson and Faz-zalari, 1994). Specially, if the perimeter and area of a histologicalsection of cancellous bone is measured at increasingly highermagnification, the measured perimeter will increase but the mea-sured area will remain relatively constant. A second property ofthe fractal geometry is the self-similarity (in the statisticallysense) of objects. Benhamou et al. (1994) proved the self-similar-ity of the trabecular bone microarchitecture on calcaneusradiographs.
ults for (b) PMBC-32, (c) PMBC-64, (d) PTPSA and (e) the blanket method (Zook and

R. Lopes, N. Betrouni / Medical Image Analysis 13 (2009) 634–649 643
Many studies were done by comparing control group and pa-tients group to show that the FD is a discriminative measure.Caligiuri et al. (1994) presented an analysis of lumbar spine radio-graphs. The authors used a surface-area technique to calculate thefractal dimension of radiographs, and have shown what appears tobe a promising discrimination between subjects with and subjectswithout fractures. Khosrovi et al. (1994) showed differences be-tween normal and osteoporotic women using fractal measures de-rived from wrist radiographs. Benhamou et al. (1994) showed thatfractal measures derived from calcaneus radiographs may also bepotentially useful in studying osteoporotic populations.
In 1999, a study by Majumdar et al. (1999) showed othersimportant characteristics using fractal analysis in this application.They used three methods to compute the FD: a surface-area tech-nique, a semi-variance technique and a Fourier transform tech-nique. As it was stressed in Section 4, many methods exist toevaluate the FD, but with different results. The authors used threemethods and their first result was that there was a correlation be-tween the fractal dimensions of the three methods and the micro-architectural measures of trabecular structure. The second resultwas that the semi-variance and Fourier transform techniquesshowed differences between the trabecular orientation in the ver-tebrae and the other planes, while the surface-area technique didnot discriminate between the planes. This result can be explainedby the fact that the semi-variance and Fourier transform tech-niques are based on a stochastic formulation, while the surface-area technique is based on a deterministic theory. Thus, the simi-larity between the semi-variance and the Fourier transform resultsand the discrepancy between the surface-area based results is notunexpected. The important message in this paper was that differ-ent fractal techniques provided different results. These measurescan adequately be exploited to provide different kinds of informa-tion pertaining to bone strength and structure.
In the recent years, research on bone trabeculation throughfractal analysis has remained very dynamic (Messent et al., 2005;Papaloucas et al., 2005; Wilkie et al., 2004; Yasar and Akgunlu,2006). Many studies concerned bone trabeculation anisotropy. Yiet al. (2007) measured bone trabeculation anisotropy using direc-tional FDs (calculated as a function of orientation and whichyielded the fractal information reflecting the spatial characteristicsof the trabecular bone in each direction). They found that theanisotropy was significantly higher in the angle region of the man-dible than in the incisor region. (Jennane et al., 2006) estimated theanisotropy degree of fractal on bone X-ray images, known to becomplex in terms of their non-stationarity, anisotropy and tex-tured character. They demonstrated that the bone organizationwas more anisotropic for osteoporotic subjects than for healthycontrols, in accordance with the natural osteoporosis-relatedchanges in bone tissue. The authors computed the FD using thevariogram method. Later on, it will be shown that the use of thismethod presents the following limitation: more the structure iscomplex, more the FD increases. However the method is unstablefor surfaces of higher dimensions (Lam et al., 2002).
Finally and always in the healthy control/patient classificationapplications, Taleb-Ahmed et al. (2003) suggested a way to charac-terize bone texture in CT images, with a view to discriminating be-tween healthy and pathological subjects. In other studies(Dougherty, 2001; Dougherty and Henebry, 2001), lacunarityparameters were combined with the fractal signature to improvethe healthy control/patient classification.
Brief summary: During the past decades, there has been contin-uous investigation into the use of fractal analysis in bone trabecu-lation applications. Several applications have been studied as thefractal character of the trabecular bone. This property, revealedin 1994 by Benhamou et al., made it possible to validate the useof FD in these applications. From this, many studies have been car-
ried out, in particular the comparison between normal subjectsand diseased subjects, bone trabeculation anisotropy, etc.
Concerning the FD computing algorithms used, studies showedthat some methods allowed good performances whereas others didnot bring any information. This point confirms the previous asser-tion, namely that the methods provide different results andshowed the importance of the method’s choice. In the applicationsconcerning the trabecular bone, the Fourier transform based meth-od seemed to provide of the most stable results.
Finally there are not real applications of the multifractal analy-sis for trabecular bone studies, which can be explained by the factthat encouraging results have been obtained with FD. As we men-tion it above, multifractal analysis adds local information about thesignal heterogeneity. In these applications, this information wasnot fundamental, but just a global quantification of the signalwas necessary.
7.2.4. MammographyMammography is the principal tool for the detection and diag-
nosis of breast cancer. Clinical studies demonstrated that survivalis greatly improved if the breast anomalies are detected at earlystages (Tabar et al., 1993). One of the significant signs of possiblecancerous changes is the existence of small mineral deposits inthe breast tissue, usually referred as micro-calcifications (Suriet al., 2002). Currently, mammography is the most effective toolfor detecting possible breast anomalies, including micro-calcifica-tions. It consists of an X-ray radiographic examination of eachbreast, usually from two angles (a top-to-bottom view and an ob-lique view). Others imaging modalities (ultrasound, MR) can beused but only as complementary examinations in the event of adifficult diagnosis. However, micro-calcifications with small sizes(typically up to a few of millimeters) and low contrast are difficultto detect. Thus, by applying image processing algorithms, signifi-cant improvements for the detection of micro-calcifications werepossible.
In particular, the application of fractal geometry showed inter-esting results. There are many reports on the use of this geometryin mammography images (Li et al., 2007; Nguyen and Rangayyan,2005; Tanki et al., 2006).
In this field, the applicability of the fractal geometry is justifiedby the fact that, micro-calcifications usually appear as a cluster ofbright spots with variant size and shape embedded in an inhomo-geneous background of breast tissue. The inhomogeneous back-ground also exhibits the self-similarity property of typical fractalimages such that a region of interest in digital mammograms con-taining the micro-calcifications clusters can be viewed as a fractalnormal background superimposed by a non-fractal foreground (i.e.the micro-calcifications clusters) (Huang and Yu, 2007; Kesteneret al., 2004).
For breast density measurements, Caldwell et al. (1990), Tayloret al. (1994) and Byng et al. (1996) used various fractal indices toclassify the images into categories. In particular, Byng et al.(1996) used a 3D box-counting method to calculate the surfaceFD (x, y, I(x, y)) where I(x, y) is the grey-scale value at pixel (x, y).The FD is estimated for the totality of the breast. The obtainedFD values are ranged between 2.23 (for a dense breast) and 2.54(for a fatty breast), corresponding to Hurst exponent values of0.77 and 0.46, respectively.
Kestener et al. (2004) showed that the multifractal spectrumcomputed by the WTMM method allows discrimination betweenfat and dense tissues. The authors found that dense and fat tissueshad Hurst exponent values of 0.65 and 0.3, respectively. This ap-proach reached to similar results as those provided by Bynget al., but the method used by Kestener et al. was more robust. In-deed, Byng et al. used the box-counting method while Kesteneret al. used the WTMM method. Moreover the second study showed

Fig. 5. Micro-calcification detection in a mammography containing two malignant foci. (a) The original mammography: the white rectangle indicates the region of interest.(b) and (c) show the maxima chains resulting from the maxima lines sorting procedure indicating the micro-calcifications for scaling parameter values of a = 1 and a = 4,respectively (Kestener et al., 2004).
644 R. Lopes, N. Betrouni / Medical Image Analysis 13 (2009) 634–649
that the breast texture on mammography had not multifractalcharacter.
Another application of fractal analysis concerned the enhance-ment of micro-calcifications on mammograms was that of Liet al. (1996). The authors showed that general mammographicparenchymal and ductal patterns can be well modelled by the frac-tal geometry. Therefore, micro-calcifications could be enhanced bytaking the difference between the original mammogram and themodelled one. Their results were compared with those of the par-tial wavelet reconstruction and morphological operation ap-proaches. The result demonstrated that the fractal modellingmethod is an effective way to enhance micro-calcifications andthereby facilitates the radiologist’s diagnosis.
Fractal and multifractal analysis have also been used for benign/malignant classification and micro-calcification detection. Theseanalyses were based on a number of features selected by radiolo-gists (Lanyi, 1986; Veldkamp et al., 2000). Based on these features,Mavroforakis et al. (2006) used the FD (calculated by the box-counting method) as a texture characteristic for classification.The results showed a breast micro-calcification detection rate ofabout 83.9%. Rangayyan and Nguyen (2005) showed that FD com-putation (using the grid method) for micro-calcification contoursenables classification of benign and malignant clusters. They alsoshowed the efficiency of FD relative to other shape factor methods(compactness, the spiculation index, fractional concavity, Fourierfactor).
The study by Guillemet (1996) constituted an initial approachto the application of multifractal analysis to micro-calcificationdetection. The proposed multifractal algorithm was based on theclassic multifractal formalism for measurements (Lévy-Véhel,1995; Lévy-Véhel and Vojak, 1995) and their numerical implemen-tation used Chhabra’s method (Chhabra and Jensen, 1989). The key
point of this work consisted in finding a measurement deducedfrom a micro-calcification-containing image and then applyingmultifractal analysis to it in order to reveal the presence of mi-cro-calcifications.
Using the generalized dimension spectrum Dq (Badii and Pol-iti, 1984, 1985; Grassberger et al., 1988; Grassberger and Pro-caccia, 1983) as a discriminating factor, a non-supervisedclassification study showed a degree of specificity for the gener-alized dimensions method in the presence of micro-calcifications.
In 2004, a work by Kestener et al. (2004) reported good resultsfor micro-calcification classification. The authors used the 2DWTMM method for texture classification in mammography viaHurst exponent calculation. They performed dense/fatty segmen-tation. Moreover, using the wavelet transform skeleton, they lo-cated and characterized micro-calcifications (Arneodo et al.,2003; Kestener et al., 2004) (Fig. 5).
More recently, (Stojic et al., 2006) used local multifractalanalysis (and Chhabra’s method in particular) to detect micro-calcifications. However this method was dependent on the micro-calcifications size. Moreover the authors used a ‘‘box-counting”method to compute the f(a) spectrum, which presents somedrawbacks.
Brief summary: Fractal geometry has been intensively used inmammography for the diagnosis of breast cancer. FD has been usedin studies of benign/malignant classifications and detection of mi-cro-calcifications. With regard to the first application the FD couldbe a discriminating tool, but it was really effective when it wascombined with other texture features. For the second application,the FD is able to isolate micro-calcifications areas but it is not ableto segment them precisely. Precisely in this second applicationmultifractal analysis could be an interesting tool. Indeed the
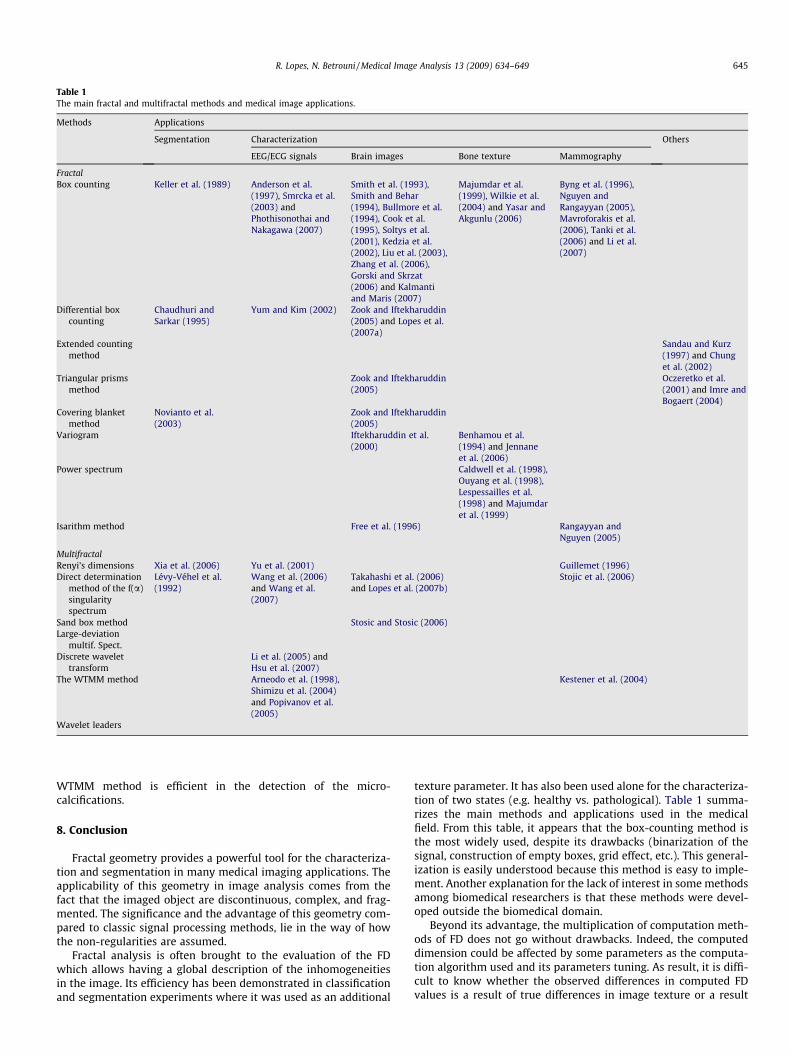
Table 1The main fractal and multifractal methods and medical image applications.
Methods Applications
Segmentation Characterization Others
EEG/ECG signals Brain images Bone texture Mammography
FractalBox counting Keller et al. (1989) Anderson et al.
(1997), Smrcka et al.(2003) andPhothisonothai andNakagawa (2007)
Smith et al. (1993),Smith and Behar(1994), Bullmore et al.(1994), Cook et al.(1995), Soltys et al.(2001), Kedzia et al.(2002), Liu et al. (2003),Zhang et al. (2006),Gorski and Skrzat(2006) and Kalmantiand Maris (2007)
Majumdar et al.(1999), Wilkie et al.(2004) and Yasar andAkgunlu (2006)
Byng et al. (1996),Nguyen andRangayyan (2005),Mavroforakis et al.(2006), Tanki et al.(2006) and Li et al.(2007)
Differential boxcounting
Chaudhuri andSarkar (1995)
Yum and Kim (2002) Zook and Iftekharuddin(2005) and Lopes et al.(2007a)
Extended countingmethod
Sandau and Kurz(1997) and Chunget al. (2002)
Triangular prismsmethod
Zook and Iftekharuddin(2005)
Oczeretko et al.(2001) and Imre andBogaert (2004)
Covering blanketmethod
Novianto et al.(2003)
Zook and Iftekharuddin(2005)
Variogram Iftekharuddin et al.(2000)
Benhamou et al.(1994) and Jennaneet al. (2006)
Power spectrum Caldwell et al. (1998),Ouyang et al. (1998),Lespessailles et al.(1998) and Majumdaret al. (1999)
Isarithm method Free et al. (1996) Rangayyan andNguyen (2005)
MultifractalRenyi’s dimensions Xia et al. (2006) Yu et al. (2001) Guillemet (1996)Direct determination
method of the f(a)singularityspectrum
Lévy-Véhel et al.(1992)
Wang et al. (2006)and Wang et al.(2007)
Takahashi et al. (2006)and Lopes et al. (2007b)
Stojic et al. (2006)
Sand box method Stosic and Stosic (2006)Large-deviation
multif. Spect.Discrete wavelet
transformLi et al. (2005) andHsu et al. (2007)
The WTMM method Arneodo et al. (1998),Shimizu et al. (2004)and Popivanov et al.(2005)
Kestener et al. (2004)
Wavelet leaders
R. Lopes, N. Betrouni / Medical Image Analysis 13 (2009) 634–649 645
WTMM method is efficient in the detection of the micro-calcifications.
8. Conclusion
Fractal geometry provides a powerful tool for the characteriza-tion and segmentation in many medical imaging applications. Theapplicability of this geometry in image analysis comes from thefact that the imaged object are discontinuous, complex, and frag-mented. The significance and the advantage of this geometry com-pared to classic signal processing methods, lie in the way of howthe non-regularities are assumed.
Fractal analysis is often brought to the evaluation of the FDwhich allows having a global description of the inhomogeneitiesin the image. Its efficiency has been demonstrated in classificationand segmentation experiments where it was used as an additional
texture parameter. It has also been used alone for the characteriza-tion of two states (e.g. healthy vs. pathological). Table 1 summa-rizes the main methods and applications used in the medicalfield. From this table, it appears that the box-counting method isthe most widely used, despite its drawbacks (binarization of thesignal, construction of empty boxes, grid effect, etc.). This general-ization is easily understood because this method is easy to imple-ment. Another explanation for the lack of interest in some methodsamong biomedical researchers is that these methods were devel-oped outside the biomedical domain.
Beyond its advantage, the multiplication of computation meth-ods of FD does not go without drawbacks. Indeed, the computeddimension could be affected by some parameters as the computa-tion algorithm used and its parameters tuning. As result, it is diffi-cult to know whether the observed differences in computed FDvalues is a result of true differences in image texture or a result

646 R. Lopes, N. Betrouni / Medical Image Analysis 13 (2009) 634–649
of certain arbitrary decisions made during the estimation process.Therefore, the choice of a method is an important issue in the com-putation of FD. In most applications cited in this study, no compar-ative evaluation was done to determine the most suitablealgorithm for the considered data, which suggests that some re-sults could be improved.
Another limitation with fractal analysis is to describe objects bya single fractal value whereas they exhibit a multifractal behaviour.Multifractal analysis is a response to this limit. It allows computinga spectrum or a set of fractal dimensions. However, as above, manyalgorithms exist to evaluate this spectrum and numerical differ-ences between the methods appear.
As conclusion of this study, fractal geometry could be an effi-cient tool to deal with some problems in image analysis as longas two parameters are taken into consideration:
1. The dimensionality of images to choose fractal or multifractalanalysis.
2. The suitable algorithm: To make a comparative study of thebehaviour of the different methods on the data.
References
Abadi, M., Grandchamp, E., 2006. Texture features and segmentation based onmultifractal approach. The 11th Iberoamerican Congress on Pattern Recognition4225, 297–305.
Anderson, J., Karagounis, L., Stein, K., Moreno, F., Ledingham, R., Hallstrom, A., 1997.Predictive value for future arrhythmic events of fractal dimension, a measure oftime clustering of ventricular premature complexes, after myocardialinfarction. Journal American College of Cardiology 30 (1), 226–232.
Appleby, S., 1996. Multifractal characterization of the distribution pattern of thehuman population. Geographical Analysis 28 (2), 147–160.
Arneodo, A., Bacry, E., Muzy, J., 1995. Oscillating singularities in locally self-similarfunctions. Physical review Letters 74 (24), 4823–4826.
Arneodo, A., Decoster, N., Kestener, P., Roux, S., 2003. A wavelet-based method formultifractal image analysis : from theoretical concepts to experimentalapplications. In: Advances in Imaging and Electron Physics, P.W. Hawkes,Academic Press (Eds), Vol. 126, 1–98.
Arneodo, A., Bacry, E., Jaffard, S., Muzzy, J., 1998. Singularity spectrum ofmultifractal functions involving oscillating singularities. Journal of FourierAnalysis and Applications 4 (2), 159–174.
Asvestas, P., Matsopoloulos, G., Nikita, K., 1998. A power differentiation method offractal dimension estimation for 2-D signals. Journal of Visual Communicationand Image Representation 9 (4), 392–400.
Bachelier, L., 1900. Théorie de la spéculation. Annales scientifiques de l’ÉcoleNormale Supérieure 17 (3), 21–86.
Badii, R., Politi, A., 1984. Hausdorff dimension and uniformity factor of strangeattractors. Physical Review Letter 52 (19), 1661–1664.
Badii, R., Politi, A., 1985. Statistical description of chaotic attractors: the dimensionfunction. Journal of Statistical Physics 40 (5–6), 725–750.
Bassingthwaighte, J., Van Beek, J., King, R., 1990. Fractal branchings: The basis ofmyocardial flow heterogeneities? Annals of the New York Academy of Science591 (1), 392–401.
Benhamou, C., Lespesailles, E., Jacquet, G., Harba, R., Jennane, R., Loussot, T.,Tourliere, D., Ohley, W., 1994. Fractal organization of trabecular bone images oncalcaneus radiographs. Journal of Bone and Mineral Research 9 (12), 1909–1918.
Bhatti, A., Nahavandi, S., Frayman, Y., 2007. 3D depth estimation for visualinspection using wavelet transform modulus maxima. Computers andElectrical Engineering 33 (1), 48–57.
Bisoi, A., Mishra, J., 2001. On calculation of fractal dimension of images. PatternRecognition Letters 22 (6–7), 631–637.
Biswas, M., Ghose, T., Guha, S., Biswas, P., 1998. Fractal dimension estimation fortexture images: A parallel approach. Pattern Recognition Letters 19 (3–4), 309–313.
Blanton, R., Levitt, J., Thompson, P., Narr, K., Capetillo-Cunliffe, L., Nobel, A.,Singerman, J., 2001. Mapping cortical asymmetry and complexity patterns innormal children. Psychiatry Research 107 (1), 29–43.
Block, A., Bloh, W., von Schellnhuber, H., 1990. Efficient boxcounting determinationof generalized fractal dimensions. Physical Review A 42 (4), 1869–1874.
Brodu, N., 2005. Multifractal Feature Vectors for Brain-Computer Interfaces.Proceedings of the IEEE World Congress on Computational Intelligence 2883,2890.
Broniatowski, M., Mignot, P., 2001. A self-adaptive technique for the estimation ofthe multifractal spectrum. Statistics and Probability Letters 54 (2), 125–135.
Bullmore, E., Brammer, M., Harvey, I., Persaud, R., Murray, R., Ron, M., 1994. Fractalanalysis of the boundary between white matter and cerebral cortex in magneticresonance images: A controlled study of schizophrenic and manic-depressivepatients. Psychological Medicine 24 (3), 771–781.
Byng, J., Boyd, N., Fishell, E., Jong, R., Yaffe, M., 1996. Automated analysis ofmammographic densities. Physics in Medicine and Biology 41 (5), 909–923.
Caldwell, C., Stapleton, S., Holdsworth, D., Jong, R., Weiser, W., Cooke, G., Yaffe, M.,1990. Characterization of mammographic parenchyma pattern by fractaldimension. Physics in Medicine and Biology 35 (2), 235–247.
Caldwell, C., Moran, E., Bogoch, E., 1998. Fractal dimension as a measure of alteredtrabecular bone in experimental inflammatory arthritis. Journal of Bone andMineral Research 13 (6), 978–985.
Caligiuri, P., Giger, M., Favus, M., 1994. Multifractal radiographic analysis ofosteoporosis. Medical Physics 21 (4), 503–508.
Caswell Schuckers, S., 1998. Approximate entropy as a measure of morphologicvariability for ventricular tachycardia and fibrillation. Computers in Cardiology1998 (13–16), 265–268.
Chappard, D., Chennebault, A., Moreau, M., Legrand, E., Audran, M., Basle, M.F., 2001.Texture analysis of X-ray radiographs is a more reliable descriptor of bone lossthan mineral content in a rat model of localized disuse induced by theclostridium botulinum toxin. Bone 28 (1), 72–79.
Chaudhuri, B., Sarkar, N., 1995. Texture Segmentation Using Fractal Dimension. IEEETransactions on Pattern Analysis and Machine Intelligence 17 (1), 72–77.
Chen, S., Keller, J., Crownover, R., 1993. On the calculation of fractal features fromimages. IEEE Transactions on Pattern Analysis and Machine Intelligence 15 (10),1087–1090.
Chhabra, A., Jensen, R., 1989. Direct determination of the f(alpha) singularityspectrum. Physical Review Letter 62 (12), 1327–1330.
Chung, H., 2003. Fractal Analysis of Nuclear medicine Images Again: Validity andInterpretation of Results from New Analysis Methods. The Journal of NuclearMedicine 44 (2), 316–317.
Chung, H., Wu, W., Chung, H., 2002. A reinvestigation of the extended countingmethod for fractal analysis of the pial vasculature. Journal of Cerebral BloodFlow & Metabolism 22 (3), 361–363.
Clarke, K., 1986. Computation of the fractal dimension of topographic surfaces usingthe triangular prism surface area method. Computers & Geosciences 12 (5),713–722.
Cook, M., Free, S., Manford, M., Fish, D., Shorvon, S., Stevens, J., 1995. Fractaldescription of cerebral cortical patterns in frontal lobe epilepsy. EuropeanNeurology 35 (6), 327–335.
Cooper, C., 1993. The epidemiology of fragility fractures: is there a role for bonequality? Calcified Tissue International 53 (Suppl. 1), 23–26.
Cross, S., Howat, A., Stephenson, T., Cotton, D., Underwood, J., 1994. Fractalgeometric analysis of material from molar and non-molar pregnancies. Journalof Pathology 173 (2), 115–118.
Cross, S., Start, R., Silcocks, P., Bull, A., Cotton, D., Underwood, J., 1993. Quantitationof the renal arterial tree by fractal analysis. Journal of Pathology 170 (4), 479–484.
Cuevas, E., 2003. F(alpha) multifractal spectrum at strong and weak disorder.Physical Review B 68, 24206–24212.
De Bartolo, S., Gaudio, R., Gabriele, S., 2004. Multifractal analysis of river networks:sandbox approach. Water Resources Research 40 (2), W02201.
De Jong, S.M., Burrough, P.A., 1995. A fractal approach to the classification ofMediterranean vegetation types in remotely sensed images. PhotogrammetricEngineering & Remote Sensing 61 (8), 1041–1053.
Dempster, D., Ferguson, P., Mellish, R., Cochran, G., Xie, F., Fey, C., Horbert, W.,Parisien, M., Lindsay, R., 1993. Relationships between bone structure in the iliaccrest and bone structure and strength in the lumpar spine. OsteoporosisInternational 3, 90–96.
Dougherty, G., 2001. A comparison of the texture of computed tomography andprojection radiography images of vertebral trabecular bone using fractalsignature and lacunarity. Medical Engineering and Physics 23 (9), 313–321.
Dougherty, G., Henebry, G., 2001. Fractal signature and lacunarity in themeasurement of the texture of trabecular bone in clinical CT images. MedicalEngineering and Physics 23 (6), 369–380.
Dubuisson, M., Dubes, R., 1994. Efficacy of fractal features in segmenting images ofnatural textures. Pattern Recognition Letters 15 (4), 419–431.
Duncan, J., Ayache, N., 2000. Medical image analysis: progress over two decades andthe challenges ahead. IEEE Transactions on Pattern Analysis and MachineIntelligence 22 (1), 85–105.
Enescu, B., Ito, K., Struzik, Z., 2006. Wavelet-based multiscale resolution analysis ofreal and simulated time-series of earthquakes. Geophysical JournalInternational 164 (1), 63–74.
Espinal, F., Chandran, R., 1998. Wavelet-based fractal signature for textureclassification. Proc. SPIE of Wavelet Applications V 3391, 602–611.
Esteller, R., Echauz, J., Tcheng, T., 2004. Comparison of line length feature before andafter brain electrical stimulation in epileptic patients. Proceedings of the 26thAnnual International Conference of the IEEE Engineering in Medicine andBiology Society 7, 4710-4713.
Ezekiel, S., 2003. Medical Image Segmentation using multifractal analysis.Proceedings of the Applied Informatics 378, 220–224.
Feeny, B., 2000. Fast multifractal analysis by recursive box covering. InternationalJournal of Bifurcation and Chaos 10 (9), 2277–2287.
Free, S., Sisodiya, S., Cook, M., Fish, D., Shorvon, S., 1996. Three-dimensional fractalanalysis of the white matter surface from magnetic resonance images of thehuman brain. Cerebral Cortex 6 (6), 830–836.
Frish, U., 1995. Turbulence: the Legacy of A.N Kolmogorov. Cambridge UniversityPress (Eds), Cambridge (UK), 296 pp.
Glenny, R., Robertson, H., 1991. Fractal modeling of pulmonary blood flowheterogeneity. Journal of Applied Physiology 70 (3), 1024–1030.

R. Lopes, N. Betrouni / Medical Image Analysis 13 (2009) 634–649 647
Goodchild, M., 1980. Fractals and the accuracy of geographical measures.Mathematical Geology 12 (2), 85–98.
Gorski, A.Z., Skrzat, J., 2006. Error estimation of the fractal dimensionmeasurements of cranial sutures. Journal of Anatomy 208 (3), 353–359.
Grassberger, P., Badii, R., Politi, A., 1988. Scaling laws for invariant measures onhyperbolic and nonhyperbolic atractors. Journal of Statistical Physics 51 (1–2),135–178.
Grassberger, P., Procaccia, I., 1983. Characterization of strange attractors. PhysicalReview Letter 50 (5), 346–349.
Guillemet, H. Détection et caractérisation des foyers de micro calcifications enmammographie numérique. 1996. Ecole Nationale Supérieure desTélécommunications, Paris, France, 171 pp.
Guo, Q., Shao, J., Guo, F., Ruiz, V., 2007. Classification of mammographic massesusing geometric symmetry and fractal analysis. International Journal ofComputer Assisted Radiology and Surgery 2 (Suppl. 1), 336–338.
Halsey, T., Jensen, M., Kadanoff, L., Procaccia, I., Shraiman, B.I., 1986. Fractalmeasures and their singularities: the characterization of strange sets. PhysicalReview A 33 (2), 1141–1151.
Haralick, R., Shanmugan, K., Dinstein, I., 1973. Textural features for imageclassification. IEEE Transactions on Systems, Man and Cybernetics 3, 610–621.
Hou, X., Gilmore, R., Mindlin, G., Solari, H., 1990. An efficient algorithm for fastO(N�ln(N)) box-counting. Physics Letters A 151 (1–2), 43–46.
Hsu, W.Y., Lin, C.C., Ju, M.S., Sun, Y.N., 2007. Wavelet-based fractal features withactive segment selection: application to single-trial EEG data. Journalof Neuroscience Methods 163, 145–160.
Huang, Y., Yu, S., 2007. Recognition of micro-calcifications in digital mammogramsbased on Markov random fiels and deterministic fractal modeling. Proceedingsof the 29th Annual International Conference of the IEEE Engineering inMedicine and Biology Society, 3922-3925.
Ida, T., Sambonsugi, Y., 1998. Image segmentation and contour detection usingfractal coding. IEEE transactions on circuits and systems for video technology 8(8), 968–975.
Iftekharuddin, K., Jia, W., Marsh, R., 2000. A fractal analysis approach toidentification of tumor in brain MR images. Proceedings of the 22nd AnnualInternational Conference of the IEEE Engineering in Medicine and BiologySociety 4, 3064-3066.
Iftekharuddin, K., Jia, W., Marsh, R., 2003. A fractal analysis of tumor in brain MRimages. Machine Vision and Applications 13 (5), 352–362.
Imre, A.R., Bogaert, J., 2004. The fractal dimension as a measure of the quality ofhabitats. Acta Biotheoretica 52 (1), 41–56.
Jaffard, S., Abry, P., Lashermes, B., 2005. Wavelet leaders in multifractal analysis. In:Wavelet analysis and Applications, T. Qian, M.I. Vai, X. Yuesheng, BirkhäuserVerlag (Eds), 219–264.
Jaffard, S., 1997. Multifractal formalism for functions. SIAM Journal of MathematicalAnalysis 28, 944–970.
Jain, R., Munn, L., Fukumura, D., 2002. Dissecting tumour pathopsysiology usingintravital microscopy. Nature Reviews Cancer 2 (4), 266–276.
Jennane, R., Harba, R., Lemineur, G., Bretteil, S., Estrade, A., Benhamou, J., 2006.Estimation of the 3D self-similarity parameter of trabecular bone from its 2Dprojection. Medical Image Analysis 11 (1), 91–98.
Jin, X., Ong, S., Jayasooriah,, 1995. A practical method for estimating fractaldimension. Pattern Recognition Letters 16 (5), 457–464.
John, S., Bradford, A., 1993. The electroencephalogram: Its pattern and origins, MITPress (Eds), London.
Jun, Y., Yoon, Y., Yoon, H., 1994. ECG data compression using fractal interpolation.Proceedings of the 16th Annual International Conference of the IEEEEngineering in Medicine and Biology Society 1 (3-6), 161-162.
Kalmanti, E., Maris, T.G., 2007. Fractal dimension as an index of brain corticalchanges throughout life. In Vivo 21 (4), 641–646.
Kaplan, L., 1999. Extended fractal analysis for texture classification andsegmentation. IEEE Transactions on Image Processing 8 (11), 1572–1585.
Kedzia, A., Rybaczuk, M., Andrzejak, R., 2002. Fractal dimensions of human braincortex vessels during the fetal period. Medical Science Monitor 8 (3), 46–51.
Keller, J., Crownover, R., Chen, S., 1989. Texture description and segmentationthrough fractal geometry. Computer Vision Graphics and Image Processing 45(2), 150–160.
Kenkel, N., Walker, D., 1996. Fractals in the biological sciences. Coenoses 1, 77–100.Keough, K., Hyam, P., Pink, D., Quinn, B., 1991. Cell surfaces and fractal dimensions.
Journal of Microscopy 163 (1), 95–99.Kestener, P., Arneodo, A., 2003. A three-dimensional wavelet based multifractal
method : about the need of revisiting the multifractal description of turbulencedissipation data. Physical Review Letter 91 (19), 194501.1–194501.4.
Kestener, P., Lina, J., Saint-Jean, P., Arneodo, A., 2004. Wavelet-based multifractalformalism to assist in diagnosis in digitized mammograms. Image Analysis andStereology 20 (3), 169–175.
Khalil, A., Joncas, G., Nekka, F., Kestener, P., Arneodo, A., 2006. Morphologicalanalysis of H I features. II. Wavelet-based multifractal formalism. AstrophysicalJournal 165 (2), 512–550.
Khosrovi, P., Kahn, A., Genant, H., Majumdar, S., 1994. Characterization of trabecularbone structure from radiographs using fractal analysis. Journal of Bone andMineral Research 9, 156–157.
Kikuchi, A., Unno, N., Horikoshi, T., Shimizu, T., Kozuma, S., Taketani, Y., 2005.Changes in fractal features of fetal heart rate during pregnancy. Early HumanDevelopment 81, 655–661.
Klapetek, P., Ohlidal, I., 2005. Applications of the wavelet transform in AFM dataanalysis. Acta Physica Slovaca 55 (3), 295–303.
Klinkenberg, B., Goodchild, M., 1992. The fractal properties of topography: acomparison of methods. Earth Surface Processes and Landforms 17, 217–234.
Kolibal, J., Monde, J., 1998. Fractal image error analysis. Computers & Geosciences 4(8), 785–795.
Kolmogorov, A., 1941. The local structure of turbulence in incompressible viscousfluid for very large reynolds number. Comptes Rendus de l’Académie dessciences 30, 9–13.
Krenz, G., Linehan, J., Dawson, C., 1992. A fractal continuum model of the pulmonaryarterial tree. Journal of Applied Physiology 72 (6), 2225–2237.
Kulish, V., Sourin, A., Sourina, O., 2006. Human electroencephalograms seen asfractal time series: Mathematical analysis and visualization. Computers inBiology and Medicine 36, 291–302.
Lam, N., De Cola, L., 2002. Fractals in Geography. The Blackburn Press (Eds),Caldwell, NJ, 308 pp.
Lam, N., Qiu, H., Quattochi, D., 1997. An evaluation of fractal surface measurementmethods using ICAMS (Image Characterization and Modeling System). ACSM/ASPRS Annual Convention 5, 377–386.
Lam, N., Qiu, H., Quattochi, D., Emerson, C., 2002. An evaluation of fractal methodsfor characterizing image complexity. Cartography and Geographic InformationScience 29 (1), 25–35.
Landini, G., Rippin, J.W., 1996. Quantification of nuclear pleomorphism using anasymptotic fractal model. Analytical & Quantitative Cytology & Histology 18 (2),167–176.
Lanyi, M., 1986. Diagnosis and differential diagnosis of breast calcifications.Springer-Verlag (Eds), Berlin, Heidelberg, New York, 252 pp.
Lashermes, B., Jaffard, S., Abry, P., 2005. Wavelet leader based multifractal analysis.Acoustics, Speech, and Signal Processing 4 (18), 161–164.
Lee, W., Chen, Y., Chen, Y., Hsieh, K., 2005. Unsupervised segmentation of ultrasonicliver images by multiresolution fractal feature vector. Information Sciences 175(3), 177–199.
Lespessailles, E., Jullien, A., Eynard, E., Harba, R., Jacquet, G., Ildefonse, J., Ohley, W.,Benhamou, C.L., 1998. Biomechanical properties of human os calcanei:relationships with bone density and fractal evaluation of bonemicroarchitecture. Journal of Biomechanics 31 (9), 817–824.
Lévy-Véhel, J., 1995. Fractal approches in signal processing. Fractals 3, 755–775.Lévy-Véhel, J., Mignot, P., Berroir, J., 1992. Texture and Multifractals: New tools for
image analysis. Technical report of INRIA-Rocquencourt, vol. 1706.Lévy-Véhel, J., Vojak, R., 1995. Multifractal analysis of Choquet capacities:
Preliminary Results. Technical report of INRIA-Rocquencourt, vol. 2576.Li, H., Liu, K., Lo, S., 1996. Enhancement of micro-calcifications on mammograms
using a fractal modelling approach. Proceedings of the 18th AnnualInternational Conference of the IEEE Engineering in Medecine and BiologySociety 3, 1111-1112.
Li, H., Giger, M.L., Olopade, O.I., Lan, L., 2007. Fractal analysis of mammographicparenchymal patterns in breast cancer risk assessment. Academic Radiology 14(5), 513–521.
Li, X., Polygiannakis, J., Kapiris, P., Peratzakis, A., Eftaxias, K., Yao, X., 2005. Fractalspectral analysis of pre-epileptic seizures in terms of criticality. Journalof Neural Engineering 2 (2), 11–16.
Link, T., Majumdar, S., Konermann, W., Meier, N., Lin, J., Newitt, D., Ouyang, X.,Peters, P., Genant, H., 1997. Texture analysis of direct magnification radiographsof vertebral specimens: correlation with bone mineral density andbiomechanical properties. Academic Radiology 4, 167–176.
Liu, J., Zhang, L., Yue, G., 2003. Fractal dimension in human cerebellummeasured by magnetic resonance imaging. Biophysical Journal 85 (6), 4041–4046.
Lopes, R., Betrouni, N., Szurhaj, W., Steinling, M., 2007a. 3D Fractal analysis forepilepsy characterization on SPECT images. European Journal ofNuclear Medicine 34 (2), 394.
Lopes, R., Dubois, P., Dewalle, A., Maouche, S., Betrouni, N., 2007b. 3D multifractalanalysis of cerebral tomoscintigraphy images. International journal ofComputer Assisted Radiology and Surgery 2 (Supp1), 17–18.
Lopes, R., Dubois, P., Makni, N., Szurhaj, W., Maouche, S., Betrouni, N., 2008.Classification of brain SPECT imaging using 3D local multifractal spectrum forepilepsy detection. International Journal of Computer Assisted Radiology andSurgery 3 (3-4), 341–346.
Maeda, J., Novianto, S., Miyashita, A., Saga, S., Suzuki, Y., 1998. Fuzzy region-growingsegmentation of natural images using local fractal dimension. Proceedings ofthe 14th International Conference on Pattern Recognition 2, 991.
Majumdar, S., Lin, J., Link, T., Millard, J., Augat, P., Ouyang, X., Newitt, D., Gould, R.,Kothari, M., Genant, H., 1999. Fractal analysis of radiographs: Assessment oftrabecular bone structure and prediction of elastic modulus and strength.Medical Physics 26 (7), 1330–1340.
Mandelbrot, B., 1963. The variation of certain speculative prices. J. of Business 36,394–419.
Mandelbrot, B., 1975. Les objets fractals : forme, hasard et dimension. Flammarion(Eds), Paris, 208 pp.
Mandelbrot, B., 1977. Fractals: Form. Chance and Dimension, Freeman (Eds), 365pp.
Mandelbrot, B., 1983. The Fractal Geometry of Nature. Freeman (Eds), 468 pp.Mandelbrot, B., 1967. How long is the coast of Britain? Statistical self-similarity and
fractional dimension. Science 156, 636–638.Mandelbrot, B., 1985. Self-affine fractals and the fractal dimension. Physica Scripta
32, 257–260.Mansury, Y., Deisboeck, T., 2004. Simulating ‘‘structure-function” patterns of
malignant brain tumors. Physica A 331 (1–2), 219–232.

648 R. Lopes, N. Betrouni / Medical Image Analysis 13 (2009) 634–649
Martinez, P., Schertzer, D., Pham, K., 1997. Texture modelisation by multifractalprocesses for SAR image segmentation. Radar 97 (4), 135–139.
Mavroforakis, M., Georgiou, H., Dimitropoulos, N., Cavouras, D., Theodoridis, S.,2006. Mammographic masses characterization based on localized texture anddataset fractal analysis using linear, neural and support vector machineclassifiers. Artificial Intelligence In Medicine 37, 145–162.
Messent, E., Ward, R., Tonkin, C., Buckland-Wright, C., 2005. Tibial cancellous bonechanges in patients with knee osteoarthritis. A short-term longitudinal studyusing fractal signature analysis. OsteoArthritis and Cartilage 13, 463–470.
Meyer, Y., 1998. Wavelets, vibrations and scaling. CRM Monograph Ser. 9, AmericanMathematical Society, Providence, RI.
Molteno, T., 1993. Fast O(N) box-counting algorithm for estimating dimensions.Physical Review E 48 (5), 3263–3266.
Munoz, D.A., Angulo, B.F., Del Rio Correa, J.L., 2005. Changes in multifractality withaging and heart failure in heartbeat interval time series. Proceedings of the 29thAnnual International Conference of the IEEE Engineering in Medicine andBiology Society 7, 6981-6984.
Murali, S., 2005. Fractal and FFT power spectra analysis of human electroenceph-alograms (brain waves) for six different odors, M.Sc. dissertation, NanyangTechnological University, Singapore.
Nagao, M., Murase, K., 2002. Measurement of heterogeneous distribution onTechnegas SPECT images by three-dimensional fractal analysis. Annals ofNuclear Medicine 16 (6), 369–376.
Nguyen, T., Rangayyan, R., 2005. Shape Analysis of Breast Masses in Mammogramsvia the Fractal Dimension. Proceedings of the 29th Annual InternationalConference of the IEEE Engineering in Medecine and Biology Society 3, 3210-3213.
Normant, F., Tricot, C., 1991. Methods for evaluating the fractal dimension of curvesusing convex hulls. Physical Review A 43 (12), 6518–6525.
Novianto, S., Suzuki, Y., Maeda, J., 2003. Near optimum estimation of local fractaldimension for image segmentation. Pattern Recognition Letters 24 (1–3), 365–374.
Oczeretko, E., Juczewska, M., Kasacka, I., 2001. Fractal geometric analysis of lungcancer angiogenic patterns. Folia Histochemica et Cytobiologica 39 (Suppl. 2),75–76.
Oiwa, N., Glazier, J., 2004. Self-Similar Mitochondrial DNA. Cell. Biochem. Biophys.41 (1), 41–62.
Osborne, A.R., Provenzale, A., 1989. Finite correlation dimension for stochasticsystems with power-law spectra. Physica D 35, 357–381.
Ott, S., 1986. Should women get screening bone mass measurements? Annals ofInternal Medicine 104, 874–876.
Ouyang, X., Majumdar, S., Link, T., Lu, Y., Augat, P., Lin, J., Newitt, D., Genant, H.,1998. Morphometric texture analysis of spinal trabecular bone structureassessed using orthogonal radiographic projections. Medical Physics 25 (10),2037–2045.
Owis, M., Abou-Zied, A., Youssef, A., Kadah, Y., 2002. Study of features based onnonlinear dynamical modeling in ECG arrhythmia detection and classification.IEEE Transactions on Biomedical Engineering 49 (7), 733–736.
Papaloucas, C., Ward, R., Tonkin, C., Buckland-Wright, C., 2005. Cancellous bonechanges in hip osteoarthritis: a short-term longitudinal study using fractalsignature analysis. OsteoArthritis and Cartilage 13 (11), 998–1003.
Parkinson, I., Fazzalari, N., 1994. Cancellous bone structure analysis using imageanalysis. Australasian Physical and Engineering Sciences in Medicine 470, 64–70.
Peleg, S., Naor, J., Hartley, R., Avnir, D., 1984. Multiple resolution texture analysisand classification. IEEE Transactions on Pattern Analysis and MachineIntelligence 6 (6), 661–674.
Penn, A., Bolinger, L., Schnall, M., Loew, M., 1999. Discrimination of MR images ofbreast masses with fractal-interpolation function models. Academic Radiology6 (3), 156–163.
Pentland, A., 1984. Fractal-based description of natural scenes. IEEE Transactions onPattern Analysis and Machine Intelligence 6 (6), 661–674.
Pereda, E., Gamundi, A., Rial, R., Gonzalez, J., 1998. Non-linear behaviour of humanEEG: fractal exponent versus correlation dimension in awake and sleep stages.Neuroscience Letters 250 (2), 91–94.
Pereira, D., Zambrano, C., Martin-Landrove, M., 2000. Evaluation of malignancy intumors of the central nervous system using fractal dimension. Proceedings ofthe 22nd Annual International Conference of the IEEE Engineering in Medicineand Biology Society 3, 1775-1778.
Perrier, E., Tarquis, A., Dathe, A., 2006. A program for fractal and multifractalanalysis of 2D binary images : Computer algorithms versus mathematicaltheory. Geoderma 134 (3–4), 284–294.
Pham, D., Xu, C., Prince, J., 1999. Current methods in medical image segmentation.Annual Review of Biomedical Engineering 2, 315–337.
Phothisonothai, M., Nakagawa, M., 2007. Fractal-based EEG data analysis of bodyparts movement imagery tasks. Journal of Physiological Sciences 57 (4), 217–226.
Pickover, C., Khorasani, A., 1986. Fractal characterization of speech waveformsgraphs. Computer Graphics 1 (1), 51–61.
Popivanov, D., Jivkova, S., Stomonyakov, V., Nicolova, G., 2005. Effect of independantcomponent analysis on multifractality of EEG during visual-motor task. SignalProcessing 85 (11), 2112–2123.
Pratt, W., Faugeras, O., Gagalowicz, A., 1978. Visual discrimination of stochastictexture fields. IEEE Transactions on Systems. Man and Cybernetics 8 (11), 796–804.
Prigarin, S., Hahn, K., Winkler, G., 2008. Comparative analysis of two numericalmethods to measure Hausdorff dimension of the fractional Brownian motion.Numerical Analysis and Applications 1 (2), 163–178.
Pruess, S., 2007. Some remarks on the numerical estimation of fractal dimension. In:Fractals in the Earth Sciences, C.C. Barton and P.R. La Pointe, Plenum Press (Eds),New-York, Chap. 3, 65–75.
Qiu, H., Lam, N., Quattochi, D., Gamon, J., 1999. Fractal characterization ofhyperspectral imagery. Photogrammetric Engineering and Remote Sensing 65(1), 63–71.
Rangayyan, R., Nguyen, T., 2005. Pattern classification of breast masses via fractalanalysis of their contours. Proceedings of Computer Assisted radiology andSurgery (CARS) 1281, 1041–1046.
Renyi, A., 1955. On a new axiomatic theory of probability. Acta MathematicaHungarica 6 (3–4), 285–335.
Russel, D., Hanson, J., Ott, E., 1980. Dimension of strange attractors. Physical ReviewLetters 45 (14), 1175–1178.
Ruttiman, U., Webber, R., Hazelrig, J., 1992. Fractal dimension from radiographs ofperidental alveolar bone. Oral Pathology 74 (1), 98–110.
Rybaczuk, M., Kedzia, A., Blaszcyk, E., 1996. Fractal description of cerebellumsurface during fetal period. Folia Morphologica 55 (4), 434–436.
Sandau, K., Kurz, H., 1997. Measuring fractal dimension and complexity–analternative approach with an application. Journal of Microscopy 186 (2), 164–176.
Sanderson, B., Goulding, A., 1990. The fractal dimension of relative Lagrangianmotion. Tellus 42A, 550–556.
Sato, K., Sugawara, K., Narita, Y., Namura, I., 1996. Consideration of the method ofimage diagnosis with respect to frontal lobe antrophy. Proceedings of IEEETransactions on Nuclear Science 43, 3230–3239.
Shan, Z., Liu, J., Glass, J., Gajjar, A., Li, C., Reddick, W., 2006. Quantitativemorphological evaluation of white matter in survivors of chilhoodmedulloblastoma. Magnetic Resonance Imaging 24 (8), 1015–1022.
Shelberg, M., Lam, N., Moellering, H., 1983. Measuring the fractal dimension ofsurfaces. Proceedings of the Sixth International Symposium on Computer-Assisted Cartography Auto-Carto 6, 319–328.
Shimizu, Y., Barth, M., Windischberger, C., Moser, E., Thurner, S., 2004. Wavelet-based multifractal analysis of fMRI time series. NeuroImage 22 (3), 1195–1202.
Sisodiya, S., Free, S., 1997. Disproportion of cerebral surface areas and volumes incerebral dysgenesis. MRI-based evidence for connectional abnormalities. Brain120 (2), 271–281.
Small, M., Yu, D., Harrison, R., Grubb, N., Fox, K., 2002. Uncovering non-linearstructure in human ECG recordings. Chaos, Solitons & Fractals 13, 1755–1762.
Smith, T., Behar, T., 1994. Comparative fractal analysis of cultured glia derived fromoptic nerve and brain demonstrate different rates of morphologicaldifferentiation. Brain Research 634 (2), 181–190.
Smith, T., Brauer, K., Reichenbach, A., 1993. Quantitative phylogenetic constancy ofcerebellar Purkinje cell morphological complexity. The Journal ofComparative Neurology 331 (3), 402–406.
Smrcka, P., Bittner, R., Vysoky, P., Hana, K., 2003. Fractal and multifractal propertiesof heartbeat interval series in extremal states of the human organism.Measurement Science Review 3, 13–15.
Soille, P., Rivest, J., 1996. On the validity of fractal dimension measurements inimage analysis. Journal of Visual Communication and Image Representation 7(3), 217–229.
Soltys, Z., Ziaja, M., Pawlinski, R., Setkowicz, Z., Janeczko, K., 2001. Morphology ofreactive microglia in the injured cerebral cortex. Fractal analysis andcomplementary quantitative methods. Journal of Neuroscience Research 63(1), 90–97.
Spasic, S., Kalauzi, A., Grbic, G., Martac, L., Culic, M., 2005. Fractal analysis of ratbrain activity after injury. Medical and Biological Engineering and Computing43 (3), 345–348.
Stojic, T., Reljin, I., Reljin, B., 2006. Adaptation of multifractal analysis tosegmentation of microcalcifications in digital mammograms. Physica A 367,494–508.
Stosic, T., Stosic, B.D., 2006. Multifractal analysis of human retinal vessels. IEEETransactions on Medical Imaging 25 (8), 1101–1107.
Sun, W., 2006. Three new implementations of the triangular prism method forcomputing the fractal dimension of remote sensing images. PhotogrammetricEngineering and Remote Sensing 72 (4), 373–382.
Suri, J., Setarehdan, S., Sing, S., 2002. Advanced algorithmic approaches to medicalimage segmentation, Springer (Eds), New-York, 668 pp.
Tabar, L., Duffy, S., Burhenne, L., 1993. New Swedish breast cancer detection resultsfor women aged 40–49. Cancer 72 (suppl. 4), 1437–1448.
Takahashi, T., Murata, T., Narita, K., Hamada, T., Kosaka, H., Omori, M., Takahashi, K.,Kimura, H., Yoshida, H., Wada, Y., 2006. Multifractal analysis of deep whitematter microstructural changes on MRI in relation to early-stageatherosclerosis. NeuroImage 32 (3), 1158–1166.
Taleb-Ahmed, A., Dubois, P., Duquenoy, E., 2003. Analysis methods of CT-scanimages for the characterization of the bone texture: First results. PatternRecognition Letters 24 (12), 1971–1982.
Tanki, N., Murase, K., Nagao, M., 2006. A new parameter enhancing breast cancerdetection in computer-aided diagnosis of X-ray mammograms. Igaku Butsuri 26(4), 207–215.
Taylor, P., Hajnal, S., Dilhuydy, M., Barreau, B., 1994. Measuring image texture toseparate ‘‘difficult” from ‘‘easy” mammograms. British Journal of Radiology 67,456–463.

R. Lopes, N. Betrouni / Medical Image Analysis 13 (2009) 634–649 649
Tél, T., Fulop, A., Vicsek, T., 1989. Determination of fractal dimensions forgeometrical multifractals. Physica A 159, 155–166.
Thakor, N., Zhu, Y., Pan, K., 1990. Ventricular tachycardia and fibrillation detectionby a sequential hypothesis testing algorithm. IEEE Transactions on BiomedicalEngineering 37 (9), 837–843.
Thompson, P., Schwartz, C., Lin, R., Khan, A., Toga, A., 1996. Three-dimensionalstatistical analysis of sulcal variability in the human brain. Journalof Neuroscience 16 (13), 4261–4274.
Touchette, H., Beck, C., 2005. Nonconcave entropies in multifractals and thethermodynamic formalism. Journal of Statistical Physics 125 (2), 455–471.
Tourassi, G., 1999. Journey toward computer-aided diagnosis: Role of image textureanalysis. Radiology 213 (2), 317–320.
Uitewaal, P., Lips, P., Netelenbos, J., 1987. An analysis of bone structure in patientswith hip fracture. Journal of Bone and Mineral Research 3 (2), 63–67.
Veldkamp, W., Karssemeijer, N., Otten, J., Hendriks, J., 2000. Automatedclassification of clustered microcalcifications into malignant and benigntypes. Medical Physics 27 (11), 2600–2608.
Veneziano, D., Moglen, G., Bras, R., 1995. Multifractal analysis: pitfalls of standardprocedures and alternatives. Physical Review E 52 (2), 1387–1398.
Vicsek, T., 1990. Mass multifractals. Physica A 168, 490–497.Wang, G., Huang, H., Xie, H., Wang, Z., Hu, X., 2007. Multifractal analysis of
ventricular fibrillation and ventricular tachycardia. Medical Engineering &Physics 29 (3), 375–379.
Wang, G., Ren, X., Li, L., Wang, Z., 2006. Multifractal analysis of surface EMG signalsfor assessing muscle fatigue during static contractions. Journal of ZhejiangUniversity - Science A 8, 910–915.
Wang, J., Ning, X., Ma, Q., Bian, C., Xu, Y., Chen, Y., 2005. Multiscale multifractalityanalysis of a 12-lead electrocardiogram. Physical Review E 71 (6), 062902.1–062902.4.
Wax, A., Yang, C., Muller, M., Nines, R., Boone, C., Steele, V., Stoner, G., Dasari, R.,Feld, M., 2003. In situ detection of neoplastic transformation andchemopreventive effects in rat esophagus epithelium using angle-resolvedlow-coherence interferometry. Cancer Research 63, 3556–3559.
Wilkie, J.R., Giger, M.L., Chinander, M.R., Vokes, T.J., Li, H., Dixon, L., Jaros, V., 2004.Comparison of radiographic texture analysis from computed radiography andbone densitometry systems. Medical Physics 31 (4), 882–891.
Woyshville, M., Calabrese, J., 1994. Quantification of occipital EEG changes inAlzheimer’s disease utilizing a new metric; the fractal dimension.Biological Psychology 35 (6), 291–302.
Xia, Y., Feng, D., Zhao, R., 2006. Morphology-based multifractal estimation fortexture segmentation. IEEE Transactions on Image Processing 15 (3), 614–624.
Yasar, F., Akgunlu, F., 2006. The differences in panoramic mandibular indices andfractal dimension between patients with and without spinal osteoporosis.Dentomaxillofacial Radiology 35 (1), 1–9.
Yi, W.J., Heo, M.S., Lee, S.S., Choi, S.C., Huh, K.H., Lee, S.P., 2007. Direct measurementof trabecular bone anisotropy using directional fractal dimension and principalaxes of inertia. Oral surgery, oral medicine, oral pathology, oral radiology, andendodontics 104 (1), 110–116.
Yoshikawa, T., Murase, K., Oku, N., Kitagawa, K., Imaizumi, M., Takasawa, M.,Nishikawa, T., Matsumoto, M., Hatazawa, J., Hori, M., 2003. Statistical ImageAnalysis of Cerebral Blood Flow in Vascular Dementia with Small-VesselDisease. Journal of Nuclear medicine 44 (4), 505–511.
Yu, Z.G., Anh, V., Lau, K.S., 2001. Measure representation and multifractal analysis ofcomplete genomes. Phys. Rev. E Stat. Nonlin. Soft Matter Physics 64, 031903.
Yum, M.K., Kim, J.S., 2002. Increased intermittency and decreased nonstationarity ofheart rates during the daytime in patients with neurocardiogenic syncope.Journal of Cardiovascular Electrophysiology 13 (8), 788–793.
Zhang, H., Zhu, Y.S., Xu, Y., 2002. Complexity information based analysis ofpathological ECG rythm for ventricular tachycardia and ventricula fibrillation.International Journal of Bifurcation and Chaos 12, 2293–2303.
Zhang, L., Dean, D., Liu, J., Sahgal, V., Wang, X., Yue, G., 2006. Quantifyingdegeneration of white matter in normal aging using fractal dimension.Neurobiology of Aging 28 (10), 1543–1555.
Zhang, X.S., Zhu, Y.S., Thakor, N.V., Wang, Z.Z., 1999. Detecting ventriculartachycardia and fibrillation by complexity measure. IEEE Transactions onBiomedical Engineering 46 (5), 548–555.
Zhuang, X., Meng, Q., 2004. Local fuzzy fractal dimension and its application inmedical image processing. Artificial Intelligence in Medicine 32 (1), 29–36.
Zook, J., Iftekharuddin, K., 2005. Statistical analysis of fractal-based brain tumordetection algorithms. Magnetic Resonance Imaging 23 (5), 671–678.


![[EXE] Fractal and Multifractal Analysis a Review](https://static.fdocuments.net/doc/165x107/577cc0b81a28aba71190dae4/exe-fractal-and-multifractal-analysis-a-review.jpg)


![Gazing into the early dissemination process of cutaneous ......fractal analysis is well suited for assessing the edge structure [25]. Fractal and multifractal analysis of angiogenesis.](https://static.fdocuments.net/doc/165x107/60c5077d3fe9d8031256b3fd/gazing-into-the-early-dissemination-process-of-cutaneous-fractal-analysis.jpg)


