Fourth quarter presentation 2018 · presentation 2018. 14 February 2019 . Agenda • Highlights •...
28
Fourth quarter presentation 2018 14 February 2019
Transcript of Fourth quarter presentation 2018 · presentation 2018. 14 February 2019 . Agenda • Highlights •...
Fourth quarter presentation 201814 February 2019
Agenda
• Highlights
• Financials
• Operational review/Strategy
• Prospects and Market update
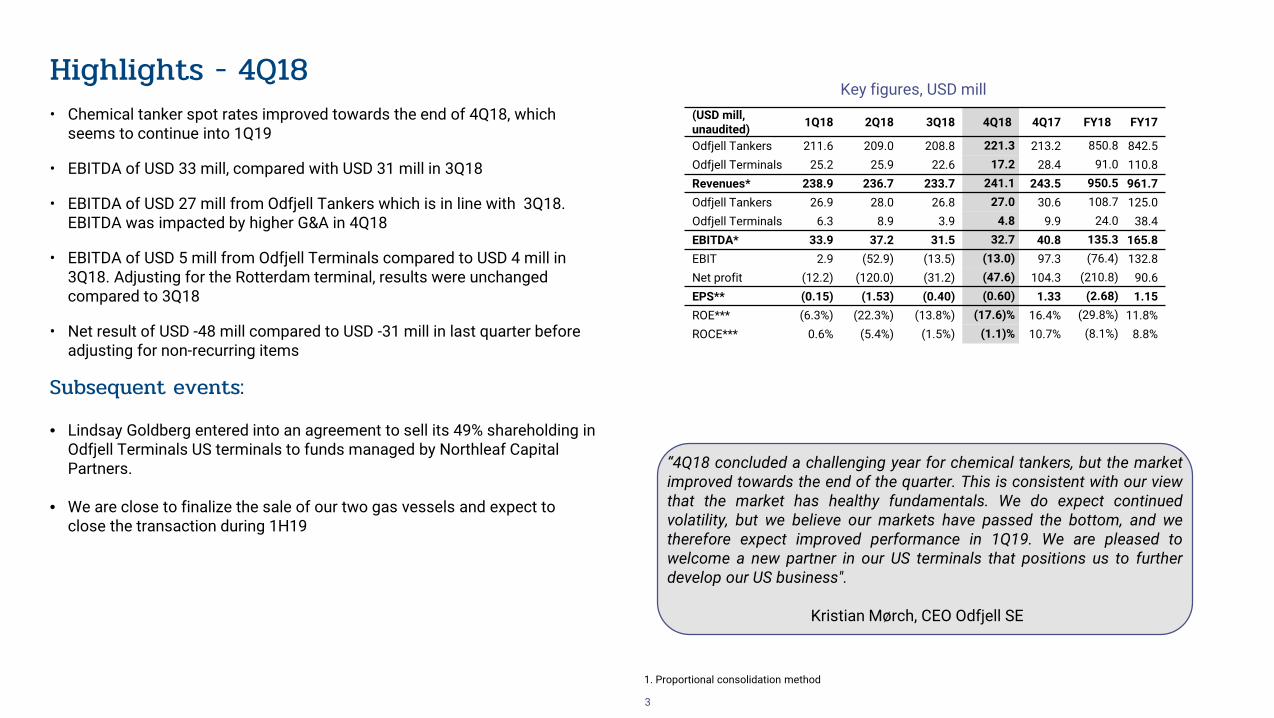
• Chemical tanker spot rates improved towards the end of 4Q18, which seems to continue into 1Q19
• EBITDA of USD 33 mill, compared with USD 31 mill in 3Q18
• EBITDA of USD 27 mill from Odfjell Tankers which is in line with 3Q18. EBITDA was impacted by higher G&A in 4Q18
• EBITDA of USD 5 mill from Odfjell Terminals compared to USD 4 mill in 3Q18. Adjusting for the Rotterdam terminal, results were unchanged compared to 3Q18
• Net result of USD -48 mill compared to USD -31 mill in last quarter before adjusting for non-recurring items
Subsequent events:
• Lindsay Goldberg entered into an agreement to sell its 49% shareholding in Odfjell Terminals US terminals to funds managed by Northleaf Capital Partners.
• We are close to finalize the sale of our two gas vessels and expect to close the transaction during 1H19
Highlights - 4Q18
“4Q18 concluded a challenging year for chemical tankers, but the marketimproved towards the end of the quarter. This is consistent with our viewthat the market has healthy fundamentals. We do expect continuedvolatility, but we believe our markets have passed the bottom, and wetherefore expect improved performance in 1Q19. We are pleased towelcome a new partner in our US terminals that positions us to furtherdevelop our US business".
Kristian Mørch, CEO Odfjell SE
Key figures, USD mill
3
1. Proportional consolidation method
(USD mill, unaudited) 1Q18 2Q18 3Q18 4Q18 4Q17 FY18 FY17
Odfjell Tankers 211.6 209.0 208.8 221.3 213.2 850.8 842.5Odfjell Terminals 25.2 25.9 22.6 17.2 28.4 91.0 110.8Revenues* 238.9 236.7 233.7 241.1 243.5 950.5 961.7Odfjell Tankers 26.9 28.0 26.8 27.0 30.6 108.7 125.0Odfjell Terminals 6.3 8.9 3.9 4.8 9.9 24.0 38.4EBITDA* 33.9 37.2 31.5 32.7 40.8 135.3 165.8EBIT 2.9 (52.9) (13.5) (13.0) 97.3 (76.4) 132.8Net profit (12.2) (120.0) (31.2) (47.6) 104.3 (210.8) 90.6EPS** (0.15) (1.53) (0.40) (0.60) 1.33 (2.68) 1.15ROE*** (6.3%) (22.3%) (13.8%) (17.6)% 16.4% (29.8%) 11.8%ROCE*** 0.6% (5.4%) (1.5%) (1.1)% 10.7% (8.1%) 8.8%
Highlights - FY 2018
4
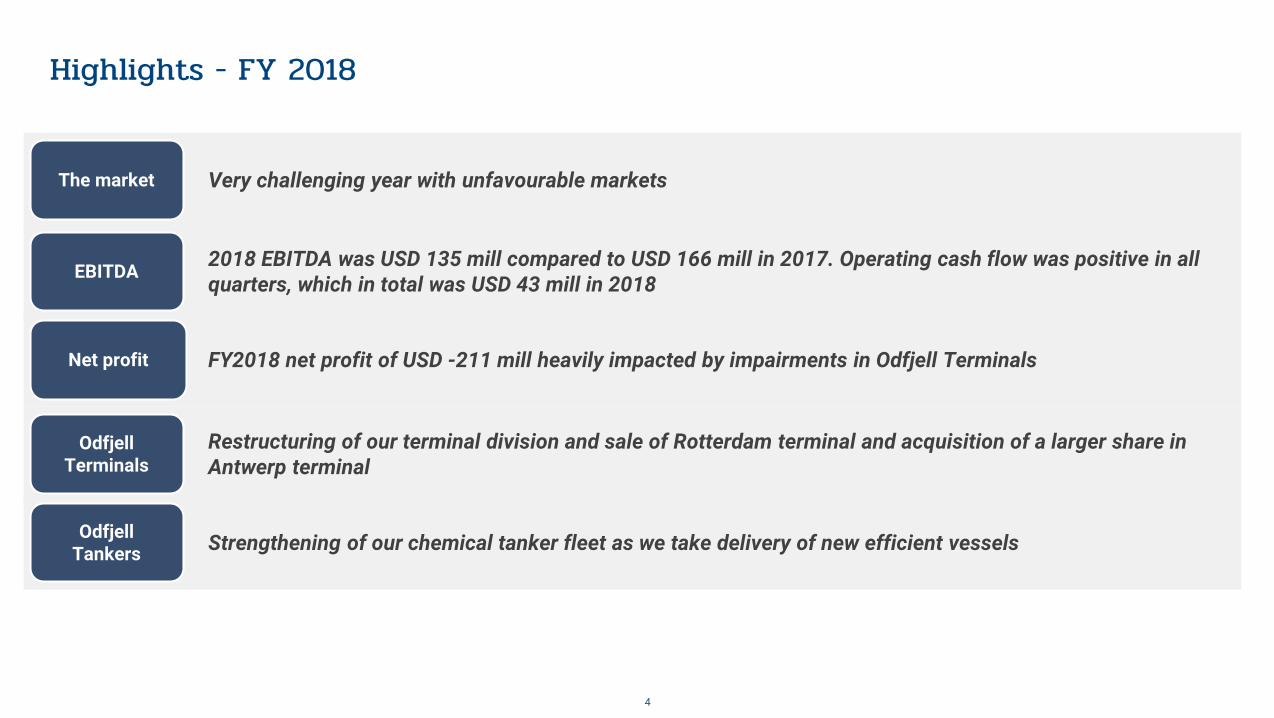
2018 EBITDA was USD 135 mill compared to USD 166 mill in 2017. Operating cash flow was positive in all quarters, which in total was USD 43 mill in 2018EBITDA
FY2018 net profit of USD -211 mill heavily impacted by impairments in Odfjell TerminalsNet profit
Strengthening of our chemical tanker fleet as we take delivery of new efficient vesselsOdfjell Tankers
Very challenging year with unfavourable marketsThe market
Restructuring of our terminal division and sale of Rotterdam terminal and acquisition of a larger share in Antwerp terminal
Odfjell Terminals
Agenda
• Highlights
• Financials
• Operational review/Strategy
• Prospects and Market update
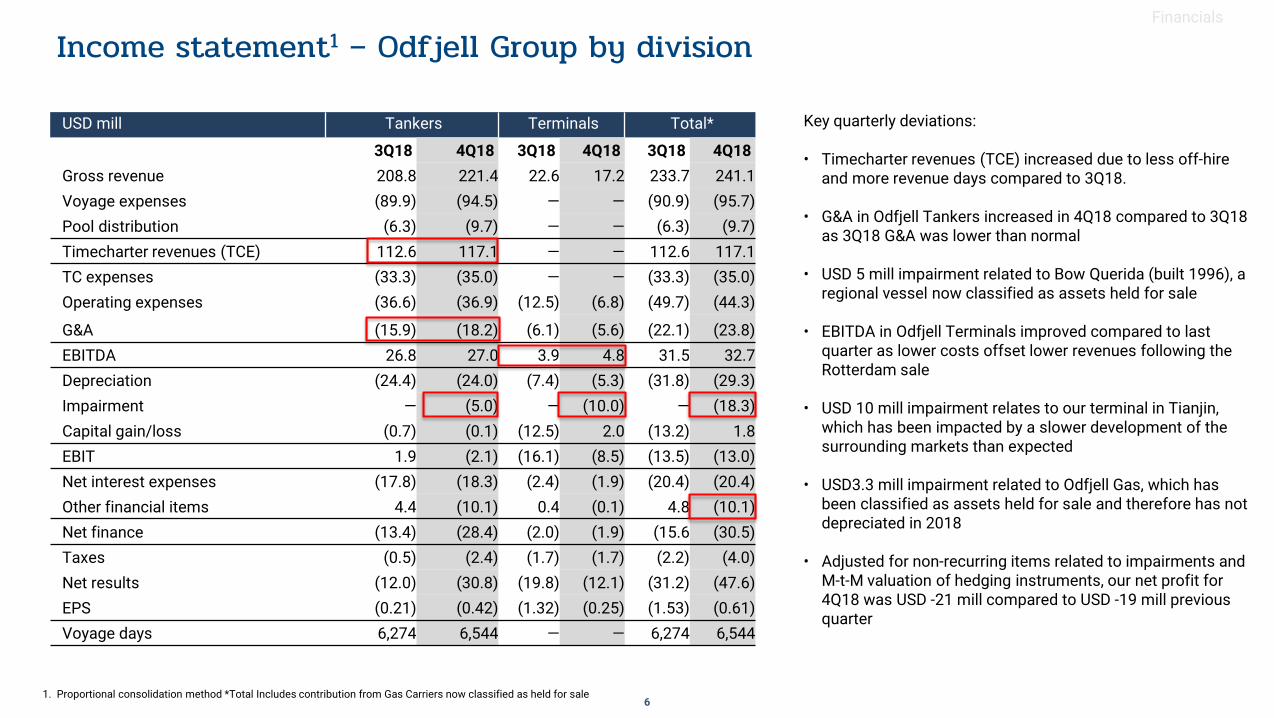
Key quarterly deviations:
• Timecharter revenues (TCE) increased due to less off-hire and more revenue days compared to 3Q18.
• G&A in Odfjell Tankers increased in 4Q18 compared to 3Q18 as 3Q18 G&A was lower than normal
• USD 5 mill impairment related to Bow Querida (built 1996), a regional vessel now classified as assets held for sale
• EBITDA in Odfjell Terminals improved compared to last quarter as lower costs offset lower revenues following the Rotterdam sale
• USD 10 mill impairment relates to our terminal in Tianjin, which has been impacted by a slower development of the surrounding markets than expected
• USD3.3 mill impairment related to Odfjell Gas, which has been classified as assets held for sale and therefore has not depreciated in 2018
• Adjusted for non-recurring items related to impairments and M-t-M valuation of hedging instruments, our net profit for 4Q18 was USD -21 mill compared to USD -19 mill previous quarter
USD mill Tankers Terminals Total*
3Q18 4Q18 3Q18 4Q18 3Q18 4Q18Gross revenue 208.8 221.4 22.6 17.2 233.7 241.1Voyage expenses (89.9) (94.5) — — (90.9) (95.7)Pool distribution (6.3) (9.7) — — (6.3) (9.7)Timecharter revenues (TCE) 112.6 117.1 — — 112.6 117.1TC expenses (33.3) (35.0) — — (33.3) (35.0)Operating expenses (36.6) (36.9) (12.5) (6.8) (49.7) (44.3)
G&A (15.9) (18.2) (6.1) (5.6) (22.1) (23.8)EBITDA 26.8 27.0 3.9 4.8 31.5 32.7Depreciation (24.4) (24.0) (7.4) (5.3) (31.8) (29.3)Impairment — (5.0) — (10.0) — (18.3)Capital gain/loss (0.7) (0.1) (12.5) 2.0 (13.2) 1.8EBIT 1.9 (2.1) (16.1) (8.5) (13.5) (13.0)Net interest expenses (17.8) (18.3) (2.4) (1.9) (20.4) (20.4)Other financial items 4.4 (10.1) 0.4 (0.1) 4.8 (10.1)Net finance (13.4) (28.4) (2.0) (1.9) (15.6 (30.5)Taxes (0.5) (2.4) (1.7) (1.7) (2.2) (4.0)Net results (12.0) (30.8) (19.8) (12.1) (31.2) (47.6)EPS (0.21) (0.42) (1.32) (0.25) (1.53) (0.61)Voyage days 6,274 6,544 — — 6,274 6,544
Income statement1 – Odfjell Group by division Financials
61. Proportional consolidation method *Total Includes contribution from Gas Carriers now classified as held for sale
Financials
7
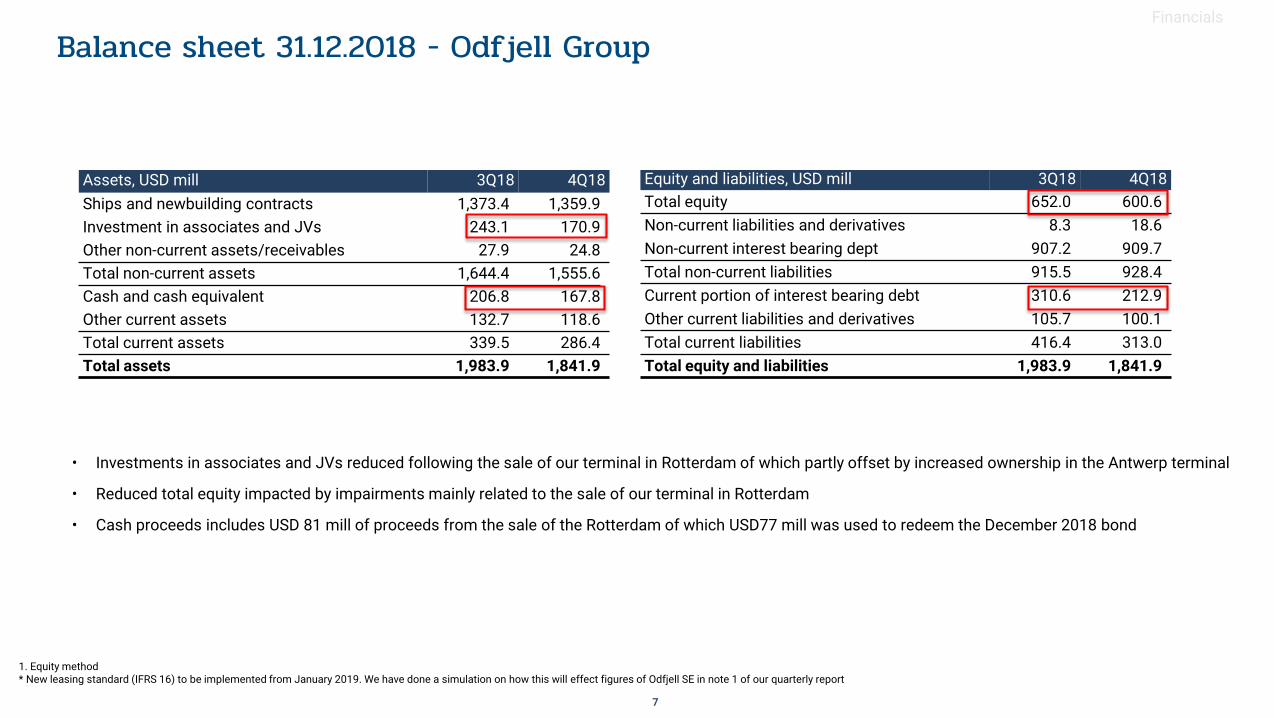
Assets, USD mill 3Q18 4Q18Ships and newbuilding contracts 1,373.4 1,359.9Investment in associates and JVs 243.1 170.9Other non-current assets/receivables 27.9 24.8Total non-current assets 1,644.4 1,555.6Cash and cash equivalent 206.8 167.8Other current assets 132.7 118.6Total current assets 339.5 286.4Total assets 1,983.9 1,841.9
Equity and liabilities, USD mill 3Q18 4Q18Total equity 652.0 600.6Non-current liabilities and derivatives 8.3 18.6Non-current interest bearing dept 907.2 909.7Total non-current liabilities 915.5 928.4Current portion of interest bearing debt 310.6 212.9Other current liabilities and derivatives 105.7 100.1Total current liabilities 416.4 313.0Total equity and liabilities 1,983.9 1,841.9
• Investments in associates and JVs reduced following the sale of our terminal in Rotterdam of which partly offset by increased ownership in the Antwerp terminal
• Reduced total equity impacted by impairments mainly related to the sale of our terminal in Rotterdam
• Cash proceeds includes USD 81 mill of proceeds from the sale of the Rotterdam of which USD77 mill was used to redeem the December 2018 bond
1. Equity method* New leasing standard (IFRS 16) to be implemented from January 2019. We have done a simulation on how this will effect figures of Odfjell SE in note 1 of our quarterly report
Balance sheet 31.12.2018 - Odfjell Group
Financials
8
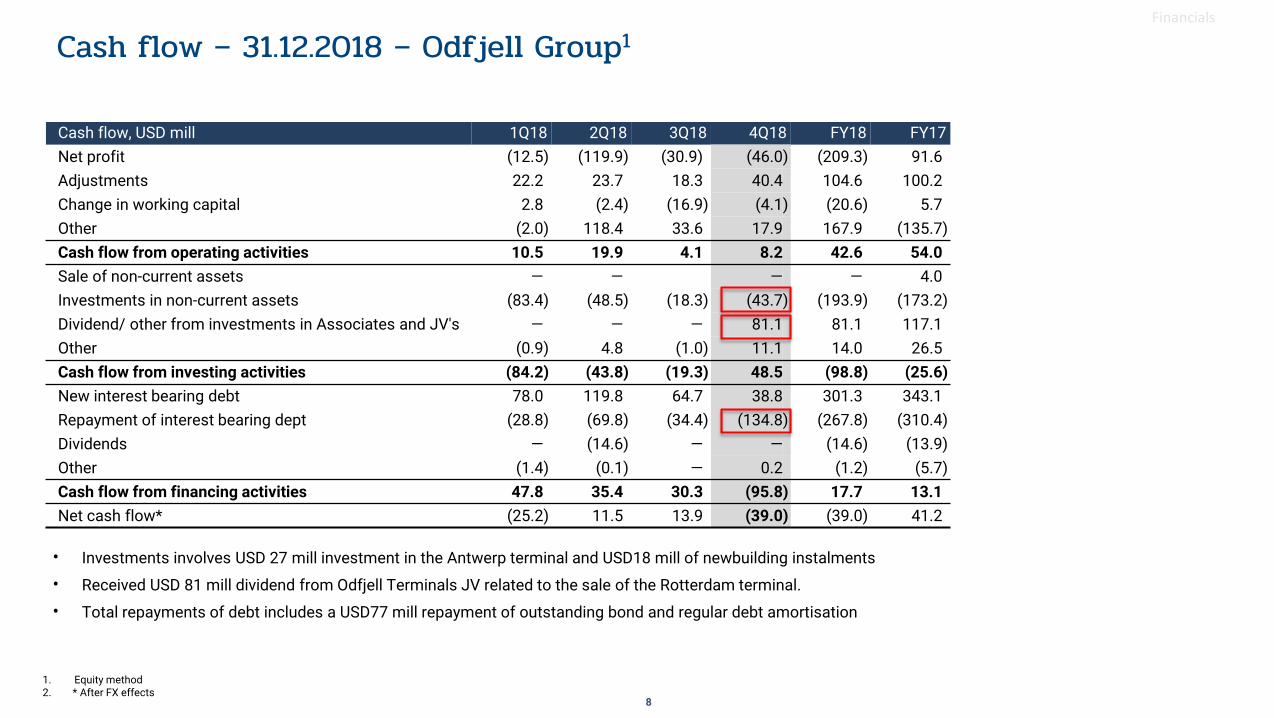
Cash flow, USD mill 1Q18 2Q18 3Q18 4Q18 FY18 FY17Net profit (12.5) (119.9) (30.9) (46.0) (209.3) 91.6Adjustments 22.2 23.7 18.3 40.4 104.6 100.2Change in working capital 2.8 (2.4) (16.9) (4.1) (20.6) 5.7Other (2.0) 118.4 33.6 17.9 167.9 (135.7)Cash flow from operating activities 10.5 19.9 4.1 8.2 42.6 54.0Sale of non-current assets — — — — 4.0Investments in non-current assets (83.4) (48.5) (18.3) (43.7) (193.9) (173.2)Dividend/ other from investments in Associates and JV's — — — 81.1 81.1 117.1Other (0.9) 4.8 (1.0) 11.1 14.0 26.5Cash flow from investing activities (84.2) (43.8) (19.3) 48.5 (98.8) (25.6)New interest bearing debt 78.0 119.8 64.7 38.8 301.3 343.1Repayment of interest bearing dept (28.8) (69.8) (34.4) (134.8) (267.8) (310.4)Dividends — (14.6) — — (14.6) (13.9)Other (1.4) (0.1) — 0.2 (1.2) (5.7)Cash flow from financing activities 47.8 35.4 30.3 (95.8) 17.7 13.1Net cash flow* (25.2) 11.5 13.9 (39.0) (39.0) 41.2
• Investments involves USD 27 mill investment in the Antwerp terminal and USD18 mill of newbuilding instalments
• Received USD 81 mill dividend from Odfjell Terminals JV related to the sale of the Rotterdam terminal.
• Total repayments of debt includes a USD77 mill repayment of outstanding bond and regular debt amortisation
1. Equity method2. * After FX effects
Cash flow – 31.12.2018 – Odfjell Group1
9
Financials
USD mill1Q18
IFRS 162Q18
IFRS 163Q18
IFRS 164Q18
IFRS 164Q18
reportedFY2018 IFRS 16
FY2018 reported
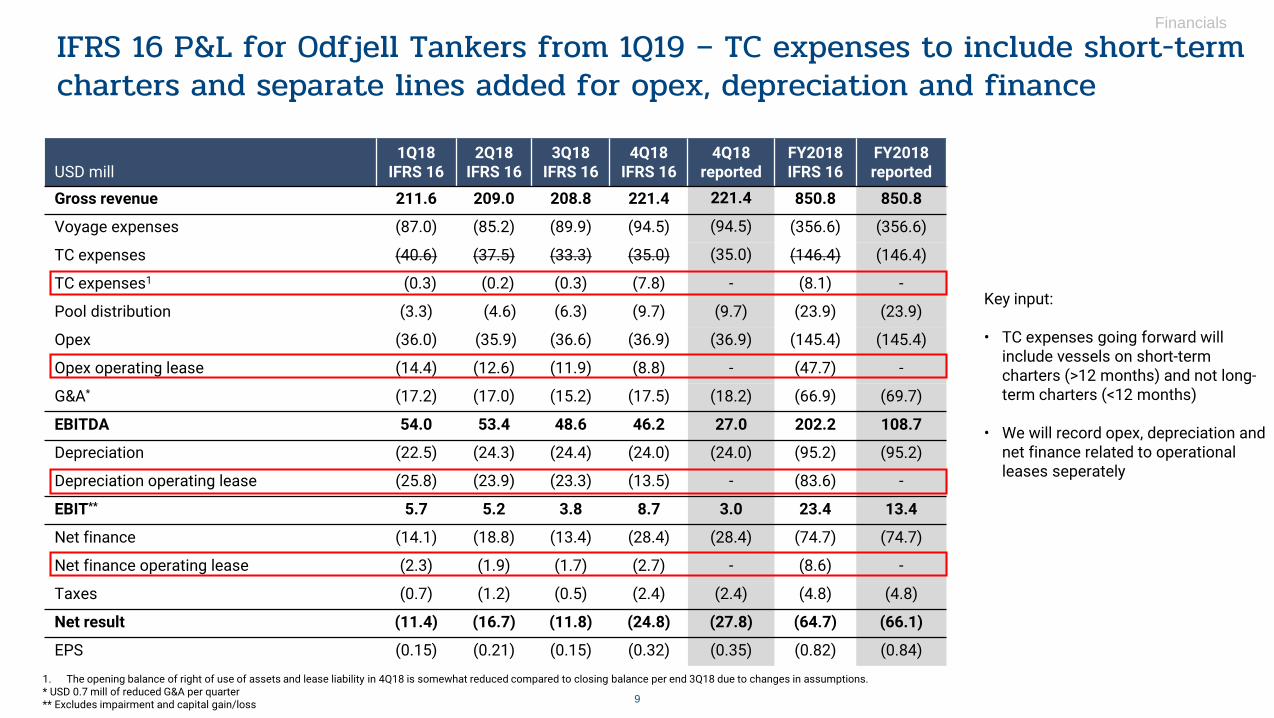
Gross revenue 211.6 209.0 208.8 221.4 221.4 850.8 850.8
Voyage expenses (87.0) (85.2) (89.9) (94.5) (94.5) (356.6) (356.6)
TC expenses (40.6) (37.5) (33.3) (35.0) (35.0) (146.4) (146.4)
TC expenses1 (0.3) (0.2) (0.3) (7.8) - (8.1) -
Pool distribution (3.3) (4.6) (6.3) (9.7) (9.7) (23.9) (23.9)
Opex (36.0) (35.9) (36.6) (36.9) (36.9) (145.4) (145.4)
Opex operating lease (14.4) (12.6) (11.9) (8.8) - (47.7) -
G&A* (17.2) (17.0) (15.2) (17.5) (18.2) (66.9) (69.7)
EBITDA 54.0 53.4 48.6 46.2 27.0 202.2 108.7
Depreciation (22.5) (24.3) (24.4) (24.0) (24.0) (95.2) (95.2)
Depreciation operating lease (25.8) (23.9) (23.3) (13.5) - (83.6) -
EBIT** 5.7 5.2 3.8 8.7 3.0 23.4 13.4
Net finance (14.1) (18.8) (13.4) (28.4) (28.4) (74.7) (74.7)
Net finance operating lease (2.3) (1.9) (1.7) (2.7) - (8.6) -
Taxes (0.7) (1.2) (0.5) (2.4) (2.4) (4.8) (4.8)
Net result (11.4) (16.7) (11.8) (24.8) (27.8) (64.7) (66.1)
EPS (0.15) (0.21) (0.15) (0.32) (0.35) (0.82) (0.84)
1. The opening balance of right of use of assets and lease liability in 4Q18 is somewhat reduced compared to closing balance per end 3Q18 due to changes in assumptions.* USD 0.7 mill of reduced G&A per quarter ** Excludes impairment and capital gain/loss
Key input:
• TC expenses going forward willinclude vessels on short-term charters (>12 months) and not long-term charters (<12 months)
• We will record opex, depreciation and net finance related to operationalleases seperately
IFRS 16 P&L for Odfjell Tankers from 1Q19 – TC expenses to include short-term charters and separate lines added for opex, depreciation and finance
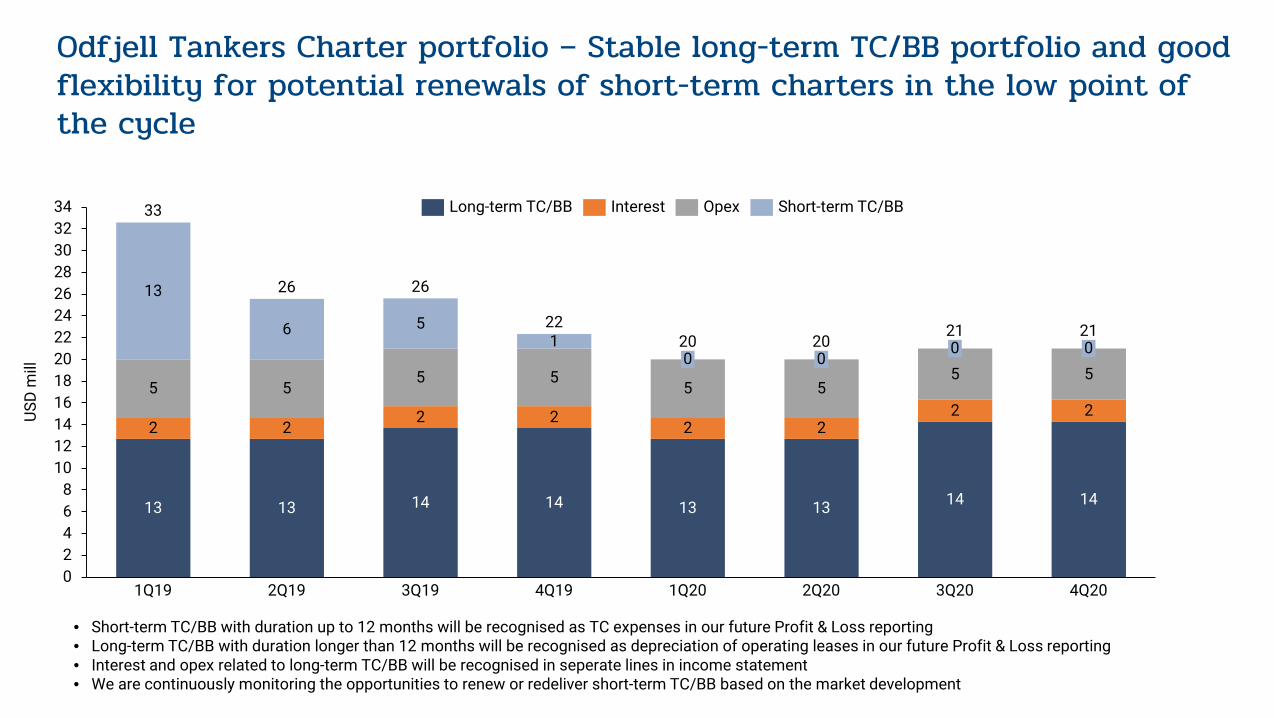
Odfjell Tankers Charter portfolio – Stable long-term TC/BB portfolio and good flexibility for potential renewals of short-term charters in the low point of the cycle
• Short-term TC/BB with duration up to 12 months will be recognised as TC expenses in our future Profit & Loss reporting• Long-term TC/BB with duration longer than 12 months will be recognised as depreciation of operating leases in our future Profit & Loss reporting• Interest and opex related to long-term TC/BB will be recognised in seperate lines in income statement• We are continuously monitoring the opportunities to renew or redeliver short-term TC/BB based on the market development
13 13 14 14 13 13 14 14
2 22 2
2 22 2
5 55 5
5 55 5
13
6 51
02468
10121416182022242628303234
22
4Q19
00
USD
mill
1Q19 2Q19
020
3Q19 1Q20 2Q20 3Q20
020
4Q20
33
26 26
21 21
Long-term TC/BB Interest Opex Short-term TC/BB
11
Financials
1. Equity method
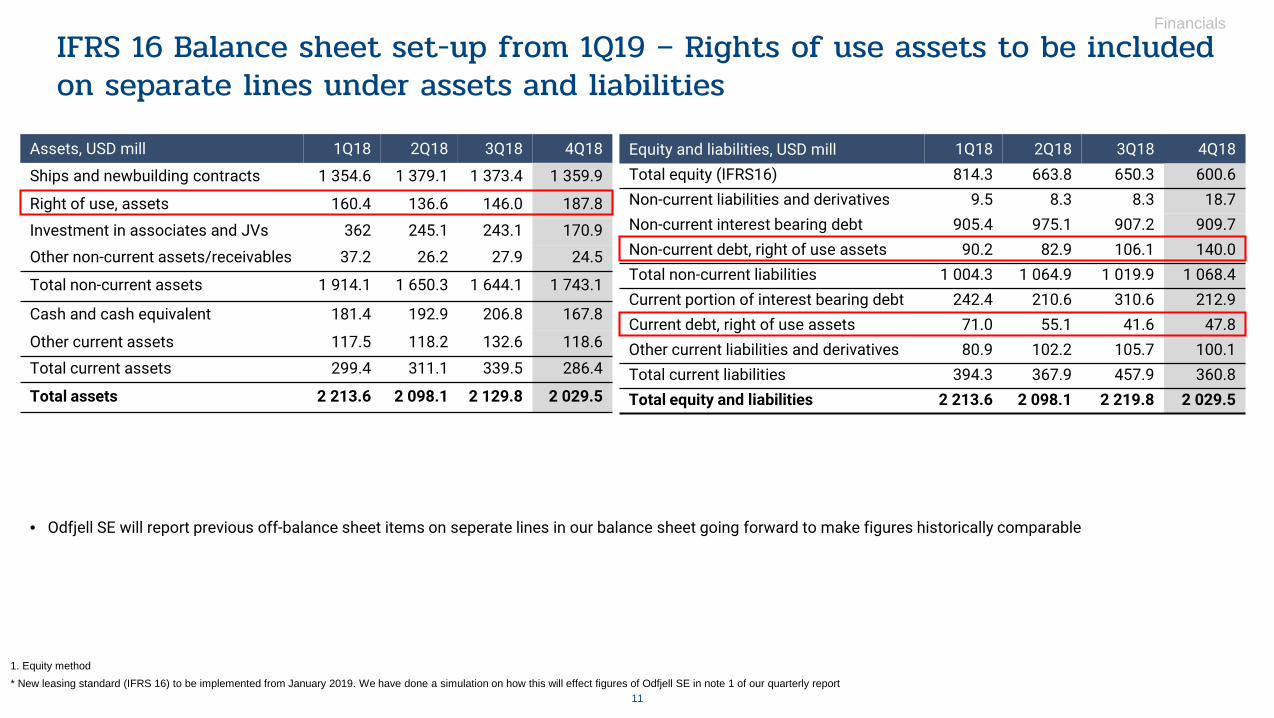
Assets, USD mill 1Q18 2Q18 3Q18 4Q18
Ships and newbuilding contracts 1 354.6 1 379.1 1 373.4 1 359.9
Right of use, assets 160.4 136.6 146.0 187.8
Investment in associates and JVs 362 245.1 243.1 170.9
Other non-current assets/receivables 37.2 26.2 27.9 24.5
Total non-current assets 1 914.1 1 650.3 1 644.1 1 743.1
Cash and cash equivalent 181.4 192.9 206.8 167.8
Other current assets 117.5 118.2 132.6 118.6Total current assets 299.4 311.1 339.5 286.4
Total assets 2 213.6 2 098.1 2 129.8 2 029.5
Equity and liabilities, USD mill 1Q18 2Q18 3Q18 4Q18Total equity (IFRS16) 814.3 663.8 650.3 600.6Non-current liabilities and derivatives 9.5 8.3 8.3 18.7Non-current interest bearing debt 905.4 975.1 907.2 909.7Non-current debt, right of use assets 90.2 82.9 106.1 140.0Total non-current liabilities 1 004.3 1 064.9 1 019.9 1 068.4Current portion of interest bearing debt 242.4 210.6 310.6 212.9Current debt, right of use assets 71.0 55.1 41.6 47.8Other current liabilities and derivatives 80.9 102.2 105.7 100.1Total current liabilities 394.3 367.9 457.9 360.8Total equity and liabilities 2 213.6 2 098.1 2 219.8 2 029.5
* New leasing standard (IFRS 16) to be implemented from January 2019. We have done a simulation on how this will effect figures of Odfjell SE in note 1 of our quarterly report
• Odfjell SE will report previous off-balance sheet items on seperate lines in our balance sheet going forward to make figures historically comparable
IFRS 16 Balance sheet set-up from 1Q19 – Rights of use assets to be included on separate lines under assets and liabilities
12
Financials
1. Equity method2. Adjusted for non-recurring items3. Based on FY 2018 reported figures
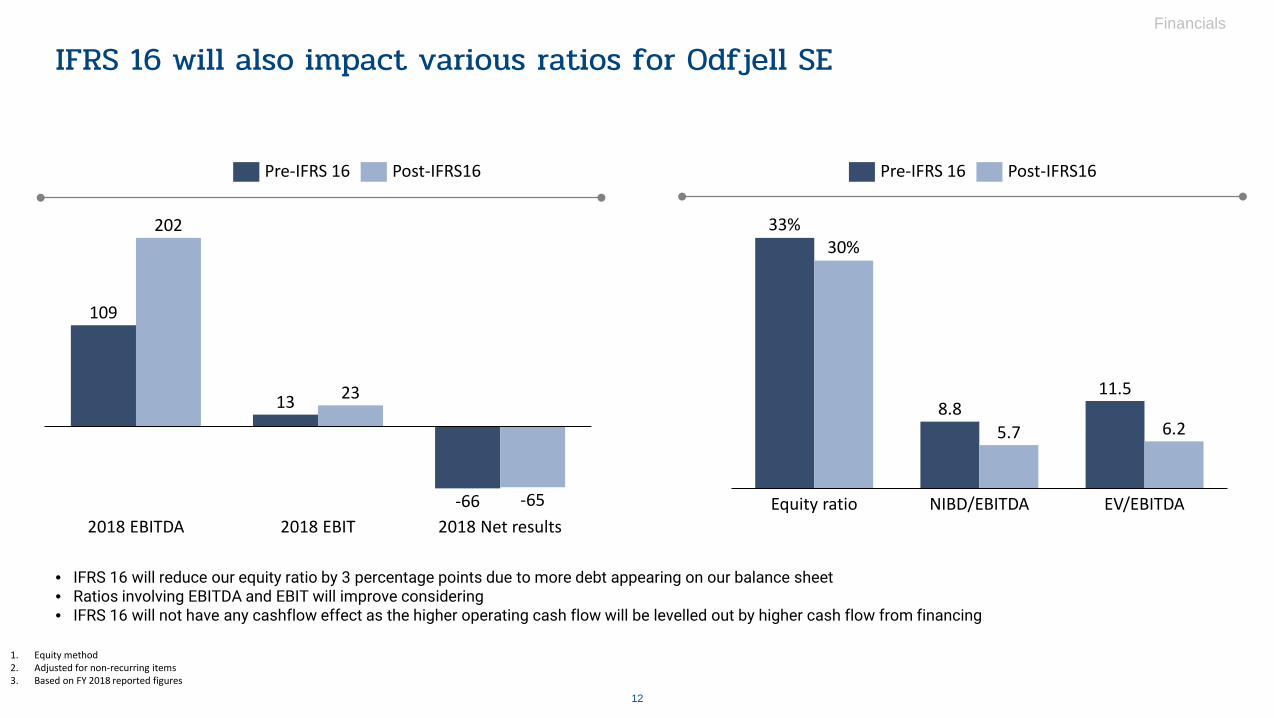
IFRS 16 will also impact various ratios for Odfjell SE
109
13
-66
202
23
-652018 Net results2018 EBIT2018 EBITDA
8.811.5
5.7 6.2
EV/EBITDAEquity ratio
30%
NIBD/EBITDA
33%
Post-IFRS16Pre-IFRS 16Pre-IFRS 16 Post-IFRS16
• IFRS 16 will reduce our equity ratio by 3 percentage points due to more debt appearing on our balance sheet• Ratios involving EBITDA and EBIT will improve considering • IFRS 16 will not have any cashflow effect as the higher operating cash flow will be levelled out by higher cash flow from financing
13
Financials
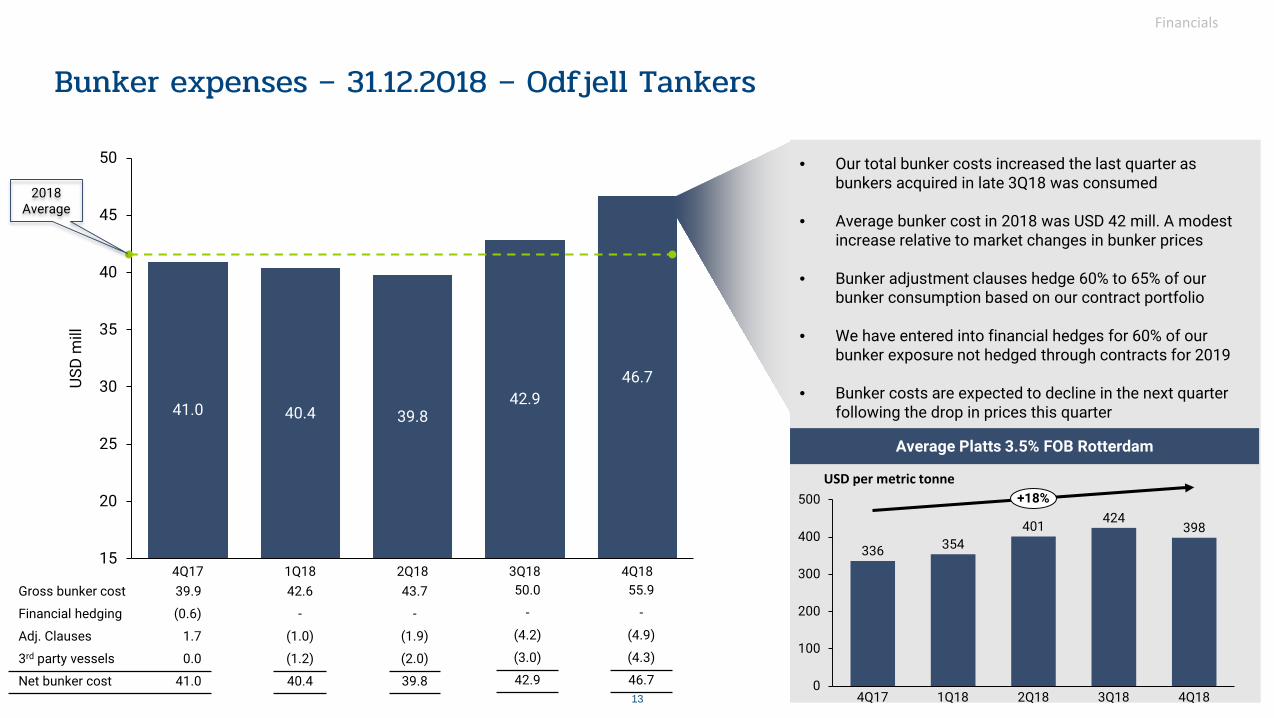
Bunker expenses – 31.12.2018 – Odfjell Tankers
USD per metric tonne
41.0 40.4 39.842.9
46.7
15
20
25
30
35
40
45
50
USD
mill
1Q184Q17 2Q18 3Q18 4Q18336 354
401 424398
0
100
200
300
400
500
4Q184Q17 2Q181Q18 3Q18
+18%
Average Platts 3.5% FOB Rotterdam
Gross bunker cost 39.9
Financial hedging (0.6)
Adj. Clauses 1.7
3rd party vessels 0.0
Net bunker cost 41.0
42.6
-
(1.0)
(1.2)
40.4
43.7
-
(1.9)
(2.0)
39.8
50.0
-
(4.2)
(3.0)
42.9
55.9
-
(4.9)
(4.3)
46.7
• Our total bunker costs increased the last quarter as bunkers acquired in late 3Q18 was consumed
• Average bunker cost in 2018 was USD 42 mill. A modest increase relative to market changes in bunker prices
• Bunker adjustment clauses hedge 60% to 65% of our bunker consumption based on our contract portfolio
• We have entered into financial hedges for 60% of ourbunker exposure not hedged through contracts for 2019
• Bunker costs are expected to decline in the next quarter following the drop in prices this quarter
2018 Average
14
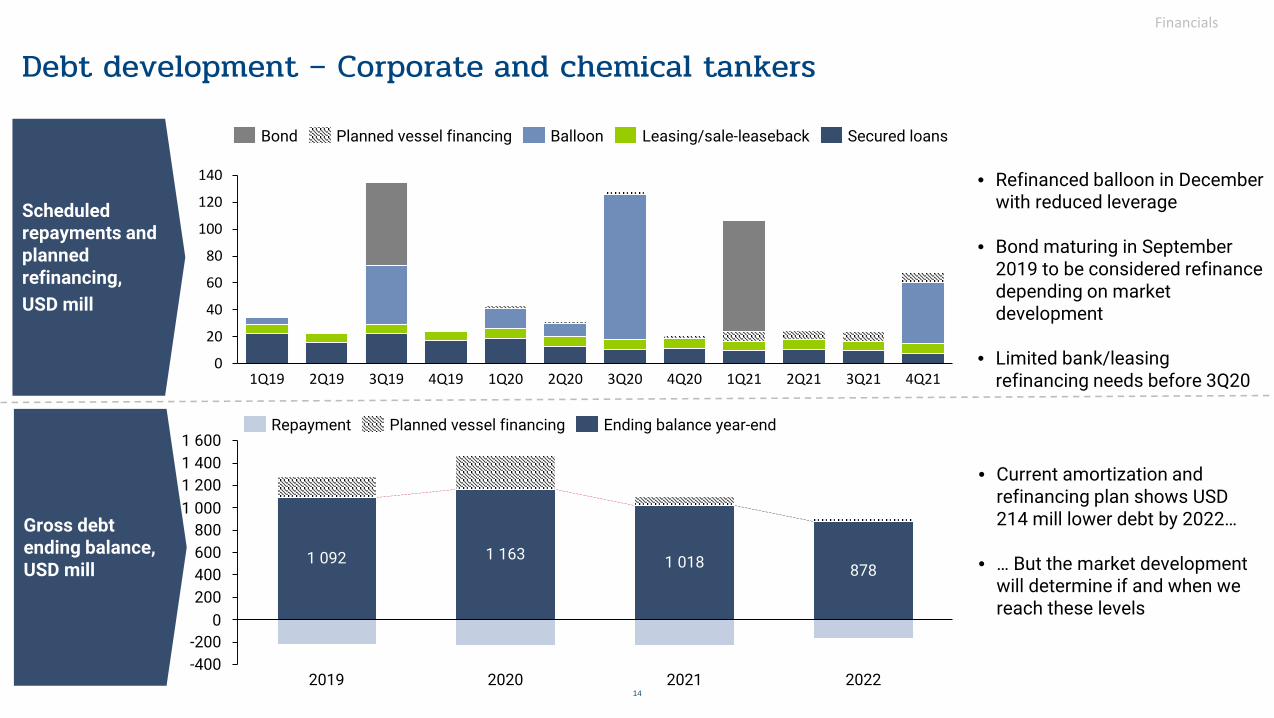
Debt development – Corporate and chemical tankersFinancials
Scheduled repayments and planned refinancing, USD mill
Gross debt ending balance, USD mill
• Refinanced balloon in December with reduced leverage
• Bond maturing in September 2019 to be considered refinance depending on market development
• Limited bank/leasing refinancing needs before 3Q20
878400
-200-400
1 200
0200
600800
1 000
1 4001 600
2019 2020 2021 2022
1 092 1 163 1 018
Planned vessel financingRepayment Ending balance year-end
0
20
40
60
80
100
120
140
4Q203Q202Q201Q19 1Q202Q19 3Q19 4Q19 1Q21 2Q21 4Q213Q21
Secured loansBond BalloonPlanned vessel financing Leasing/sale-leaseback
• Current amortization and refinancing plan shows USD 214 mill lower debt by 2022…
• … But the market development will determine if and when we reach these levels
Financials
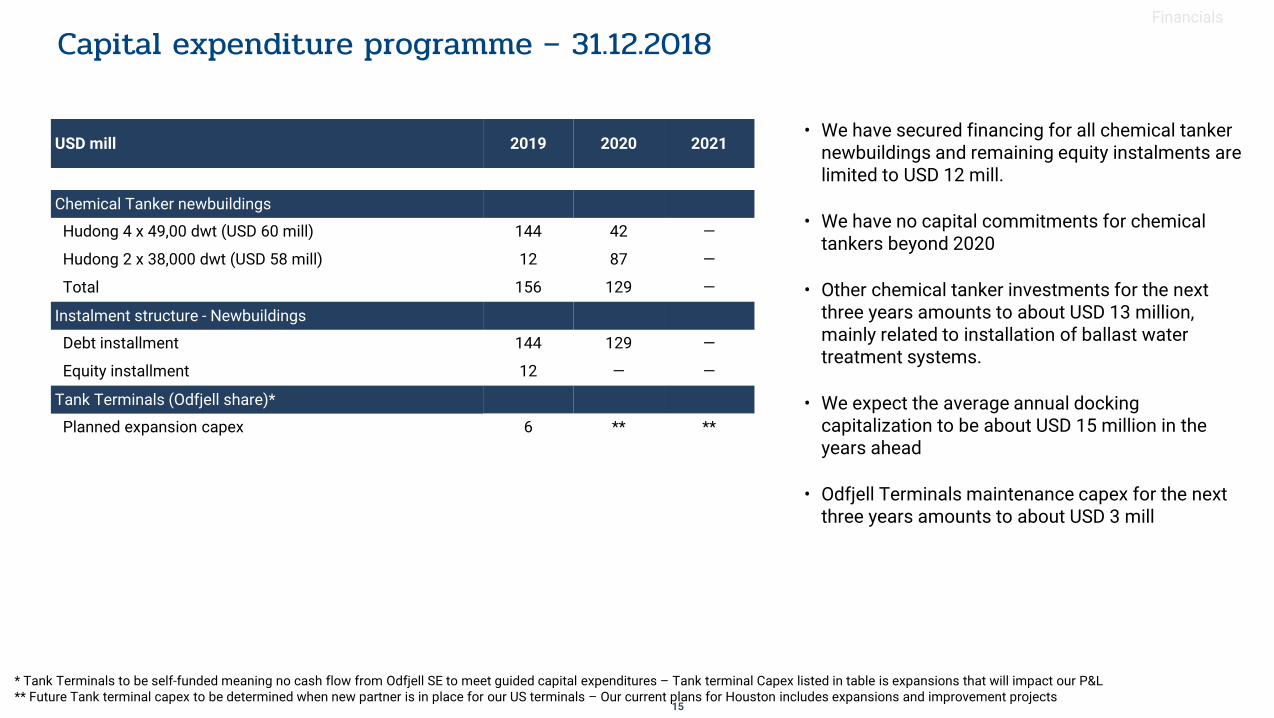
• We have secured financing for all chemical tanker newbuildings and remaining equity instalments are limited to USD 12 mill.
• We have no capital commitments for chemical tankers beyond 2020
• Other chemical tanker investments for the next three years amounts to about USD 13 million, mainly related to installation of ballast water treatment systems.
• We expect the average annual docking capitalization to be about USD 15 million in the years ahead
• Odfjell Terminals maintenance capex for the next three years amounts to about USD 3 mill
USD mill 2019 2020 2021
Chemical Tanker newbuildings
Hudong 4 x 49,00 dwt (USD 60 mill) 144 42 —
Hudong 2 x 38,000 dwt (USD 58 mill) 12 87 —
Total 156 129 —
Instalment structure - Newbuildings
Debt installment 144 129 —
Equity installment 12 — —
Tank Terminals (Odfjell share)*
Planned expansion capex 6 ** **
Capital expenditure programme – 31.12.2018
* Tank Terminals to be self-funded meaning no cash flow from Odfjell SE to meet guided capital expenditures – Tank terminal Capex listed in table is expansions that will impact our P&L** Future Tank terminal capex to be determined when new partner is in place for our US terminals – Our current plans for Houston includes expansions and improvement projects
15
Agenda
• Highlights
• Financials
• Operational review/Strategy
• Prospects and Market update
17
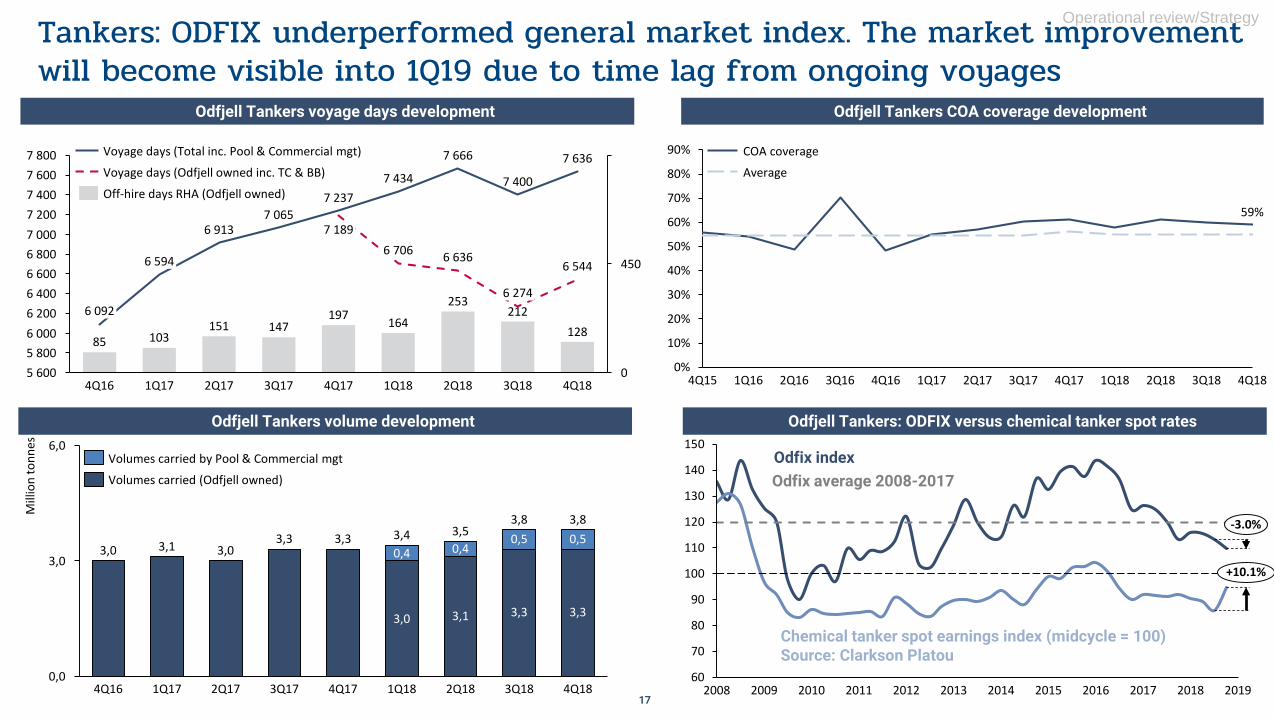
Tankers: ODFIX underperformed general market index. The market improvementwill become visible into 1Q19 due to time lag from ongoing voyages
Odfjell Tankers volume development
Odfjell Tankers voyage days development
Odfjell Tankers: ODFIX versus chemical tanker spot rates
Odfjell Tankers COA coverage development
60
70
80
90
100
110
120
130
140
150
201520132008 20142009 20112010 2012 2016 2017 2018 2019
-3.0%
+10.1%
Chemical tanker spot earnings index (midcycle = 100)Source: Clarkson Platou
Odfix indexOdfix average 2008-2017
6,0
0,0
3,0
3,3
Mill
ion
tonn
es
3,4
2Q184Q16
0,5
1Q181Q17
3,0
2Q17 4Q173Q17 3Q18 4Q18
3,53,8 3,8
3,0 3,1 3,3
3,0
0,4
3,1
0,4
3,3 3,3
0,5
Volumes carried by Pool & Commercial mgt
Volumes carried (Odfjell owned)
59%
0%
10%
20%
30%
40%
50%
60%
70%
80%
90%
1Q174Q15 2Q16 2Q171Q16 3Q16 4Q16 3Q17 4Q17 1Q18 2Q18 3Q18 4Q18
COA coverage
Average
85 103151 147
197 164
253212
128
6 8007 000
0
7 600
450
7 2007 400
6 400
5 6005 8006 000
7 800
6 200
6 6006 594
4Q16
7 636
7 237
6 092
1Q17 2Q17 3Q17
7 189
4Q17
7 400
6 706
1Q18 2Q18
6 274
6 913
3Q18
6 544
7 065
7 434
7 666
6 636
4Q18
Off-hire days RHA (Odfjell owned)
Voyage days (Total inc. Pool & Commercial mgt)
Voyage days (Odfjell owned inc. TC & BB)
Operational review/Strategy
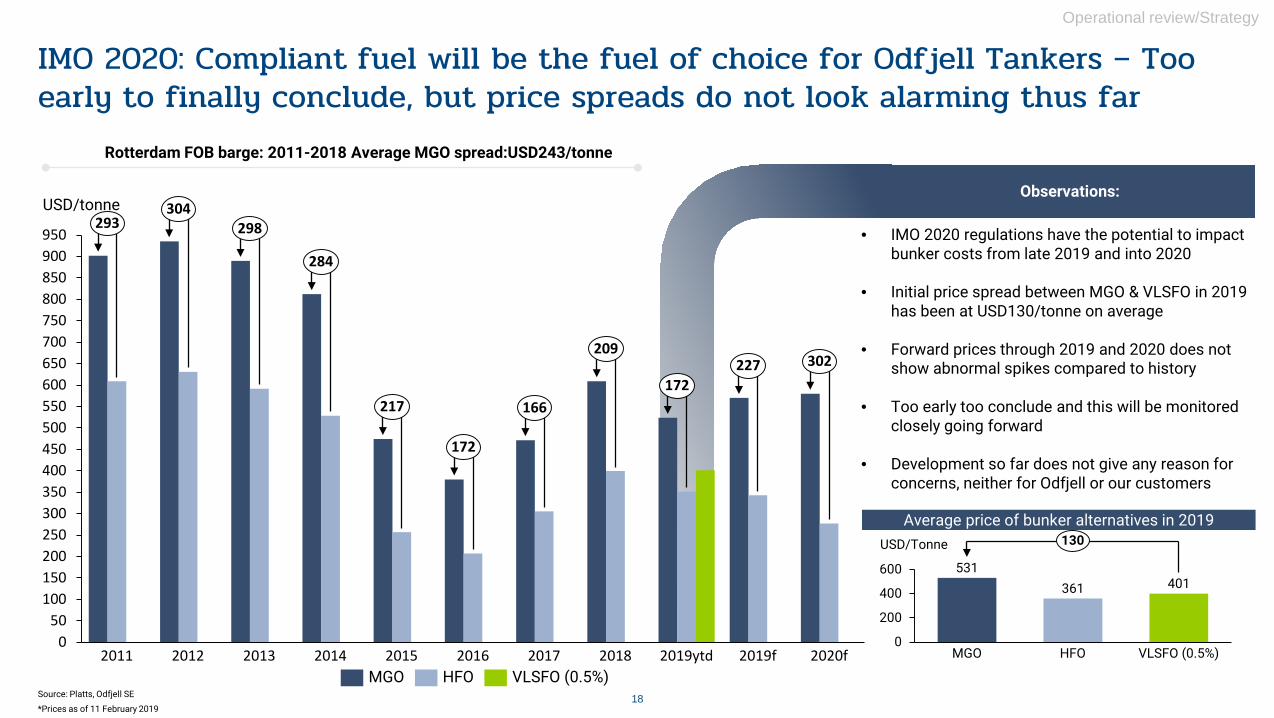
• IMO 2020 regulations have the potential to impact bunker costs from late 2019 and into 2020
• Initial price spread between MGO & VLSFO in 2019 has been at USD130/tonne on average
• Forward prices through 2019 and 2020 does not show abnormal spikes compared to history
• Too early too conclude and this will be monitored closely going forward
• Development so far does not give any reason for concerns, neither for Odfjell or our customers
IMO 2020: Compliant fuel will be the fuel of choice for Odfjell Tankers – Too early to finally conclude, but price spreads do not look alarming thus far
18
Operational review/Strategy
050
100150200250300350400450500550600650700750800850900950
2014 20172016
USD/tonne
2012 2020f2019f2019ytd2018201520132011
293304
298
284
217
172
166
209
172227 302
HFOMGO VLSFO (0.5%)
Rotterdam FOB barge: 2011-2018 Average MGO spread:USD243/tonne
Observations:
531361 401
0
200
400
600
USD/Tonne
VLSFO (0.5%)MGO HFO
130
Source: Platts, Odfjell SE
*Prices as of 11 February 2019
Average price of bunker alternatives in 2019
19
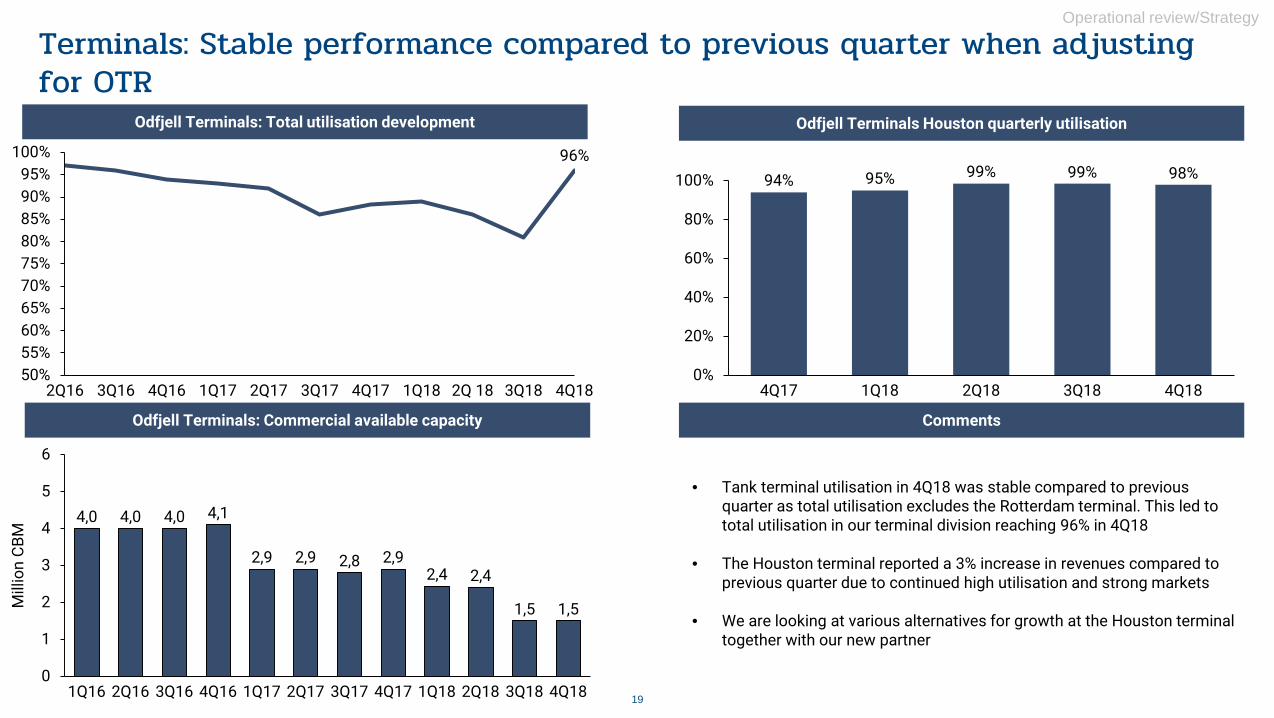
Terminals: Stable performance compared to previous quarter when adjusting for OTR
96%
50%55%60%65%70%75%80%85%90%95%
100%
2Q16 3Q16 1Q174Q16 3Q172Q17 4Q17 1Q18 2Q 18 3Q18 4Q18
0
1
2
3
4
5
6
3Q16 1Q18
Mill
ion
CBM
2Q161Q16 4Q16
4,0
1Q17 2Q17 3Q17 4Q17 2Q18 3Q18 4Q18
4,0 4,0 4,1
2,9 2,9 2,8 2,92,4 2,4
1,5 1,5
• Tank terminal utilisation in 4Q18 was stable compared to previous quarter as total utilisation excludes the Rotterdam terminal. This led to total utilisation in our terminal division reaching 96% in 4Q18
• The Houston terminal reported a 3% increase in revenues compared to previous quarter due to continued high utilisation and strong markets
• We are looking at various alternatives for growth at the Houston terminal together with our new partner
Odfjell Terminals: Total utilisation development Odfjell Terminals Houston quarterly utilisation
CommentsOdfjell Terminals: Commercial available capacity
Operational review/Strategy
94% 95% 99% 99% 98%
0%
20%
40%
60%
80%
100%
4Q17 4Q181Q18 3Q182Q18
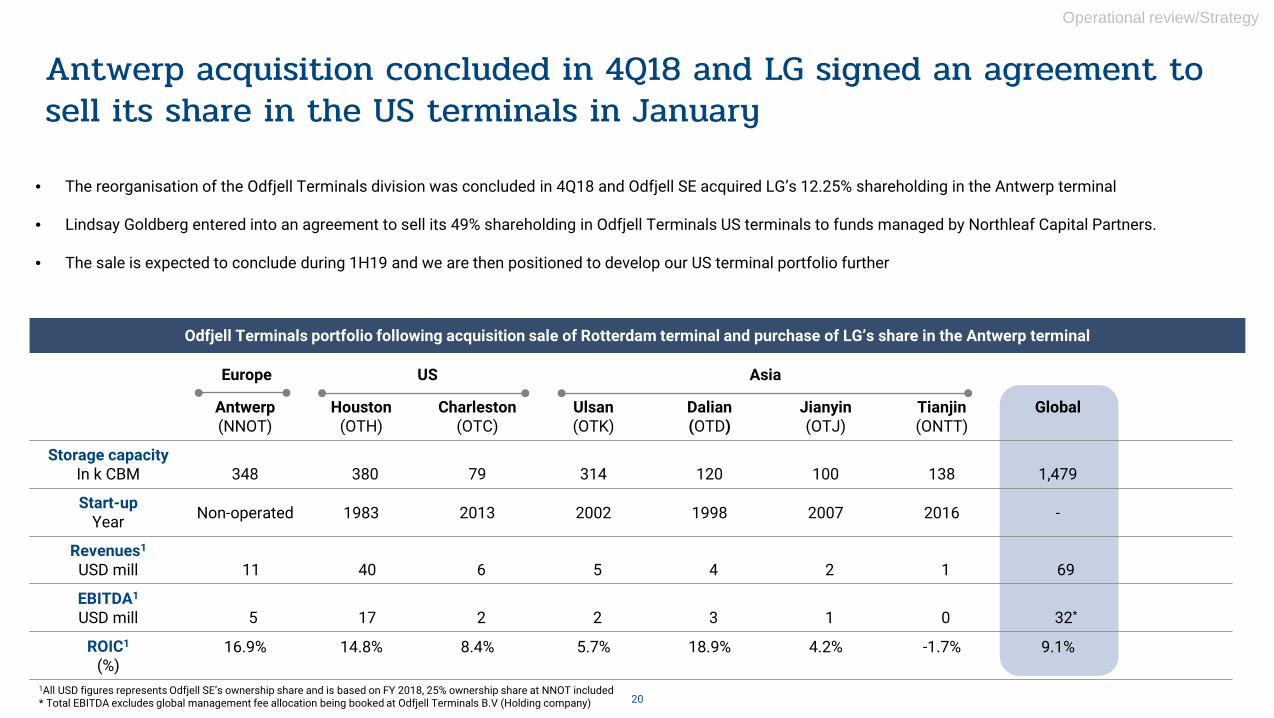
Antwerp acquisition concluded in 4Q18 and LG signed an agreement to sell its share in the US terminals in January
20
Antwerp(NNOT)
Houston(OTH)
Charleston(OTC)
Ulsan(OTK)
Dalian(OTD)
Jianyin(OTJ)
Tianjin(ONTT)
Global
Storage capacityIn k CBM 348 380 79 314 120 100 138 1,479
Start-upYear Non-operated 1983 2013 2002 1998 2007 2016 -
Revenues1
USD mill 11 40 6 5 4 2 1 69
EBITDA1
USD mill 5 17 2 2 3 1 0 32*
ROIC1
(%)16.9% 14.8% 8.4% 5.7% 18.9% 4.2% -1.7% 9.1%
Europe US Asia
Operational review/Strategy
1All USD figures represents Odfjell SE’s ownership share and is based on FY 2018, 25% ownership share at NNOT included* Total EBITDA excludes global management fee allocation being booked at Odfjell Terminals B.V (Holding company)
• The reorganisation of the Odfjell Terminals division was concluded in 4Q18 and Odfjell SE acquired LG’s 12.25% shareholding in the Antwerp terminal
• Lindsay Goldberg entered into an agreement to sell its 49% shareholding in Odfjell Terminals US terminals to funds managed by Northleaf Capital Partners.
• The sale is expected to conclude during 1H19 and we are then positioned to develop our US terminal portfolio further
Odfjell Terminals portfolio following acquisition sale of Rotterdam terminal and purchase of LG’s share in the Antwerp terminal
Agenda
• Highlights
• Financials
• Operational review/Strategy
• Prospects and Market update
22
0%
20%
40%
60%
80%
100%
jan-18
jan-16
jan-17
des-18
-0.7%Trading chemicals Trading CPP/Crude
2.5
3.0
3.5
4.0
4.5
5.0
3.03.54.04.55.05.56.06.5
jan-16
nov-18
jan-18
jan-17
CPP
Palm
Oil
Chem
ical
s
1
2
3
Fundamental drivers: Rate development:
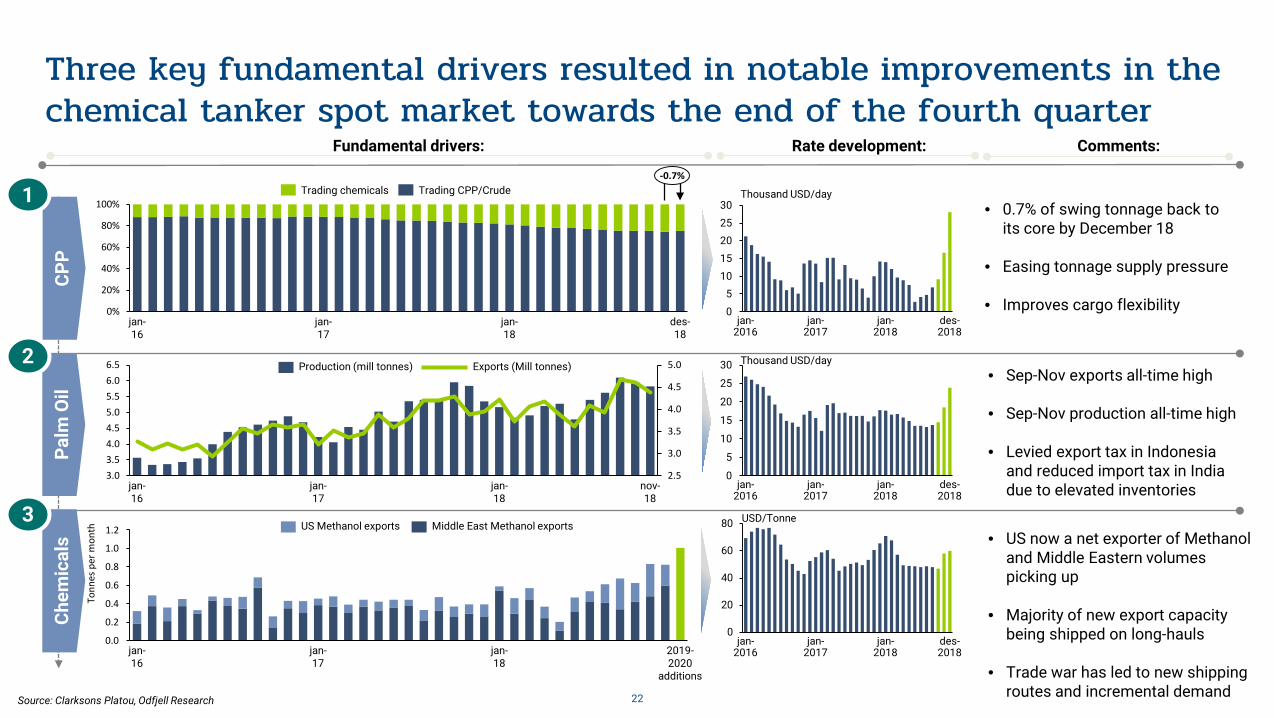
• 0.7% of swing tonnage back to its core by December 18
• Easing tonnage supply pressure
• Improves cargo flexibility
Comments:
• Sep-Nov exports all-time high
• Sep-Nov production all-time high
• Levied export tax in Indonesia and reduced import tax in India due to elevated inventories
• US now a net exporter of Methanol and Middle Eastern volumes picking up
• Majority of new export capacity being shipped on long-hauls
• Trade war has led to new shipping routes and incremental demand
Production (mill tonnes) Exports (Mill tonnes)
0
15
5
30
10
20
25
jan-2016
des-2018
jan-2017
jan-2018
0
20
40
60
80
jan-2016
jan-2017
jan-2018
des-2018
15
0
2520
5
30
10
jan-2018
jan-2016
jan-2017
des-2018
Thousand USD/day
Thousand USD/day
USD/Tonne
Source: Clarksons Platou, Odfjell Research
0.2
0.0
0.4
1.2
0.6
0.8
1.0
jan-16
Tonn
es p
er m
onth
jan-17
jan-18
2019-2020
additions
US Methanol exports Middle East Methanol exports
Three key fundamental drivers resulted in notable improvements in the chemical tanker spot market towards the end of the fourth quarter
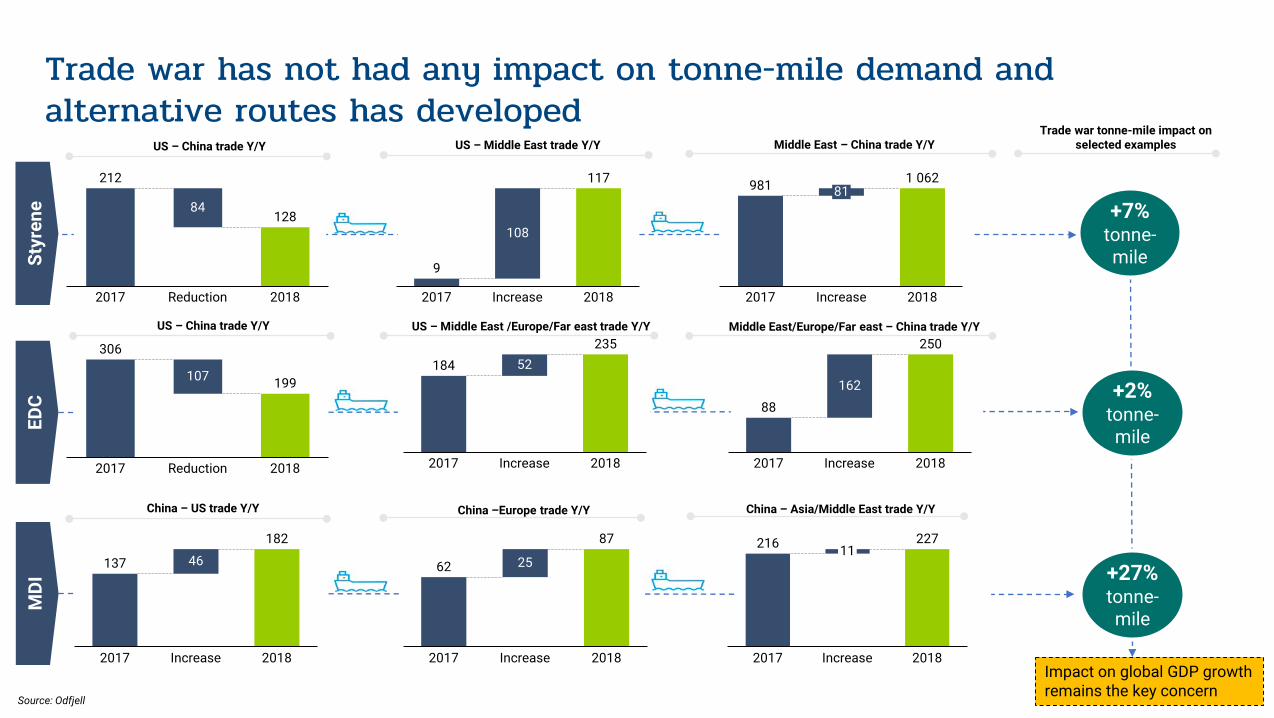
Source: Odfjell
Reduction
84
2017 2018
212
128
US – China trade Y/Y US – Middle East trade Y/Y
117
2017 Increase
108
2018
9
Middle East – China trade Y/Y
1 06281
2017 Increase 2018
981
Styr
ene
EDC
MDI
US – China trade Y/Y US – Middle East /Europe/Far east trade Y/Y235
184 52
2017 Increase 2018
Middle East/Europe/Far east – China trade Y/Y
2018
162
2017 Increase
88
250
+7%tonne-mile
+2%tonne-mile
Increase2017
25
2018
87
62
216 227
2017 2018
11
Increase
+27%tonne-mile
China – US trade Y/Y China –Europe trade Y/Y China – Asia/Middle East trade Y/Y
Impact on global GDP growthremains the key concern
20182017
107
Reduction
199
306
2017 2018
46
Increase
137
182
Trade war tonne-mile impact onselected examples
Trade war has not had any impact on tonne-mile demand and alternative routes has developed

Net fleet growth expected to decline the next couple of years and removal of swing tonnage could lead to negative overall fleet growth in our markets
Source: Clarksons Platou, Odfjell
• Newbuilding orders and interest remains low• 60% of orders the last two years has been for vessels above 50,000 dwt,
below 18,000 dwt or is considered replacement orders• The low newbuilding orders is expected to continue and is needed to
secure a sustainable recovery in the chemical tanker markets
0,4
0,6
0,0
0,2
0,1
0,5
0,3
0,7
jan-14
jan-10
jan-09
Mill
dw
t
jan-07
jan-08
jan-11
jan-12
des-18
jan-13
jan-15
jan-16
jan-17
des-17
Chemical tanker newbuilding orders (10,000 – 55,000 dwt)
6,0%
Scrapping potential
5,0%
Swing tonnageOrderbook ratio
8,0%
Slowsteaming
17,0%
Orderbook/trading fleet Potential fleet reduction factors
Core chemical tankersbuilt between1995-2000
Potential reduced supplyfrom swing tonnage
Lower supplypotential ifowners reducesailing speed
Chemical tanker orderbook of 8% before adjusting for several variable factors
• Orderbook ratio at 8% which implies average supply growth of 2.6% p.a by 2021...• …This is before adjusting for several variables impacting real supply growth like:
Scrapping Removal of swing tonnage Slowsteaming in the event of elevated bunker prices (IMO 2020) New orders
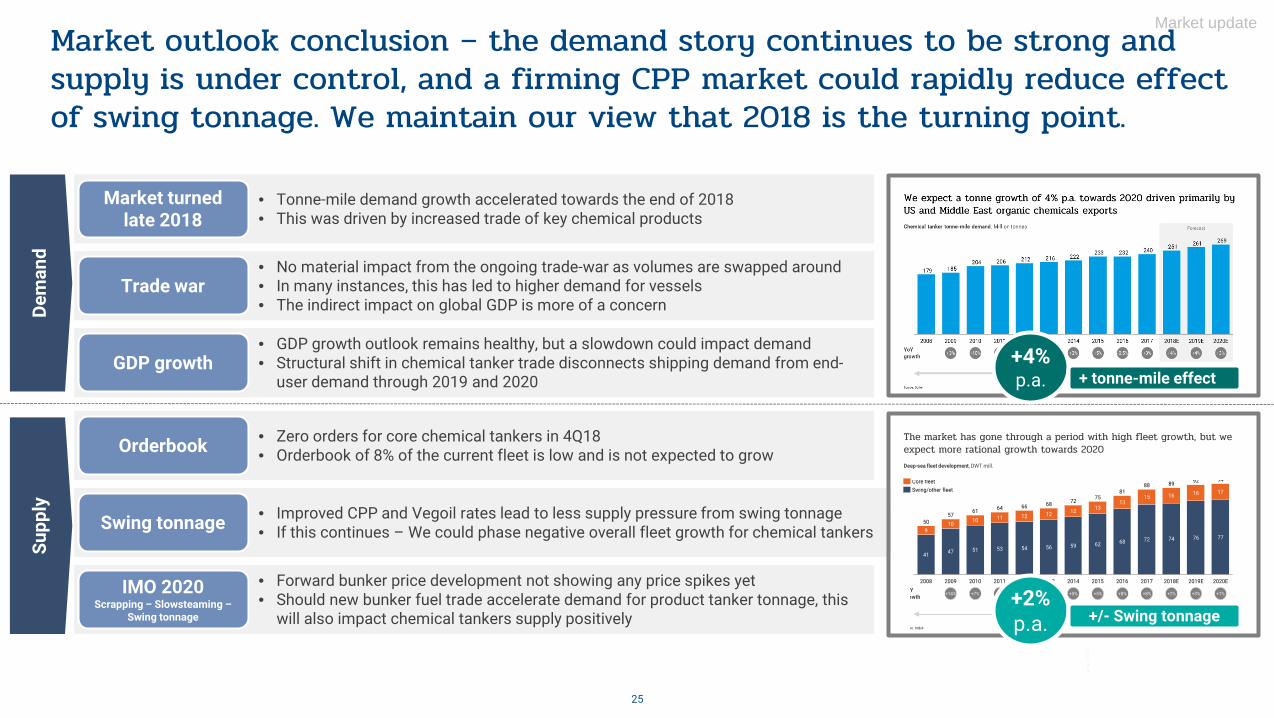
Market outlook conclusion – the demand story continues to be strong and supply is under control, and a firming CPP market could rapidly reduce effect of swing tonnage. We maintain our view that 2018 is the turning point.
25
Market update
• Tonne-mile demand growth accelerated towards the end of 2018• This was driven by increased trade of key chemical products
Market turned late 2018
• No material impact from the ongoing trade-war as volumes are swapped around• In many instances, this has led to higher demand for vessels• The indirect impact on global GDP is more of a concern
Trade war
• GDP growth outlook remains healthy, but a slowdown could impact demand• Structural shift in chemical tanker trade disconnects shipping demand from end-
user demand through 2019 and 2020 GDP growth
• Zero orders for core chemical tankers in 4Q18 • Orderbook of 8% of the current fleet is low and is not expected to growOrderbook
• Improved CPP and Vegoil rates lead to less supply pressure from swing tonnage• If this continues – We could phase negative overall fleet growth for chemical tankersSwing tonnage
• Forward bunker price development not showing any price spikes yet• Should new bunker fuel trade accelerate demand for product tanker tonnage, this
will also impact chemical tankers supply positively
IMO 2020Scrapping – Slowsteaming –
Swing tonnage
Dem
and
Supp
ly
+4%p.a. + tonne-mile effect
The market has gone through a period with high fleet growth, but we expect more rational growth towards 2020
12
Deep-sea fleet development, DWT mill.
72
62
928994
66
1681
5968
11
88
68
54
1213
17
74
75
77
15
76
1613
53
20092008 20142011
9
2010
47
2012 2018E 2020E2013
51
2017
50
2019E
5710
2015
5672
2016
41
126110
1264
Core fleetSwing/other fleet
+6%p.a.
+2%p.a.
ce: Odfjell
Yowth +14% +1%+7% +5% +2% +4% +5% +5% +8% +8% +2% +3%+2%
p.a. +/- Swing tonnage
• We continue to think that 2018 was the turning point for the chemical tanker markets
• Improvement towards the end of the year was driven by real fundamental improvements in our markets
• Odfjell is monitoring the IMO 2020 impact from a cost and market perspective
• Delivery of new fuel efficient vessels to our fleet continues in 2019 and we believe timing has been favourable
• A new JV partner in our US terminals positions us to develop ourterminal business further following the closing of the transaction
• We expect to report improved results in 1Q19 as the chemical tanker markets improve
• We expect Odfjell Terminals results to be stable in 2019
26
Summary and Prospects
Summary:
Prospects:
Odfjell SE would like to welcome you to our annualcapital markets day 5 June 2019.
Theme this year will be the future Odfjell and ongoing changes affecting our operations and markets.
The CMD will be in Oslo at Hotel Continental with seperate invitation to follow.
27
Capital Markets Day 2019 – Save the date
Contact
Investor Relations & Research: Bjørn Kristian Røed | Tlph: +47 55 27 47 33 | Email: [email protected]: Anngun Dybsland | Tel: + 41 54 88 54 | Email: [email protected]
ODFJELL SE | Conrad Mohrs veg 29 | P.O. Box 6101 Postterminalen | 5892 Bergen, Norway Tel: +47 55 27 00 00 | Email: [email protected] | Org. no: 930 192 503
Odfjell.com