Fourth Quarter FY 2010 - infineon.com
32
Fourth Quarter FY 2010 Quarterly Update Infineon Technologies AG Investor Relations
Transcript of Fourth Quarter FY 2010 - infineon.com
Fourth Quarter FY 2010Quarterly Update
Infineon Technologies AGInvestor Relations
Copyright © Infineon Technologies 2010. All rights reserved.
Table of contents
Infineon Results and Outlook
Business Highlights
16 November 2010 Page 2
Copyright © Infineon Technologies 2010. All rights reserved.
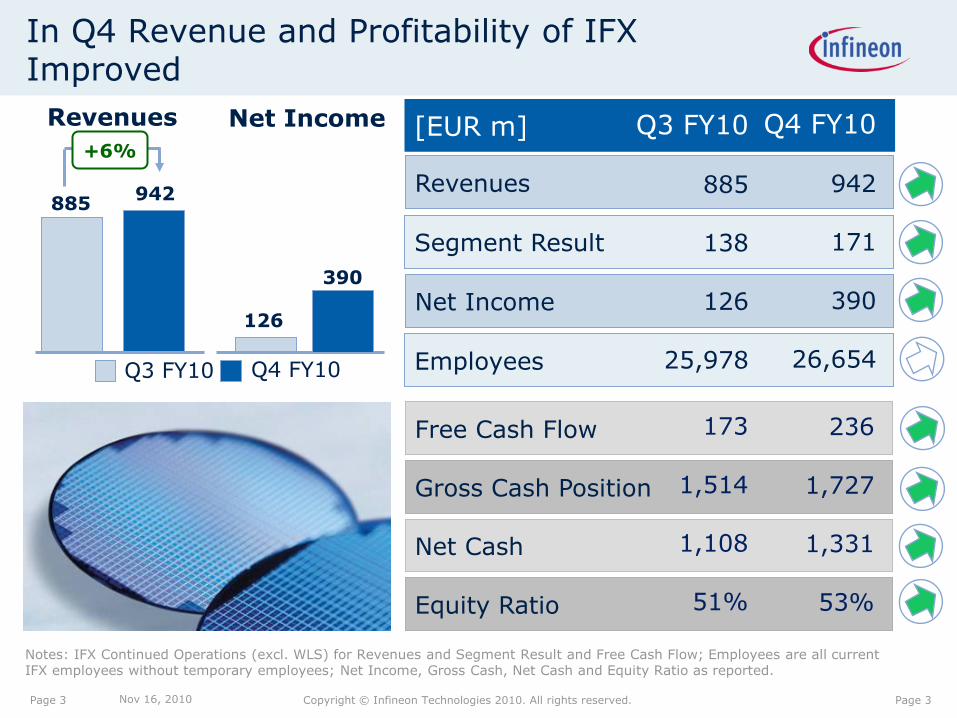
In Q4 Revenue and Profitability of IFX Improved
Segment Result
Revenues
Net Cash
Equity Ratio
Employees
Net Income
Free Cash Flow
Gross Cash Position
173
1,514
1,108
51%
236
1,727
1,331
53%
[EUR m] Q3 FY10
885
138
126
25,978
Q4 FY10
942
171
390
26,654
Revenues Net Income
885942
+6%
Q3 FY10 Q4 FY10
Nov 16, 2010 Page 3
390
126
Notes: IFX Continued Operations (excl. WLS) for Revenues and Segment Result and Free Cash Flow; Employees are all current IFX employees without temporary employees; Net Income, Gross Cash, Net Cash and Equity Ratio as reported.
Page 3
Copyright © Infineon Technologies 2010. All rights reserved.
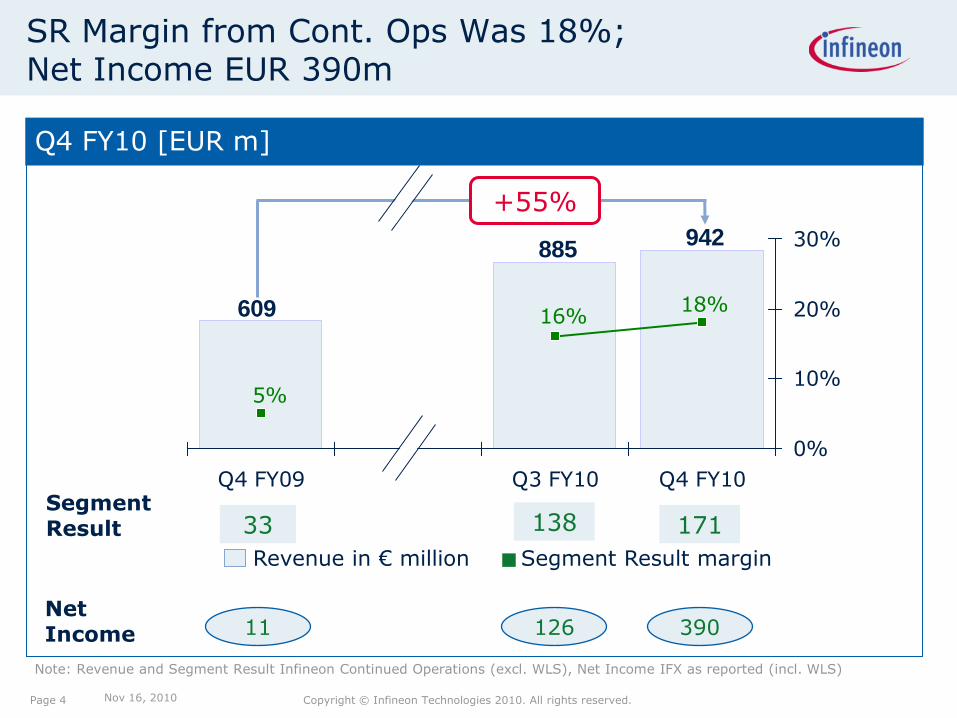
Note: Revenue and Segment Result Infineon Continued Operations (excl. WLS), Net Income IFX as reported (incl. WLS)
609
885942
5%
16%18%
Q4 FY09 Q3 FY10 Q4 FY10
0%
10%
20%
30%
Page 4
SR Margin from Cont. Ops Was 18%;Net Income EUR 390m
Q4 FY10 [EUR m]
Revenue in € million Segment Result margin
+55%
Segment Result
Nov 16, 2010
33 138 171
NetIncome 11 126 390
Copyright © Infineon Technologies 2010. All rights reserved. Page 5Page 5
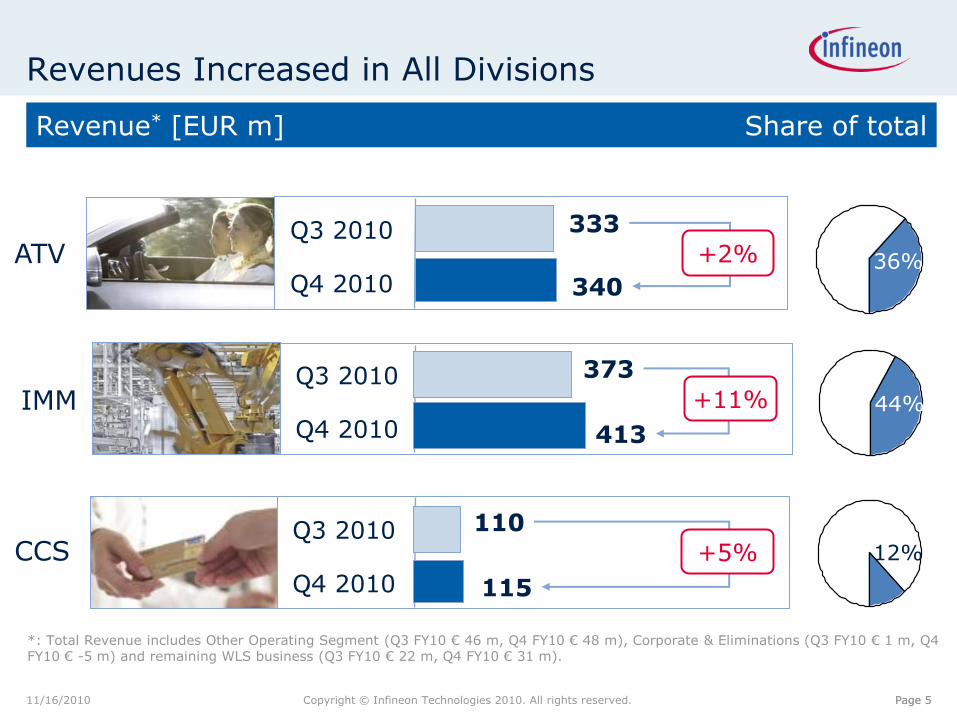
Revenues Increased in All Divisions
36%
Q3 2010
Q4 2010
+2%
333
340
ATV
12%Q3 2010
Q4 2010
+5%
110
115
CCS
44%
Q3 2010
Q4 2010
+11%
373
413
IMM
Revenue* [EUR m] Share of total
*: Total Revenue includes Other Operating Segment (Q3 FY10 € 46 m, Q4 FY10 € 48 m), Corporate & Eliminations (Q3 FY10 € 1 m, Q4 FY10 € -5 m) and remaining WLS business (Q3 FY10 € 22 m, Q4 FY10 € 31 m).
x%
11/16/2010
Copyright © Infineon Technologies 2010. All rights reserved. Page 6Page 6
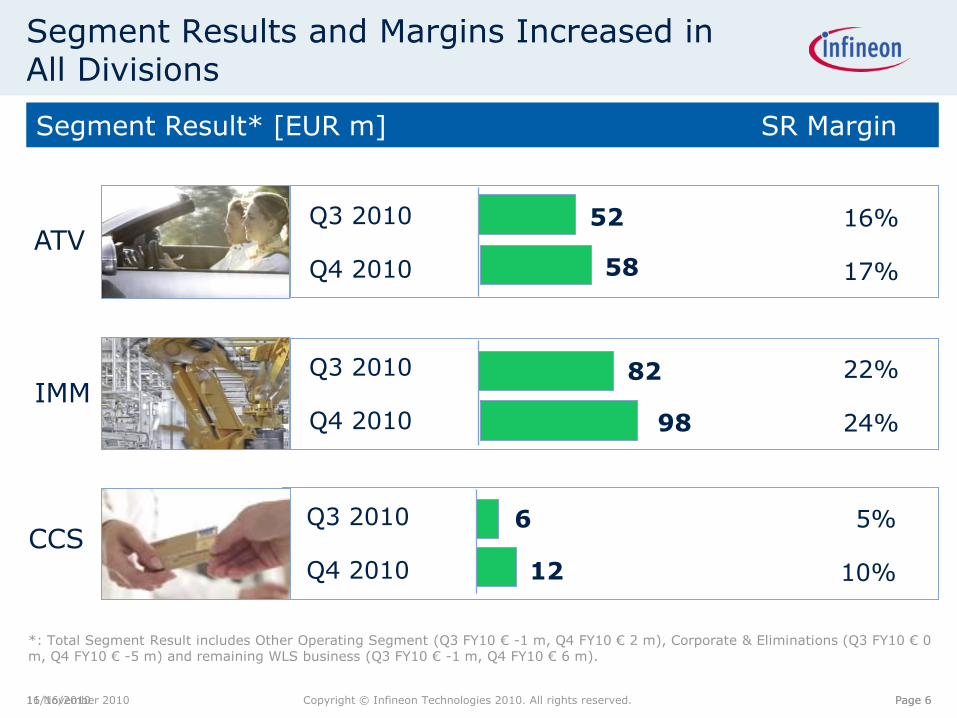
Segment Results and Margins Increased in All Divisions
Segment Result* [EUR m] SR Margin
*: Total Segment Result includes Other Operating Segment (Q3 FY10 € -1 m, Q4 FY10 € 2 m), Corporate & Eliminations (Q3 FY10 € 0 m, Q4 FY10 € -5 m) and remaining WLS business (Q3 FY10 € -1 m, Q4 FY10 € 6 m).
6Q3 2010
Q4 2010 12
CCS5%
10%
82Q3 2010
Q4 2010 98IMM
22%
24%
52Q3 2010
Q4 2010 58ATV
16%
17%
11/16/201016 November 2010
Copyright © Infineon Technologies 2010. All rights reserved.
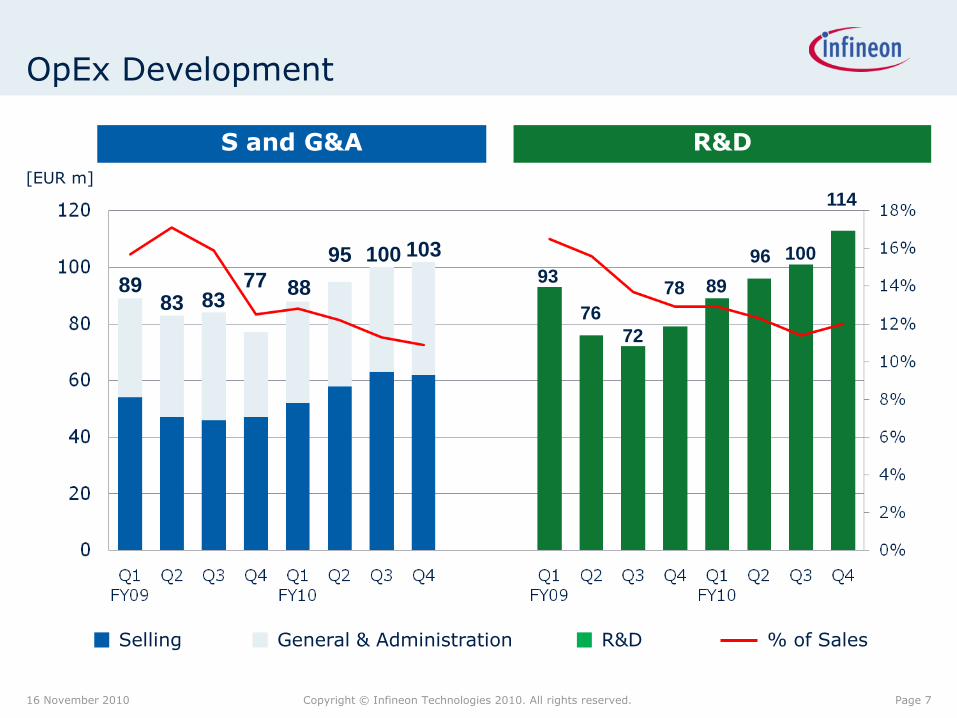
OpEx Development
S and G&A R&D
[EUR m]
16 November 2010 Page 7
89 93
76
72
78 89
100
114
96
83 8377 88
95 100 103
% of SalesR&DGeneral & AdministrationSelling
Copyright © Infineon Technologies 2010. All rights reserved.
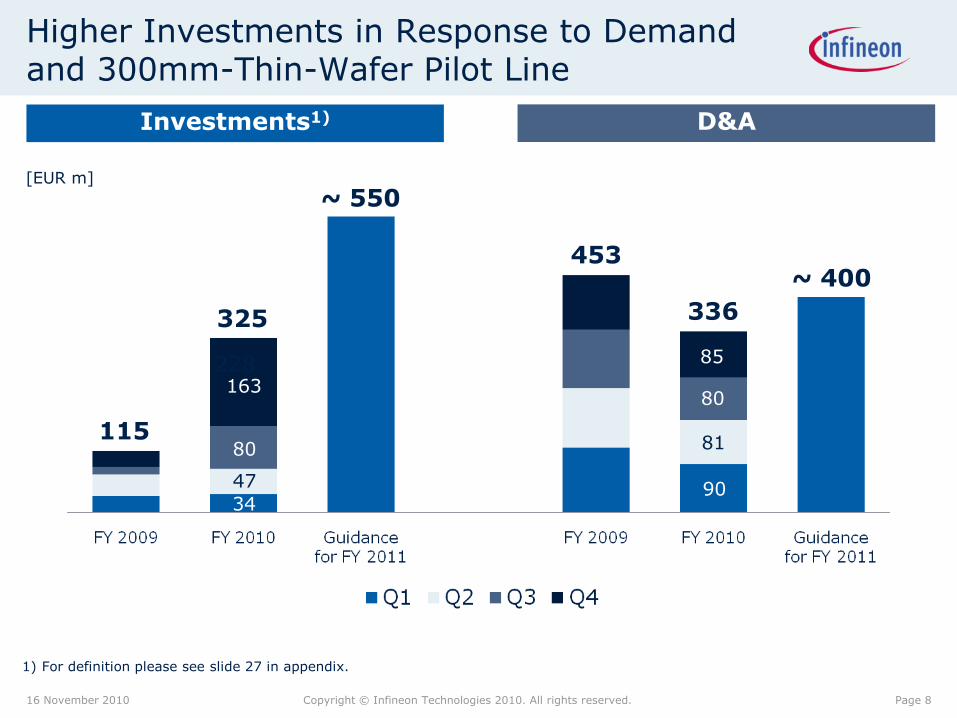
Higher Investments in Response to Demand and 300mm-Thin-Wafer Pilot Line
Investments1)
1) For definition please see slide 27 in appendix.
D&A
115
228
~ 550
453
xxx
~ 400
85
16 November 2010 Page 8
163
[EUR m]
325
80
80
336
47
81
9034
Copyright © Infineon Technologies 2010. All rights reserved.
15
07
65
7
16
78
87
4
16
67
99
5 15
14
17
27
28
0 27
0 27
0 25
5 24
3
57
0 53
4
40
2
15
1
15
3
65
7
87
4 99
5
11
08
13
31
Gross Cash Debt Equity-linked Net Cash
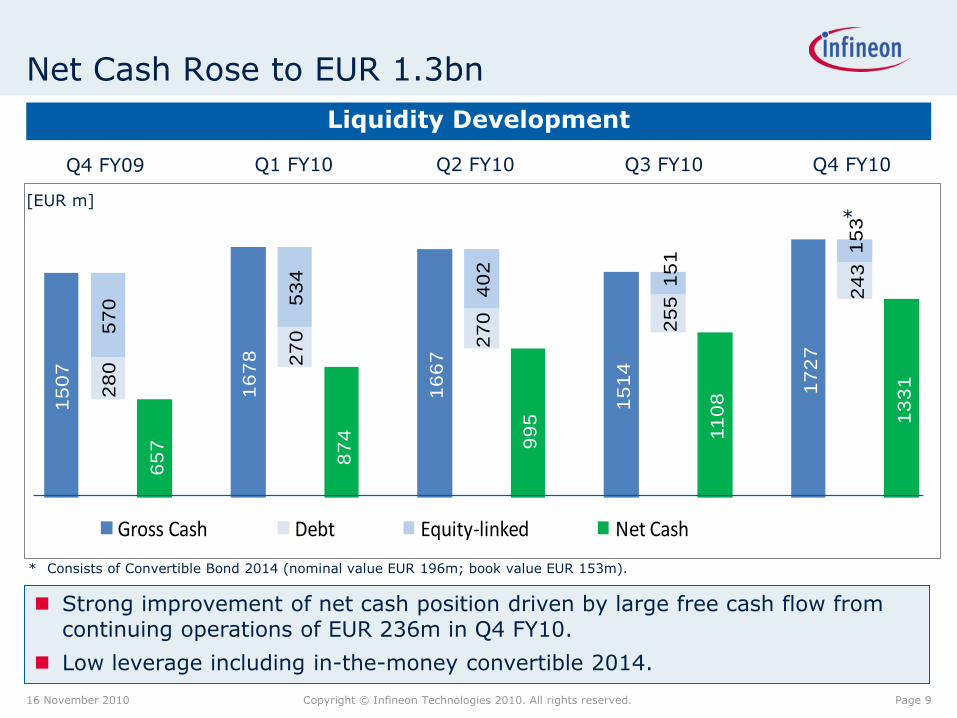
Net Cash Rose to EUR 1.3bn
Liquidity Development
[EUR m]
Strong improvement of net cash position driven by large free cash flow from continuing operations of EUR 236m in Q4 FY10.
Low leverage including in-the-money convertible 2014.
Q4 FY09 Q1 FY10 Q2 FY10
* Consists of Convertible Bond 2014 (nominal value EUR 196m; book value EUR 153m).
Q3 FY10
16 November 2010 Page 9
Q4 FY10
*
Copyright © Infineon Technologies 2010. All rights reserved.
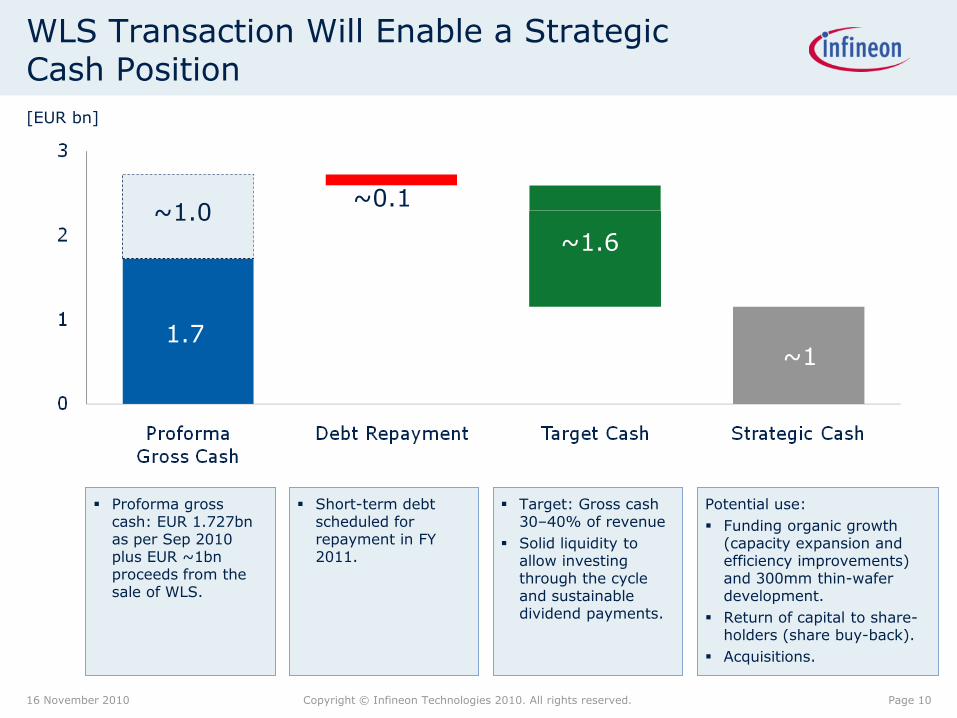
WLS Transaction Will Enable a Strategic Cash Position
Page 10
Proforma gross cash: EUR 1.727bn as per Sep 2010 plus EUR ~1bn proceeds from the sale of WLS.
Short-term debt scheduled for repayment in FY 2011.
16 November 2010
Target: Gross cash 30–40% of revenue
Solid liquidity to allow investing through the cycle and sustainable dividend payments.
Potential use:
Funding organic growth (capacity expansion and efficiency improvements) and 300mm thin-wafer development.
Return of capital to share-holders (share buy-back).
Acquisitions.
[EUR bn]
1.7
~1.0
~1
~1.6
~0.1
Copyright © Infineon Technologies 2010. All rights reserved.
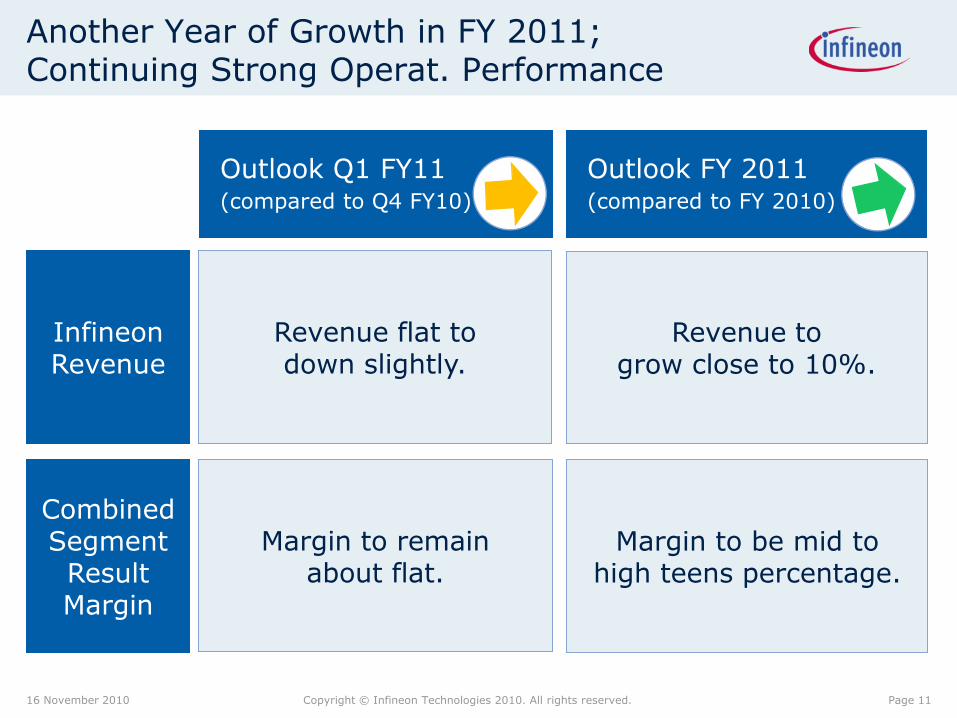
Another Year of Growth in FY 2011;Continuing Strong Operat. Performance
Combined Segment Result Margin
Infineon Revenue
Margin to remainabout flat.
Revenue flat todown slightly.
Outlook Q1 FY11(compared to Q4 FY10)
Margin to be mid tohigh teens percentage.
Revenue togrow close to 10%.
Outlook FY 2011(compared to FY 2010)
16 November 2010 Page 11
Copyright © Infineon Technologies 2010. All rights reserved.16 November 2010
Table of Contents
Infineon Results and Outlook
Business Highlights
Page 12
Copyright © Infineon Technologies 2010. All rights reserved.16 November 2010
AutomotiveIndustrial & Multimarket
Chip Card& Security
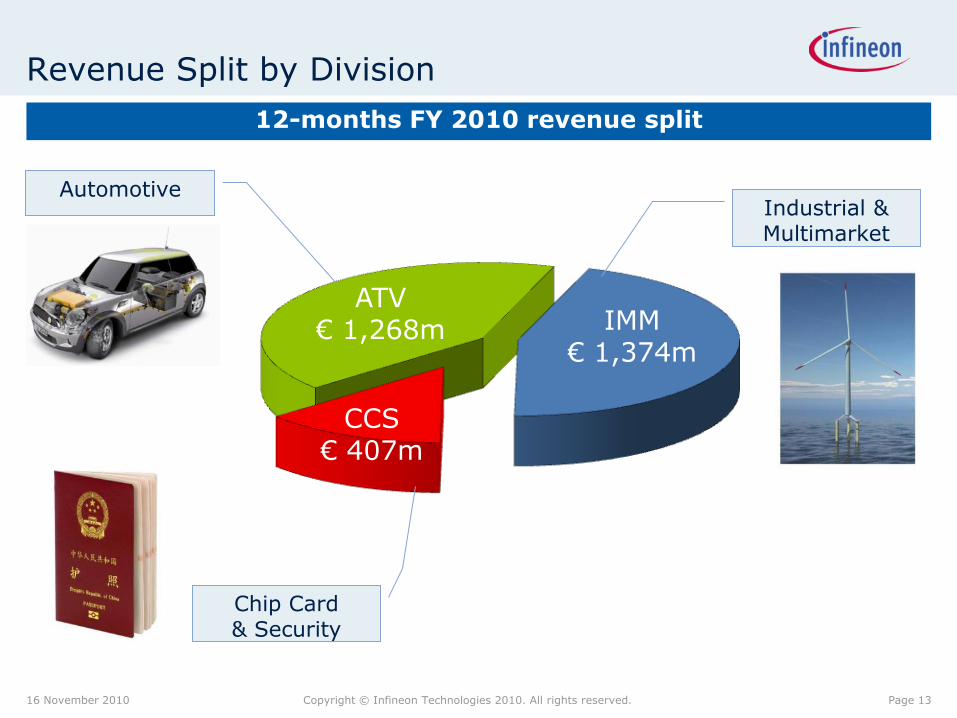
Revenue Split by Division
ATV€ 1,268m
CCS€ 407m
12-months FY 2010 revenue split
Page 13
IMM€ 1,374m
Copyright © Infineon Technologies 2010. All rights reserved.
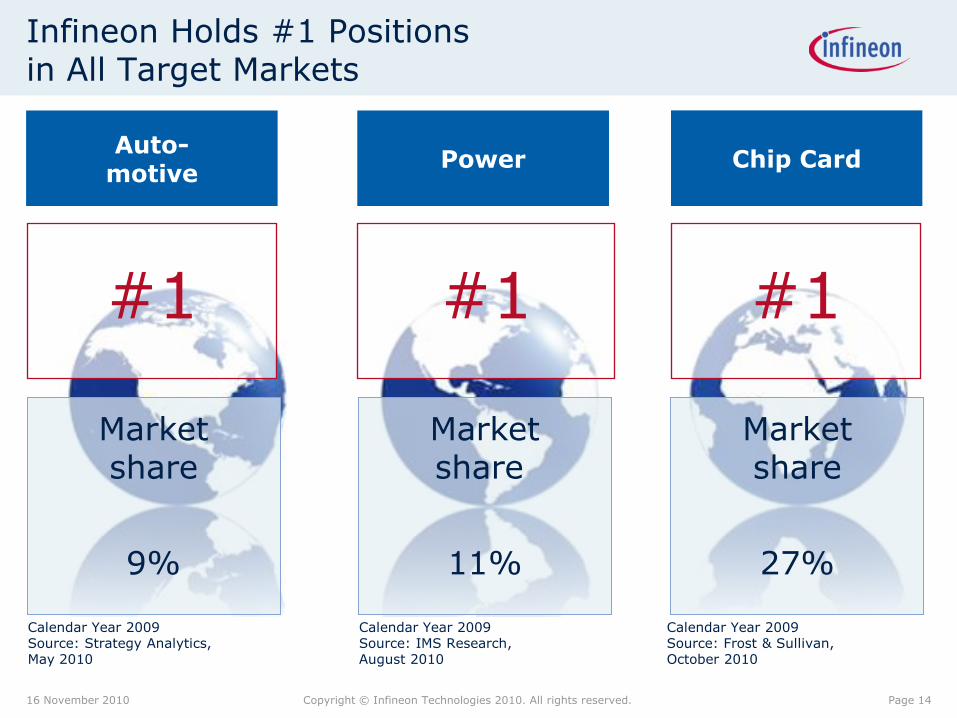
Infineon Holds #1 Positions in All Target Markets
#1
Power
Marketshare
11%
Chip Card
#1
Marketshare
27%
Auto-motive
#1
Marketshare
9%
Calendar Year 2009Source: IMS Research,August 2010
Calendar Year 2009Source: Frost & Sullivan,October 2010
Calendar Year 2009Source: Strategy Analytics,May 2010
16 November 2010 Page 14
Copyright © Infineon Technologies 2010. All rights reserved.
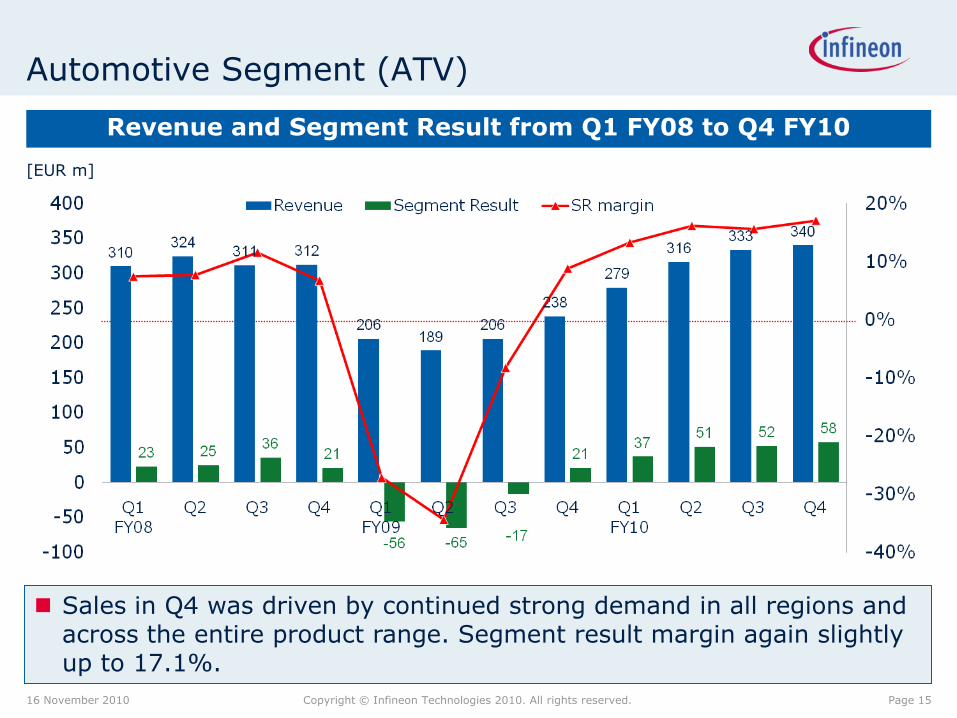
Automotive Segment (ATV)
Revenue and Segment Result from Q1 FY08 to Q4 FY10
[EUR m]
16 November 2010 Page 15
Sales in Q4 was driven by continued strong demand in all regions and across the entire product range. Segment result margin again slightly up to 17.1%.
Copyright © Infineon Technologies 2010. All rights reserved.
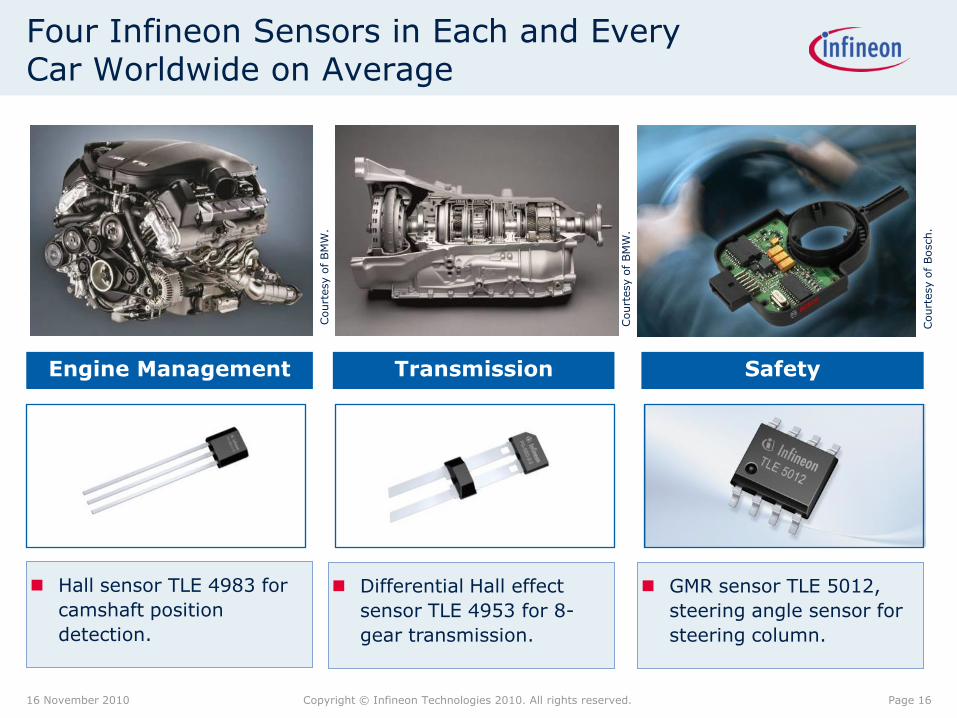
Four Infineon Sensors in Each and Every Car Worldwide on Average
16 November 2010 Page 16
Engine Management Transmission Safety
Hall sensor TLE 4983 for
camshaft position
detection.Court
esy o
f BM
W.
GMR sensor TLE 5012,
steering angle sensor for
steering column.
Differential Hall effect
sensor TLE 4953 for 8-
gear transmission.
Court
esy o
f Bosch.
Court
esy o
f BM
W.
Copyright © Infineon Technologies 2010. All rights reserved.16 November 2010 Page 17
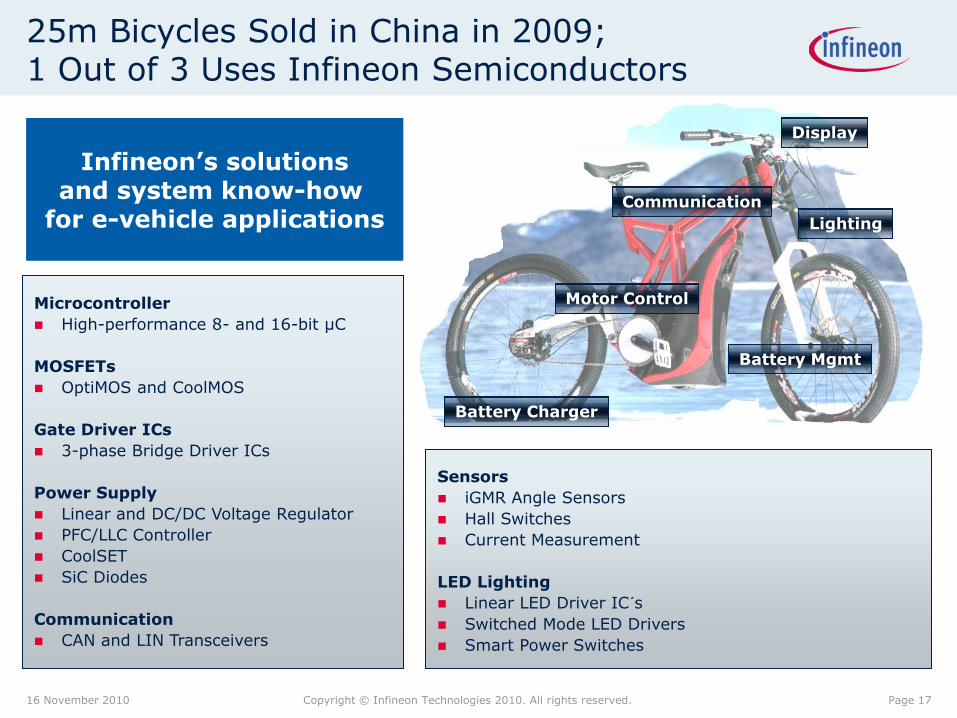
25m Bicycles Sold in China in 2009;1 Out of 3 Uses Infineon Semiconductors
Microcontroller
High-performance 8- and 16-bit µC
MOSFETs
OptiMOS and CoolMOS
Gate Driver ICs
3-phase Bridge Driver ICs
Power Supply
Linear and DC/DC Voltage Regulator
PFC/LLC Controller
CoolSET
SiC Diodes
Communication
CAN and LIN Transceivers
Battery Charger
Battery Mgmt
Motor Control
Display
Lighting
Communication
Sensors
iGMR Angle Sensors
Hall Switches
Current Measurement
LED Lighting
Linear LED Driver IC´s
Switched Mode LED Drivers
Smart Power Switches
Infineon’s solutionsand system know-how
for e-vehicle applications
Copyright © Infineon Technologies 2010. All rights reserved.
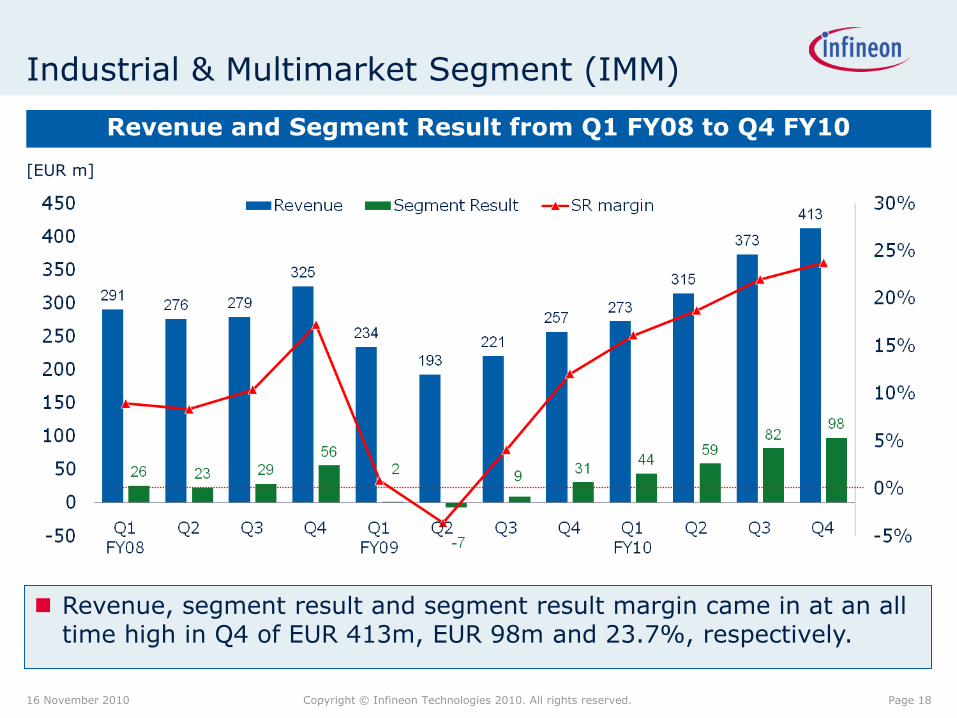
Industrial & Multimarket Segment (IMM)
Revenue and Segment Result from Q1 FY08 to Q4 FY10
[EUR m]
16 November 2010 Page 18
Revenue, segment result and segment result margin came in at an all time high in Q4 of EUR 413m, EUR 98m and 23.7%, respectively.
Copyright © Infineon Technologies 2010. All rights reserved.
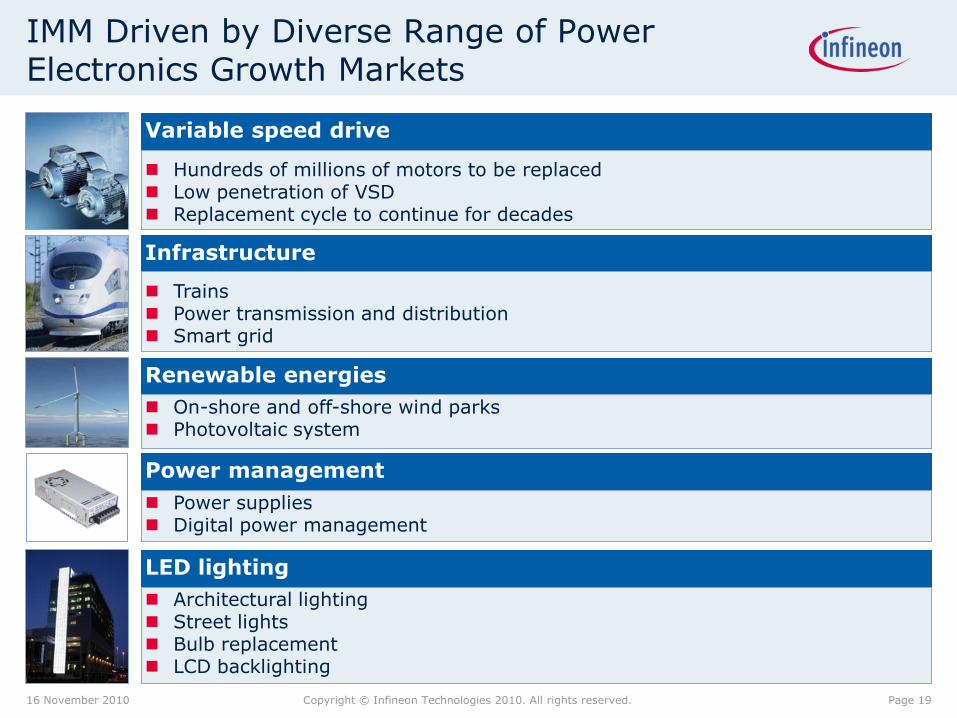
IMM Driven by Diverse Range of Power Electronics Growth Markets
Renewable energies
On-shore and off-shore wind parks Photovoltaic system
LED lighting
Architectural lighting Street lights Bulb replacement LCD backlighting
Variable speed drive
Hundreds of millions of motors to be replaced Low penetration of VSD Replacement cycle to continue for decades
Infrastructure
Trains Power transmission and distribution Smart grid
Power management
Power supplies Digital power management
16 November 2010 Page 19
Copyright © Infineon Technologies 2010. All rights reserved.
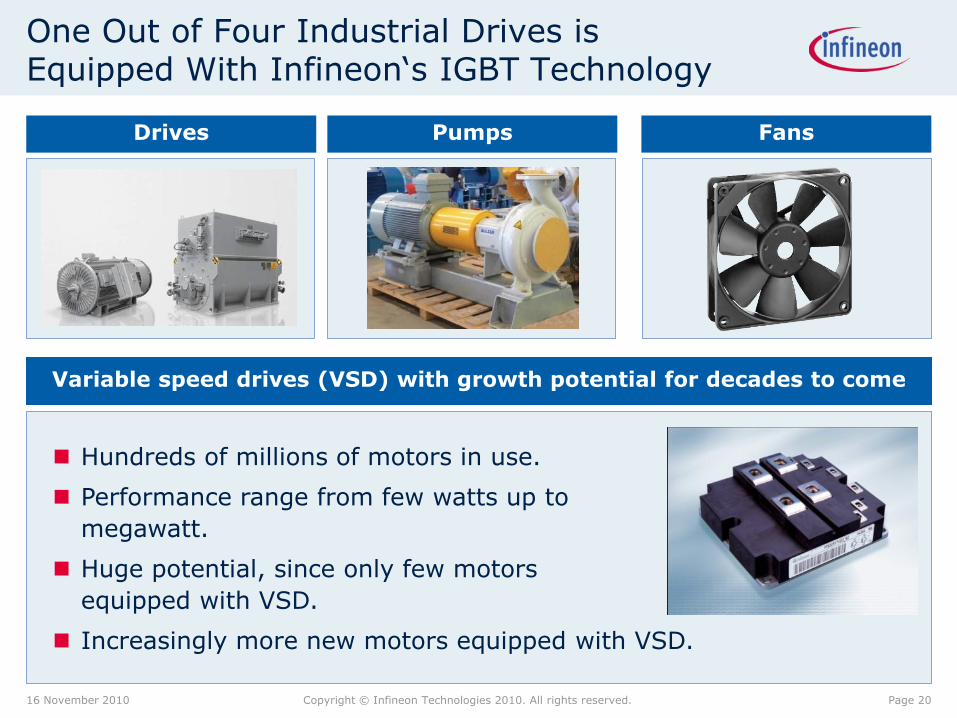
Hundreds of millions of motors in use.
Performance range from few watts up to
megawatt.
Huge potential, since only few motors
equipped with VSD.
Increasingly more new motors equipped with VSD.
One Out of Four Industrial Drives is Equipped With Infineon„s IGBT Technology
Drives Pumps
Variable speed drives (VSD) with growth potential for decades to come
Fans
16 November 2010 Page 20
Copyright © Infineon Technologies 2010. All rights reserved.
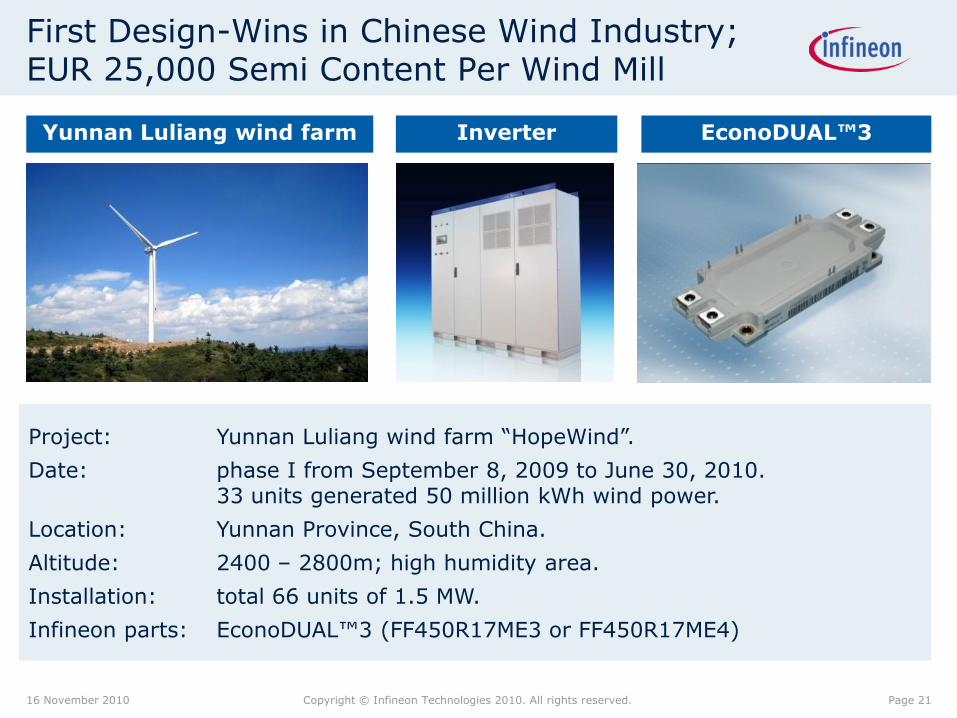
First Design-Wins in Chinese Wind Industry; EUR 25,000 Semi Content Per Wind Mill
16 November 2010 Page 21
Project: Yunnan Luliang wind farm “HopeWind”.
Date: phase I from September 8, 2009 to June 30, 2010.33 units generated 50 million kWh wind power.
Location: Yunnan Province, South China.
Altitude: 2400 – 2800m; high humidity area.
Installation: total 66 units of 1.5 MW.
Infineon parts: EconoDUAL™3 (FF450R17ME3 or FF450R17ME4)
Yunnan Luliang wind farm Inverter EconoDUAL™3
Copyright © Infineon Technologies 2010. All rights reserved.
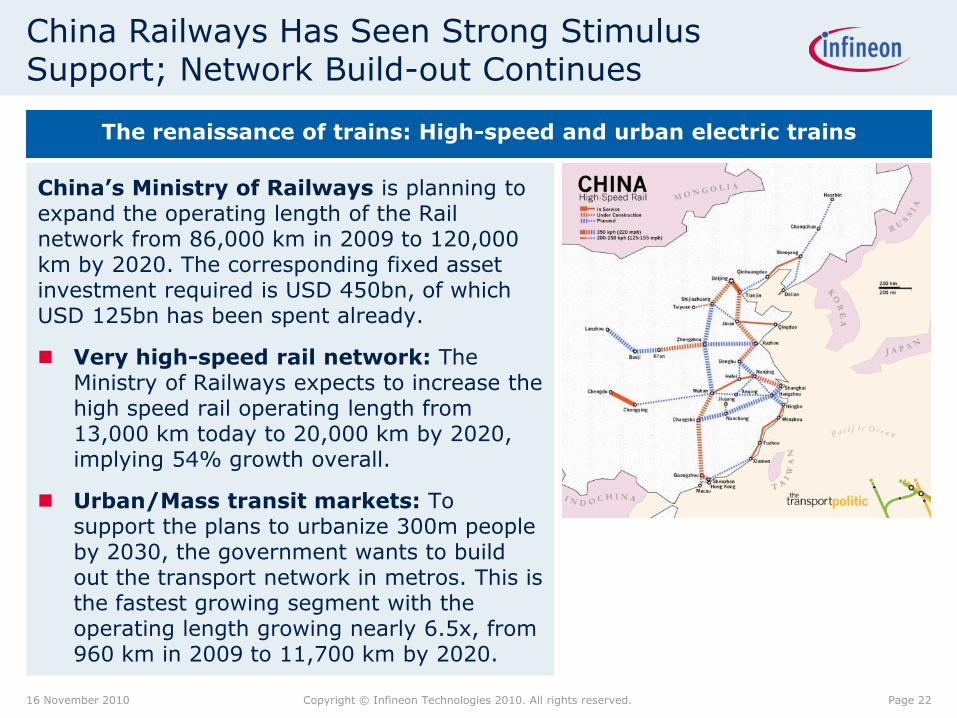
China Railways Has Seen Strong Stimulus Support; Network Build-out Continues
China’s Ministry of Railways is planning to expand the operating length of the Rail network from 86,000 km in 2009 to 120,000 km by 2020. The corresponding fixed asset investment required is USD 450bn, of which USD 125bn has been spent already.
Very high-speed rail network: The Ministry of Railways expects to increase the high speed rail operating length from 13,000 km today to 20,000 km by 2020, implying 54% growth overall.
Urban/Mass transit markets: To support the plans to urbanize 300m people by 2030, the government wants to build out the transport network in metros. This is the fastest growing segment with the operating length growing nearly 6.5x, from 960 km in 2009 to 11,700 km by 2020.
16 November 2010 Page 22
The renaissance of trains: High-speed and urban electric trains
Copyright © Infineon Technologies 2010. All rights reserved.
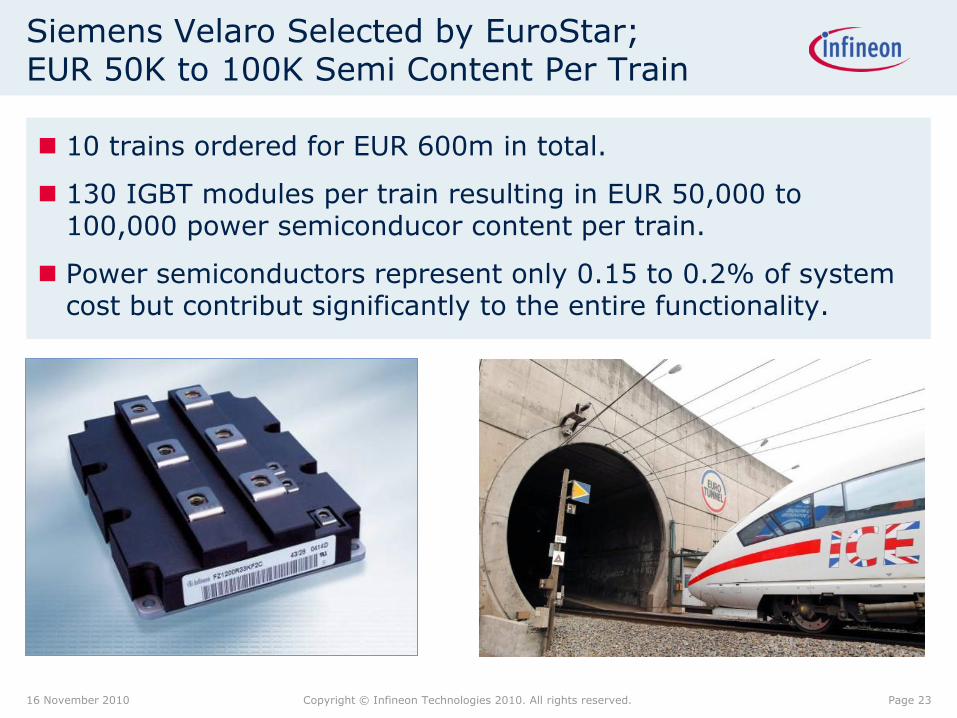
Siemens Velaro Selected by EuroStar;EUR 50K to 100K Semi Content Per Train
10 trains ordered for EUR 600m in total.
130 IGBT modules per train resulting in EUR 50,000 to 100,000 power semiconducor content per train.
Power semiconductors represent only 0.15 to 0.2% of system cost but contribut significantly to the entire functionality.
16 November 2010 Page 23
Copyright © Infineon Technologies 2010. All rights reserved.
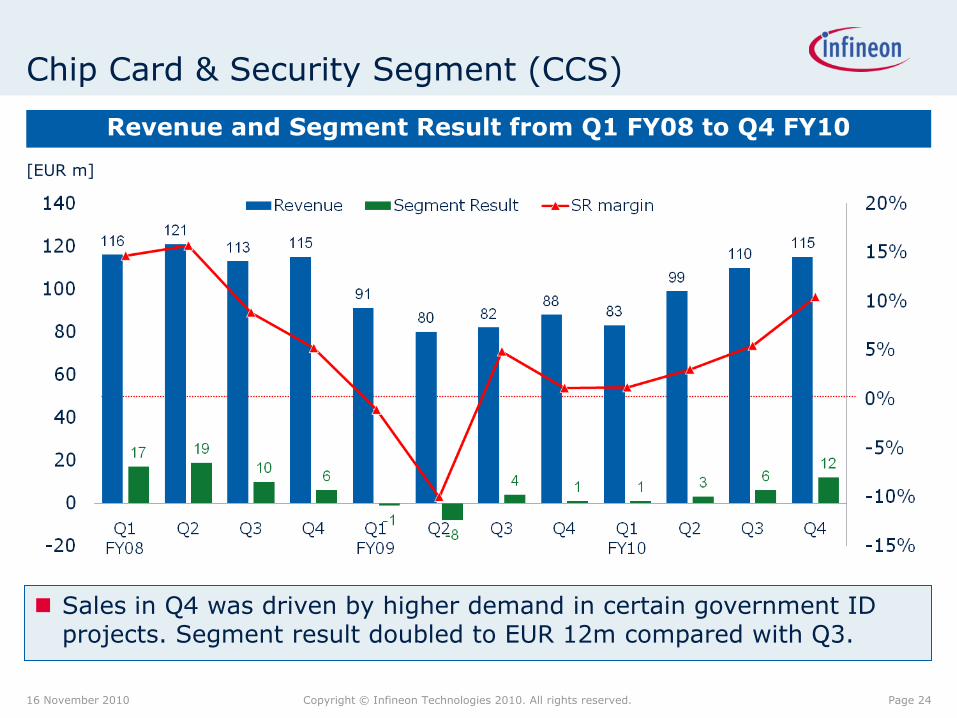
Chip Card & Security Segment (CCS)
Revenue and Segment Result from Q1 FY08 to Q4 FY10
[EUR m]
16 November 2010 Page 24
Sales in Q4 was driven by higher demand in certain government ID projects. Segment result doubled to EUR 12m compared with Q3.
Copyright © Infineon Technologies 2010. All rights reserved.
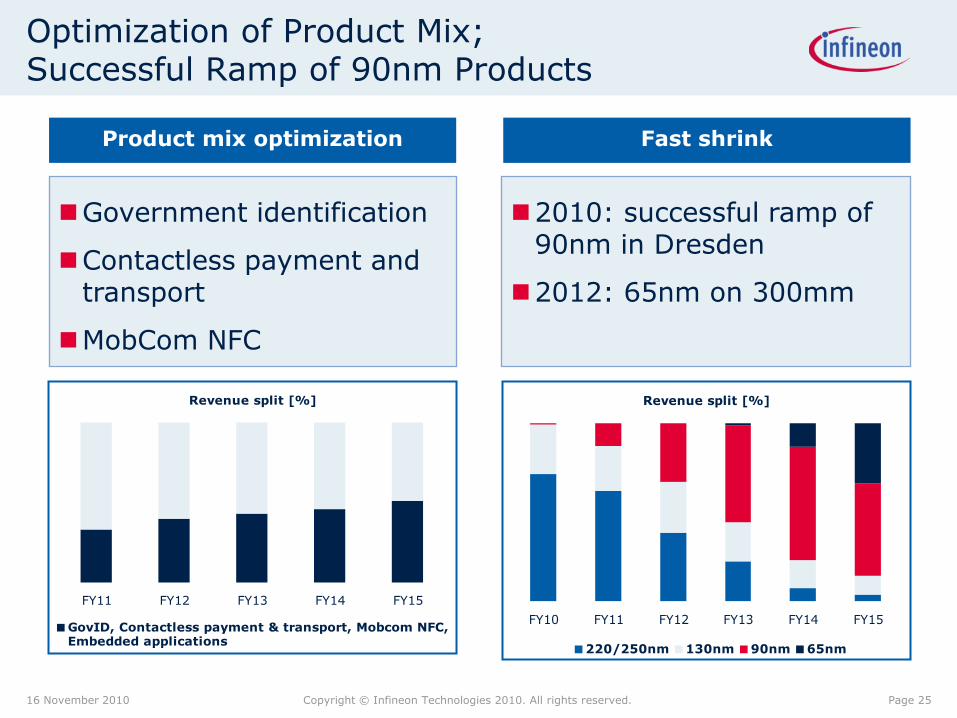
Optimization of Product Mix;Successful Ramp of 90nm Products
16 November 2010 Page 25
Revenue split [%]
FY11 FY12 FY13 FY14 FY15
GovID, Contactless payment & transport, Mobcom NFC,Embedded applications
Government identification
Contactless payment and transport
MobCom NFC
Revenue split [%]
FY10 FY11 FY12 FY13 FY14 FY15
220/250nm 130nm 90nm 65nm
2010: successful ramp of 90nm in Dresden
2012: 65nm on 300mm
Product mix optimization Fast shrink

Copyright © Infineon Technologies 2010. All rights reserved.
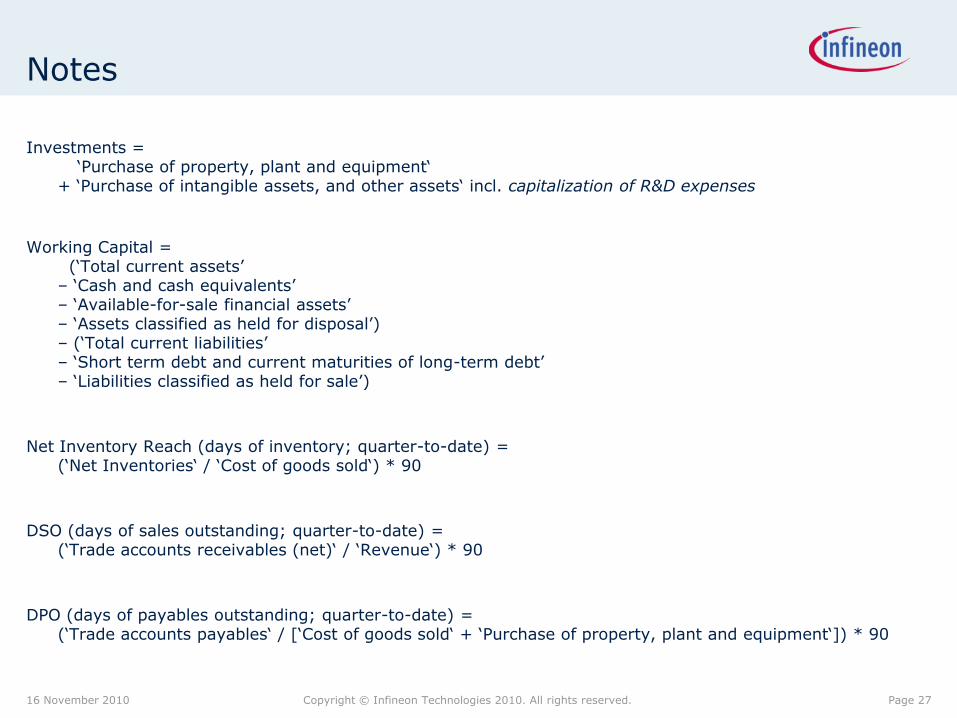
Notes
Investments = „Purchase of property, plant and equipment„
+ „Purchase of intangible assets, and other assets„ incl. capitalization of R&D expenses
Working Capital =(„Total current assets‟
– „Cash and cash equivalents‟– „Available-for-sale financial assets‟– „Assets classified as held for disposal‟)– („Total current liabilities‟– „Short term debt and current maturities of long-term debt‟– „Liabilities classified as held for sale‟)
Net Inventory Reach (days of inventory; quarter-to-date) = („Net Inventories„ / „Cost of goods sold„) * 90
DSO (days of sales outstanding; quarter-to-date) = („Trade accounts receivables (net)„ / „Revenue„) * 90
DPO (days of payables outstanding; quarter-to-date) = („Trade accounts payables„ / [„Cost of goods sold„ + „Purchase of property, plant and equipment„]) * 90
16 November 2010 Page 27
Copyright © Infineon Technologies 2010. All rights reserved.
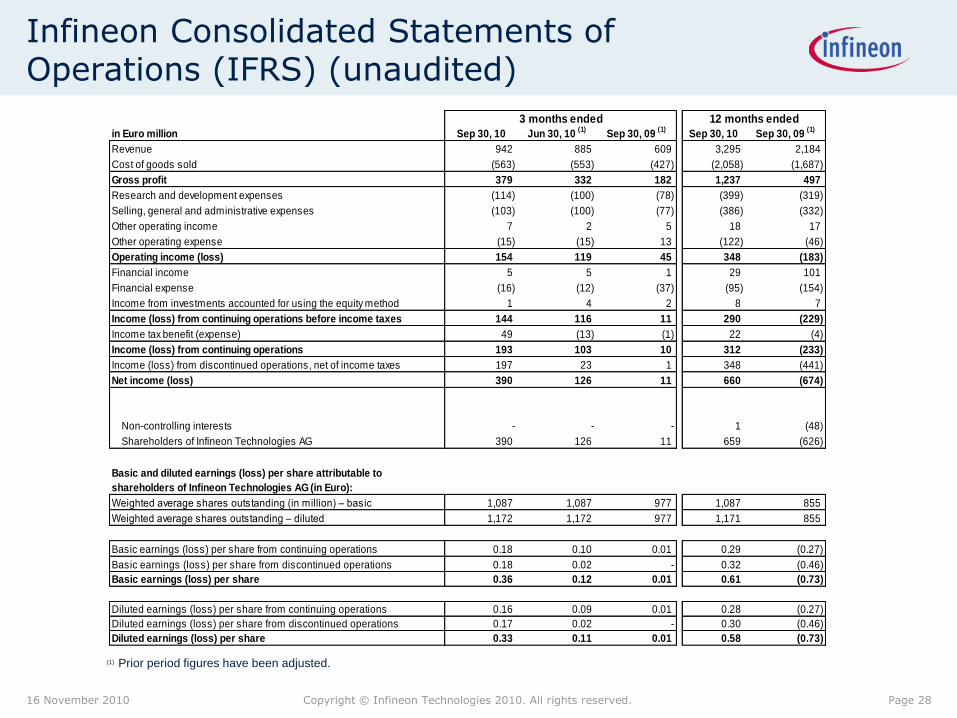
Infineon Consolidated Statements of Operations (IFRS) (unaudited)
16 November 2010 Page 28
in Euro million Sep 30, 10 Jun 30, 10 (1)
Sep 30, 09 (1)
Sep 30, 10 Sep 30, 09 (1)
Revenue 942 885 609 3,295 2,184
Cost of goods sold (563) (553) (427) (2,058) (1,687)
Gross profit 379 332 182 1,237 497
Research and development expenses (114) (100) (78) (399) (319)
Selling, general and administrative expenses (103) (100) (77) (386) (332)
Other operating income 7 2 5 18 17
Other operating expense (15) (15) 13 (122) (46)
Operating income (loss) 154 119 45 348 (183)
Financial income 5 5 1 29 101
Financial expense (16) (12) (37) (95) (154)
Income from investments accounted for using the equity method 1 4 2 8 7
Income (loss) from continuing operations before income taxes 144 116 11 290 (229)
Income tax benefit (expense) 49 (13) (1) 22 (4)
Income (loss) from continuing operations 193 103 10 312 (233)
Income (loss) from discontinued operations, net of income taxes 197 23 1 348 (441)
Net income (loss) 390 126 11 660 (674)
Non-controlling interests - - - 1 (48)
Shareholders of Infineon Technologies AG 390 126 11 659 (626)
Basic and diluted earnings (loss) per share attributable to
shareholders of Infineon Technologies AG (in Euro):
Weighted average shares outstanding (in million) – basic 1,087 1,087 977 1,087 855
Weighted average shares outstanding – diluted 1,172 1,172 977 1,171 855
Basic earnings (loss) per share from continuing operations 0.18 0.10 0.01 0.29 (0.27)
Basic earnings (loss) per share from discontinued operations 0.18 0.02 - 0.32 (0.46)
Basic earnings (loss) per share 0.36 0.12 0.01 0.61 (0.73)
Diluted earnings (loss) per share from continuing operations 0.16 0.09 0.01 0.28 (0.27)
Diluted earnings (loss) per share from discontinued operations 0.17 0.02 - 0.30 (0.46)
Diluted earnings (loss) per share 0.33 0.11 0.01 0.58 (0.73)
3 months ended 12 months ended
(1) Prior period figures have been adjusted.
Copyright © Infineon Technologies 2010. All rights reserved.
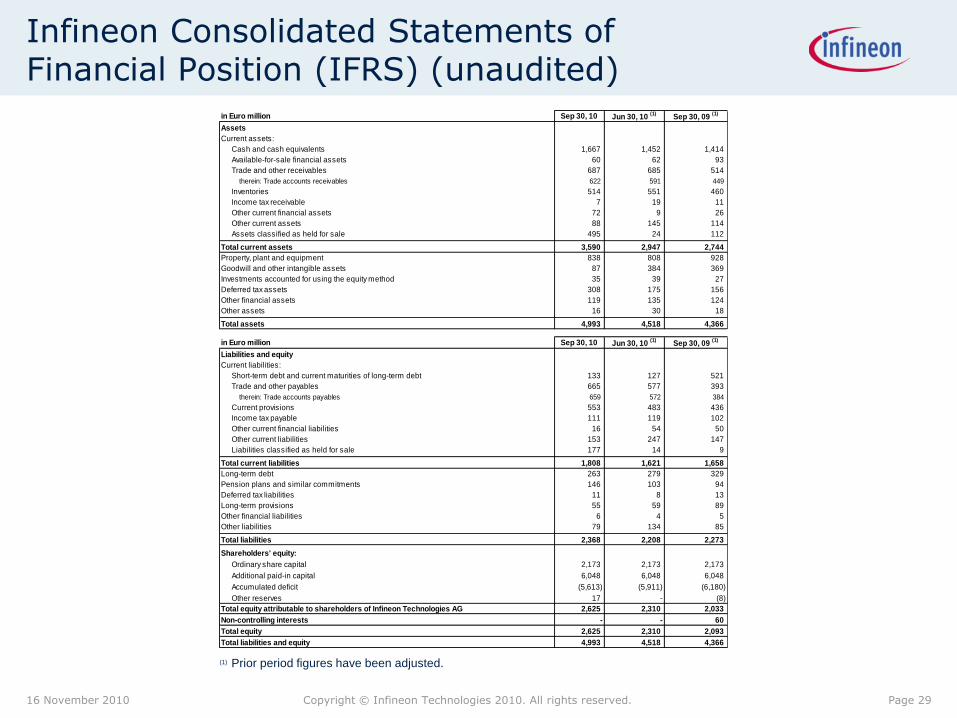
Infineon Consolidated Statements of Financial Position (IFRS) (unaudited)
16 November 2010 Page 29
(1) Prior period figures have been adjusted.
in Euro million Sep 30, 10 Jun 30, 10 (1)
Sep 30, 09 (1)
Assets
Current assets:
Cash and cash equivalents 1,667 1,452 1,414
Available-for-sale financial assets 60 62 93
Trade and other receivables 687 685 514
therein: Trade accounts receivables 622 591 449
Inventories 514 551 460
Income tax receivable 7 19 11
Other current financial assets 72 9 26
Other current assets 88 145 114
Assets classified as held for sale 495 24 112 - - -
Total current assets 3,590 2,947 2,744
Property, plant and equipment 838 808 928
Goodwill and other intangible assets 87 384 369
Investments accounted for using the equity method 35 39 27
Deferred tax assets 308 175 156
Other financial assets 119 135 124
Other assets 16 30 18 Umsatzerlöse einschließlich Wireless Solutions - - -
Total assets 4,993 4,518 4,366
in Euro million Sep 30, 10 Jun 30, 10 (1)
Sep 30, 09 (1)
Liabilities and equity
Current liabilities:
Short-term debt and current maturities of long-term debt 133 127 521
Trade and other payables 665 577 393
therein: Trade accounts payables 659 572 384
Current provisions 553 483 436
Income tax payable 111 119 102
Other current financial liabilities 16 54 50
Other current liabilities 153 247 147
Liabilities classified as held for sale 177 14 9 - - -
Total current liabilities 1,808 1,621 1,658
Long-term debt 263 279 329
Pension plans and similar commitments 146 103 94
Deferred tax liabilities 11 8 13
Long-term provisions 55 59 89
Other financial liabilities 6 4 5
Other liabilities 79 134 85 - - -
Total liabilities 2,368 2,208 2,273 - - -
Shareholders' equity:
Ordinary share capital 2,173 2,173 2,173
Additional paid-in capital 6,048 6,048 6,048
Accumulated deficit (5,613) (5,911) (6,180)
Other reserves 17 - (8)
Total equity attributable to shareholders of Infineon Technologies AG 2,625 2,310 2,033
Non-controlling interests - - 60
Total equity 2,625 2,310 2,093
Total liabilities and equity 4,993 4,518 4,366
Copyright © Infineon Technologies 2010. All rights reserved.
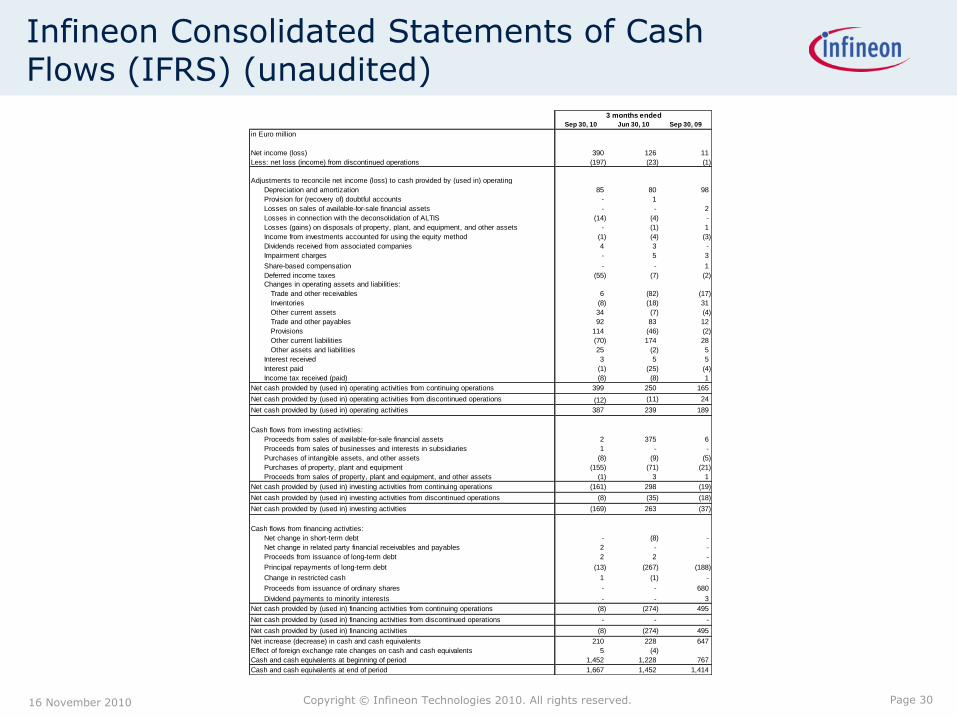
Infineon Consolidated Statements of Cash Flows (IFRS) (unaudited)
Page 3016 November 2010
Sep 30, 10 Jun 30, 10 Sep 30, 09
in Euro million
Net income (loss) 390 126 11
Less: net loss (income) from discontinued operations (197) (23) (1)
Adjustments to reconcile net income (loss) to cash provided by (used in) operating
Depreciation and amortization 85 80 98
Provision for (recovery of) doubtful accounts - 1
Losses on sales of available-for-sale financial assets - - 2
Losses in connection with the deconsolidation of ALTIS (14) (4) -
Losses (gains) on disposals of property, plant, and equipment, and other assets - (1) 1
Income from investments accounted for using the equity method (1) (4) (3)
Dividends received from associated companies 4 3 -
Impairment charges - 5 3
Share-based compensation - - 1
Deferred income taxes (55) (7) (2)
Changes in operating assets and liabilities:
Trade and other receivables 6 (82) (17)
Inventories (8) (18) 31
Other current assets 34 (7) (4)
Trade and other payables 92 83 12
Provisions 114 (46) (2)
Other current liabilities (70) 174 28
Other assets and liabilities 25 (2) 5
Interest received 3 5 5
Interest paid (1) (25) (4)
Income tax received (paid) (8) (8) 1
Net cash provided by (used in) operating activities from continuing operations 399 250 165
Net cash provided by (used in) operating activities from discontinued operations (12) (11) 24
Net cash provided by (used in) operating activities 387 239 189
Cash flows from investing activities:
Proceeds from sales of available-for-sale financial assets 2 375 6
Proceeds from sales of businesses and interests in subsidiaries 1 - -
Purchases of intangible assets, and other assets (8) (9) (5)
Purchases of property, plant and equipment (155) (71) (21)
Proceeds from sales of property, plant and equipment, and other assets (1) 3 1
Net cash provided by (used in) investing activities from continuing operations (161) 298 (19)
Net cash provided by (used in) investing activities from discontinued operations (8) (35) (18)
Net cash provided by (used in) investing activities (169) 263 (37)
Cash flows from financing activities:
Net change in short-term debt - (8) -
Net change in related party financial receivables and payables 2 - -
Proceeds from issuance of long-term debt 2 2 -
Principal repayments of long-term debt (13) (267) (188)
Change in restricted cash 1 (1) -
Proceeds from issuance of ordinary shares - - 680
Dividend payments to minority interests - - 3
Net cash provided by (used in) financing activities from continuing operations (8) (274) 495
Net cash provided by (used in) financing activities from discontinued operations - - -
Net cash provided by (used in) financing activities (8) (274) 495
Net increase (decrease) in cash and cash equivalents 210 228 647
Effect of foreign exchange rate changes on cash and cash equivalents 5 (4)
Cash and cash equivalents at beginning of period 1,452 1,228 767
Cash and cash equivalents at end of period 1,667 1,452 1,414
3 months ended
Copyright © Infineon Technologies 2010. All rights reserved.
Financial Calendar and IR Contacts
Feb 17, 2011Annual Shareholder Meeting
Feb 01, 2011*Q1 FY11 Results
May 03, 2011*Q2 FY11 Results
Jul 28, 2011*Q3 FY11 Results
Nov 17, 2011*Q4 FY11 Results
* Preliminary Date
Ulrich Pelzer
Corporate Vice PresidentCorporate Development & Investor Relations
+49 89 234-26153
Joachim Binder
Senior Director, Investor Relations
+49 89 234-25649
Aleksandar Josic
Manager, Investor Relations
+49 89 234-83045
IR ContactsFinancial Calendar
16 November 2010 Page 31
Copyright © Infineon Technologies 2010. All rights reserved.
Disclaimer
This presentation was prepared as of November 16, 2010 and is current only as of that date.
This presentation includes forward-looking statements and assumptions about the future of Infineon‟s business and the industry in which we operate. These include statements and assumptions relating to general economic conditions, future developments in the world semiconductor market, our ability to manage our costs and to achieve our growth targets, the resolution of Qimonda‟s insolvency proceedings and the liabilities we may face as a result of Qimonda‟s insolvency, the successful closing of the sale of our WLS business to Intel, the benefits of research and development alliances and activities, our planned levels of future investment, the introduction of new technology at our facilities, our continuing ability to offer commercially viable products, and our expected or projected future results.
These forward-looking statements are subject to a number of uncertainties, such as broader economic developments, including the sustainability of recent improvements in the market environment; trends in demand and prices for semiconductors generally and for our products in particular, as well as for the end-products, such as automobiles and consumer electronics, that incorporate our products; the success of our development efforts, both alone and with partners; the success of our efforts to introduce new production processes at our facilities; the actions of competitors; the continued availability of adequate funds; any mergers, acquisitions or dispositions we may undertake; the outcome of antitrust investigations and litigation matters; and the resolution of Qimonda‟s insolvency proceedings; as well as the other factors mentioned in this presentation and those described in the “Risk Factors” section of our most recent annual report on Form 20-F on file with the U.S. Securities and Exchange Commission.
As a result, Infineon‟s actual results could differ materially from those contained in or suggested by these forward-looking statements. You are cautioned not to place undue reliance on these forward-looking statements. Infineon does not undertake any obligation to publicly update or revise any forward-looking statements in light of developments which differ from those anticipated.
16 November 2010 Page 32