Fourth quarter and full year 2020 result presentation
32
Fourth quarter and full year 2020 result presentation CEO Per Jørgen Weisethaunet CFO Per Kristian Reppe 10 February 2021, Trondheim, Norway
Transcript of Fourth quarter and full year 2020 result presentation

Fourth quarter and full year 2020 result presentation
CEO Per Jørgen Weisethaunet CFO Per Kristian Reppe
10 February 2021, Trondheim, Norway
These materials, prepared by NORBIT ASA (the "Company"), may contain statements about future events and expectations that are forward-looking statements. Any statement in these materials that is not a statement of historical fact including, without limitation, those regarding theCompany's financial position, business strategy, plans and objectives of management for future operations is a forward-looking statement thatinvolves known and unknown risks, uncertainties and other factors which may cause the actual results, performance or achievements of theCompany to be materially different from any future results, performance or achievements expressed or implied by such forward-lookingstatements. Such forward-looking statements are based on numerous assumptions regarding the Company's present and future businessstrategies and the environment in which the Company will operate in the future. Although management believes that the expectations reflectedin these forward-looking statements are reasonable, it can give no assurances that they will materialize or prove to be correct. Because thesestatements are based on assumptions or estimates and are subject to risks and uncertainties, the actual results or outcome could differmaterially from those set out in the forward-looking statements. The Company assumes no obligations to update the forward-looking statementscontained herein to reflect actual results, changes in assumptions or changes in factors affecting these statements.
This presentation does not constitute or form part of, and is not prepared or made in connection with, an offer or invitation to sell, or anysolicitation of any offer to subscribe for or purchase any securities and nothing contained herein shall form the basis of any contract orcommitment whatsoever. No reliance may be placed for any purposes whatsoever on the information contained in this presentation or on itscompleteness, accuracy or fairness. The information in this presentation is subject to verification, completion and change. The contents of thispresentation have not been independently verified. The Company's securities have not been and will not be registered under the US SecuritiesAct of 1933, as amended (the "US Securities Act"), and are offered and sold only outside the United States in accordance with an exemptionfrom registration provided by Regulation S of the US Securities Act. This presentation should not form the basis of any investment decision.Investors and prospective investors in securities of any issuer mentioned herein are required to make their own independent investigation andappraisal of the business and financial condition of such company and the nature of the securities.
Disclaimer
2

• Founded 1995• HQ in Trondheim, Norway• Manufacturing facilities in Selbu and Røros, Norway• Offices and Subsidiaries in 14 countries• Listed on Oslo Børs, ticker NORBIT
NORBIT is to be recognized as world class, enabling people to explore more
3
Victory awaits him who has everything in order. Luck people call it... Defeat is certain for him who has neglected to take necessary precaution in time. This is called bad luck”
Roald Amundsen 1912

Oceans is offering tailored technology solutions to global maritime markets
A global provider of tailored technology to carefully selected niches
Diversified and robust business model
Intelligent Traffic Systems (ITS) is offering tailored connectivity solutions for traffic
systems and truck applications
Product Innovation & Realization (PIR) is offering R&D services and contract
manufacturing to key customers
4

Strategic priorities to navigate through the pandemic
Strengthen platform for growth
Maintain financial robustness• Reduce use of consultants• Put new employments on hold• Deliver all customer orders• Scale staffing in production to activity
• All planned investments programs maintained• Broaden product offering through R&D /
innovation• Increase production capacity
• Continue to explore strategic opportunities
5

Fourth quarter 2020
▪ NORBIT succeeded in maintaining stable activity in a challenging environment caused by the pandemic
▪ Revenues of NOK 162 million
▪ EBITDA of NOK 20 million
Full year 2020
▪ Revenues of NOK 619 million, vs NOK 668 million in 2019
▪ EBITDA of NOK 93 million, 15% margin
▪ The Board proposes a dividend for fiscal year 2020 of NOK 0.30 per share
Stable activity during 2020
90
115105
128
158170
154
187
152 155 150162
6
21 2027
50
21
39 40
16
29 2820
Q3-18
7%
32%
19%
Q1-18 Q1-19
19%
11%
Q2-18
21%
Q4-18
19%
12%
Q3-20
25%
Q2-19 Q3-19
22%
Q4-19 Q1-20
19%
Q2-20
12%
Q4-20
Revenues EBITDA EBITDA margin (%)
Revenues and EBITDANOK million
6

Oceans

Fourth quarter 2020
▪ Revenues of NOK 74 million
▪ EBITDA margin of 21% for the quarter
▪ Moderate revenue decline despite a strong end to the quarter
▪ Less delivered to the aquaculture market compared to the corresponding period last year
▪ Announcement of the acquisition of the SeaDarQ Radar System
▪ Awarded contract for delivery of the SeaCOPEnvironmental Monitoring and Surveillance System
Full year 2020
▪ Revenues of NOK 267 million
▪ 7% revenue growth despite negative impact on sales activities from travel restrictions
▪ EBITDA margin of 22% for 2020
Oceans delivers growth also in 2020
Revenues and EBITDANOK million
28
54 5256
59 59
51
81
52
59
83
74
2
16 1621
17 1611
5
16
24
15
30%
Q4-18Q3-18
10%6%
Q1-18
29%
37%
Q2-18
29%
Q1-19
23%
28%
Q2-19 Q3-19
24%
Q4-19 Q1-20
27%
Q2-20
28%
Q3-20
21%
Q4-20
20
Revenues EBITDA EBITDA margin
8

✓ Shallow Water Bathymetry ✓ Pipeline & Cable Inspection Surveys ✓ Structure inspection eg. offshore wind, quay wall, bridges
✓ Pond, River and Estuary Surveys ✓ Harbor and Lake Surveys ✓ Coastal Surveys ✓ USV & UUV
Important milestone in 2020:Launch of WINGHEAD® - a new ultrahigh resolution sonar
9

▪ Strategy to add selected regional resellers with sufficient domain knowledge, demo capacity, relevant practical skills and a size where commission from sales of NORBIT Sonars has a meaningful impact
▪ Geohydrocean Services Sdn Bhdappointment of as official reseller in Malaysia
Adding carefully selected resellers
10

▪ The acquired SeaDarQ Radar System integrated into SeaCOP
▪ Awarded contract for delivery of the SeaCOPEnvironmental Monitoring and Surveillance System to European governmental customer
▪ System combining remote sensing technologies (radar, infrared cameras and sonars) with data fusion and artificial intelligence
▪ Targeting energy and shipbuilding companies, ports and harbour authorities, transportation companies etc
▪ Purpose to give improved situational awareness- Information and tools to increase efficiency
and reduce cost- Ensuring safety and integrity of people,
environment and marine assets
Environmental monitoring and Surveillance system - SeaCOP
11

NORBIT Oceans includes offering of tailored underwater cables
Utilize our global sales network to offer tailored underwater cables and assemblies
NORBIT Kabelpartner to be included in segment Oceans
12

DSRC solutions for satellite-based truck tolling
Connectivity devices for smart tachograph
Intelligent Traffic Systems (ITS)

Fourth quarter 2020
▪ Revenues still impacted by inventory build down at one larger customer
▪ Revenues up 82% from Q3 due to high sales of On-Board Units (OBUs)
▪ EBITDA margin of 23%
Full year 2020
▪ Revenues NOK 145 million, down from NOK 186 million in 2019
▪ EBITDA margin of 29% in 2020
Recent events
▪ Announced potential strategic European acquisition
▪ Entering the Italian market in partnership with DKV
Intelligent Traffic Systems (ITS) increased revenues on higher OBU volumes
14
Revenues and EBITDANOK million
11 1014
36
42
62
4745
38
22
40
-1
5 6
17 18
29
2017
13
4
9
49%
-12%
Q2-18Q1-18 Q3-18
2%
43%43%
Q4-18
47%
Q1-19
42%
Q2-20Q2-19
46%
Q4-20Q3-19 Q4-19
37%
Q1-20
33%
Q3-20
20%23%
5
0
Revenues EBITDA EBITDA margin

Asset Tracking/Monitoring Taking advantage of existing key competence within high-volume wireless low power devices
Strong competence and vast experience from : • RF & Microwave based wireless technology
• Customized integrated antennas
• Embedded Software
• Lower power devices
• Robotized high volume manufacturing
Strategy to grow a new subsegment based on selected IoT/5G niche applications (vehicle/asset tracking & monitoring)
15

▪ NORBIT is in advanced and exclusive negotiations regarding an acquisition of an undisclosed European technology company
▪ The target company has vast experience in the vehicle tracking market
▪ Well-established customer base in its home market
▪ Subscription based business model
▪ Preliminary enterprise value of EUR 14.5 million, based on an expected 2020 EBITDA of approx. EUR 2 million (margin > 35%)
▪ Expected closing end of Q1-21
▪ Attractive synergies where NORBIT´s capabilities can contribute to expand and broaden both the market footprint and the technology base of the target to fuel growth in Europe
European acquisition kickstarts strategy to broaden technology base for ITS
16
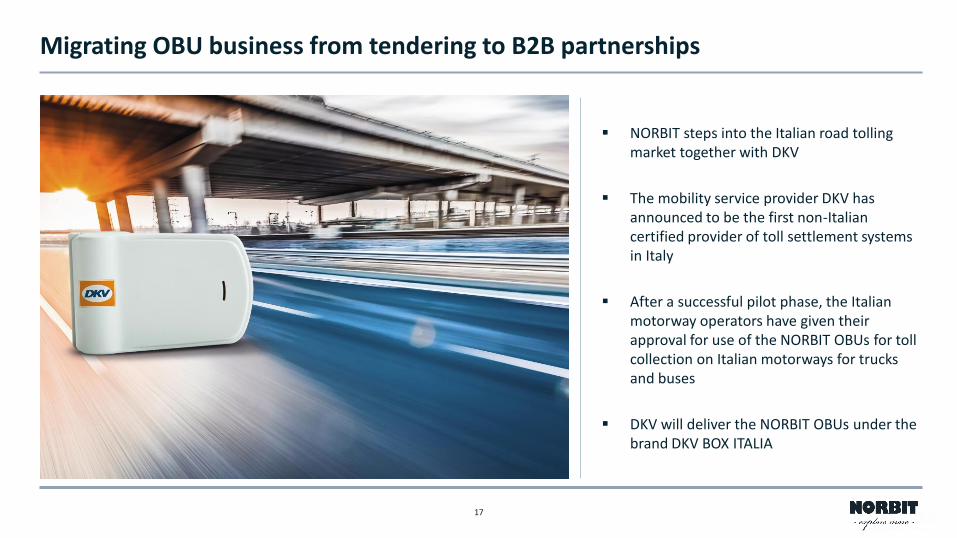
▪ NORBIT steps into the Italian road tolling market together with DKV
▪ The mobility service provider DKV has announced to be the first non-Italian certified provider of toll settlement systems in Italy
▪ After a successful pilot phase, the Italian motorway operators have given their approval for use of the NORBIT OBUs for toll collection on Italian motorways for trucks and buses
▪ DKV will deliver the NORBIT OBUs under the brand DKV BOX ITALIA
Migrating OBU business from tendering to B2B partnerships
17

Product Innovation & Realization (PIR)

Product Innovation & Realization on par with previous quarter
19
Revenues and EBITDANOK million
61 60
54
46
69
76
49
6763
57
5153
7 58
3
-2 0
9%
-3%
Q2-18
11%
Q4-20Q1-18 Q3-18
12%
23%
Q4-18
12%
Q1-19
13%
Q2-19 Q4-19
3%
Q3-19
5%
Q1-20
4%7
Q2-20
4%
Q3-20
-1%2
10
1 2
Revenues EBITDA marginEBITDA
Fourth quarter 2020
▪ Revenues of NOK 53 million in line with Q3
▪ EBITDA of NOK -0.4
Full year 2020
▪ Revenues of NOK 225 million down from NOK 260 million in 2019
▪ EBITDA margin of 1% in 2020
▪ Revenues impacted by reduces sales of contract manufacturing both towards Automotive Industry and other industrial clients

Expansion and modernization of the facilities
Røros:• Doubling of the floor area• More than doubling of the production capacity
Trondheim:• Established “Fast-track” center for rapid prototyping • Expansion of R&D test laboratories and assembly area
Selbu:• Standardized on same high speed assembly lines as Røros• New inventory robots
Røros
Trondheim Selbu
20

• Increasing demand for “Made in Europe/Norway“
• Production capacity significantly increased, enabling opportunities for growth in contract manufacturing
• Enhanced collaboration between in-house R&D and leading-edge manufacturing process capabilities
• Established “Fast-Track” center including 3D-printing and CNC milling for rapid prototyping and pilot-series
Established basis for growth and improved profitability in PIR going forward
21

Group financials

Fourth quarter of 2020
▪ Revenues of NOK 162.1 million, up 8% from Q3 2020, but down 13% from Q4 2019
o Sequential growth quarter-over-quarter in ITS and PIR
o All segments delivered lower revenues compared to Q4 2019
▪ Total expenses, excluding D&A, amounted to NOK 142.3 million versus NOK 146.3 million in Q4 2019 and NOK 121.8 million in the prior quarter
▪ EBITDA of NOK 19.8 million (12% margin) compared to NOK 40.2 million in Q4 2019 (22% margin)
▪ Net financial items of negative NOK 9.4 million primarily due to foreign exchange losses
▪ Net profit for the period of negative NOK 2.6 million
Financials – P&L
Amounts in NOK 000's Q4 2020 Q3 2020 Q4 2019 FY 2020 FY 2019
Revenues 162 110 149 966 186 467 618 798 668 176
Other gains and losses - - - - 10 865
Raw materials and change in inventories 78 065 69 113 87 092 292 670 304 495
Employee benefit expenses 44 586 37 198 41 153 155 595 161 650
Other operating expenses 19 621 15 484 18 039 77 062 63 147
EBITDA 19 838 28 170 40 183 93 471 149 749
Depreciation and amortization expenses 14 161 11 882 12 390 49 125 46 836
Operating profit / EBIT 5 677 16 288 27 793 44 346 102 913
Net financial items (9 364) 1 430 3 157 (9 524) (7 482)
Profit before tax (3 687) 17 718 30 950 34 822 95 432
Income tax expense 1 048 (4 154) (6 339) (7 422) (18 158)
Profit for the period (2 639) 13 564 24 611 27 400 77 274
23
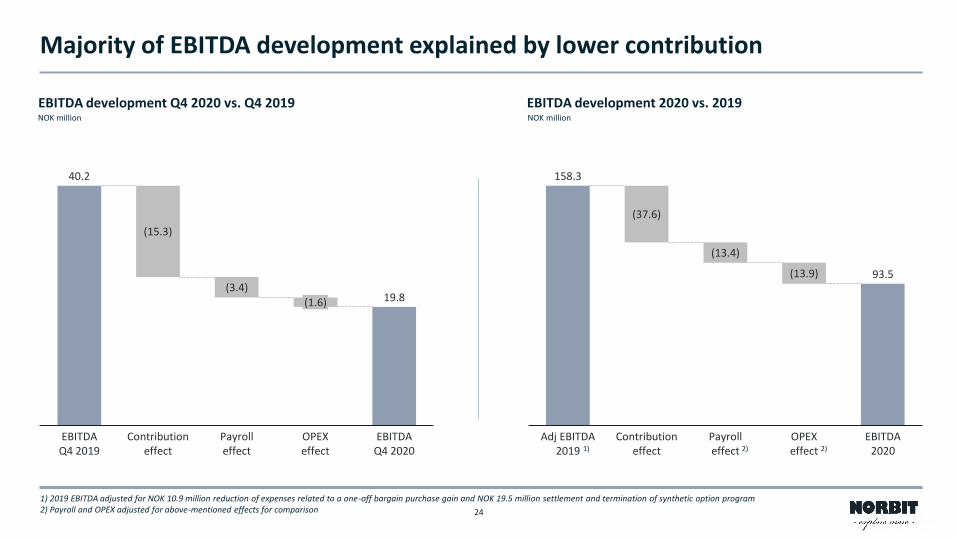
Majority of EBITDA development explained by lower contribution
40.2
19.8
EBITDA Q4 2020
EBITDA Q4 2019
Contribution effect
(15.3)
(3.4)
Payrolleffect
OPEXeffect
(1.6)
EBITDA development Q4 2020 vs. Q4 2019NOK million
158.3
93.5(13.9)
EBITDA2020
(13.4)
Adj EBITDA 2019
(37.6)
Payrolleffect
Contribution effect
OPEXeffect
EBITDA development 2020 vs. 2019NOK million
1) 2019 EBITDA adjusted for NOK 10.9 million reduction of expenses related to a one-off bargain purchase gain and NOK 19.5 million settlement and termination of synthetic option program2) Payroll and OPEX adjusted for above-mentioned effects for comparison
1) 2) 2)
24

ITS and PIR explaining lion’s share of Q4 EBITDA development
19.6
15.4
Contribution effect
EBITDA Q4 2019
Expense effect
(1.3)
(2.9)
EBITDA Q4 2020
Segment EBITDA development Q4 2020 vs. Q4 2019NOK million
20.3
9.0
1.5
(12.8)
EBITDA Q4 2019
Contribution effect
Expense effect
EBITDA Q4 2020
3.4
-0.42.9
(6.7)
EBITDA Q4 2019
Contribution effect
Expense effect
EBITDA Q4 2020
Oceans ITS PIR
25

A similar development observed throughout 2020
64.159.6
10.0
Contribution effect
EBITDA 2019 Expense effect
(14.5)
EBITDA 2020
Segment EBITDA development 2020 vs. 2019NOK million
83.1
42.5
4.7
Contribution effect
Expense effect
EBITDA 2020EBITDA 2019
(45.2)
22.6
2.3
EBITDA 2019 Contribution effect
(15.6)
(4.6)
Expense effect
EBITDA 2020
Oceans ITS PIR
26
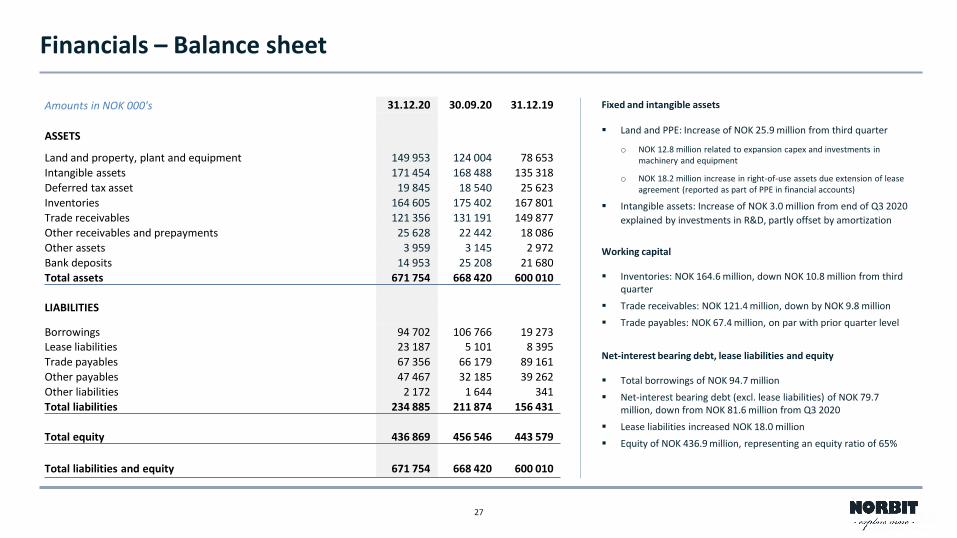
Fixed and intangible assets
▪ Land and PPE: Increase of NOK 25.9 million from third quarter
o NOK 12.8 million related to expansion capex and investments in machinery and equipment
o NOK 18.2 million increase in right-of-use assets due extension of lease agreement (reported as part of PPE in financial accounts)
▪ Intangible assets: Increase of NOK 3.0 million from end of Q3 2020
explained by investments in R&D, partly offset by amortization
Working capital
▪ Inventories: NOK 164.6 million, down NOK 10.8 million from third quarter
▪ Trade receivables: NOK 121.4 million, down by NOK 9.8 million
▪ Trade payables: NOK 67.4 million, on par with prior quarter level
Net-interest bearing debt, lease liabilities and equity
▪ Total borrowings of NOK 94.7 million
▪ Net-interest bearing debt (excl. lease liabilities) of NOK 79.7 million, down from NOK 81.6 million from Q3 2020
▪ Lease liabilities increased NOK 18.0 million
▪ Equity of NOK 436.9 million, representing an equity ratio of 65%
Financials – Balance sheet
Amounts in NOK 000's 31.12.20 30.09.20 31.12.19
ASSETS
Land and property, plant and equipment 149 953 124 004 78 653Intangible assets 171 454 168 488 135 318
Deferred tax asset 19 845 18 540 25 623
Inventories 164 605 175 402 167 801
Trade receivables 121 356 131 191 149 877
Other receivables and prepayments 25 628 22 442 18 086
Other assets 3 959 3 145 2 972
Bank deposits 14 953 25 208 21 680
Total assets 671 754 668 420 600 010
LIABILITIES
Borrowings 94 702 106 766 19 273Lease liabilities 23 187 5 101 8 395
Trade payables 67 356 66 179 89 161
Other payables 47 467 32 185 39 262
Other liabilities 2 172 1 644 341
Total liabilities 234 885 211 874 156 431
Total equity 436 869 456 546 443 579
Total liabilities and equity 671 754 668 420 600 010
27

Fourth quarter of 2020
▪ Operating cash flow of NOK 42.0 million
o Net decrease in working capital of NOK 33.0 million
▪ Investing activities generated cash outflow of NOK 22.3 million
o NOK 12.8 million related to PPE investments
o NOK 9.5 million investment in R&D
▪ Financing activities led to a cash outflow of NOK 29.9 million
o NOK 17.0 million in dividend paid
o NOK 12.9 million in repayment of debt and leases
▪ Solid liquidity position with NOK 199.9 million in undrawn committed credit facilities at 31 December
Financials – Cash Flow
Cash flow development fourth quarter 2020NOK million
1)
1) Including lease payments
25.2
15.0
19.8
33.0
Change in WC
Cash 30.09.2020
(17.0)
InvestmentsEBITDA Cash 31.12.2020
(22.3)
Dividend paid
(12.8)
Net change borrowings
(10.9)
FX & other items
28

Outlook

Outlook
• Sonar sales has started well in Q1-21
• Utilize on global market organization by broadening product portfolio
• Long term growth supported by WINGHEAD sonar and additional products under development
• Expect weak H1 2021, due to continued inventory build down at one large client and lower volumes of OBUs
• Migrating part of the OBU business to B2B business through strategic partnering
• Planned acquisition kicks off IoT based asset tracking and monitoring vertical
• Increasing demand for “Made in Europe / Made in Norway“
• Expect strong growth and margin improvement in Q1-21 compared to Q4-20
• Significant expansion of the production capacity forms basis for growth in contract manufacturing, where the outlook is favorable
• Increased risk of supply shortage in the electronic component market
30

EXPLORING IS FINDING OPPORTUNITIES WHERE OTHERS FIND LIMITS

Shareholder overview, updated 8 February 2021
# Investor # of shares %
1 VHF INVEST AS - founder Steffen Kirknes 8,686,495 15.30
2 PETORS AS - CEO Per Jørgen Weisethaunet 6,925,695 12.20
3 DRAUPNIR INVEST AS - family of founder Steffen Kirknes 5,702,949 10.04
4 ESMAR AS 3,832,286 6.75
4 EIDCO A/S 3,832,286 6.75
6 Taiga Investment Funds (through Morgan Stanley) 3,745,187 6.60
7 Handelsbanken Nordiska smabolag (through J.P. Morgan Bank) 3,696,135 6.51
8 ARCTIC FUNDS PLC 2,734,676 4.82
9 Citibank, N.A. 1,200,000 2.11
10 Danske Invest Norge Vekst 1,050,000 1.85
11 Nordea Bank Abp 726,066 1.28
12 Danske Bank A/S - MD Oceans Peter K. Eriksen 725,076 1.28
13 USEGI AS - CTO Arild Søraunet 721,989 1.27
14 T.D. VEEN AS 715,000 1.26
15 SONSTAD AS 685,822 1.21
16 Carnegie Investment Bank AB 627,216 1.10
17 Citibank, N.A. 525,000 0.92
18 Handelsbanken Mikrocap Norden (through J.P. Morgan Bank) 520,392 0.92
19 GH HOLDING AS 421,000 0.74
20 BERGEN KOMMUNALE PENSJONSKASSE 310,344 0.55
Total 20 largest shareholders 47,383,614 83.44
Other shareholders 9,403,304 16.56
Total 56,786,918 100.00
32