FOURTH QUARTER 2014 FINANCIAL RESULTS .../media/Files/T/Thehartford...FOURTH QUARTER 2014 FINANCIAL...
23
FOURTH QUARTER 2014 FINANCIAL RESULTS PRESENTATION The Hartford Financial Services Group, Inc. Investor Presentation February 2, 2015
Transcript of FOURTH QUARTER 2014 FINANCIAL RESULTS .../media/Files/T/Thehartford...FOURTH QUARTER 2014 FINANCIAL...

FOURTH QUARTER 2014 FINANCIAL RESULTS PRESENTATION
The Hartford Financial Services Group, Inc.
Investor Presentation
February 2, 2015

Copyright © 2015 by The Hartford. All rights reserved. No part of this document may be reproduced, published or posted without the permission of The Hartford.
Safe Harbor Statement
Certain statements made in this presentation should be considered forward-looking statements as defined in the Private Securities Litigation Reform Act of 1995. These include statements about The Hartford’s future results of operations. We caution investors that these forward-looking statements are not guarantees of future performance, and actual results may differ materially. Investors should consider the important risks and uncertainties that may cause actual results to differ, including those discussed in The Hartford’s news release issued on February 2, 2015, our Quarterly Reports on Form 10-Q, our 2013 Annual Report on Form 10-K, and other filings we make with the Securities and Exchange Commission. We assume no obligation to update this presentation, which speaks as of today’s date. The discussion in this presentation of The Hartford’s financial performance includes financial measures that are not derived from generally accepted accounting principles (GAAP). Information regarding these non-GAAP financial measures, including reconciliations to the most directly comparable GAAP financial measures, is provided in the news release issued on February 2, 2015 and The Hartford’s Investor Financial Supplement for fourth quarter 2014 which is available at the Investor Relations section of The Hartford’s website at http://ir.thehartford.com.
From time to time, The Hartford may use its website to disseminate material company information. Financial and other important information regarding The Hartford is routinely accessible through and posted on our website at http://ir.thehartford.com. In addition, you may automatically receive email alerts and other information about The Hartford when you enroll your email address by visiting the “Email Alerts” section at http://ir.thehartford.com.
2

Copyright © 2015 by The Hartford. All rights reserved. No part of this document may be reproduced, published or posted without the permission of The Hartford.
Fourth Quarter 2014 Key Financial Highlights
3
• Core EPS1,2 up 22% to $0.96; core earnings1 up 12% to $426 million ˗ Core EPS $0.95 excluding CATs3 below outlook and unfavorable PYD4
˗ Growth driven by improved P&C5 and Corporate results
BVPS and ROE • BVPS, ex-AOCI1,6, up 4% over 4Q13 to $40.71
• Core earnings ROE1,7 8.4%, up 1 point over 2013
P&C Underwriting
• P&C (Combined) CAY8 combined ratio, before CATs1, improved 3.8
points to 92.0 driven by Commercial and Personal Lines
Core Earnings
Capital Management
Talcott Runoff • Variable and fixed annuity contract counts down 13% and 18%,
respectively, since 4Q13
• Weighted average diluted shares outstanding declined 9% from 4Q13 ˗ Repurchased 7.7 million shares in the quarter for $300 million
˗ Completed ASR9 program in the quarter, taking delivery of an additional 2.7 million shares
Commercial Lines Pricing
• Standard Commercial renewal written price increases averaged 3%,
in-line with loss cost trends
1. Denotes financial measure not calculated based on generally accepted accounting principles (GAAP) 2. Earnings per diluted share 3. Catastrophes 4. Prior year development 5. Property &
Casualty 6. Book value per diluted share, excluding accumulated other comprehensive income 7. Return on equity 8. Current accident year 9. Accelerated share repurchase

Copyright © 2015 by The Hartford. All rights reserved. No part of this document may be reproduced, published or posted without the permission of The Hartford.
4Q14 core earnings per diluted share of $0.96, up 22% over 4Q13
Core Earnings (Loss) By Segment ($ in millions except per diluted share amounts) 4Q13 4Q14 Change 3
Commercial Lines $229 $251 10%
Personal Lines 49 65 33%
P&C Other Operations 22 - (100%)
Group Benefits 55 45 (18%)
Mutual Funds 20 27 35%
Sub-total $375 $388 3%
Talcott Resolution 99 98 (1%)
Corporate (92) (60) 35%
Core earnings1 $382 $426 12%
Net realized capital gains (losses) 1 11 (9) NM
Unlock charge, after-tax 1 13 NM
Restructuring and other (costs), after-tax (10) (17) (70%)
Income (loss) from disc. operations, after-tax (70) 37 NM
Pension settlement, after-tax - (83) NM
Net reinsurance gain on dispositions, after-tax - 15 NM
Net income $314 $382 22%
Core earnings per diluted share $0.79 $0.96 22%
Wtd. avg. diluted shares outstanding2 486.1 442.6 (9%)
• Core earnings increased 12%
from 4Q13 primarily due to
improved P&C and Corporate
results
• Core earnings per diluted share
were $0.96, up 22% over 4Q13
• Net income of $382 million
included an $83 million, after-tax,
pension settlement charge
• Weighted average diluted shares
outstanding decreased 9% due
to the company’s equity
repurchases
• 4Q14 last 12 months core
earnings ROE of 8.4%, up from
7.4% in 4Q13
4
1. Net realized capital gains (losses), after-tax and deferred acquisition
costs (DAC), excluded from core earnings
2. In millions
3. The Hartford defines increases or decreases greater than or equal to
200%, or changes from a net gain to a net loss position, or vice versa, as
“NM” or not meaningful
Copyright © 2015 by The Hartford. All rights reserved. No part of this document may be reproduced, published or posted without the permission of The Hartford.
5
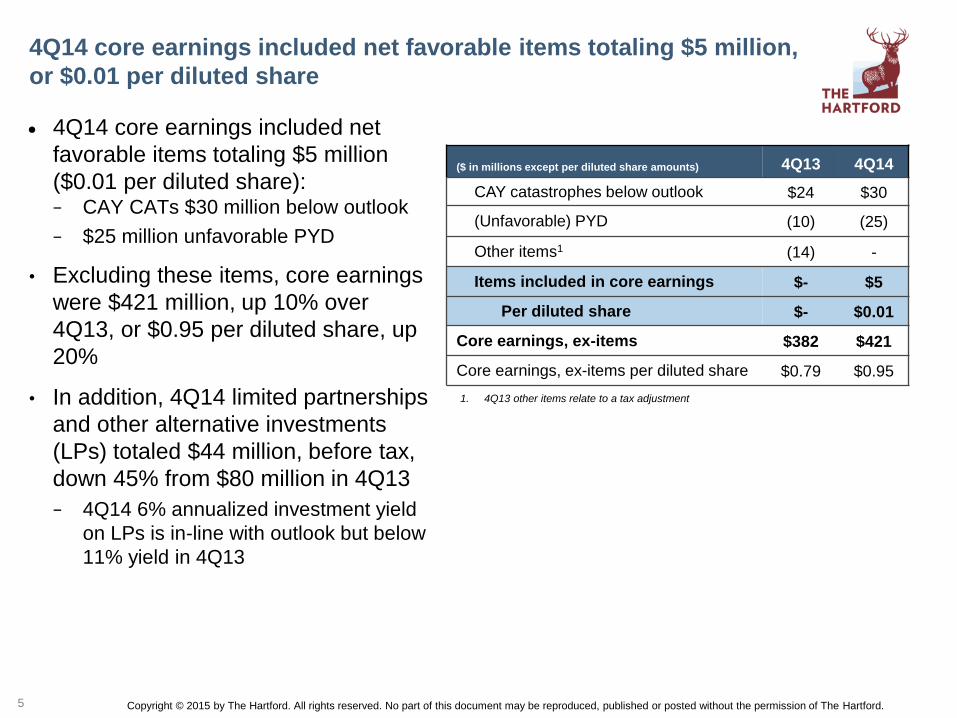
4Q14 core earnings included net favorable items totaling $5 million,
or $0.01 per diluted share
4Q14 core earnings included net
favorable items totaling $5 million
($0.01 per diluted share): − CAY CATs $30 million below outlook
− $25 million unfavorable PYD
• Excluding these items, core earnings
were $421 million, up 10% over
4Q13, or $0.95 per diluted share, up
20%
• In addition, 4Q14 limited partnerships
and other alternative investments
(LPs) totaled $44 million, before tax,
down 45% from $80 million in 4Q13
− 4Q14 6% annualized investment yield
on LPs is in-line with outlook but below
11% yield in 4Q13
($ in millions except per diluted share amounts) 4Q13 4Q14
CAY catastrophes below outlook $24 $30
(Unfavorable) PYD (10) (25)
Other items1 (14) -
Items included in core earnings $- $5
Per diluted share $- $0.01
Core earnings, ex-items $382 $421
Core earnings, ex-items per diluted share $0.79 $0.95
5
1. 4Q13 other items relate to a tax adjustment

Copyright © 2015 by The Hartford. All rights reserved. No part of this document may be reproduced, published or posted without the permission of The Hartford.
P&C (Combined) Written Premiums
($ in millions)
4Q14 P&C (Combined)1 top line growth and margin improvement
continues
6
$1,463 $1,669 $1,571 $1,583 $1,558
$886 $927 $1,003 $1,019 $912
4Q13 1Q14 2Q14 3Q14 4Q14
Commercial Lines Personal Lines
$2,603 $2,349
$2,597 $2,574 $2,470
P&C (Combined) Combined Ratio Breakdown
64.7 61.7 62.4 61.8 61.0
31.1 27.9 30.2 30.1 31.0
1.7 1.9
17.7 1.2 1.8
4Q13 1Q14 2Q14 3Q14 4Q14Total Losses and LAE Before CATs and PYD Expenses CATs and PYD
91.4 97.5 110.4
93.0 93.8
• Written premiums rose 5% over 4Q13
− 6% growth in Commercial Lines
− 3% growth in Personal Lines
• P&C (Combined) core earnings rose 5%
to $316 million from $300 million in 4Q13
driven by improved CAY underwriting
results
• Combined ratio of 93.8 was 3.7 points
better than 4Q13 due to improved loss
and loss adjustment expense (LAE) ratio
• CAY combined ratio, before CATs, of 92.0
improved 3.8 points from 4Q13
− Both Commercial Lines and Personal Lines
CAY combined ratio, before CATs, improved
over 4Q13
1. P&C (Combined) consists of the Commercial Lines, Personal Lines and P&C Other segments
2. 1Q14 expense ratio includes 2.0 point benefit related to NY State Workers’ Compensation Board assessments (NY Assessments)
3. Expense ratio includes policyholder dividends
6
2
3
Copyright © 2015 by The Hartford. All rights reserved. No part of this document may be reproduced, published or posted without the permission of The Hartford.
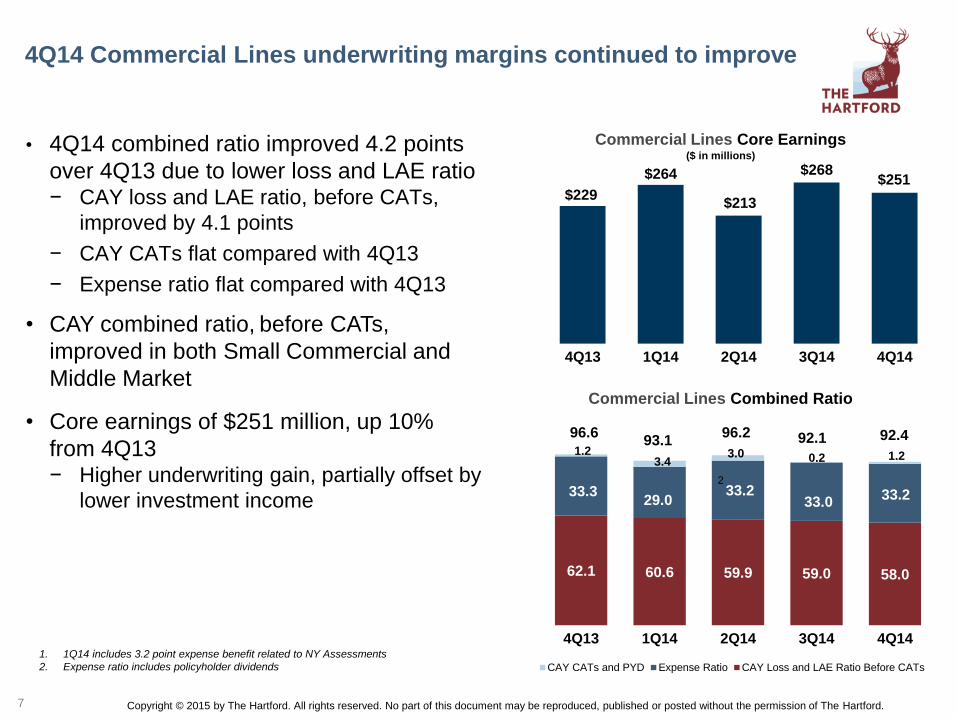
4Q14 Commercial Lines underwriting margins continued to improve
7
• 4Q14 combined ratio improved 4.2 points
over 4Q13 due to lower loss and LAE ratio − CAY loss and LAE ratio, before CATs,
improved by 4.1 points
− CAY CATs flat compared with 4Q13
− Expense ratio flat compared with 4Q13
• CAY combined ratio, before CATs,
improved in both Small Commercial and
Middle Market
• Core earnings of $251 million, up 10%
from 4Q13 − Higher underwriting gain, partially offset by
lower investment income
Commercial Lines Combined Ratio
62.1 60.6 59.9 59.0 58.0
33.3 29.0
33.2 33.0
33.2
1.2 3.4
3.0 0.2 1.2
4Q13 1Q14 2Q14 3Q14 4Q14
CAY CATs and PYD Expense Ratio CAY Loss and LAE Ratio Before CATs
96.6 93.1
96.2 92.1 92.4
1. 1Q14 includes 3.2 point expense benefit related to NY Assessments
2. Expense ratio includes policyholder dividends
1
2
$229
$264
$213
$268 $251
4Q13 1Q14 2Q14 3Q14 4Q14
Commercial Lines Core Earnings
($ in millions)

Copyright © 2015 by The Hartford. All rights reserved. No part of this document may be reproduced, published or posted without the permission of The Hartford.
Commercial Lines written premium grew 6% with strong
retention and new business
1. Programs written premiums were negatively impacted by underwriting actions to
reposition the business and the exit from unprofitable programs. The company ceased
writing all transportation programs effective Jan. 1, 2014
2. Standard Commercial is comprised of Small Commercial and certain Middle Market lines
of business
3. Renewal written price statistics are subject to change from period to period, based on a
number of factors, including changes in actuarial estimates and the effect of subsequent
cancellations and non-renewals on rate achieved, and modifications made to better reflect
ultimate pricing achieved
• Written premiums rose 6% over 4Q13; up
7% excluding programs1 − Small Commercial rose 5%
− Middle Market rose 6%, 7% excluding programs
− Specialty Commercial premiums increased 13%,
driven by 29% growth in National Accounts
• Renewal written price increases averaged
3% in Standard Commercial2, in line with
loss cost trends
− More competitive pressure in Middle Market
workers’ compensation
− Commercial auto remains highest in rate
increase
$715 $865 $833 $791 $754
$568 $572 $537 $583 $601
$173
$223 $192 $201 $195
4Q13 1Q14 2Q14 3Q14 4Q14
Small Commercial Middle Market Specialty Commercial
$1,583 $1,463
$1,669 $1,571 $1,558
Commercial Lines Written Premiums
($ in millions)
7%
6%
5% 5%
3%
4Q13 1Q14 2Q14 3Q14 4Q14
Standard Commercial1 Renewal Written Pricing3
8

Copyright © 2015 by The Hartford. All rights reserved. No part of this document may be reproduced, published or posted without the permission of The Hartford.
• Written premiums increased 5% over
4Q13 − Renewal written price increases averaged
3%
− New business premium totaled $122
million, up 10% for the third consecutive
quarter of double-digit growth
− Policy count retention increased to 85%,
up 3 points
• Small Commercial delivered outstanding
underwriting results in 4Q14 − Combined ratio improved 1.6 points over
4Q13 to 86.1 due to improved CAY results
and lower PYD
− CAY combined ratio, before CATs, of 86.8
improved 1.1 points from 4Q13, reflecting
strong margins in workers’ compensation
Small Commercial: 4Q14 results driven by sustained pricing and
underwriting initiatives
9
9
1. 1Q14 expense ratio includes 3.3 point benefit related to NY Assessments
87.9 85.9 87.6 87.5 86.8
1.9
3.8 0.9
4Q13 1Q14 2Q14 3Q14 4Q14
CATs and PYD CAY Combined Ratio Before CATs
87.7 86.1 87.8
91.4 88.4
(0.2) (0.7)
Small Commercial Combined Ratio
$111
$131 $140
$128 $122
82% 83% 84% 84% 85%
4Q13 1Q14 2Q14 3Q14 4Q14New Business Retention
Small Commercial Written Premiums & Retention ($ in millions)
$754 $715
$865 $833 $791
1
1

Copyright © 2015 by The Hartford. All rights reserved. No part of this document may be reproduced, published or posted without the permission of The Hartford.
• Written premiums rose 6% over 4Q13, 7%
excluding programs
− Renewal written price increases averaged 3%
− New business premium of $131 million, up
30% driven by strong growth in workers’
compensation, particularly in large accounts
− Policy count retention of 80%, up 1 point
• Margins continue to improve
− Combined ratio improved 4.8 points to 97.8
due to improved CAY underwriting results
− CAY combined ratio, before CATs, improved
5.0 points to 94.7, reflecting an improved
workers’ compensation loss and LAE ratio
• Facing increased competition in Middle
Markets, particularly in the workers’
compensation and property lines
• During 4Q14, realigned certain business
lines between Middle Market and Specialty
Commercial2
Middle Market: Strong top line growth and improved margins
10
10
1. 1Q14 expense ratio includes 2.6 point benefit related to NY Assessments 2. Underwriting results for programs and livestock business are now reported in
Middle Market instead of Specialty Commercial, and underwriting results for bond are now reported in Specialty Commercial instead of Middle Market
Middle Market Combined Ratio
99.7 92.2 97.6 93.5 94.7
2.9 6.6 2.2 0.2 3.1
4Q13 1Q14 2Q14 3Q14 4Q14
CATs and PYD CAY Combined Ratio Before CATs
102.6
$101 $110 $110
$107 $131
79% 81% 80% 80% 80%
4Q13 1Q14 2Q14 3Q14 4Q14New Business Retention
Middle Market Written Premiums & Retention ($ in millions)
$583 $568 $572 $537
$601
98.8
1
1 99.8 93.7 97.8
Copyright © 2015 by The Hartford. All rights reserved. No part of this document may be reproduced, published or posted without the permission of The Hartford.
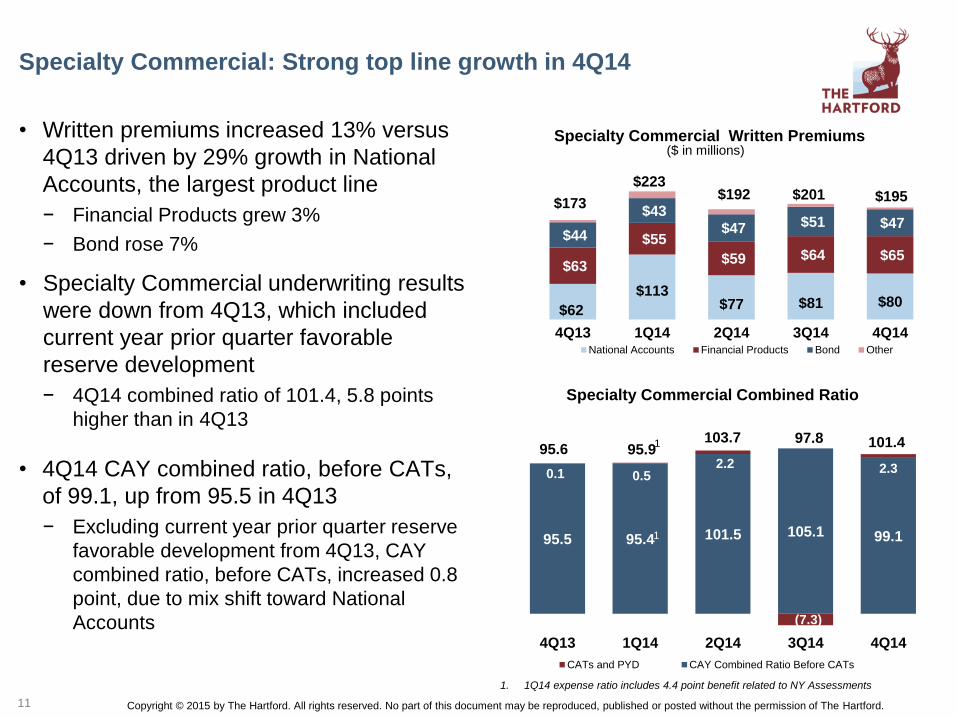
• Written premiums increased 13% versus
4Q13 driven by 29% growth in National
Accounts, the largest product line
− Financial Products grew 3%
− Bond rose 7%
• Specialty Commercial underwriting results
were down from 4Q13, which included
current year prior quarter favorable
reserve development
− 4Q14 combined ratio of 101.4, 5.8 points
higher than in 4Q13
• 4Q14 CAY combined ratio, before CATs,
of 99.1, up from 95.5 in 4Q13
− Excluding current year prior quarter reserve
favorable development from 4Q13, CAY
combined ratio, before CATs, increased 0.8
point, due to mix shift toward National
Accounts
11
$62
$113 $77 $81 $80
$63
$55
$59 $64 $65
$44
$43
$47 $51 $47
4Q13 1Q14 2Q14 3Q14 4Q14National Accounts Financial Products Bond Other
Specialty Commercial: Strong top line growth in 4Q14
11
Specialty Commercial Written Premiums
($ in millions)
Specialty Commercial Combined Ratio
95.5 95.4 101.5 105.1 99.1
0.1 0.5 2.2
(7.3)
2.3
4Q13 1Q14 2Q14 3Q14 4Q14
CATs and PYD CAY Combined Ratio Before CATs
95.6 95.9 103.7 97.8 101.4
$173
$223
1. 1Q14 expense ratio includes 4.4 point benefit related to NY Assessments
1
1
$192 $201 $195
Copyright © 2015 by The Hartford. All rights reserved. No part of this document may be reproduced, published or posted without the permission of The Hartford.
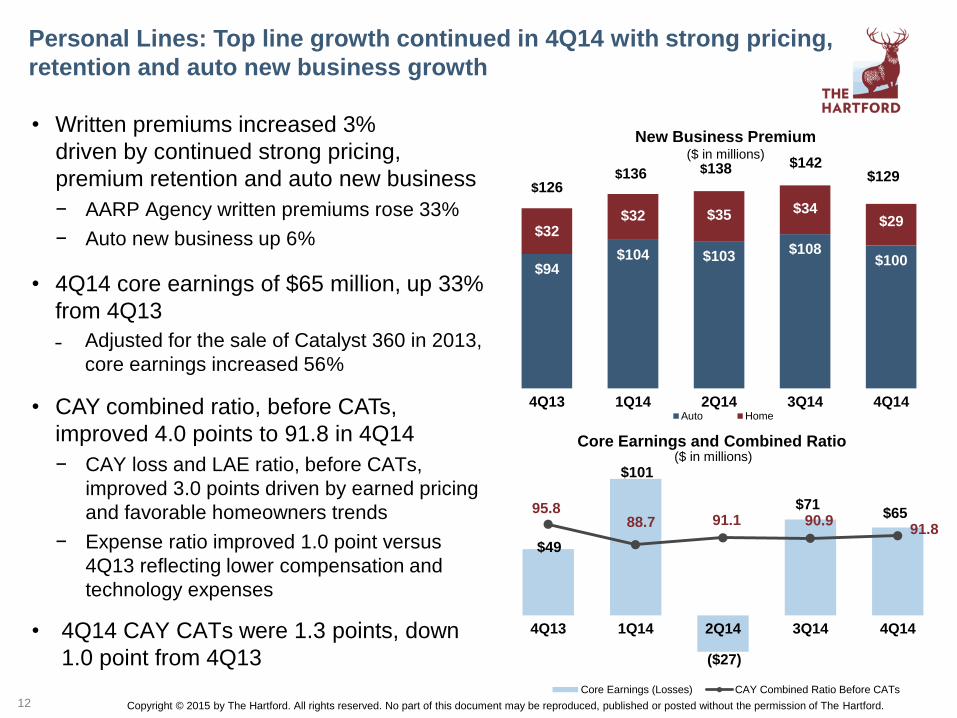
Personal Lines: Top line growth continued in 4Q14 with strong pricing,
retention and auto new business growth
• Written premiums increased 3%
driven by continued strong pricing,
premium retention and auto new business
− AARP Agency written premiums rose 33%
− Auto new business up 6%
• 4Q14 core earnings of $65 million, up 33%
from 4Q13
˗ Adjusted for the sale of Catalyst 360 in 2013,
core earnings increased 56%
• CAY combined ratio, before CATs,
improved 4.0 points to 91.8 in 4Q14
− CAY loss and LAE ratio, before CATs,
improved 3.0 points driven by earned pricing
and favorable homeowners trends
− Expense ratio improved 1.0 point versus
4Q13 reflecting lower compensation and
technology expenses
• 4Q14 CAY CATs were 1.3 points, down
1.0 point from 4Q13
12
Core Earnings and Combined Ratio
($ in millions)
$49
$101
($27)
$71 $65 95.8
88.7 91.1 90.9 91.8
4Q13 1Q14 2Q14 3Q14 4Q14
Core Earnings (Losses) CAY Combined Ratio Before CATs
$94 $104 $103
$108 $100
$32 $32 $35 $34
$29
4Q13 1Q14 2Q14 3Q14 4Q14Auto Home
New Business Premium ($ in millions)
$126 $136 $138 $142
$129

Copyright © 2015 by The Hartford. All rights reserved. No part of this document may be reproduced, published or posted without the permission of The Hartford.
Personal Lines: Auto written premiums up 3% in 4Q14
13
1. Before CATs and PYD
• Auto written premiums increased 3%
over 4Q13 due to new business, strong
retention and renewal written price
increases
− New business premium rose 6%
− Policy and premium retention of 84% and
87%, respectively
− Renewal written price increases averaged
6%, up from 5% in 3Q14 and 4Q13
• CAY auto combined ratio, before CATs,
improved 2.4 points to 102.4 in 4Q14
reflecting:
− Earned pricing and favorable liability
frequency trends offsetting moderate
severity trends
− Lower expense ratio
Auto Combined Ratio1
104.8
92.8 96.0 97.0
102.4
4Q13 1Q14 2Q14 3Q14 4Q14
5% 5% 5% 5%
6%
86% 87% 86% 85% 84%
4Q13 1Q14 2Q14 3Q14 4Q14Renewal Written Price Increases Policy Count Retention
Auto Renewal Written Price Increases and
Policy Count Retention
Copyright © 2015 by The Hartford. All rights reserved. No part of this document may be reproduced, published or posted without the permission of The Hartford.
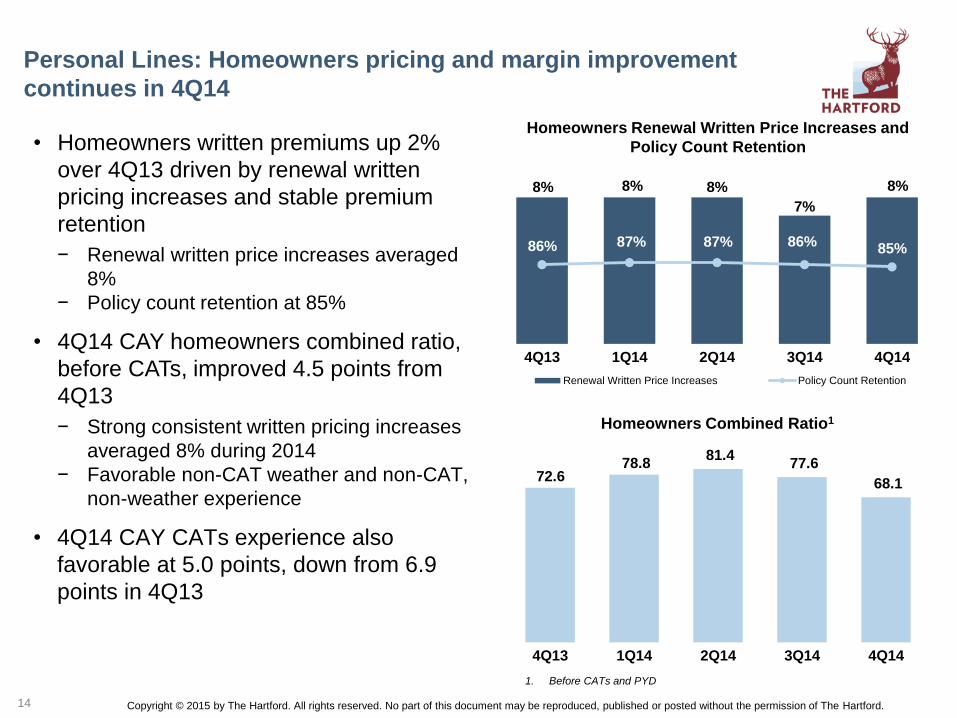
Personal Lines: Homeowners pricing and margin improvement
continues in 4Q14
1. Before CATs and PYD
8% 8% 8%
7%
8%
86% 87% 87% 86% 85%
4Q13 1Q14 2Q14 3Q14 4Q14
Renewal Written Price Increases Policy Count Retention
Homeowners Renewal Written Price Increases and
Policy Count Retention
72.6 78.8
81.4 77.6
68.1
4Q13 1Q14 2Q14 3Q14 4Q14
Homeowners Combined Ratio1
• Homeowners written premiums up 2%
over 4Q13 driven by renewal written
pricing increases and stable premium
retention
− Renewal written price increases averaged
8%
− Policy count retention at 85%
• 4Q14 CAY homeowners combined ratio,
before CATs, improved 4.5 points from
4Q13
− Strong consistent written pricing increases
averaged 8% during 2014
− Favorable non-CAT weather and non-CAT,
non-weather experience
• 4Q14 CAY CATs experience also
favorable at 5.0 points, down from 6.9
points in 4Q13
14

Copyright © 2015 by The Hartford. All rights reserved. No part of this document may be reproduced, published or posted without the permission of The Hartford.
$756 $732 $742 $731 $737
74.7% 77.6% 77.5% 78.3% 76.0%
4Q13 1Q14 2Q14 3Q14 4Q14Premiums Loss Ratio
Group Benefits: After-tax core earnings margin 5.3% in 4Q14
Core Earnings & After-Tax Margin1 ($ in millions)
1. Denotes a financial measure not calculated based on GAAP
2. Excludes A-FI and buyout premiums
Fully Insured Ongoing Premiums2 & Loss Ratio2 ($ in millions)
15
• Core earnings declined from 4Q13 due to lower
disability results and LP income, partially offset
by favorable life results
- 5.3% after-tax core earnings margin versus 5.9%
in 4Q13
• 4Q14 loss ratio, excluding A-FI, increased 1.3
points from 4Q13 to 76.0% due to less
favorable group disability results
• Group life loss ratio, excluding A-FI, improved
2.8 points to 71.8% on favorable mortality
• Group disability loss ratio increased 6.2 points
to 81.9% - 4Q13 results benefited from improved recovery
rates on claims incurred in prior policy years
- Disability recovery rates remained strong in 4Q14
• Fully insured ongoing premiums declined 3%
from 4Q13, excluding A-FI
15
$55
$45
$52
$38
$45
5.9%
5.1%
6.0%
4.5%
5.3%
4Q13 1Q14 2Q14 3Q14 4Q14Core earnings After-Tax Margin

Copyright © 2015 by The Hartford. All rights reserved. No part of this document may be reproduced, published or posted without the permission of The Hartford.
Mutual Fund Sales & Net Flows
($ in millions)
Mutual Funds: Continued strong sales
and fund performance
16
• Core earnings of $27 million, up 35% from 4Q13
driven by a state income tax benefit as well as by
higher fee income due to an increase in Mutual
Fund AUM
• Mutual Fund2 assets under management (AUM),
which excludes Talcott Resolution AUM3,
increased 3% from 4Q13 to $73.0 billion − Talcott Resolution AUM declined 20%
• Mutual Fund sales remained strong at $3.9
billion, up 10% compared with 4Q13
• Mutual Fund net outflows of $0.4 billion,
excluding a planned $0.7 billion AUM transfer
within the company, versus net outflows of $0.4
billion in 4Q13
• Solid overall fund performance as 43%, 63% and
64% of funds beat peers on a 1-, 3- and 5-year basis4,
respectively
1. Core earnings $ in millions and AUM $ in billions. AUM as of end of period.
2. Mutual funds sold through retail, bank trust, registered investment advisor and 529 plan channels
3. Consists of mutual fund assets held in separate accounts supporting variable insurance and investment products
4. Hartford Mutual Funds (HMF) only on Morningstar net of fees basis
$3,555 $3,692 $3,910 $3,753 $3,894
($3,997) ($3,674) ($4,348)
($3,660)
($4,954)
($442) $18
($438) $93
($1,060)
Sales Redemptions Net Flows
$25.8 $25.0 $24.5 $22.9 $20.6
$70.9 $73.3
$74.3 $73.3 $73.0
$20 $21 $21 $22
$27
4Q13 1Q14 2Q14 3Q14 4Q14
Talcott Resolution AUM Mutual Funds AUM
Mutual Funds Segment Core Earnings & AUM1
4Q13 2Q14 1Q14 4Q14 3Q14

Copyright © 2015 by The Hartford. All rights reserved. No part of this document may be reproduced, published or posted without the permission of The Hartford.
Talcott Resolution: Variable and fixed annuity contract counts declined
13% and 18%, respectively, since Dec. 31, 2013
17
• Core earnings of $98 million, almost flat with
4Q13
− Lower fee income due to variable annuity (VA) run-
off partially offset by lower expenses, including lower
expenses related to contract holder initiatives
• VA contract counts decreased 3% during 4Q14
and 13% since Dec. 31, 2013
• Fixed annuity contract counts decreased 3%
during 4Q14 and 18% since Dec. 31, 2013
• Institutional covered lives declined 1% during
4Q14 and 3% since Dec. 31, 2013
• Guaranteed minimum withdrawal benefit
(GMWB) moneyness remained favorable
− 94% of GMWB contracts out-of-the-money; for those
contracts in-the-money, average moneyness of 11%
in 4Q14
• 91% of VA block beyond surrender charge period at
Dec. 31, 2014
1. Individual Annuity consists of U.S. annuity products for individuals, including variable, fixed and payout
2. Other consists of PPLI, residual income or tax benefits associated with the reinsurance of the policyholder and separate account liabilities of the Retirement Plans, Individual Life
businesses and International discontinued operations.
774 747 721 694 674
170 163
151 143
139
4Q13 1Q14 2Q14 3Q14 4Q14Variable Annuity Fixed Annuity and Payout
944 910
872 837
Individual Annuity Contract Counts (in thousands)
813
(14%)
$81 $89 $84 $83 $80
$18 $23
$17 $39
$18
4Q13 1Q14 2Q14 3Q14 4Q14Individual Annuity Institutional and Other
$98 $99
$112 $101
$122
Talcott Resolution Core Earnings
($ in millions)
1 2

Copyright © 2015 by The Hartford. All rights reserved. No part of this document may be reproduced, published or posted without the permission of The Hartford.
U.S. government/government agencies
13%AAA12%
AA17%
A28%
BBB24%
BB & below6%
36%
17% 15%
12%
7%
4%
4% 3% 2%
$76.3 billion
High quality and well-diversified investment portfolio
18
• Fixed maturities portfolio weighted
average credit rating of “A+” as of
Dec. 31, 2014, up from “A” at Dec.
31, 2013 – 5.7% rated below investment grade as
of Dec. 31, 2014, down from 6.3% as
of Dec. 31, 2013
• Duration of 5.3 years as of Dec. 31,
2014 versus 5.2 as of Dec. 31,
2013
• Energy exposure4 totals $3.5 billion
in book value
˗ Generally high quality and well-
diversified
˗ Have reduced exposure selectively
and will continue to manage it
proactively
1. Includes high yield, emerging market and private placement securities
2. Includes commercial mortgage backed securities, collateralized debt obligations, and residential mortgage backed securities
3. Includes emerging market securities
4. Includes direct investments in energy companies, as well as direct investments in entities that have meaningful exposure to the energy sector, including sovereigns and government
agencies
5. Average credit ratings are based on availability, and are the midpoint of the applicable ratings among Moody’s, S&P, Fitch and Morningstar. If no rating is available from a rating
agency, then an internally developed rating is used
Investment Portfolio Composition (Excluding equity securities, trading)
As of Dec. 31, 2014
Fixed Maturities by Credit Rating5
$59.4 Billion – Weighted Average Rating A+
Corporate 1
Municipal
Real estate backed securities 2
US government/government agency & short-term
Mortgage loans
Limited partnerships
Policy loans, equity and other
Asset-backed securities
Foreign government/government agency 3
Copyright © 2015 by The Hartford. All rights reserved. No part of this document may be reproduced, published or posted without the permission of The Hartford.
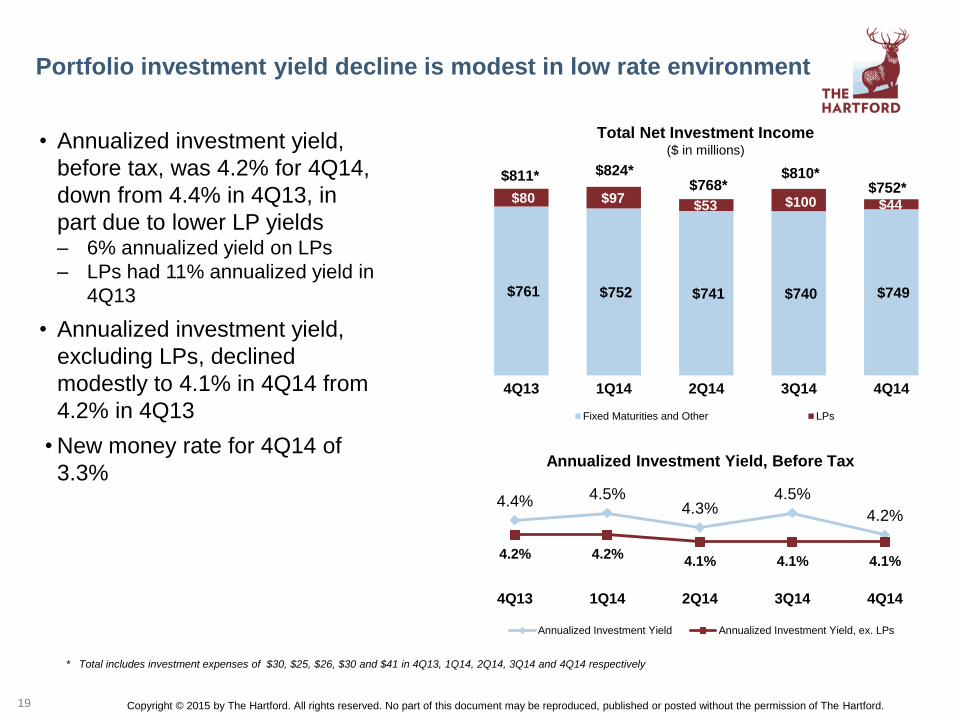
Portfolio investment yield decline is modest in low rate environment
19
* Total includes investment expenses of $30, $25, $26, $30 and $41 in 4Q13, 1Q14, 2Q14, 3Q14 and 4Q14 respectively
• Annualized investment yield,
before tax, was 4.2% for 4Q14,
down from 4.4% in 4Q13, in
part due to lower LP yields – 6% annualized yield on LPs
– LPs had 11% annualized yield in
4Q13
• Annualized investment yield,
excluding LPs, declined
modestly to 4.1% in 4Q14 from
4.2% in 4Q13
• New money rate for 4Q14 of
3.3%
$761 $752 $741 $740 $749
$80 $97 $53 $100 $44
4Q13 1Q14 2Q14 3Q14 4Q14
Fixed Maturities and Other LPs
Total Net Investment Income
($ in millions)
$811* $824* $768*
$810* $752*
4.4% 4.5% 4.3%
4.5%
4.2%
4.2% 4.2% 4.1% 4.1% 4.1%
4Q13 1Q14 2Q14 3Q14 4Q14
Annualized Investment Yield Annualized Investment Yield, ex. LPs
Annualized Investment Yield, Before Tax
Copyright © 2015 by The Hartford. All rights reserved. No part of this document may be reproduced, published or posted without the permission of The Hartford.
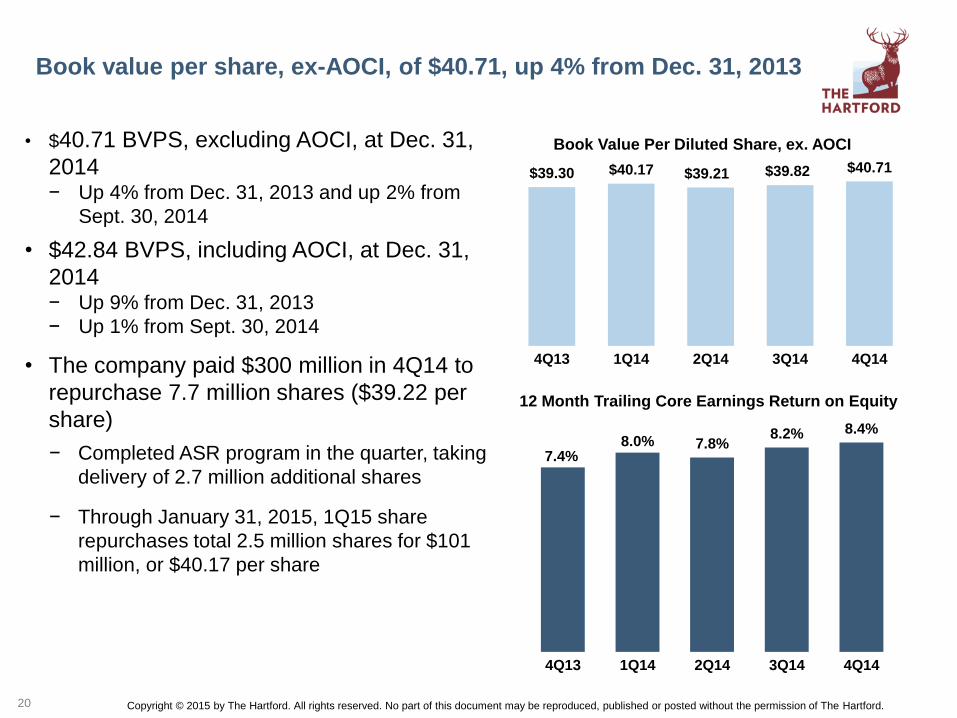
Book value per share, ex-AOCI, of $40.71, up 4% from Dec. 31, 2013
20
• $40.71 BVPS, excluding AOCI, at Dec. 31,
2014 − Up 4% from Dec. 31, 2013 and up 2% from
Sept. 30, 2014
• $42.84 BVPS, including AOCI, at Dec. 31,
2014 − Up 9% from Dec. 31, 2013
− Up 1% from Sept. 30, 2014
• The company paid $300 million in 4Q14 to
repurchase 7.7 million shares ($39.22 per
share)
− Completed ASR program in the quarter, taking
delivery of 2.7 million additional shares
− Through January 31, 2015, 1Q15 share
repurchases total 2.5 million shares for $101
million, or $40.17 per share
Book Value Per Diluted Share, ex. AOCI
$39.30 $40.17 $39.21 $39.82 $40.71
4Q13 1Q14 2Q14 3Q14 4Q14
7.4% 8.0% 7.8%
8.2% 8.4%
4Q13 1Q14 2Q14 3Q14 4Q14
12 Month Trailing Core Earnings Return on Equity
APPENDIX
Copyright © 2015 by The Hartford. All rights reserved. No part of this document may be reproduced, published or posted without the permission of The Hartford.
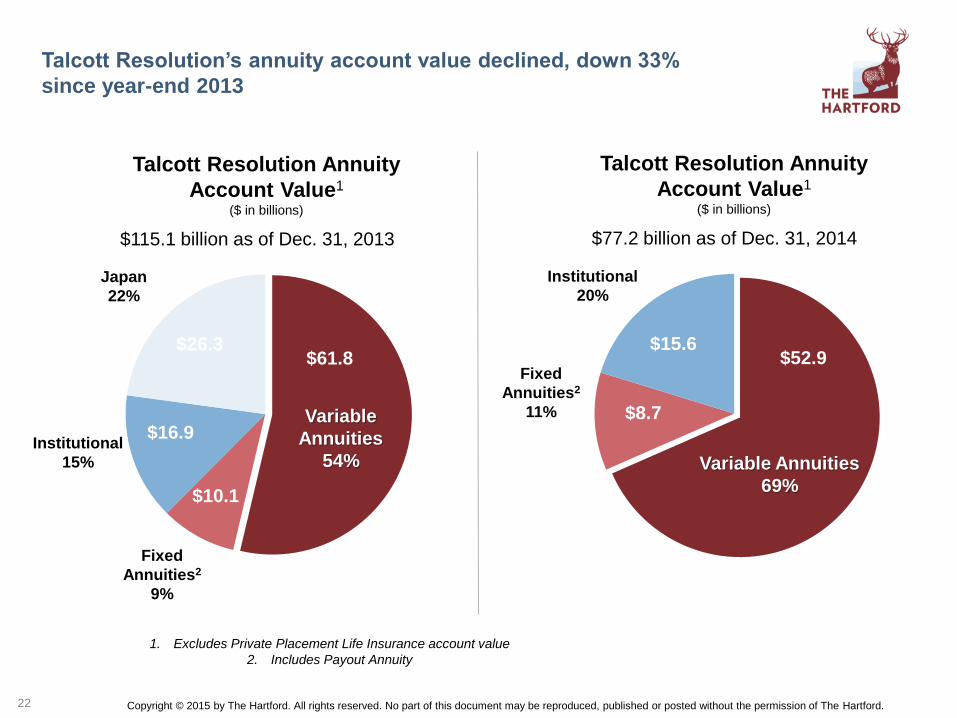
Talcott Resolution’s annuity account value declined, down 33%
since year-end 2013
22
Talcott Resolution Annuity
Account Value1
($ in billions)
$115.1 billion as of Dec. 31, 2013
Fixed
Annuities2
9%
Japan
22%
Variable
Annuities
54%
1. Excludes Private Placement Life Insurance account value
2. Includes Payout Annuity
$77.2 billion as of Dec. 31, 2014
Fixed
Annuities2
11%
Institutional
20%
Variable Annuities
69%
Institutional
15%
$26.3
Talcott Resolution Annuity
Account Value1
($ in billions)
$16.9
$10.1
$61.8 $15.6
$8.7
$52.9
Copyright © 2015 by The Hartford. All rights reserved. No part of this document may be reproduced, published or posted without the permission of The Hartford. 23
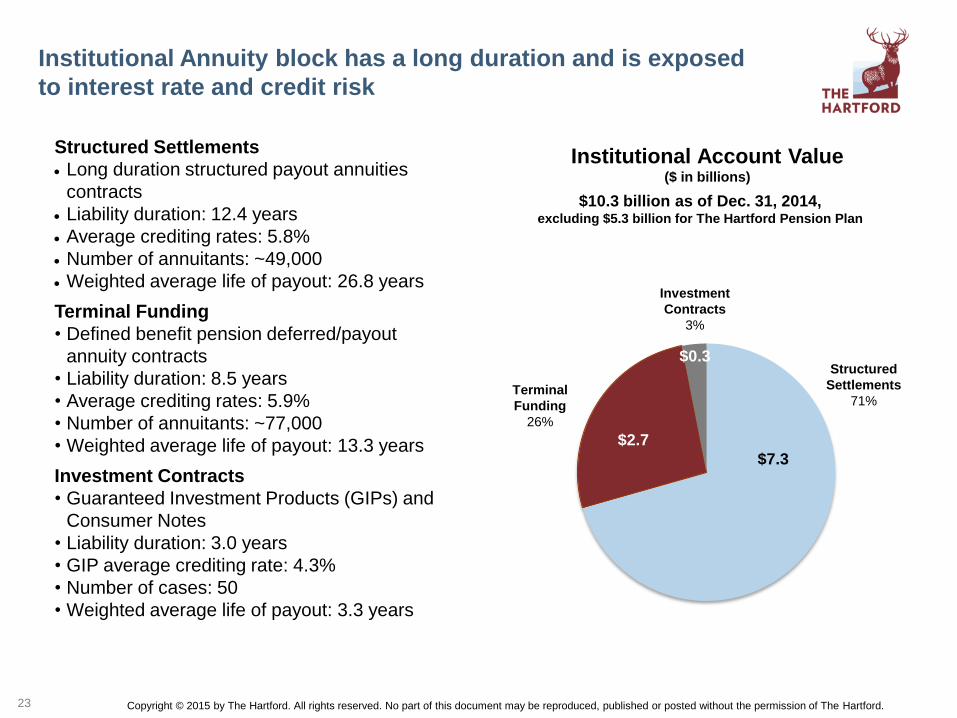
Institutional Annuity block has a long duration and is exposed
to interest rate and credit risk
$7.3
$2.7
$0.3
Institutional Account Value ($ in billions)
$10.3 billion as of Dec. 31, 2014, excluding $5.3 billion for The Hartford Pension Plan
Investment
Contracts
3%
Terminal
Funding
26%
Structured
Settlements
71%
Structured Settlements
Long duration structured payout annuities
contracts
Liability duration: 12.4 years
Average crediting rates: 5.8%
Number of annuitants: ~49,000
Weighted average life of payout: 26.8 years
Terminal Funding
• Defined benefit pension deferred/payout
annuity contracts
• Liability duration: 8.5 years
• Average crediting rates: 5.9%
• Number of annuitants: ~77,000
• Weighted average life of payout: 13.3 years
Investment Contracts
• Guaranteed Investment Products (GIPs) and
Consumer Notes
• Liability duration: 3.0 years
• GIP average crediting rate: 4.3%
• Number of cases: 50
• Weighted average life of payout: 3.3 years