Four Lethal Encounters: Non-conflict Armed Violence ... armed violence. global burden of armed...
22
NON - CONFLICT ARMED VIOLENCE 67 1 2 4 5 6 7 3 Chapter Four Lethal Encounters: Non-conflict Armed Violence B y far the largest aspect of the global burden of armed violence is the deaths and injuries that occur in non-conflict or non-war settings. Countries such as South Africa, Jamaica, and El Salvador suffer from extremely high recorded levels of homicide, with more deaths each year than in many contemporary wars. This fact alone underlines the importance of adopting a more comprehensive approach to armed violence, since a narrow focus on conflict- related deaths by development donors and prac- titioners excludes the significant burden of armed violence that occurs in non-conflict settings. This chapter provides a regional and subregional breakdown of the global distribution of non- conflict violent deaths, both in absolute terms and as rates per 100,000 population. It also exam- ines the limited available trend data and provides information on the burden of violence in cities, firearm homicides, the gendered dimension of violent deaths, and the issue of the effectiveness of criminal justice systems. The main findings of this chapter are as follows: Approximately 490,000 deaths from homicide are estimated to have occurred in 2004. 1 The world average homicide rate in 2004 was 7.6 per 100,000 population. Southern Africa, Central America, and South America are the three subregions with the highest homicide rates. West and Central Europe, East Asia, and South-east Europe are the three subregions showing the lowest rates of homicide. 2 Approximately 60 per cent of all violent deaths are committed with firearms, with variation from a low of 19 per cent in West and Central Europe to a high of 77 per cent in Central America, based on data from 45 countries. In countries with high homicide rates, women make up around ten per cent of the victims. As homicide rates drop, women make up a greater percentage of victims, up to around 30 per cent in European countries. Available data is seldom, however, disaggregated by sex. Trend data shows few increases in homicide rates over the past decade. The majority of subregions examined show flat or slightly increasing or decreasing trends. There is little evidence that armed violence has, at least at the subregional level, increased overall in the Americas, Europe, and Central Asia and Transcaucasia in recent years. Arriving at these findings is a complex and deli- cate exercise, and the chapter also explains some of the difficulties involved in measuring armed violence. Existing statistics and data-gathering mechanisms are underdeveloped, and greater investment in effective measurement of the bur- den of armed violence will be needed in order to develop a more accurate picture of its overall scope and impact. 3
Transcript of Four Lethal Encounters: Non-conflict Armed Violence ... armed violence. global burden of armed...
NO
N- C
ON
FLIC
T A
RM
ED
VIO
LEN
CE
67
1
2
4
5
6
7
3
Chapter Four Lethal Encounters: Non-conflict Armed Violence
B y far the largest aspect of the global
burden of armed violence is the deaths
and injuries that occur in non-conflict or
non-war settings. Countries such as South Africa,
Jamaica, and El Salvador suffer from extremely
high recorded levels of homicide, with more
deaths each year than in many contemporary
wars. This fact alone underlines the importance
of adopting a more comprehensive approach to
armed violence, since a narrow focus on conflict-
related deaths by development donors and prac-
titioners excludes the significant burden of armed
violence that occurs in non-conflict settings.
This chapter provides a regional and subregional
breakdown of the global distribution of non-
conflict violent deaths, both in absolute terms
and as rates per 100,000 population. It also exam-
ines the limited available trend data and provides
information on the burden of violence in cities,
firearm homicides, the gendered dimension of
violent deaths, and the issue of the effectiveness
of criminal justice systems.
The main findings of this chapter are as follows:
Approximately 490,000 deaths from homicide
are estimated to have occurred in 2004.1 The
world average homicide rate in 2004 was 7.6
per 100,000 population.
Southern Africa, Central America, and South
America are the three subregions with the
highest homicide rates. West and Central
Europe, East Asia, and South-east Europe are
the three subregions showing the lowest rates
of homicide.2
Approximately 60 per cent of all violent deaths
are committed with firearms, with variation
from a low of 19 per cent in West and Central
Europe to a high of 77 per cent in Central
America, based on data from 45 countries.
In countries with high homicide rates, women
make up around ten per cent of the victims.
As homicide rates drop, women make up a
greater percentage of victims, up to around 30
per cent in European countries. Available data
is seldom, however, disaggregated by sex.
Trend data shows few increases in homicide
rates over the past decade. The majority of
subregions examined show flat or slightly
increasing or decreasing trends. There is little
evidence that armed violence has, at least at
the subregional level, increased overall in
the Americas, Europe, and Central Asia and
Transcaucasia in recent years.
Arriving at these findings is a complex and deli-
cate exercise, and the chapter also explains some
of the difficulties involved in measuring armed
violence. Existing statistics and data-gathering
mechanisms are underdeveloped, and greater
investment in effective measurement of the bur-
den of armed violence will be needed in order to
develop a more accurate picture of its overall
scope and impact.3
GLO
BA
L B
UR
DEN
of
AR
MED
VIO
LEN
CE
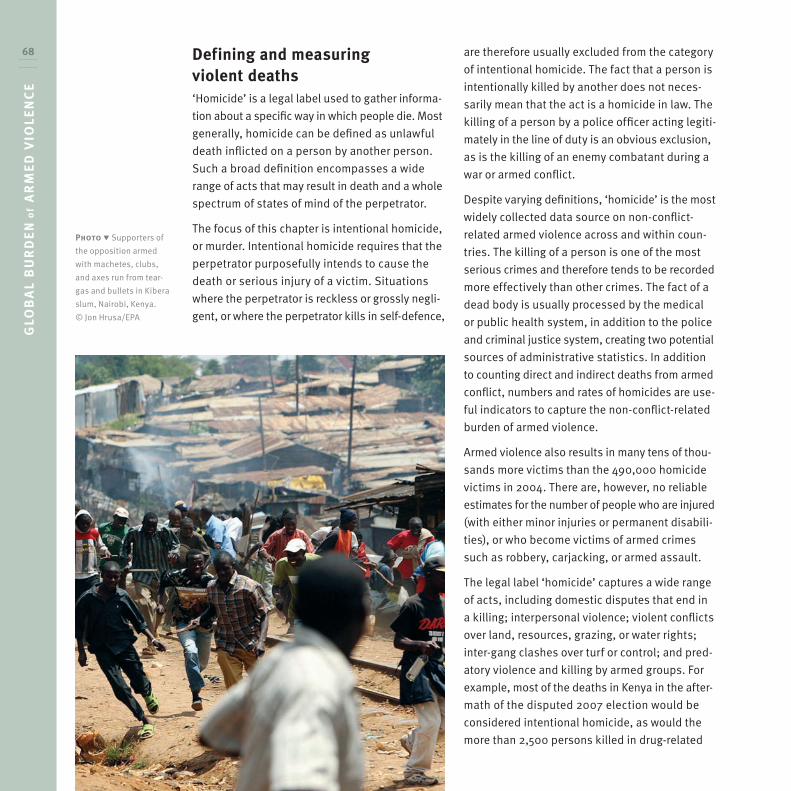
68 Defining and measuring violent deaths‘Homicide’ is a legal label used to gather informa-
tion about a specific way in which people die. Most
generally, homicide can be defined as unlawful
death inflicted on a person by another person.
Such a broad definition encompasses a wide
range of acts that may result in death and a whole
spectrum of states of mind of the perpetrator.
The focus of this chapter is intentional homicide,
or murder. Intentional homicide requires that the
perpetrator purposefully intends to cause the
death or serious injury of a victim. Situations
where the perpetrator is reckless or grossly negli-
gent, or where the perpetrator kills in self-defence,
are therefore usually excluded from the category
of intentional homicide. The fact that a person is
intentionally killed by another does not neces-
sarily mean that the act is a homicide in law. The
killing of a person by a police officer acting legiti-
mately in the line of duty is an obvious exclusion,
as is the killing of an enemy combatant during a
war or armed conflict.
Despite varying definitions, ‘homicide’ is the most
widely collected data source on non-conflict-
related armed violence across and within coun-
tries. The killing of a person is one of the most
serious crimes and therefore tends to be recorded
more effectively than other crimes. The fact of a
dead body is usually processed by the medical
or public health system, in addition to the police
and criminal justice system, creating two potential
sources of administrative statistics. In addition
to counting direct and indirect deaths from armed
conflict, numbers and rates of homicides are use-
ful indicators to capture the non-conflict-related
burden of armed violence.
Armed violence also results in many tens of thou-
sands more victims than the 490,000 homicide
victims in 2004. There are, however, no reliable
estimates for the number of people who are injured
(with either minor injuries or permanent disabili-
ties), or who become victims of armed crimes
such as robbery, carjacking, or armed assault.
The legal label ‘homicide’ captures a wide range
of acts, including domestic disputes that end in
a killing; interpersonal violence; violent conflicts
over land, resources, grazing, or water rights;
inter-gang clashes over turf or control; and pred-
atory violence and killing by armed groups. For
example, most of the deaths in Kenya in the after-
math of the disputed 2007 election would be
considered intentional homicide, as would the
more than 2,500 persons killed in drug-related
Photo Supporters of
the opposition armed
with machetes, clubs,
and axes run from tear-
gas and bullets in Kibera
slum, Nairobi, Kenya.
© Jon Hrusa/EPA
NO
N- C
ON
FLIC
T A
RM
ED
VIO
LEN
CE
69
1
2
4
5
6
7
3
violence in Mexico in 2007–08 (BBC, 2008; Los
Angeles Times, 2008; Reuters, 2008). By contrast,
the 79 suspected gang members killed in clashes
with police in Sao Paulo in May 2006 may not be
counted as homicides (BBC, 2006). Similarly,
neither the nearly 3,000 persons killed in the
attacks on the United States on 11 September
2001, nor the nearly 200 persons killed in terrorist
attacks on 11 March 2004 in Madrid, Spain were
recorded as homicides. These examples highlight
that while ‘homicide’ is a broad category that goes
beyond interpersonal violence, it does not capture
all intentional killing.
The difference between deaths arising from armed
conflict and non-conflict deaths is often described
by the organization of the killing. Homicide is
usually committed by individuals or small groups,
whereas the killing in armed conflict is committed
by more or less cohesive groups of up to several
hundred members (Collier and Hoeffler, 2004, p. 3).
But there is often little difference in intensity
between large-scale criminal violence and low-
level armed conflict, and the line between the two
is often blurred.
A comparative analysis of homicide statistics
must be conducted cautiously. Legal definitions
of homicide vary among countries, and may or
may not include crimes such as assault leading
to death, euthanasia, infanticide, or assistance
with suicide. Societies define those killings that
are perceived as acceptable and others that are
not in their legal codes. Comparing intentional
homicide among countries and regions is, there-
fore, a comparison not only of the level of intended
killing of persons, but also of the extent to which
countries and regions deem that a killing should
be classified as such.
Official statistics rarely capture the number of
actual criminal events that have occurred. Figures
and rates should therefore be assumed to be
conservative estimates. Homicide can be reported
by relatives and witnesses, but obviously cannot
be measured through reports by victims. The
quality of homicide figures is also affected by
different criteria and approaches to case recording,
and the capacity of national institutions to gather
data and accurately record events (Aebi, 2004).
The capacity gap between developed and devel-
oping countries particularly affects the cross-
national comparison of police-recorded crime
statistics (UN, 2007a), with the result that admin-
istrative statistics are not a particularly strong
basis for the study of cross-national differences
in criminal activity (Aebi, 2004, p. 163). Some
analysts (Soares, 2004a, p. 851) have demon-
strated that variations in crime reporting rates
are ‘strongly related to measures of institutional
stability, to police presence, and . . . to a subjec-
tive index of corruption’ (see also Soares, 2004b).
Cross-national differences in reported crime must
therefore take into account both state capacity
and crime victim reporting rates.
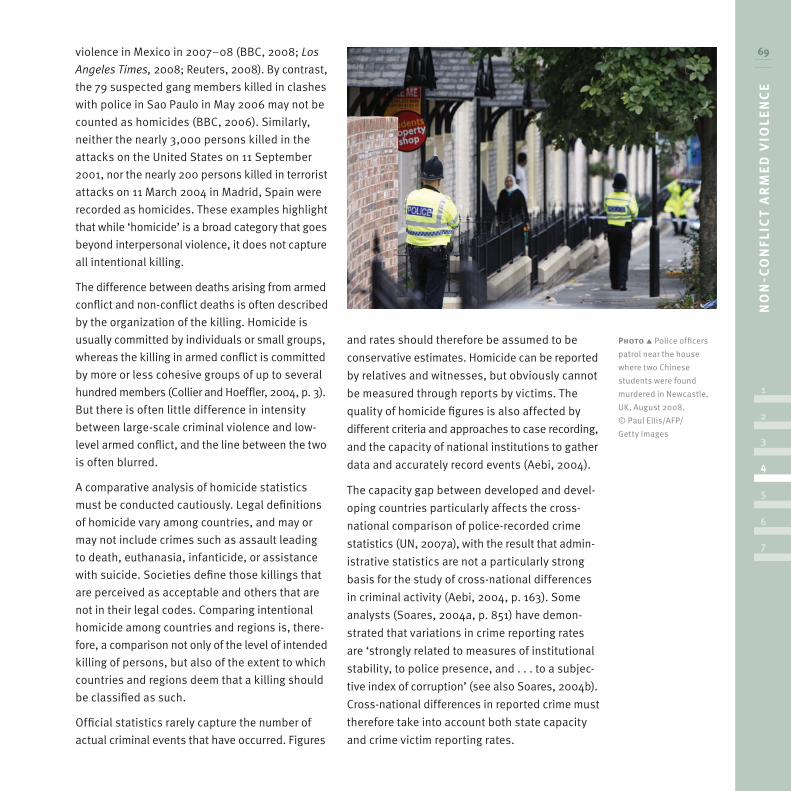
Photo Police officers
patrol near the house
where two Chinese
students were found
murdered in Newcastle,
UK, August 2008.
© Paul Ellis/AFP/
Getty Images
GLO
BA
L B
UR
DEN
of
AR
MED
VIO
LEN
CE
70 There are also important differences between data
obtained from public health, police, or criminal
justice institutions. All measure subtly different
phenomena and are therefore unlikely to provide
identical numbers.4 The differences between
health and police statistics are especially marked
in developing countries, with some analysts noting
that health statistics may be up to 45 per cent
higher than police-recorded figures. In higher
income countries, such as those in West and Central
Europe, significant differences remain for some
countries between police and health statistics
(Shaw, Van Dijk, and Romberg, 2003, pp. 46–47).
Such differences may be linked to limitations in
the capacity of police and law enforcement agen-
cies to identify and record homicide events, and
other factors such as the lethality of assaults.
Despite the proliferation of increasingly dangerous
weapons and an increase in the number of serious
criminal assaults in developing countries since
1960, the lethality of such assaults has dropped
dramatically due to developments in medical
technology and medical support services, in both
North America and Western Europe (Harris et al.,
2002; Aebi, 2004). As a consequence, not only is
it difficult to explain long-term homicide trends
in one region without taking into account improve-
ments in health care, but it is also difficult to draw
Source: UN Office on Drugs and Crime (UNODC) estimates
LEGEND:
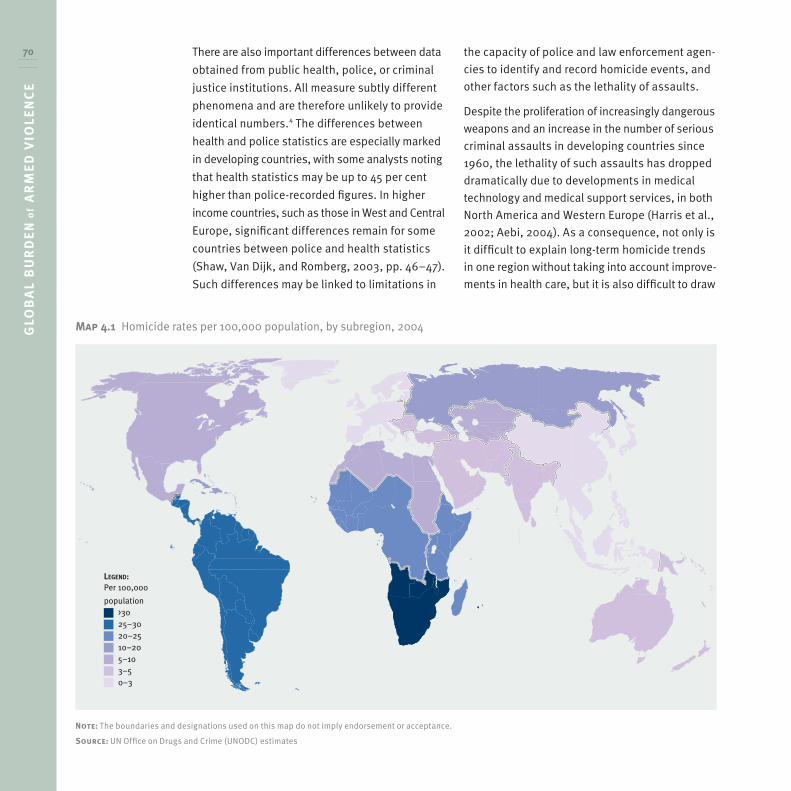
MAP 4.1 Homicide rates per 100,000 population, by subregion, 2004
Note: The boundaries and designations used on this map do not imply official endorsement or acceptance.
>3025–3020–2510–205–103–50–3
Per 100,000
population
Map 4.1 Homicide rates per 100,000 population, by subregion, 2004
Note: The boundaries and designations used on this map do not imply endorsement or acceptance.
Source: UN Office on Drugs and Crime (UNODC) estimates
NO
N- C
ON
FLIC
T A
RM
ED
VIO
LEN
CE
71
1
2
4
5
6
7
3
comparisons between regions of the world that
have different healthcare systems.
Estimating global homicide levelsThis section disaggregates the estimated 490,000
non-conflict violent deaths using results from
analysis of available national-level data.5 Data is
presented in this section as subregional aggregates
due to the difficulties in comparing homicide data
directly at the country level. The resulting homicide
estimates are expressed as the number of homi-
cides per 100,000 people in one year.
Map 4.1 shows the global distribution of homi-
cide captured as population-weighted homicide
levels for 16 subregions for 2004. These sub-
regional figures are calculated from 201 individual
country or territory homicide level estimates, each
derived from available national-level administra-
tive data.6
The world average for 2004—the most recent year
for which comprehensive data is available—is 7.6
homicides per 100,000 population. The highest
homicide rates are concentrated in Africa (with
the exception of North Africa) and Central and
South America, and fall within the higher homicide
rate ranges of from 20 to more than 30 homicides
per 100,000 population. By contrast, East and
South-east Asia and West and Central Europe
show the lowest homicide levels, with rates lower
than 3 homicides per 100,000 population. The
Caribbean and East Europe are affected by rela-
tively high homicide rates that are in the range of
10–20 homicides per 100,000 population. North
Africa, North America, and Central Asia follow with
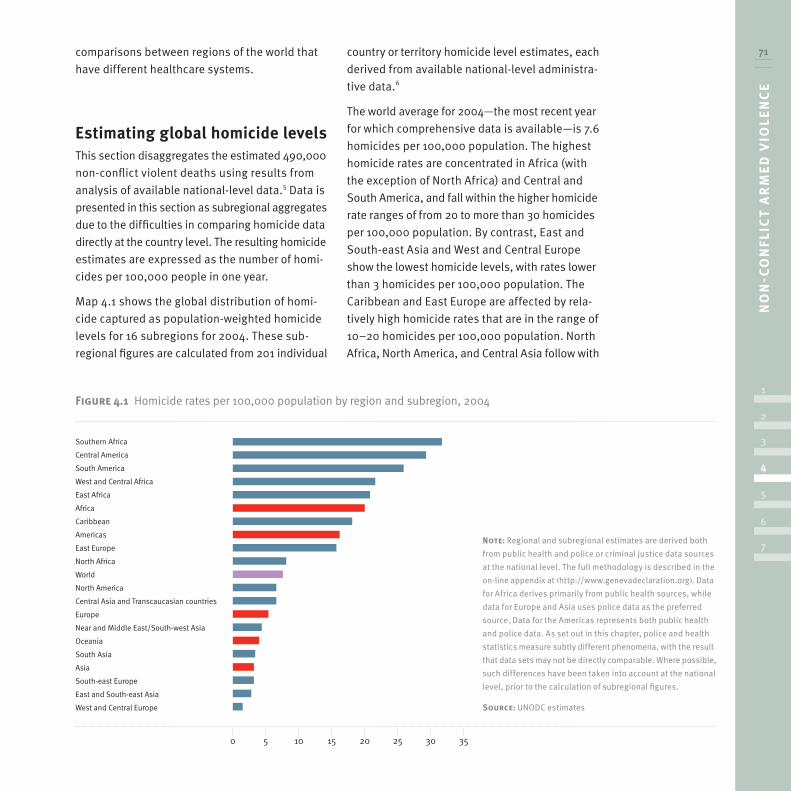
Figure 4.1 Homicide rates per 100,000 population by region and subregion, 2004
Southern Africa
Central America
South America
West and Central Africa
East Africa
Africa
Caribbean
Americas
East Europe
North Africa
World
North America
Central Asia and Transcaucasian countries
Europe
Near and Middle East/South-west Asia
Oceania
South Asia
Asia
South-east Europe
East and South-east Asia
West and Central Europe
Note: Regional and subregional estimates are derived both
from public health and police or criminal justice data sources
at the national level. The full methodology is described in the
on-line appendix at <http://www.genevadeclaration.org>. Data
for Africa derives primarily from public health sources, while
data for Europe and Asia uses police data as the preferred
source. Data for the Americas represents both public health
and police data. As set out in this chapter, police and health
statistics measure subtly different phenomena, with the result
that data sets may not be directly comparable. Where possible,
such differences have been taken into account at the national
level, prior to the calculation of subregional figures.
Source: UNODC estimates
0 5 10 15 20 25 30 35
GLO
BA
L B
UR
DEN
of
AR
MED
VIO
LEN
CE
72 rates between 5 and 10, while Oceania, the Near
and Middle East/South-west Asia, South Asia,
and South-east Europe show homicide rates in
the range 3–5 per 100,000 population.
Figure 4.1 provides in graphic form details of the
regional and subregional distribution of homi-
cide rates. In Africa, high homicide rates may be
associated with a series of social and economic
indicators also linked to crime. These include, for
example, a low overall Human Development Index
(HDI),7 low economic performance,8 high levels of
income inequality,9 a youthful population,10 rapid
rates of urbanization, poorly resourced criminal
justice systems, and a proliferation of firearms,
related in part to the recurrence of conflict in all
regions of the continent (UNODC, 2005, p. ix).
Systematic analysis of the nature of these linkages,
however, remains to be done (see Box 4.1).
In Africa, some conflict-related deaths may appear
in homicide statistics, but overall the number of
direct conflict-related deaths in Africa (approxi-
mately 17,700 conflict deaths were recorded via
incident reporting in 200412) pales compared to
an estimated 180,000 non-conflict violent deaths
in 2004. There is nevertheless a link between
conflict and non-conflict violence. Armed conflict
has the potential to influence violent crime both
during and after the end of hostilities (ARMED
VIOLENCE AFTER WAR). Contemporary conflicts
often also overlap with organized criminal activ-
ity and other forms of looting and predation. The
psychological impact of war, destruction of social
fabric, loss of livelihoods, social displacement,
and increased availability of weapons may also
all contribute to high post-conflict levels of crime
and insecurity that are reflected in homicide levels
(UNODC, 2005, p. x).
The Americas, with the exception of North America,
show the second-highest regional homicide levels.
Central and South American rates are higher than
the global average, representing the second- and
third-highest subregional rates globally: 29.3 and
25.9 homicides per 100,000 population, respec-
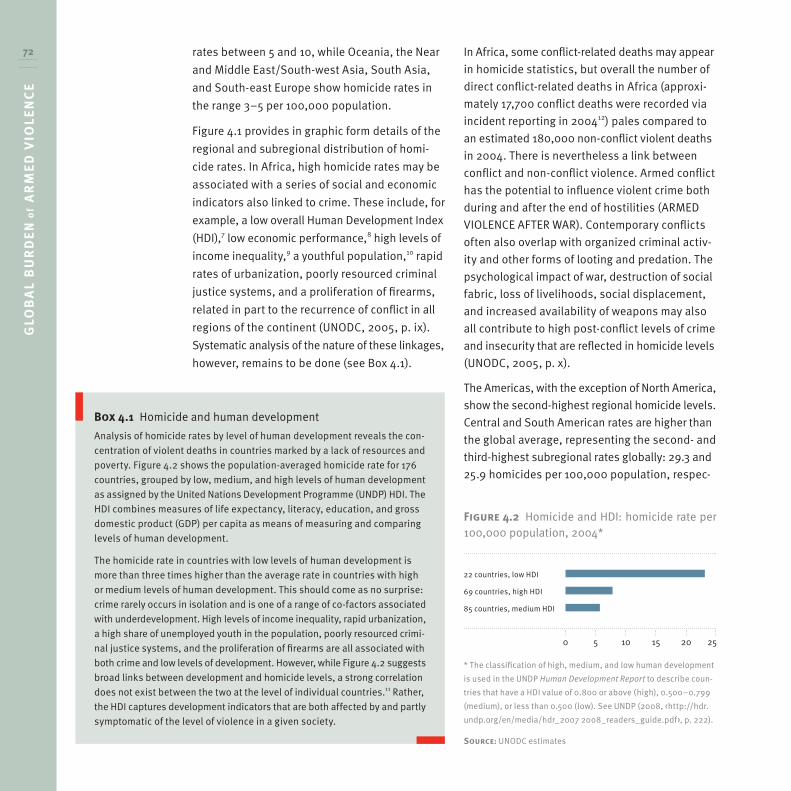
Box 4.1 Homicide and human development
Analysis of homicide rates by level of human development reveals the con-
centration of violent deaths in countries marked by a lack of resources and
poverty. Figure 4.2 shows the population-averaged homicide rate for 176
countries, grouped by low, medium, and high levels of human development
as assigned by the United Nations Development Programme (UNDP) HDI. The
HDI combines measures of life expectancy, literacy, education, and gross
domestic product (GDP) per capita as means of measuring and comparing
levels of human development.
The homicide rate in countries with low levels of human development is
more than three times higher than the average rate in countries with high
or medium levels of human development. This should come as no surprise:
crime rarely occurs in isolation and is one of a range of co-factors associated
with underdevelopment. High levels of income inequality, rapid urbanization,
a high share of unemployed youth in the population, poorly resourced crimi-
nal justice systems, and the proliferation of firearms are all associated with
both crime and low levels of development. However, while Figure 4.2 suggests
broad links between development and homicide levels, a strong correlation
does not exist between the two at the level of individual countries.11 Rather,
the HDI captures development indicators that are both affected by and partly
symptomatic of the level of violence in a given society.
Figure 4.2 Homicide and HDI: homicide rate per 100,000 population, 2004*
0 5 10 15 20 25
22 countries, low HDI
69 countries, high HDI
85 countries, medium HDI
* The classification of high, medium, and low human development
is used in the UNDP Human Development Report to describe coun-
tries that have a HDI value of 0.800 or above (high), 0.500–0.799
(medium), or less than 0.500 (low). See UNDP (2008, <http://hdr.
undp.org/en/media/hdr_2007 2008_readers_guide.pdf>, p. 222).
Source: UNODC estimates
NO
N- C
ON
FLIC
T A
RM
ED
VIO
LEN
CE
73
1
2
4
5
6
7
3
tively. The Caribbean rate of 18.1 is more than twice
as high as the global average (7.6 per 100,000
population).
However, the socioeconomic situation of the
Americas is qualitatively different to that of Africa.
GDP per capita for the Caribbean and South and
Central America is about double that of Africa
and the average HDI is 0.78, as compared with
0.53 for Africa.13 Out of a total of 41 main armed
conflicts globally, 16 occurred in Africa, while
there were only 2 in the Americas (DIRECT
CONFLICT DEATH).
This suggests a different set of factors associated
with a high homicide rate. While the Americas
region does have some history of armed conflict
(especially in Central and South America), it is
drug trafficking, criminal activity, and youth gangs
that play a more significant role in driving homi-
cide levels, particularly in Central America and the
Caribbean (OTHER FORMS OF ARMED VIOLENCE).
The drug trade fuels crime in numerous ways:
through violence linked to trafficking; by normaliz-
ing illegal behaviour; by diverting criminal justice
resources from other activities; and, importantly
with respect to homicide, by contributing to the
widespread availability of firearms (UNODC, 2007,
p. 15; UNODC and World Bank, 2007, pp. i–ii).
By comparison, as a region, Asia has the lowest
average intentional homicide rate. However, its
subregions show considerable variability, from
6.6 per 100,000 population for Central Asia and
Transcaucasia to 2.8 for East and South-east Asia.
South Asia is slightly higher at 3.4 per 100,000,
as is the Near and Middle East/South-west Asia
at 4.4 per 100,000 population. It is worth noting
that average homicide levels in South Asia are
almost six times lower than for Africa, even
though average GDP per capita in South Asia is
approximately equal to that for Africa. There is
no clear explanation for this, but it does call for a
nuanced perspective on the association between
economic performance (as measured by GDP) and
levels of armed violence.
Oceania shows a homicide rate slightly higher than
for Asia, at 4.0 per 100,000 population. Factors
particularly affecting this comparatively low rate
may include the unique geographic and demo-
graphic features of Oceania, with some 23 out of
26 countries or territories having a population
under 1,000,000 persons. Fifteen of these do not
reach 100,000 inhabitants. While the regional
average is low, countries within Oceania show
considerable variability, ranging from 15.2 to less
than 1 per 100,000 population.
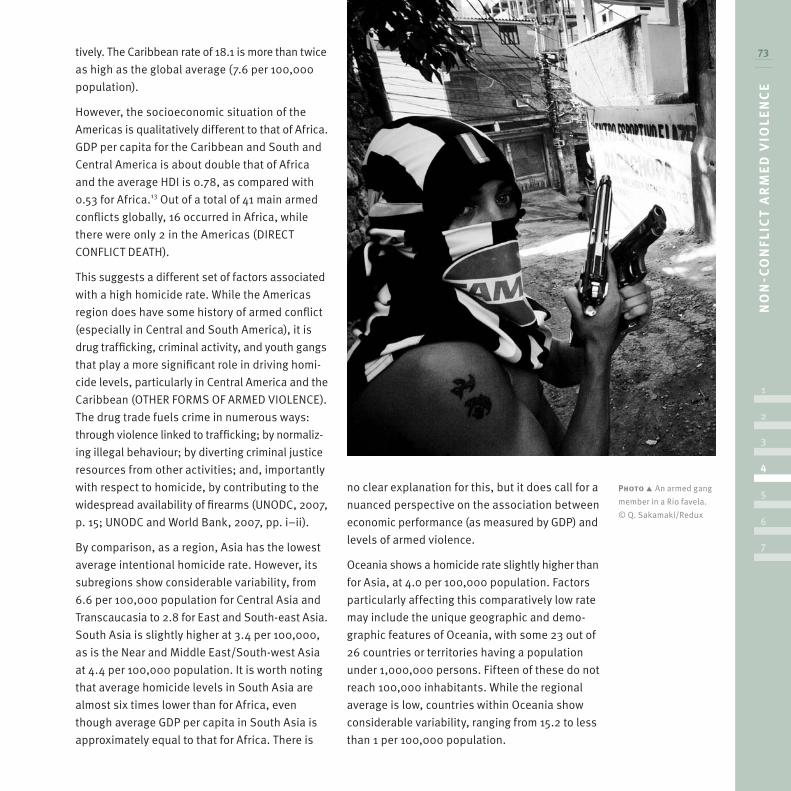
Photo An armed gang
member in a Rio favela.
© Q. Sakamaki/Redux
GLO
BA
L B
UR
DEN
of
AR
MED
VIO
LEN
CE
74
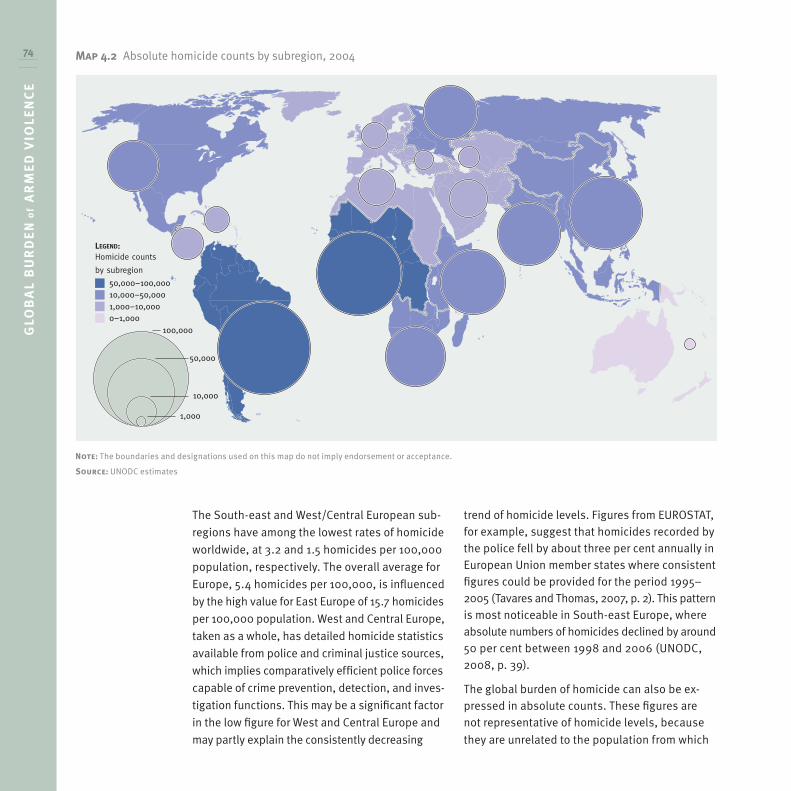
SOURCE: UNODC estimates
LEGEND:
50,000–100,00010,000–50,0001,000–10,0000–1,000
Homicide counts
by subregion
100,000
50,000
10,000
1,000
MAP 4.2 Absolute homicide counts by subregion, 2004
NOTE: The boundaries and designations used on this map do not imply official endorsement or acceptance.
The South-east and West/Central European sub-
regions have among the lowest rates of homicide
worldwide, at 3.2 and 1.5 homicides per 100,000
population, respectively. The overall average for
Europe, 5.4 homicides per 100,000, is influenced
by the high value for East Europe of 15.7 homicides
per 100,000 population. West and Central Europe,
taken as a whole, has detailed homicide statistics
available from police and criminal justice sources,
which implies comparatively efficient police forces
capable of crime prevention, detection, and inves-
tigation functions. This may be a significant factor
in the low figure for West and Central Europe and
may partly explain the consistently decreasing
trend of homicide levels. Figures from EUROSTAT, for example, suggest that homicides recorded by the police fell by about three per cent annually in European Union member states where consistent figures could be provided for the period 1995–2005 (Tavares and Thomas, 2007, p. 2). This pattern is most noticeable in South-east Europe, where absolute numbers of homicides declined by around 50 per cent between 1998 and 2006 (UNODC, 2008, p. 39).
The global burden of homicide can also be ex-pressed in absolute counts. These figures are not representative of homicide levels, because
they are unrelated to the population from which
Map 4.2 Absolute homicide counts by subregion, 2004
Note: The boundaries and designations used on this map do not imply endorsement or acceptance.
Source: UNODC estimates
NO
N- C
ON
FLIC
T A
RM
ED
VIO
LEN
CE
75
1
2
4
5
6
7
3
Box 4.2 Guns and homicide
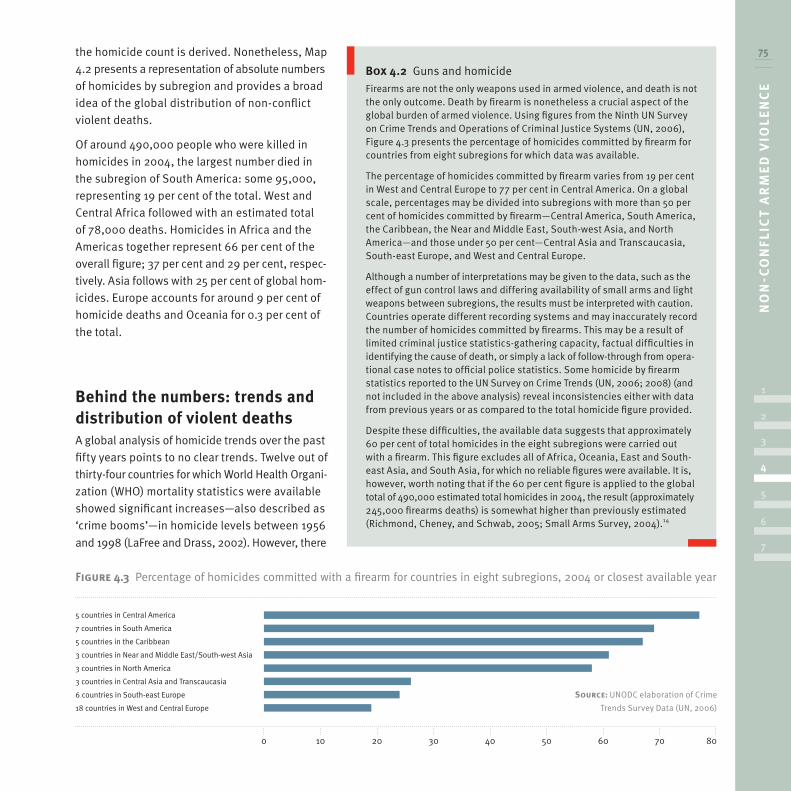
Firearms are not the only weapons used in armed violence, and death is not the only outcome. Death by firearm is nonetheless a crucial aspect of the global burden of armed violence. Using figures from the Ninth UN Survey on Crime Trends and Operations of Criminal Justice Systems (UN, 2006), Figure 4.3 presents the percentage of homicides committed by firearm for countries from eight subregions for which data was available.
The percentage of homicides committed by firearm varies from 19 per cent in West and Central Europe to 77 per cent in Central America. On a global scale, percentages may be divided into subregions with more than 50 per cent of homicides committed by firearm—Central America, South America, the Caribbean, the Near and Middle East, South-west Asia, and North America—and those under 50 per cent—Central Asia and Transcaucasia, South-east Europe, and West and Central Europe.
Although a number of interpretations may be given to the data, such as the effect of gun control laws and differing availability of small arms and light weapons between subregions, the results must be interpreted with caution. Countries operate different recording systems and may inaccurately record the number of homicides committed by firearms. This may be a result of limited criminal justice statistics-gathering capacity, factual difficulties in identifying the cause of death, or simply a lack of follow-through from opera-tional case notes to official police statistics. Some homicide by firearm statistics reported to the UN Survey on Crime Trends (UN, 2006; 2008) (and not included in the above analysis) reveal inconsistencies either with data from previous years or as compared to the total homicide figure provided.
Despite these difficulties, the available data suggests that approximately 60 per cent of total homicides in the eight subregions were carried out with a firearm. This figure excludes all of Africa, Oceania, East and South-east Asia, and South Asia, for which no reliable figures were available. It is, however, worth noting that if the 60 per cent figure is applied to the global total of 490,000 estimated total homicides in 2004, the result (approximately 245,000 firearms deaths) is somewhat higher than previously estimated (Richmond, Cheney, and Schwab, 2005; Small Arms Survey, 2004).14
the homicide count is derived. Nonetheless, Map
4.2 presents a representation of absolute numbers
of homicides by subregion and provides a broad
idea of the global distribution of non-conflict
violent deaths.
Of around 490,000 people who were killed in
homicides in 2004, the largest number died in
the subregion of South America: some 95,000,
representing 19 per cent of the total. West and
Central Africa followed with an estimated total
of 78,000 deaths. Homicides in Africa and the
Americas together represent 66 per cent of the
overall figure; 37 per cent and 29 per cent, respec-
tively. Asia follows with 25 per cent of global hom-
icides. Europe accounts for around 9 per cent of
homicide deaths and Oceania for 0.3 per cent of
the total.
Behind the numbers: trends and distribution of violent deathsA global analysis of homicide trends over the past
fifty years points to no clear trends. Twelve out of
thirty-four countries for which World Health Organi-
zation (WHO) mortality statistics were available
showed significant increases—also described as
‘crime booms’—in homicide levels between 1956
and 1998 (LaFree and Drass, 2002). However, there
Figure 4.3 Percentage of homicides committed with a firearm for countries in eight subregions, 2004 or closest available year
5 countries in Central America
7 countries in South America
5 countries in the Caribbean
3 countries in Near and Middle East/South-west Asia
3 countries in North America
3 countries in Central Asia and Transcaucasia
6 countries in South-east Europe
18 countries in West and Central Europe
0 10 20 30 40 50 60 70 80
Source: UNODC elaboration of Crime
Trends Survey Data (UN, 2006)
GLO
BA
L B
UR
DEN
of
AR
MED
VIO
LEN
CE
76 is no conclusive evidence to support the argument
that crime booms have been universal since the
Second World War.15 More recently, analysis of
homicide and homicide attempts in the 1990s in
Europe shows an increase between 1990 and 1992,
followed by a gradual but consistent decrease in
homicide levels between 1992 and 2000 (Aebi,
2004). According to data from EUROSTAT, this
decline has continued to the year 2006 (Tavares
and Thomas, 2007).
In a longer historical perspective, however, all
analysts agree that homicide rates in Western
Europe have dropped more or less steadily—and
dramatically—over the past several centuries.
Homicide rates dropped roughly by half from the
medieval to the early modern period (late 16th and
early 17th centuries), and by the 19th century had
dropped five to ten times further. This holds from
England and Scandinavia to Germany, Switzerland,
the Netherlands, and Italy. The homicide rate in
England dropped from about 23 per 100,000
population in the 13th and 14th centuries to 4.3
per 100,000 by the end of the 17th century, to 0.8
per 100,000 by the first half of the 20th century.
In the Netherlands and Belgium, equivalent fig-
ures were 47, 9.2, and 1.7 per 100,000; while in
Germany and Switzerland, the figures fell from
37 per 100,000 to below 2.0 for the 20th century
(Eisner, 2001; Gurr, 1981; Monkkonen, 2001).
Although the exact timing and scope of the decline
varies from place to place, there is no doubt about
the historical decline in lethal violence within
European states.
Various explanations have been advanced for
this decline, including increases in state capacity
(policing, criminal justice), increased urbanization
and levels of education, and changing norms
towards interpersonal violence. Whatever the
causes, the long-term decline in lethal violence
should provide some insight into contemporary
global trends analysed over a short time period.
The analysis presented below looks at homicide
trends in selected countries based on results
from multiple data sources. It captures the best
available data for the period 1998–2006 in order
to provide a temporal context to the subregional
estimates presented above for 2004.16 This trend
analysis refutes the existence of ‘crime booms’
in the Americas, Europe, and Central Asia and
Transcaucasia in recent years. It shows that there
were very few sustained increases of greater
than ten per cent in homicide levels. The majority
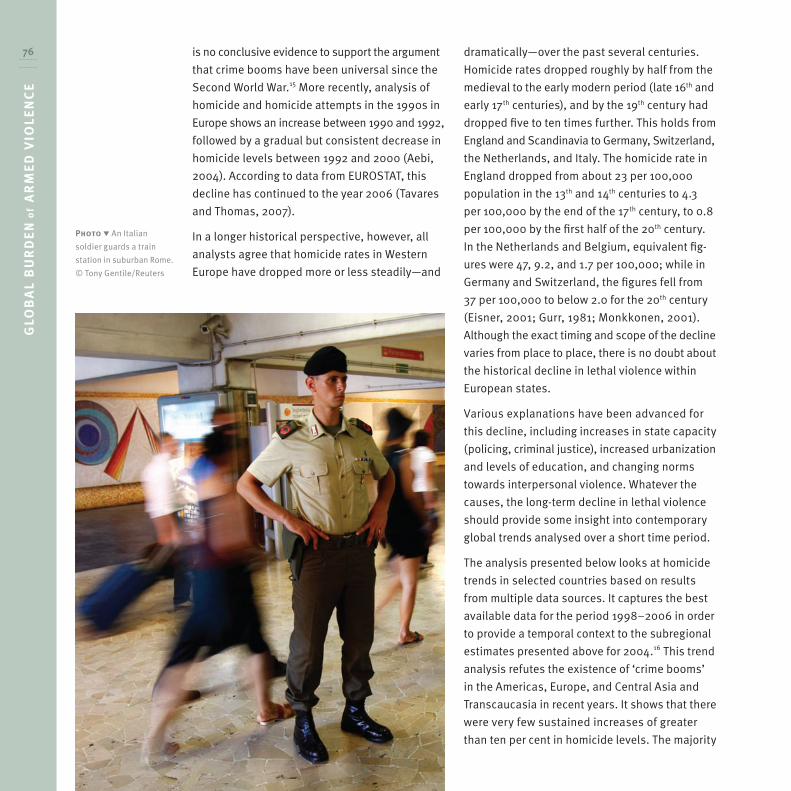
Photo An Italian
soldier guards a train
station in suburban Rome.
© Tony Gentile/Reuters
NO
N- C
ON
FLIC
T A
RM
ED
VIO
LEN
CE
77
1
2
4
5
6
7
3
of subregions examined show flat or slightly
increasing or decreasing trends.
The examination of homicide trends over time
can be undertaken, provided that reporting and
recording practices, as well as legal definitions
of the offence, do not change during the period
considered. Trend analysis further requires a
rigorous approach to data completeness: it is
important that data from the same set of countries
is compared year to year and that, where sub-
regional or regional trends are examined, data is
collected from as many representative countries
as possible. Reliable trend analysis also usually
requires that countries with fewer than one mil-
lion inhabitants be excluded, as small numbers
may contribute to a lack of statistical reliability
(Aebi, 2004).
National-level time series data was examined for
the existence of possible trends, and countries
(or territories) classified as ‘increasing’, ‘decreas-
ing’, ‘flat’, or ‘single dominant change’. The cat-
egory ‘single dominant change’ describes the
situation where homicide levels show a ‘∩’- or
‘∪’-shaped trend. Countries exhibiting short-term
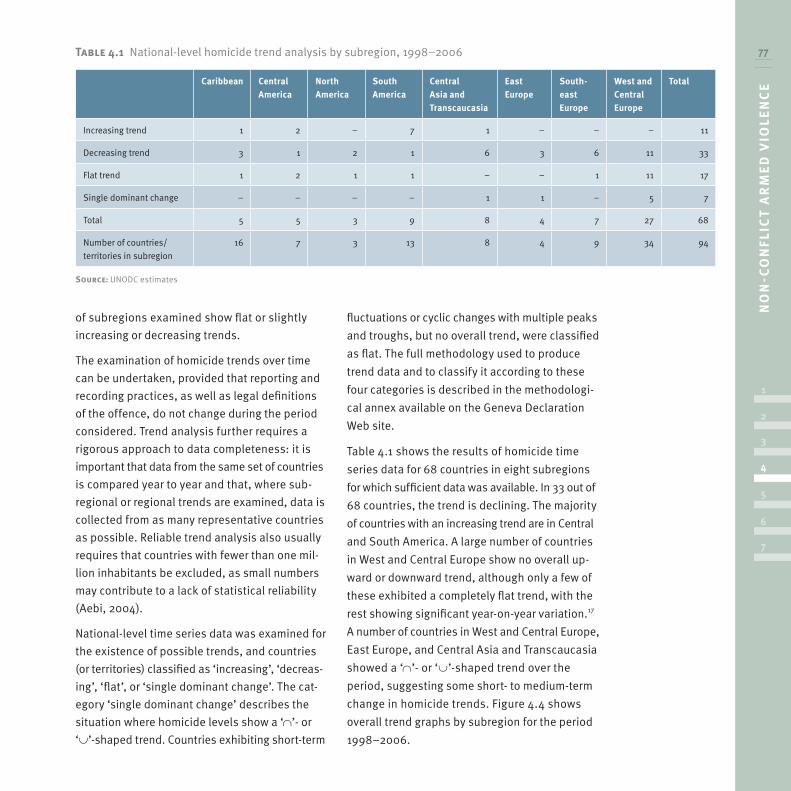
Table 4.1 National-level homicide trend analysis by subregion, 1998–2006
Caribbean Central America
North America
South America
Central Asia and Transcaucasia
East Europe
South-east Europe
West and Central Europe
Total
Increasing trend 1 2 – 7 1 – – – 11
Decreasing trend 3 1 2 1 6 3 6 11 33
Flat trend 1 2 1 1 – – 1 11 17
Single dominant change – – – – 1 1 – 5 7
Total 5 5 3 9 8 4 7 27 68
Number of countries/
territories in subregion
16 7 3 13 8 4 9 34 94
Source: UNODC estimates
fluctuations or cyclic changes with multiple peaks
and troughs, but no overall trend, were classified
as flat. The full methodology used to produce
trend data and to classify it according to these
four categories is described in the methodologi-
cal annex available on the Geneva Declaration
Web site.
Table 4.1 shows the results of homicide time
series data for 68 countries in eight subregions
for which sufficient data was available. In 33 out of
68 countries, the trend is declining. The majority
of countries with an increasing trend are in Central
and South America. A large number of countries
in West and Central Europe show no overall up-
ward or downward trend, although only a few of
these exhibited a completely flat trend, with the
rest showing significant year-on-year variation.17
A number of countries in West and Central Europe,
East Europe, and Central Asia and Transcaucasia
showed a ‘∩’- or ‘∪’-shaped trend over the
period, suggesting some short- to medium-term
change in homicide trends. Figure 4.4 shows
overall trend graphs by subregion for the period
1998–2006.
GLO
BA
L B
UR
DEN
of
AR
MED
VIO
LEN
CE
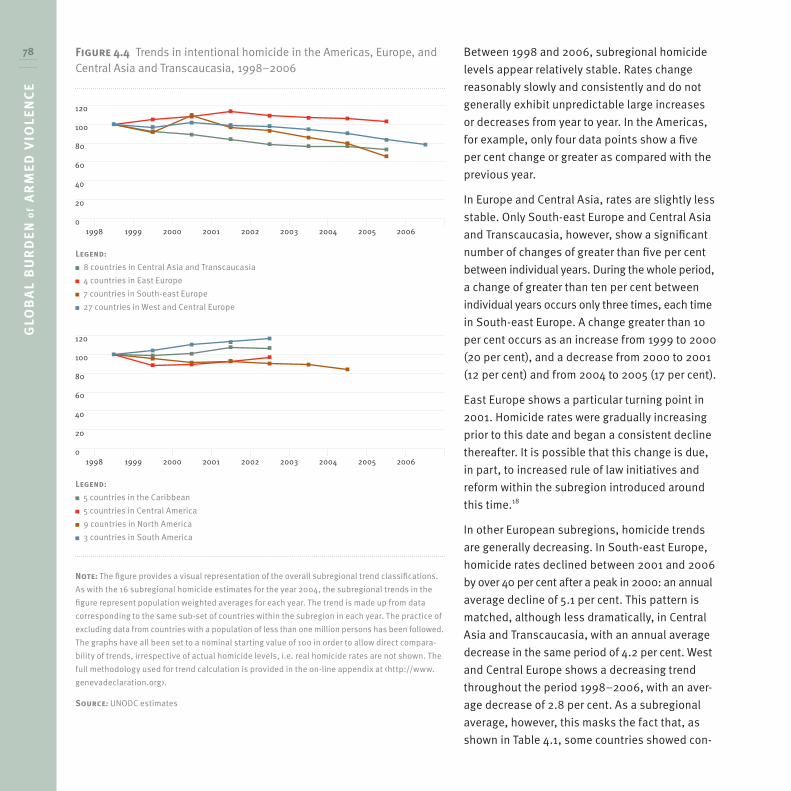
78 Figure 4.4 Trends in intentional homicide in the Americas, Europe, and Central Asia and Transcaucasia, 1998–2006
Legend:
8 countries in Central Asia and Transcaucasia
4 countries in East Europe
7 countries in South-east Europe
27 countries in West and Central Europe
120
100
80
60
40
20
01998 1999 2000 2001 2002 2003 2004 2005 2006
Legend:
5 countries in the Caribbean
5 countries in Central America
9 countries in North America
3 countries in South America
120
100
80
60
40
20
01998 1999 2000 2001 2002 2003 2004 2005 2006
Note: The figure provides a visual representation of the overall subregional trend classifications.
As with the 16 subregional homicide estimates for the year 2004, the subregional trends in the
figure represent population weighted averages for each year. The trend is made up from data
corresponding to the same sub-set of countries within the subregion in each year. The practice of
excluding data from countries with a population of less than one million persons has been followed.
The graphs have all been set to a nominal starting value of 100 in order to allow direct compara-
bility of trends, irrespective of actual homicide levels, i.e. real homicide rates are not shown. The
full methodology used for trend calculation is provided in the on-line appendix at <http://www.
genevadeclaration.org>.
Source: UNODC estimates
Between 1998 and 2006, subregional homicide
levels appear relatively stable. Rates change
reasonably slowly and consistently and do not
generally exhibit unpredictable large increases
or decreases from year to year. In the Americas,
for example, only four data points show a five
per cent change or greater as compared with the
previous year.
In Europe and Central Asia, rates are slightly less
stable. Only South-east Europe and Central Asia
and Transcaucasia, however, show a significant
number of changes of greater than five per cent
between individual years. During the whole period,
a change of greater than ten per cent between
individual years occurs only three times, each time
in South-east Europe. A change greater than 10
per cent occurs as an increase from 1999 to 2000
(20 per cent), and a decrease from 2000 to 2001
(12 per cent) and from 2004 to 2005 (17 per cent).
East Europe shows a particular turning point in
2001. Homicide rates were gradually increasing
prior to this date and began a consistent decline
thereafter. It is possible that this change is due,
in part, to increased rule of law initiatives and
reform within the subregion introduced around
this time.18
In other European subregions, homicide trends
are generally decreasing. In South-east Europe,
homicide rates declined between 2001 and 2006
by over 40 per cent after a peak in 2000: an annual
average decline of 5.1 per cent. This pattern is
matched, although less dramatically, in Central
Asia and Transcaucasia, with an annual average
decrease in the same period of 4.2 per cent. West
and Central Europe shows a decreasing trend
throughout the period 1998–2006, with an aver-
age decrease of 2.8 per cent. As a subregional
average, however, this masks the fact that, as
shown in Table 4.1, some countries showed con-
NO
N- C
ON
FLIC
T A
RM
ED
VIO
LEN
CE
79
1
2
4
5
6
7
3
sistent increases during the time period, while
others demonstrated ‘∩’- or ‘∪’-shaped trends.
By contrast, South America shows the greatest
rate of consistent increase between 1998 and
2002 (four per cent). The Central America rate
fell between 1998 and 1999, but increased con-
sistently thereafter. North America decreased
between 1998 and 2002, with an average annual
decrease of 2.4 per cent. The Caribbean shows
no clear linear increase, but presented a homicide
rate six per cent higher in 2002 than 1998. The
increasing trend in the Caribbean links with pre-
vious findings of rising crime in the subregion
and a vulnerability to narcotics trafficking and
the violence associated with it (UNODC and World
Bank, 2007, p. ii).
Trend analysis for the Americas, Europe, and
Central Asia and Transcaucasia provides a con-
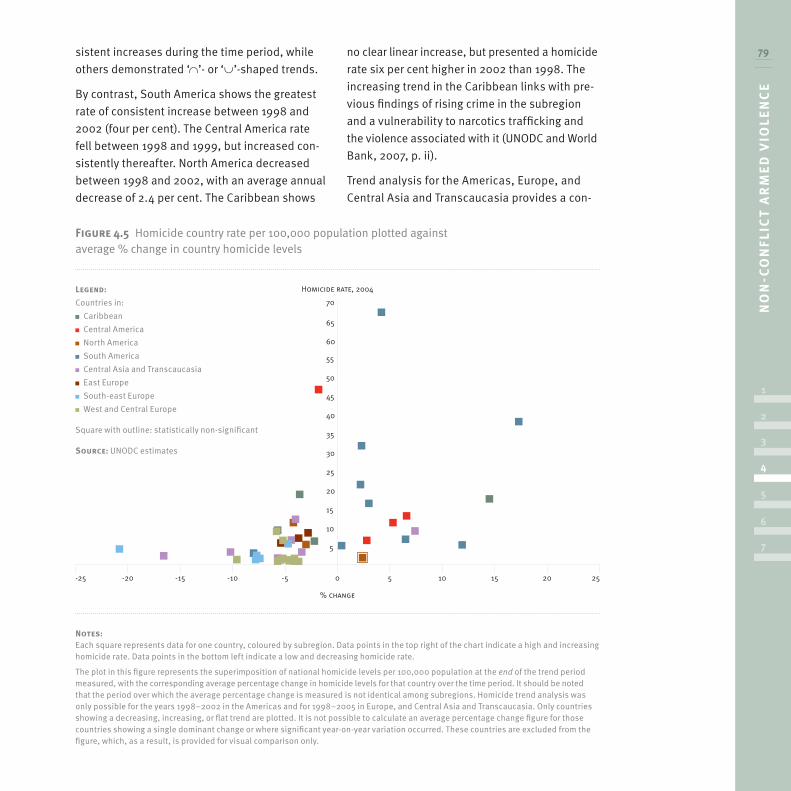
Figure 4.5 Homicide country rate per 100,000 population plotted against average % change in country homicide levels
-25 -20 -15 -10 -5 0 5 10 15 20 25
15
10
15
20
25
30
35
40
45
50
55
60
65
70
% change
Homicide rate, 2004
Notes: Each square represents data for one country, coloured by subregion. Data points in the top right of the chart indicate a high and increasing homicide rate. Data points in the bottom left indicate a low and decreasing homicide rate.
The plot in this figure represents the superimposition of national homicide levels per 100,000 population at the end of the trend period measured, with the corresponding average percentage change in homicide levels for that country over the time period. It should be noted that the period over which the average percentage change is measured is not identical among subregions. Homicide trend analysis was only possible for the years 1998–2002 in the Americas and for 1998–2005 in Europe, and Central Asia and Transcaucasia. Only countries showing a decreasing, increasing, or flat trend are plotted. It is not possible to calculate an average percentage change figure for those countries showing a single dominant change or where significant year-on-year variation occurred. These countries are excluded from the figure, which, as a result, is provided for visual comparison only.
Legend:
Countries in:
Caribbean
Central America
North America
South America
Central Asia and Transcaucasia
East Europe
South-east Europe
West and Central Europe
Square with outline: statistically non-significant
Source: UNODC estimates
GLO
BA
L B
UR
DEN
of
AR
MED
VIO
LEN
CE
80 text to the global subregional estimates for 2004
presented above. The high subregional 2004
homicide value for South America (25.9 per
100,000 population), for example, is a result of a
consistent increase in homicide levels between
1998 and 2002. At the lower end of the scale, it
can be seen that subregions with comparatively
low homicide rates in 2004—West and Central
Europe, South-east Europe, and Central Asia and
Transcaucasia—have achieved such values through
consistent and, in some cases, marked decreases
since 1998.
Figure 4.5 summarizes the homicide trends. It
provides a visual indication of homicide levels
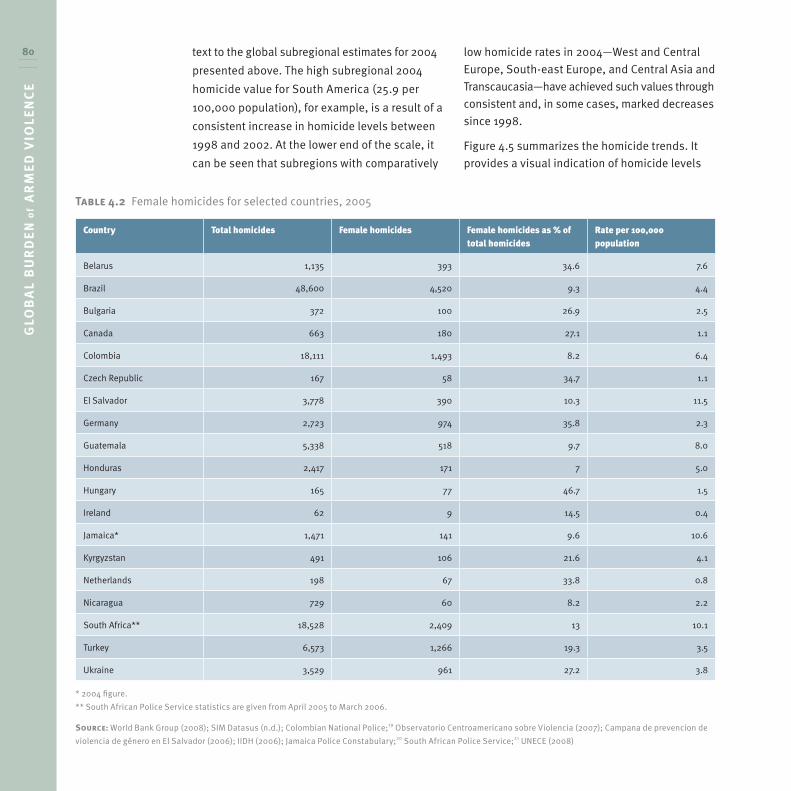
Table 4.2 Female homicides for selected countries, 2005
Country Total homicides Female homicides Female homicides as % of total homicides
Rate per 100,000 population
Belarus 1,135 393 34.6 7.6
Brazil 48,600 4,520 9.3 4.4
Bulgaria 372 100 26.9 2.5
Canada 663 180 27.1 1.1
Colombia 18,111 1,493 8.2 6.4
Czech Republic 167 58 34.7 1.1
El Salvador 3,778 390 10.3 11.5
Germany 2,723 974 35.8 2.3
Guatemala 5,338 518 9.7 8.0
Honduras 2,417 171 7 5.0
Hungary 165 77 46.7 1.5
Ireland 62 9 14.5 0.4
Jamaica* 1,471 141 9.6 10.6
Kyrgyzstan 491 106 21.6 4.1
Netherlands 198 67 33.8 0.8
Nicaragua 729 60 8.2 2.2
South Africa** 18,528 2,409 13 10.1
Turkey 6,573 1,266 19.3 3.5
Ukraine 3,529 961 27.2 3.8
* 2004 figure.
** South African Police Service statistics are given from April 2005 to March 2006.
Source: World Bank Group (2008); SIM Datasus (n.d.); Colombian National Police;19 Observatorio Centroamericano sobre Violencia (2007); Campana de prevencion de
violencia de género en El Salvador (2006); IIDH (2006); Jamaica Police Constabulary;20 South African Police Service;21 UNECE (2008)
NO
N- C
ON
FLIC
T A
RM
ED
VIO
LEN
CE
81
1
2
4
5
6
7
3
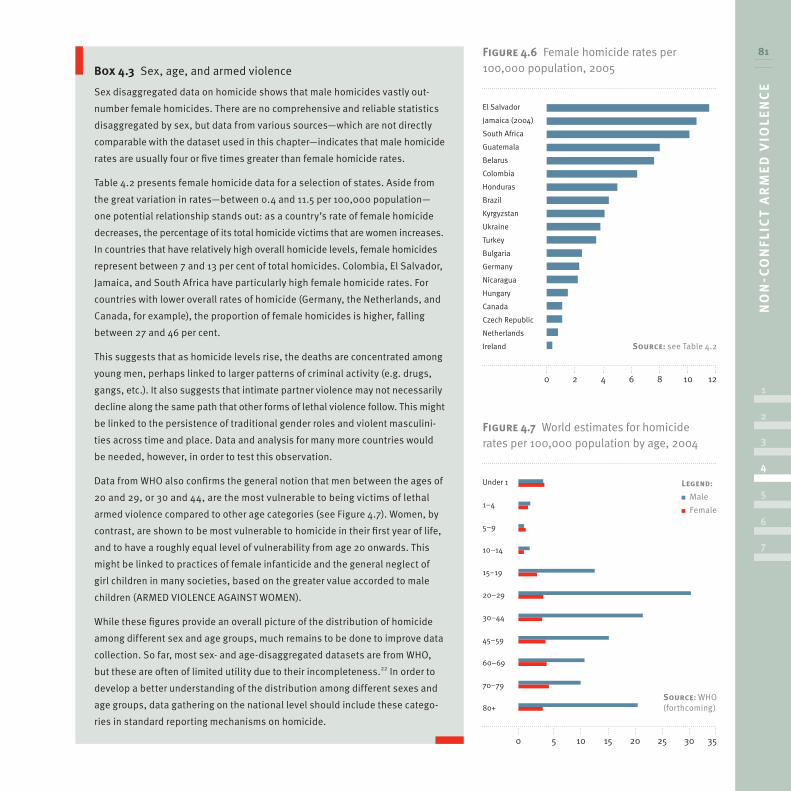
Box 4.3 Sex, age, and armed violence
Sex disaggregated data on homicide shows that male homicides vastly out-
number female homicides. There are no comprehensive and reliable statistics
disaggregated by sex, but data from various sources—which are not directly
comparable with the dataset used in this chapter—indicates that male homicide
rates are usually four or five times greater than female homicide rates.
Table 4.2 presents female homicide data for a selection of states. Aside from
the great variation in rates—between 0.4 and 11.5 per 100,000 population—
one potential relationship stands out: as a country’s rate of female homicide
decreases, the percentage of its total homicide victims that are women increases.
In countries that have relatively high overall homicide levels, female homicides
represent between 7 and 13 per cent of total homicides. Colombia, El Salvador,
Jamaica, and South Africa have particularly high female homicide rates. For
countries with lower overall rates of homicide (Germany, the Netherlands, and
Canada, for example), the proportion of female homicides is higher, falling
between 27 and 46 per cent.
This suggests that as homicide levels rise, the deaths are concentrated among
young men, perhaps linked to larger patterns of criminal activity (e.g. drugs,
gangs, etc.). It also suggests that intimate partner violence may not necessarily
decline along the same path that other forms of lethal violence follow. This might
be linked to the persistence of traditional gender roles and violent masculini-
ties across time and place. Data and analysis for many more countries would
be needed, however, in order to test this observation.
Data from WHO also confirms the general notion that men between the ages of
20 and 29, or 30 and 44, are the most vulnerable to being victims of lethal
armed violence compared to other age categories (see Figure 4.7). Women, by
contrast, are shown to be most vulnerable to homicide in their first year of life,
and to have a roughly equal level of vulnerability from age 20 onwards. This
might be linked to practices of female infanticide and the general neglect of
girl children in many societies, based on the greater value accorded to male
children (ARMED VIOLENCE AGAINST WOMEN).
While these figures provide an overall picture of the distribution of homicide
among different sex and age groups, much remains to be done to improve data
collection. So far, most sex- and age-disaggregated datasets are from WHO,
but these are often of limited utility due to their incompleteness.22 In order to
develop a better understanding of the distribution among different sexes and
age groups, data gathering on the national level should include these catego-
ries in standard reporting mechanisms on homicide.
Figure 4.6 Female homicide rates per 100,000 population, 2005
El Salvador
Jamaica (2004)
South Africa
Guatemala
Belarus
Colombia
Honduras
Brazil
Kyrgyzstan
Ukraine
Turkey
Bulgaria
Germany
Nicaragua
Hungary
Canada
Czech Republic
Netherlands
Ireland
2 4 6 8 10 120
Source: see Table 4.2
Figure 4.7 World estimates for homicide rates per 100,000 population by age, 2004
Under 1
1–4
5–9
10–14
15–19
20–29
30–44
45–59
60–69
70–79
80+
10 15 20 25 30 350 5
Legend:
Male
Female
Source: WHO (forthcoming)
GLO
BA
L B
UR
DEN
of
AR
MED
VIO
LEN
CE
82
and rates of change across eight subregions for
47 countries (but see the note beneath the figure).
The countries of South and Central America pre-
dominantly fall towards the top right of the graph,
indicating high and increasing homicide levels
between 1998 and 2002. The countries of West
and Central Europe, South-east Europe, and
North America fall to the bottom left, indicating
low and decreasing homicide levels (between
1998 and 2005). Countries of the Caribbean and
Central Asia are more widely distributed. They
generally fall higher in the graph and to the left.
A number of outliers, however, show strongly
increasing trends with resultant effects on overall
subregional trends. Overall, this figure suggests
that homicide rates are highly sensitive to local
factors, including, as discussed above, cross-
national differences in healthcare systems.
Armed violence and the criminal justice systemAn effective criminal justice response to armed violence is an important element of prevention and reduction policies—both for its deterrent effect and for the prevention of reoffending. An effective and successful criminal justice system boosts public confidence and perceptions of security. As might be expected, however, the ‘success’ of a criminal justice system in detecting crime and bringing perpetrators to justice depends on many factors. These range from the efficiency and level of resources and training of police and justice personnel to the level of sophistication of criminal activity in a particular country and the degree to which corruption and bribery allow criminals to operate with impunity.
The measurement of ‘success’ is a complex task, and a number of possible tools have been pro-posed. The justice attrition rate compares the number of recorded cases of armed violence, the number of persons arrested for this crime, the number of persons prosecuted, the number of persons convicted, and the number of persons sentenced to deprivation of liberty. The utility of the method suffers, however, from the fact that police, prosecution, court, and penal systems frequently use different methods of case record-ing and different definitions, and from the problem that cases may take a significant amount of time to be processed by the police and justice system. As a result, comparison of such figures as pub-lished in official statistics is rarely appropriate.
Another tool is the police detection rate. The detec-tion rate is frequently defined simply as the number of cases solved divided by the number of cases recorded (Smit, Meijer, and Groen, 2004, p. 229). The Tenth UN Survey of Crime Trends and Operations of Criminal Justice Systems (UN, 2006) defined a
case ‘solved’ if it conforms to the following criteria:
Box 4.4 Up close and personal:
arms availability and female homicide
The simple existence of a gun in a household increases the risk for women
becoming a homicide victim. In the United States, between 40 and 50 per
cent of all female homicides are intimate partner homicides. Of these hom-
icides, 67–80 per cent involve physical abuse of the female by the male
partner before the homicide. Access to a gun and previous threats with a
gun have been found to increase the risk of homicide by about three times
(Kellermann et al., 1993; Campbell et al., 2003, p. 1089).
In 2005 in the United States, 1,858 females were murdered by men. More
than 50 per cent (52 per cent) of these female homicides were committed
with firearms, and more than 90 per cent (92 per cent) of the victims were
murdered by someone they knew (VPC, 2007). In South Africa, 43 per cent
of female homicides were committed with a gun in 2000, making it a major
external cause of death for women. The majority of these homicides are
committed by legally possessed firearms. Thus, rather than contributing
to higher levels of protection, gun ownership at home can increase the risk
of homicide by a family member or intimate partner (Campbell et al., 2003,
p. 1084; NIMSS, 2001, p. 21).
NO
N- C
ON
FLIC
T A
RM
ED
VIO
LEN
CE
83
1
2
4
5
6
7
3
The police are satisfied of a suspect’s guilt
because there is a corroborated confession
and/or because of the weight of the evidence
against him or;
The offender was caught in the act (even if he
denies all guilt) or;
The person who committed the offence has
been identified (regardless of whether he is in
custody, on provisional release, still at large,
or dead) or;
Police investigations reveal that no penal
offence was in fact committed (UN, 2007b,
p. 39).
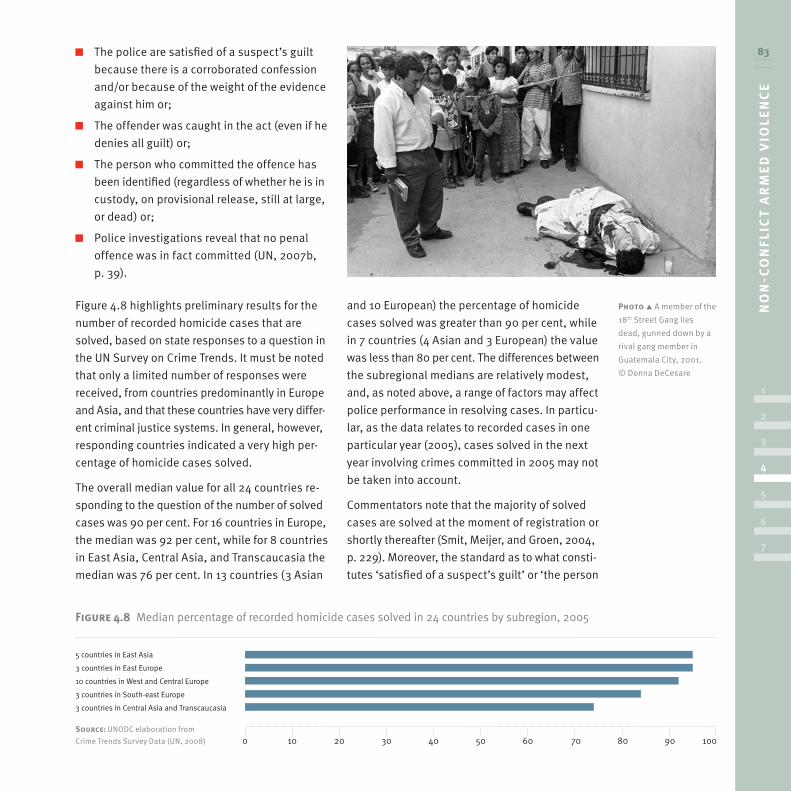
Figure 4.8 highlights preliminary results for the
number of recorded homicide cases that are
solved, based on state responses to a question in
the UN Survey on Crime Trends. It must be noted
that only a limited number of responses were
received, from countries predominantly in Europe
and Asia, and that these countries have very differ-
ent criminal justice systems. In general, however,
responding countries indicated a very high per-
centage of homicide cases solved.
The overall median value for all 24 countries re-
sponding to the question of the number of solved
cases was 90 per cent. For 16 countries in Europe,
the median was 92 per cent, while for 8 countries
in East Asia, Central Asia, and Transcaucasia the
median was 76 per cent. In 13 countries (3 Asian
and 10 European) the percentage of homicide
cases solved was greater than 90 per cent, while
in 7 countries (4 Asian and 3 European) the value
was less than 80 per cent. The differences between
the subregional medians are relatively modest,
and, as noted above, a range of factors may affect
police performance in resolving cases. In particu-
lar, as the data relates to recorded cases in one
particular year (2005), cases solved in the next
year involving crimes committed in 2005 may not
be taken into account.
Commentators note that the majority of solved
cases are solved at the moment of registration or
shortly thereafter (Smit, Meijer, and Groen, 2004,
p. 229). Moreover, the standard as to what consti-
tutes ‘satisfied of a suspect’s guilt’ or ‘the person
Photo A member of the
18th Street Gang lies
dead, gunned down by a
rival gang member in
Guatemala City, 2001.
© Donna DeCesare
Figure 4.8 Median percentage of recorded homicide cases solved in 24 countries by subregion, 2005
0 10 20 30 40 50 60 70 80 90 100
5 countries in East Asia
3 countries in East Europe
10 countries in West and Central Europe
3 countries in South-east Europe
3 countries in Central Asia and Transcaucasia
Source: UNODC elaboration from
Crime Trends Survey Data (UN, 2008)
GLO
BA
L B
UR
DEN
of
AR
MED
VIO
LEN
CE
84
who committed the offence has been identified’
may vary between countries. The suspect may
or may not have to be formally charged before this
criterion is satisfied. Overall, while little may be
said about the differences between subregions,
the results indicate a generally high level of suc-
cess of the various criminal justice systems.
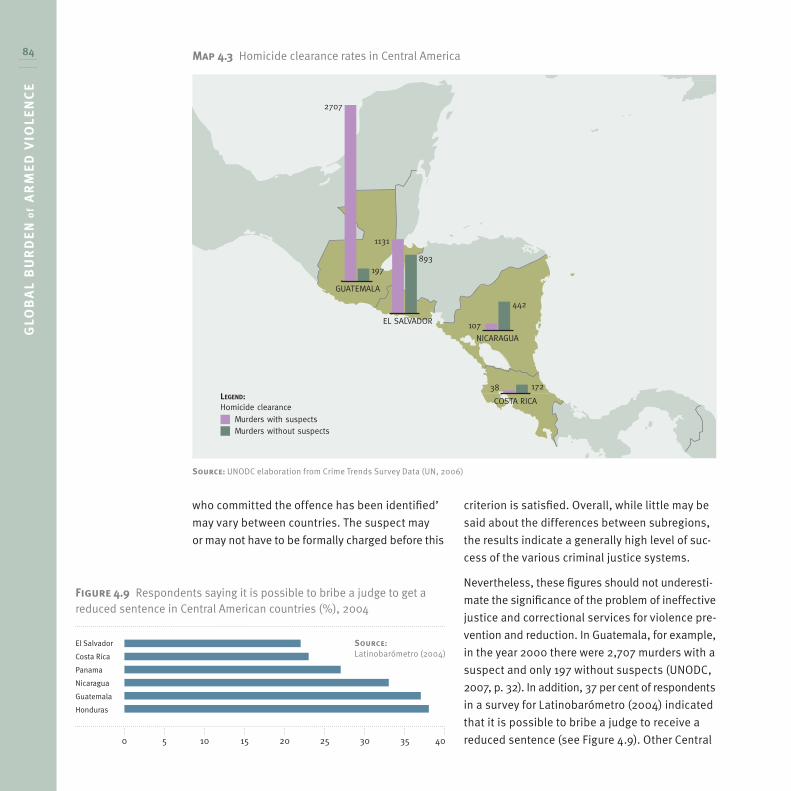
Nevertheless, these figures should not underesti-
mate the significance of the problem of ineffective
justice and correctional services for violence pre-
vention and reduction. In Guatemala, for example,
in the year 2000 there were 2,707 murders with a
suspect and only 197 without suspects (UNODC,
2007, p. 32). In addition, 37 per cent of respondents
in a survey for Latinobarómetro (2004) indicated
that it is possible to bribe a judge to receive a
reduced sentence (see Figure 4.9). Other Central
Figure 4.9 Respondents saying it is possible to bribe a judge to get a reduced sentence in Central American countries (%), 2004
El Salvador
Costa Rica
Panama
Nicaragua
Guatemala
Honduras
0 5 10 15 20 25 30 35 40
Source: Latinobarómetro (2004)
Homicide clearance
GUATEMALA
EL SALVADOR
2707
197
1131
893
NICARAGUA
107
442
COSTA RICA
38 172
SOURCE: UNODC elaboration from Crime Trends Survey Data (UN, 2006)
LEGEND:
Murders with suspectsMurders without suspects
MAP 4.3 Homicide clearance rates in Central AmericaMap 4.3 Homicide clearance rates in Central America
Source: UNODC elaboration from Crime Trends Survey Data (UN, 2006)
NO
N- C
ON
FLIC
T A
RM
ED
VIO
LEN
CE
85
1
2
4
5
6
7
3
American countries have similar trends, even if
they are not as acute as Guatemala (Map 4.3). In
Africa, the chances of a murder resulting in a con-
viction are only around 11 per cent. This figure
increases to 18 per cent in South Africa and stands
in comparison to 56 per cent in the United States
and 61 per cent in the United Kingdom (UNODC,
2005, p. 13).
The inability to prosecute offenders, corruption,
and the absence of adequate prison facilities
foster a perception of impunity for homicide. The
experience of justice reform in Jamaica and the
Dominican Republic highlights that better coopera-
tion among the police, justice, and correctional serv-
ices (supported by integrated information systems)
and embedding justice reform in a broader multi-
sector strategy of violence and crime prevention
can help in dealing with impunity and increase the
effectiveness of institutional responses to crime
(UNODC and World Bank, 2007, pp. 126–27).
Conclusion: knowledge gaps and policy implicationsThe use of international homicide data as an in-
direct means to assess the global burden of armed
violence is in its infancy. This chapter has made
use of extensive and rigorous data gathering and
analysis in order to provide a comprehensive
snapshot of the scale and magnitude of lethal
non-conflict armed violence. It has also attempted
to provide some indication of recent trends, and
of the possible spatial, demographic, and socio-
economic factors that might affect levels of
armed violence.
Some cross-national comparisons of homicide levels
have recently begun to appear in development-
related publications, including the Human Develop-
Box 4.5 Violent death in the city
Received wisdom claims that victimization by more serious crimes is cor-related with increases in the proportion of the population of a country living in larger cities. Criminologists frequently argue that urban density is thought to be associated with crime, since greater concentrations of people lead to competition for limited resources, greater stress, and increased conflict (Glaeser and Sacerdote, 1996; Van Dijk, 1998, p. 69; Naudé, Prinsloo, and Ladikos, 2006).
When it comes to urban armed violence, however, its frequency and effect is strikingly heterogeneous and it results from multiple causes. It is linked to factors such as the drug trade, the availability of weapons, and forms of social organization such as street gangs and militia or quasi-militia groups (Small Arms Survey, 2007). While not all urban violence ends in homicide, homicide rates are related to more general violent acts.
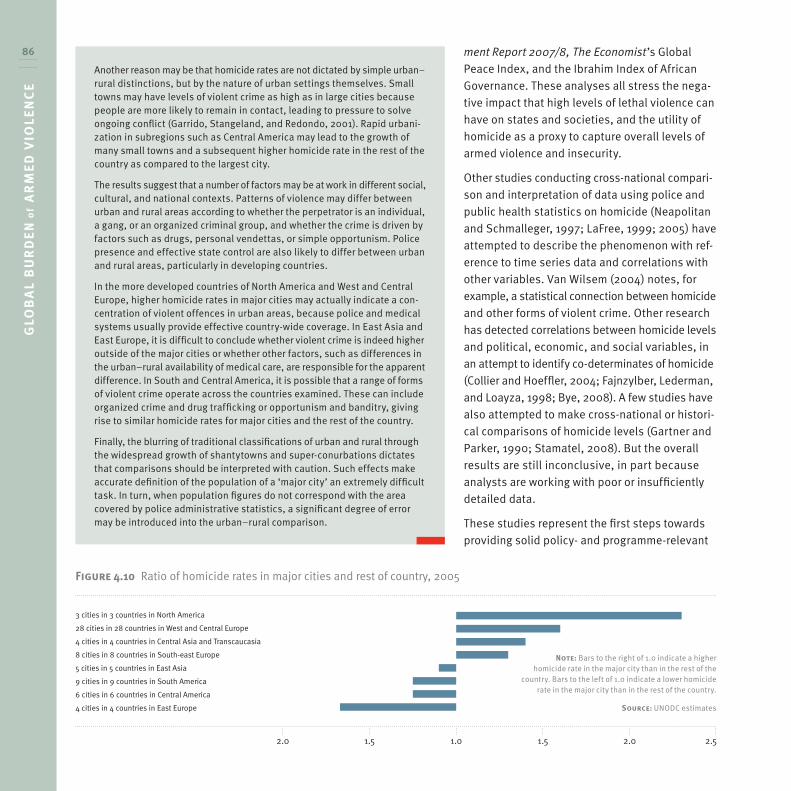
The complexity of urban armed violence is highlighted by the fact that there is no clear correlation between city population and levels of urban homicide (Small Arms Survey, 2007). In order to provide further insight into differ-ences between urban and rural homicide rates, research was undertaken to identify homicide rates per 100,000 population in major cities. Data for the largest available city in 67 countries was located. The cities ranged from a population of just over 6,000 persons to more than 14 million per-sons. The median city population was slightly over 1.2 million. The results of this comparison are presented in Figure 4.10 and are summarized by subregion. Insufficient data prevented meaningful comparisons being carried out for Africa, Oceania, and Asia, with the exception of East Asia. The methodology for major city/rest of country comparisons is described in full in the on-line appendix (www.genevadeclaration.org).
A common theme in the literature is that crime levels are higher in urban areas than rural areas (UN-HABITAT, 2006). While this may be true for North America, Central Asia and Transcaucasia, West and Central Europe, and South-east Europe, the reverse appears to be true for East Europe, Central America, and East Asia. South America shows only a small differ-ence between urban and rural homicide rates.
A first possible explanation for differences may relate to differing degrees of urbanization in the rest of the country. The ‘major city’ rate may, for instance, be compared with a ‘rest of country’ rate that itself contains many large urban centres. A look at urbanization rates only partially explains the differences, however. While a low urbanization rate in Central Asia and Transcaucasia (50 per cent) corresponds with a homicide rate one and a half times as high in the largest city as for rest of country, the pattern is more complicated in other subregions. The four countries examined in East Europe and the five countries in East Asia, for example, show average urbani-zation rates (both around 60 per cent) lower than those for the countries examined in North America (80 per cent) and West and Central Europe (73 per cent).23 This is despite the fact that East Europe and East Asia show higher homicide rates for ‘rest of country’ than major cities.
GLO
BA
L B
UR
DEN
of
AR
MED
VIO
LEN
CE
86 ment Report 2007/8, The Economist’s Global Peace Index, and the Ibrahim Index of African Governance. These analyses all stress the nega-tive impact that high levels of lethal violence can have on states and societies, and the utility of homicide as a proxy to capture overall levels of armed violence and insecurity.
Other studies conducting cross-national compari-son and interpretation of data using police and public health statistics on homicide (Neapolitan and Schmalleger, 1997; LaFree, 1999; 2005) have attempted to describe the phenomenon with ref-erence to time series data and correlations with other variables. Van Wilsem (2004) notes, for example, a statistical connection between homicide and other forms of violent crime. Other research has detected correlations between homicide levels and political, economic, and social variables, in an attempt to identify co-determinates of homicide (Collier and Hoeffler, 2004; Fajnzylber, Lederman, and Loayza, 1998; Bye, 2008). A few studies have also attempted to make cross-national or histori-cal comparisons of homicide levels (Gartner and Parker, 1990; Stamatel, 2008). But the overall results are still inconclusive, in part because analysts are working with poor or insufficiently detailed data.
These studies represent the first steps towards providing solid policy- and programme-relevant
Another reason may be that homicide rates are not dictated by simple urban–rural distinctions, but by the nature of urban settings themselves. Small towns may have levels of violent crime as high as in large cities because people are more likely to remain in contact, leading to pressure to solve ongoing conflict (Garrido, Stangeland, and Redondo, 2001). Rapid urbani-zation in subregions such as Central America may lead to the growth of many small towns and a subsequent higher homicide rate in the rest of the country as compared to the largest city.
The results suggest that a number of factors may be at work in different social, cultural, and national contexts. Patterns of violence may differ between urban and rural areas according to whether the perpetrator is an individual, a gang, or an organized criminal group, and whether the crime is driven by factors such as drugs, personal vendettas, or simple opportunism. Police presence and effective state control are also likely to differ between urban and rural areas, particularly in developing countries.
In the more developed countries of North America and West and Central Europe, higher homicide rates in major cities may actually indicate a con-centration of violent offences in urban areas, because police and medical systems usually provide effective country-wide coverage. In East Asia and East Europe, it is difficult to conclude whether violent crime is indeed higher outside of the major cities or whether other factors, such as differences in the urban–rural availability of medical care, are responsible for the apparent difference. In South and Central America, it is possible that a range of forms of violent crime operate across the countries examined. These can include organized crime and drug trafficking or opportunism and banditry, giving rise to similar homicide rates for major cities and the rest of the country.
Finally, the blurring of traditional classifications of urban and rural through the widespread growth of shantytowns and super-conurbations dictates that comparisons should be interpreted with caution. Such effects make accurate definition of the population of a ‘major city’ an extremely difficult task. In turn, when population figures do not correspond with the area covered by police administrative statistics, a significant degree of error may be introduced into the urban–rural comparison.
Figure 4.10 Ratio of homicide rates in major cities and rest of country, 2005
2.0 1.5 1.0 1.5 2.0 2.5
Note: Bars to the right of 1.0 indicate a higher homicide rate in the major city than in the rest of the
country. Bars to the left of 1.0 indicate a lower homicide rate in the major city than in the rest of the country.
Source: UNODC estimates
3 cities in 3 countries in North America
28 cities in 28 countries in West and Central Europe
4 cities in 4 countries in Central Asia and Transcaucasia
8 cities in 8 countries in South-east Europe
5 cities in 5 countries in East Asia
9 cities in 9 countries in South America
6 cities in 6 countries in Central America
4 cities in 4 countries in East Europe
NO
N- C
ON
FLIC
T A
RM
ED
VIO
LEN
CE
87
1
2
4
5
6
7
3
evidence on the patterns and distribution of non-
conflict violence. Greater information on the effec-
tiveness of criminal justice systems, and on who
is at risk, from what kind of violence, from what
source, and where and when they are vulnerable
are all important keys to improving the ability of
the international community to design practical
policies to reduce the global incidence of armed
violence.
AbbreviationsGDP gross domestic product
HDI Human Development Index
UNDP United Nations Development Programme
UNODC United Nations Office on Drugs and Crime
WHO World Health Organization
Endnotes1 The most recent date for which comprehensive global
data is available is 2004.
2 The world’s regions are subdivided as follows: Africa: East Africa, North Africa, Southern Africa, West and Central Africa; Americas: Caribbean, Central America, North America, South America; Asia: Central Asia and Transcaucasia, East and South-east Asia, Near and Middle East/South-west Asia, South Asia; Europe: East Europe, South-east Europe, West and Central Europe. Oceania is not subdivided.
3 An on-line appendix (<http://www.genevadeclaration.org>) also provides a comprehensive account of the methodology used to arrive at the figures given in this chapter, including an explanation of data sources and the calculations of subregional estimates, homicide trends, major city/rest of country homicide ratios, and the percentage of homi-cides committed with firearms.
4 In official public health statistics, important differences may arise among cause-of-death recording systems. The individual responsible for determining the cause of death and the manner in which such decisions enter official statistics may also vary. In one country, doctors may enter a cause of death on a death certificate; however, in another country, a medico-legal coroner may be required to certify the cause of death. Most importantly, the public health
system cannot determine the legal existence of an inten-tional homicide, merely the fact that a person has been killed by an act of violence that appears to have been carried out intentionally. Sometimes, doctors may even be reluctant to classify a death as a homicide for social reasons or as a result of pressure from the victim’s family.
5 Described in the on-line appendix at <http://www.genevadeclaration.org>.
6 The results represented in Map 4.1, and also in Figure 4.1, correspond to population weighted averages. As a result, they are sensitive to the distorting effect of countries with particularly high or low homicide rates (outliers). An alter-native method of calculation of subregional figures is the use of median values. These are available for comparison in the on-line appendix at <http://www.genevadeclaration.org>.
7 Countries in Africa have an average HDI of 0.53. See UNDP (2008, <http://hdrstats.undp.org/indicators/1.html>).
8 Countries in Africa have an average gross domestic product per capita just over one-third that of countries in the Ameri-cas and around one-sixth that of countries in Europe. See UNDP (2008, <http://hdrstats.undp.org/indicators/5.html>).
9 On average, the richest 10 per cent in Africa earn 28 times more than the poorest 10 per cent. See UNDP (2008, <http:// hdrstats.undp.org/indicators/145.html>).
10 Forty-three per cent of the population are under the age of 15. See UNDP (2008, <http://hdrstats.undp.org/indicators/ 44.html>).
11 R2 = 0.2, for 176 countries.
12 This figure accounts for 21 armed conflicts in Africa in 2004 (see Chapter 1).
13 See UNDP (2008, <http://hdrstats.undp.org/indicators/1.html>; <http://hdrstats.undp.org/indicators/5.html>).
14 Richmond, Cheney, and Schwab (2005) estimate total non-conflict-related firearm mortality at between 196,000 and 229,000; Small Arms Survey (2004, p. 200) estimates it to be between 180,000 and 250,000.
15 In the 12 ‘boom’ countries identified, rates were reported to have increased from around 2 homicides per 100,000 population in 1956 to nearly 3 per 100,000 population in 1998, and from just below 4 per 100,000 population in 1956 to 7 per 100,000 by 1995 in developing countries. Over all 34 countries, while 30 were reported to show an upward trend direction, this was characterized as ‘sus-tained’ in only 15 countries, including the 12 considered to show a homicide boom (LaFree and Drass, 2002).
16 Insufficient data was available to enable reliable trend analysis in Africa, Oceania, and Asia, with the exception of Central Asia and Transcaucasia. In the remaining eight subregions, however, sufficient national-level data was available for trend analysis between 1998 and 2002 in
GLO
BA
L B
UR
DEN
of
AR
MED
VIO
LEN
CE
88 the Americas, and between 1998 and 2005 in Europe, and
Central Asia and Transcaucasia.
17 In West and Central Europe, some 8 countries demon-
strated significant fluctuations of up to 50 per cent from
year to year, with no overall upward or downward trend in
homicide levels.
18 During the early to mid-1990s, for example, both the
Russian Federation and Ukraine adopted significant legis-
lative acts aimed at providing a modern framework for
policing. This was followed in the mid-1990s by the adop-
tion of ‘Concept of Development’ Programmes for the reform
of police in the Russian Federation and Ukraine, which
included short-, medium-, and long-term plans relating to
police activity, resulting in changes to police legal status,
organizational structure, operational police forces, work
patterns, and supervision and control (Robertson, 2004).
19 Figures on Colombia based on data provided by the Colom-
bian National Police.
20 Figures on Jamaica based on data provided by the Jamaica
Police Constabulary.
21 South African Police Service statistics received through
written correspondence with Angelica Pino from the Centre
for Study of Violence and Reconciliation, <http://www.csvr.
org.za/>.
22 These datasets include the WHO mortality database (WHO,
n.d.); the WHO World Report on Violence and Health (WHO,
2002); the PAHO mortality database (PAHO, n.d.); the
PAHO age-standardized mortality rate (PAHO, n.d.); WHO
(forthcoming); and projected deaths by WHO region, age,
sex, and cause (WHO, 2006).
23 See UNDP (2008, <http://hdrstats.undp.org/indicators/
41.html>).