Foundations of Sensation and...
53
Transcript of Foundations of Sensation and...
Copyright © 2009 George Mather – http://www.psypress.com/mather
Foundations ofSensation andPerceptionSecond Edition
George Mather
University of Sussex, UK
Mather2008-FM.qxp 10/16/08 9:12 PM Page iii

Copyright © 2009 George Mather – http://www.psypress.com/mather
First published 2009by Psychology Press Ltd27 Church Road, Hove, East Sussex, BN3 2FA
Simultaneously published in the USA and Canadaby Taylor & Francis Inc.270 Madison Ave, New York, NY 10016
http://www.psypress.com
Psychology Press is part of the Taylor & Francis Group,an informa business
© 2009 George Mather
All rights reserved. No part of this book may be reprinted or reproduced or utilized in any form or by any electronic,mechanical, or other means, now known or hereafter invented,including photocopying and recording, or in any information storage or retrieval system, without permission in writing from the publishers.
British Library Cataloguing in Publication DataA catalogue record for this book is available from the British Library
Library of Congress Cataloging-in-Publication DataMather, George.
Foundations of sensation and perception / George Mather.—2nd ed.p.cm.
Rev. ed.: Foundations of perception. 2005.Includes bibliographical references and index.ISBN 978–1–84169–698–0 (hb) – ISBN 978–1–84169–699–7 (soft cover)
1. Perception. I. Mather, George. Foundations of perception. II. Title.BF311.M4255 2009152.1—dc22 2008026160
ISBN: 978–1–84169–698–0 (hbk)ISBN: 978–1–84169–699–7 (pbk)
Cover design by Sandra HeathTypeset by Newgen Imaging Systems (P) Ltd, Chennai, IndiaPrinted and bound in China by 1010 Printing International Ltd
Mather2008-FM.qxp 10/16/08 9:12 PM Page iv

Copyright © 2009 George Mather – http://www.psypress.com/mather
ContentsPreface to the first edition viiChanges in the second edition ix
1 General principles 2Introduction 3
Classification of the senses 4
Methods used to study perception 5
General principles of sensation and
perception 12
Chapter summary 25
Tutorials 26
2 The chemical senses 42Introduction 43
Smell 43
Taste 48
Flavor 55
Evaluation 55
Chapter summary 56
Tutorials 57
3 The body senses 60Introduction 61
The somatosensory system 61
The vestibular system 72
Chapter summary 83
Tutorials 84
4 The physics and biology of audition 90Introduction 91
Sound as a physical stimulus 91
The physiology of the auditory system 100
Chapter summary 118
Tutorials 119
5 Perception of sound 128Introduction 129
Loudness perception 129
Pitch perception 132
Auditory localization 139
Speech perception 143
Auditory scene analysis 148
Hearing dysfunction 149
Chapter summary 153
Tutorials 154
6 The physics of vision—light and the eye 158Introduction 159
What is light? 159
Some important properties of light 163
The eye 169
Chapter summary 183
Tutorials 184
7 Visual physiology 196Introduction 197
The retina 198
The visual pathway 211
The visual cortex 215
Chapter summary 228
Tutorials 229
8 Spatial vision 236Introduction 237
Fundamental functions 237
Representation at multiple spatial
scales 249
Uses of spatial filters 256
Chapter summary 265
Tutorials 266
9 Shape and object perception 274Introduction: The three-stage model 275
Shape representation 276
Object representation 283
Scene perception 289
Mather2008-FM.qxp 10/16/08 9:12 PM Page v
Copyright © 2009 George Mather – http://www.psypress.com/mather
vi Contents
Chapter summary 290
Tutorials 291
10 Depth perception 296Introduction 297
The multiplicity of depth cues 297
Cue combination 315
Chapter summary 317
Tutorials 318
11 Visual motion perception 326Introduction 327
Detecting movement 328
The integration of motion detector responses 336
Multiple processes in motion perception 342
Chapter summary 350
Tutorials 351
12 Color vision 358Introduction 359
Color space 359
Color mixture 360
Dual-process theory 368
Color interactions 369
Color deficiency 374
Chapter summary 377
Tutorials 378
13 Multisensory processing in perception 382Introduction 383
Multisensory processing 384
Synesthesia 388
Chapter summary 390
Tutorials 391
14 Individual differences in perception 398Introduction 399
Age 399
Sex 404
Culture 407
Expertise 411
Idiosyncratic individual differences 414
Chapter summary 415
Tutorials 417
References 421Author index 441Subject index 449
Mather2008-FM.qxp 10/16/08 9:12 PM Page vi
Copyright © 2009 George Mather – http://www.psypress.com/mather
Preface to the first editionMy primary aim in writing this book has been to provide a coherent, up-to-dateintroduction to the basic facts and theories concerning human sensory perception. Afull appreciation of perception requires some understanding of relevant physicalstimuli and a basic grasp of sensory physiology. Therefore, the physical andphysiological aspects of each sensory modality are considered before its perceptualcharacteristics. Emphasis is placed on how perceptual experience relates to thephysical properties of the world and to physiological constraints in the brain.
The first chapter introduces some of the techniques used to study perception, andsome important general principles that apply equally to all the sensory systems.These principles are first applied to the minor senses in the following two chapters:smell and taste (Chapter 2), and touch and balance (Chapter 3). More space isdevoted to hearing (Chapters 4 and 5), and yet more to vision (Chapters 7 to 12),reflecting the relative importance of the senses to humans. The final chapter considersindividual differences in perception relating to age, sex, culture, and expertise.
The bulk of each chapter is devoted to fundamental material that all studentsshould read. Each chapter also contains a tutorials section covering more advancedor controversial material, or newly developing areas, to offer an opportunity for fur-ther study and a bridge to more advanced texts. For example, tutorials in Chapters 4and 8 introduce Fourier analysis; tutorials in Chapter 9 discuss Bayesian inference aswell as the debate about active versus passive processing; a tutorial in Chapter 13surveys recent research on sensory integration.
The manuscript has been improved significantly as a result of the criticalcomments offered by a number of people including Chris Darwin, Graham Hole, IanHoward, Linda Murdoch, Romi Nijhawan, Daniel Osorio, and several anonymousreviewers. I am very grateful to them all for their valuable contributions, but anyremaining errors are of course down to me. I would also like to thank Mike Forster,Ruben Hale, Mandy Collison, and everyone else at Psychology Press for all theirencouragement during the protracted period of writing.
Finally I would like to dedicate the book to Anne, Laura, and Luke for theirpatience and support during the preparation of the manuscript and associatedmaterial. Laura was particularly helpful in the preparation of the indexes.
Mather2008-FM.qxp 10/16/08 9:12 PM Page vii
Copyright © 2009 George Mather – http://www.psypress.com/mather
Changes in the second editionThe publication of a full-color second edition gives me the opportunity to update thetext and add new features that readers have suggested in their comments on the firstedition (many thanks to all those who made suggestions). The most significantchanges include:
• Revised and expanded coverage of taste processing and taste perception, touchperception, pitch perception, and receptive field modeling.
• New sections on word perception, the size after-effect, crowding, sceneperception, and optic flow.
• A new chapter devoted to multisensory processing and synesthesia, with a newtutorial on attentional effects in perception (I am grateful to Jamie Ward forcomments on this chapter).
• A new tutorial on visual dysfunction in artists.
An important goal of the text is to provide references to primary sources whereverpossible, so that interested readers can delve deeper into the many fascinating aspectsof modern perceptual research. Consequently a great many new references have beenadded in the second edition to reflect the changes in the text.
I hope you find the additions to the text worthwhile and, as always, commentsfrom readers would be very much appreciated.
George MatherJanuary 2008
Mather2008-FM.qxp 10/16/08 9:12 PM Page ix
Copyright © 2009 George Mather – http://www.psypress.com/mather
CH
APTE
R 6
C O N T E N T S
Introduction 159
What is light? 159
Some important properties of light 163
The eye 169
Chapter summary 183
Tutorials 184
Mather2008-06.qxp 10/23/08 7:58 PM Page 158
Copyright © 2009 George Mather – http://www.psypress.com/mather
6The physics ofvision—light and the eyeINTRODUCTION
Before we can begin to understand visual perception, we must consider the basicproperties of the physical stimulus, light. Answers to fundamental questions aboutvision, such as why we have a light sense and how our sense organs gatherinformation from light, depend on understanding the nature of the physicalstimulus.
The physical nature of light has puzzled philosophers and scientists throughouthistory, and is still not completely understood. The Ancient Greeks believed thatvision was the result of a “fire” that is emitted by the eyes to strike objects and soreveal their shape. Plato distinguished three kinds or “fire”—daylight from the sun,fire of the same kind emitted by the eye, and fire streaming off objects to interactwith the fire emitted from the eyes (see Gregory, 1981). We now know, of course,that the eye does not emit light (except as a reflection) but only receives it. Issuesconcerning the nature of light itself have taxed some of the greatest minds in thehistory of science, including Isaac Newton, Christian Huygens, Max Planck, andAlbert Einstein.
WHAT IS L IGHT?
Light is a form of radiant energy that is capable of stimulating receptors in the eyeand evoking a visual sensation. The behavior of light can be described in threeapparently incompatible ways: as rays, as particles, and as waves. One of the majorsuccesses of modern theoretical physics has been to resolve the apparentinconsistencies between these descriptions.
L IGHT AS RAYSEveryday experience tells us that light normally travels in straight lines or rays froma light source at such a high speed that it can be considered instantaneous. Light raysare emitted from a point on a source in all directions (see Figure 6.1). Opaqueoccluding objects in the path of the rays create well-defined shadows. Light rays aredeflected (refracted), as they pass from one transmitting medium, such as air, intoanother, such as glass or water. This behavior is crucial to our understanding of howimages can be formed by lenses and mirrors.
K E Y T E R M
RefractionThe change in thedirection of a light rayas it passes from onetransmitting mediumto another, caused bya change in thevelocity ofpropagation.
Mather2008-06.qxp 10/23/08 7:58 PM Page 159
Copyright © 2009 George Mather – http://www.psypress.com/mather
160 F O U N D AT I O N S O F S E N S AT I O N A N D P E R C E P T I O N
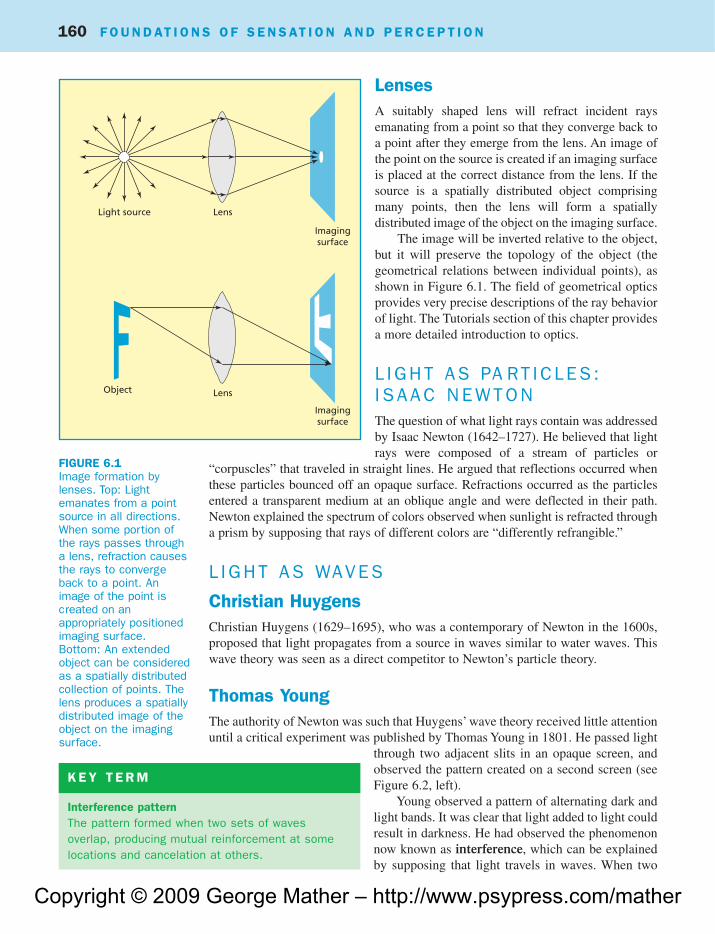
LensesA suitably shaped lens will refract incident raysemanating from a point so that they converge back toa point after they emerge from the lens. An image ofthe point on the source is created if an imaging surfaceis placed at the correct distance from the lens. If thesource is a spatially distributed object comprisingmany points, then the lens will form a spatiallydistributed image of the object on the imaging surface.
The image will be inverted relative to the object,but it will preserve the topology of the object (thegeometrical relations between individual points), asshown in Figure 6.1. The field of geometrical opticsprovides very precise descriptions of the ray behaviorof light. The Tutorials section of this chapter providesa more detailed introduction to optics.
L IGHT AS PA RT ICLES :I S A A C N E W T O NThe question of what light rays contain was addressedby Isaac Newton (1642–1727). He believed that lightrays were composed of a stream of particles or
“corpuscles” that traveled in straight lines. He argued that reflections occurred whenthese particles bounced off an opaque surface. Refractions occurred as the particlesentered a transparent medium at an oblique angle and were deflected in their path.Newton explained the spectrum of colors observed when sunlight is refracted througha prism by supposing that rays of different colors are “differently refrangible.”
L IGHT AS WAVES
Christian HuygensChristian Huygens (1629–1695), who was a contemporary of Newton in the 1600s,proposed that light propagates from a source in waves similar to water waves. Thiswave theory was seen as a direct competitor to Newton’s particle theory.
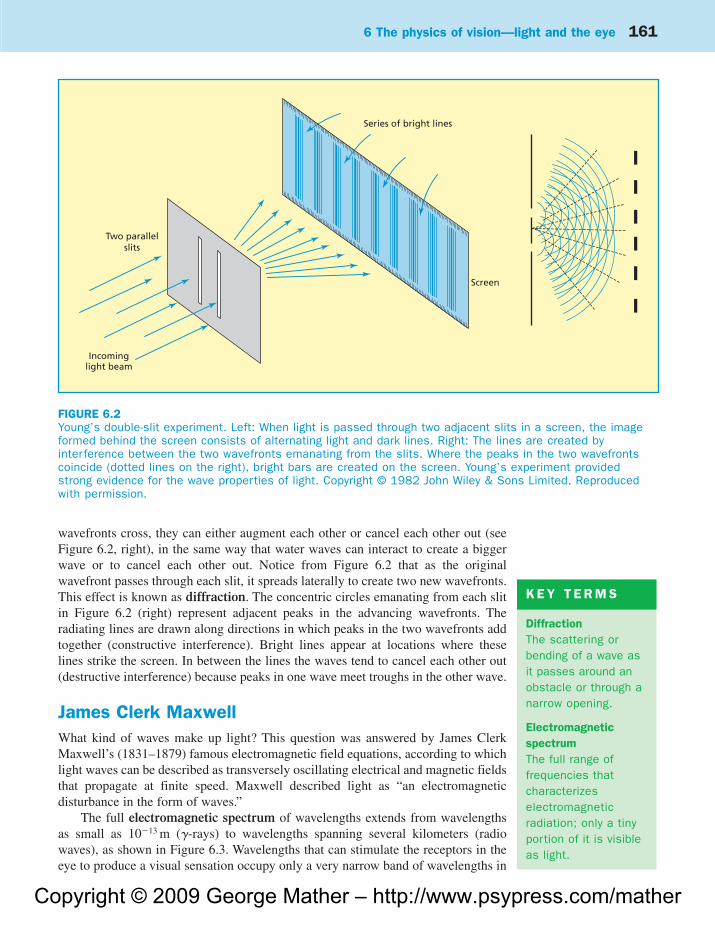
Thomas YoungThe authority of Newton was such that Huygens’ wave theory received little attentionuntil a critical experiment was published by Thomas Young in 1801. He passed light
through two adjacent slits in an opaque screen, andobserved the pattern created on a second screen (seeFigure 6.2, left).
Young observed a pattern of alternating dark andlight bands. It was clear that light added to light couldresult in darkness. He had observed the phenomenonnow known as interference, which can be explainedby supposing that light travels in waves. When two
Light source Lens
Object Lens
Imagingsurface
Imagingsurface
FIGURE 6.1Image formation bylenses. Top: Lightemanates from a pointsource in all directions.When some portion ofthe rays passes througha lens, refraction causesthe rays to convergeback to a point. Animage of the point iscreated on anappropriately positionedimaging surface.Bottom: An extendedobject can be consideredas a spatially distributedcollection of points. Thelens produces a spatiallydistributed image of theobject on the imagingsurface.
K E Y T E R M
Interference patternThe pattern formed when two sets of wavesoverlap, producing mutual reinforcement at somelocations and cancelation at others.
Mather2008-06.qxp 10/23/08 7:58 PM Page 160
Copyright © 2009 George Mather – http://www.psypress.com/mather
6 The physics of vision—light and the eye 161
wavefronts cross, they can either augment each other or cancel each other out (seeFigure 6.2, right), in the same way that water waves can interact to create a biggerwave or to cancel each other out. Notice from Figure 6.2 that as the originalwavefront passes through each slit, it spreads laterally to create two new wavefronts.This effect is known as diffraction. The concentric circles emanating from each slitin Figure 6.2 (right) represent adjacent peaks in the advancing wavefronts. Theradiating lines are drawn along directions in which peaks in the two wavefronts addtogether (constructive interference). Bright lines appear at locations where theselines strike the screen. In between the lines the waves tend to cancel each other out(destructive interference) because peaks in one wave meet troughs in the other wave.
James Clerk MaxwellWhat kind of waves make up light? This question was answered by James ClerkMaxwell’s (1831–1879) famous electromagnetic field equations, according to whichlight waves can be described as transversely oscillating electrical and magnetic fieldsthat propagate at finite speed. Maxwell described light as “an electromagneticdisturbance in the form of waves.”
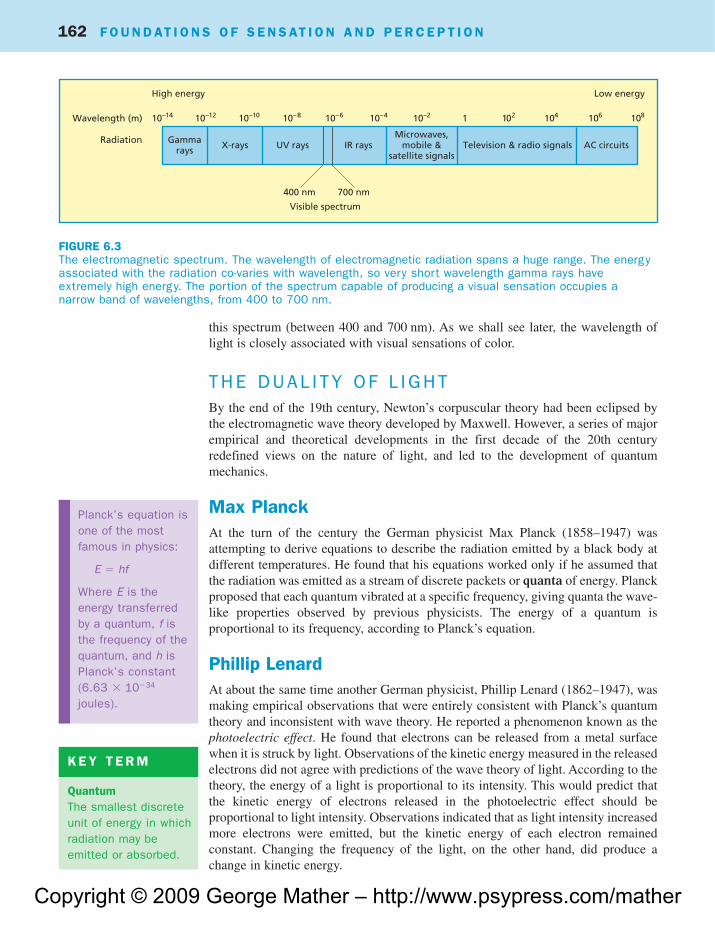
The full electromagnetic spectrum of wavelengths extends from wavelengthsas small as 10�13 m (�-rays) to wavelengths spanning several kilometers (radiowaves), as shown in Figure 6.3. Wavelengths that can stimulate the receptors in theeye to produce a visual sensation occupy only a very narrow band of wavelengths in
Screen
Two parallelslits
Incominglight beam
Series of bright lines
FIGURE 6.2Young’s double-slit experiment. Left: When light is passed through two adjacent slits in a screen, the imageformed behind the screen consists of alternating light and dark lines. Right: The lines are created byinterference between the two wavefronts emanating from the slits. Where the peaks in the two wavefrontscoincide (dotted lines on the right), bright bars are created on the screen. Young’s experiment providedstrong evidence for the wave properties of light. Copyright © 1982 John Wiley & Sons Limited. Reproducedwith permission.
K E Y T E R M S
DiffractionThe scattering orbending of a wave asit passes around anobstacle or through anarrow opening.
ElectromagneticspectrumThe full range offrequencies thatcharacterizeselectromagneticradiation; only a tinyportion of it is visibleas light.
Mather2008-06.qxp 10/23/08 7:58 PM Page 161
Copyright © 2009 George Mather – http://www.psypress.com/mather
162 F O U N D AT I O N S O F S E N S AT I O N A N D P E R C E P T I O N
this spectrum (between 400 and 700 nm). As we shall see later, the wavelength oflight is closely associated with visual sensations of color.
THE DUAL I TY OF L IGHTBy the end of the 19th century, Newton’s corpuscular theory had been eclipsed bythe electromagnetic wave theory developed by Maxwell. However, a series of majorempirical and theoretical developments in the first decade of the 20th centuryredefined views on the nature of light, and led to the development of quantummechanics.
Max PlanckAt the turn of the century the German physicist Max Planck (1858–1947) wasattempting to derive equations to describe the radiation emitted by a black body atdifferent temperatures. He found that his equations worked only if he assumed thatthe radiation was emitted as a stream of discrete packets or quanta of energy. Planckproposed that each quantum vibrated at a specific frequency, giving quanta the wave-like properties observed by previous physicists. The energy of a quantum isproportional to its frequency, according to Planck’s equation.
Phillip LenardAt about the same time another German physicist, Phillip Lenard (1862–1947), wasmaking empirical observations that were entirely consistent with Planck’s quantumtheory and inconsistent with wave theory. He reported a phenomenon known as thephotoelectric effect. He found that electrons can be released from a metal surfacewhen it is struck by light. Observations of the kinetic energy measured in the releasedelectrons did not agree with predictions of the wave theory of light. According to thetheory, the energy of a light is proportional to its intensity. This would predict thatthe kinetic energy of electrons released in the photoelectric effect should beproportional to light intensity. Observations indicated that as light intensity increasedmore electrons were emitted, but the kinetic energy of each electron remainedconstant. Changing the frequency of the light, on the other hand, did produce achange in kinetic energy.
10–14 10–12 10–10 10–8 10–6 10–4 10–2 1 102 104 106 108
Gammarays
High energy
Wavelength (m)
Radiation X-rays UV rays IR rays
400 nm 700 nm
Visible spectrum
Microwaves,mobile &
satellite signalsTelevision & radio signals AC circuits
Low energy
FIGURE 6.3The electromagnetic spectrum. The wavelength of electromagnetic radiation spans a huge range. The energyassociated with the radiation co-varies with wavelength, so very short wavelength gamma rays haveextremely high energy. The portion of the spectrum capable of producing a visual sensation occupies anarrow band of wavelengths, from 400 to 700 nm.
Planck’s equation isone of the mostfamous in physics:
E � hf
Where E is theenergy transferredby a quantum, f isthe frequency of thequantum, and h isPlanck’s constant(6.63 � 10�34
joules).
K E Y T E R M
QuantumThe smallest discreteunit of energy in whichradiation may beemitted or absorbed.
Mather2008-06.qxp 10/23/08 7:58 PM Page 162
Copyright © 2009 George Mather – http://www.psypress.com/mather
6 The physics of vision—light and the eye 163
Albert EinsteinAlbert Einstein (1879–1955) used Planck’s notion ofquanta to explain the photoelectric effect in a majortheoretical paper published in 1905. This paper laidthe foundations of the theory of quantum mechanics,according to which light (and indeed all matter) canbe considered to be both particles and waves.
Light is a wave and a particleHow can light be both a particle and a wave? The behavior of light is certainlyconsistent with both descriptions, since it propagates through space as a wave, yetbehaves like particles during emission and absorption. It must be recognized thatquanta of light are fundamentally different from the particles that we can see andtouch in everyday experience, such as pebbles or grains of sand. Light quanta aresubmicroscopic units of energy that have no mass and do not even seem to have adiscrete location. Light is both a ray, a wave, and a stream of particles. All threeaspects of behavior are important for understanding visual perception:
1. Ray properties are especially useful when attempting to understand how imagesare formed by optical devices such as eyes.
2. Wave properties are important when considering the behavior of light at a muchfiner scale, such as when dealing with passage through small apertures (e.g., thepupil) or along very narrow waveguides (e.g., photoreceptors).
3. The quantal nature of light intrudes on visual perception when light intensity isso low that quantum absorptions can be counted individually.
Both wave and particle models of light can be related to the color sensationsproduced by light. According to wave theory, color depends on frequency (thefrequency of violet light is about twice that of red light). According to particle theory,color depends on energy (violet quanta transfer twice as much energy as red quanta).The two models are related via Planck’s equation (see the box on the previous page).Discussions of color vision generally prefer to use the wave model.
SOME IMPORTANT PROPERTIES OF L IGHT
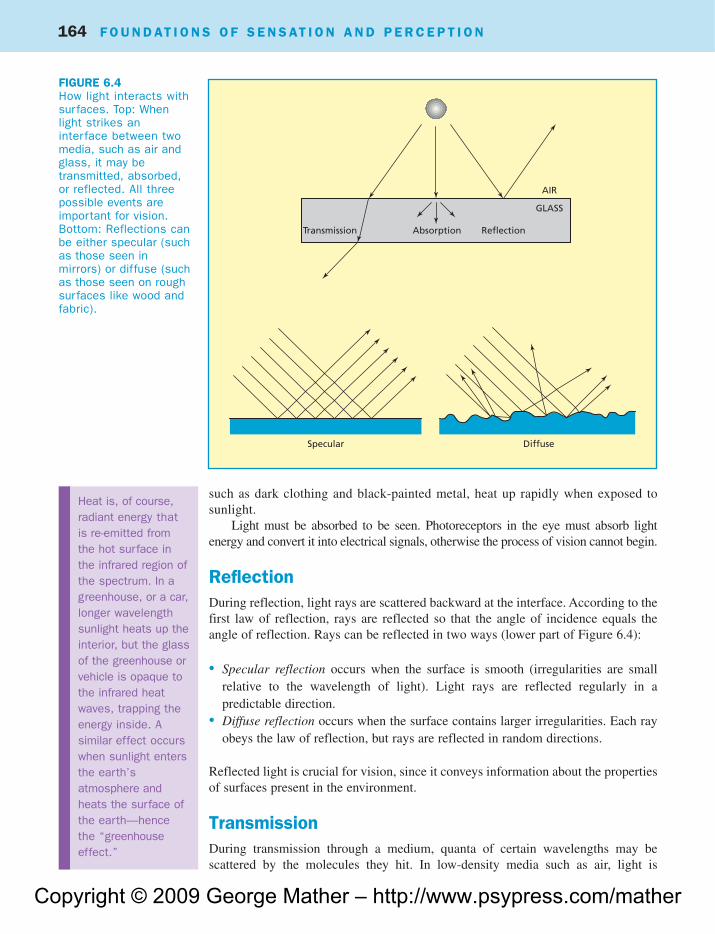
ABSORPT ION , REFLECT ION ,TRANSMISS IONWhen light strikes the interface between two substances (e.g., between air and glass),it may be transmitted, absorbed, or reflected, as shown in Figure 6.4. All threeproperties are crucial for vision.
AbsorptionDuring absorption, light quanta are taken up by the substance and converted intothermal energy. Substances that absorb a high proportion of incident radiation,
Light quanta arealso known asphotons. This termwas introduced byLewis (1926).
Einstein published two other theoretical papers in1905, while working as a clerk in the SwissPatent Office in Bern. One paper concerned therandom motion of small particles, and the otherconcerned the special theory of relativity. Einsteinreceived a Nobel Prize for this work in 1921.Lenard and Planck also received Nobel Prizes fortheir work, in 1905 and 1918 respectively.
Mather2008-06.qxp 10/23/08 7:58 PM Page 163
Copyright © 2009 George Mather – http://www.psypress.com/mather
164 F O U N D AT I O N S O F S E N S AT I O N A N D P E R C E P T I O N
such as dark clothing and black-painted metal, heat up rapidly when exposed tosunlight.
Light must be absorbed to be seen. Photoreceptors in the eye must absorb lightenergy and convert it into electrical signals, otherwise the process of vision cannot begin.
ReflectionDuring reflection, light rays are scattered backward at the interface. According to thefirst law of reflection, rays are reflected so that the angle of incidence equals theangle of reflection. Rays can be reflected in two ways (lower part of Figure 6.4):
• Specular reflection occurs when the surface is smooth (irregularities are smallrelative to the wavelength of light). Light rays are reflected regularly in apredictable direction.
• Diffuse reflection occurs when the surface contains larger irregularities. Each rayobeys the law of reflection, but rays are reflected in random directions.
Reflected light is crucial for vision, since it conveys information about the propertiesof surfaces present in the environment.
TransmissionDuring transmission through a medium, quanta of certain wavelengths may bescattered by the molecules they hit. In low-density media such as air, light is
Transmission Absorption Reflection
GLASS
AIR
Specular Diffuse
FIGURE 6.4How light interacts withsurfaces. Top: Whenlight strikes aninterface between twomedia, such as air andglass, it may betransmitted, absorbed,or reflected. All threepossible events areimportant for vision.Bottom: Reflections canbe either specular (suchas those seen inmirrors) or diffuse (suchas those seen on roughsurfaces like wood andfabric).
Heat is, of course,radiant energy thatis re-emitted fromthe hot surface inthe infrared region ofthe spectrum. In agreenhouse, or a car,longer wavelengthsunlight heats up theinterior, but the glassof the greenhouse orvehicle is opaque tothe infrared heatwaves, trapping theenergy inside. Asimilar effect occurswhen sunlight entersthe earth’satmosphere andheats the surface ofthe earth—hencethe “greenhouseeffect.”
Mather2008-06.qxp 10/23/08 7:58 PM Page 164
Copyright © 2009 George Mather – http://www.psypress.com/mather
6 The physics of vision—light and the eye 165
scattered laterally. Air molecules scatter light in the blue region of the spectrum,resulting in the bluish appearance of the sky. In dense, uniform media such as glassthere is very little lateral scattering, because of destructive interference. Scatteringoccurs mostly in the forward direction. The interference between the original waveand waves produced by forward scattering results in a retardation of the wavefront asit passes through the medium.
Refraction
An important consequence of the retardation of light during transmission through amedium is refraction, a change in the direction of the path of light rays as they entera transmitting medium obliquely. The degree of change in direction depends on theextent to which the wavefront is retarded, and this in turn depends on the refractiveindex of the transmitting medium. Materials with higher indices retard light more,and consequently produce greater angles of refraction. Air has a refractive indexclose to 1.0, meaning that light is retarded very little during its transmission. Glasshas a refractive index of approximately 1.5, so when light strikes an interfacebetween air and glass it will change direction.
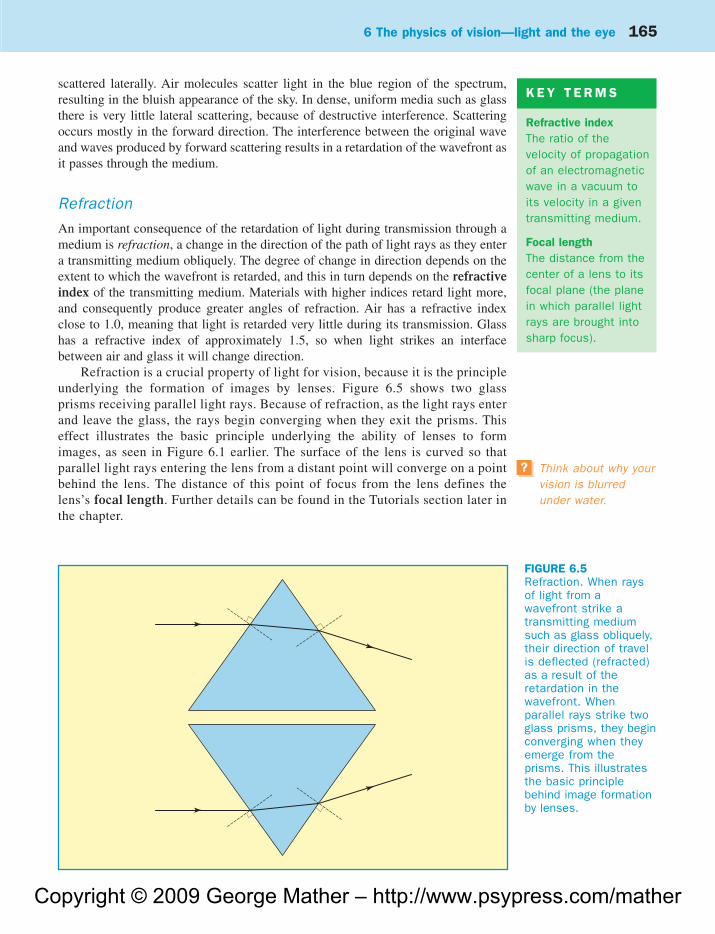
Refraction is a crucial property of light for vision, because it is the principleunderlying the formation of images by lenses. Figure 6.5 shows two glassprisms receiving parallel light rays. Because of refraction, as the light rays enterand leave the glass, the rays begin converging when they exit the prisms. Thiseffect illustrates the basic principle underlying the ability of lenses to formimages, as seen in Figure 6.1 earlier. The surface of the lens is curved so thatparallel light rays entering the lens from a distant point will converge on a pointbehind the lens. The distance of this point of focus from the lens defines thelens’s focal length. Further details can be found in the Tutorials section later inthe chapter.
FIGURE 6.5Refraction. When raysof light from awavefront strike atransmitting mediumsuch as glass obliquely,their direction of travelis deflected (refracted)as a result of theretardation in thewavefront. Whenparallel rays strike twoglass prisms, they beginconverging when theyemerge from theprisms. This illustratesthe basic principlebehind image formationby lenses.
Think about why yourvision is blurredunder water.
?
K E Y T E R M S
Refractive indexThe ratio of thevelocity of propagationof an electromagneticwave in a vacuum toits velocity in a giventransmitting medium.
Focal lengthThe distance from thecenter of a lens to itsfocal plane (the planein which parallel lightrays are brought intosharp focus).
Mather2008-06.qxp 10/23/08 7:58 PM Page 165
Copyright © 2009 George Mather – http://www.psypress.com/mather
166 F O U N D AT I O N S O F S E N S AT I O N A N D P E R C E P T I O N
I N TENS I TYThe intensity of a light source ultimately depends on the number of quanta itemits per unit of time. A range of physical units, known as radiometric units, hasbeen developed to measure intensity. However, the effectiveness of light quanta asa stimulus for vision depends on their wavelength properties, since the humanvisual system is more sensitive to some wavelengths than to others. So in thecontext of vision, light intensity is usually specified in photometric units thattake account of human sensitivity. The most commonly used unit is “candelas persquare meter” (abbreviated to cd/m2, or equivalently cd·m�2), which measures theintensity of the light emanating from a surface relative to that of a standard light.Further details on different measures of light intensity can be found in theTutorials section.
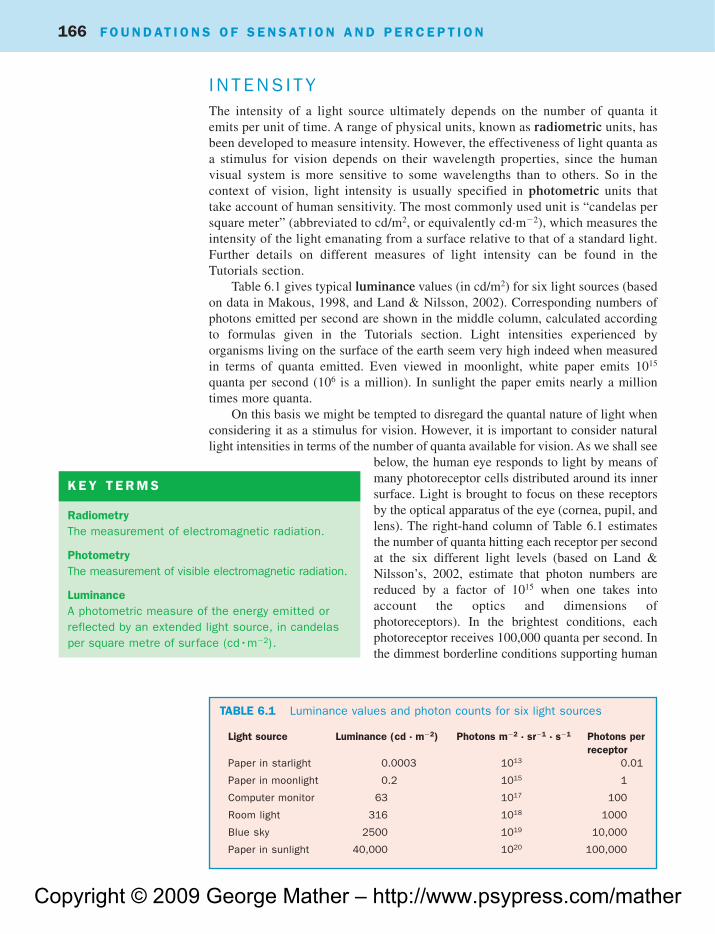
Table 6.1 gives typical luminance values (in cd/m2) for six light sources (basedon data in Makous, 1998, and Land & Nilsson, 2002). Corresponding numbers ofphotons emitted per second are shown in the middle column, calculated accordingto formulas given in the Tutorials section. Light intensities experienced byorganisms living on the surface of the earth seem very high indeed when measuredin terms of quanta emitted. Even viewed in moonlight, white paper emits 1015
quanta per second (106 is a million). In sunlight the paper emits nearly a milliontimes more quanta.
On this basis we might be tempted to disregard the quantal nature of light whenconsidering it as a stimulus for vision. However, it is important to consider naturallight intensities in terms of the number of quanta available for vision. As we shall see
below, the human eye responds to light by means ofmany photoreceptor cells distributed around its innersurface. Light is brought to focus on these receptorsby the optical apparatus of the eye (cornea, pupil, andlens). The right-hand column of Table 6.1 estimatesthe number of quanta hitting each receptor per secondat the six different light levels (based on Land &Nilsson’s, 2002, estimate that photon numbers arereduced by a factor of 1015 when one takes intoaccount the optics and dimensions ofphotoreceptors). In the brightest conditions, eachphotoreceptor receives 100,000 quanta per second. Inthe dimmest borderline conditions supporting human
Light source Luminance (cd . m�2) Photons m�2 . sr�1 . s�1 Photons perreceptor
Paper in starlight 0.0003 1013 0.01
Paper in moonlight 0.2 1015 1
Computer monitor 63 1017 100
Room light 316 1018 1000
Blue sky 2500 1019 10,000
Paper in sunlight 40,000 1020 100,000
TABLE 6.1 Luminance values and photon counts for six light sources
K E Y T E R M S
RadiometryThe measurement of electromagnetic radiation.
PhotometryThe measurement of visible electromagnetic radiation.
LuminanceA photometric measure of the energy emitted orreflected by an extended light source, in candelasper square metre of surface (cd•m�2).
Mather2008-06.qxp 10/23/08 7:58 PM Page 166
Copyright © 2009 George Mather – http://www.psypress.com/mather
6 The physics of vision—light and the eye 167
vision, each receptor receives only 0.01 quanta per second. In other words, minutesmay elapse between successive strikes on any one receptor. The quantal nature oflight thus becomes an important issue at low light levels (individual photoreceptorsare capable of responding to individual quantal strikes).
We can see from Table 6.1 that the visual diet experienced by an organism onearth spans a very wide range (increasing by a factor of 10,000,000, or 107, fromstarlight to sunlight). Individual photoreceptors can respond over a range ofintensities spanning less than one hundredth of this range (roughly two rows of thetable). Yet humans can see adequately both by starlight and in the midday sun. How,then, does the visual system cope successfully with such a huge range of light levels?At any one moment the intensity in a scene, from the darkest shadow to the brightestsurface, varies only by a factor of less than 1 in 100 (see below), a tiny fraction ofthe full range available on earth. As one moves from well-shaded, interior, or night-time conditions into bright outdoor conditions, the relatively narrow range of lightlevels experienced slides up the intensity scale. The visual system possessesmechanisms that adjust the operating range of photoreceptors so that it too slides upand down the intensity range, and thus receptor responses remain well matched toprevailing illumination conditions. This process of adjustment is known as light anddark adaptation, and is discussed in detail in Chapter 8.
CONTRAST AND REFLECTA N C EUnless the observer looks directly at a light source(not recommended in the case of the sun, as it islikely to result in permanent eye damage), the patternof light and dark entering the eye is a result ofreflections from surfaces in the scene. Some surfacesreflect a very high proportion of the light that strikesthem. White paper reflects approximately 75% of theincident light. Other surfaces absorb a highproportion of the incident light. Black paper andpaint, for instance, reflect only 5% of the incidentlight. Black velvet reflects about 2%.
Consequently, even in a scene containing the extreme combination of both blackvelvet and white paper, intensity will vary only by a factor of 1 in 38 (the paper willreflect 38 times more light than the velvet). A useful measure of relative luminanceis contrast (C) defined as:
C � (Lmax – Lmin)/(Lmax � Lmin)
Where Lmax is the higher luminance value and Lmin isthe lower luminance value. Contrast can varybetween 0 and 1.
It is very important to realize that contrast isindependent of the absolute level of illuminationand (in the absence of variations in illuminationsuch as shadows) is determined by surfacereflectance. For example, assume that the velvet and
K E Y T E R M S
ReflectanceThe proportion of incident light reflected from asurface.
ContrastA measure of the difference between the highestluminance and the lowest luminance emitted orreflected from a surface
Why do so fewphotons reach eachphotoreceptor,relative to the numberentering the eye?
?
The proportion of incident light reflected by asurface is known as its reflectance. Highlyreflecting surfaces appear whitish, and havevalues approaching unity. Snow, for example, hasa reflectance of 0.93, whereas newspaper has areflectance of 0.38 (Makous, 1998). Surfaceswith reflectance values approaching zero appearvery dark.
Mather2008-06.qxp 10/23/08 7:58 PM Page 167
Copyright © 2009 George Mather – http://www.psypress.com/mather
168 F O U N D AT I O N S O F S E N S AT I O N A N D P E R C E P T I O N
paper are viewed in moonlight: Lmax corresponds to the luminance of the paper,0.2 cd·m�2; Lmin corresponds to the luminance of the velvet, 0.0053 cd·m�2. Thecontrast between the paper and the velvet is 0.948, according to the equationabove. When viewed in sunlight, the luminances of the paper and velvet are 40,000cd·m�2 and 1066.7 cd·m�2 respectively. Contrast is again 0.948.
Absolute luminance is relatively uninformative about the properties of surfaces,whereas contrast provides information about surface reflectance. So early neuralprocesses in the visual system are specialized to encode contrast but discardinformation about absolute luminance.
W AVELENGTHHumans are able to detect wavelengths in the region between 400 nm and 700 nm.Wavelength is correlated with sensory impressions of color. Moving down thewavelength scale from 700 to 400 nm, color varies through the following sequence:red–orange–yellow–green–blue–indigo–violet. The acronym ROYGBIV issometimes used as a mnemonic. The wavelength composition of light actuallyreflected from a surface depends jointly on the spectral power distribution of theilluminating light and the spectral reflectance of the surface.
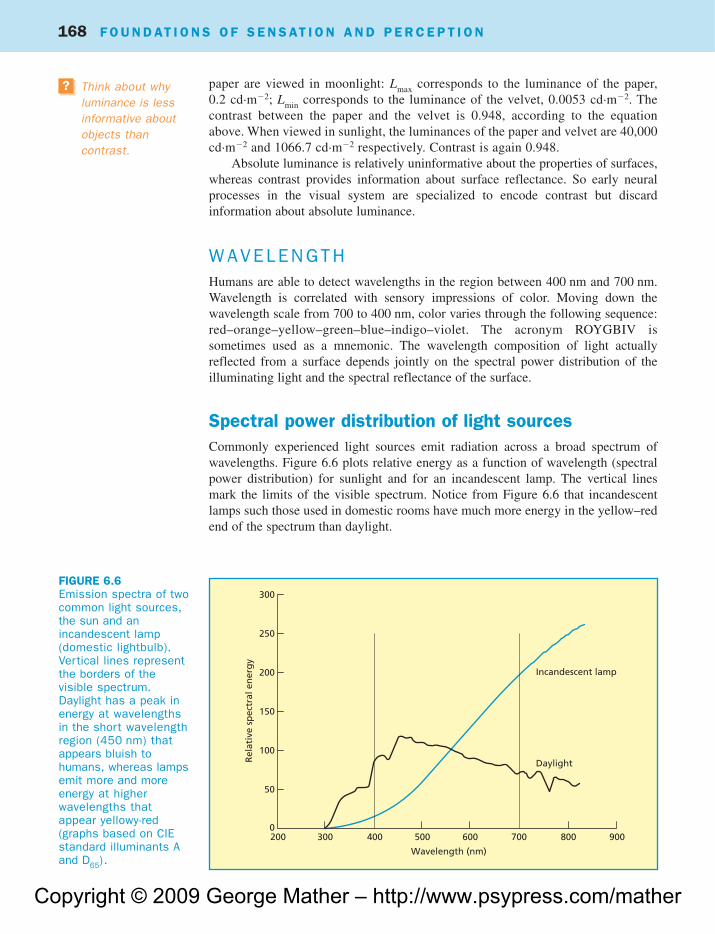
Spectral power distribution of light sourcesCommonly experienced light sources emit radiation across a broad spectrum ofwavelengths. Figure 6.6 plots relative energy as a function of wavelength (spectralpower distribution) for sunlight and for an incandescent lamp. The vertical linesmark the limits of the visible spectrum. Notice from Figure 6.6 that incandescentlamps such those used in domestic rooms have much more energy in the yellow–redend of the spectrum than daylight.
300
250
200
150
100
50
0200 300 400 500 600 700 800 900
Wavelength (nm)
Rel
ativ
e sp
ectr
al e
ner
gy
Incandescent lamp
Daylight
FIGURE 6.6Emission spectra of twocommon light sources,the sun and anincandescent lamp(domestic lightbulb).Vertical lines representthe borders of thevisible spectrum.Daylight has a peak inenergy at wavelengthsin the short wavelengthregion (450 nm) thatappears bluish tohumans, whereas lampsemit more and moreenergy at higherwavelengths thatappear yellowy-red(graphs based on CIEstandard illuminants Aand D65).
Think about whyluminance is lessinformative aboutobjects thancontrast.
?
Mather2008-06.qxp 10/23/08 7:58 PM Page 168
Copyright © 2009 George Mather – http://www.psypress.com/mather
6 The physics of vision—light and the eye 169
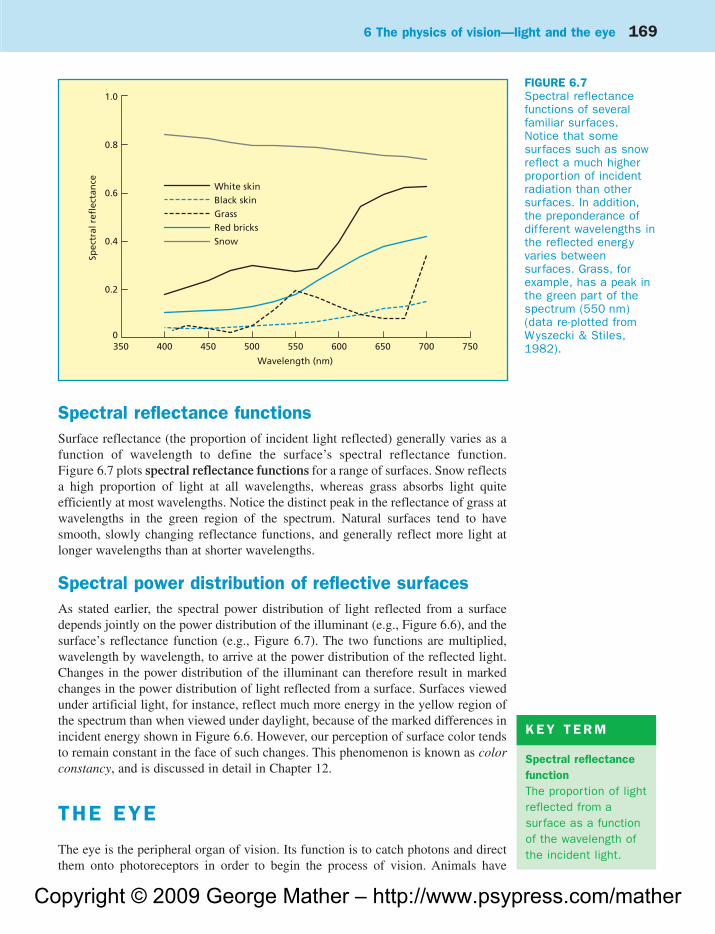
Spectral reflectance functionsSurface reflectance (the proportion of incident light reflected) generally varies as afunction of wavelength to define the surface’s spectral reflectance function.Figure 6.7 plots spectral reflectance functions for a range of surfaces. Snow reflectsa high proportion of light at all wavelengths, whereas grass absorbs light quiteefficiently at most wavelengths. Notice the distinct peak in the reflectance of grass atwavelengths in the green region of the spectrum. Natural surfaces tend to havesmooth, slowly changing reflectance functions, and generally reflect more light atlonger wavelengths than at shorter wavelengths.
Spectral power distribution of reflective surfacesAs stated earlier, the spectral power distribution of light reflected from a surfacedepends jointly on the power distribution of the illuminant (e.g., Figure 6.6), and thesurface’s reflectance function (e.g., Figure 6.7). The two functions are multiplied,wavelength by wavelength, to arrive at the power distribution of the reflected light.Changes in the power distribution of the illuminant can therefore result in markedchanges in the power distribution of light reflected from a surface. Surfaces viewedunder artificial light, for instance, reflect much more energy in the yellow region ofthe spectrum than when viewed under daylight, because of the marked differences inincident energy shown in Figure 6.6. However, our perception of surface color tendsto remain constant in the face of such changes. This phenomenon is known as colorconstancy, and is discussed in detail in Chapter 12.
THE EYE
The eye is the peripheral organ of vision. Its function is to catch photons and directthem onto photoreceptors in order to begin the process of vision. Animals have
FIGURE 6.7Spectral reflectancefunctions of severalfamiliar surfaces.Notice that somesurfaces such as snowreflect a much higherproportion of incidentradiation than othersurfaces. In addition,the preponderance ofdifferent wavelengths inthe reflected energyvaries betweensurfaces. Grass, forexample, has a peak inthe green part of thespectrum (550 nm)(data re-plotted fromWyszecki & Stiles,1982).
1.0
0.8
0.6
0.4
0.2
0350 400 450 500 550 600 650 700 750
Wavelength (nm)
Spec
tral
ref
lect
ance White skin
Black skinGrassRed bricksSnow
K E Y T E R M
Spectral reflectancefunctionThe proportion of lightreflected from asurface as a functionof the wavelength ofthe incident light.
Mather2008-06.qxp 10/23/08 7:58 PM Page 169

Copyright © 2009 George Mather – http://www.psypress.com/mather
170 F O U N D AT I O N S O F S E N S AT I O N A N D P E R C E P T I O N
evolved a huge variety of organs that respond to light, only some of which can beclassed as eyes. Some invertebrates such as worms have single receptors distributedon the surface of their skin. The minimum qualification for such an organ to be calledan eye is that it must form some kind of image on a sheet of photoreceptors. Imagesare vital for effective vision because they preserve the spatial arrangement of thepoints in space from which the light rays emanated. With suitable neural processing,a great deal of information about the world can be extracted from images, as we shalldiscover in the rest of the book.
STRUCTURE OF THE HUMAN EYEHumans, in common with other mammals, birds, and reptiles, have single-chamberedeyes. Figure 6.8 shows the main structures of the human eye. It is a roughly spherical,light-tight chamber, the inside surface of which is lined with a sheet of photoreceptors.An opening in the chamber, covered by a transparent membrane, admits light.
The transparent membrane is known as the cornea. Having passed through thecornea, incoming light then enters an aperture known as the pupil. The pupil isformed by a muscular diaphragm known as the iris (idiosyncratic pigmentation in theiris determines eye color, and is increasingly used as a form of identification). After
passing through the lens, situated behind the pupil,light strikes the photoreceptor sheet, known as theretina. The structure of the retina is very complex,and will be described in detail in the next chapter.
The interior of the eye is filled with two substances,vitreous humor and aqueous humor. Vitreous humor isa viscous gel that fills the large posterior chamber of theeye, maintaining its shape and holding the retina againstthe inner wall. The watery aqueous humor is pumpedinto the eye continuously, entering the eye near theattachment of the lens (ciliary processes) and leaving
G
Pupil
50 m
m
570 mm
5° of visualangle
Cornea
Lens
Iris
Retina
Fovea
1.5 mm
G
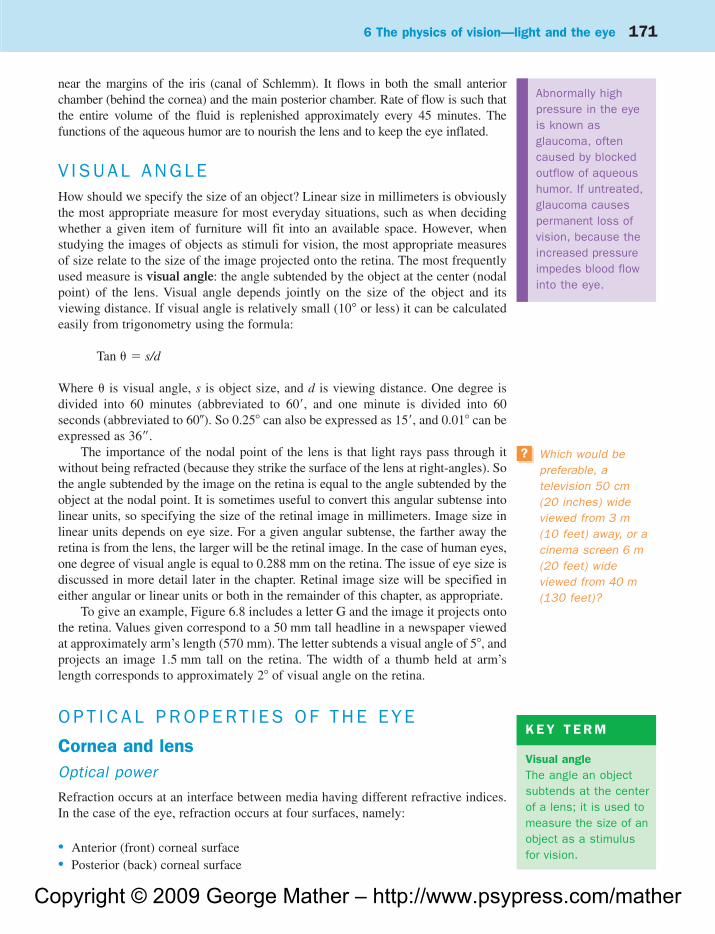
FIGURE 6.8Major components ofthe human eye.Dimensions are alsoshown for the imageproduced by a 50 mmtall letter viewed at adistance of 570 mm(similar to a largenewspaper headlineviewed at arm’slength). The anglesubtended by the letterat the nodal point of theeye is 5°. The retinalimage of the letter is1.5 mm tall, and spansapproximately 500photoreceptors.
K E Y T E R M S
CorneaThe transparent membrane through which lightenters a single-chambered eye.
PupilThe circular aperture formed by a musculardiaphragm in the eye, through which light passesafter entering the cornea.
Mather2008-06.qxp 10/23/08 7:58 PM Page 170
Copyright © 2009 George Mather – http://www.psypress.com/mather
6 The physics of vision—light and the eye 171
near the margins of the iris (canal of Schlemm). It flows in both the small anteriorchamber (behind the cornea) and the main posterior chamber. Rate of flow is such thatthe entire volume of the fluid is replenished approximately every 45 minutes. Thefunctions of the aqueous humor are to nourish the lens and to keep the eye inflated.
V ISUAL ANGLEHow should we specify the size of an object? Linear size in millimeters is obviouslythe most appropriate measure for most everyday situations, such as when decidingwhether a given item of furniture will fit into an available space. However, whenstudying the images of objects as stimuli for vision, the most appropriate measuresof size relate to the size of the image projected onto the retina. The most frequentlyused measure is visual angle: the angle subtended by the object at the center (nodalpoint) of the lens. Visual angle depends jointly on the size of the object and itsviewing distance. If visual angle is relatively small (10° or less) it can be calculatedeasily from trigonometry using the formula:
Tan � � s/d
Where � is visual angle, s is object size, and d is viewing distance. One degree isdivided into 60 minutes (abbreviated to 60�, and one minute is divided into 60seconds (abbreviated to 60�). So 0.25 can also be expressed as 15�, and 0.01 can beexpressed as 36��.
The importance of the nodal point of the lens is that light rays pass through itwithout being refracted (because they strike the surface of the lens at right-angles). Sothe angle subtended by the image on the retina is equal to the angle subtended by theobject at the nodal point. It is sometimes useful to convert this angular subtense intolinear units, so specifying the size of the retinal image in millimeters. Image size inlinear units depends on eye size. For a given angular subtense, the farther away theretina is from the lens, the larger will be the retinal image. In the case of human eyes,one degree of visual angle is equal to 0.288 mm on the retina. The issue of eye size isdiscussed in more detail later in the chapter. Retinal image size will be specified ineither angular or linear units or both in the remainder of this chapter, as appropriate.
To give an example, Figure 6.8 includes a letter G and the image it projects ontothe retina. Values given correspond to a 50 mm tall headline in a newspaper viewedat approximately arm’s length (570 mm). The letter subtends a visual angle of 5, andprojects an image 1.5 mm tall on the retina. The width of a thumb held at arm’slength corresponds to approximately 2 of visual angle on the retina.
O P T I C A L P R O P E RT IES OF THE EYE
Cornea and lensOptical power
Refraction occurs at an interface between media having different refractive indices.In the case of the eye, refraction occurs at four surfaces, namely:
• Anterior (front) corneal surface• Posterior (back) corneal surface
Which would bepreferable, atelevision 50 cm (20 inches) wideviewed from 3 m (10 feet) away, or acinema screen 6 m(20 feet) wideviewed from 40 m(130 feet)?
?
K E Y T E R M
Visual angleThe angle an objectsubtends at the centerof a lens; it is used tomeasure the size of anobject as a stimulusfor vision.
Abnormally highpressure in the eyeis known asglaucoma, oftencaused by blockedoutflow of aqueoushumor. If untreated,glaucoma causespermanent loss ofvision, because theincreased pressureimpedes blood flowinto the eye.
Mather2008-06.qxp 10/23/08 7:59 PM Page 171
Copyright © 2009 George Mather – http://www.psypress.com/mather
172 F O U N D AT I O N S O F S E N S AT I O N A N D P E R C E P T I O N
• Front surface of the lens• Rear surface of the lens.
The combined effect of these surfaces is to create an optical system with a focallength of 16.8 mm. This means that in a normal, relaxed eye the image of a distantobject will fall into focus 16.8 mm behind the center of the lens system, a distancethat corresponds precisely to the location of the retina. As discussed in detail in theTutorials section, optical power is conventionally expressed in diopters (D), whichcorrespond to (1/focal length in meters). The power of the eye’s optical system istherefore (1/16.8 �10�3), or 59.52 D.
The degree of refraction at an interface between two media depends on thedifference in refractive index of the media, as described in the tutorial. The refractiveindices of air, cornea, ocular fluid, and the lens are 1.009, 1.376, 1.336, and 1.413respectively. We can therefore see that the greatest degree of refraction in the eye’soptical system occurs at the interface between air and the cornea, because of the largedifference in refractive index. In fact, approximately 48 D of the eye’s optical poweris contributed by refraction at the anterior surface of the cornea.
Accommodation
Although the optical power of the eye is sufficient to focus parallel rays from farobjects on the retina, diverging rays from near objects come into focus behind theretina. There are two ways to bring the image back into focus on the retina. The first isto move the lens further away from the retina. Certain fish (and cameras) adopt thisstrategy. The alternative is to increase the optical power of the lens. This latter strategyis adopted by reptiles, birds, and mammals, including humans. The lens is deformable,and ciliary muscles located around the margins of the lens where it attaches to the eyecan adjust its shape to accommodate objects at different distances. The process offocusing is actually known as accommodation. Zonular fibers attach the lens to theciliary muscles. When the muscles are relaxed, intraocular pressure stretches thezonular fibers, which in turn pull the lens into a thin shape. In this shape the lens has afocal length of 59.52 D, appropriate for far objects. When the muscles are tense, they
relieve the pressure on the zonular fibers, which allowsthe lens to relax into a thicker shape with a shorterfocal length. In young healthy eyes accommodationcan increase the optical power of the eye by up toapproximately 8 D, allowing objects as close as250 mm to be brought into focus. This distance isknown as the near point. Lens flexibility declines withage, so that the near point moves progressively furtheraway. Beyond the age of 50 there is typically littlescope for accommodation left, a condition known aspresbyopia (see Glasser & Campbell, 1998).
Accommodative errors Two kinds of error arecommonly found. The optical power of the eye can beeither too great or too weak, given the size of the eye,resulting in image blur at the retina.
• Myopia, or short-sight, occurs when the opticalpower is too great. Rays from distant objects come
K E Y T E R M S
DiopterA measure of the refractive power of a lens; itcorresponds to (1/f) where f is its focal length inmeters.
AccommodationThe process by which the shape of the eye’s lens ischanged to alter its focal length.
PresbyopiaThe age-related change in accommodative range,resulting from loss of flexibility in the lens.
MyopiaA condition in which the refractive power of theeye’s lens is too great, causing the image ofdistant objects to be defocused.
Mather2008-06.qxp 10/23/08 7:59 PM Page 172

Copyright © 2009 George Mather – http://www.psypress.com/mather
6 The physics of vision—light and the eye 173
into focus in front of the retina, and accommodation is no help because it bringsthe point of focus even further forward. Near objects do fall into focus, andaccommodation is required only for very near distances.
• Hyperopia, or long-sight, occurs when the optical power is too weak. Rays fromdistant objects come into focus behind the retina. In this case accommodation doeshelp, but it comes into play at distances that should not normally require it.
Both kinds of accommodative error can be corrected in two ways. The traditionalsolution is to wear corrective lenses, either as spectacles or as contact lenses, whichadjust the optical power of the eye to remove the error. A more recent solution, knownas photorefractive keratectomy, is to shave a very small amount of material from thesurface of the cornea using a laser. This has the effect of altering the radius of curvatureof the cornea in such a way as to alter the optical power of the cornea and correct theaccommodative error.
PupilThe diameter of the pupil can vary between approximately 2 mm and 8 mm. Theresultant change in area equates to a sixteenfold variation in retinal illumination.Since this is a tiny fraction of the range of illumination levels experienced on earth,as explained earlier, we can safely assume that the function of the pupil is not solelyto control retinal illumination. Its function may be more subtle, in regulating thebalance that must be struck between maximizing the eye’s sensitivity and retainingits resolution (ability to resolve detail), as explained later in the chapter.
Pupil size is influenced by emotional responses. Large pupils are associated withpositive or pleasurable emotions, whereas small pupils are associated with negativeemotions. For example, in a study by Hess and Polt (1960), the pupils of male andfemale subjects were photographed while they viewed a range of photographs.Figure 6.9 plots the mean change in pupil size as a function of subject matter. Malesubjects showed a large increase in pupil size while viewing pictures of nudefemales, and very small increases while viewing landscapes. Female subjects showedlarge increases while viewing pictures of mother and baby, and nude males, butdecreases while viewing landscapes.
What kinds of lensesmust spectaclescontain?
?
How can presbyopiabe treated?
?
25
20
15
10
5
0
–5
–10
Male
Female
% C
han
ge
in p
up
il ar
ea
Baby Mother& baby
Nudemale
Nudefemale
Landscape
Picture viewed
FIGURE 6.9Mean change in pupilsize as a function ofimage viewed, for maleand female subjects.Male subjects show alarge increase in pupildiameter only whenviewing pictures of nudefemales. Femalesubjects showincreases in pupildiameter when viewingpictures of babies andnude males. Anincrease in pupil size isusually interpreted asan indicator of positiveemotional responses(data re-plotted fromHess & Polt, 1960).
K E Y T E R M
HyperopiaA condition in whichthe refractive power ofthe eye’s lens is tooweak, causing theimage of near objectsto be defocused.
Other old studies(e.g., Hess, 1975)also claim that largepupils make femalefaces appear moreattractive, perhapsbecause theyindicate an interestin the viewer.
Mather2008-06.qxp 10/23/08 7:59 PM Page 173
Copyright © 2009 George Mather – http://www.psypress.com/mather
174 F O U N D AT I O N S O F S E N S AT I O N A N D P E R C E P T I O N
PhotoreceptorsThe retina of each eye contains over 100 million photoreceptor cells, responsible forconverting light energy into neural activity (transduction). Each photoreceptor is along, thin tube consisting of an outer segment that contains light-sensitive pigmentand an inner segment that in effect forms the cell body. A detailed discussion of howphotoreceptors achieve transduction will be postponed until the next chapter. Thediscussion here will concentrate on the optical properties of photoreceptors.
Rods and cones
Human photoreceptors fall into two classes, called rods and cones on the basis of theshape of their outer segments. Rods and cones differ in several important respects:
• They contain different light-sensitive pigments (discussed in the next chapter).Rod pigment is very sensitive at low light levels. Cones are 30–100 times lesssensitive, so function only at high light levels.
• There are far more rods in each eye (approximately 120,000,000) than cones(approximately 6,000,000).
• They differ in width, length, and retinal distribution. An important landmark on theretina is the fovea, a small pit at the optical centre of the retina, 0.5 mm (1.7)wide. It is entirely devoid of rods and contains only cones (more details below).
Photoreceptor width
The light-sensitive portion of each cone has a diameter of approximately 1–4 �m inthe fovea, and 4–10 �m outside the fovea. Rods have a diameter of 1 �m near thefovea (Wandell, 1995). The width of each photoreceptor obviously imposes a limit onthe spacing between adjacent photoreceptors. Spacing, in turn, determines the abilityof the retina to resolve detail. As we shall see in a moment, reducing the spacingbetween receptors increases their ability to resolve fine spatial detail. So why are thephotoreceptors not narrower still? The answer to this question lies in the waveproperties of light. As each photoreceptor’s width approaches the wavelength ofvisible light (0.4–0.7 �m) it becomes unable to retain light by total internal reflection.Instead, some of the light leaks out through the sides of the photoreceptor, and excitesadjacent receptors. This “cross-talk” between receptors reduces the effectiveresolution of the retinal mosaic, because each photoreceptor’s response depends notjust on the light striking it, but also on the light striking its neighbors. There isconsequently nothing to be gained in terms of resolution from having photoreceptorsnarrower than 1 �m, and indeed none have been found in the eyes of any animal.
Photoreceptor length
The light-sensitive portion of each human cone is up to80 �m long in the fovea and 40 �m long outside thefovea; rods are 60 �m long (Wandell, 1995). Theproportion of incident light absorbed by aphotoreceptor depends on its length. Inside the fovea,cones absorb up to 50% of incident light. Outside thefovea, cones absorb 33% of incident light. Rods absorb42% of incident light (see Warrant & Nilsson, 1998).
Curiously, there is acone-rich rim at theextreme edge of theretina, where the farlateral periphery ofthe visual field isimaged; it may formpart of a rapid earlywarning mechanism( Williams, 1991).
K E Y T E R M S
RodA type of photoreceptor that is specialized forresponses at low light levels.
ConeA type of photoreceptor that is specialized forresponses at high light levels.
Mather2008-06.qxp 10/23/08 7:59 PM Page 174
Copyright © 2009 George Mather – http://www.psypress.com/mather
6 The physics of vision—light and the eye 175
Photoreceptor spacing
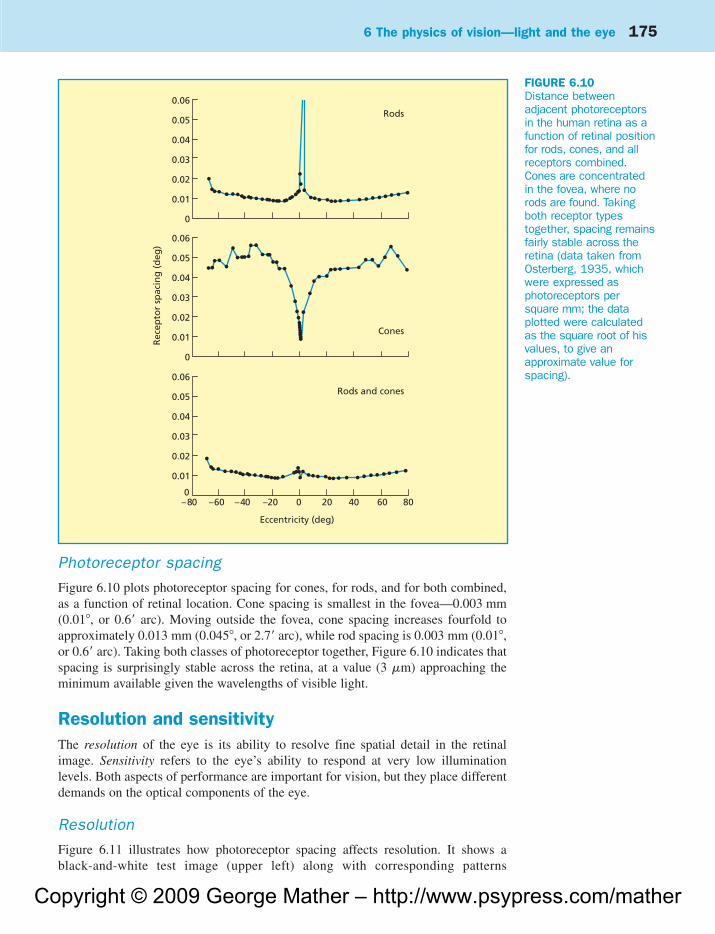
Figure 6.10 plots photoreceptor spacing for cones, for rods, and for both combined,as a function of retinal location. Cone spacing is smallest in the fovea—0.003 mm(0.01, or 0.6� arc). Moving outside the fovea, cone spacing increases fourfold toapproximately 0.013 mm (0.045, or 2.7� arc), while rod spacing is 0.003 mm (0.01,or 0.6� arc). Taking both classes of photoreceptor together, Figure 6.10 indicates thatspacing is surprisingly stable across the retina, at a value (3 �m) approaching theminimum available given the wavelengths of visible light.
Resolution and sensitivityThe resolution of the eye is its ability to resolve fine spatial detail in the retinalimage. Sensitivity refers to the eye’s ability to respond at very low illuminationlevels. Both aspects of performance are important for vision, but they place differentdemands on the optical components of the eye.
Resolution
Figure 6.11 illustrates how photoreceptor spacing affects resolution. It shows ablack-and-white test image (upper left) along with corresponding patterns
0.06
0.05
0.04
0.03
0.02
0.01
0
0.06
0.05
0.04
0.03
0.02
0.01
0
0.06
0.05
0.04
0.03
0.02
0.01
0
Rods
Cones
Rods and cones
–80 –60 –40 –20 806040200
Eccentricity (deg)
Rec
epto
r sp
acin
g (
deg
)
FIGURE 6.10Distance betweenadjacent photoreceptorsin the human retina as afunction of retinal positionfor rods, cones, and allreceptors combined.Cones are concentratedin the fovea, where norods are found. Takingboth receptor typestogether, spacing remainsfairly stable across theretina (data taken fromOsterberg, 1935, whichwere expressed asphotoreceptors persquare mm; the dataplotted were calculatedas the square root of hisvalues, to give anapproximate value forspacing).
Mather2008-06.qxp 10/23/08 7:59 PM Page 175

Copyright © 2009 George Mather – http://www.psypress.com/mather
176 F O U N D AT I O N S O F S E N S AT I O N A N D P E R C E P T I O N
superimposed on three imaginary retinal mosaics with different receptor spacing.Each circle represents an individual photoreceptor.
The test image includes a grating consisting of alternating black and white bars.Gratings are used very frequently to assess spatial resolution, for reasons that willbecome clear in Chapter 8. Notice that the finest mosaic (top right) can representboth the grating pattern and the broken circle faithfully. The coarsest mosaic (bottomright) cannot resolve individual grating bars, and provides only a crude rendition ofthe broken circle. Mathematical procedures allow us to calculate the finest gratingbars that can be resolved by a given photoreceptor spacing. In simple terms, thegrating can be resolved faithfully if each adjacent light and dark bar falls on aseparate receptor. Each pair of light and dark bars constitutes one cycle of the gratingpattern. So there must be two receptors per grating cycle in order to accuratelyrepresent the grating (the so-called Nyquist Limit). With fewer receptors it is notpossible to distinguish all the bars of the grating.
Photoreceptor spacing is limited by photoreceptor width, which, in turn, islimited by the wavelengths of visible light. Once the minimum photoreceptor widthis achieved, the only other way to increase the resolving power of the retina is toincrease the size of the image. Larger images allow greater detail to be resolvedbecause they are sampled by more photoreceptors. Larger images require larger eyes,since image size or magnification is a function of focal length (see the Tutorials
I I I
III IV
FIGURE 6.11Effect of receptorspacing on acuity. Thestimulus pattern (topleft) consists of avertical grating and abroken circle. Thispattern wassuperimposed on retinalmosaics at threedifferent spacings:small (top right),medium (bottom left),and large (bottomright). Each circlerepresents a receptorpositioned over anelement of the pattern.Small receptor spacingspermit a faithfulrendition of thepattern—all gratingbars and the break inthe circle are visible. Atthe largest receptorspacing individualgrating bars cannot beresolved, and the breakin the circle is lost ( re-drawn from Pirenne,1948). Used withpermission of Taylor &Francis, Inc.
K E Y T E R M S
GratingA pattern ofalternating light anddark bars, widely usedin vision research.
MagnificationThe size of the imageproduced by a lens; itdepends on the focallength of the lens.
Mather2008-06.qxp 10/23/08 7:59 PM Page 176
Copyright © 2009 George Mather – http://www.psypress.com/mather
6 The physics of vision—light and the eye 177
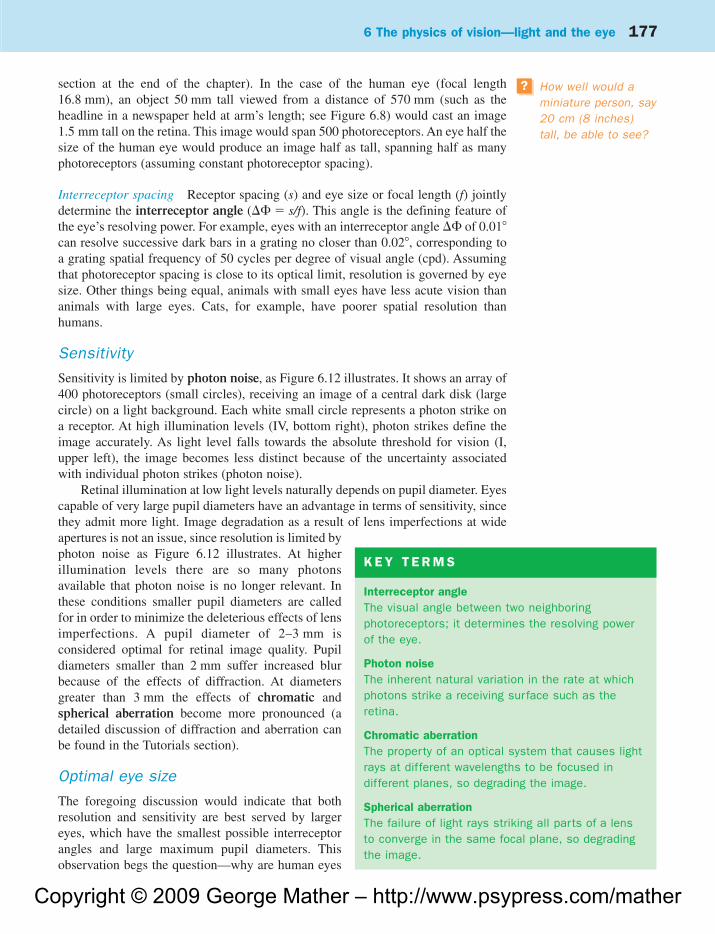
section at the end of the chapter). In the case of the human eye (focal length16.8 mm), an object 50 mm tall viewed from a distance of 570 mm (such as theheadline in a newspaper held at arm’s length; see Figure 6.8) would cast an image1.5 mm tall on the retina. This image would span 500 photoreceptors. An eye half thesize of the human eye would produce an image half as tall, spanning half as manyphotoreceptors (assuming constant photoreceptor spacing).
Interreceptor spacing Receptor spacing (s) and eye size or focal length (f) jointlydetermine the interreceptor angle (� � s/f). This angle is the defining feature ofthe eye’s resolving power. For example, eyes with an interreceptor angle � of 0.01can resolve successive dark bars in a grating no closer than 0.02, corresponding toa grating spatial frequency of 50 cycles per degree of visual angle (cpd). Assumingthat photoreceptor spacing is close to its optical limit, resolution is governed by eyesize. Other things being equal, animals with small eyes have less acute vision thananimals with large eyes. Cats, for example, have poorer spatial resolution thanhumans.
Sensitivity
Sensitivity is limited by photon noise, as Figure 6.12 illustrates. It shows an array of400 photoreceptors (small circles), receiving an image of a central dark disk (largecircle) on a light background. Each white small circle represents a photon strike ona receptor. At high illumination levels (IV, bottom right), photon strikes define theimage accurately. As light level falls towards the absolute threshold for vision (I,upper left), the image becomes less distinct because of the uncertainty associatedwith individual photon strikes (photon noise).
Retinal illumination at low light levels naturally depends on pupil diameter. Eyescapable of very large pupil diameters have an advantage in terms of sensitivity, sincethey admit more light. Image degradation as a result of lens imperfections at wideapertures is not an issue, since resolution is limited byphoton noise as Figure 6.12 illustrates. At higherillumination levels there are so many photonsavailable that photon noise is no longer relevant. Inthese conditions smaller pupil diameters are calledfor in order to minimize the deleterious effects of lensimperfections. A pupil diameter of 2–3 mm isconsidered optimal for retinal image quality. Pupildiameters smaller than 2 mm suffer increased blurbecause of the effects of diffraction. At diametersgreater than 3 mm the effects of chromatic andspherical aberration become more pronounced (adetailed discussion of diffraction and aberration canbe found in the Tutorials section).
Optimal eye size
The foregoing discussion would indicate that bothresolution and sensitivity are best served by largereyes, which have the smallest possible interreceptorangles and large maximum pupil diameters. Thisobservation begs the question—why are human eyes
How well would aminiature person, say20 cm (8 inches)tall, be able to see?
?
K E Y T E R M S
Interreceptor angleThe visual angle between two neighboringphotoreceptors; it determines the resolving powerof the eye.
Photon noiseThe inherent natural variation in the rate at whichphotons strike a receiving surface such as theretina.
Chromatic aberrationThe property of an optical system that causes lightrays at different wavelengths to be focused indifferent planes, so degrading the image.
Spherical aberrationThe failure of light rays striking all parts of a lensto converge in the same focal plane, so degradingthe image.
Mather2008-06.qxp 10/23/08 7:59 PM Page 177

Copyright © 2009 George Mather – http://www.psypress.com/mather
178 F O U N D AT I O N S O F S E N S AT I O N A N D P E R C E P T I O N
not larger than 24 mm in diameter? Eyes are expensive organs, because they occupya significant amount of space in the head, and they consume a large amount ofenergy. It has been estimated, for example, that 10% of the oxygen consumption ofa walking fly is devoted to phototransduction (Laughlin, de Ruyter van Steveninck,& Anderson, 1998). It therefore makes sense for eyes to be no larger than strictlynecessary given the visual requirements of their host. Once the eyes have achievedthe level of resolution required by their host in order to catch prey, avoid predators,and so on, pressures on energy consumption and cranial real estate limit furtherincreases in eye size. Nocturnal and deep-sea dwelling animals have the largesteyes, in the interests of maximizing sensitivity at low levels of ambient illumination.Deep-sea squid possess the largest eyes of all, with a diameter of 40 cm (Land &Nilsson, 2002).
Rods versus cones
The relatively constant spacing of rods and cones combined (Figure 6.10) might leadone to expect that our ability to resolve detail is also constant across the retina.However, as mentioned earlier, rods and cones operate at different light levels, withrods operating at low light levels and cones operating at high light levels. The
III
III IV
FIGURE 6.12Effect of photon noiseon acuity. The smallcircles representlocations of individualphotoreceptors, withwhite circlesrepresenting activereceptors. The largecircle in the center ofeach panel shows theposition of a large darkdisk presented as animage against a whitebackground for a shorttime. The four panelsrepresent photoreceptorresponses at fourdifferent light levels.Under extremely dimillumination (top left),when few photons areemitted, the probabilitythat any one receptorwill be struck by aphoton is very low. Justsix active receptors areshown. As illuminationlevel and photonnumbers rise, theprobability of activity ineach receptor alsorises. At the highestlevel (bottom right), somany photons areemitted that allreceptors are activatedby the light region ofthe image. The ability ofthe photoreceptormosaic to resolve thepattern at low lightlevels thereforedepends on the numberof photons emitted, noton the fineness of themosaic or blur in theimage (re-drawn fromPirenne, 1948). Usedwith permission ofTaylor & Francis, Inc.
Mather2008-06.qxp 10/23/08 7:59 PM Page 178

Copyright © 2009 George Mather – http://www.psypress.com/mather
6 The physics of vision—light and the eye 179
differing distributions of rods and cones aim to strike a balance between maximizingresolution while retaining sensitivity. In high illumination, resolution is very high(near the 50 cpd optical limit of the eye) but only in central vision, since this is wherecone spacing is smallest. Outside the fovea, resolution drops to a value dictated byrod spacing—only 11 cpd. On the other hand, the fact that we have any sensitivity atall at low illumination levels is because of rods outside the fovea.
EYE MOVEMENTS
The eye musclesHumans have six extraocular muscles that allow the eyes to rotate quickly andaccurately about any combination of the three possible axes. Figure 6.13 illustratesthe attachment points of the muscles. They work as three antagonistic pairs. Themedial and lateral recti control side-to-side rotation about the vertical axis (known asadduction and abduction); the superior and inferior recti control up-and-downrotation around the horizontal axis running from side to side across the head (knownas elevation and depression); and the superior and inferior obliques control rotationabout the visual axis itself around the horizontal axis running from front to backthrough the head (known as intorsion and extorsion).
Types of eye movementThere are six types of large-scale eye movement, which can be categorized in termsof whether they are voluntary (under conscious control) or involuntary (under reflexcontrol), and whether they are conjugate or disjunctive. The latter classificationrelates to how the two eyes move together.
In conjugate movements, the two eyes move by the same amount and in the samedirection (e.g., both eyes turn to the left). In disjunctive movements, the two eyesmove by the same amount but in opposite directions (e.g., the eyes both turn inwardstowards the nose, so that one becomes cross-eyed).
FIGURE 6.13The extraocularmuscles. Six musclesworking in three pairsallow each eye torotate in its socketabout the three possibleaxes (based on Walls,1963).
Inferioroblique
Superioroblique
Lateralrectus
Medialrectus
Superiorrectus
Inferiorrectus
Mather2008-06.qxp 10/23/08 7:59 PM Page 179
Copyright © 2009 George Mather – http://www.psypress.com/mather
180 F O U N D AT I O N S O F S E N S AT I O N A N D P E R C E P T I O N
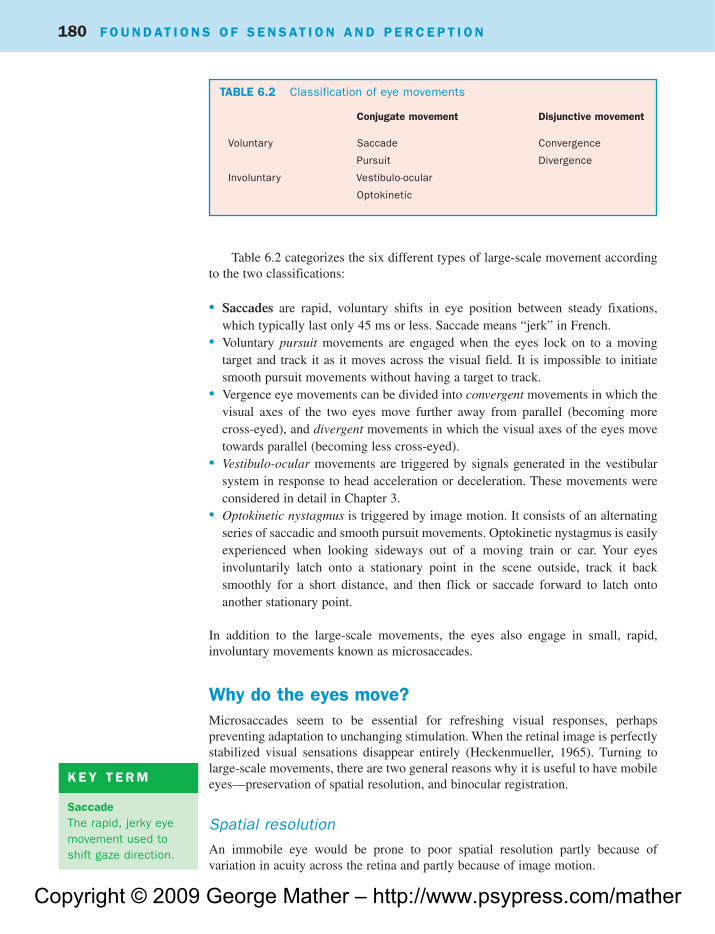
Table 6.2 categorizes the six different types of large-scale movement accordingto the two classifications:
• Saccades are rapid, voluntary shifts in eye position between steady fixations,which typically last only 45 ms or less. Saccade means “jerk” in French.
• Voluntary pursuit movements are engaged when the eyes lock on to a movingtarget and track it as it moves across the visual field. It is impossible to initiatesmooth pursuit movements without having a target to track.
• Vergence eye movements can be divided into convergent movements in which thevisual axes of the two eyes move further away from parallel (becoming morecross-eyed), and divergent movements in which the visual axes of the eyes movetowards parallel (becoming less cross-eyed).
• Vestibulo-ocular movements are triggered by signals generated in the vestibularsystem in response to head acceleration or deceleration. These movements wereconsidered in detail in Chapter 3.
• Optokinetic nystagmus is triggered by image motion. It consists of an alternatingseries of saccadic and smooth pursuit movements. Optokinetic nystagmus is easilyexperienced when looking sideways out of a moving train or car. Your eyesinvoluntarily latch onto a stationary point in the scene outside, track it backsmoothly for a short distance, and then flick or saccade forward to latch ontoanother stationary point.
In addition to the large-scale movements, the eyes also engage in small, rapid,involuntary movements known as microsaccades.
Why do the eyes move?Microsaccades seem to be essential for refreshing visual responses, perhapspreventing adaptation to unchanging stimulation. When the retinal image is perfectlystabilized visual sensations disappear entirely (Heckenmueller, 1965). Turning tolarge-scale movements, there are two general reasons why it is useful to have mobileeyes—preservation of spatial resolution, and binocular registration.
Spatial resolution
An immobile eye would be prone to poor spatial resolution partly because ofvariation in acuity across the retina and partly because of image motion.
Conjugate movement Disjunctive movement
Voluntary Saccade Convergence
Pursuit Divergence
Involuntary Vestibulo-ocular
Optokinetic
TABLE 6.2 Classification of eye movements
K E Y T E R M
SaccadeThe rapid, jerky eyemovement used toshift gaze direction.
Mather2008-06.qxp 10/23/08 7:59 PM Page 180

Copyright © 2009 George Mather – http://www.psypress.com/mather
6 The physics of vision—light and the eye 181
Saccadic eyemovementsthemselves generatemotion of the imageacross the retina.Chapter 11 onmotion perceptioncontains adiscussion of whywe are not aware ofthis motion.
Acuity variation As we saw in the previous section, the ability of the retina toresolve fine spatial detail varies with retinal location and with illumination level.Cones operate only in bright conditions, so resolution is much higher near the visualaxis in the fovea than elsewhere on the retina. Eye movements allow the most acuteportion of the retina to be brought to bear on a particular region of interest in thevisual field. For this reason humans tend to adopt a fixate–saccade strategy. Shortperiods of fixation, typically lasting 300 ms, alternate with saccades to ensure thatthe eyes are always directed at the center of current interest. It seems that relativelylittle specific detail about the content of the visual scene is stored in the visualsystem from one saccade to the next, though more general information may beretained. This explains why saccades occur so frequently—if detailed informationis required, the eye simply executes a saccade to acquire it.
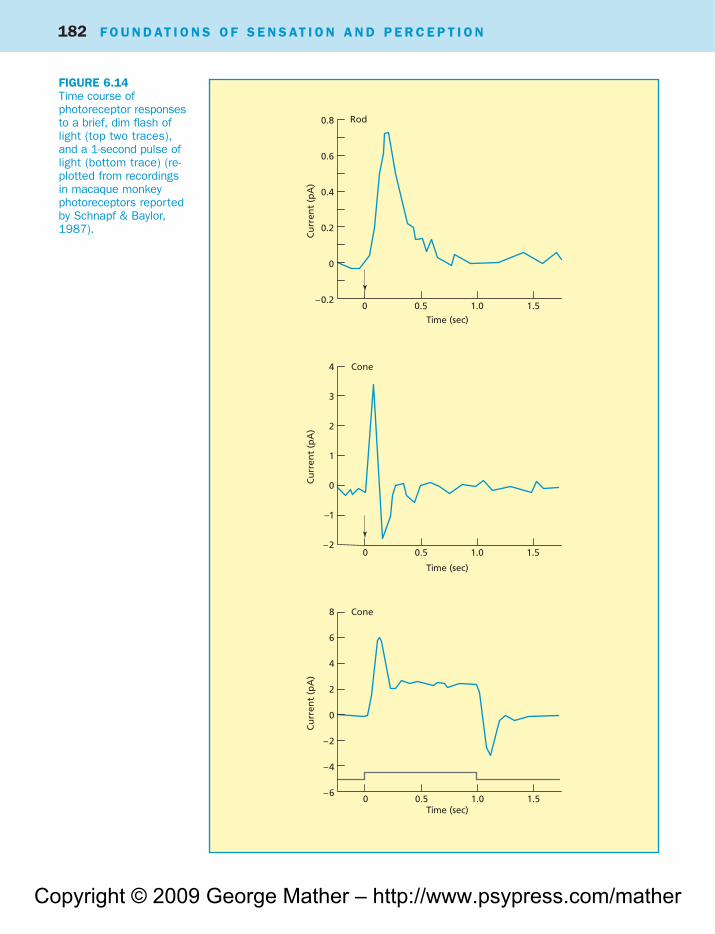
Image motion Any movement of the image across the retina degrades the quality ofthe information provided by photoreceptors, because photoreceptor responses arerelatively slow. Figure 6.14 shows the time course of responses in photoreceptors to abrief flash of light. It can take a tenth of a second or more for receptor response toreach its peak, and each response lasts at least 100 ms even for very brief flashes.Imagine that you are fixating steadily on a stationary point as a person walks acrossyour field of view at a distance of 10 meters (about 33 feet). The image of the personwill move across your retina at a speed of 8 s�1, passing over photoreceptors at a rateof one every 1.25 ms (assuming a walking speed of 5 kph; i.e., 3 mph, or 140 cm s�1).At this speed the image of the person will not dwell on each photoreceptor longenough for that receptor to reach its maximum response before the image moves on—there will be a reduction in effective contrast. Since each photoreceptor’s responselasts tens of milliseconds, at any one instant in time a whole array of receptors willbe responding. Receptors that were passed over many milliseconds ago will still beresponding when new responses are just building in other receptors. Consequently, theimage of the moving figure will be spread over many receptors, an effect known asmotion blur. The deleterious effects of image motion can be overcome by moving theeyes to compensate for the movement and stabilize the position of the image on theretina. Voluntary pursuit movements and optokinetic nystagmus keep the center ofinterest—a moving object—stationary on the retina (at the cost of blurring andcontrast reduction in the background). Vestibulo-ocular movements stabilize theretinal image of the stationary world during head movements.
Binocular registration
We have already seen that in order to maximize acuity each eye must be positionedso that the center of interest in the image is projected onto the fovea. The eyes arenecessarily located a short distance apart in the head. This means that if both eyesare to engage in foveal fixation on the same point in the world, their optical axesmust be made to converge using vergence eye movements. The degree ofconvergence depends on viewing distance. Points very close to the observer requirelarge convergence angles, while very distant points require extremely smallconvergence angles.
Even when converged to fixate on the same object, the two eyes receive slightlydifferent views of the world, because of their different positions in the head. Theseslight differences provide a very powerful visual depth cue, discussed in detail inChapter 10, which also contains more information about convergence.
K E Y T E R M
Motion blurSmearing in an imagecaused by movementof an object relative tothe imaging surface.
Mather2008-06.qxp 10/23/08 7:59 PM Page 181
Copyright © 2009 George Mather – http://www.psypress.com/mather
182 F O U N D AT I O N S O F S E N S AT I O N A N D P E R C E P T I O N
0.8
0.6
0.4
0.2
0
–0.2
4
3
2
1
0
–1
–2
8
6
4
2
–2
–4
–6
0 0.5 1.0 1.5
0 0.5 1.0 1.5
Time (sec)
0 0.5 1.0 1.5
Time (sec)
Cone
Time (sec)
Rod
Cone
Cu
rren
t (p
A)
Cu
rren
t (p
A)
Cu
rren
t (p
A)
0
FIGURE 6.14Time course ofphotoreceptor responsesto a brief, dim flash oflight (top two traces),and a 1-second pulse oflight (bottom trace) (re-plotted from recordingsin macaque monkeyphotoreceptors reportedby Schnapf & Baylor,1987).
Mather2008-06.qxp 10/23/08 7:59 PM Page 182
Copyright © 2009 George Mather – http://www.psypress.com/mather
6 The physics of vision—light and the eye 183
CHAPTER SUMMARY
L IGHTLight is a form of energy that can be described as both a ray, a wave,and a stream of particles:
• The par ticle or quantal nature of light is impor tant forunderstanding how light is emitted and absorbed, especially at lowintensities.
• Ray properties are useful for understanding large-scale properties oflight, including how it is refracted during transmission throughoptical devices.
• Wave properties are useful for understanding much finer scaleeffects such as diffraction.
Three important aspects of light as a stimulus for vision are:
• Intensity (number of quanta emitted per second).• Contrast (ratio of the lightest to the darkest parts of an image).• Wavelength (emission spectra of light sources, and reflectance
functions of object surfaces).
THE EYE• Humans have single-chambered eyes. The cornea and lens refract
incoming rays to form an image on the light-sensitive inner surfaceof the eye (the retina). Two thirds of the optical power of the eye isprovided by the cornea.
• Variation in lens shape allows the eye to adjust its optical power tomaintain a focused image of objects at different distances.
• Photoreceptor cells called rods and cones catch incoming photonsand generate electrical currents that are transmitted through thenetwork of neurons in the retina to the optic nerve.
• The optical properties of the photoreceptors (width, length, anddistribution) place fundamental limits on the information transmittedup the optic nerve.
• The structure of the eye represents a compromise betweenproperties that maximize spatial resolution and sensitivity tolight.
• Eye movements are mediated by six extraocular muscles. Theirfunctions are to maintain spatial resolution in the face of imagemovement across the retina, and to allow binocular registration ofobjects seen through both eyes.
Mather2008-06.qxp 10/23/08 7:59 PM Page 183
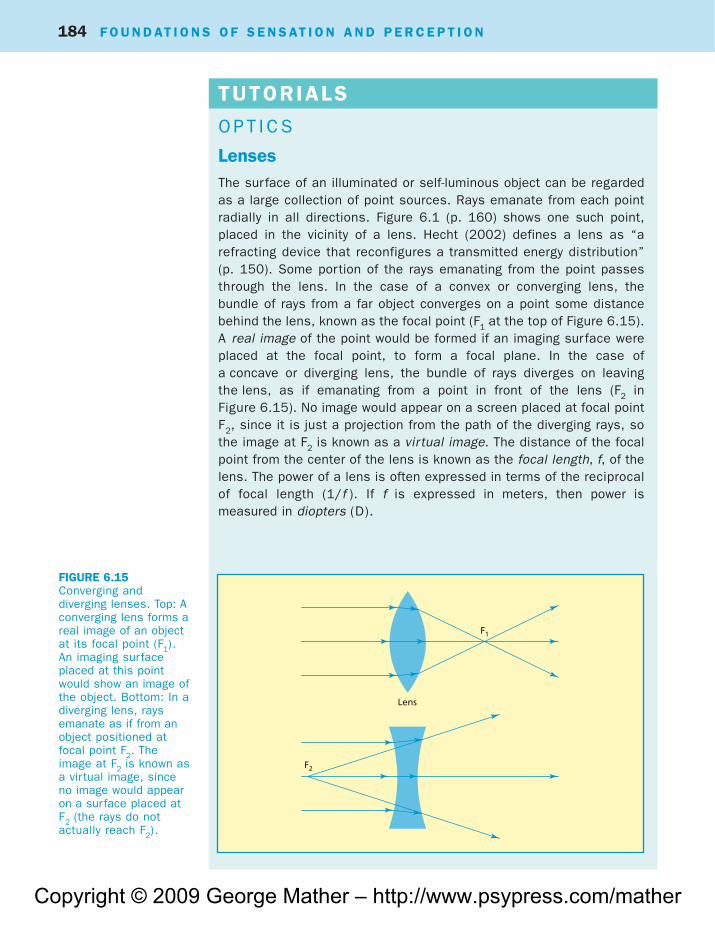
Copyright © 2009 George Mather – http://www.psypress.com/mather
184 F O U N D AT I O N S O F S E N S AT I O N A N D P E R C E P T I O N
FIGURE 6.15Converging anddiverging lenses. Top: Aconverging lens forms areal image of an objectat its focal point (F1).An imaging surfaceplaced at this pointwould show an image ofthe object. Bottom: In adiverging lens, raysemanate as if from anobject positioned atfocal point F2. Theimage at F2 is known asa virtual image, sinceno image would appearon a surface placed atF2 (the rays do notactually reach F2).
TUTORIALS
O P T I C S
LensesThe surface of an illuminated or self-luminous object can be regardedas a large collection of point sources. Rays emanate from each pointradially in all directions. Figure 6.1 (p. 160) shows one such point,placed in the vicinity of a lens. Hecht (2002) defines a lens as “arefracting device that reconfigures a transmitted energy distribution”(p. 150). Some portion of the rays emanating from the point passesthrough the lens. In the case of a convex or converging lens, thebundle of rays from a far object converges on a point some distancebehind the lens, known as the focal point (F1 at the top of Figure 6.15).A real image of the point would be formed if an imaging surface wereplaced at the focal point, to form a focal plane. In the case ofa concave or diverging lens, the bundle of rays diverges on leavingthe lens, as if emanating from a point in front of the lens (F2 inFigure 6.15). No image would appear on a screen placed at focal pointF2, since it is just a projection from the path of the diverging rays, sothe image at F2 is known as a virtual image. The distance of the focalpoint from the center of the lens is known as the focal length, f, of thelens. The power of a lens is often expressed in terms of the reciprocalof focal length (1/f ). If f is expressed in meters, then power ismeasured in diopters (D).
Lens
F1
F2
Mather2008-06.qxp 10/23/08 7:59 PM Page 184

Copyright © 2009 George Mather – http://www.psypress.com/mather
6 The physics of vision—light and the eye 185
RefractionRefraction is the principle underlying the formation of images by lenses.As mentioned earlier in the chapter, the effective speed with which alight wavefront passes through a medium may be retarded (even thoughindividual quanta always travel at the speed of light), because ofinterference between the original wave and waves produced by forwardscattering. An important consequence of the retardation of light duringtransmission through a medium is refraction, a change in the directionof the path of light rays as they enter a transmitting medium obliquely(see Figure 6.16). Refraction occurs because the retardation of thewavefront skews its direction of travel as it enters the medium, similarto the way a moving vehicle’s direction would be skewed if one frontwheel left the road and entered gravel at the roadside. Imagine thatrays a and f in Figure 6.16 were the wheel tracks of a vehicle as it leftthe road (air), and entered gravel (glass). Wheels in track a would reachthe gravel and begin slowing down before the wheels in track f. As aresult, the direction of the vehicle’s travel would be skewed towardsthe slow side of the vehicle.
Media that transmit light have an index of refraction, which definesthe extent to which a light wavefront is retarded during transmission.The index of refraction, n, is defined as follows:
n � c / v
f
e
d
c
b
a
i
r
a'
b'
c'
d'
e'f '
90°
Air, n = 1.0
Glass, n = 1.5
FIGURE 6.16Refraction. A wavefrontcontaining the bundle ofrays a–f is shownstriking a glass surface.The wavefront isretarded as it entersthe glass. Since wavesin one part of thewavefront (a) areretarded before wavesat other parts (e.g., f)have reached the glass,the direction of thewavefront is skewedonce it enters theglass. The angle ofeach refracted ray (r)differs from the angle ofeach incident ray (i) byan amount that dependson the refractive indicesof air and glass.
Mather2008-06.qxp 10/23/08 7:59 PM Page 185

Copyright © 2009 George Mather – http://www.psypress.com/mather
186 F O U N D AT I O N S O F S E N S AT I O N A N D P E R C E P T I O N
FIGURE 6.17Formation of the Airydisk. The wavefront(W1) emanating from apoint is curved in anarc centered on thepoint. After thiswavefront has passedthrough a lens, it iscurved in an arccentered on the focalpoint of the lens (W2).Each point on awavefront can beconsidered as thesource of newwavefronts. Threepoints are shown onW2. As thesewavefronts interactwhen they reach thefocal point, constructiveand destructiveinterference produces acentral bright disk (theAiry disk) surroundedby dimmer rings.
where c is the speed of light in a vacuum, v is its speed in the medium.Air has a refractive index n of 1.00029. For water n equals 1.333, forglass n equals approximately 1.5, and for the cornea (outermostsurface of the eye) n equals 1.376. The degree to which light rays aredeflected or refracted as they pass from one medium into anotherdepends on the refractive index of each medium. The angle of refractionis defined in Snell’s Law:
sin i / sin r �n2 /n1
where sin i is the angle of the incident light ray as it strikes the interfacebetween medium 1 and medium 2, sin r is the angle of the refractedlight ray traveling through medium 2, and n2, n1 are the indices ofrefraction of the two media (see Figure 6.16). The angle through whichlight rays are refracted on entering a given medium is higher for mediawith larger refractive indices.
Airy diskAccording to ray or geometric optics, the real image of the point sourcein Figure 6.1 should itself be a point. However, images formed by actuallenses never conform to this ideal. Even in the best lenses, the imageof a point is always slightly blurred. To understand why this is so, wemust consider image formation in terms of wave or physical opticsrather than geometrical optics. Light from a point strikes the lens as awavefront, shown as W1 in Figure 6.17 (rays are lines at right-angles tothe wavefront).
The part of the wavefront passing through the center of the lens isdelayed more than the part passing through the edge of the lens,
W1
W2
Airy disk
Mather2008-06.qxp 10/23/08 7:59 PM Page 186

Copyright © 2009 George Mather – http://www.psypress.com/mather
6 The physics of vision—light and the eye 187
because the lens is thinner at its edges. Consequently, the wavefrontthat emerges from the lens is curved in an arc centered on the focalpoint (W2 in Figure 6.17). As the various parts of the wavefront meetat the focal point, they interfere to create an interference pattern ofthe same kind as that observed by Thomas Young. The pattern has acentral bright spot, known as the Airy disk, surrounded by analternating series of faint dark and bright rings. Figure 6.17 illustrateshow interference produces the Airy disk. Each point on the wavefrontemanating from the lens (W2 in the figure) can be considered as thesource of a new wavefront. Three such wavefronts are shown in thefigure. Just as in the case of Young’s double slit experiment (seeFigure 6.2), when these different wavefronts cross they interact toeither cancel out or augment each other. All of the wavefronts combineconstructively at the focal point to create a bright spot, but alternatingdestructive and constructive interference creates a series of ringssurrounding this spot.
Optical systems, including eyes, usually have a circular aper tureplaced between the light source and the lens in order to controllight intensity and depth of field. The radius of the Air y disk dependson the diameter of the aper ture, according to the followingequation:
r � 1.22 • f �/D
where r is the radius of the disk (radius to the first dark ring), f is focallength, D is aperture diameter, and � is the wavelength of the light (allmeasures in mm). The width of the Airy disk is inversely proportional toaperture diameter—wider apertures create smaller disks. You may beable to understand why this is so from inspection of Figure 6.17. Anaperture placed in front of the lens limits the size of the wavefrontemanating from the lens. A narrow aperture, for example, would removethe more peripheral (top and bottom) wavefronts and so broaden theinterference pattern at the focal point.
Figure 6.18 plots the intensity of the retinal image created by a verythin line, at two different pupil diameters. The dotted line is thelinespread expected on the basis of diffraction effects alone. The solidline is the actual image measured by Campbell and Gubisch (1966). Atthe narrower pupil diameter, the actual linespread is very close to thatpredicted by diffraction—the image is said to be diffraction-limited. Atthe wider pupil diameter, diffraction effects predict a narrower spread,according to the equation above. Actual linespread at wider pupildiameters is much worse than that predicted by diffraction—opticalimperfections play a much greater role in determining image quality.Small pupil diameters are therefore optimal for preserving imagequality.
K E Y T E R M S
Airy diskThe image of a pointlight source createdby an optical system;it contains a brightcentral spotsurrounded by severalfaint rings.
Linespread functionThe image (or amathematical functiondescribing the image)of a very thin linecreated by an opticalsystem.
Mather2008-06.qxp 10/23/08 7:59 PM Page 187
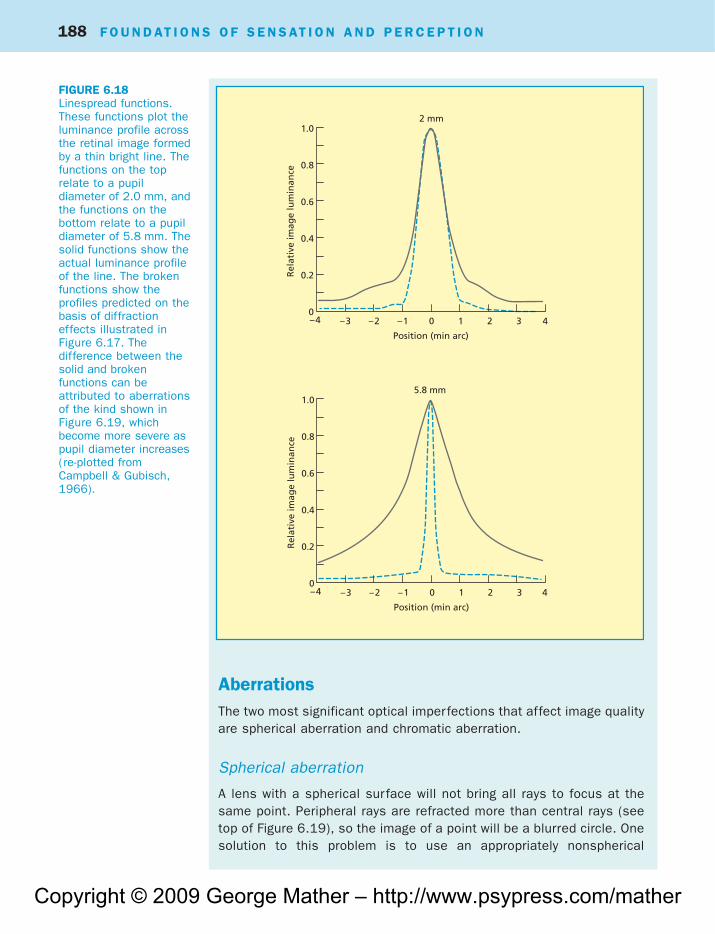
Copyright © 2009 George Mather – http://www.psypress.com/mather
188 F O U N D AT I O N S O F S E N S AT I O N A N D P E R C E P T I O N
AberrationsThe two most significant optical imperfections that affect image qualityare spherical aberration and chromatic aberration.
Spherical aberration
A lens with a spherical surface will not bring all rays to focus at thesame point. Peripheral rays are refracted more than central rays (seetop of Figure 6.19), so the image of a point will be a blurred circle. Onesolution to this problem is to use an appropriately nonspherical
2 mm
5.8 mm
1.0
0.8
0.6
0.4
0.2
0–4 –3 –2 –1 0 1 2 3 4
Position (min arc)
Rel
ativ
e im
age
lum
inan
ce
1.0
0.8
0.6
0.4
0.2
0–4 –3 –2 –1 0 1 2 3 4
Position (min arc)
Rel
ativ
e im
age
lum
inan
ce
FIGURE 6.18Linespread functions.These functions plot theluminance profile acrossthe retinal image formedby a thin bright line. Thefunctions on the toprelate to a pupildiameter of 2.0 mm, andthe functions on thebottom relate to a pupildiameter of 5.8 mm. Thesolid functions show theactual luminance profileof the line. The brokenfunctions show theprofiles predicted on thebasis of diffractioneffects illustrated inFigure 6.17. Thedifference between thesolid and brokenfunctions can beattributed to aberrationsof the kind shown inFigure 6.19, whichbecome more severe aspupil diameter increases(re-plotted fromCampbell & Gubisch,1966).
Mather2008-06.qxp 10/23/08 7:59 PM Page 188
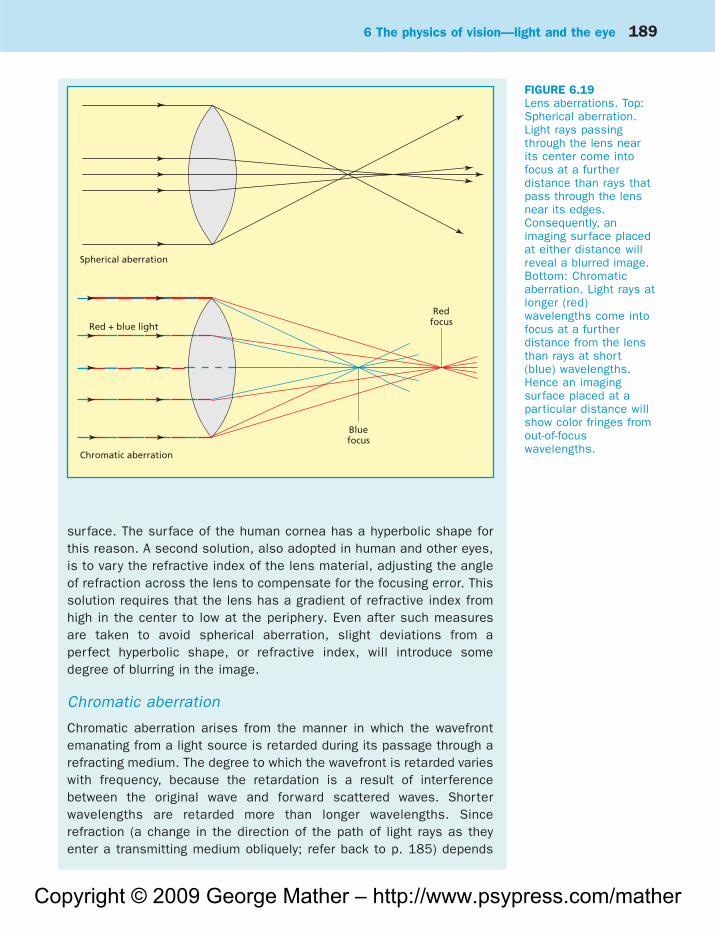
Copyright © 2009 George Mather – http://www.psypress.com/mather
6 The physics of vision—light and the eye 189
surface. The surface of the human cornea has a hyperbolic shape forthis reason. A second solution, also adopted in human and other eyes,is to vary the refractive index of the lens material, adjusting the angleof refraction across the lens to compensate for the focusing error. Thissolution requires that the lens has a gradient of refractive index fromhigh in the center to low at the periphery. Even after such measuresare taken to avoid spherical aberration, slight deviations from aperfect hyperbolic shape, or refractive index, will introduce somedegree of blurring in the image.
Chromatic aberration
Chromatic aberration arises from the manner in which the wavefrontemanating from a light source is retarded during its passage through arefracting medium. The degree to which the wavefront is retarded varieswith frequency, because the retardation is a result of interferencebetween the original wave and forward scattered waves. Shorterwavelengths are retarded more than longer wavelengths. Sincerefraction (a change in the direction of the path of light rays as theyenter a transmitting medium obliquely; refer back to p. 185) depends
Spherical aberration
Chromatic aberration
Bluefocus
RedfocusRed + blue light
FIGURE 6.19Lens aberrations. Top:Spherical aberration.Light rays passingthrough the lens nearits center come intofocus at a furtherdistance than rays thatpass through the lensnear its edges.Consequently, animaging surface placedat either distance willreveal a blurred image.Bottom: Chromaticaberration. Light rays atlonger (red)wavelengths come intofocus at a furtherdistance from the lensthan rays at short(blue) wavelengths.Hence an imagingsurface placed at aparticular distance willshow color fringes fromout-of-focuswavelengths.
Mather2008-06.qxp 10/23/08 7:59 PM Page 189

Copyright © 2009 George Mather – http://www.psypress.com/mather
190 F O U N D AT I O N S O F S E N S AT I O N A N D P E R C E P T I O N
on retardation, the angle through which a light ray is refracted dependson its frequency. Shorter (violet) wavelengths are deflected more thanlonger (red) wavelengths. If the refracting device is a prism, then whitelight (composed of many wavelengths) will be dispersed into a rainbowspectrum of colors. If the refracting device is a lens, then each differentwavelength will have a different focal point (see bottom of Figure 6.19).The image of light from a white point will be a blurred circle of coloredfringes. Cameras attempt to compensate for this effect by combiningtwo lenses of different material and different shape, so that theiraberrations cancel out. Eyes attempt to deal with the problem byreducing sensitivity to wavelengths at the short end of the visiblespectrum.
Lens equationsLens equations allow us to calculate the size and location of the imageproduced by a lens. For a thin lens, the distance (di) of the image fromthe focal plane depends on the distance of the object (do), as defined inthe Newtonian lens equation (which first appeared in Isaac Newton’sOpticks in 1704):
di � f 2/do
For an object very far away from the lens (do essentially infinite), di iseffectively zero, so the image falls in the focal plane of the lens. As theobject approaches the lens, di grows progressively because the point offocus falls beyond the focal plane of the lens. An imaging surface fixedin position at the focal plane would render a blurred image of the object.In order to maintain a focused image, one of two things must happen.The imaging surface could be moved back away from the lens until itcoincides with the point of focus. This is the solution used in manycameras. Alternatively, the power (focal length) of the lens could beadjusted to maintain focus on a fixed imaged plane. As objects movecloser to the lens, its power must be increased to maintain focus. Thisis the solution adopted in human eyes.
The size of the image, Hi, is an important consideration for eyes. Thefollowing equations specify image height:
Hi /Ho � f /do, or
Hi � Ho • (f /do)
Thus, for a given size of object (i.e., Ho fixed), at a given distanceaway (i.e., do fixed), the size of the image scales directly with focallength f. Lenses with small focal lengths project smaller images thanthose with long focal lengths. The human eye has a focal length of
Mather2008-06.qxp 10/23/08 7:59 PM Page 190
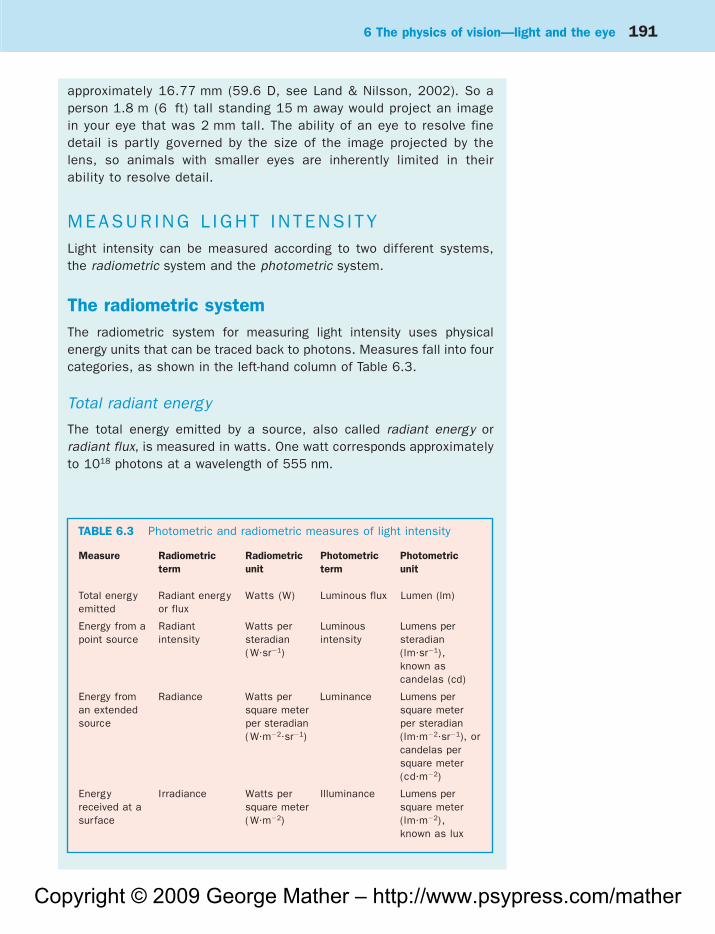
Copyright © 2009 George Mather – http://www.psypress.com/mather
6 The physics of vision—light and the eye 191
approximately 16.77 mm (59.6 D, see Land & Nilsson, 2002). So aperson 1.8 m (6 ft) tall standing 15 m away would project an imagein your eye that was 2 mm tall. The ability of an eye to resolve finedetail is partly governed by the size of the image projected by thelens, so animals with smaller eyes are inherently limited in theirability to resolve detail.
MEASUR ING L IGHT INTENS I TYLight intensity can be measured according to two different systems,the radiometric system and the photometric system.
The radiometric systemThe radiometric system for measuring light intensity uses physicalenergy units that can be traced back to photons. Measures fall into fourcategories, as shown in the left-hand column of Table 6.3.
Total radiant energy
The total energy emitted by a source, also called radiant energy orradiant flux, is measured in watts. One watt corresponds approximatelyto 1018 photons at a wavelength of 555 nm.
Measure Radiometric Radiometric Photometric Photometricterm unit term unit
Total energy Radiant energy Watts (W) Luminous flux Lumen (lm)emitted or flux
Energy from a Radiant Watts per Luminous Lumens perpoint source intensity steradian intensity steradian
( W�sr�1) (lm�sr�1),known ascandelas (cd)
Energy from Radiance Watts per Luminance Lumens peran extended square meter square metersource per steradian per steradian
( W�m�2�sr�1) (lm�m�2�sr�1), orcandelas persquare meter(cd�m�2)
Energy Irradiance Watts per Illuminance Lumens perreceived at a square meter square metersurface ( W�m�2) (lm�m�2),
known as lux
TABLE 6.3 Photometric and radiometric measures of light intensity
Mather2008-06.qxp 10/23/08 7:59 PM Page 191
Copyright © 2009 George Mather – http://www.psypress.com/mather
192 F O U N D AT I O N S O F S E N S AT I O N A N D P E R C E P T I O N
Radiant energy from a point source
Energy emitted by a point source emanates in all directions, so it isusually more convenient to specify the range of directions over whichthe measured amount of energy is emitted. The convention is toconsider a point source as positioned at the center of a sphere, and todivide the sphere into conical sectors. These sectors are measured inunits of solid angle known as steradians. A complete sphere contains4 steradians. Energy emitted by a point source, also called radiantintensity, is therefore specified in watts per steradian.
Radiant energy from an extended source
Most light-emitting sources, such as TV and computer screens, areextended over space. The appropriate measure of intensity for suchsources must therefore specify the unit of sur face area over whichit applies. Energy emitted by an extended source, also calledradiance, is therefore specified in watts per square meter persteradian.
Radiant energy received at a surface
Energy falling on a receiving surface can simply be specified in termsof watts received per square meter of surface area, also calledirradiance. The amount of energy received depends on both the energyemitted by the source and the distance between the receiving surfaceand the source. Irradiance Ee can be calculated from radiant intensity Ieusing the following relation:
Ee � Ie /r 2
where r is the distance between the source and the receiving surface.Energy falling on the surface declines according to the square of thedistance, known as the inverse square law. Each doubling in distanceresults in a fourfold decline in irradiance. This occurs because asdistance increases, energy emanating over a particular range ofdirections falls on a progressively greater area of the receiving surface(the same effect occurs with sound intensity, for the same reasons).Strictly speaking, the inverse square law holds only for point sources.Practically speaking, it operates with an error of less than 1% if thediameter of the source is less than 1/10th of the distance to thereceiving surface (Pokorny & Smith, 1986).
The photometric systemLight was defined at the beginning of the chapter as energy that iscapable of evoking a visual sensation. Since this definition includes a
Mather2008-06.qxp 10/23/08 7:59 PM Page 192
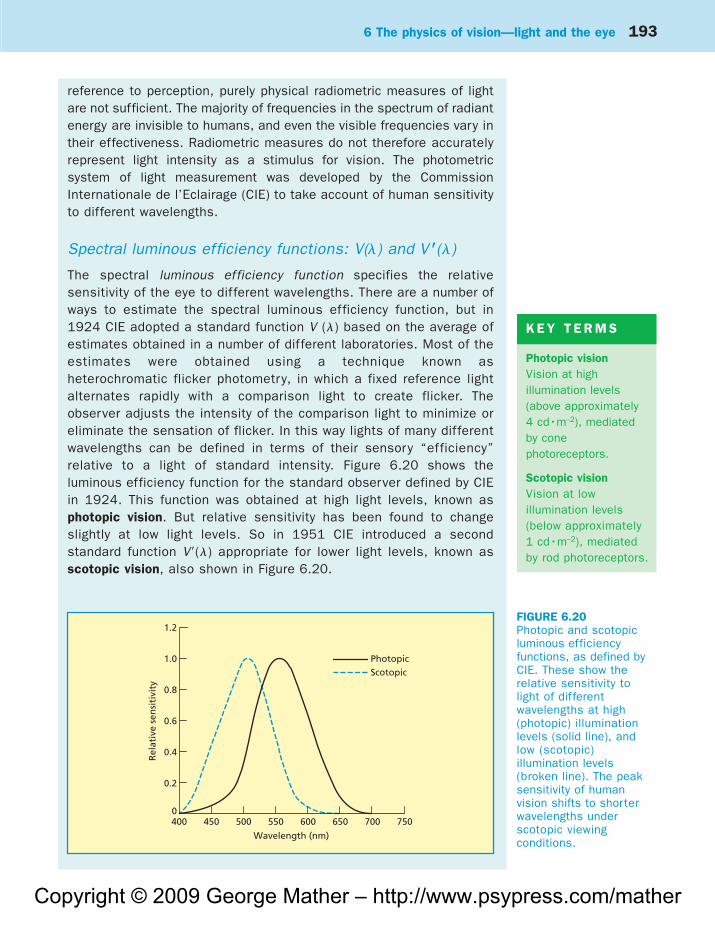
Copyright © 2009 George Mather – http://www.psypress.com/mather
6 The physics of vision—light and the eye 193
reference to perception, purely physical radiometric measures of lightare not sufficient. The majority of frequencies in the spectrum of radiantenergy are invisible to humans, and even the visible frequencies vary intheir effectiveness. Radiometric measures do not therefore accuratelyrepresent light intensity as a stimulus for vision. The photometricsystem of light measurement was developed by the CommissionInternationale de l’Eclairage (CIE) to take account of human sensitivityto different wavelengths.
Spectral luminous efficiency functions: V(�) and V �(�)
The spectral luminous efficiency function specifies the relativesensitivity of the eye to different wavelengths. There are a number ofways to estimate the spectral luminous efficiency function, but in1924 CIE adopted a standard function V (�) based on the average ofestimates obtained in a number of different laboratories. Most of theestimates were obtained using a technique known asheterochromatic flicker photometry, in which a fixed reference lightalternates rapidly with a comparison light to create flicker. Theobserver adjusts the intensity of the comparison light to minimize oreliminate the sensation of flicker. In this way lights of many differentwavelengths can be defined in terms of their sensory “efficiency”relative to a light of standard intensity. Figure 6.20 shows theluminous efficiency function for the standard observer defined by CIEin 1924. This function was obtained at high light levels, known asphotopic vision. But relative sensitivity has been found to changeslightly at low light levels. So in 1951 CIE introduced a secondstandard function V�(�) appropriate for lower light levels, known asscotopic vision, also shown in Figure 6.20.
1.2
1.0
0.8
0.6
0.4
0.2
0
PhotopicScotopic
Rel
ativ
e se
nsi
tivi
ty
400 450 500 550 600 650 700 750
Wavelength (nm)
FIGURE 6.20Photopic and scotopicluminous efficiencyfunctions, as defined byCIE. These show therelative sensitivity tolight of differentwavelengths at high(photopic) illuminationlevels (solid line), andlow (scotopic)illumination levels(broken line). The peaksensitivity of humanvision shifts to shorterwavelengths underscotopic viewingconditions.
K E Y T E R M S
Photopic visionVision at highillumination levels(above approximately 4 cd•m–2), mediatedby conephotoreceptors.
Scotopic visionVision at lowillumination levels(below approximately1 cd•m–2), mediatedby rod photoreceptors.
Mather2008-06.qxp 10/23/08 7:59 PM Page 193
Copyright © 2009 George Mather – http://www.psypress.com/mather
194 F O U N D AT I O N S O F S E N S AT I O N A N D P E R C E P T I O N
Units in the photometric system of measurement are based oncorresponding units in the radiometric system, adjusted for the relativeefficiencies defined in V(�) and V�(�), as shown in Table 6.3.
Total luminous energy
Total energy emitted, or luminous flux, is specified in lumens. Onelumen is defined as the luminous flux of 1/683 W of monochromaticradiation at a wavelength of 555 nm (Makous, 1998), or approximately4 � 1015 photons. The total luminous flux emitted by a source iscalculated by multiplying the radiant flux at each wavelength by itsluminous efficacy defined on the luminous efficiency function, andsumming the products.
Luminous energy from a point source
Energy emitted by a point source, or luminous intensity, is specified inlumens per steradian, also known as candelas (cd).
Luminous energy from an extended source
Energy emitted by an extended source, or luminance, is specified incandelas per square meter (lumens per square meter per steradian),abbreviated to cd•m�2.
Luminous energy received at a surface
Energy received at a surface, or illuminance, is specified in lux (lumensper square meter).
Photometric units are used very frequently in the research literature,the most commonly used unit being candelas per square meter(cd•m�2), since this measures surface luminance of visual stimuli.Luminance is usually measured by pointing a telescopic spotphotometer at the surface to be measured. The photometer is similar insize and shape to a small camcorder. The center of its viewfindercontains a small gray spot. A digital display on the photometer reportsthe luminance of the area covered by the spot, in cd•m�2.
Retinal illumination
Even photometric luminance units may not provide a sufficiently precisemeasure of stimulus intensity in certain situations. Light enters the eyevia the pupil, and variation in the diameter of the pupil can result insignificant variation in the amount of light that falls on the retina of theeye (see earlier in the chapter for a discussion of the pupil). Trolandunits (td) specify retinal illuminance, taking pupil size into account. Onetroland is defined as the retinal illumination that would result from
K E Y T E R M
TrolandA photometric unitspecifying retinalilluminance, whichtakes into accountpupil diameter.
Mather2008-06.qxp 10/23/08 7:59 PM Page 194

Copyright © 2009 George Mather – http://www.psypress.com/mather
6 The physics of vision—light and the eye 195
K E Y T E R M
Stiles-Crawford effectThe variation in thesensitivity of theretina with the placeof entry of light raysat the pupil.
viewing a surface at 1 cd•m�2 through a pupil with an area of 1 mm2
(Makous, 1998). There are two limitations on the accuracy of trolandmeasures. First, troland value does not make any correction forabsorption by ocular media. Second, troland value does not take intoaccount the part of the pupil through which light enters the eye. Lightentering near the edge of the pupil is less effective than light enteringnear the center of the pupil, because of the optical properties of theretinal photoreceptors (light rays that strike the photoreceptorsobliquely are less effective than rays that strike them straight on). Thiseffect is known as the Stiles-Crawford effect.
Mather2008-06.qxp 10/23/08 7:59 PM Page 195

Copyright © 2009 George Mather – http://www.psypress.com/mather
1-D spatial images 266–72-D spatial images 267–9, 2702AFC tasks 31, 333-D objects 339–40
Aberration 177, 188–90Absolute threshold 27Absorption 163–4Acceleration: responses to 76–8, 87Accessory optic system 212Accidental viewpoint 282Accommodation 172, 172–3, 304–5Accommodative vergence 309Achromatic channel 210, 368Adapatability 17Adaptation 20Additive color mixture 362, 362–4
linearity 362–3origin 365–8trichromacy 363, 366–8uses 363–4
After-images 371Age 399–404, 415–16
changes in perceptual capacity399–403
changes in the brain 403–4hearing level 400, 402infant vision 417–18odor identification 400, 402touch discrimination 400, 403visual acuity 172, 399–401
Age-related macular degeneration(AMD) 401, 419
Agnosia 275, 275–6AI (artificial intelligence) 11Airy disk 186–7, 187Algorithms 22, 23Aliasing 330, 330–1Alignment 286–7Amacrine cells 203Ambiguity 392–3AMD (age-related macular
degeneration) 401, 419Ames Window 408, 409Amgydala 45Amplitude 93, 93–4Anaglyphs 322, 323Analog representation 21, 21–2, 24Anomalous trichromacy 374–5, 376Anosmia 48Aperture problem 337
Apparent motionclassical displays 344–5space–time plots 355–6stroboscopic apparent movement
334, 334–5transformational apparent motion 349two-process theory 345–5vs. real movement 334–6
Apperceptive agnosia 275Aqueous humor 170–1Artificial intelligence (AI) 11Artists 412, 418–20Associative agnosia 276Astigmatism 419–20Atmospheric perspective 304Attached shadows 307Attention 392Attentional control of sensory
processing 391–7acuity variation 393–4ambiguous stimuli 392–3attention 392attentional modulation 395–6endogenous attention 386evidence 392–6exogenous attention 386habituation 417–18inattentional blindness 289, 394,
394–5mechanisms 396–7object-based attention 395preferential attention 417“reach of attention” 396–7source of signals 397
Auditory association cortex 117Auditory localization 139–43, 153
cones of confusion 140–1, 141distance judgments 142–3duplex theory 140horizontal plane 139–41minimum audible angle (MAA)
139–40precedence effect 142vertical plane 141–2
Auditory nerveintensity coding 111sound frequency coding 109–11
Auditory scene analysis 148–9, 154sequential grouping 148–9simultaneous grouping 149
Auditory streaming 148, 411–12
Auditory system: physiology 14,100–17, 118–19
ascending auditory pathway 112–16auditory cortex 116–17central auditory system 112–17, 119descending auditory pathway 117inner ear 103, 103–11middle ear 102, 102–3outer ear 101, 102peripheral auditory system 100–12,
118–19, 402see also hearing; hearing
dysfunction; soundAutocorrelation theory 138Autostereogram 322, 324Axons 13Azimuth 114, 139
� (bias) 29–30, 32Balance see vestibular systemBand-pass noise 133Basilar membrane 104, 104–6, 108Bayesian models of visual perception
286, 291–5inference in shape analysis 294inference in signal combination 295probability 292–3
Beats 137Bias (�) 29–30, 32Binocular depth cues 308, 308–15
binocular disparity 220, 309–15vergence 180, 308–9
Binocular disparity 220, 309–15correspondence problem 314,
314–15diplopia 314far disparity 311horizontal binocular disparity 310,
310–12, 318–20near disparity 311physiology 314random-dot stereograms (RDS)
312, 312–14stereoblindness 314vertical disparity 312, 324–5
Binocular neurons 213Binocularity 181, 219–20
convergence 180, 181, 212–13divergence 180
Biological motion 340, 340–2Biplexiform ganglion cells 203
Subject indexNote: References in bold are to key terms; those in italic are to chapter summaries.
Mather2008-SubjectIndex.qxp 10/16/08 9:38 PM Page 449

Copyright © 2009 George Mather – http://www.psypress.com/mather
450 Subject index
Bipolar cells 201–2Bistratified ganglion cells 203, 203–8,
215Blindness, inattentional 289, 394,
394–5Blindsight 275Blobs 223Block quantization effects 261Body senses 61–89
somatosensory system 4, 61–72,83–4
vestibular system 4, 72–83, 84Brain
cerebral cortex 3, 5developmental changes 403–4senescence 404
Brain imaging 9–10computerized tomography (CT) 9functional MRI (fMRI) 10, 52, 147,
148–9, 347, 349, 387, 389,396–7, 406, 414
magnetic resonance imaging (MRI)10, 414
positron emission tomography(PET) 58, 146, 388
Brightness 360
Canal of Schlemm 171Candelas (cd) 194“Carpentered world” hypothesis
408–10Cassatt, Mary 419Cast shadows 307Cataracts 401, 419Categorical perception 144, 144–5cd (candelas) 194Center–surround receptive fields 67Central auditory processing
disorder 152Cerebellum 78–9Cerebral cortex 3, 5Channels 69Chemical senses 43–59
flavor 55, 57physiological principles 55sensory principles 55smell 4, 43–8, 56taste 4, 48–55, 57theoretical principles 56
Chemoreceptors 58–9Chromatic aberration 177, 189–90Chromatic channels 210, 368Chromatic filtering 210Chromaticity coordinates 365Chromophore 199CIE (Commission Internationale de
l’Eclairage) 193, 364CIE chromaticity diagram 364, 364–5Ciliary processes 170Classification of the senses 4–5, 25
Clinical studies 6–7Cochlea 72, 103
inner hair cells 106, 107–8mechanical properties 104–6organ of Corti 106, 106–7outer hair cells 106, 108–9, 151structure 103–4
Cochlear damage 151–2Cochlear nuclei 112Cochlear partition 103, 104Collector units 280Color constancy 373–4, 373Color deficiency 374, 374–7, 378
anomalous trichromacy 374–5, 376diagnosis 376–7dichromacy 375incidence 375–6monochromacy 375
Color interactions 369, 369–73, 377–8adaptation 370, 371–2constancy 373–4, 373contrast 369–70, 372origins 370–3physiology 372–3
Color matching 364–5Color mixture 360–8, 377
additive color mixture 362, 362–4,365–8
CIE chromaticity diagram 364,364–5
subtractive color mixture 361,361–2
Color space 359–60, 377Color vision 359–81, 377–8
color deficiency 374, 374–7, 378color interactions 369, 369–73,
377–8color matching 364–5color mixture 360–8, 377color space 359–60, 377dual-process theory 368–9, 377opponency theory 210, 360trichromacy theory 363, 366,
366–8, 378–81wavelength 168–9, 220, 359
Commission Internationale del’Eclairage (CIE) 193, 364
Common fate 277, 278Complementary colors 365Complex cells 217, 218–19Complex numbers 122Complex waves 94, 95Compressions 91, 92Computation 11, 22–4Computational modeling 38–9, 230–5Computerized tomography (CT) 9Concha 102Conductive hearing loss 149, 150–1Cone bipolars 202Cone of confusion 140–1, 141
Cones (photoreceptors) 174, 178–9,198–200, 202, 204
Cones, generalized 285Connectionism 11Consonance 156Constructivism 36–7Continuity 315Contour integration 279–81
image-based 280–1symbolic contour integration 281
Contrast 167, 167–8, 240Contrast ratios 242Contrast sensitivity function (CSF)
241, 241–3Convolution 233Cooperative interactions 280Coriolis effects 82Cornea 170, 171–3Correspondence problem 314,
314–15Cortex
association areas 14, 15auditory cortex 116–17cerebral cortex 3, 5extrastriate cortex 216, 223–8primary olfactory cortex 45receiving areas 14, 15somatosensation 65–9, 414striate cortex 216, 216–23taste 52
Cortical column 68Cortical magnification 16, 68–9Crista 78Critical-band masking 134Critical bandwidth 133Critical period 16Cross-adaptation 48Cross-fiber theory 53, 53–4Cross-modal cuing 384, 384–5Crowding 282–3CSF (contrast sensitivity function)
241, 241–3CT (computerized tomography) 9Culture 407–10, 416
“carpentered world” hypothesis408–10
pictorial competence 407, 407–8Cupula 78Curvilinear aggregation 281
d� (d-prime) 32D (diopters) 172, 184Daedalus 334–5Dark adaptation 237–8Decibels (dB) 93Decision rules 24Degas, Edgar 419Dendrites 13Depth-based segmentation 278Depth of field 302
Mather2008-SubjectIndex.qxp 10/16/08 9:38 PM Page 450

Copyright © 2009 George Mather – http://www.psypress.com/mather
Subject index 451
Depth perception 297–325, 317–18binocular cues 308, 308–15cue combination 315–17, 318geometrical basis of stereopsis
318–25monocular cues 297, 297–308
Detectability 18Deuteranomaly 375Deuteranopia 375Dichromacy 375Difference-of-Gaussians (DoG) 231Differential threshold 27Diffraction 161Diffuse reflection 164Diopters (D) 172, 184Diplopia 314Direct perception 37–8Direction-selective cells 219Direction-specific threshold elevation
332, 332–3Disparity see binocular disparityDissonance 156DoG (difference-of-Gaussians) 231Dorsal brain regions 72Dorsal root ganglia 64Dorsal stream 226, 227Double opponency 220Dual-process theory of color
368–9, 377Duplex theory 140Dynamic range 111
Earcanal 101, 102as Fourier analyzer? 111–12inner 103, 103–11middle 102, 102–3outer 101, 102
Ecological approach 37–8, 408–10Edge localization 256–61
edges 256–8hyperacuity 258–9theories 259–61
Edinger-Westphal nucleus 212Einstein, Albert 77, 163El Greco 419–20Electrical Field Theory 7, 229–30Electro-optical shutters 322, 323Electromagnetic spectrum 161, 161–2Emotion and smell 57–8Endogenous attention 386Endolymph 74Epipolar line 315, 320Epipolar plane 315, 320Epipolarity 315, 320Epithelium 44, 45, 74Equal-loudness contour 130ERPs (event-related potentials)
387, 418Euler’s relation 126
Eustachian tube 102Even functions 120Event-related potentials (ERPs)
387, 418Evolution and music 157Excitation pattern model 131Exogenous attention 386Expertise 411–14, 416
formal training 411–12neural correlates 414practice 413–14
“Explanatory gap” 18Extrastriate cortex 216, 223–8
architecture 225–6connectivity 224, 225lesion studies 226response latency 224, 224–5response properties 225, 226size 224, 225“two streams” theories 226–8
Eye 169–79, 183cornea 170, 171–3developmental changes 401lens 171–3muscles 179optical properties 171–9optimal size 177–8photoreceptors 13, 174–5,
178–9, 198pupil 170, 173resolution 175–9, 180–1retina 197, 198–211, 228senescence 401sensitivity 175, 177–9structure 170–1visual angle 171
Eye movements 179–82, 183binocular registration 181commands 333–4muscles 179spatial resolution 180–1, 182types of movement 179–80
Far disparity 311Fast Fourier transform (FFT) 127Feature detectors 8, 8–9Feature space 287, 287–8Feature tracking 347, 348Filter–rectify–filter (FRF) 262, 264,
278, 288, 347, 391First-order motion displays 345,
345–6Flavor 55, 57fMRI (functional MRI) scans 10, 52,
147, 148–9, 347, 349, 387, 389,396–7, 406, 414
Focal length 165, 184, 190–1Forced-choice tasks 31, 31–2Formant frequencies 143Formant transitions 143
Fourier analysis 96, 119–271-D spatial images 266–72-D spatial images 267–9, 270complex numbers 122energy 123even and odd functions 120Fourier transforms 127, 252, 263inner products 120, 120–2magnitude 123nonperiodic waveforms 125–6periodic waveforms 123–5phase 123in sensory systems 111–12, 126–7sound 96–100spatial frequency filtering 250,
269–70, 271spatiotemporal images 270–2vision 250–2, 266–73
Fourier integrals 125Fourier series 123Fourier spectrum 96Fourier synthesis 96Fovea 174Free fusion 322, 324Free nerve endings 45, 51Frequency 92Frequency coding 110–11Frequency discrimination 135Frequency filters 97–8, 98Frequency selectivity
masking 132, 132–5, 255, 255–6physiological basis 134–5psychophysical studies 132–4
Frequency-to-place conversion 106FRF see filter–rectify–filterFundamental frequency 95, 95–6
Ganglion cells 198, 203, 203–11cell types 203–4, 215chromatic filtering 210information processing 208–11luminance response 204ON and OFF systems 211spatial filtering 209–10spatial response 204–6spectral response 204, 206spectral/spatial opponency 206–8temporal filtering 210–11temporal response 204, 208
Generalized cones 285Generic viewpoint 282Geniculostriate pathway 211, 212–15
representation of visual field212–13
signal processing in LGN 215structure of LGN 213–15
Geometrical illusions 408, 408–10Geons 285–6Gestalt psychology 35, 35–6, 276–7Good continuation 277
Mather2008-SubjectIndex.qxp 10/16/08 9:38 PM Page 451

Copyright © 2009 George Mather – http://www.psypress.com/mather
452 Subject index
Graded potentials 200Gray matter 404Ground plane 299Gustation see tasteGustatory papillae 49
Habituation 417–18Haptic perception 71Harmonic frequency 95Harmonics 95–6Head movement 75–6Hearing 4, 129–49
and age 400, 402auditory localization 139–43, 153auditory scene analysis 148–9, 154loudness perception 129–32, 153music perception 153–7pitch perception 132–9, 153sex differences 405speech perception 143–7, 154see also auditory system:
physiology; hearing dysfunction; sound
Hearing dysfunction 149–52, 154conductive hearing loss 149, 150–1sensorineural hearing loss 149,
151–2tinnitus 152
Heat 164Height in the visual field (HVF) 299,
299–300Helicotrema 104Hertz (Hz) 14, 15, 92Heschl’s gyrus 116Heterochromatic flicker
photometry 193Hierarchical processing 13–14Hippocampus 414Horizontal binocular disparity 310,
310–12, 318–20Horizontal cells 202, 202–3Hue 359Huygens, Christian 160HVF (height in the visual field) 299,
299–300Hyperacuity 258, 259Hypercolumns 223Hypercomplex cells 218Hyperopia 173, 419Hypothalamus 212Hz (hertz) 14, 15, 92
ILD (interaural level differences) 114,116, 140
Illusion studies 408–10Image-based vs. symbolic
processing 288Image blur 302–3Impedance 103Impedance matching 103
Impressionists 418–19Inattentional blindness 289, 394,
394–5Incus (anvil) 102Individual differences 399–420,
415–16age 399–404, 415–16culture 407–10, 416expertise 411–14, 416idiosyncratic differences 414–15, 416infant vision 417–18sex 404–6, 416vision of artists 418–20
Information processing device 230Inner ear 103, 103–11Inner hair cells 106, 107–8Inner products 120, 120–2Inouye, Tatsuji 7Interaural level differences (ILD) 114,
116, 140Interaural time differences (ITD) 114,
114–16, 140, 149Interference pattern 160Interposition 307Interreceptor angle 177Intersection-of-constraints model see
velocity space modelIntersubjectivity 39Introspection 35Inverse square law 192Ion channels 17Iris 170Irradiance 192Ishihara test for color deficiency 376ITD see interaural time differences
Just noticeable difference (JND) 27
Kinesthesis 61Kinetic depth 339, 339–40Kinocilium 72, 72–4Knee-jerk reflex 65Konio layers 213, 213–14
Labeled lines 22Labyrinth 72, 74–8Language and music 157Lateral geniculate nuclei (LGN) 211
signal processing 215structure 213–15
Lateral inhibition 67, 202Lemniscal pathway 64, 64–5Lenard, Phillip 162, 163Lens equations 190–1Lenses 160, 184
eye 171–3Leonardo da Vinci 304Lesion experiments 6, 226Lesions 6LGN see lateral geniculate nuclei
Light 159–69, 183, 192–3absorption 163–4contrast 167, 167–8, 240duality of light 162–3intensity 166–7, 191–5lenses 160, 184particles 160, 163properties 163–6rays 159–60, 163reflectance 167, 167–8, 169reflection 160, 164refraction 159, 159–60, 165–6,
185–6spectral power distribution 168, 169spectral reflectance functions 169transmission 164–6wavelength 168–9, 220, 359waves 160–2, 163
Light intensity 166–7photometric system 192–5radiometric system 191–2
Linear filter 99Linear systems theory 99Linearity 99–100, 106, 111–12, 362–3Linespread function 187, 187–8Linking propositions 24Localization of function 6, 10Loudness 129, 155Loudness perception 129–32, 153
loudness matching 129–30loudness scaling 131models 131–2
Loudness recruitment 151, 151–2Lumens 194Luminance 166, 194Luminance gratings 239, 239–40
contrast thresholds 240–1Luminous energy 194Luminous flux 194Luminous intensity 194Lux 194
MAA (minimum audible angle)139–40
McGurk effect 384, 385Macula 76Macular degeneration 401, 419MAE (motion after-effect) 331, 331–2Magnetic resonance imaging (MRI)
10, 414 see also fMRI (functionalMRI) scans
Magnification 176Magnitude 123Magnitude estimation 18, 131Magno layers 213, 213–14Malleus (hammer) 102Masking 132, 132–5, 255, 255–6Meatus 101Mechanoreceptors 13Medial geniculate nucleus 113
Mather2008-SubjectIndex.qxp 10/16/08 9:38 PM Page 452

Copyright © 2009 George Mather – http://www.psypress.com/mather
Subject index 453
Meissner’s corpuscles 63, 65Melody 156Mental lexicon 147Mental rotation tasks 405, 405–6, 412Merkel’s disks 63, 65Mesopic vision 238Metameric colors (metamers) 362Method of adjustment 29Method of constant stimuli 29, 241Metric depth cues 297Microelectrode recordings 8Microneurography 65Microsaccades 180Microspectrophotometry 368Middle ear 102, 102–3Midget ganglion cells 203, 203–8, 215Minimum audible angle (MAA)
139–40Mirror stereoscope 321–2Missing fundamental wave 137Mitral cells 45Modular processing 383–4, 384Monet, Claude 419Monochromacy 375Monocular depth cues 297, 297–308
accommodation 304–5atmospheric perspective 304height in the visual field (HVF)
299, 299–300image blur 302–3interposition 307motion parallax 305–7, 307retinal image size 297–8shadows 307texture gradients 300, 300–2
Monosodium glutamate (MSG) 49Motion after-effect (MAE) 331, 331–2Motion-based segmentation 278Motion blur 181Motion detectors 329, 329–31, 352–3Motion parallax 305–7, 307Motion perception 327–57, 350
aliasing 330, 330–1biological motion 340, 340–2classical apparent motion displays
344–5detecting movement 328–36, 350first- vs. second-order motion 345,
345–8human visual system 331–3integration of responses 336–42, 350multiple processes 342–9, 350neural motion detectors 329, 329–31object motion and observer motion
333–4optic flow 334planar surfaces 336–9random-dot kinematograms (RDK)
342, 342–5real vs. apparent movement 334–6
rigid 3-D objects 339–40short- vs. long-range distinction
342–5spatiotemporal approaches 351–7two-process theory 344–5
Motion sickness 81, 86–9MRI (magnetic resonance imaging)
10, 414 see also fMRI (functionalMRI) scans
MSG (monosodium glutamate) 49Muller, Johannes 16Müller-Lyer illusion 408, 409Multisensory processing 383–97,
390–1attentional control 391–7cortical architecture 383detection 384–5evidence 384–6identification 385localization 386mechanisms 386–7synesthesia 388–90, 391
Music perception 153–7consonance 156and evolution 157functional significance 156–7and language 157loudness 155melody 156pitch 155, 411rhythm 156timbre 155, 411tone 155
Musicians 411–12Myelin 404Myopia 172, 172–3, 418–19Myotatic reflex 65
Near disparity 311Neural blur 210Neural impulses 12, 12–13Neuron Doctrine 40, 41Neurophysiological approach 40–1Neuropsychology 146, 275, 397Neurotransmitters 13Newton, Isaac 34–5, 160, 190Noise 17Nonlinear filter 99, 263Normal distribution 28Nyquist Limit 176Nystagmus 81, 180
Object-based attention 395Object motion and observer motion
333–4Object recognition 71–2 see also
shape and object perceptionObject representation 283–9, 290–1
image-based vs. symbolicprocessing 288
multiple systems? 288–9view-dependent theories 284,
286–7view-independent theories 284,
284–6Oblique effect 410Occam’s Razor 34Ocular dominance 219, 220Ocular dominance columns 221,
221–2Oculogravic illusion 82, 87–9Oculogyral illusion 82, 87–8Odd functions 120Ohm’s law 132Olfactory bulb 45Olfactory epithelium 44, 45Olfactory glomeruli 45Olfactory receptor neurons 44, 45Opponency theory 210, 360Opsin 199Optic chiasm 213Optic flow 306, 334Optic flow field 37Optic nerve 211Optical power 171–2Optical transfer functions (OTF) 242Optics 184–91
Airy disk 186–7, 187chromatic aberration 177, 189–90lens equations 190–1lenses 160, 171–3, 184refraction 159, 159–60, 165–6,
185–6spherical aberration 177, 188–9
Optokinetic nystagmus 180Ordinal depth cues 297Organ of Corti 106, 106–7Organization 15–16, 68–9Orientation columns 221, 221–2Orientation tuning 217–19Ossicles 102, 150, 151OTF (optical transfer functions) 242Oto-acoustic emissions 109Otoconia 76Otolith organs 74, 76–8Otolithic membrane 76Otosclerosis 150Outer ear 101, 102Outer hair cells 106, 108–9, 151Oval window 102
Pacinian corpuscles 63, 65Pain 69, 70–1PAN (postural alcohol nystagmus)
81–2Parasol ganglion cells 203, 203–8,
215Parsing 281, 349Partial decussation 213Parvo layers 213, 213–14
Mather2008-SubjectIndex.qxp 10/16/08 9:38 PM Page 453

Copyright © 2009 George Mather – http://www.psypress.com/mather
454 Subject index
Pattern theory 138Peaks 260Perceptual color space 360Perceptual principles 17–20, 26Perfect pitch 411Perilymph 104PET (positron emission tomography)
58, 146, 388Phantom limbs 84–6, 86Phase 94, 123, 240Phase locking 109–11, 110Phase spectrum 96Phenomenology 39–40Phoneme boundaries 144, 145Phoneme discrimination 410Phoneme restoration effect 147Phonemes 143Phons 130Photoelectric effect 162–3Photoisomerization 199–200Photometric system 192–5Photometric units 166, 191Photometry 166Photon absorption 199Photon noise 177, 178Photons 163Photopic vision 193, 237, 237–9Photoreceptors 13, 198
length 174photon absorption 199responses 199–200, 202rods and cones 174, 178–9,
198–200, 202, 204spacing 175width 174
Photorefractive keratectomy 173Physiological principles 12–17,
25–6, 55Pictorial competence 407, 407–8Pigments 365Pineal gland 212Pinna 102Pitch 132
musical pitch 155, 411Pitch perception 132–9, 153
autocorrelation theory 138complex tones 137–8frequency discrimination 135frequency selectivity 132–5pattern recognition theory 138place theory 136pure tones 136–7temporal theory 137–8theories 136–8timing theory 136
Place code 110, 111Place theory 136Plaid patterns 338, 339Planck, Max 162, 163Plasticity 16–17
Ponzo illusion 409Population coding 22Positron emission tomography (PET)
58, 146, 388Postural alcohol nystagmus (PAN)
81–2Power laws 302Precedence effect 142Preferential attention 417Pregeniculate 212Presbyacusis 152, 402Presbyopia 172, 401Pretectum 212Primal sketch 260, 275, 278Primary auditory cortex 116, 116–17Primary olfactory cortex 45Primitives 278, 278–9Prism stereoscope 322–3Processing stream 226, 227Proprioception 61, 63–4, 65Proprioceptors 63Prosopagnosia 3Protanomaly 374Protanopia 375Proximity 277Pseudo-isochromatic plates 376Psychometric functions 18, 27–8Psychophysics 4, 10–11, 26–33Pupil 170, 173Pupillary miosis 401Purkinje shift 238–9
Qualia 18Quantum mechanics 163Quantum/quanta 162
Radiance 192Radiant energy 191–2Radiant flux 191Radiant intensity 192Radiometric system 191–2Radiometric units 166, 191Radiometry 166Random-dot kinematograms (RDK)
342, 342–5Random-dot stereograms (RDS) 312,
312–14Rarefactions 91, 92Receptive field responses 204–10,
232–3Receptive fields 15, 65, 67, 68, 215,
220, 231–2Receptor cells 4Reflectance 167, 167–8, 169Reflection 160, 164Refraction 159, 159–60, 165–6,
185–6Refractive index 165Reichardt detectors 329Rembrandt 420
Representation 20, 20–2, 23, 56analog representations 21, 21–2, 24in the brain 22symbolic representations 21, 21–2,
23–4Residue pitch 138Response latency 224Retina 197, 198–211, 228
fovea 174ganglion cell layer 198, 203–11inner nuclear layer 198, 201–3outer nuclear layer 198–200
Retinal illumination 194–5Retinal image size 297–8Retinal motion signals 333–4Retrocochlear dysfunction 152Rhodopsins 199Rhythm 156Rod bipolars 202Rods 174, 178–9, 198–200, 202, 204Ruffini’s corpuscles 63, 65
Saccades 180, 181Saccadic suppression 333Saccule 74, 76Sander Parallelogram 408, 409Saturation 360Scala tympani 103, 104Scala vestibuli 103, 104Scene perception 289–90, 291Scotomas 275Scotopic vision 193, 237, 237–9SDT (signal detection theory) 30–3,
31, 384Second-order motion detectors 347–8Second-order motion displays 345,
345–8, 356–7Second-order schemes 263Selectivity 14–15, 392Semicircular canals 74, 77, 78Senescence 401, 404Senile cataract 401Sensation 17–18Senses: classification 4–5, 25Sensorineural hearing loss 149, 151–2Sensory magnitude 18–19Sensory principles 55Sensory space 14–15Sex differences 404–6, 416Shadows 307, 349Shape and object perception 275–95,
290–1Bayesian models 286, 291–5object representation 283–9, 290–1scene perception 289–90, 291shape representation 276–83, 290three-stage model 275–6
Shape constancy 412–13, 413Shape representation 276–83, 290
contour integration 279–81
Mather2008-SubjectIndex.qxp 10/16/08 9:38 PM Page 454

Copyright © 2009 George Mather – http://www.psypress.com/mather
Subject index 455
crowding 282–3Gestalt laws 276–7shape segmentation processes
278–9surface parsing 281–2
Shape segmentation processes 278–9Sighting 412Signal detection theory (SDT) 30–3,
31, 384Signal processing 23Similarity 277, 315Simple cells 217, 217–18, 219Sine waves 92, 93, 94Single-unit recordings 7–9, 14–15,
40–1, 396Sinusoidal gratings 240Size after-effecct 253Smell 4, 43–8, 56
adaptation 47–8anatomy and physiology 43–5anosmia 48cortical processing 45detection 46and emotion 57–8perception 46–8receptors 44–5recognition 46–7, 400, 402, 405,
413sensory pathways 44, 45
Somatosensory system 4, 61–72, 83–4cortical representation 65–9, 414detection 69discrimination 69–70, 400, 403, 405object recognition 71–2pain 69, 70–1pathways 64–5perception 69–72phantom limbs 84–6, 86physiology 62–9receptors 62–4sensation 70texture perception 71
Sone 131Sound 91–100, 118
amplitude 93, 93–4complex sounds 94–100filters 97–8Fourier theory 96–100frequency 92linearity 99–100phase 94simple sounds 91–4spectrograms 96–7, 97, 143transfer functions 98, 98–9
Sound pressure level (SPL) 93Space constants 231Space motion sickness 89Space–time plots 245–6
apparent motion 355–6motion detectors 352–3
second-order motion 356–7Spatial ability 405–6, 415Spatial contrast sensitivity 239–43,
241, 415contrast sensitivity 241contrast thresholds for gratings 240–1luminance gratings 239, 239–40neural responses 242–3optical limitations 242
Spatial contrast threshold 241Spatial filtering 209–10, 250–1,
265–6edge localization 256–61psychophysical evidence 252–6stereo and motion 264texture analysis 262–4in the visual system 251–2
Spatial frequency 240Fourier theory 250, 269–70, 271and spatial scale 250–2
Spatial opponency 205, 206–8Spatial scale 249
and spatial frequency 250–2Spatial vision 237–73, 265–6
Fourier analysis 250–2, 266–73fundamental functions 237–49, 265photopic and scotopic vision 193,
237, 237–9representation at multiple spatial
scales 249–56, 265spatial contrast sensitivity 239–43,
241, 415spatiotemporal sensitivity 245,
245–9temporal contrast sensitivity 243,
243–5uses of spatial filters 256–64,
265–6Spatiotemporal approaches to motion
processing 351–7apparent motion 355–6motion as spatiotemporal orientation
351–2motion detectors 352–3second-order motion 356–7space–time plots 352–3, 354, 355–7velocity coding 353–5
Spatiotemporal contrast sensitivity245, 245–9
parallel pathways 248–9receptive field organization 247–8sensitivity 246–7stimuli 245–6
Spatiotemporal CSF 247Spatiotemporal images 270–2Specific nerve energy 16, 17Spectral luminous efficiency
functions 193Spectral opponency 206, 206–8, 360Spectral reflectance function 169
Spectrograms 96–7, 97, 143Specular reflection 164Speech mode 144, 144–7Speech perception 143–7, 154
physiological specialization 145–7production of speech sounds 143qualitative differences in processing
144–5speech mode 144, 144–7spoken word recognition 147
Speech sounds 143Spherical aberration 177, 188–9Spinothalamic pathway 64, 64–5SPL (sound pressure level) 93Squint 314, 420Staining 15Stapes (stirrup) 102Statocyst 77Steradians 192Stereo vision (stereopsis) 318–25
epipolarity 320horizontal disparity 318–20and motion 264psychophysics in RDS stimuli
313–14stereograms 312, 321–4stereoscopes 321–4vertical disparity 324–5
Stereoblindness 314, 420Stereocilia 72, 72–4, 107Stereograms 312, 321–4Stereoscopes 321–4Stevens’s power law 19Stiles-Crawford effect 195, 199Strabismus 314, 420Striate cortex 216, 216–23
anatomical connections 216–17cell properties 217–20connections to extrastriate
cortex 217functional architecture 220–3
Stripes 225Stroboscopic apparent movement 334,
334–5Structural description 284Structuralism 35Study methods 5–12, 25Subtractive color mixture 361, 361–2Subtractive primaries 361Superadditive responses 386Superior colliculi 211–12Superior olive 112Suprachiasmatic nuclei 212Suprathreshold measurements 253, 255Surface parsing 281–2, 349Sustained channel 248Sustained temporal response 208Symbolic contour integration 281Symbolic representation 21,
21–2, 23–4
Mather2008-SubjectIndex.qxp 10/16/08 9:38 PM Page 455

Copyright © 2009 George Mather – http://www.psypress.com/mather
456 Subject index
Symbolic segmentation 278–9Synapses 13Synesthesia 388–90, 391
Taste 4, 48–55, 57adaptation 53anatomy and physiology 48–52buds 48–9, 49coding theories 53–4conditioned aversion 54–5cortical processing 52dimensions 52–3perception 52–5receptors 48–9, 49, 51sensory pathways 50, 51
Taste primaries theory 53, 54Taste tetrahedron 52, 52–3td (troland units) 194, 194–5Tectorial membrane 106, 108Temporal contrast sensitivity 243,
243–5Temporal contrast sensitivity function
244, 244–5Temporal filtering 210–11Temporal frequency 243Temporal theory 137–8Terminal buttons 13Texture analysis 262–4
feature extraction 263nonlinear transform 263psychophysical evidence 264spatial filtering 263
Texture-based segmentation 278Texture gradients 300, 300–2Texture perception 71Thalamus 14Theoretical approaches to perception
33–41Theoretical principles 20–4, 26, 56Threshold elevation 253, 331–2Threshold measurements 253Thresholds 27–8Tilt after-effect 253Timbre 155, 411Timing theory 136Tinnitus 152Tone
complex tones 137–8musical tone 155pure tones 136–7
Tonotopic organization 110, 114,116–17, 117
Topographic maps 7, 15–16Touch see somatosensory systemTouch receptors 62, 62–3
Transduction 4, 12–13Transfer functions 98, 98–9Transformational apparent
motion 349Transient channel 248Transient temporal response 208Traveling waves 104, 105Trichromacy theory 363, 366, 366–8,
378–81anomalous trichromacy 374–5, 376evolutionary genetics 380–1spatial resolving power 379–80visual ecology 380
Tritanopia 375Troland units (td) 194, 194–5Turing, Alan 11, 23, 38Two-tone suppression 112Tympanic membrane 102, 150, 151
Umami 49, 51, 53Unconscious conclusions 36Univariance 200, 201Utricle 74, 76
Vection 82–3, 83Velocity coding 353–5Velocity effects 87–9Velocity space model 337, 339Ventral brain regions 71Ventral stream 226, 227Vergence 180, 308–9Vergence angle 308, 308–9Vernier acuity 256, 257Vertical disparity 312, 324–5Vertical–Horizontal illusion 408, 409Vertigo 81–2Vestibular nuclei 78Vestibular system 4, 72–83, 84
labyrinth 72, 74–8motion sickness 81, 86–9organs 72, 73, 74pathways 78–80perception 81–3physiology 72–80receptors 72, 72–4
Vestibulo-cerebellar system 78–9Vestibulo-ocular reflex 79, 79–80Vestibulo-ocular system 79–80Vestibulo-spinal system 79Vestibulo-thalamic system 79View-dependent representation 284,
286–7View-independent representation 284,
284–6Virtual reality simulators 384
Vision 4artists 412, 418–20color vision 359–81, 377–8depth perception 297–325, 317–18infants 417–18motion perception 327–57, 350physiology 15–16, 197–235, 228–9pictorial competence 407, 407–8practice 413shape and object perception
275–95, 290–1spatial vision 237–73, 265–6see also eye; eye movements; light;
opticsVisual acuity 172, 393–4, 399–401Visual angle 171Visual artists 412, 418–20Visual cortex 198, 215–28, 229, 403
extrastriate cortex 216, 223–8striate cortex 216, 216–23
Visual pathway 197, 211–15, 228destinations of optic nerve fibers
211–12geniculostriate pathway 211,
212–15Visual physiology 15–16, 197–235,
228–9importance of 229–30modeling cell responses 230–5retina 197, 198–211, 228visual cortex 198, 215–28, 229, 403visual pathway 197, 211–15, 228
Visual routines 387, 389Visual stimuli 230–1Visual texture 262Visual vector analysis 341Vitreous humor 170
Wavelength 168–9, 220, 359Waves
light 160–2, 163sound 91–6, 104–5
Wernicke’s aphasia 146, 147Wernicke’s area 146–7, 147, 389“What” processing 113–14, 117, 227“Where” processing 114–16, 117, 227White matter 404Word recognition 147
Yes/no tasks 31, 31–2Young, Thomas 160–1, 187, 366,
367, 368
Zero-crossing model 260Zoetrope 334–5
Mather2008-SubjectIndex.qxp 10/16/08 9:38 PM Page 456