Foundations - Xchanging · Foundations Foundations for ... Financial review 36 Corporate social...
148
Foundations for growth Annual report 2012
Transcript of Foundations - Xchanging · Foundations Foundations for ... Financial review 36 Corporate social...
Xchanging34 Leadenhall StreetLondonEC3A 1AXUK
T: +44 20 7780 6999F: +44 20 7780 6998
Registered in England and Wales company number 5819018
Foundations for growth
Fou
nd
ation
s for grow
th Xch
ang
ing A
nn
ual rep
ort 2012
Annual report 2012

01
Xchanging is a technology-enabled provider of business processing, technology and procurement services internationally to customers across many industry sectors. We are a truly international outsourcing specialist.
More online: www.xchanging.com
01 Xchanging plcAnnual report 2012
Company overview Corporate description IFC
Highlights of 2012 01
Chairman’s statement 02
Xchanging at a glance 04
Our business model 06
Key performance indicators 08
Xchanging’s four key strengths 10
Our year in review 12
Market review 14
Business review Chief Executive Officer’s report 16Principal risks and uncertainties 24Business review 28Financial review 36Corporate social responsibility 44
Corporate governance Board of Directors 46Executive Board 48Directors’ report 50Corporate governance report 53Remuneration report 61
Financial statements Independent auditors’ report (Group) 70Consolidated income statement 71Consolidated statement of comprehensive income 72Consolidated cash flow statement 73Reconciliation of net cash flow to movement in net cash 74Movement in net cash 74Consolidated balance sheet 75Consolidated statement of changes in equity 76Notes to the consolidated financial statements 78Independent auditors’ report (Company) 134Company balance sheet 135Company cash flow statement and reconciliation 136Notes to the Company financial statements 137
Other information Shareholder information 141Glossary of terms 142
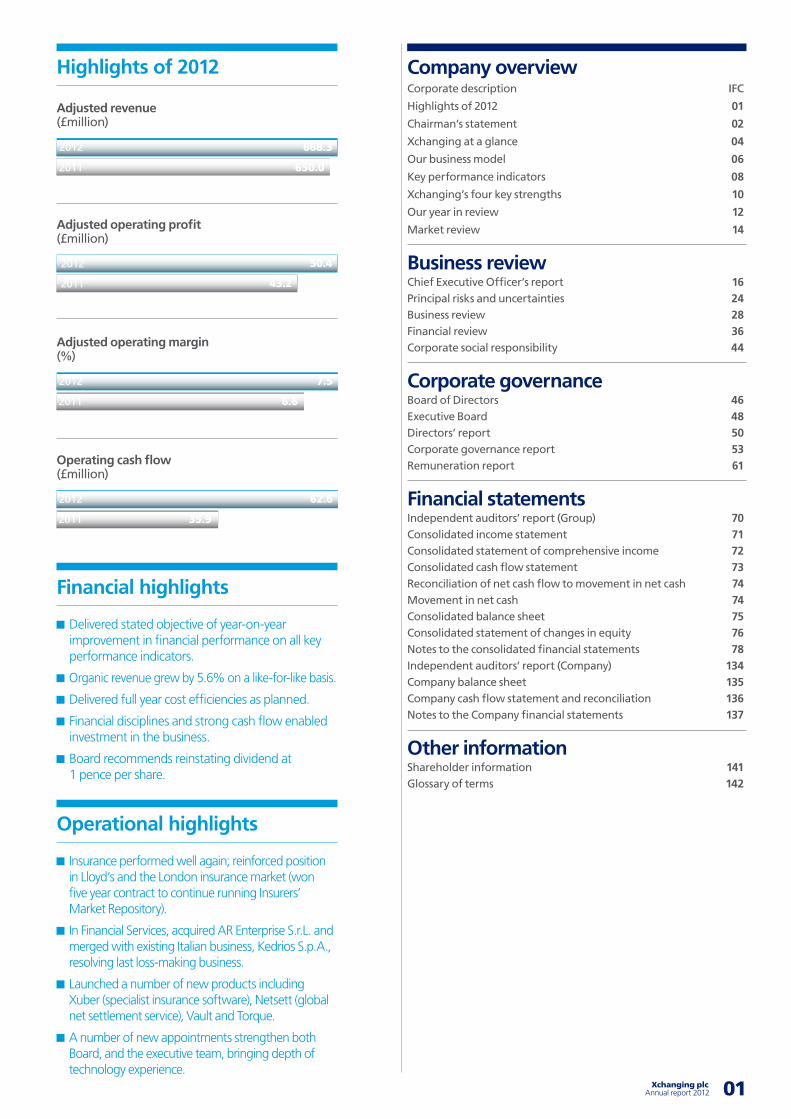
Adjusted revenue (£million)
Adjusted revenue (£million)
668.3
650.0
2012
2011
Adjusted operating profit (£million)
Adjusted revenue (£million)
50.4
43.2
2012
2011
Adjusted operating margin (%)
Adjusted revenue (£million)
7.5
6.6
2012
2011
Operating cash flow (£million)
Adjusted revenue (£million)
62.6
35.9
2012
2011
Highlights of 2012
Financial highlights
Delivered stated objective of year-on-year improvement in financial performance on all key performance indicators.
Organic revenue grew by 5.6% on a like-for-like basis.
Delivered full year cost efficiencies as planned.
Financial disciplines and strong cash flow enabled investment in the business.
Board recommends reinstating dividend at 1 pence per share.
Operational highlights
Insurance performed well again; reinforced position in Lloyd’s and the London insurance market (won five year contract to continue running Insurers’ Market Repository).
In Financial Services, acquired AR Enterprise S.r.L. and merged with existing Italian business, Kedrios S.p.A., resolving last loss-making business.
Launched a number of new products including Xuber (specialist insurance software), Netsett (global net settlement service), Vault and Torque.
A number of new appointments strengthen both Board, and the executive team, bringing depth of technology experience.

03
Chairman’s statement
Technology-enablement and constant innovation, not just cost effectiveness, are vital if we are to win business and ensure that customer satisfaction remains high.
02 Xchanging plc Annual report 2012
wo years ago, in 2011, we evaluated Xchanging’s portfolio of businesses in order to understand intrinsic value, identify underperforming assets
and assess how best to redefine our strategy. We also recognised that significant work had to be done to regain the confidence and trust of some of our customers.
Our aim was to re-energise the business and unlock value for shareholders in a company whose business model and strategy had not kept pace with market developments and which, frankly, in some instances, had lost touch with its customers. The business was also too complex for its size. Last year we were able to report good progress implementing the outcome of that assessment.
This year we pressed on with the next stage of our turnaround plan, continuing the reshaping of our business portfolio, putting the foundations for sustainable growth and value creation in place and, most importantly, listening and responding to our customers.
The sound financial performance for the year and the steadily growing flow of new business wins in the second half indicates that we are moving in the right direction.
Strategic progressOur turnaround process is well under way. The optimisation of our business assets sees Xchanging in much better shape. Many of the issues we faced have been dealt with, and this year, most notably, we have resolved the strategic future of our Italian business. However, more still needs to be done.
Our strategic planning is fundamentally driven by the fact that we must increase the value of our offerings and improve their propensity to become embedded in our customers’ processes. Technology-enablement and constant innovation, not just cost effectiveness, are vital if we are to win business and ensure that customer satisfaction remains high.
T
03 Xchanging plcAnnual report 2012
Company overview
01-15
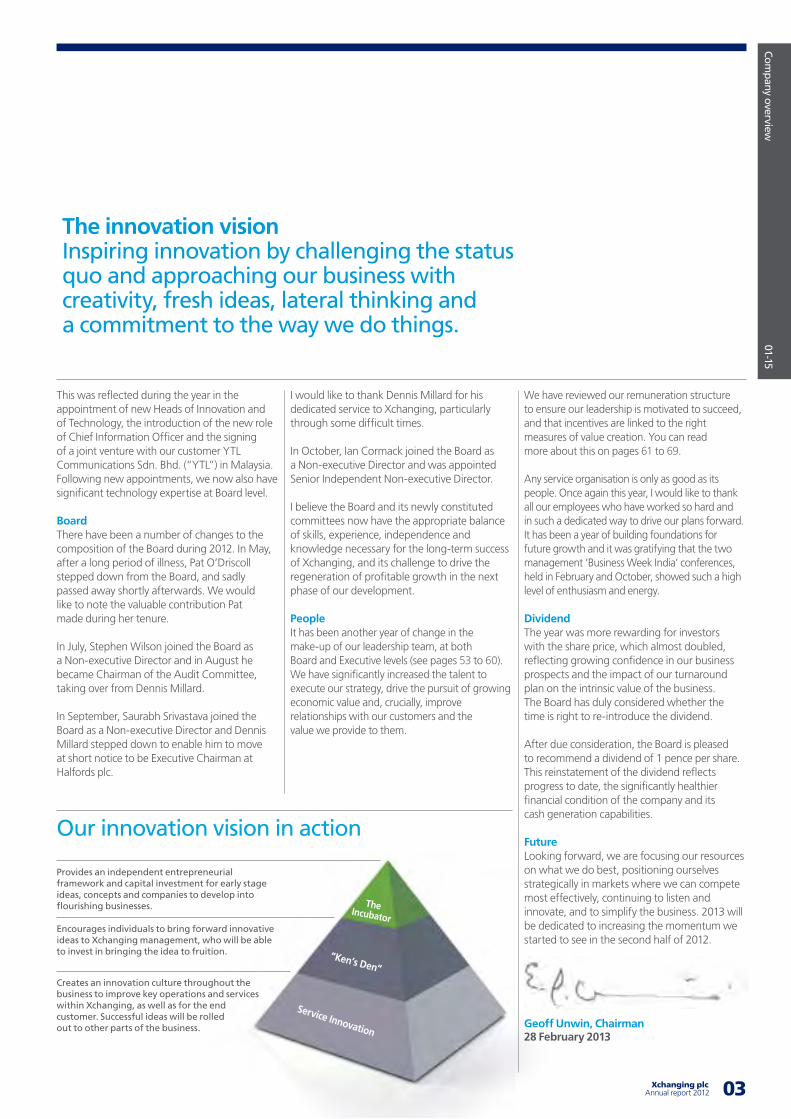
The innovation vision Inspiring innovation by challenging the status quo and approaching our business with creativity, fresh ideas, lateral thinking and a commitment to the way we do things.
This was reflected during the year in the appointment of new Heads of Innovation and of Technology, the introduction of the new role of Chief Information Officer and the signing of a joint venture with our customer YTL Communications Sdn. Bhd. (“YTL”) in Malaysia. Following new appointments, we now also have significant technology expertise at Board level.
BoardThere have been a number of changes to the composition of the Board during 2012. In May, after a long period of illness, Pat O’Driscoll stepped down from the Board, and sadly passed away shortly afterwards. We would like to note the valuable contribution Pat made during her tenure.
In July, Stephen Wilson joined the Board as a Non-executive Director and in August he became Chairman of the Audit Committee, taking over from Dennis Millard.
In September, Saurabh Srivastava joined the Board as a Non-executive Director and Dennis Millard stepped down to enable him to move at short notice to be Executive Chairman at Halfords plc.
I would like to thank Dennis Millard for his dedicated service to Xchanging, particularly through some difficult times.
In October, Ian Cormack joined the Board as a Non-executive Director and was appointed Senior Independent Non-executive Director.
I believe the Board and its newly constituted committees now have the appropriate balance of skills, experience, independence and knowledge necessary for the long-term success of Xchanging, and its challenge to drive the regeneration of profitable growth in the next phase of our development.
PeopleIt has been another year of change in the make-up of our leadership team, at both Board and Executive levels (see pages 53 to 60). We have significantly increased the talent to execute our strategy, drive the pursuit of growing economic value and, crucially, improve relationships with our customers and the value we provide to them.
We have reviewed our remuneration structure to ensure our leadership is motivated to succeed, and that incentives are linked to the right measures of value creation. You can read more about this on pages 61 to 69.
Any service organisation is only as good as its people. Once again this year, I would like to thank all our employees who have worked so hard and in such a dedicated way to drive our plans forward. It has been a year of building foundations for future growth and it was gratifying that the two management ‘Business Week India’ conferences, held in February and October, showed such a high level of enthusiasm and energy.
DividendThe year was more rewarding for investors with the share price, which almost doubled, reflecting growing confidence in our business prospects and the impact of our turnaround plan on the intrinsic value of the business. The Board has duly considered whether the time is right to re-introduce the dividend.
After due consideration, the Board is pleased to recommend a dividend of 1 pence per share. This reinstatement of the dividend reflects progress to date, the significantly healthier financial condition of the company and its cash generation capabilities.
FutureLooking forward, we are focusing our resources on what we do best, positioning ourselves strategically in markets where we can compete most effectively, continuing to listen and innovate, and to simplify the business. 2013 will be dedicated to increasing the momentum we started to see in the second half of 2012.
Geoff Unwin, Chairman 28 February 2013
Our innovation vision in action
Encourages individuals to bring forward innovative ideas to Xchanging management, who will be able to invest in bringing the idea to fruition.
Provides an independent entrepreneurial framework and capital investment for early stage ideas, concepts and companies to develop into flourishing businesses.
Creates an innovation culture throughout the business to improve key operations and services within Xchanging, as well as for the end customer. Successful ideas will be rolled out to other parts of the business.
“Ken’s Den”
The Incubator
Service Innovation
04 Xchanging plc Annual report 2012 05
Xchanging at a glance
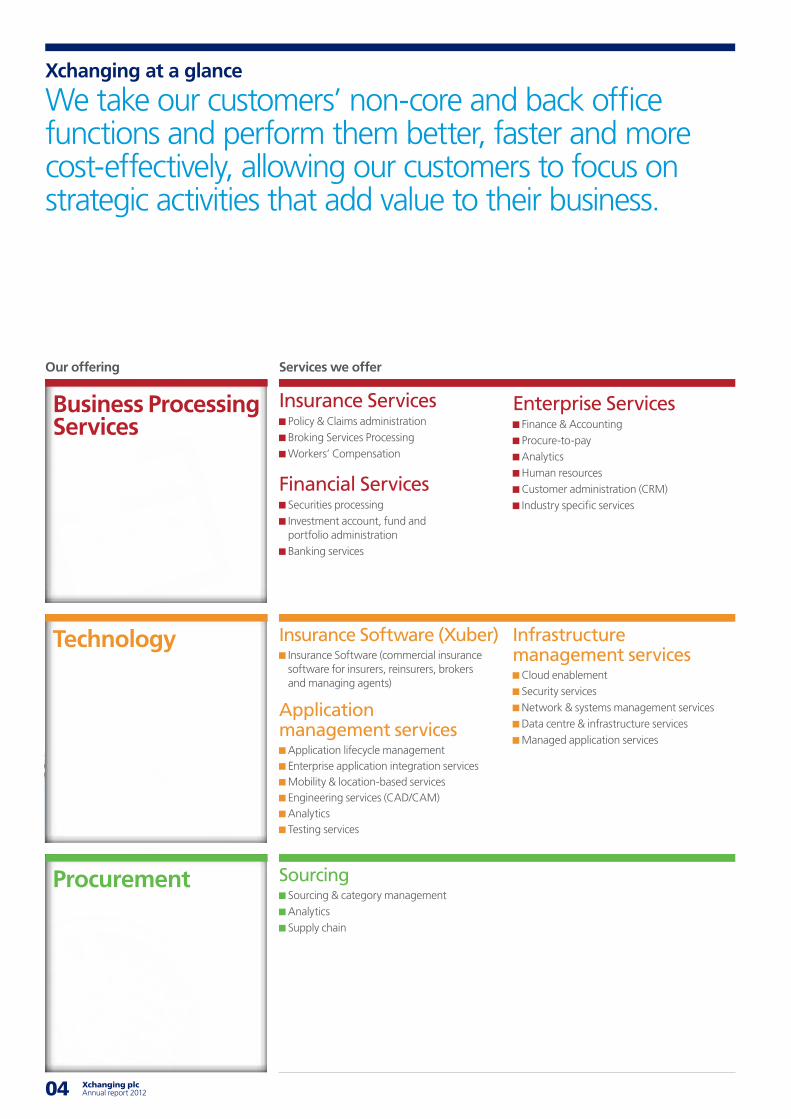
We take our customers’ non-core and back office functions and perform them better, faster and more cost-effectively, allowing our customers to focus on strategic activities that add value to their business.
Services we offer
Insurance Services Policy & Claims administration Broking Services Processing Workers’ Compensation
Financial Services Securities processing Investment account, fund and portfolio administration Banking services
Enterprise Services Finance & Accounting Procure-to-pay Analytics Human resources Customer administration (CRM) Industry specific services
Insurance Software (Xuber) Insurance Software (commercial insurance software for insurers, reinsurers, brokers and managing agents)
Application management services
Application lifecycle management Enterprise application integration services Mobility & location-based services Engineering services (CAD/CAM) Analytics Testing services
Infrastructure management services
Cloud enablement Security services Network & systems management services Data centre & infrastructure services Managed application services
Sourcing Sourcing & category management Analytics Supply chain
Our offering
Business Processing Services
Technology
Procurement
05 Xchanging plcAnnual report 2012
Company overview
01-15
We have particular expertise in complex and critical business processing services. We have unique domain knowledge in insurance where we process policies and premiums as well as handling claims. We are also specialists in financial services where we handle securities processing, investment account and fund administration. We hold a strong position in the London insurance market where there are currently no other providers and no comparable offerings within this market.
In 2012, Xchanging launched Netsett, a global net settlement solution to handle the cash flow between brokers, cedents and carriers efficiently, including effective management across borders and currencies.
We provide technology support that is often critical to the functioning of a customer’s business. Xchanging has a strong track record in integrating business critical systems.
In 2012, Xchanging’s technology, delivery expertise and international domain knowledge were utilised when we formed a joint venture with YTL: Xchanging Malaysia Sdn. Bhd.. This initiative was focused on developing and delivering enhanced mobile internet and cloud-based hosting offerings in Malaysia. This year, Xchanging re-launched Xuber, our software for the insurance industry, the culmination of a £20 million+ investment. Xuber is the only single platform solution with global capability available today. Our offering boasts unparalleled configurability and flexibility with unrivalled expertise in the market.
By leveraging our supplier relationships and applying our trading experience and buying power, we are able to drive savings to our customers’ bottom lines and improve visibility and control over spend. Xchanging offers a Gainshare Procurement model: an innovative commercial model that enables Xchanging to share the risks and reward with the customer. Value is realised through any savings generated from sourcing of indirect goods and services at a lower cost compared to the customer’s own sourcing costs. These savings are shared with the customer.
In 2012, Xchanging developed Vault: an innovative custom-built technology platform. Vault has the ability to measure, track and report realised savings helping to ensure planned savings are delivered.
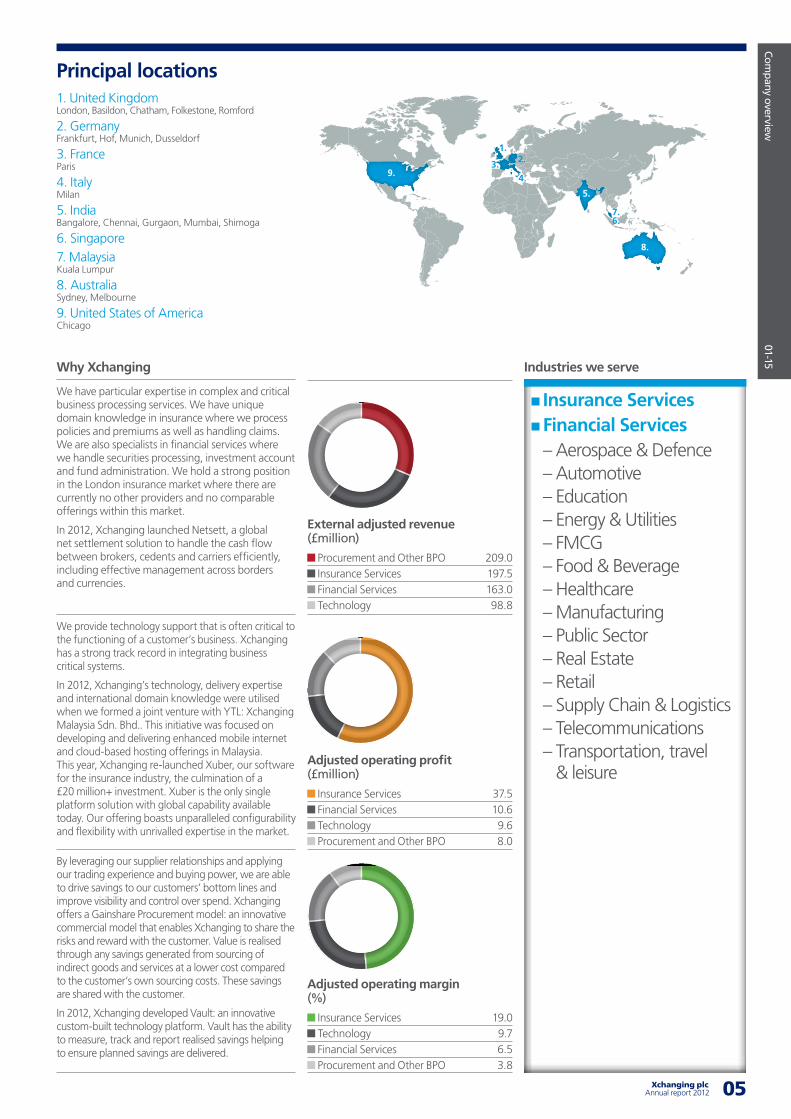
Principal locations
Industries we serveWhy Xchanging
External adjusted revenue (£million)
Procurement and Other BPO 209.0 Insurance Services 197.5 Financial Services 163.0 Technology 98.8
Adjusted operating profit (£million)
Insurance Services 37.5 Financial Services 10.6 Technology 9.6 Procurement and Other BPO 8.0
Adjusted operating margin (%)
Insurance Services 19.0 Technology 9.7 Financial Services 6.5 Procurement and Other BPO 3.8
1. United KingdomLondon, Basildon, Chatham, Folkestone, Romford
2. GermanyFrankfurt, Hof, Munich, Dusseldorf
3. FranceParis
4. ItalyMilan
5. IndiaBangalore, Chennai, Gurgaon, Mumbai, Shimoga
6. Singapore7. MalaysiaKuala Lumpur
8. AustraliaSydney, Melbourne
9. United States of AmericaChicago
Insurance Services Financial Services
– Aerospace & Defence – Automotive – Education – Energy & Utilities – FMCG – Food & Beverage – Healthcare – Manufacturing – Public Sector – Real Estate – Retail – Supply Chain & Logistics – Telecommunications – Transportation, travel
& leisure
9.
8.
5.
1.
3.
7.6.
2.
4.
06 Xchanging plc Annual report 2012 07
Our business model
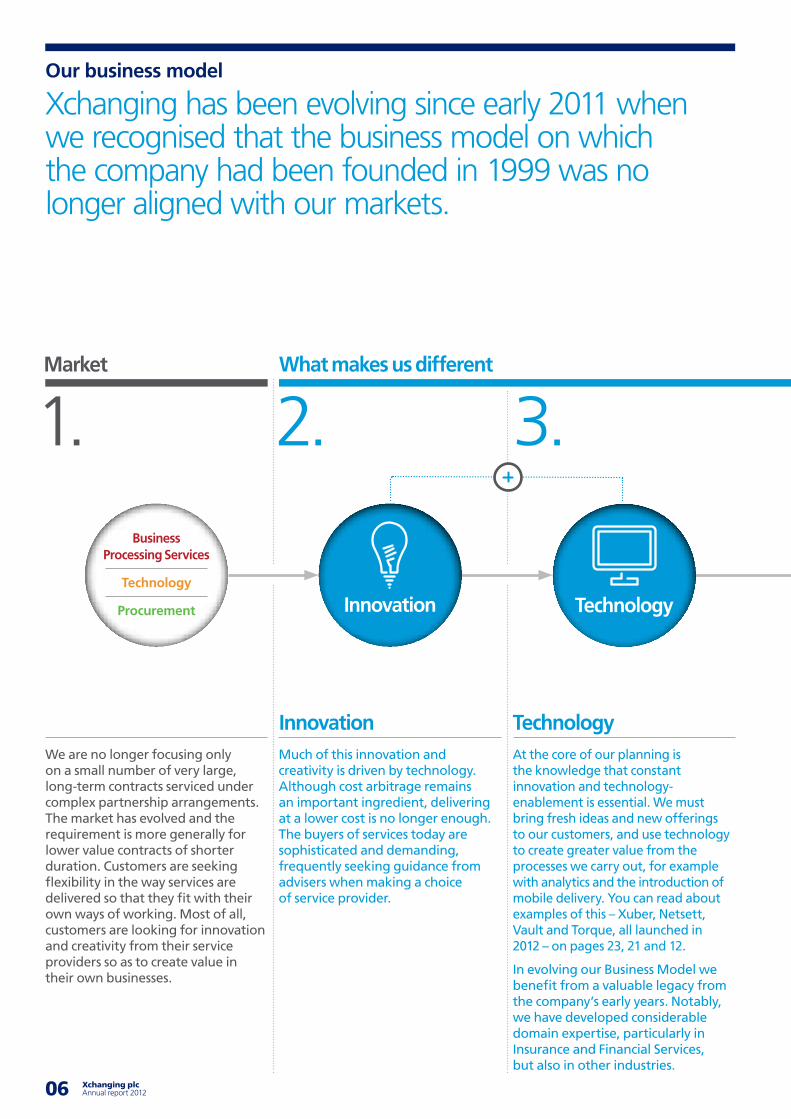
Xchanging has been evolving since early 2011 when we recognised that the business model on which the company had been founded in 1999 was no longer aligned with our markets.
We are no longer focusing only on a small number of very large, long-term contracts serviced under complex partnership arrangements. The market has evolved and the requirement is more generally for lower value contracts of shorter duration. Customers are seeking flexibility in the way services are delivered so that they fit with their own ways of working. Most of all, customers are looking for innovation and creativity from their service providers so as to create value in their own businesses.
Much of this innovation and creativity is driven by technology. Although cost arbitrage remains an important ingredient, delivering at a lower cost is no longer enough. The buyers of services today are sophisticated and demanding, frequently seeking guidance from advisers when making a choice of service provider.
At the core of our planning is the knowledge that constant innovation and technology-enablement is essential. We must bring fresh ideas and new offerings to our customers, and use technology to create greater value from the processes we carry out, for example with analytics and the introduction of mobile delivery. You can read about examples of this – Xuber, Netsett, Vault and Torque, all launched in 2012 – on pages 23, 21 and 12.
In evolving our Business Model we benefit from a valuable legacy from the company’s early years. Notably, we have developed considerable domain expertise, particularly in Insurance and Financial Services, but also in other industries.
What makes us different
Innovation Technology
Market
Business Processing Services
Technology
Procurement Innovation Technology
1. 2. 3.
07 Xchanging plcAnnual report 2012
Company overview
01-15
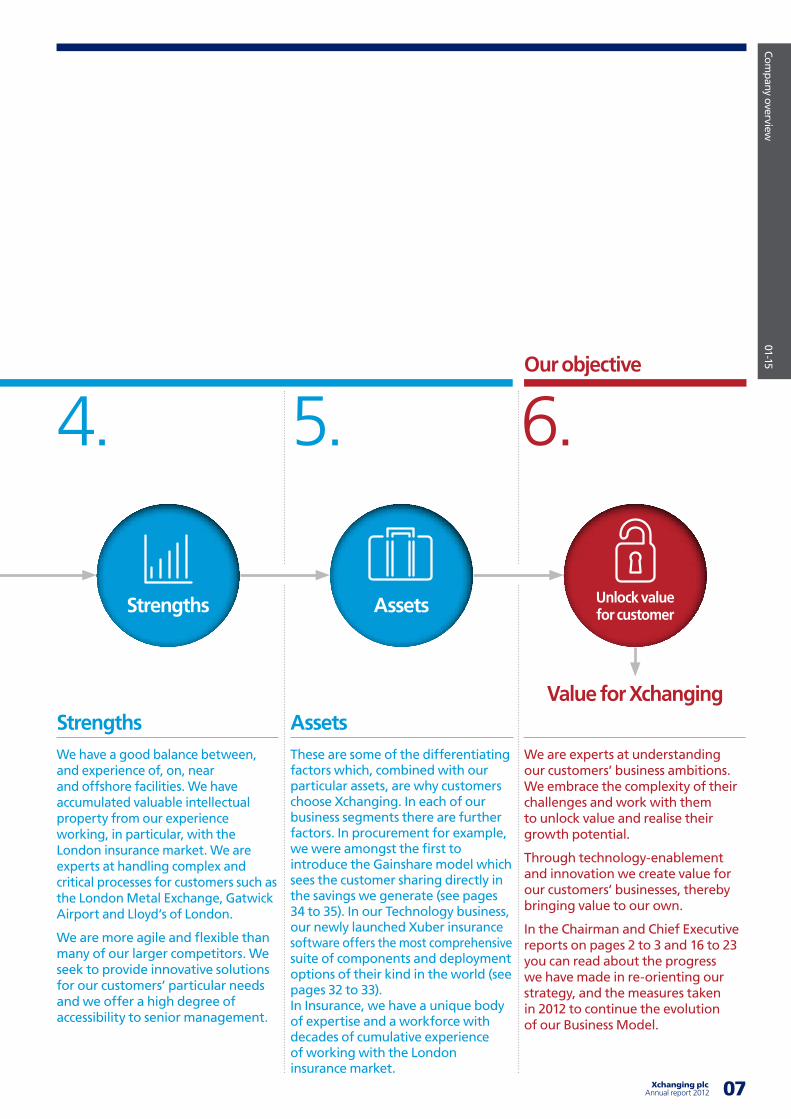
We have a good balance between, and experience of, on, near and offshore facilities. We have accumulated valuable intellectual property from our experience working, in particular, with the London insurance market. We are experts at handling complex and critical processes for customers such as the London Metal Exchange, Gatwick Airport and Lloyd’s of London.
We are more agile and flexible than many of our larger competitors. We seek to provide innovative solutions for our customers’ particular needs and we offer a high degree of accessibility to senior management.
These are some of the differentiating factors which, combined with our particular assets, are why customers choose Xchanging. In each of our business segments there are further factors. In procurement for example, we were amongst the first to introduce the Gainshare model which sees the customer sharing directly in the savings we generate (see pages 34 to 35). In our Technology business, our newly launched Xuber insurance software offers the most comprehensive suite of components and deployment options of their kind in the world (see pages 32 to 33). In Insurance, we have a unique body of expertise and a workforce with decades of cumulative experience of working with the London insurance market.
We are experts at understanding our customers’ business ambitions. We embrace the complexity of their challenges and work with them to unlock value and realise their growth potential.
Through technology-enablement and innovation we create value for our customers’ businesses, thereby bringing value to our own.
In the Chairman and Chief Executive reports on pages 2 to 3 and 16 to 23 you can read about the progress we have made in re-orienting our strategy, and the measures taken in 2012 to continue the evolution of our Business Model.
Strengths Assets
Our objective
Value for Xchanging
Strengths Assets Unlock value for customer
4. 5. 6.
08 Xchanging plc Annual report 2012 09
Key performance indicators
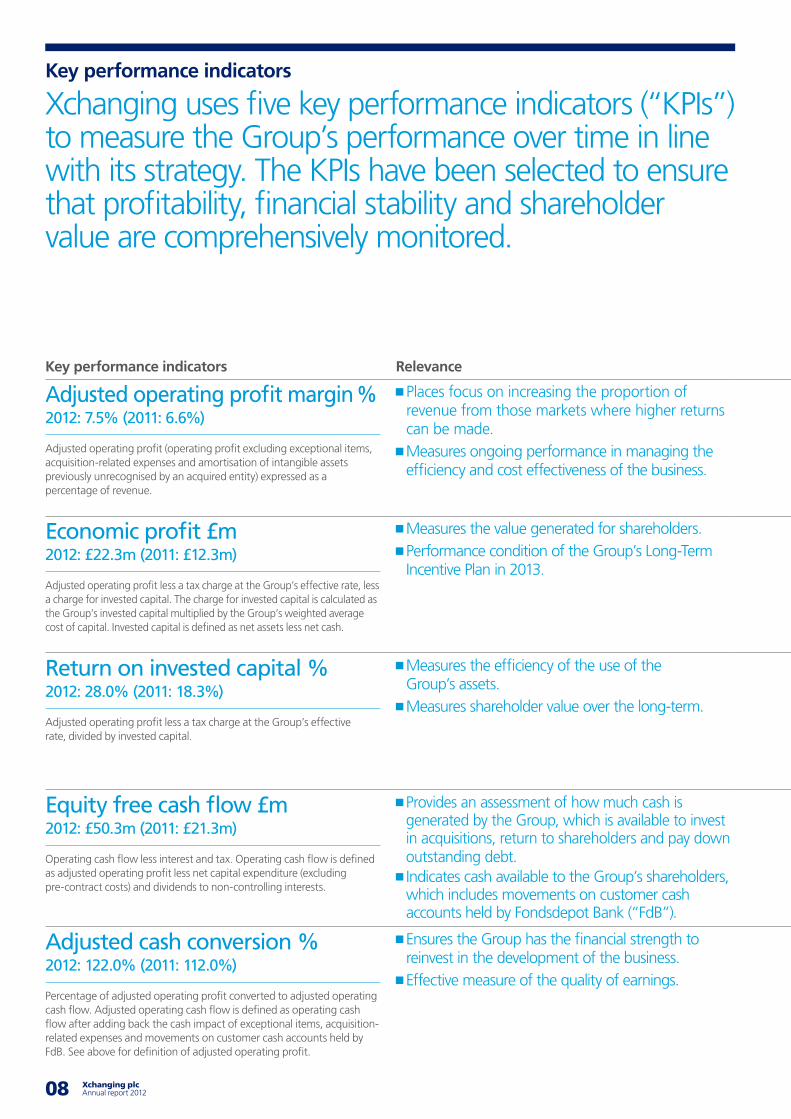
Xchanging uses five key performance indicators (“KPIs”) to measure the Group’s performance over time in line with its strategy. The KPIs have been selected to ensure that profitability, financial stability and shareholder value are comprehensively monitored.
Key performance indicators Relevance Performance (see page 36 to 43 for more detail) Chart
Adjusted operating profit margin % 2012: 7.5% (2011: 6.6%)
Adjusted operating profit (operating profit excluding exceptional items, acquisition-related expenses and amortisation of intangible assets previously unrecognised by an acquired entity) expressed as a percentage of revenue.
Places focus on increasing the proportion of revenue from those markets where higher returns can be made. Measures ongoing performance in managing the efficiency and cost effectiveness of the business.
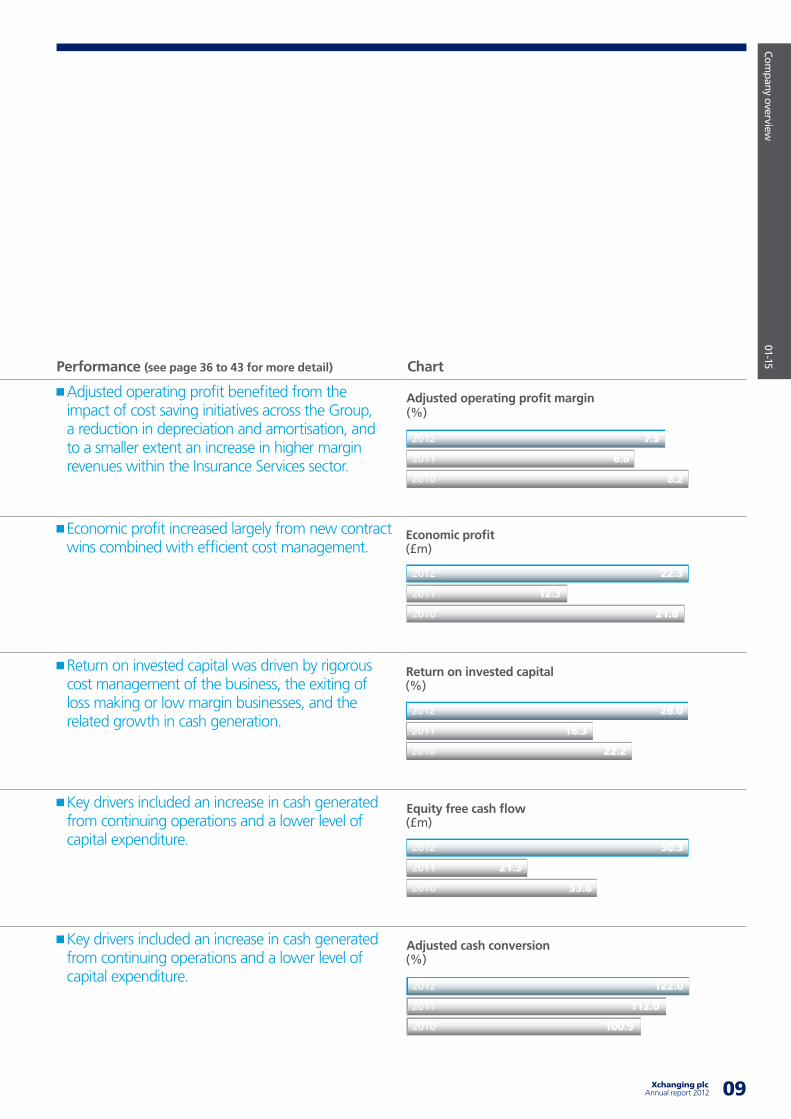
Adjusted operating profit benefited from the impact of cost saving initiatives across the Group, a reduction in depreciation and amortisation, and to a smaller extent an increase in higher margin revenues within the Insurance Services sector.
Economic profit £m 2012: £22.3m (2011: £12.3m)
Adjusted operating profit less a tax charge at the Group’s effective rate, less a charge for invested capital. The charge for invested capital is calculated as the Group’s invested capital multiplied by the Group’s weighted average cost of capital. Invested capital is defined as net assets less net cash.
Measures the value generated for shareholders. Performance condition of the Group’s Long-Term Incentive Plan in 2013.
Economic profit increased largely from new contract wins combined with efficient cost management.
Return on invested capital % 2012: 28.0% (2011: 18.3%)
Adjusted operating profit less a tax charge at the Group’s effective rate, divided by invested capital.
Measures the efficiency of the use of the Group’s assets. Measures shareholder value over the long-term.
Return on invested capital was driven by rigorous cost management of the business, the exiting of loss making or low margin businesses, and the related growth in cash generation.
Equity free cash flow £m 2012: £50.3m (2011: £21.3m)
Operating cash flow less interest and tax. Operating cash flow is defined as adjusted operating profit less net capital expenditure (excluding pre-contract costs) and dividends to non-controlling interests.
Provides an assessment of how much cash is generated by the Group, which is available to invest in acquisitions, return to shareholders and pay down outstanding debt. Indicates cash available to the Group’s shareholders, which includes movements on customer cash accounts held by Fondsdepot Bank (“FdB”).
Key drivers included an increase in cash generated from continuing operations and a lower level of capital expenditure.
Adjusted cash conversion % 2012: 122.0% (2011: 112.0%)
Percentage of adjusted operating profit converted to adjusted operating cash flow. Adjusted operating cash flow is defined as operating cash flow after adding back the cash impact of exceptional items, acquisition-related expenses and movements on customer cash accounts held by FdB. See above for definition of adjusted operating profit.
Ensures the Group has the financial strength to reinvest in the development of the business. Effective measure of the quality of earnings.
Key drivers included an increase in cash generated from continuing operations and a lower level of capital expenditure.
Adjusted operating profit margin
2012 7.5
2011 6.6
2010 8.2
(%)
Economic profit (£m)
2012 22.3
2011 12.3
2010 21.8
Return on invested capital (%)
2012 28.0
2011 18.3
2010 22.2
Equity free cash flow (£m)
2012 50.3
2011 21.3
2010 33.8
Adjusted cash conversion (%)
2012 122.0
2011 112.0
2010 100.9
09 Xchanging plcAnnual report 2012
Company overview
01-15Key performance indicators Relevance Performance (see page 36 to 43 for more detail) Chart
Adjusted operating profit margin % 2012: 7.5% (2011: 6.6%)
Adjusted operating profit (operating profit excluding exceptional items, acquisition-related expenses and amortisation of intangible assets previously unrecognised by an acquired entity) expressed as a percentage of revenue.
Places focus on increasing the proportion of revenue from those markets where higher returns can be made. Measures ongoing performance in managing the efficiency and cost effectiveness of the business.
Adjusted operating profit benefited from the impact of cost saving initiatives across the Group, a reduction in depreciation and amortisation, and to a smaller extent an increase in higher margin revenues within the Insurance Services sector.
Economic profit £m 2012: £22.3m (2011: £12.3m)
Adjusted operating profit less a tax charge at the Group’s effective rate, less a charge for invested capital. The charge for invested capital is calculated as the Group’s invested capital multiplied by the Group’s weighted average cost of capital. Invested capital is defined as net assets less net cash.
Measures the value generated for shareholders. Performance condition of the Group’s Long-Term Incentive Plan in 2013.
Economic profit increased largely from new contract wins combined with efficient cost management.
Return on invested capital % 2012: 28.0% (2011: 18.3%)
Adjusted operating profit less a tax charge at the Group’s effective rate, divided by invested capital.
Measures the efficiency of the use of the Group’s assets. Measures shareholder value over the long-term.
Return on invested capital was driven by rigorous cost management of the business, the exiting of loss making or low margin businesses, and the related growth in cash generation.
Equity free cash flow £m 2012: £50.3m (2011: £21.3m)
Operating cash flow less interest and tax. Operating cash flow is defined as adjusted operating profit less net capital expenditure (excluding pre-contract costs) and dividends to non-controlling interests.
Provides an assessment of how much cash is generated by the Group, which is available to invest in acquisitions, return to shareholders and pay down outstanding debt. Indicates cash available to the Group’s shareholders, which includes movements on customer cash accounts held by Fondsdepot Bank (“FdB”).
Key drivers included an increase in cash generated from continuing operations and a lower level of capital expenditure.
Adjusted cash conversion % 2012: 122.0% (2011: 112.0%)
Percentage of adjusted operating profit converted to adjusted operating cash flow. Adjusted operating cash flow is defined as operating cash flow after adding back the cash impact of exceptional items, acquisition-related expenses and movements on customer cash accounts held by FdB. See above for definition of adjusted operating profit.
Ensures the Group has the financial strength to reinvest in the development of the business. Effective measure of the quality of earnings.
Key drivers included an increase in cash generated from continuing operations and a lower level of capital expenditure.
Adjusted operating profit margin
2012 7.5
2011 6.6
2010 8.2
(%)
Economic profit (£m)
2012 22.3
2011 12.3
2010 21.8
Return on invested capital (%)
2012 28.0
2011 18.3
2010 22.2
Equity free cash flow (£m)
2012 50.3
2011 21.3
2010 33.8
Adjusted cash conversion (%)
2012 122.0
2011 112.0
2010 100.9
10 11
Xchanging’s four key strengths
In building our ability to compete in our markets we have redefined our service offerings and our go-to-market strategy. We also draw on four key strengths.
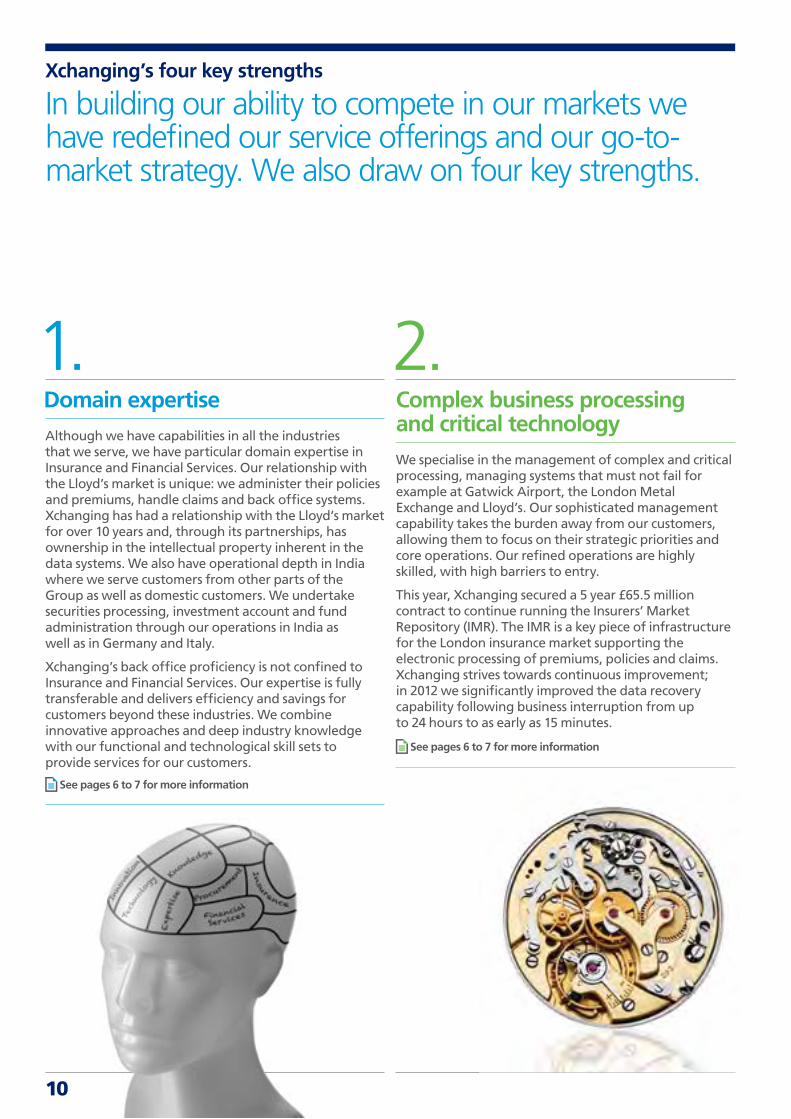
Domain expertiseAlthough we have capabilities in all the industries that we serve, we have particular domain expertise in Insurance and Financial Services. Our relationship with the Lloyd’s market is unique: we administer their policies and premiums, handle claims and back office systems. Xchanging has had a relationship with the Lloyd’s market for over 10 years and, through its partnerships, has ownership in the intellectual property inherent in the data systems. We also have operational depth in India where we serve customers from other parts of the Group as well as domestic customers. We undertake securities processing, investment account and fund administration through our operations in India as well as in Germany and Italy.
Xchanging’s back office proficiency is not confined to Insurance and Financial Services. Our expertise is fully transferable and delivers efficiency and savings for customers beyond these industries. We combine innovative approaches and deep industry knowledge with our functional and technological skill sets to provide services for our customers.
See pages 6 to 7 for more information
1. 2.Complex business processing and critical technologyWe specialise in the management of complex and critical processing, managing systems that must not fail for example at Gatwick Airport, the London Metal Exchange and Lloyd’s. Our sophisticated management capability takes the burden away from our customers, allowing them to focus on their strategic priorities and core operations. Our refined operations are highly skilled, with high barriers to entry.
This year, Xchanging secured a 5 year £65.5 million contract to continue running the Insurers’ Market Repository (IMR). The IMR is a key piece of infrastructure for the London insurance market supporting the electronic processing of premiums, policies and claims. Xchanging strives towards continuous improvement; in 2012 we significantly improved the data recovery capability following business interruption from up to 24 hours to as early as 15 minutes.
See pages 6 to 7 for more information
11 Xchanging plcAnnual report 2012
Company overview
01-15 3. 4.
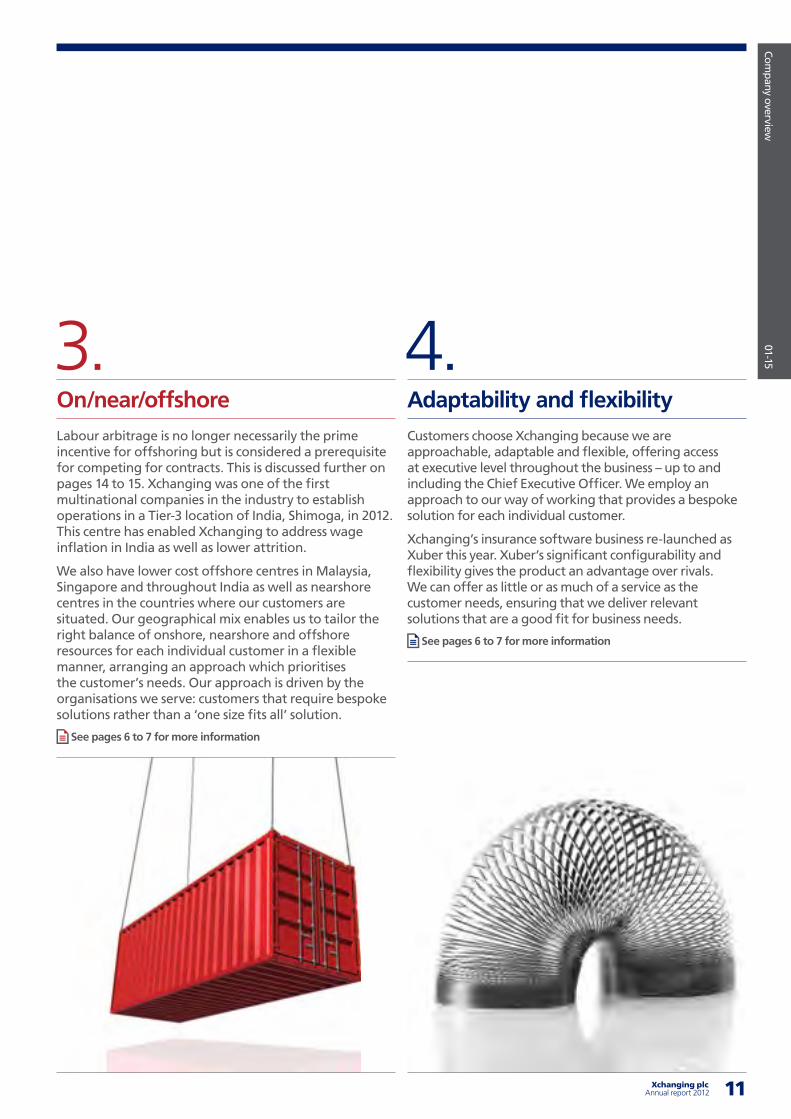
On/near/offshoreLabour arbitrage is no longer necessarily the prime incentive for offshoring but is considered a prerequisite for competing for contracts. This is discussed further on pages 14 to 15. Xchanging was one of the first multinational companies in the industry to establish operations in a Tier-3 location of India, Shimoga, in 2012. This centre has enabled Xchanging to address wage inflation in India as well as lower attrition.
We also have lower cost offshore centres in Malaysia, Singapore and throughout India as well as nearshore centres in the countries where our customers are situated. Our geographical mix enables us to tailor the right balance of onshore, nearshore and offshore resources for each individual customer in a flexible manner, arranging an approach which prioritises the customer’s needs. Our approach is driven by the organisations we serve: customers that require bespoke solutions rather than a ‘one size fits all’ solution.
See pages 6 to 7 for more information
Adaptability and flexibilityCustomers choose Xchanging because we are approachable, adaptable and flexible, offering access at executive level throughout the business – up to and including the Chief Executive Officer. We employ an approach to our way of working that provides a bespoke solution for each individual customer.
Xchanging’s insurance software business re-launched as Xuber this year. Xuber’s significant configurability and flexibility gives the product an advantage over rivals. We can offer as little or as much of a service as the customer needs, ensuring that we deliver relevant solutions that are a good fit for business needs.
See pages 6 to 7 for more information

12 Xchanging plc Annual report 2012 13
Our year in review
The sound financial performance for the year and the steadily growing flow of new business wins in the second half indicates that we are moving in the right direction.
JANUARY: Technology
New joinerAndrew Binns appointed Executive Director, Technology and a member of the Executive Board. With strong experience in both the financial and technology sectors, Andrew has played a key role this year in driving the final stage of investment and launch of Xuber.
APRIL: Technology
Joint ventureA 50-50 joint venture was formed with YTL called Xchanging Malaysia Sdn. Bhd. The venture, with about 200 employees at the year end, develops and delivers enhanced mobile internet and cloud-based hosting offerings in Malaysia.
SEPTEMBER: Technology
New contractNew contract signed with existing customer, Gatwick Airport, to partner in delivering its telephony services for the next four years.
JUNE: Technology
Product launchThe quality control service Torque was launched. This independent, automated testing and validation service, reduces overall testing times by a minimum of 40%.
JULY & SEPTEMBER: Group
Board changeStephen Wilson joined the Board as Non- executive Director in July and from 1 August became Chairman of the Audit Committee. In September Saurabh Srivastava was appointed as a Non-executive Director and member of the Audit Committee. See pages 46 to 47 for how Stephen and Saurabh will further strengthen the expertise of the Board.
FEBRUARY: Procurement
Contract renewalBAE Systems UK extended its procurement services contract in the UK for a further three years. The renewal further strengthened the relationship with this valuable customer whilst enabling benefits of scale and core expertise to be retained in the UK.
JUNE: Technology
New contract winOne of the largest global mobile operators awards Data Integration Limited, our network and systems integration company, a contract to re-architect their core customer network.
JULY: Business Processing Services
New centreA global delivery centre was opened in a new special economic zone in Shimoga, Karnataka. Xchanging became one of the first multinational companies in the industry to establish business in a a Tier-3 location of India.

13 Xchanging plcAnnual report 2012
Company overview
01-15
OCTOBER: Technology
Xuber relaunchThe software business was re-launched as ‘Xuber’, to compete more assertively in the insurance software market. The offering was strongly positioned to meet the positive shift in market demand.
NOVEMBER: Insurance Services
Contract awarded to build platform for the Lloyd’s market Claims Reporting Suite (CRS). Both the Lloyd’s Corporation and managing agents will be provided with consistent, benchmarked, claims management information delivered against a market-agreed set of key performance indicators.
NOVEMBER: Financial Services
AcquisitionKedrios, our Italian subsidiary, acquired 100% of the share capital of AR Enterprise S.r.L. (“AR“)which operates in the same business segment. This created a stronger, more competitive and profitable combined business with scale and resolved Kedrios’ weak strategic position.
NOVEMBER: Technology
Award winThe 2012 Insurance Day London Market Awards Technological Initiative of the Year was presented to Xchanging. This was in recognition of work with the Lloyd’s and London insurance market in the implementation of Electronic Claims File 2.
SEPTEMBER: Insurance Services
Product launchGlobal (re)insurance and accounting net settlement service, Netsett, launched alongside partner Deutsche Bank. The new global initiative uses structured data to enable organisations to exchange and settle accounting information.
OCTOBER: Insurance Services
Five year contractFive year follow-on contract – IMR. Signed a £65.5 million five year contract to continue providing the IMR to the London insurance market.
DECEMBER: Insurance Services
New joinerAppointment of Adrian Guttridge as Executive Director, Insurance Services and as a member of the Executive Board. Adrian will be focused on global growth of our Insurance Services business as well as building on the strong position in the Lloyd’s and London markets. (see pages 48 to 49 for a full biography).
OCTOBER: Group
Board changeThe third Non-executive addition to the Board in the year was Ian Cormack who took over the role of Senior Independent Director. Ian has extensive experience of the City and financial markets (see pages 46 to 47 for a full biography).
DECEMBER: Insurance Services
New contract winA twelve-year contract signed with leading insurance broker Marsh for the provision of Xuber’s Brokasure software.
14 Xchanging plc Annual report 2012 15
Market review
The market is evolving past the “traditional” outsourcing model, which involved long term contracts, customised software and a strong focus on cost reduction through offshoring.
Outsourcing market trendsMany analyst firms believe that the outsourcing industry reached a significant point in its history in 2012.1 Against the background of continuing economic depression in mature outsourcing markets (especially the USA and UK), outsourcing deals appear to have reduced in size, while client expectations have risen.2 The market is evolving past the “traditional” outsourcing model, which involved long term contracts, customised software and a strong focus on cost reduction through offshoring. Outsourcing providers are now delivering greater value and insight for their clients by leveraging new technologies and flexible commercial structures.3
Moving up the value chainIn early outsourcing deals, labour arbitrage was the core of outsourcing providers’ value propositions. Now, however, although labour arbitrage still requires continual investment, it is considered “table stakes”: the minimum entry requirement for bidding on an outsourcing project.4 Providers who have recognised this are looking to provide higher value and more strategic services to clients through investment – particularly in technology and innovation.
New technologiesThe technology landscape for business has changed very rapidly, to the point where Cloud technology, mobile applications and social media are ubiquitous. KPMG describes these tools as representing a key change in how the customer and business agree to interact, share information and conduct trade.5 Understanding of how new technology affects outsourcing customers (and their customers in turn) is the key to success in moving up the outsourcing value chain.
Strategic partnershipsAs outsourcing providers create more business value for their clients, they move closer to becoming true strategic partners. A crucial element in this evolution is more flexible commercial terms, driven by the development of on-demand services.
Sector developmentsPlease see below for some of the key global trends in our business sectors.
Business Processing ServicesInsurance Services There is consensus among industry analysts that 2013 will likely be another challenging year for the insurance industry, with continuing pressure from low rates of economic growth in the developed world, volatile financial markets, regulatory schemes and customer demands. In an environment that makes profitable growth difficult, insurers are more likely to turn to outsourcing providers who can optimise their core systems (including policy, billing and claims), drive value from their data, support channel management with mobile solutions and assist with regulatory compliance.6 As a result, Nelson Hall forecasts that the insurance BPO market will grow at 8% (year-on-year) in 2012 – 2016.7
Insurance BPO providers are increasingly technology-bundled providers, reflecting the continuing if not growing importance of technology in the industry. The optimisation of core systems remains a priority for insurance clients and there are an increasing number of options for these systems, both in terms of software functionality and delivery model (which runs from licence-only software right
through to Cloud-enabled Business Processing as a Service, or “BPaaS”). Vendors are partnering with clients to deliver value from new technologies as well: mobile solutions that support real-time information flows, data analytics that deliver new insight, and social media monitoring and intelligence.8
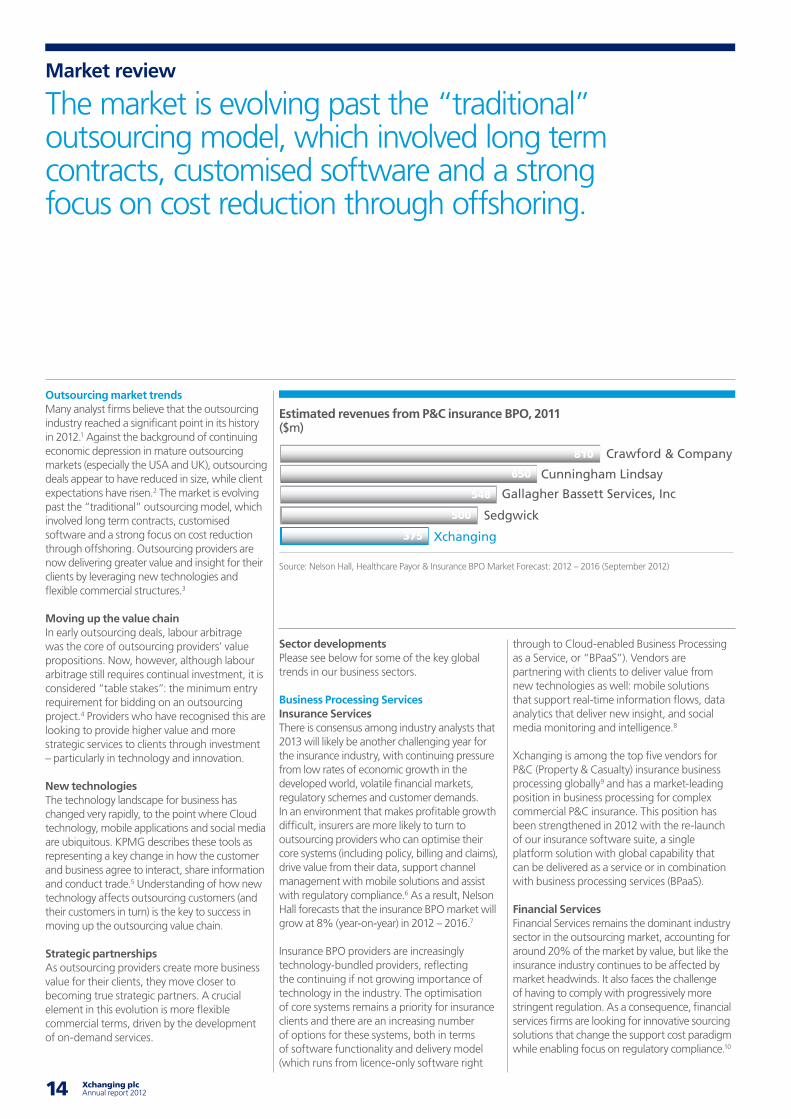
Xchanging is among the top five vendors for P&C (Property & Casualty) insurance business processing globally9 and has a market-leading position in business processing for complex commercial P&C insurance. This position has been strengthened in 2012 with the re-launch of our insurance software suite, a single platform solution with global capability that can be delivered as a service or in combination with business processing services (BPaaS).
Financial ServicesFinancial Services remains the dominant industry sector in the outsourcing market, accounting for around 20% of the market by value, but like the insurance industry continues to be affected by market headwinds. It also faces the challenge of having to comply with progressively more stringent regulation. As a consequence, financial services firms are looking for innovative sourcing solutions that change the support cost paradigm while enabling focus on regulatory compliance.10
Estimated revenues from P&C insurance BPO, 2011 ($m)
Source: Nelson Hall, Healthcare Payor & Insurance BPO Market Forecast: 2012 – 2016 (September 2012)
Estimated revenues from P&C insurance BPO, 2011 (£million)
810
650
548
500
375
Crawford & Company
Cunningham Lindsay
Gallagher Bassett Services, Inc
Sedgwick
Xchanging
15 Xchanging plcAnnual report 2012
Company overview
01-15
In addition, financial services firms are looking to leverage service provider skills in process optimisation and to access skills in technology innovation. As in insurance, financial services institutions are looking at bundled ITO/BPO options, reflecting increasingly integrated sourcing strategies.11
Xchanging’s footprint in financial services business processing includes both vertical-specific services (including securities processing, funds administration and investment account administration) and horizontal services such as finance and accounting. In 2012 we acquired AR, a leading provider of software packages and comprehensive IT solutions for the securities brokerage and asset management industry in Italy, to strengthen our market position in Europe.
Technology Cloud services are now a mainstream trend and while cost remains a driving factor for many Cloud investments, customers are beginning to consider Cloud more strategically.12 The continued transition to Cloud platforms and data centre consolidation will continue to drive outsourcing deals, and vendors who can demonstrate value as strategic partners through a broad Cloud portfolio and innovative services will benefit most.
Cloud services are inextricably linked to the other key technology outsourcing trends: data and mobility. “Big Data” (the phenomenon of the rapid increase in data volumes) was the technology story of 2012, and outsourcing providers are starting to offer increasingly sophisticated data analytics solutions to enable enterprises to realise the marketing, benchmarking and product development advantages of using their data.13
More effective data insights, coupled with the rise in use of mobile devices, is also encouraging adoption of outsourced mobile solutions. Bring Your Own Device (or “BYOD”) behaviour is now a “truly widespread phenomenon” and a trend that is forecast to continue if not accelerate in 2013.14
This is driving growth in the enterprise mobility management market, particularly in services that will help customers get the maximum business value from their BYOD policies.
Xchanging is a technology-enabled provider and integrator of business process services. Our evolution as a technology provider has been focused on our customers’ business needs and as a result we pay attention to the evolving technology landscape. In 2012 we launched a joint venture with YTL Communications to offer mobile internet and cloud-based hosting offerings to customers in Malaysia, and we also announced that our insurance software suite will incorporate advanced data analytics tools.
Procurement The procurement market continues to grow rapidly. The market grew by 14% in 2011 and is forecast to have grown by 15% in 2012, reaching an annual contract value total of over £1.1 billion.15 Procurement outsourcing also shows increasing signs of maturity, with deals expanding outside of indirect spend to include non-core direct spend, and with more deals being signed with small and medium-sized enterprises every year.16 Industry analyst firm Everest also reports a growing number of contracts with a global scope, including operations in Asia Pacific and South America in addition to Europe and North America.17 The market’s attractiveness is demonstrated by the fact that new entrants continue to enter the market, including BPO providers and former shared service centres, or captives.
Buyers continue to take an end-to-end approach to procurement, driving partnerships between service providers and BPO generalists. The trend has also driven acquisition activity, with specialist procurement providers or consultancies a particular target, along with technology vendors. This highlights the importance of technology innovation in this market. Cloud-based delivery capabilities are an increasingly frequent and sophisticated feature of e-procurement and Procure-to-Pay solutions, while Software as a Service (“SaaS”)
Notes:1. Source: Ovum, ‘2013 Trends to Watch: Outsourcing’,
October 20122. For a typical analyst view on this, see KPMG, ‘The
Death of Outsourcing’, July 20123. Source: Accenture, ‘Next-Generation BPO: Are You
Ready?’, December 20114. Source: Ovum, ‘2013 Trends to Watch: Outsourcing’,
October 20125. Source: KPMG, ‘The Death of Outsourcing’, July 20126. Source: Ovum, ‘2013 Trends to Watch: Insurance’,
October 20127. Source: Nelson Hall, ‘Healthcare Payor & Insurance
BPO Market Forecast: 2012 – 2016’, September 20128. These trends are referenced in Ovum, ‘2013 Trends to
Watch: Insurance’, October 20129. Source: Nelson Hall, ‘Healthcare Payor & Insurance
BPO Market Forecast: 2012 – 2016’, September 201210. Source: Elix-IRR, ‘Trends in Outsourcing & Offshoring
in the Financial Services Industry, 2008 – 2012’, October 2012
11. Source: Elix-IRR, ‘Trends in Outsourcing & Offshoring in the Financial Services Industry, 2008 – 2012’, October 2012
12. Source: Ovum, ‘2013 Trends to Watch: Cloud Services’, October 2012
13. Source: Ovum, ‘2013 Trends to Watch: Big Data’, October 2012
14. Source: Ovum, ‘2013 Trends to Watch: Mobile Consumerization’, October 2012
15. Source: Everest, ‘Procurement Outsourcing (PO) Annual Report 2012’, May 2012
16. Source: Everest, ‘PO Service Provider Landscape – Investing in Building Expertise’, August 2012
17. Source: Everest, ‘Procurement Outsourcing (PO) Annual Report 2012’, May 2012
18. Source: Everest, ‘PO Service Provider Landscape – Investing in Building Expertise’, August 2012
19. Source: Everest, ‘PO Service Provider Landscape – Investing in Building Expertise’, August 2012
solutions are becoming more widely adopted and BPaaS solutions are starting to emerge.18
Xchanging was named a “star performer” by industry analyst firm Everest in 2012 and has an estimated 24% share of the UK procurement market as well as important market shares in the US, Europe and Asia Pacific markets. Our flexibility in commercial models including our Gainshare proposition and end-to-end sourcing capability and proprietary technology to manage sourcing workflow and track savings remain important differentiators in the market and have driven our growth to become the estimated fourth largest procurement outsourcing provider globally by active annual contract value.19
16 Xchanging plc Annual report 2012 17
Chief Executive Officer’s report
We have made good progress and have started to see the benefits, with much higher levels of interest in our offerings, the award of new contracts and the successful renewal of existing ones.
Objectives for 2012
1. Compete to win See page 17
2. Increase revenue from existing customers See page 18
3. Achieve ‘One Xchanging’ See page 19
4. Year-on-year improvement in financial performance See page 20
17 Xchanging plcAnnual report 2012
Business review
16-45
wenty twelve was a year in which we restored the confidence in Xchanging of our shareholders, our employees, our customers
and our partners. It was a year in which we got fit again and demonstrated our ability to compete to win. Moreover, it was a year in which we built a foundation for the future of the business and delivered year-on-year improvement in financial performance.
In a year of intense activity we made good progress. At the beginning of the year we set out our four objectives for the year, and said our performance for the period should be judged against these. I can now report on what we have achieved.
Compete to winFrom a low base historically it has been paramount to build our sales and marketing capability. Under the new global sales and marketing leadership of Stephen Scott (see pages 48 to 49), we are much more customer and market focused.
We reviewed and consolidated our product and service offerings to provide focus for our customers, our account directors and our growing sales force. Amongst other marketing collateral developed, our newly defined service offerings have been incorporated into a sales and marketing mobile application, harnessing technology to improve delivery.
Early in the year we established a ‘Bid Factory’ based in India which has reduced the time taken to respond to Requests for Proposals (‘RFPs’) considerably whilst improving the quality and consistency of our documentation. The Bid Factory also provides research information, competitor analysis and supports the development of service solutions.
We developed an account management group and a system to nurture, and where necessary rebuild, existing relationships and to develop new relationships in a methodical way. We introduced Salesforce.com to track and cross reference sales activity. Sales pipeline information is now available in real time to senior management.
Our Third Party Adviser (“TPA”) programme is now well established, and has driven the increased flow of RFPs into Xchanging. We are continuing to develop this channel to market.
These measures have started to have an effect, and during the year we won a number of new contracts, which I refer to in the Business Sector Review. Although many are small or medium sized, these demonstrate our ability to compete successfully. Experience shows that strong customer relationships can grow from the initial small contracts. Most importantly, we are seeing a much higher level of interest and RFPs across all our businesses than was previously the case. This suggests our renewed focus on sales and marketing is bearing fruit.
Grow revenue from existing customersLast year we recognised that we have been missing growth opportunities by not assiduously developing valuable existing customer relationships. The sales and marketing activity I describe above has supported our efforts here.
However, to generate new business with existing customers we must innovate, bringing fresh ideas and ways to add value to our customers’ businesses. During 2012 we put greater focus on ‘Inspiring Innovation’, developing channels to stimulate and capture innovative thinking (see page 3). We established a cross-company Innovation Group, holding an ‘Innovation Olympics’ mid-year and rolling out the first ‘Ken’s Den’ innovation competition. The response has been very encouraging and we have taken a first set of ideas into development.
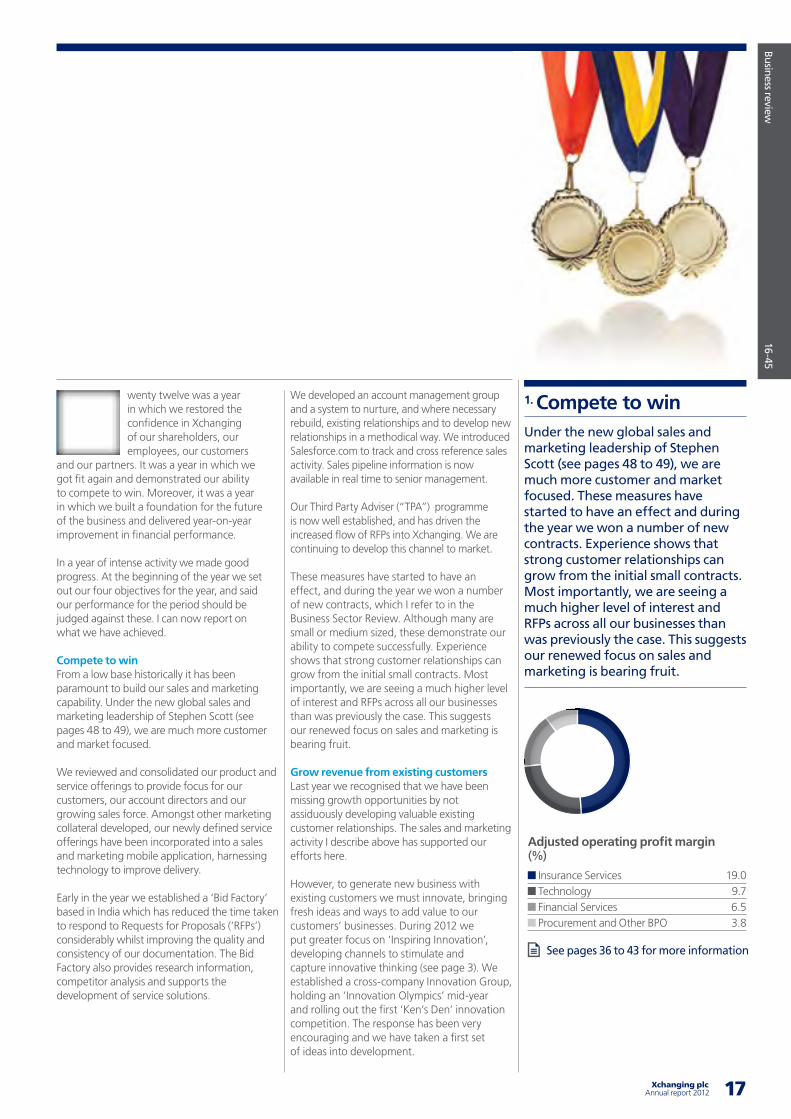
T1. Compete to winUnder the new global sales and marketing leadership of Stephen Scott (see pages 48 to 49), we are much more customer and market focused. These measures have started to have an effect and during the year we won a number of new contracts. Experience shows that strong customer relationships can grow from the initial small contracts. Most importantly, we are seeing a much higher level of interest and RFPs across all our businesses than was previously the case. This suggests our renewed focus on sales and marketing is bearing fruit.
See pages 36 to 43 for more information
Adjusted operating profit margin (%)
Insurance Services 19.0 Technology 9.7 Financial Services 6.5 Procurement and Other BPO 3.8
18 Xchanging plc Annual report 2012 19
Other opportunities to grow business with existing customers lie in cross-selling, since the collective spectrum of our offerings are relevant to the vast majority of medium to large scale businesses.
To cross-sell successfully we must behave as ‘One Xchanging’. I talk more about this below. Of the supporting practical measures we introduced this year, our new Account Management programme provides a structure for routinely exploring new sales opportunities within existing relationships; and our marketing mobile application provides our sales force with both a mobile database on our offerings and subject matter experts, and a prompter to ensure opportunities are not missed.
One XchangingMany multi-faceted businesses suffer from ‘silo mentality’. We recognised the need to break down silo barriers, to drive business growth through collaborative working and business efficiencies, to optimise innovative thinking and promote a good working environment for employees.
We started by introducing our six corporate values last year (see page 44), and during 2012 we have continued to promote these in all we do. Group wide initiatives such as ‘Values Months’ have helped individual employees work through what each value means to them in their role. At our two internal conferences, Business Week India 1 in February and Business Week India 2 in October, awards were presented to employees who have shown excellence in ‘Living the Values’.
Our efforts have been underpinned in a very pragmatic way by the introduction at the year end of a pilot Enterprise Social Network. Named ‘Leapfrog’ for its potential contribution to our business efficiencies, this platform facilitates communication, collaborative working and knowledge sharing, right across the company.
Cultural change takes time; but we have made a good start and we are seeing the mantra ‘One Xchanging’ being translated into behaviours. Our 2011 ‘Changing Xchanging’ programme led to ‘Xchanging is Changing’ in 2012.
Entering 2013 we have launched ‘Going for Gold’. This is a programme of six work streams designed to support achievement of our business objectives: year-on-year improvement in financial performance; increased sales to existing customers; compete to win increased sales to new customers.
Based on ‘One Xchanging’ teamwork, the work streams focus on: differentiating our service offering through innovation; world class selling and customer engagement; creating an organisation with customer focus built around our industry sectors and our service lines, which will ensure all our capabilities can be taken to market; developing talent for the future; enhancing our competitive edge by establishing shared services, optimising cost of delivery through standardisation and simplification, and enhancing provision of management information for decision-making; and the simplification and standardisation of internal IT processes and systems.
The Going for Gold programme will continue to hone our business, aiming to make the way we operate leaner, more efficient and more productive whilst we focus on delivering innovative offerings to customers.
Chief Executive Officer’s report continued
“ Our markets are evolving. We are increasingly providing higher margin, technology-enabled business processing services.”
2. Increase revenue from existing customers
To generate new business with existing customers we must innovate, bringing fresh ideas and ways to add value to our customers’ businesses. During 2012 we put greater focus on ‘Inspiring Innovation’, developing channels to stimulate and capture innovative thinking (see page 3). Other opportunities to grow business with existing customers lie in cross-selling, since the collective spectrum of our offerings are relevant to the vast majority of medium to large scale businesses. To cross-sell successfully we must behave as ‘One Xchanging’.
Adjusted revenue (£million)
668.3
650.0
2012
2011
See pages 36 to 43 for more information
19 Xchanging plcAnnual report 2012
Year-on-year improvement in financial performanceYear-on-year improvements in revenue, profit, cash flow and return on invested capital have been achieved in challenging markets. With our focus on building our sales and marketing infrastructure, developing our position with the TPA channels and on our new integrated sales platform, our pipeline has been steadily strengthening and we have started to see the benefits through the second half of the year. As set out at the beginning of the year, profit growth has been supported by sustaining the cost reductions achieved in 2011.
Business sector reviewBusiness Processing Servicesa) Insurance ServicesOur insurance business had a good year, with higher volumes in the UK market, good progress winning new customers, and an increased market share granted to our Australian State of Victoria contract. Developing our US strategy around the existing Xuber customer base has meant costs have been kept under control as we enter that market.
As the London Market Modernisation programme moved forward, we continued to work closely with the Lloyd’s and London market. We believe we have demonstrated the strength of our business processing and technology capabilities and the integrity of our trusted partner status, as evidenced by winning a five year £65.5 million contract to continue providing the IMR service, previously an annual contract.
We also won accreditation as one of the two Lloyd’s market Volume Claims Providers and, towards the year end, the contract to develop Lloyd’s market Claims Reporting Suite. The publication of high level Governance Principles mid-year placed us firmly at the centre of the service provisioning process for the Lloyd’s market going forward.
More recently, the announcement that the Darwin project – the part of the Market Modernisation programme relating to the provision of central services – is being replaced with the more evolutionary Central Services Review has provided further, significant reassurance of Xchanging’s position.
Two new products were launched. In October, our insurance software suite was re-launched under the brand name ‘Xuber’ – this is reported below under Technology.
We also launched a pilot for our new global net settlement service, ‘Netsett’ (see page 21). Primarily aimed at the global insurance market, Netsett is also suitable for other settings such as large global enterprises where high volumes of two-way intra-party settlements are being made daily. In December, we launched a live Netsett pilot with RSA, the multi-national insurance company.
To support the protection and growth of our existing London insurance business we established a dedicated product and service development function. In February 2013, this team introduced a mobile application, ‘X-presso’, linked to our Electronic Claims File database for agents and brokers, enabling mobile data loading and viewing.
We won a number of industry awards, including the Insurance Day’s London Market Technological Initiative of the Year Award (for our work on the Electronic Claims File), Treasury Today’s Adam Smith Award for ‘One to Watch’ (for Netsett) and Post Magazine’s Major Loss Award (for our handling of claims in the Japanese earthquake aftermath).
In Australia we won the Top Performing Agent Award in the State of Victoria. This contract continues to perform well, winning the grant of additional market share. The New South Wales contract has been profitable but remains challenging.
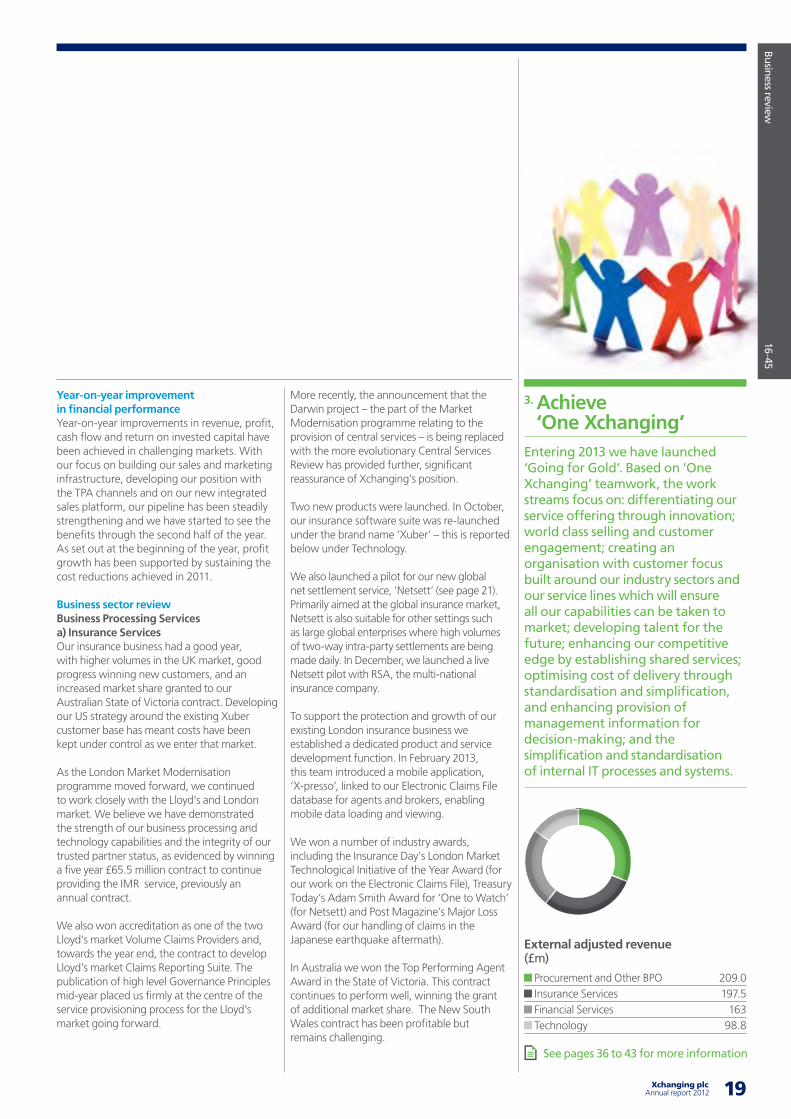
3. Achieve ‘One Xchanging’
Entering 2013 we have launched ‘Going for Gold’. Based on ‘One Xchanging’ teamwork, the work streams focus on: differentiating our service offering through innovation; world class selling and customer engagement; creating an organisation with customer focus built around our industry sectors and our service lines which will ensure all our capabilities can be taken to market; developing talent for the future; enhancing our competitive edge by establishing shared services; optimising cost of delivery through standardisation and simplification, and enhancing provision of management information for decision-making; and the simplification and standardisation of internal IT processes and systems.
External adjusted revenue (£m)
Procurement and Other BPO 209.0 Insurance Services 197.5 Financial Services 163 Technology 98.8
See pages 36 to 43 for more information
Business review
16-45
20 Xchanging plc Annual report 2012 21
During the year we also won an extension to our contract with Crawford. Our aim is to pursue more business in the self-insured market.
In December, we appointed a new Executive Director for Insurance Services, Adrian Guttridge (see pages 48 to 49).
b) Financial Services The Financial Services business performance was flat as cost control measures, particularly in Xchanging Transaction Bank, GmbH (“XTB”), offset the impact of the weak securities market volumes. In our FdB operations, we continued to balance core activity for Allianz Global Investors with new customers, which now account for approximately half the business’s revenue.
We continued to build a broader base to our Financial Services business, serviced from our Indian operations, with the second half of the year continuing to add new customers. We have also started to establish a financial services presence in Spain, building on the initial Xchanging footprint established there in 2011 to service the L’Oréal procurement contract won that year.
In November, we announced the acquisition by our Italian subsidiary Kedrios of securities market software company AR (see page 23). AR provides Kedrios with important technology, and the combined business will have a leading position in the Italian market. The transaction accelerates our plan to bring Kedrios to profitability and resolves the strategic challenge to this operation. It also means we no longer have any loss making businesses. The two businesses formally merged under the new name, Xchanging Italy S.p.A., in January 2013.
Chief Executive Officer’s report continued
c) Enterprise Services (business sectors other than Insurance Services and Financial Services)We continued to build our customer base in the other industry sectors we serve, both internationally and in the growing domestic Indian market. Contract wins included a UK transport company and a national ministry of education.
July saw the formal opening of our new global delivery centre in Shimoga, Karnataka. Located in a Special Enterprise Zone, this centre forms part of our strategy to sustain our ability to offer lower cost offshore processing capabilities. Seating nearly 600 employees by the end of the year, the facility has a capacity of 1,000.
TechnologyOur Technology business made steady progress in 2012. The Application Management Services business (formerly ‘Information Technology Outsourcing’) returned to profit and our Software business benefited from encouraging early interest in the newly launched Xuber insurance software products.
At the beginning of the year we appointed Andrew Binns as Executive Director, Technology (see pages 48 to 49). During 2012 we reshaped the business, with the primary focus being to accelerate completion of the development and launch of our insurance software suite of four products. This was done in October under the brand name ‘Xuber’ (see page 23).
The Xuber products will sit at the core of the insurance offering we provide in the UK as well as in markets we are developing outside the UK, namely the US and Bermuda.
We have won a number of technology contracts with new customers, including Visa, and some substantial new business with existing customers, including Gatwick Airport.
Adjusted operating margin (%)
7.5
6.6
2012
2011
4. Year-on-year improvement in financial performance
Year-on-year improvement in revenue, profit, cash flow and return on invested capital have been achieved in challenging markets. With our focus on building our sales and marketing infrastructure, developing our position with the Third Party Adviser channels and on our new integrated sales platform, our pipeline has been steadily strengthening and we have started to see the benefits through the second half of the year. As set out at the beginning of the year, profit growth has been supported by sustaining the cost reductions achieved in 2011.
See pages 36 to 43 for more information
21 Xchanging plcAnnual report 2012
Business review
16-45
Our Application Management Services business based in India, the UK, Singapore and Malaysia performed much better following some reorganisation and sales reinvigoration. During the year we launched a new product, Torque; a product that helps reduce testing time for new software in development by as much as 40% (see page 12). Our Infrastructure Management Services business had a particularly successful year of contract wins, and we made good progress within our new Joint Venture with YTL in Malaysia.
ProcurementThe procurement business has had a busy year. The two large contracts won in 2011 made slower progress than expected working through to completion of their implementation phases.
This business sector also gained new leadership during the year with the appointment of Ed Cross as Executive Director (see pages 48 to 49). We reorganised the senior management team and re-oriented marketing strategy on a global basis, building a sales team to support this and establishing an office in Chicago. In 2013, we will focus on winning additional contracts for our new US platform to establish the critical mass needed for a sustainable business.
In the UK, we rationalised our operating model to achieve greater efficiencies to match the lower margin on the BAE Systems procurement contract that was renewed in February.
The sector successfully renewed maturing contracts with all its existing customers and won a number of new customers including a leading Financial Services company in the UK and G4S in Continental Europe, and with Cerebos, Sydney Water, University of South Australia and ACH Group in Australia. A new contract with Grupo Panrico is helping to develop our procurement presence in Spain, building on the existing L’Oréal contract. Earlier, I referred to our aim to promote cross-selling and we saw a good example of this, winning a procurement project in Australia with existing insurance customer Aon.
Business Processing Services:
Netsett – Liberating cashWhat is Netsett?Netsett is software that operates as a central accounting and net settlement service to the global insurance market. The Netsett platform has been created in partnership with Deutsche Bank, which provides transaction banking, clearing and foreign exchange capabilities to the service.
Netsett has 3 key benefits:1. Operational efficiency – Netsett removes the need to manage the
payments cycle as well as allowing for the reconciliation of incoming and outgoing payments to the ledger
2. Transparency and control – there is continual ledger correspondence in relation to the incoming and outgoing payments as well as an audit trail in the ledger
3. Capital efficiency – Netsett enables a reduction of working capital and improved cash flow. Clients benefit from reduced bank charges due to the reconciliation of outgoing and incoming charges and the weekly netting process
Procurement:
Vault – a multi-benefit trading platform for procurement globallyWhat is Vault?Vault drives procurement performance across the globe by enabling spend and savings forecasting, performance monitoring, savings reporting and financial settlement.
There are 4 key features that differentiate Vault:1. Vault captures business needs that are determined as a result of
an annual planning process and tracks them from baseline through the sourcing project milestones to negotiated contract and finally to tracked savings – truly end-to-end visibility
2. The system offers transparency, giving both Co-Sourcing partners access to sourcing initiatives and detailed savings numbers
3. Vault has been built using the combined experience of Xchanging’s sourcing professionals and financial management professionals and drawing upon 10 years’ experience operating a gainshare commercial model with its customer base
4. Vault is unique. There is no other solution in the market that has the same end-to-end features that Vault has, nor is there a system that has been designed and built specifically for the unique requirements of the gainshare business model
22 Xchanging plc Annual report 2012 23
Chief Executive Officer’s report continued
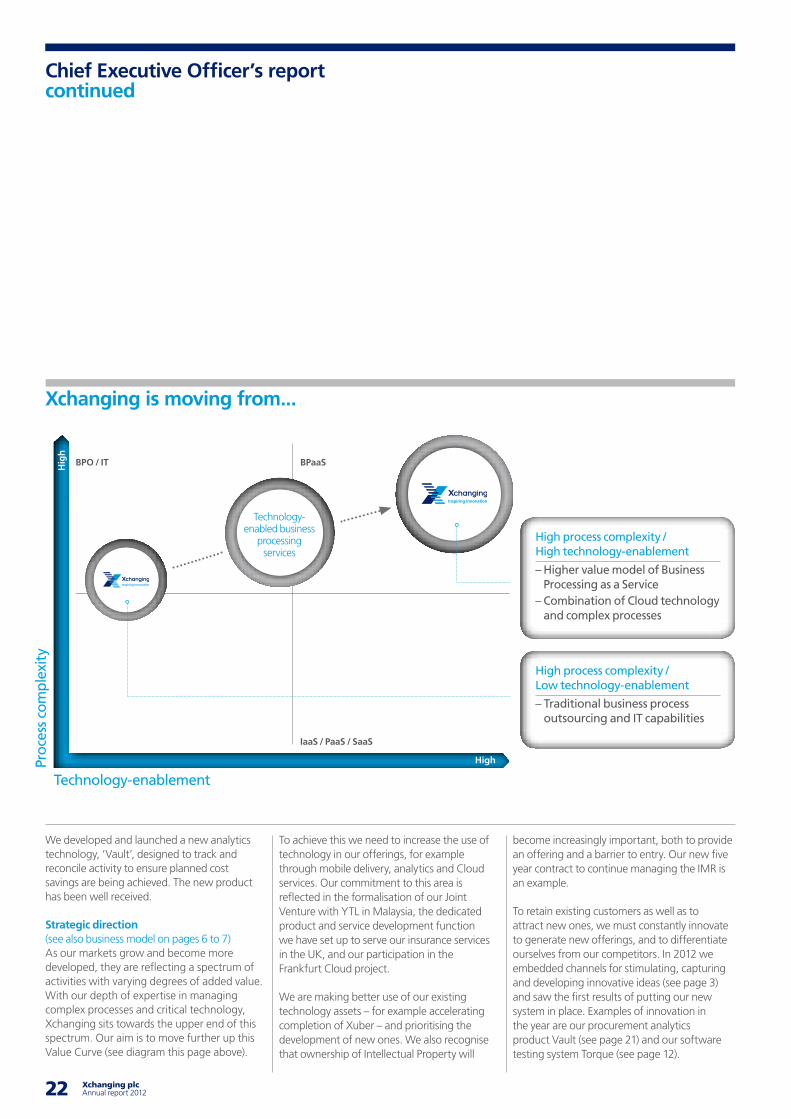
High process complexity / Low technology-enablement
– Traditional business process outsourcing and IT capabilities
BPO / IT BPaaS
IaaS / PaaS / SaaS
Technology- enabled business
processing services
High process complexity / High technology-enablement
– Higher value model of Business Processing as a Service
– Combination of Cloud technology and complex processes
Proc
ess
com
plex
ity
High
Hig
h
Xchanging is moving from...
Technology-enablement
We developed and launched a new analytics technology, ‘Vault’, designed to track and reconcile activity to ensure planned cost savings are being achieved. The new product has been well received.
Strategic direction (see also business model on pages 6 to 7)As our markets grow and become more developed, they are reflecting a spectrum of activities with varying degrees of added value. With our depth of expertise in managing complex processes and critical technology, Xchanging sits towards the upper end of this spectrum. Our aim is to move further up this Value Curve (see diagram this page above).
To achieve this we need to increase the use of technology in our offerings, for example through mobile delivery, analytics and Cloud services. Our commitment to this area is reflected in the formalisation of our Joint Venture with YTL in Malaysia, the dedicated product and service development function we have set up to serve our insurance services in the UK, and our participation in the Frankfurt Cloud project.
We are making better use of our existing technology assets – for example accelerating completion of Xuber – and prioritising the development of new ones. We also recognise that ownership of Intellectual Property will
become increasingly important, both to provide an offering and a barrier to entry. Our new five year contract to continue managing the IMR is an example.
To retain existing customers as well as to attract new ones, we must constantly innovate to generate new offerings, and to differentiate ourselves from our competitors. In 2012 we embedded channels for stimulating, capturing and developing innovative ideas (see page 3) and saw the first results of putting our new system in place. Examples of innovation in the year are our procurement analytics product Vault (see page 21) and our software testing system Torque (see page 12).
23 Xchanging plcAnnual report 2012
Business review
16-45
Technology-enablement and innovation will remain central to our business plans going forward.
OutlookWe set out at the beginning of the year to build the foundations for growth. We have made good progress and have started to see the benefits, with much higher levels of interest in our offerings, the award of new contracts and the successful renewal of existing ones. We have started our transition from the founding business model, based on a small number of large contracts, to a more broadly-based model.
The challenges we face as we go into 2013 are the more familiar ones of any business: innovation and new product and service development, differentiation in the market, sales and marketing capabilities, attracting and retaining talent and effective management of costs.
Our agenda for 2013 will be to maintain the pace and press ahead with efforts started in 2012 to compete to win, contributing further to the momentum we saw in the second half of 2012.
Ken LeverChief Executive Officer
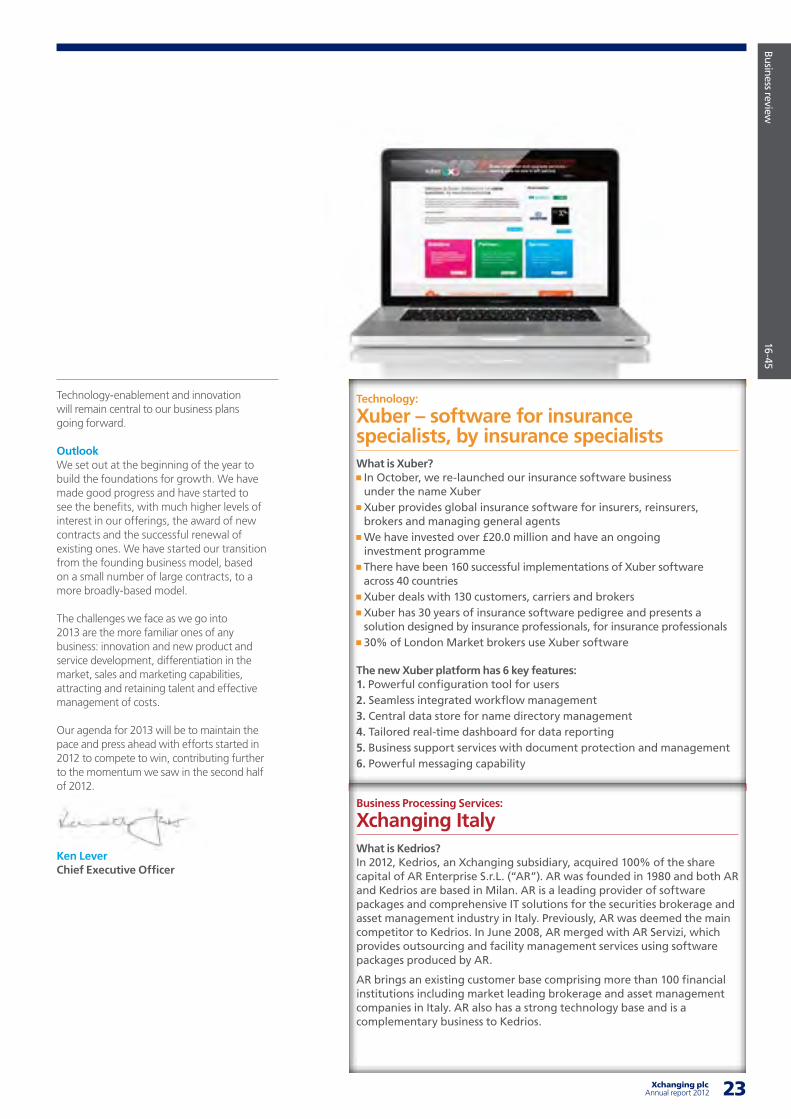
Technology:
Xuber – software for insurance specialists, by insurance specialistsWhat is Xuber? In October, we re-launched our insurance software business under the name Xuber Xuber provides global insurance software for insurers, reinsurers, brokers and managing general agents We have invested over £20.0 million and have an ongoing investment programme There have been 160 successful implementations of Xuber software across 40 countries Xuber deals with 130 customers, carriers and brokers Xuber has 30 years of insurance software pedigree and presents a solution designed by insurance professionals, for insurance professionals 30% of London Market brokers use Xuber software
The new Xuber platform has 6 key features:1. Powerful configuration tool for users2. Seamless integrated workflow management3. Central data store for name directory management4. Tailored real-time dashboard for data reporting5. Business support services with document protection and management6. Powerful messaging capability
Business Processing Services:
Xchanging Italy What is Kedrios?In 2012, Kedrios, an Xchanging subsidiary, acquired 100% of the share capital of AR Enterprise S.r.L. (“AR”). AR was founded in 1980 and both AR and Kedrios are based in Milan. AR is a leading provider of software packages and comprehensive IT solutions for the securities brokerage and asset management industry in Italy. Previously, AR was deemed the main competitor to Kedrios. In June 2008, AR merged with AR Servizi, which provides outsourcing and facility management services using software packages produced by AR.
AR brings an existing customer base comprising more than 100 financial institutions including market leading brokerage and asset management companies in Italy. AR also has a strong technology base and is a complementary business to Kedrios.
24 Xchanging plc Annual report 2012 25
Principal risks and uncertainties
Xchanging maintains risk registers covering each significant operation, business sector and the Group. We review our risk assessment four times per year, which helps to ensure we have a consistent approach and focus on the right risks. The Board reviews the Group risk register annually.
uring 2012 the focus for the business has moved from the Four Part Action Plan of 2011 to the key objectives outlined at the beginning of the year:
Compete to win
Increase sales from existing customers
Achieve “One Xchanging”
Year-on-year improvement in financial performance
Focusing upon these activities and addressing the key risks from the beginning of the year, has enabled the business to move to a more stable position going into 2013.
However, the outsourcing market is becoming more sophisticated and is evolving into a spectrum of services from simple to complex.
It is important that we ensure that we continue to evolve our high quality products and services to increase competitive advantage and grow market share.
How we manage risk We analyse the nature and extent of risks and consider their likelihood and impact, both on an inherent and a residual basis, after taking into account mitigating controls. This allows us to determine how we should manage each risk in order to achieve our strategic objectives. We divide our risks into strategic, commercial, operational and financial categories: Strategic risks reflect the potential for a significant strategic action or a failure to react to developing trends in the market, to have a financial impact on the economic value of our business.
D Commercial risks reflect the potential to enter into a critical contract or commercial arrangement that may have an adverse impact on the economic value of our business.
Operational risks reflect the potential for the failure of a critical process or procedure to have an adverse impact on the economic value of our business.
Financial risks include interest, foreign exchange, tax rate changes, pension valuations and liquidity. Failure to manage these risks could negatively impact the economic value of our business.
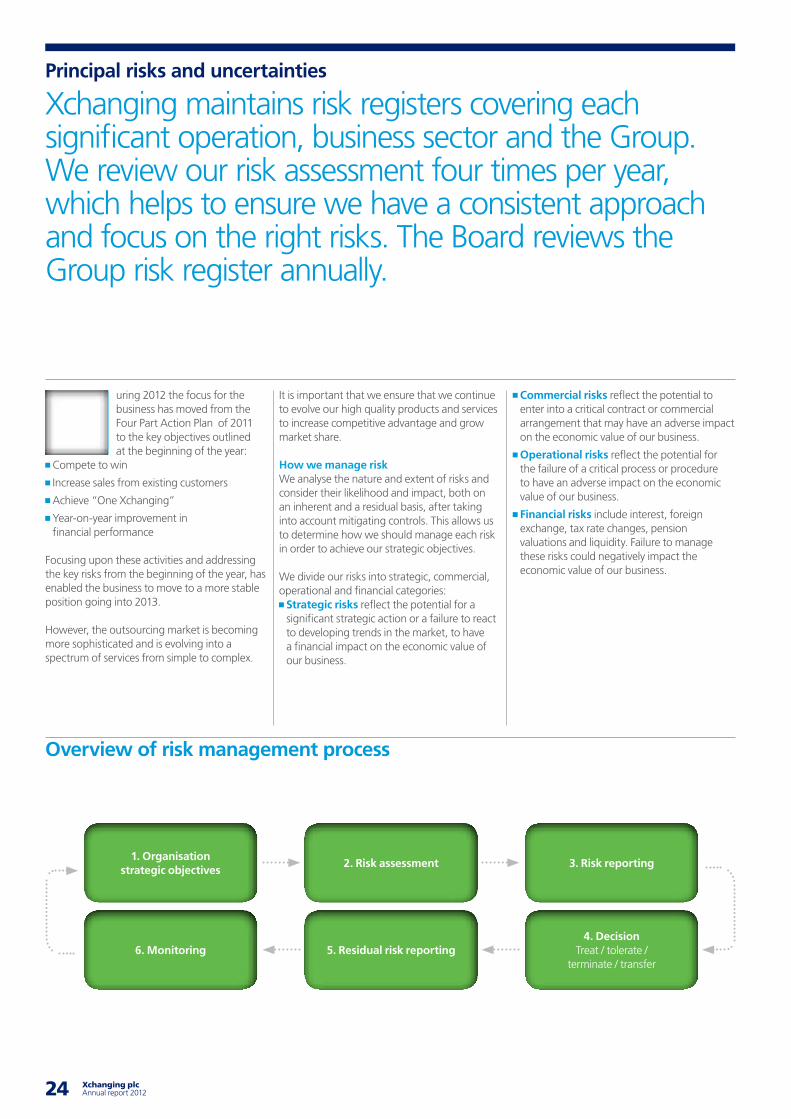
Overview of risk management process
1. Organisation strategic objectives
2. Risk assessment 3. Risk reporting
4. DecisionTreat / tolerate /
terminate / transfer5. Residual risk reporting6. Monitoring
25 Xchanging plcAnnual report 2012
Business review
16-45
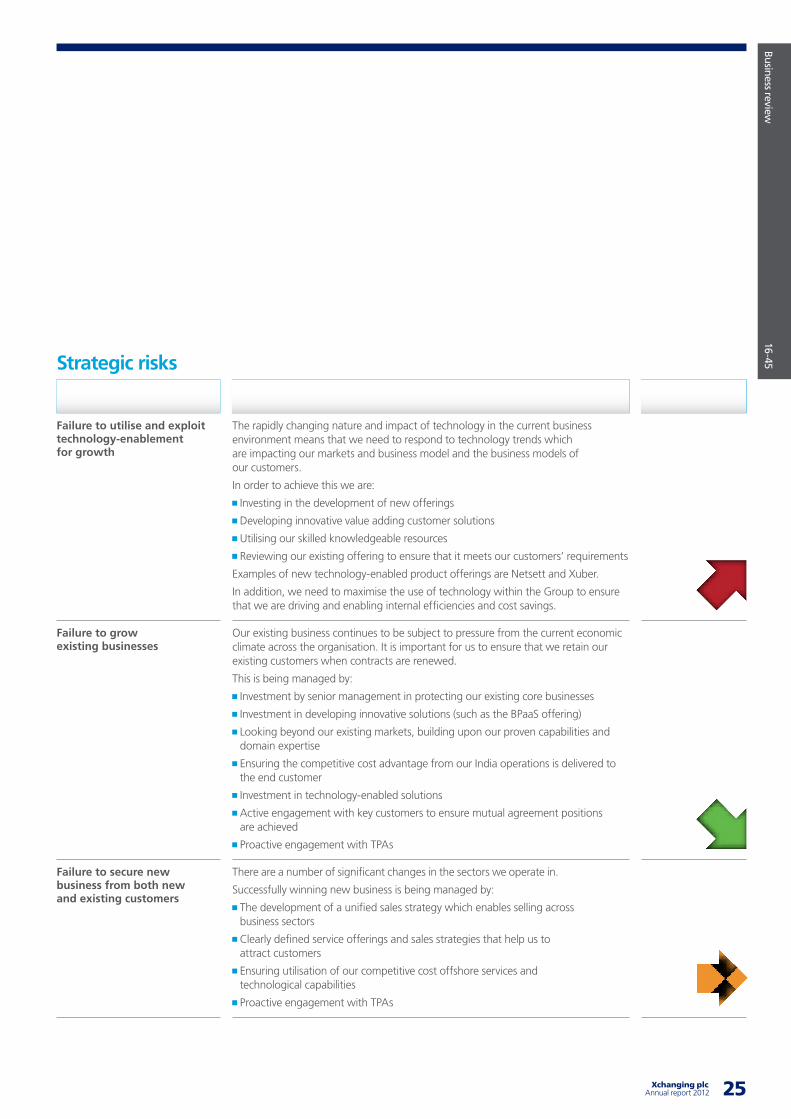
Key risk Commentary and mitigating plan Risk change in year
Failure to utilise and exploit technology-enablement for growth
The rapidly changing nature and impact of technology in the current business environment means that we need to respond to technology trends which are impacting our markets and business model and the business models of our customers.
In order to achieve this we are:
Investing in the development of new offerings
Developing innovative value adding customer solutions
Utilising our skilled knowledgeable resources
Reviewing our existing offering to ensure that it meets our customers’ requirements
Examples of new technology-enabled product offerings are Netsett and Xuber.
In addition, we need to maximise the use of technology within the Group to ensure that we are driving and enabling internal efficiencies and cost savings.
Failure to grow existing businesses
Our existing business continues to be subject to pressure from the current economic climate across the organisation. It is important for us to ensure that we retain our existing customers when contracts are renewed.
This is being managed by:
Investment by senior management in protecting our existing core businesses
Investment in developing innovative solutions (such as the BPaaS offering)
Looking beyond our existing markets, building upon our proven capabilities and domain expertise
Ensuring the competitive cost advantage from our India operations is delivered to the end customer
Investment in technology-enabled solutions
Active engagement with key customers to ensure mutual agreement positions are achieved
Proactive engagement with TPAs
Failure to secure new business from both new and existing customers
There are a number of significant changes in the sectors we operate in.
Successfully winning new business is being managed by:
The development of a unified sales strategy which enables selling across business sectors
Clearly defined service offerings and sales strategies that help us to attract customers
Ensuring utilisation of our competitive cost offshore services and technological capabilities
Proactive engagement with TPAs
Strategic risks
26 Xchanging plc Annual report 2012 27
Principal risks and uncertainties continued
Key risk Commentary and mitigating plan Risk change in year
Key risk Commentary and mitigating plan Risk change in year
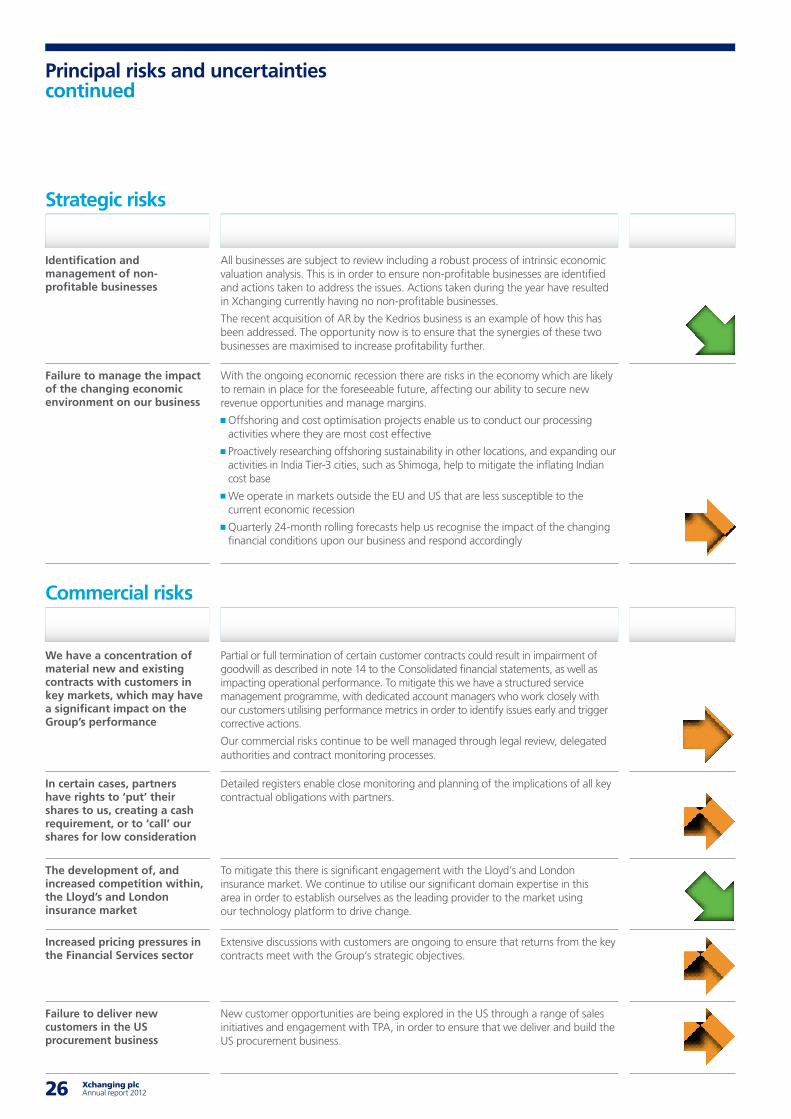
Identification and management of non-profitable businesses
All businesses are subject to review including a robust process of intrinsic economic valuation analysis. This is in order to ensure non-profitable businesses are identified and actions taken to address the issues. Actions taken during the year have resulted in Xchanging currently having no non-profitable businesses.
The recent acquisition of AR by the Kedrios business is an example of how this has been addressed. The opportunity now is to ensure that the synergies of these two businesses are maximised to increase profitability further.
Failure to manage the impact of the changing economic environment on our business
With the ongoing economic recession there are risks in the economy which are likely to remain in place for the foreseeable future, affecting our ability to secure new revenue opportunities and manage margins. Offshoring and cost optimisation projects enable us to conduct our processing activities where they are most cost effective Proactively researching offshoring sustainability in other locations, and expanding our activities in India Tier-3 cities, such as Shimoga, help to mitigate the inflating Indian cost base We operate in markets outside the EU and US that are less susceptible to the current economic recession Quarterly 24-month rolling forecasts help us recognise the impact of the changing financial conditions upon our business and respond accordingly
We have a concentration of material new and existing contracts with customers in key markets, which may have a significant impact on the Group’s performance
Partial or full termination of certain customer contracts could result in impairment of goodwill as described in note 14 to the Consolidated financial statements, as well as impacting operational performance. To mitigate this we have a structured service management programme, with dedicated account managers who work closely with our customers utilising performance metrics in order to identify issues early and trigger corrective actions.
Our commercial risks continue to be well managed through legal review, delegated authorities and contract monitoring processes.
In certain cases, partners have rights to ‘put’ their shares to us, creating a cash requirement, or to ‘call’ our shares for low consideration
Detailed registers enable close monitoring and planning of the implications of all key contractual obligations with partners.
The development of, and increased competition within, the Lloyd’s and London insurance market
To mitigate this there is significant engagement with the Lloyd’s and London insurance market. We continue to utilise our significant domain expertise in this area in order to establish ourselves as the leading provider to the market using our technology platform to drive change.
Increased pricing pressures in the Financial Services sector
Extensive discussions with customers are ongoing to ensure that returns from the key contracts meet with the Group’s strategic objectives.
Failure to deliver new customers in the US procurement business
New customer opportunities are being explored in the US through a range of sales initiatives and engagement with TPA, in order to ensure that we deliver and build the US procurement business.
Strategic risks
Commercial risks
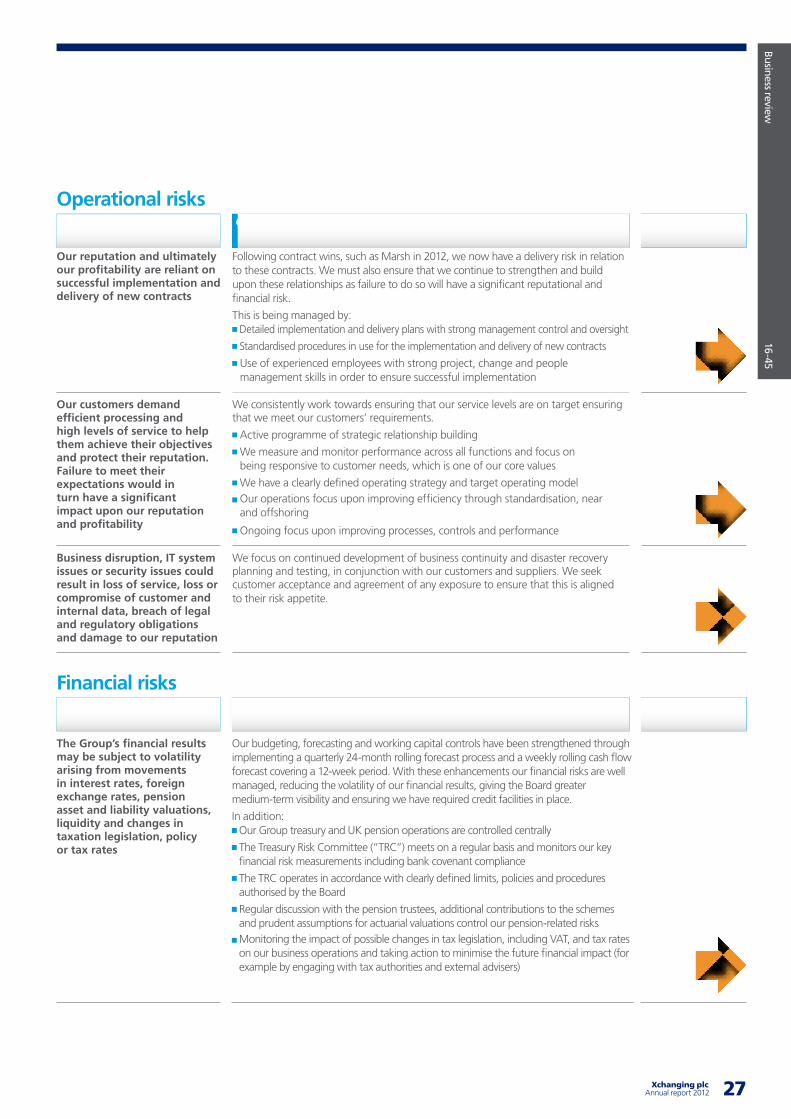
27 Xchanging plcAnnual report 2012
Business review
16-45
Key risk Commentary and mitigating plan Risk change in year
Key risk Commentary and mitigating plan Risk change in year
Our reputation and ultimately our profitability are reliant on successful implementation and delivery of new contracts
Following contract wins, such as Marsh in 2012, we now have a delivery risk in relation to these contracts. We must also ensure that we continue to strengthen and build upon these relationships as failure to do so will have a significant reputational and financial risk.
This is being managed by: Detailed implementation and delivery plans with strong management control and oversight Standardised procedures in use for the implementation and delivery of new contracts Use of experienced employees with strong project, change and people management skills in order to ensure successful implementation
Our customers demand efficient processing and high levels of service to help them achieve their objectives and protect their reputation. Failure to meet their expectations would in turn have a significant impact upon our reputation and profitability
We consistently work towards ensuring that our service levels are on target ensuring that we meet our customers’ requirements. Active programme of strategic relationship building We measure and monitor performance across all functions and focus on being responsive to customer needs, which is one of our core values We have a clearly defined operating strategy and target operating model Our operations focus upon improving efficiency through standardisation, near and offshoring
Ongoing focus upon improving processes, controls and performance
Business disruption, IT system issues or security issues could result in loss of service, loss or compromise of customer and internal data, breach of legal and regulatory obligations and damage to our reputation
We focus on continued development of business continuity and disaster recovery planning and testing, in conjunction with our customers and suppliers. We seek customer acceptance and agreement of any exposure to ensure that this is aligned to their risk appetite.
The Group’s financial results may be subject to volatility arising from movements in interest rates, foreign exchange rates, pension asset and liability valuations, liquidity and changes in taxation legislation, policy or tax rates
Our budgeting, forecasting and working capital controls have been strengthened through implementing a quarterly 24-month rolling forecast process and a weekly rolling cash flow forecast covering a 12-week period. With these enhancements our financial risks are well managed, reducing the volatility of our financial results, giving the Board greater medium-term visibility and ensuring we have required credit facilities in place.
In addition: Our Group treasury and UK pension operations are controlled centrally The Treasury Risk Committee (“TRC”) meets on a regular basis and monitors our key financial risk measurements including bank covenant compliance The TRC operates in accordance with clearly defined limits, policies and procedures authorised by the Board Regular discussion with the pension trustees, additional contributions to the schemes and prudent assumptions for actuarial valuations control our pension-related risks Monitoring the impact of possible changes in tax legislation, including VAT, and tax rates on our business operations and taking action to minimise the future financial impact (for example by engaging with tax authorities and external advisers)
Operational risks
Financial risks
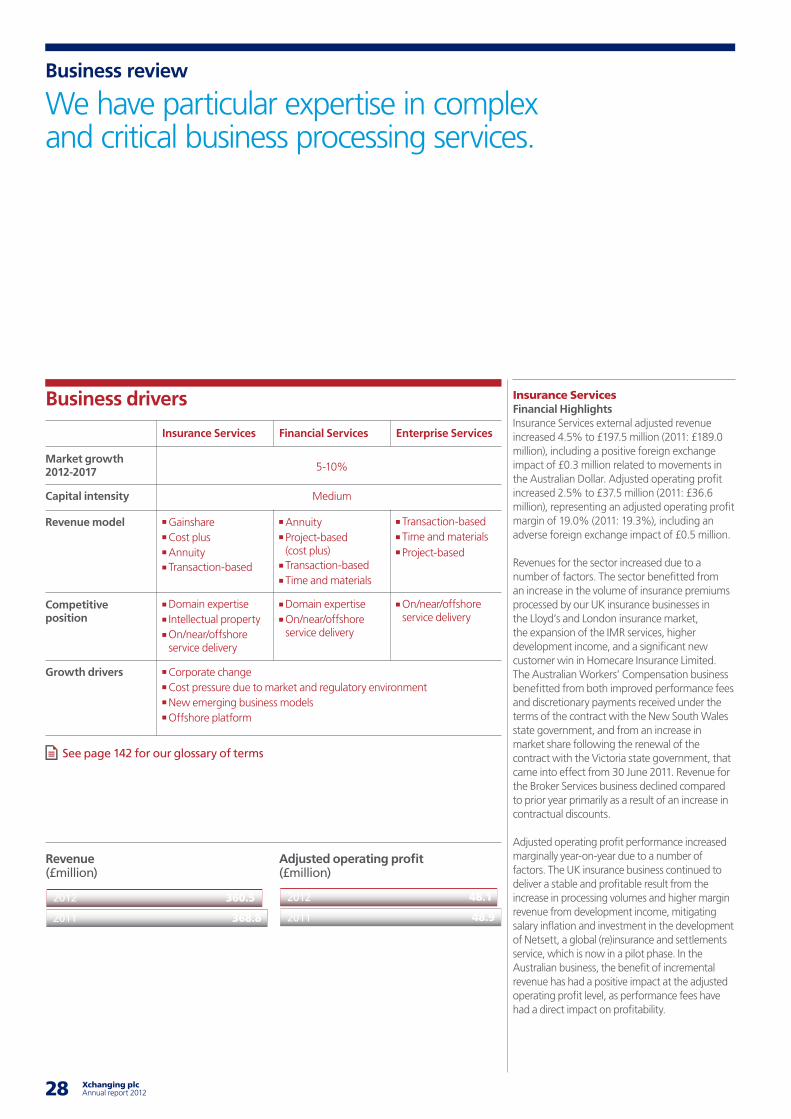
28 Xchanging plc Annual report 2012 29
Business review
We have particular expertise in complex and critical business processing services.
Insurance ServicesFinancial Highlights Insurance Services external adjusted revenue increased 4.5% to £197.5 million (2011: £189.0 million), including a positive foreign exchange impact of £0.3 million related to movements in the Australian Dollar. Adjusted operating profit increased 2.5% to £37.5 million (2011: £36.6 million), representing an adjusted operating profit margin of 19.0% (2011: 19.3%), including an adverse foreign exchange impact of £0.5 million.
Revenues for the sector increased due to a number of factors. The sector benefitted from an increase in the volume of insurance premiums processed by our UK insurance businesses in the Lloyd’s and London insurance market, the expansion of the IMR services, higher development income, and a significant new customer win in Homecare Insurance Limited. The Australian Workers’ Compensation business benefitted from both improved performance fees and discretionary payments received under the terms of the contract with the New South Wales state government, and from an increase in market share following the renewal of the contract with the Victoria state government, that came into effect from 30 June 2011. Revenue for the Broker Services business declined compared to prior year primarily as a result of an increase in contractual discounts.
Adjusted operating profit performance increased marginally year-on-year due to a number of factors. The UK insurance business continued to deliver a stable and profitable result from the increase in processing volumes and higher margin revenue from development income, mitigating salary inflation and investment in the development of Netsett, a global (re)insurance and settlements service, which is now in a pilot phase. In the Australian business, the benefit of incremental revenue has had a positive impact at the adjusted operating profit level, as performance fees have had a direct impact on profitability.
Insurance Services Financial Services Enterprise Services
Gainshare Cost plus Annuity Transaction-based
Annuity Project-based (cost plus) Transaction-based Time and materials
Transaction-based Time and materials Project-based
5-10%
Medium
Domain expertise Intellectual property On/near/offshore service delivery
Domain expertise On/near/offshore service delivery
On/near/offshore service delivery
Corporate change Cost pressure due to market and regulatory environment New emerging business models Offshore platform
Market growth 2012-2017
Capital intensity
Revenue model
Competitive position
Growth drivers
Business drivers
Revenue (£million)
Adjusted operating profit (£million)
See page 142 for our glossary of terms
360.5
368.8
2012
2011
48.1
48.9
2012
2011
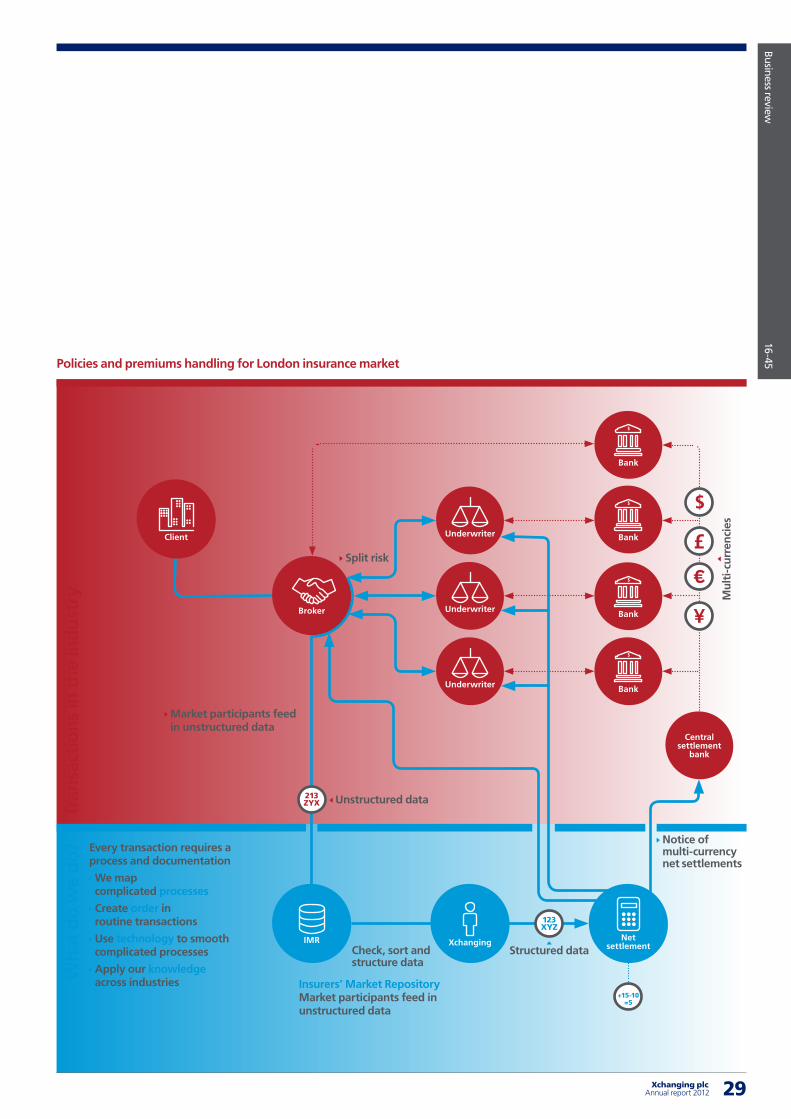
29 Xchanging plcAnnual report 2012
Business review
16-45Policies and premiums handling for London insurance market
+15-10=5
Central settlement
bank
Every transaction requires a process and documentation
We map complicated processes
Create order in routine transactions
Use technology to smooth complicated processes
Apply our knowledge across industries Insurers’ Market Repository
Market participants feed in unstructured data
Structured dataCheck, sort and structure data
Unstructured data
Market participants feed in unstructured data
Notice of multi-currency net settlements
Split risk
Mul
ti-c
urre
nci
es
Broker
IMR Xchanging
Client
Bank
Bank
Bank
BankUnderwriter
Underwriter
Underwriter
Net settlement
Wha
t do
we
do?
Tran
sact
ions
in t
he in
dust
ry
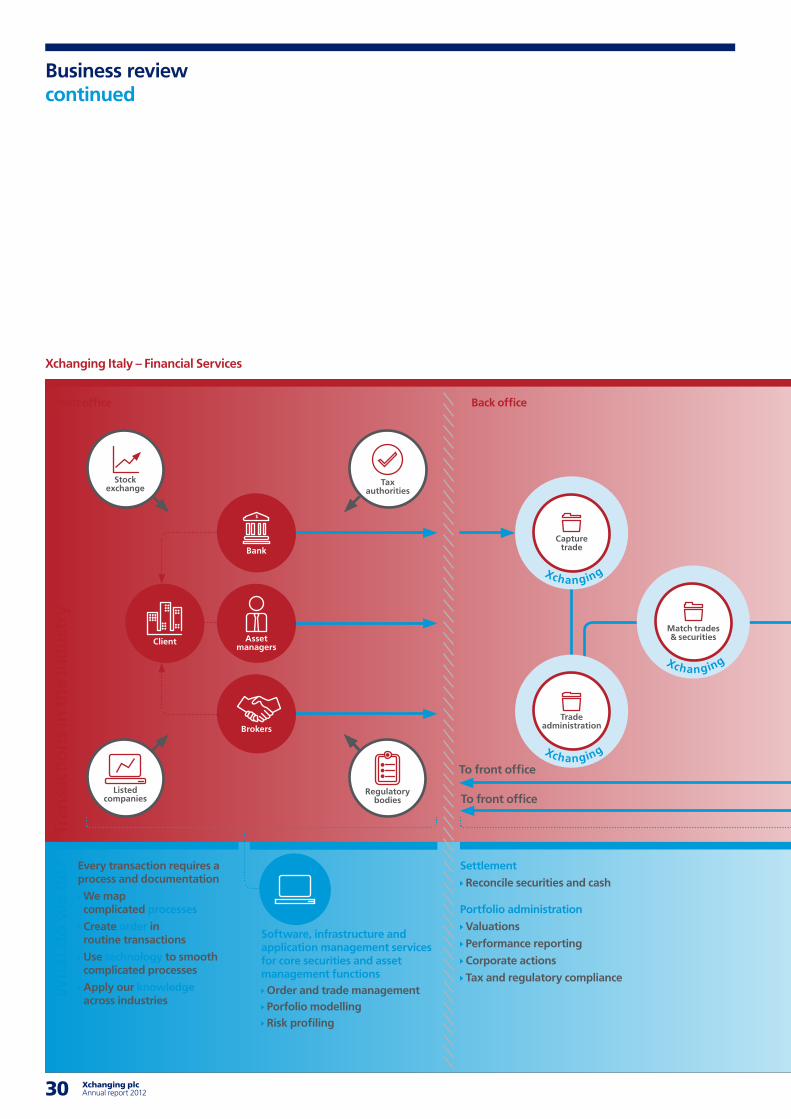
30 Xchanging plc Annual report 2012 31
Business reviewcontinued
Xchanging Italy – Financial Services
Tran
sact
ions
in t
he in
dust
ry
Every transaction requires a process and documentation
We map complicated processes
Create order in routine transactions
Use technology to smooth complicated processes
Apply our knowledge across industries
Settlement
Reconcile securities and cash
Portfolio administration
Valuations
Performance reporting
Corporate actions
Tax and regulatory compliance
Wha
t do
we
do?
Front office Back office
Listed companies
Stock exchange
To front office
To front office
Software, infrastructure and application management services for core securities and asset management functions Order and trade management Porfolio modelling Risk profiling
Client Asset managers
Brokers
Bank
Regulatory bodies
Xchanging
Capture trade
Xchanging
Xchanging
Match trades & securities
Trade administration
Tax authorities
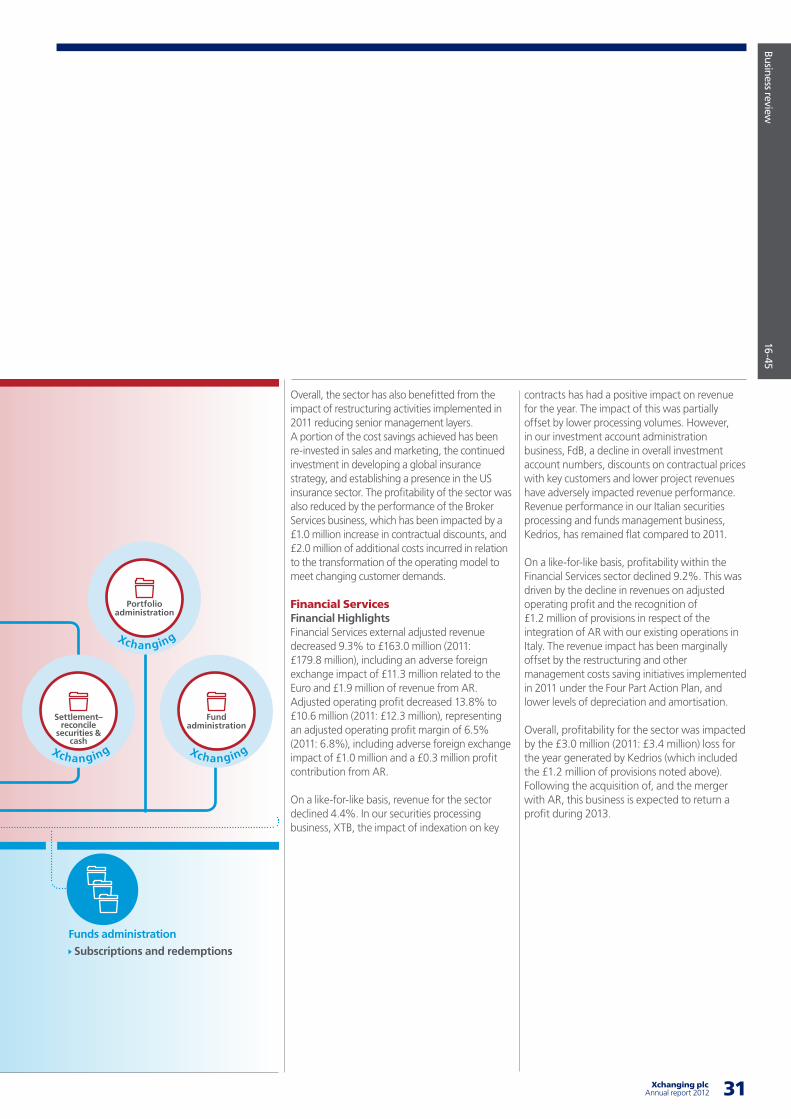
31 Xchanging plcAnnual report 2012
Business review
16-45
contracts has had a positive impact on revenue for the year. The impact of this was partially offset by lower processing volumes. However, in our investment account administration business, FdB, a decline in overall investment account numbers, discounts on contractual prices with key customers and lower project revenues have adversely impacted revenue performance. Revenue performance in our Italian securities processing and funds management business, Kedrios, has remained flat compared to 2011.
On a like-for-like basis, profitability within the Financial Services sector declined 9.2%. This was driven by the decline in revenues on adjusted operating profit and the recognition of £1.2 million of provisions in respect of the integration of AR with our existing operations in Italy. The revenue impact has been marginally offset by the restructuring and other management costs saving initiatives implemented in 2011 under the Four Part Action Plan, and lower levels of depreciation and amortisation.
Overall, profitability for the sector was impacted by the £3.0 million (2011: £3.4 million) loss for the year generated by Kedrios (which included the £1.2 million of provisions noted above). Following the acquisition of, and the merger with AR, this business is expected to return a profit during 2013.
Overall, the sector has also benefitted from the impact of restructuring activities implemented in 2011 reducing senior management layers. A portion of the cost savings achieved has been re-invested in sales and marketing, the continued investment in developing a global insurance strategy, and establishing a presence in the US insurance sector. The profitability of the sector was also reduced by the performance of the Broker Services business, which has been impacted by a £1.0 million increase in contractual discounts, and £2.0 million of additional costs incurred in relation to the transformation of the operating model to meet changing customer demands.
Financial ServicesFinancial HighlightsFinancial Services external adjusted revenue decreased 9.3% to £163.0 million (2011: £179.8 million), including an adverse foreign exchange impact of £11.3 million related to the Euro and £1.9 million of revenue from AR. Adjusted operating profit decreased 13.8% to £10.6 million (2011: £12.3 million), representing an adjusted operating profit margin of 6.5% (2011: 6.8%), including adverse foreign exchange impact of £1.0 million and a £0.3 million profit contribution from AR.
On a like-for-like basis, revenue for the sector declined 4.4%. In our securities processing business, XTB, the impact of indexation on key
Funds administration
Subscriptions and redemptions
Xchanging
Xchanging
Xchanging
Portfolio administration
Fund administration
Settlement– reconcile
securities & cash
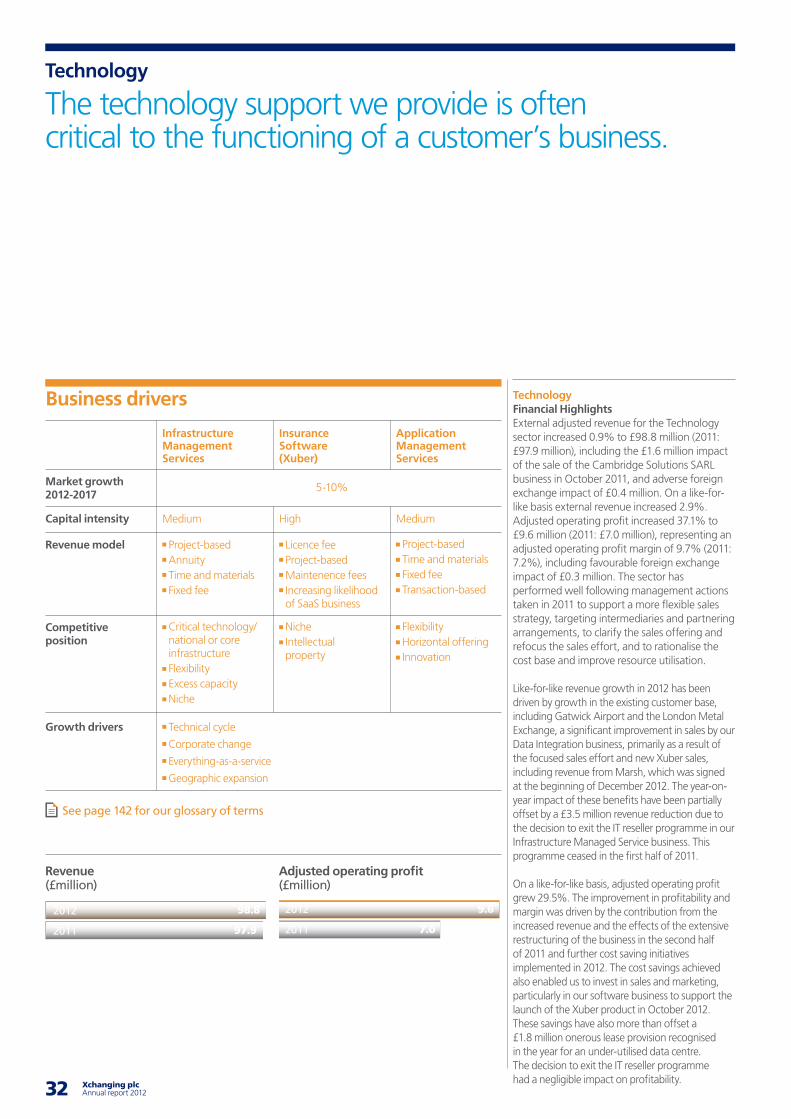
32 Xchanging plc Annual report 2012 33
Technology
The technology support we provide is often critical to the functioning of a customer’s business.
Revenue (£million)
Adjusted operating profit (£million)
TechnologyFinancial HighlightsExternal adjusted revenue for the Technology sector increased 0.9% to £98.8 million (2011: £97.9 million), including the £1.6 million impact of the sale of the Cambridge Solutions SARL business in October 2011, and adverse foreign exchange impact of £0.4 million. On a like-for-like basis external revenue increased 2.9%. Adjusted operating profit increased 37.1% to £9.6 million (2011: £7.0 million), representing an adjusted operating profit margin of 9.7% (2011: 7.2%), including favourable foreign exchange impact of £0.3 million. The sector has performed well following management actions taken in 2011 to support a more flexible sales strategy, targeting intermediaries and partnering arrangements, to clarify the sales offering and refocus the sales effort, and to rationalise the cost base and improve resource utilisation.
Like-for-like revenue growth in 2012 has been driven by growth in the existing customer base, including Gatwick Airport and the London Metal Exchange, a significant improvement in sales by our Data Integration business, primarily as a result of the focused sales effort and new Xuber sales, including revenue from Marsh, which was signed at the beginning of December 2012. The year-on-year impact of these benefits have been partially offset by a £3.5 million revenue reduction due to the decision to exit the IT reseller programme in our Infrastructure Managed Service business. This programme ceased in the first half of 2011.
On a like-for-like basis, adjusted operating profit grew 29.5%. The improvement in profitability and margin was driven by the contribution from the increased revenue and the effects of the extensive restructuring of the business in the second half of 2011 and further cost saving initiatives implemented in 2012. The cost savings achieved also enabled us to invest in sales and marketing, particularly in our software business to support the launch of the Xuber product in October 2012. These savings have also more than offset a £1.8 million onerous lease provision recognised in the year for an under-utilised data centre. The decision to exit the IT reseller programme had a negligible impact on profitability.
Infrastructure Management Services
Insurance Software (Xuber)
Application Management Services
Project-based Annuity Time and materials Fixed fee
Licence fee Project-based Maintenence fees Increasing likelihood of SaaS business
Project-based Time and materials Fixed fee Transaction-based
5-10%
Medium High Medium
Critical technology/national or core infrastructure Flexibility Excess capacity Niche
Niche Intellectual property
Flexibility Horizontal offering Innovation
Technical cycle Corporate change Everything-as-a-service Geographic expansion
Market growth 2012-2017
Capital intensity
Revenue model
Competitive position
Growth drivers
Business drivers
See page 142 for our glossary of terms
98.8
97.9
2012
2011
9.6
7.0
2012
2011
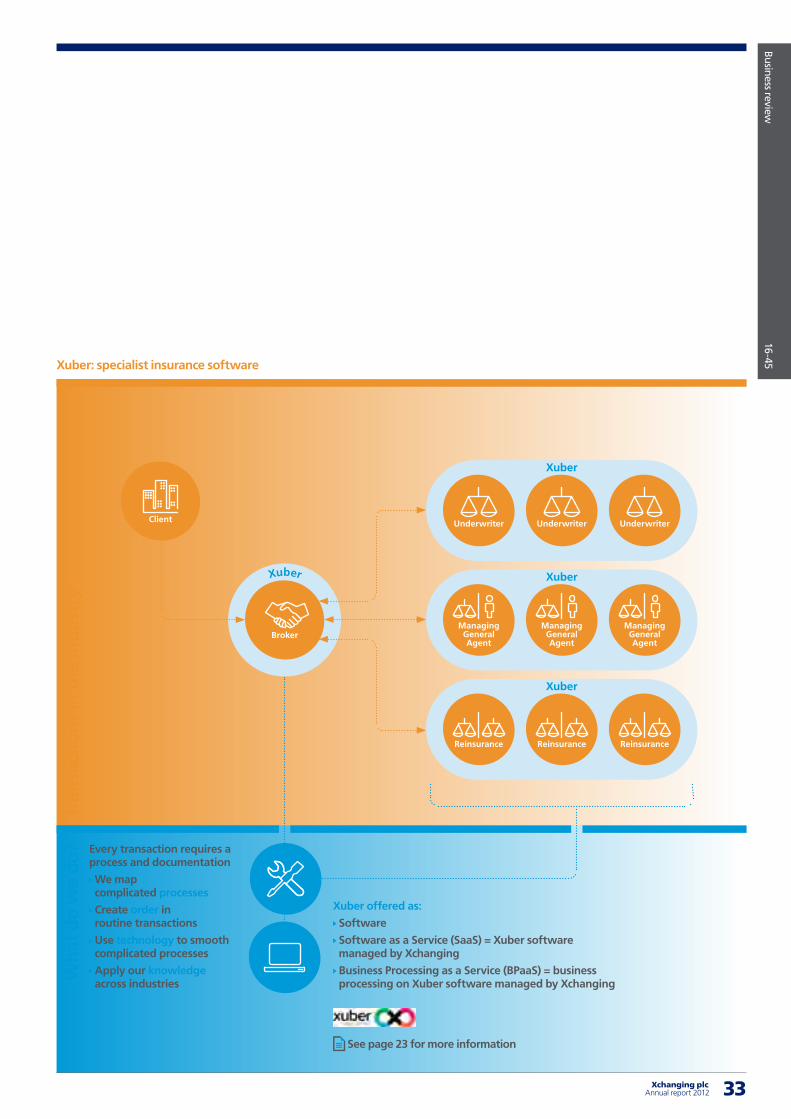
33 Xchanging plcAnnual report 2012
Business review
16-45
Every transaction requires a process and documentation
We map complicated processes
Create order in routine transactions
Use technology to smooth complicated processes
Apply our knowledge across industries
Xuber: specialist insurance software
Xuber
Xuber
Xuber
Xuber
Xuber offered as:
Software
Software as a Service (SaaS) = Xuber software managed by Xchanging
Business Processing as a Service (BPaaS) = business processing on Xuber software managed by Xchanging
See page 23 for more information
Broker
Client Underwriter Underwriter Underwriter
Managing General Agent
Managing General Agent
Managing General Agent
Reinsurance Reinsurance Reinsurance
Tran
sact
ions
in t
he in
dust
ryW
hat
do w
e do
?
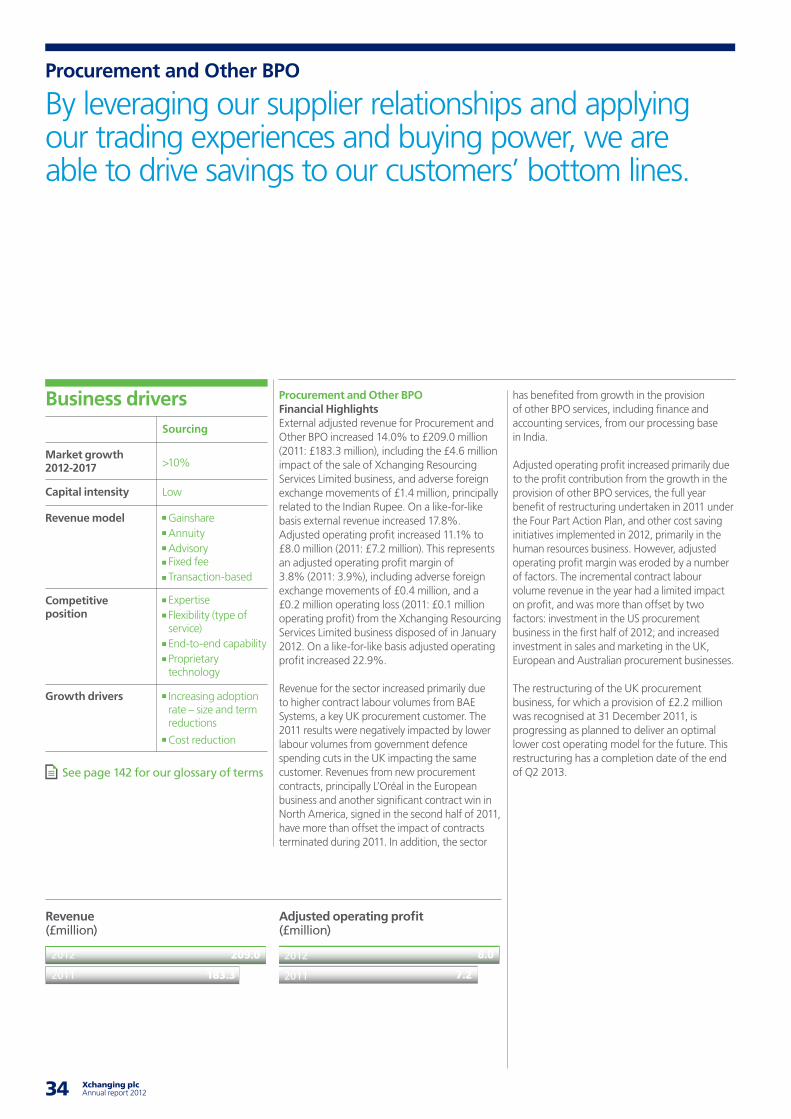
34 Xchanging plc Annual report 2012 35
Procurement and Other BPO
By leveraging our supplier relationships and applying our trading experiences and buying power, we are able to drive savings to our customers’ bottom lines.
Revenue (£million)
Adjusted operating profit (£million)
209.0
183.3
2012
2011
8.0
7.2
2012
2011
Procurement and Other BPOFinancial HighlightsExternal adjusted revenue for Procurement and Other BPO increased 14.0% to £209.0 million (2011: £183.3 million), including the £4.6 million impact of the sale of Xchanging Resourcing Services Limited business, and adverse foreign exchange movements of £1.4 million, principally related to the Indian Rupee. On a like-for-like basis external revenue increased 17.8%. Adjusted operating profit increased 11.1% to £8.0 million (2011: £7.2 million). This represents an adjusted operating profit margin of 3.8% (2011: 3.9%), including adverse foreign exchange movements of £0.4 million, and a £0.2 million operating loss (2011: £0.1 million operating profit) from the Xchanging Resourcing Services Limited business disposed of in January 2012. On a like-for-like basis adjusted operating profit increased 22.9%.
Revenue for the sector increased primarily due to higher contract labour volumes from BAE Systems, a key UK procurement customer. The 2011 results were negatively impacted by lower labour volumes from government defence spending cuts in the UK impacting the same customer. Revenues from new procurement contracts, principally L’Oréal in the European business and another significant contract win in North America, signed in the second half of 2011, have more than offset the impact of contracts terminated during 2011. In addition, the sector
has benefited from growth in the provision of other BPO services, including finance and accounting services, from our processing base in India.
Adjusted operating profit increased primarily due to the profit contribution from the growth in the provision of other BPO services, the full year benefit of restructuring undertaken in 2011 under the Four Part Action Plan, and other cost saving initiatives implemented in 2012, primarily in the human resources business. However, adjusted operating profit margin was eroded by a number of factors. The incremental contract labour volume revenue in the year had a limited impact on profit, and was more than offset by two factors: investment in the US procurement business in the first half of 2012; and increased investment in sales and marketing in the UK, European and Australian procurement businesses.
The restructuring of the UK procurement business, for which a provision of £2.2 million was recognised at 31 December 2011, is progressing as planned to deliver an optimal lower cost operating model for the future. This restructuring has a completion date of the end of Q2 2013.
Sourcing
Gainshare Annuity Advisory Fixed fee Transaction-based
>10%
Low
Expertise Flexibility (type of service) End-to-end capability Proprietary technology
Increasing adoption rate – size and term reductions Cost reduction
Market growth 2012-2017
Capital intensity
Revenue model
Competitive position
Growth drivers
Business drivers
See page 142 for our glossary of terms
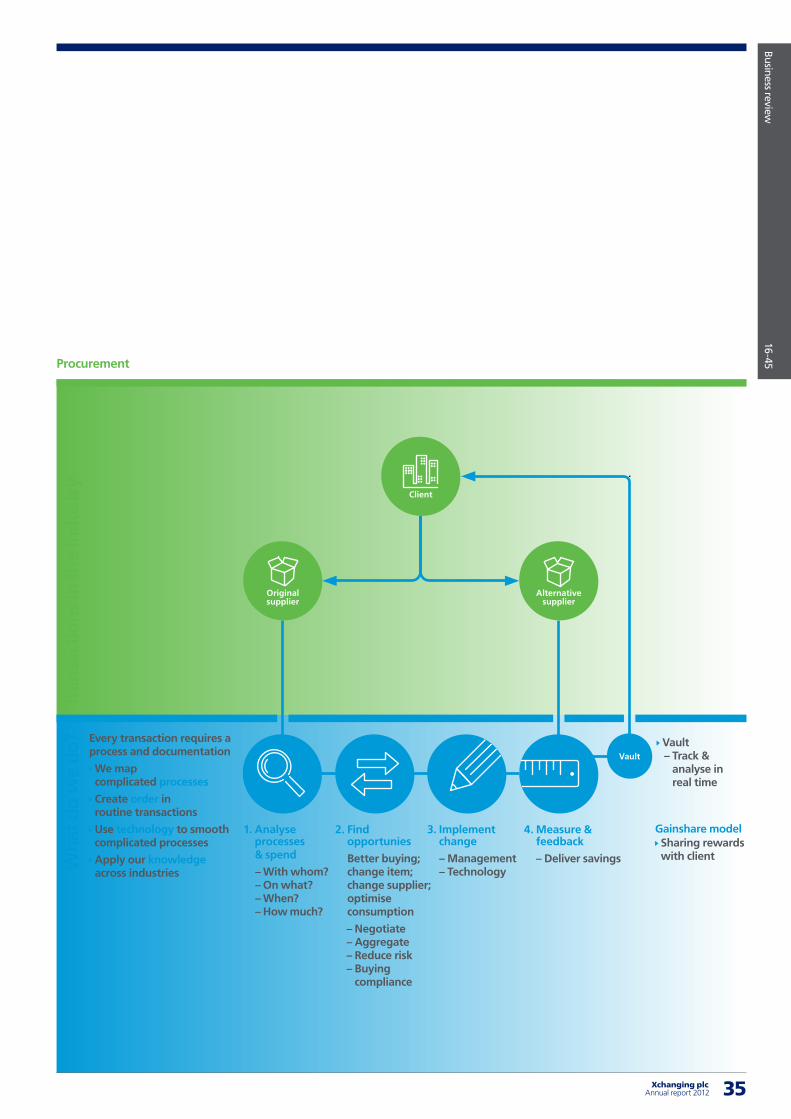
35 Xchanging plcAnnual report 2012
Business review
16-45
Tran
sact
ions
in t
he in
dust
ry
Every transaction requires a process and documentation
We map complicated processes
Create order in routine transactions
Use technology to smooth complicated processes
Apply our knowledge across industries
Vault
Wha
t do
we
do?
Procurement
4. Measure & feedback
– Deliver savings
2. Find opportunies
Better buying; change item; change supplier; optimise consumption
– Negotiate – Aggregate– Reduce risk– Buying
compliance
3. Implement change
– Management – Technology
1. Analyse processes & spend
– With whom? – On what? – When? – How much?
Gainshare model Sharing rewards with client
Vault– Track &
analyse in real time
Alternative supplier
Original supplier
Client
36 Xchanging plc Annual report 2012 37
Financial review
In 2012, we met our objective of delivering year-on-year improvement in financial performance. The financial disciplines we have established and the strong cash flow we have generated mean we are able to invest to grow our business and reinstate the dividend.
Group financial performance summaryIn the year ended 31 December 2012, the Group achieved improvement across all KPIs from continuing operations compared to the prior year.
The Group’s adjusted KPIs are calculated after adding back a number of non-cash, acquisition-related items, exceptional items and movements in customer cash accounts held by FdB, as noted below, in order to present the underlying performance of the business.
All numbers presented, unless stated otherwise, are from continuing operations only.
Group performanceAdjusted revenue Adjusted revenue from continuing operations for the year ended 31 December 2012 was £668.3 million (2011: £650.0 million). In 2011, there was also £1.2 million of exceptional revenue recognised in respect of contract settlements within the Financial Services sector.
Organic revenue was £666.2 million, an increase of 5.6% on a like-for-like basis. Organic revenue growth excludes adverse currency movements of £12.7 million, primarily related to the Euro, £1.9 million of revenue from AR, acquired in November 2012, and £0.1 million (2011: £6.2 million) relating to the impact of disposals in 2011 and 2012, which did not represent discontinued operations.
The increase in organic revenue was driven by higher UK, European and US, procurement revenues, higher Insurance Services revenues and higher revenues in our Technology business. These were partially offset by lower revenues in the Financial Services sector.
Adjusted operating profit Adjusted operating profit from continuing operations was £50.4 million (2011: £43.2 million). On a like-for-like basis, adjusted operating profit increased 19.8%. Organic growth excludes adverse currency movements of £1.6 million, primarily relating to the Euro and
Indian Rupee, £0.3 million of profit contribution from AR, and £0.2 million (2011: £nil) relating to the impact of disposals in 2011 and 2012, which did not represent discontinued operations.
The organic increase in adjusted operating profit was primarily driven by the full year impact of cost saving initiatives across the Group, a reduction in depreciation and amortisation, and, to a smaller extent, an increase in higher margin revenues within the Insurance Services sector. These benefits have partially offset the investment in the US procurement business, and an investment in our sales and marketing capabilities.
Statutory operating profit from continuing operations increased to £46.0 million (2011: £6.6 million). Statutory operating profit includes the following: amortisation of acquired intangibles of £4.0 million (2011: £4.8 million); and
acquisition-related expenses of £0.4 million (2011: £nil).
In 2011, statutory operating profit also included net exceptional costs of £31.8 million related to restructuring costs of £18.4 million incurred in respect of the Four Part Action Plan, impairment of goodwill, intangibles and other assets of £14.6 million and contract settlement income of £1.2 million.
The table opposite sets out the reconciliation from statutory to adjusted operating profit for continuing operations.
Xchanging’s share of adjusted operating profit for the year from continuing operations was £38.4 million (2011: £33.0 million).
Acquisition and acquisition-related expensesOn 7 November 2012, the Group acquired 98.7% of the share capital of AR, a provider of software packages and comprehensive IT solutions for the securities brokerage and asset management industry in Italy, with a customer base comprising more than 100 leading
financial institutions. On 1 February 2013, AR has been merged with our pre-existing Italian business, Kedrios, and the joint company will operate under the name of Xchanging Italy S.p.A.
The Group recorded acquisition-related expenses of £0.7 million (2011: £nil), of which £0.4 million are recognised within administrative expenses and £0.3 million are recognised within finance costs, relating to this acquisition.
MarginsAdjusted operating profit margin for continuing operations improved 90 bps from 6.6% for the year ended 31 December 2011 to 7.5% for the year ended 31 December 2012. This was driven by an increase in margin in the Technology sector, and a reduction in Corporate costs as a result of the cost saving initiatives implemented in 2011. Margins in the Insurance Services, Financial Services and Procurement and Other BPO sectors declined in the year. Please refer to the Business Review on pages 28 to 35 for sector analyses.
Non-controlling interestsNon-controlling interest calculations for the Group’s non-100% owned subsidiaries are dependent upon individual contractual terms. Some define adjustments in relation to certain items prior to calculating profit share based on the percentage share ownerships. These may include, for example, adjustments for differences between local and international accounting standards, and adjustments for any discounts or fees payable between parties.
In 2012, the adjusted profit after tax for total operations attributable to non-controlling interests was £6.3 million (2011: £4.8 million). The increase in the adjusted profit after tax for total operations attributable to non-controlling interests is due to the improved profit performance in the Enterprise Partnerships with the Lloyd’s and London insurance market, and the reduction in the loss generated by Kedrios, partially offset by an increase in the reversal of profit under IFRS in the securities
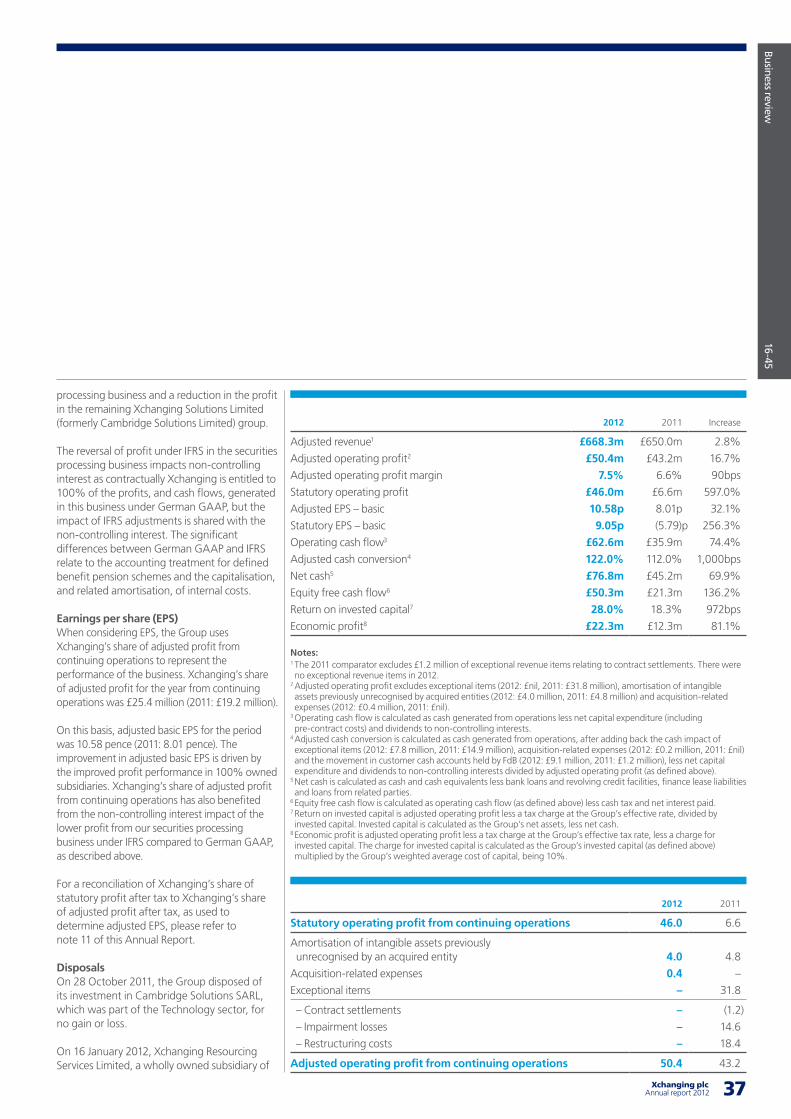
37 Xchanging plcAnnual report 2012
Business review
16-45
processing business and a reduction in the profit in the remaining Xchanging Solutions Limited (formerly Cambridge Solutions Limited) group.
The reversal of profit under IFRS in the securities processing business impacts non-controlling interest as contractually Xchanging is entitled to 100% of the profits, and cash flows, generated in this business under German GAAP, but the impact of IFRS adjustments is shared with the non-controlling interest. The significant differences between German GAAP and IFRS relate to the accounting treatment for defined benefit pension schemes and the capitalisation, and related amortisation, of internal costs.
Earnings per share (EPS)When considering EPS, the Group uses Xchanging’s share of adjusted profit from continuing operations to represent the performance of the business. Xchanging’s share of adjusted profit for the year from continuing operations was £25.4 million (2011: £19.2 million).
On this basis, adjusted basic EPS for the period was 10.58 pence (2011: 8.01 pence). The improvement in adjusted basic EPS is driven by the improved profit performance in 100% owned subsidiaries. Xchanging’s share of adjusted profit from continuing operations has also benefited from the non-controlling interest impact of the lower profit from our securities processing business under IFRS compared to German GAAP, as described above.
For a reconciliation of Xchanging’s share of statutory profit after tax to Xchanging’s share of adjusted profit after tax, as used to determine adjusted EPS, please refer to note 11 of this Annual Report.
DisposalsOn 28 October 2011, the Group disposed of its investment in Cambridge Solutions SARL, which was part of the Technology sector, for no gain or loss.
On 16 January 2012, Xchanging Resourcing Services Limited, a wholly owned subsidiary of
2012 2011 Increase
Adjusted revenue1 £668.3m £650.0m 2.8%
Adjusted operating profit2 £50.4m £43.2m 16.7%
Adjusted operating profit margin 7.5% 6.6% 90bps
Statutory operating profit £46.0m £6.6m 597.0%
Adjusted EPS – basic 10.58p 8.01p 32.1%
Statutory EPS – basic 9.05p (5.79)p 256.3%
Operating cash flow3 £62.6m £35.9m 74.4%
Adjusted cash conversion4 122.0% 112.0% 1,000bps
Net cash5 £76.8m £45.2m 69.9%
Equity free cash flow6 £50.3m £21.3m 136.2%
Return on invested capital7 28.0% 18.3% 972bps
Economic profit8 £22.3m £12.3m 81.1%
Notes:1 The 2011 comparator excludes £1.2 million of exceptional revenue items relating to contract settlements. There were no exceptional revenue items in 2012.
2 Adjusted operating profit excludes exceptional items (2012: £nil, 2011: £31.8 million), amortisation of intangible assets previously unrecognised by acquired entities (2012: £4.0 million, 2011: £4.8 million) and acquisition-related expenses (2012: £0.4 million, 2011: £nil).
3 Operating cash flow is calculated as cash generated from operations less net capital expenditure (including pre-contract costs) and dividends to non-controlling interests.
4 Adjusted cash conversion is calculated as cash generated from operations, after adding back the cash impact of exceptional items (2012: £7.8 million, 2011: £14.9 million), acquisition-related expenses (2012: £0.2 million, 2011: £nil) and the movement in customer cash accounts held by FdB (2012: £9.1 million, 2011: £1.2 million), less net capital expenditure and dividends to non-controlling interests divided by adjusted operating profit (as defined above).
5 Net cash is calculated as cash and cash equivalents less bank loans and revolving credit facilities, finance lease liabilities and loans from related parties.
6 Equity free cash flow is calculated as operating cash flow (as defined above) less cash tax and net interest paid.7 Return on invested capital is adjusted operating profit less a tax charge at the Group’s effective rate, divided by invested capital. Invested capital is calculated as the Group’s net assets, less net cash.
8 Economic profit is adjusted operating profit less a tax charge at the Group’s effective tax rate, less a charge for invested capital. The charge for invested capital is calculated as the Group’s invested capital (as defined above) multiplied by the Group’s weighted average cost of capital, being 10%.
2012 2011
Statutory operating profit from continuing operations 46.0 6.6
Amortisation of intangible assets previouslyunrecognised by an acquired entity 4.0 4.8
Acquisition-related expenses 0.4 –
Exceptional items – 31.8
– Contract settlements – (1.2)
– Impairment losses – 14.6
– Restructuring costs – 18.4
Adjusted operating profit from continuing operations 50.4 43.2
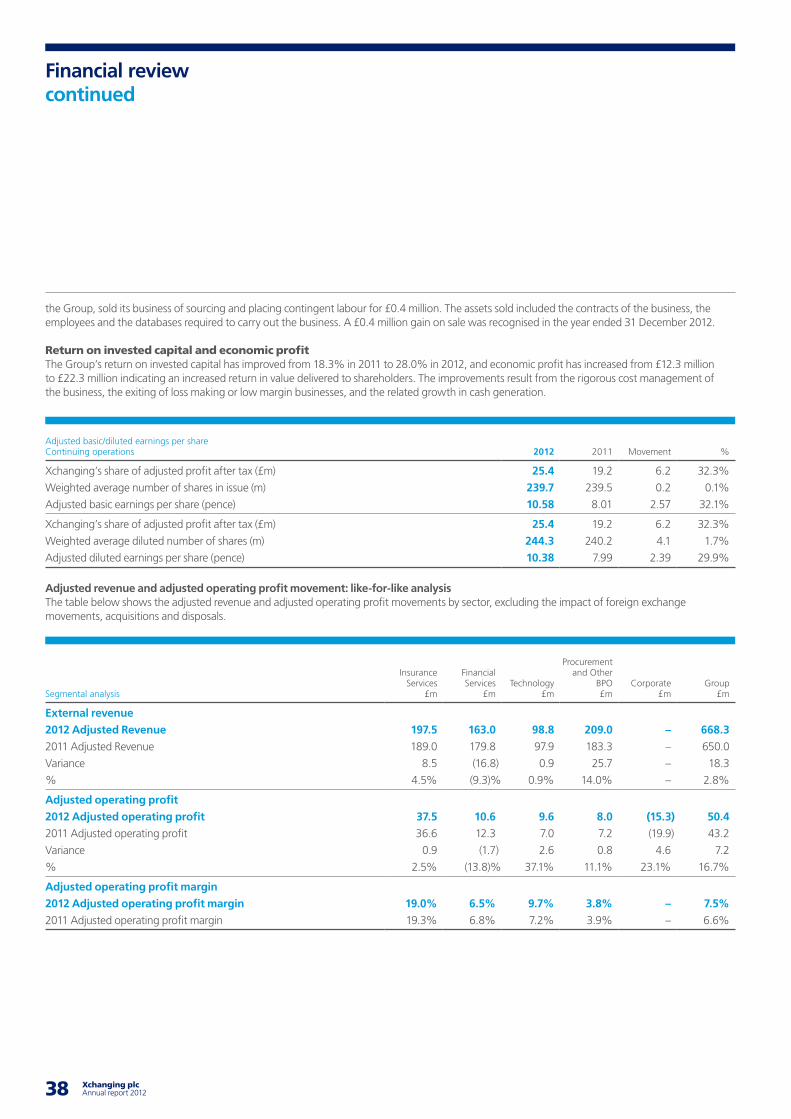
38 Xchanging plc Annual report 2012 39
Financial reviewcontinued
the Group, sold its business of sourcing and placing contingent labour for £0.4 million. The assets sold included the contracts of the business, the employees and the databases required to carry out the business. A £0.4 million gain on sale was recognised in the year ended 31 December 2012.
Return on invested capital and economic profitThe Group’s return on invested capital has improved from 18.3% in 2011 to 28.0% in 2012, and economic profit has increased from £12.3 million to £22.3 million indicating an increased return in value delivered to shareholders. The improvements result from the rigorous cost management of the business, the exiting of loss making or low margin businesses, and the related growth in cash generation.
Adjusted revenue and adjusted operating profit movement: like-for-like analysisThe table below shows the adjusted revenue and adjusted operating profit movements by sector, excluding the impact of foreign exchange movements, acquisitions and disposals.
Adjusted basic/diluted earnings per share Continuing operations 2012 2011 Movement %
Xchanging’s share of adjusted profit after tax (£m) 25.4 19.2 6.2 32.3%
Weighted average number of shares in issue (m) 239.7 239.5 0.2 0.1%
Adjusted basic earnings per share (pence) 10.58 8.01 2.57 32.1%
Xchanging’s share of adjusted profit after tax (£m) 25.4 19.2 6.2 32.3%
Weighted average diluted number of shares (m) 244.3 240.2 4.1 1.7%
Adjusted diluted earnings per share (pence) 10.38 7.99 2.39 29.9%
Segmental analysis
Insurance Services
£m
Financial Services
£mTechnology
£m
Procurement and Other
BPO £m
Corporate £m
Group£m
External revenue
2012 Adjusted Revenue 197.5 163.0 98.8 209.0 – 668.3
2011 Adjusted Revenue 189.0 179.8 97.9 183.3 – 650.0
Variance 8.5 (16.8) 0.9 25.7 – 18.3
% 4.5% (9.3)% 0.9% 14.0% – 2.8%
Adjusted operating profit
2012 Adjusted operating profit 37.5 10.6 9.6 8.0 (15.3) 50.4
2011 Adjusted operating profit 36.6 12.3 7.0 7.2 (19.9) 43.2
Variance 0.9 (1.7) 2.6 0.8 4.6 7.2
% 2.5% (13.8)% 37.1% 11.1% 23.1% 16.7%
Adjusted operating profit margin
2012 Adjusted operating profit margin 19.0% 6.5% 9.7% 3.8% – 7.5%
2011 Adjusted operating profit margin 19.3% 6.8% 7.2% 3.9% – 6.6%
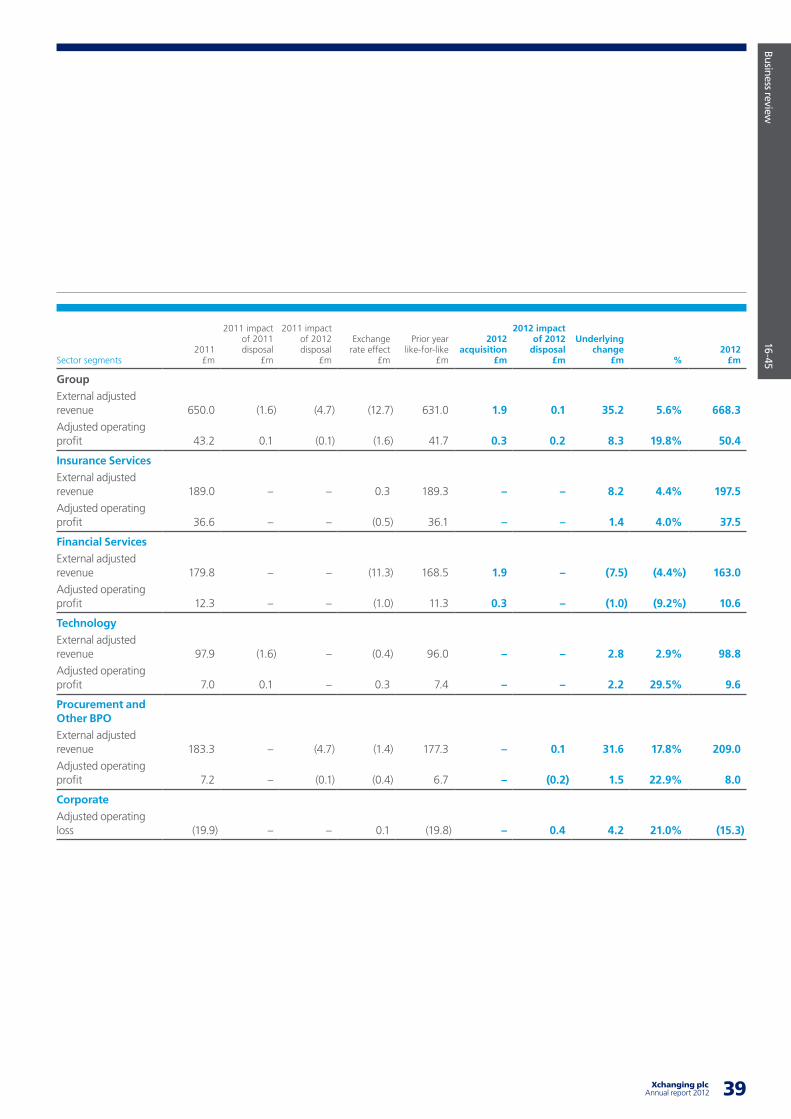
39 Xchanging plcAnnual report 2012
Business review
16-45Sector segments
2011 £m
2011 impact of 2011 disposal
£m
2011 impact of 2012 disposal
£m
Exchange rate effect
£m
Prior year like-for-like
£m
2012 acquisition
£m
2012 impact of 2012
disposal£m
Underlying change
£m %2012
£m
Group
External adjusted revenue 650.0 (1.6) (4.7) (12.7) 631.0 1.9 0.1 35.2 5.6% 668.3
Adjusted operating profit 43.2 0.1 (0.1) (1.6) 41.7 0.3 0.2 8.3 19.8% 50.4
Insurance Services
External adjusted revenue 189.0 – – 0.3 189.3 – – 8.2 4.4% 197.5
Adjusted operating profit 36.6 – – (0.5) 36.1 – – 1.4 4.0% 37.5
Financial Services
External adjusted revenue 179.8 – – (11.3) 168.5 1.9 – (7.5) (4.4%) 163.0
Adjusted operating profit 12.3 – – (1.0) 11.3 0.3 – (1.0) (9.2%) 10.6
Technology
External adjusted revenue 97.9 (1.6) – (0.4) 96.0 – – 2.8 2.9% 98.8
Adjusted operating profit 7.0 0.1 – 0.3 7.4 – – 2.2 29.5% 9.6
Procurement and Other BPO
External adjusted revenue 183.3 – (4.7) (1.4) 177.3 – 0.1 31.6 17.8% 209.0
Adjusted operating profit 7.2 – (0.1) (0.4) 6.7 – (0.2) 1.5 22.9% 8.0
Corporate
Adjusted operating loss (19.9) – – 0.1 (19.8) – 0.4 4.2 21.0% (15.3)
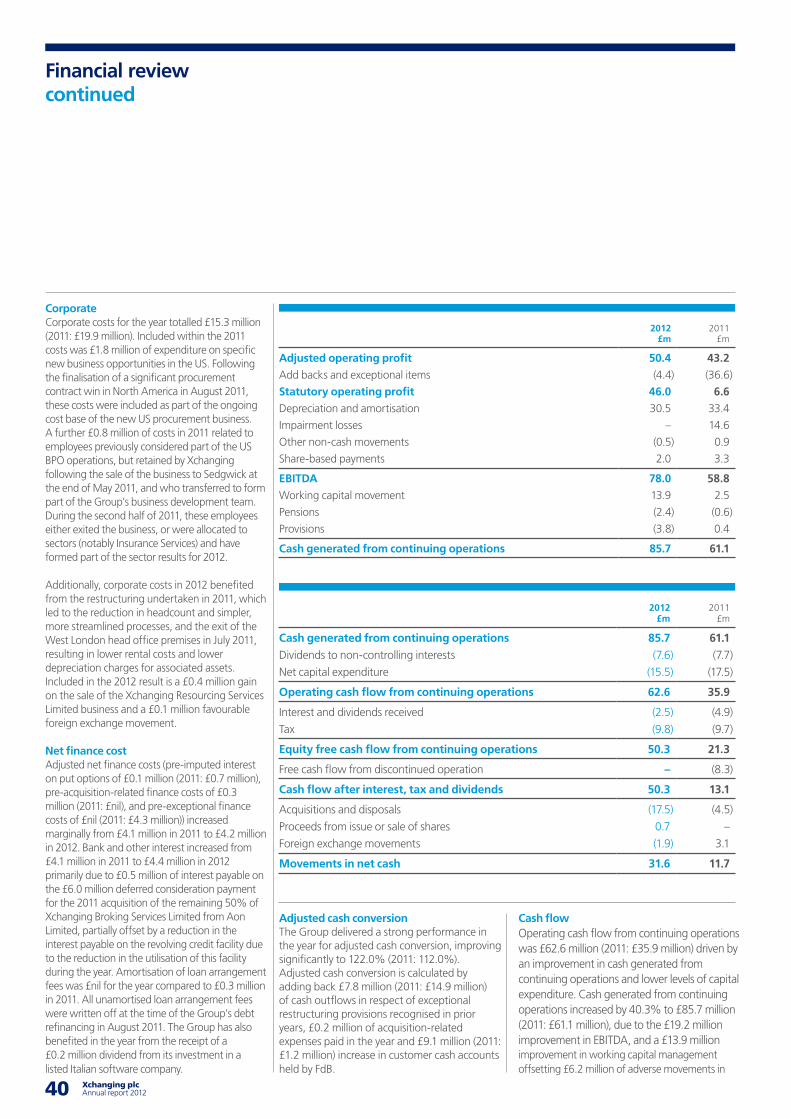
40 Xchanging plc Annual report 2012 41
Financial reviewcontinued
CorporateCorporate costs for the year totalled £15.3 million (2011: £19.9 million). Included within the 2011 costs was £1.8 million of expenditure on specific new business opportunities in the US. Following the finalisation of a significant procurement contract win in North America in August 2011, these costs were included as part of the ongoing cost base of the new US procurement business. A further £0.8 million of costs in 2011 related to employees previously considered part of the US BPO operations, but retained by Xchanging following the sale of the business to Sedgwick at the end of May 2011, and who transferred to form part of the Group’s business development team. During the second half of 2011, these employees either exited the business, or were allocated to sectors (notably Insurance Services) and have formed part of the sector results for 2012.
Additionally, corporate costs in 2012 benefited from the restructuring undertaken in 2011, which led to the reduction in headcount and simpler, more streamlined processes, and the exit of the West London head office premises in July 2011, resulting in lower rental costs and lower depreciation charges for associated assets. Included in the 2012 result is a £0.4 million gain on the sale of the Xchanging Resourcing Services Limited business and a £0.1 million favourable foreign exchange movement.
Net finance costAdjusted net finance costs (pre-imputed interest on put options of £0.1 million (2011: £0.7 million), pre-acquisition-related finance costs of £0.3 million (2011: £nil), and pre-exceptional finance costs of £nil (2011: £4.3 million)) increased marginally from £4.1 million in 2011 to £4.2 million in 2012. Bank and other interest increased from £4.1 million in 2011 to £4.4 million in 2012 primarily due to £0.5 million of interest payable on the £6.0 million deferred consideration payment for the 2011 acquisition of the remaining 50% of Xchanging Broking Services Limited from Aon Limited, partially offset by a reduction in the interest payable on the revolving credit facility due to the reduction in the utilisation of this facility during the year. Amortisation of loan arrangement fees was £nil for the year compared to £0.3 million in 2011. All unamortised loan arrangement fees were written off at the time of the Group’s debt refinancing in August 2011. The Group has also benefited in the year from the receipt of a £0.2 million dividend from its investment in a listed Italian software company.
Adjusted cash conversionThe Group delivered a strong performance in the year for adjusted cash conversion, improving significantly to 122.0% (2011: 112.0%). Adjusted cash conversion is calculated by adding back £7.8 million (2011: £14.9 million) of cash outflows in respect of exceptional restructuring provisions recognised in prior years, £0.2 million of acquisition-related expenses paid in the year and £9.1 million (2011: £1.2 million) increase in customer cash accounts held by FdB.
Cash flow Operating cash flow from continuing operations was £62.6 million (2011: £35.9 million) driven by an improvement in cash generated from continuing operations and lower levels of capital expenditure. Cash generated from continuing operations increased by 40.3% to £85.7 million (2011: £61.1 million), due to the £19.2 million improvement in EBITDA, and a £13.9 million improvement in working capital management offsetting £6.2 million of adverse movements in
2012 £m
2011 £m
Adjusted operating profit 50.4 43.2
Add backs and exceptional items (4.4) (36.6)
Statutory operating profit 46.0 6.6
Depreciation and amortisation 30.5 33.4
Impairment losses – 14.6
Other non-cash movements (0.5) 0.9
Share-based payments 2.0 3.3
EBITDA 78.0 58.8
Working capital movement 13.9 2.5
Pensions (2.4) (0.6)
Provisions (3.8) 0.4
Cash generated from continuing operations 85.7 61.1
2012 £m
2011 £m
Cash generated from continuing operations 85.7 61.1 Dividends to non-controlling interests (7.6) (7.7)
Net capital expenditure (15.5) (17.5)
Operating cash flow from continuing operations 62.6 35.9
Interest and dividends received (2.5) (4.9)
Tax (9.8) (9.7)
Equity free cash flow from continuing operations 50.3 21.3
Free cash flow from discontinued operation – (8.3)
Cash flow after interest, tax and dividends 50.3 13.1
Acquisitions and disposals (17.5) (4.5)
Proceeds from issue or sale of shares 0.7 –
Foreign exchange movements (1.9) 3.1
Movements in net cash 31.6 11.7
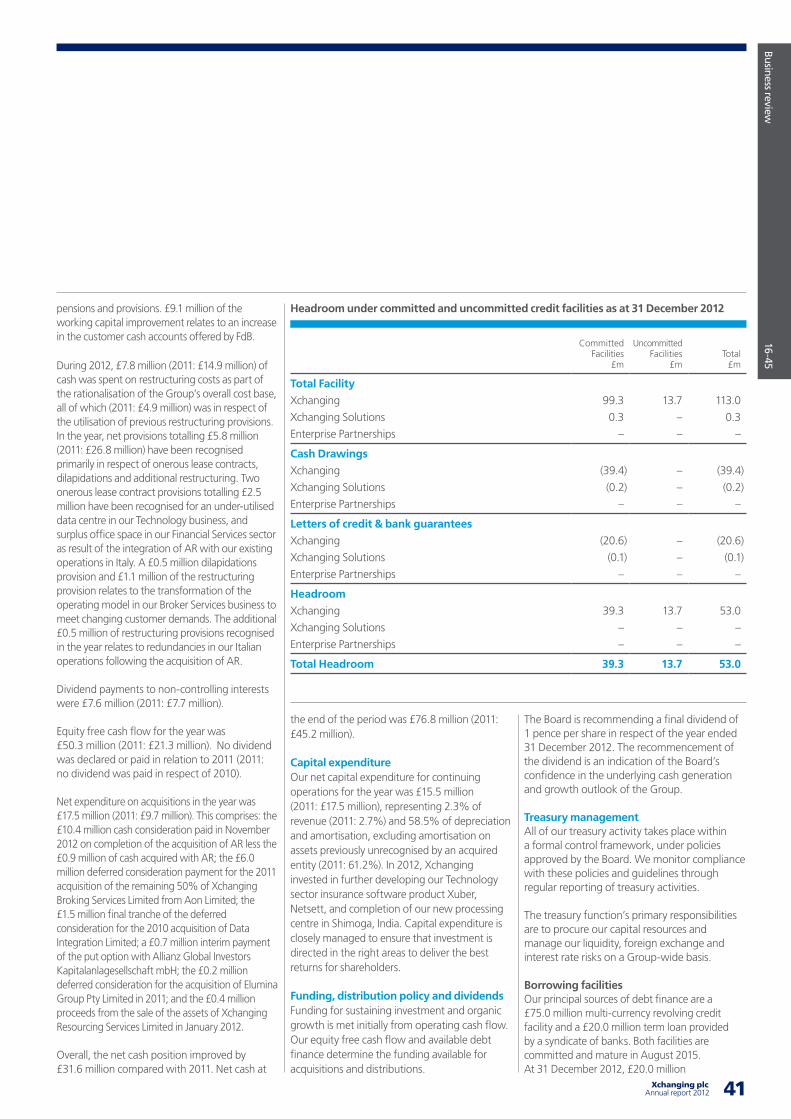
41 Xchanging plcAnnual report 2012
Business review
16-45
pensions and provisions. £9.1 million of the working capital improvement relates to an increase in the customer cash accounts offered by FdB.
During 2012, £7.8 million (2011: £14.9 million) of cash was spent on restructuring costs as part of the rationalisation of the Group’s overall cost base, all of which (2011: £4.9 million) was in respect of the utilisation of previous restructuring provisions. In the year, net provisions totalling £5.8 million (2011: £26.8 million) have been recognised primarily in respect of onerous lease contracts, dilapidations and additional restructuring. Two onerous lease contract provisions totalling £2.5 million have been recognised for an under-utilised data centre in our Technology business, and surplus office space in our Financial Services sector as result of the integration of AR with our existing operations in Italy. A £0.5 million dilapidations provision and £1.1 million of the restructuring provision relates to the transformation of the operating model in our Broker Services business to meet changing customer demands. The additional £0.5 million of restructuring provisions recognised in the year relates to redundancies in our Italian operations following the acquisition of AR.
Dividend payments to non-controlling interests were £7.6 million (2011: £7.7 million).
Equity free cash flow for the year was £50.3 million (2011: £21.3 million). No dividend was declared or paid in relation to 2011 (2011: no dividend was paid in respect of 2010).
Net expenditure on acquisitions in the year was £17.5 million (2011: £9.7 million). This comprises: the £10.4 million cash consideration paid in November 2012 on completion of the acquisition of AR less the £0.9 million of cash acquired with AR; the £6.0 million deferred consideration payment for the 2011 acquisition of the remaining 50% of Xchanging Broking Services Limited from Aon Limited; the £1.5 million final tranche of the deferred consideration for the 2010 acquisition of Data Integration Limited; a £0.7 million interim payment of the put option with Allianz Global Investors Kapitalanlagesellschaft mbH; the £0.2 million deferred consideration for the acquisition of Elumina Group Pty Limited in 2011; and the £0.4 million proceeds from the sale of the assets of Xchanging Resourcing Services Limited in January 2012.
Overall, the net cash position improved by £31.6 million compared with 2011. Net cash at
the end of the period was £76.8 million (2011: £45.2 million).
Capital expenditureOur net capital expenditure for continuing operations for the year was £15.5 million (2011: £17.5 million), representing 2.3% of revenue (2011: 2.7%) and 58.5% of depreciation and amortisation, excluding amortisation on assets previously unrecognised by an acquired entity (2011: 61.2%). In 2012, Xchanging invested in further developing our Technology sector insurance software product Xuber, Netsett, and completion of our new processing centre in Shimoga, India. Capital expenditure is closely managed to ensure that investment is directed in the right areas to deliver the best returns for shareholders.
Funding, distribution policy and dividendsFunding for sustaining investment and organic growth is met initially from operating cash flow. Our equity free cash flow and available debt finance determine the funding available for acquisitions and distributions.
The Board is recommending a final dividend of 1 pence per share in respect of the year ended 31 December 2012. The recommencement of the dividend is an indication of the Board’s confidence in the underlying cash generation and growth outlook of the Group.
Treasury managementAll of our treasury activity takes place within a formal control framework, under policies approved by the Board. We monitor compliance with these policies and guidelines through regular reporting of treasury activities.
The treasury function’s primary responsibilities are to procure our capital resources and manage our liquidity, foreign exchange and interest rate risks on a Group-wide basis.
Borrowing facilitiesOur principal sources of debt finance are a £75.0 million multi-currency revolving credit facility and a £20.0 million term loan provided by a syndicate of banks. Both facilities are committed and mature in August 2015. At 31 December 2012, £20.0 million
Headroom under committed and uncommitted credit facilities as at 31 December 2012
Committed Facilities
£m
Uncommitted Facilities
£mTotal
£m
Total Facility
Xchanging 99.3 13.7 113.0
Xchanging Solutions 0.3 – 0.3
Enterprise Partnerships – – –
Cash Drawings
Xchanging (39.4) – (39.4)
Xchanging Solutions (0.2) – (0.2)
Enterprise Partnerships – – –
Letters of credit & bank guarantees
Xchanging (20.6) – (20.6)
Xchanging Solutions (0.1) – (0.1)
Enterprise Partnerships – – –
Headroom
Xchanging 39.3 13.7 53.0
Xchanging Solutions – – –
Enterprise Partnerships – – –
Total Headroom 39.3 13.7 53.0
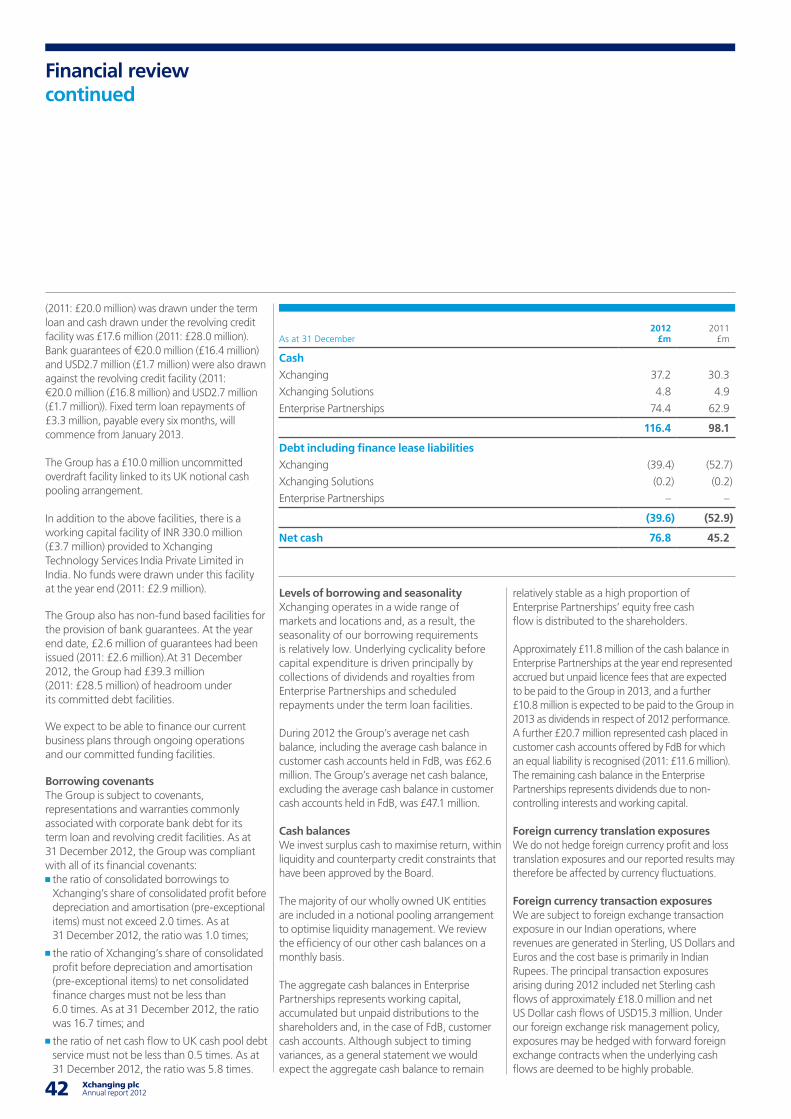
42 Xchanging plc Annual report 2012 43
(2011: £20.0 million) was drawn under the term loan and cash drawn under the revolving credit facility was £17.6 million (2011: £28.0 million). Bank guarantees of €20.0 million (£16.4 million) and USD2.7 million (£1.7 million) were also drawn against the revolving credit facility (2011: €20.0 million (£16.8 million) and USD2.7 million (£1.7 million)). Fixed term loan repayments of £3.3 million, payable every six months, will commence from January 2013.
The Group has a £10.0 million uncommitted overdraft facility linked to its UK notional cash pooling arrangement.
In addition to the above facilities, there is a working capital facility of INR 330.0 million (£3.7 million) provided to Xchanging Technology Services India Private Limited in India. No funds were drawn under this facility at the year end (2011: £2.9 million).
The Group also has non-fund based facilities for the provision of bank guarantees. At the year end date, £2.6 million of guarantees had been issued (2011: £2.6 million).At 31 December 2012, the Group had £39.3 million (2011: £28.5 million) of headroom under its committed debt facilities.
We expect to be able to finance our current business plans through ongoing operations and our committed funding facilities.
Borrowing covenantsThe Group is subject to covenants, representations and warranties commonly associated with corporate bank debt for its term loan and revolving credit facilities. As at 31 December 2012, the Group was compliant with all of its financial covenants: the ratio of consolidated borrowings to Xchanging’s share of consolidated profit before depreciation and amortisation (pre-exceptional items) must not exceed 2.0 times. As at 31 December 2012, the ratio was 1.0 times;
the ratio of Xchanging’s share of consolidated profit before depreciation and amortisation (pre-exceptional items) to net consolidated finance charges must not be less than 6.0 times. As at 31 December 2012, the ratio was 16.7 times; and
the ratio of net cash flow to UK cash pool debt service must not be less than 0.5 times. As at 31 December 2012, the ratio was 5.8 times.
Levels of borrowing and seasonalityXchanging operates in a wide range of markets and locations and, as a result, the seasonality of our borrowing requirements is relatively low. Underlying cyclicality before capital expenditure is driven principally by collections of dividends and royalties from Enterprise Partnerships and scheduled repayments under the term loan facilities.
During 2012 the Group’s average net cash balance, including the average cash balance in customer cash accounts held in FdB, was £62.6 million. The Group’s average net cash balance, excluding the average cash balance in customer cash accounts held in FdB, was £47.1 million.
Cash balancesWe invest surplus cash to maximise return, within liquidity and counterparty credit constraints that have been approved by the Board.
The majority of our wholly owned UK entities are included in a notional pooling arrangement to optimise liquidity management. We review the efficiency of our other cash balances on a monthly basis.
The aggregate cash balances in Enterprise Partnerships represents working capital, accumulated but unpaid distributions to the shareholders and, in the case of FdB, customer cash accounts. Although subject to timing variances, as a general statement we would expect the aggregate cash balance to remain
relatively stable as a high proportion of Enterprise Partnerships’ equity free cash flow is distributed to the shareholders.
Approximately £11.8 million of the cash balance in Enterprise Partnerships at the year end represented accrued but unpaid licence fees that are expected to be paid to the Group in 2013, and a further £10.8 million is expected to be paid to the Group in 2013 as dividends in respect of 2012 performance. A further £20.7 million represented cash placed in customer cash accounts offered by FdB for which an equal liability is recognised (2011: £11.6 million). The remaining cash balance in the Enterprise Partnerships represents dividends due to non-controlling interests and working capital.
Foreign currency translation exposuresWe do not hedge foreign currency profit and loss translation exposures and our reported results may therefore be affected by currency fluctuations.
Foreign currency transaction exposuresWe are subject to foreign exchange transaction exposure in our Indian operations, where revenues are generated in Sterling, US Dollars and Euros and the cost base is primarily in Indian Rupees. The principal transaction exposures arising during 2012 included net Sterling cash flows of approximately £18.0 million and net US Dollar cash flows of USD15.3 million. Under our foreign exchange risk management policy, exposures may be hedged with forward foreign exchange contracts when the underlying cash flows are deemed to be highly probable.
As at 31 December2012
£m2011
£m
Cash
Xchanging 37.2 30.3
Xchanging Solutions 4.8 4.9
Enterprise Partnerships 74.4 62.9
116.4 98.1
Debt including finance lease liabilities
Xchanging (39.4) (52.7)
Xchanging Solutions (0.2) (0.2)
Enterprise Partnerships – –
(39.6) (52.9)
Net cash 76.8 45.2
Financial reviewcontinued
43 Xchanging plcAnnual report 2012
Business review
16-45
Typically, we will look to hedge revenue to protect operating cash flow and to support the planning cycle. Foreign exchange contracts hedging revenue against the Indian Rupee amounting to £11.4 million, USD8.2 million and €3.3 million were outstanding at the year end (2011: £4.8 million and USD4.8 million).
Interest rate risk managementThe Group reviews its interest rate exposure against acceptable risk profiles on a periodic basis and may enter into interest rate swap agreements in order to achieve an acceptable balance of fixed and floating rate interest exposure. At 31 December 2012 all drawn debt was subject to floating rate interest.
Retirement benefit obligationsThe Group has three funded defined benefit schemes in the UK, all of which are closed to new members.
The cash contribution to the UK plans (Insurance Services and Technology sectors) includes £3.0 million per year in respect of recovery plans agreed with the trustees on two UK Plans, one in 2011 and the other in 2012. Recovery plans are agreed on completion of the triennial actuarial valuations and with valuations commencing for the two largest UK schemes in 2013, the current plans will therefore need to be reviewed with the trustees during 2014. It is expected that contributions in respect of the UK defined benefit schemes during 2013 will be £5.4 million (of which £2.0 million is expected to be funded from UK Enterprise Partnerships, and the remainder from a wholly owned subsidiary) and these figures include the anticipated level of deficit recovery payments.
Around 60 UK employees are members of various BAE Systems defined benefit pension schemes; however, the contributions made by the Group to the BAE Systems schemes can only vary in respect of future service contributions and are therefore accounted for on a defined contribution basis. The Group has various indemnities in place with BAE Systems and therefore could only be exposed to deficits in the BAE Systems schemes in the event that BAE Systems were to become insolvent.
In Financial Services, the Group operates various unfunded defined benefit plans, the
largest of which is supported by a Contractual Trust Arrangement (CTA). The CTA investment strategy adopted by the Group seeks to match asset movements to changes in the value of the liabilities. It is expected that contributions in respect of the Financial Services defined benefit schemes during 2013 will be £2.8 million (all of which is expected to be funded from Financial Services Enterprise Partnerships).
The Group works closely with the trustees of each of the pension plans to manage the risks associated with the provision of defined benefit pensions and reviews the investment strategy on all three UK schemes. The factors that most affect the value of the liabilities are interest rate and longevity, and the Group’s sensitivity to these particular risks is shown in notes to the accounts.
As at 31 December 2012, the Group has net retirement benefit obligations of £62.1 million (2011: £42.4 million). The significant increase in the obligations is driven by an actuarial loss in the largest scheme in the Financial Services sector principally due to a reduction in the discount rate applied from 5.37% to 3.42%. The discount rate reduction is driven by the decrease in German bond yields.
Capital structureThe Group seeks to maintain a strong credit profile to aid its ability to partner in business and will plan so as not to exceed consolidated borrowings of 2.0 times Xchanging’s share of consolidated profit before depreciation and amortisation. In order to achieve its desired capital structure, the Group may adjust the amount of dividends paid to shareholders, return capital to shareholders and adjust asset holdings to reduce or increase debt.
Regulatory capitalXchanging operates in a number of regulatory regimes. The key businesses affected by regulatory requirements are XTB and FdB, which conduct securities processing and retail investment account administration in Germany. They both maintain full banking licences and are regulated under the German Federal Financial Supervisory Authority (BaFin). Sufficient regulatory capital must be held in these entities to cover the operating and credit risks of the business. The regulatory capital requirement is based on market, operating and credit risk factors applied to asset classes. The regulatory capital in the business is calculated
as total equity less total intangible assets. There is no obligation to set cash aside to meet regulatory capital requirements but funding may be required from the holding company if the required regulatory capital is less than the calculated regulatory capital.
No additional regulatory capital was contributed to the German banking group during 2012.
Components of the Insurance Services business are regulated in the United Kingdom by the Financial Services Authority (FSA).
Weighted average cost of capitalThe Group has calculated its weighted average cost of capital as 10% (2011: 10%).
TaxationThe Group’s effective tax rate on adjusted operating profit from continuing operations was 31.5% (2011: 36.3%). The rate was higher in 2011 due to additional tax charges arising in that year from share schemes and other non-deductible items. The cash tax rate on adjusted profit from continuing operations was 33.9% (2011: 34.5%).
The 2012 rates are higher than the UK statutory tax rate of 24.5% (2011: 26.5%). This is due to losses in Italy where no tax benefit has been recognised and various other non-deductible items. Additionally the effective tax rate has been adversely affected by the write-down of the closing UK deferred tax assets in accordance with the reduction in the UK corporate tax rate. The 2012 rates have also been affected by profits arising in overseas jurisdictions with higher tax rates.
The 2012 effective rate is lower than the 2012 cash tax rate, largely due to the recognition of deferred tax assets in the US.
Major accounting judgementsFor details of major accounting judgements, please refer to note 3 of this Annual Report, on pages 88 to 89.
David Bauernfeind Chief Financial Officer 28 February 2013
Xchanging plc Annual report 2012 4544
Corporate social responsibility
Delivering our business responsiblyCorporate social responsibility (“CSR”) encompasses a broad spectrum of activities. Xchanging analyses issues in order to identify those that are material to the business and seeks to respond to them accordingly. CSR is closely aligned with our Values and is divided into four categories: people, environment, communities and marketplace.
Managing our responsibilitiesOur CSR Committee is responsible for setting the strategy for our CSR programme and overseeing its performance. The Committee meets quarterly and manages CSR activities to address the five key areas of interest to our stakeholders.
Corporate Social Responsibility Committee members: Chairman/Marketplace, Gary Whitaker (Company Secretary)
People, Campbell Hair (Group Human Resources Director)
Environment, Matthew Denham (Trading Director, Procurement)
Communities, James Willcocks (Interim Internal Communication Manager, Insurance)
Communication, Melanie Wheeler (Group Head of Internal Communication & CSR)
People People are critical to our business. We are committed to developing and supporting our people in order to drive our innovative approach to business and ensure that Xchanging remains a great place to work.
2012 saw the introduction of our pioneering Business Week India (“BWI”) concept, which aims to increase collaboration and understanding of capabilities across the Xchanging businesses. BWI involves more than 70 senior managers assembling in India to work together in delivering a range of business critical projects, share internal best practice and gain exposure to global thought leadership. Two BWI events took place in the year and led to outcomes such as the establishment of our India based “Bid Factory”; the design of our Account Management programme; a New Product and Market Development toolkit for our Sales and
Account Management population, in addition to a process for accelerating the creation of a true “innovation culture” across Xchanging.
Xchanging conducts a regular Group-wide employee survey. The 2012 survey showed a like-for-like improvement in engagement of 8 percentage points from the previous survey in 2010. Priority areas for action were identified at both global and local levels and a full governance process has been established to ensure identified actions are implemented.
The year has seen a focus on first line manager skills with new, consistent programmes being delivered in the UK, India and Australia. The aim of these programmes is to improve the employee experience and increase retention by establishing a minimum standard of leadership effectiveness in areas including hiring, team leadership, performance management and communication. The programme will be delivered in remaining businesses and geographies through 2013.
Our people resourcing agenda has focused on building capability to drive growth in order to ensure we have the knowledge and resource to deliver it. This has resulted in campaigns in three key areas: Sales, Account Management and hiring talent to support our rebranding and the launch of our ground-breaking Xuber product.
This year we recognised individuals and teams within the business who have made a particularly distinguished contribution to our development over the course of 2012, as judged against each of our six corporate Values.
EnvironmentThe environmental impact of Xchanging’s worldwide operations has been assessed and is not deemed to be considerable. Nonetheless, all of our business operations apply Xchanging’s environment policy in order to reduce the impact on the environment.
Xchanging tracks and monitors our impact and publishes our carbon footprint along with our involvement in the Carbon Disclosure Project.
The corporate Values are:Customer focus We focus relentlessly on the customer. We provide flexible, practical and value added solutions. We deliver results by constantly taking the initiative.
Innovation We challenge the status quo and approach our business with creativity, fresh ideas, lateral thinking and a commitment to do things in a new way. We inspire innovation.
Speed & efficiency We act quickly and decisively. Speed is of the essence.
People We create value, are empowered to make a difference and are responsible and accountable for our actions. We succeed through teamwork based on mutual respect and the desire to invest in each other’s success.
Excellence We are dedicated to continuous improvement which is reflected in our leadership in technology, implementation, operations and quality standards.
Integrity We are dependable and responsible people committed to being open, transparent, honest and direct in all of our activities.
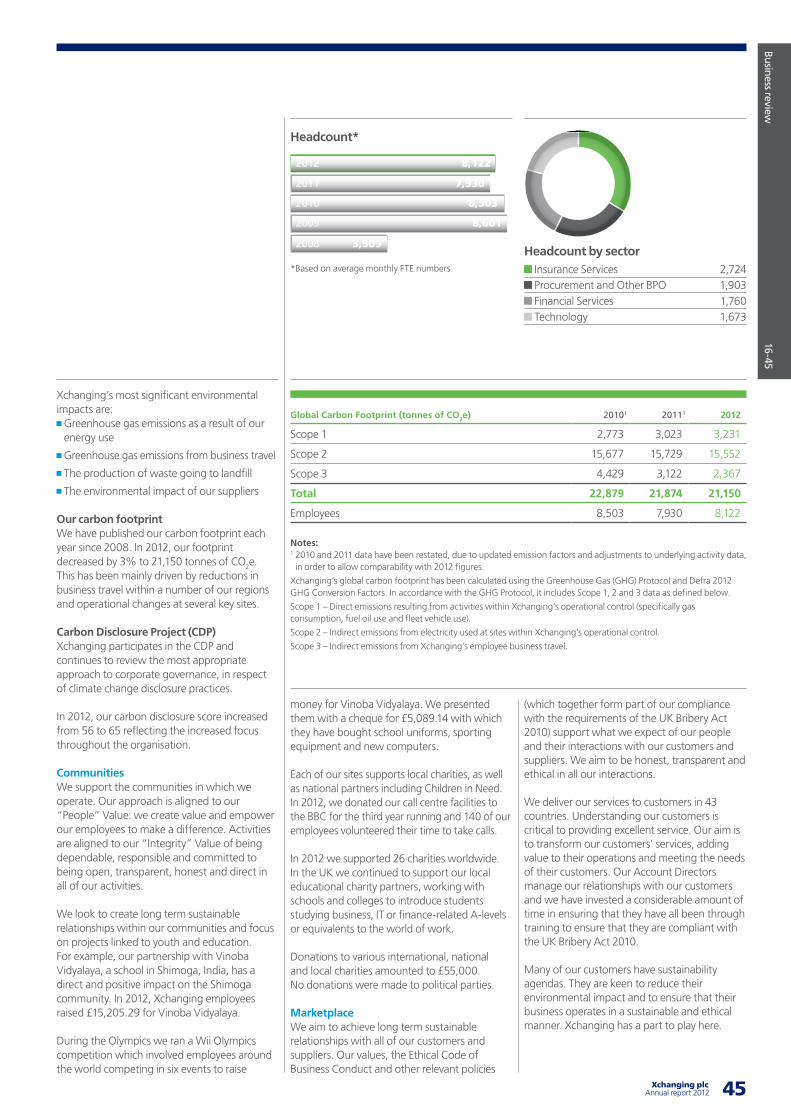
45 Xchanging plcAnnual report 2012
Business review
16-45
money for Vinoba Vidyalaya. We presented them with a cheque for £5,089.14 with which they have bought school uniforms, sporting equipment and new computers.
Each of our sites supports local charities, as well as national partners including Children in Need. In 2012, we donated our call centre facilities to the BBC for the third year running and 140 of our employees volunteered their time to take calls.
In 2012 we supported 26 charities worldwide. In the UK we continued to support our local educational charity partners, working with schools and colleges to introduce students studying business, IT or finance-related A-levels or equivalents to the world of work.
Donations to various international, national and local charities amounted to £55,000. No donations were made to political parties.
MarketplaceWe aim to achieve long term sustainable relationships with all of our customers and suppliers. Our values, the Ethical Code of Business Conduct and other relevant policies
Xchanging’s most significant environmental impacts are: Greenhouse gas emissions as a result of our energy use
Greenhouse gas emissions from business travel
The production of waste going to landfill
The environmental impact of our suppliers
Our carbon footprint We have published our carbon footprint each year since 2008. In 2012, our footprint decreased by 3% to 21,150 tonnes of CO2e. This has been mainly driven by reductions in business travel within a number of our regions and operational changes at several key sites.
Carbon Disclosure Project (CDP)Xchanging participates in the CDP and continues to review the most appropriate approach to corporate governance, in respect of climate change disclosure practices.
In 2012, our carbon disclosure score increased from 56 to 65 reflecting the increased focus throughout the organisation.
CommunitiesWe support the communities in which we operate. Our approach is aligned to our “People” Value: we create value and empower our employees to make a difference. Activities are aligned to our “Integrity” Value of being dependable, responsible and committed to being open, transparent, honest and direct in all of our activities.
We look to create long term sustainable relationships within our communities and focus on projects linked to youth and education. For example, our partnership with Vinoba Vidyalaya, a school in Shimoga, India, has a direct and positive impact on the Shimoga community. In 2012, Xchanging employees raised £15,205.29 for Vinoba Vidyalaya.
During the Olympics we ran a Wii Olympics competition which involved employees around the world competing in six events to raise
(which together form part of our compliance with the requirements of the UK Bribery Act 2010) support what we expect of our people and their interactions with our customers and suppliers. We aim to be honest, transparent and ethical in all our interactions.
We deliver our services to customers in 43 countries. Understanding our customers is critical to providing excellent service. Our aim is to transform our customers’ services, adding value to their operations and meeting the needs of their customers. Our Account Directors manage our relationships with our customers and we have invested a considerable amount of time in ensuring that they have all been through training to ensure that they are compliant with the UK Bribery Act 2010.
Many of our customers have sustainability agendas. They are keen to reduce their environmental impact and to ensure that their business operates in a sustainable and ethical manner. Xchanging has a part to play here.
Global Carbon Footprint (tonnes of CO2e) 20101 20111 2012
Scope 1 2,773 3,023 3,231
Scope 2 15,677 15,729 15,552
Scope 3 4,429 3,122 2,367
Total 22,879 21,874 21,150
Employees 8,503 7,930 8,122
Notes:1 2010 and 2011 data have been restated, due to updated emission factors and adjustments to underlying activity data, in order to allow comparability with 2012 figures.
Xchanging’s global carbon footprint has been calculated using the Greenhouse Gas (GHG) Protocol and Defra 2012 GHG Conversion Factors. In accordance with the GHG Protocol, it includes Scope 1, 2 and 3 data as defined below.
Scope 1 – Direct emissions resulting from activities within Xchanging’s operational control (specifically gas consumption, fuel oil use and fleet vehicle use).
Scope 2 – Indirect emissions from electricity used at sites within Xchanging’s operational control.
Scope 3 – Indirect emissions from Xchanging’s employee business travel.
Headcount*
2012 8,122
2011 7,930
2010 8,503
2009 8,601
2008 3,909Headcount by sector
Insurance Services 2,724 Procurement and Other BPO 1,903 Financial Services 1,760 Technology 1,673
*Based on average monthly FTE numbers
47
01. Geoff Unwin, Chairman
Skills and Experience: Geoff has extensive experience in the Technology and Services sector. He spent over 20 years at Hoskyns, the computer services company, latterly as Managing Director and then Executive Chairman. From 1990 – 2002 he held roles at Capgemini, rising to Chief Executive Officer in 2000. Appointment Date: 1 December 2011Term of Appointment: 4 Years Independent: YesOther directorships and offices
Current Chairman of Halma plc Chairman of OpenCloud Limited Member of Advisory Board of Palamon Capital Partners Chairman of RD Card Holdings Limited
Past Chairman of United Business Media plc (2002 to 2007) Chairman of Liberata plc (2003 to 2011) Chairman of Omnibus Systems Ltd Chairman of Alliance Medical Group (to December 2010) Non-voting director of Capgemini S.A. (to May 2012) Chairman of Taptu Limited (to September 2012)
Board Committee Membership Chairman of the Nomination Committee Member of Remuneration Committee
02. Ken Lever, Chief Executive Officer
Skills and Experience: Ken initially joined Xchanging as Chief Finance Officer in October 2010 and became acting Chief Executive Officer in February 2011. He became Chief Executive Officer in June 2011. Ken was a partner at Arthur Andersen.
He has served as a public listed company director initially as Group Managing Director with Corton Beach plc, a small conglomerate, and then as Finance Director of Alfred McAlpine plc, the international construction services group, Albright & Wilson, the global chemicals group and then he spent eight years with Tomkins plc, the global engineering and manufacturing group formerly listed on the London and New York Stock Exchanges. Ken then moved into the role of Chief Financial Officer of Numonyx BV, based in Switzerland. Appointment Date: 7 June 2011 Term of Appointment: N/AIndependent: N/AOther directorships and offices
Current Non-executive Director of FM Insurance Company Limited, the subsidiary of FM Global. Member of Accounting Council of the Financial Reporting Council.
Board Committee Membership None
03. David Bauernfeind, Chief Financial Officer
Skills and Experience: David is a qualified chartered accountant having worked in the audit discipline with Deloitte and Touche, before gaining experience with Johnson Matthey plc and progressing to Head of Audit with Airbus.
In 1998, David joined BAE Systems where he became financial controller (Defence). Responsibilities included acting as the commercial lead in the creation of an HR shared services joint venture with Xchanging. David joined Xchanging HR Services Limited in 2001 to oversee this JV. For over a decade, he has worked in almost all of the business areas in senior financial positions.
Appointment Date: 7 June 2011 Term of Appointment: N/AIndependent: N/A
Other directorships and offices None
Board Committee Membership None
04. Michel Paulin, Non-executive Director
Skills and Experience: Michel brings to the Board more than 20 years’ experience in the telecommunications industry and experience of working in Continental Europe. After his early career as a consultant for McKinsey & Company, he was COO of Louis Dreyfus Group’s major commodity trading business and also recently held the position of Chief Executive Officer of Neuf Cegetel. Appointment Date: 1 January 2010 Term of Appointment: 3 YearsIndependent: YesOther directorships and offices
Current Independent Director of Bull S.A.
Past Chief Executive Officer of Neuf Cegetel. COO at the Louis Dreyfus Group’s major commodity trading business Non-executive Director Myriad Group AG (October 2011) Non-executive Director LDC SEV
Board Committee Membership Member of Remuneration Committee Member of Nomination Committee
Board of Directors
01. 02. 03. 04.
47
05. Bill Thomas, Non-executive Director
Skills and Experience: Bill has extensive experience of the IT sector and adds valuable technical expertise to the Board. He has more than 30 years’ experience in the IT services sector. His early career was spent at Marconi and SD-Scicon and for over 20 years worked with EDS and Hewlett-Packard in the USA and Europe running the EMEA services business. Appointment Date: 1 December 2011 Term of Appointment: 3 YearsIndependent: YesOther directorships and offices
Current Chairman of the Advisory Board of Cranfield School of Management. Independent Director GFI Software SARL Director of Advisory Board of University of Leeds Business School
Board Committee Membership Chairman of the Remuneration Committee Member of Audit Committee Member of Nomination Committee
06. Stephen Wilson, Non-executive Director
Skills and Experience: Stephen has significant financial and business experience in both technology and outsourcing. Stephen has spent most of his career in the IT industry, including 25 years with IBM. He was Chief Financial Officer for IBM UK and Ireland from 2002 to 2009.In 2009 he joined Misys plc, as Vice President Group Finance and became Chief Financial Officer in June 2010, taking Misys through its acquisition by Vista Equity Partners and its subsequent merger with Turaz in 2012. On 14 January 2013 he joined the Board of Genus plc and will become Group Finance Director on 1 March 2013. He is also a Fellow of the Chartered Institute of Management Accountants.
Appointment Date: 1 July 2012 Term of Appointment: 3 YearsIndependent: YesOther directorships and offices
Current Director of Genus plc
Past Executive director of Misys plc
Board Committee Membership Chairman of the Audit Committee
07. Saurabh Srivastava, Non-executive Director
Skills and Experience: Saurabh is one of India’s leading IT entrepreneurs, angel investors and venture capitalists and has a deep knowledge of the Indian IT market. He founded and chaired IIS Infotech, NASSCOM, and co-founded the Indian Angel Network. He also chairs the Indian operations of CA Technologies Inc., the US listed software business. He chaired the Indian Venture Capital Association and is Chairman Emeritus of TIE Delhi. Saurabh has previously served on the Advisory Boards of Imperial College Business School, London, and on the advisory boards of Uttarakhand and Himachal Universities in India. He serves on the Prime Minister’s National Innovation Council and on various government boards/committees. He has been awarded a Lifetime Achievement award from the IT Industry in India and a Distinguished Alumnus from IIT Kanpur. Appointment Date: 4 September 2012 Term of Appointment: 3 YearsIndependent: YesOther directorships and offices
Current National Executive Committees of CII (Confederation of Indian Industries) FICCI (Federation of Indian Chambers of Commerce and Industry)
Chair of Indian operations of CA Technologies Inc
Board Committee Membership Member of Audit Committee
08. Ian Cormack, Senior Independent Non-executive Director
Skills and Experience: Ian has wide experience of the City and financial markets together with first-hand experience of the Insurance sector. Ian spent over 30 years at Citibank, latterly as UK Country Head of the Financial Institutions Group. From 2000 to 2002, he was Chief Executive Officer of AIG Europe. A former member of the Chancellor’s City Advisory Panel, he has served on committees for the London Stock Exchange, CHAPS, APACS, the European Securities Forum. He founded and, until 2008, ran Cormack Tansey Partners which provides strategic consulting to financial institutions. He is an active member of the Development Council for the National Theatre and Campaign Committee of Pembroke College, Oxford. Appointment Date: 26 October 2012 Term of Appointment: 3 YearsIndependent: YesOther directorships and offices
Current Senior Independent Director and Chairman of the Audit Committee at Bloomsbury Publishing plc Non-executive Director and Chairman of the Remuneration Committee of Phoenix Group Holdings plc Chairman of Maven Income and Growth VCT 4 plc Non-executive Director and Chairman of the Audit Committee of Arria NLG Ltd Non-executive Director Aspen Insurance Holdings Ltd, Bermuda.
Board Committee Membership Member of Nomination Committee Member of Remuneration Committee
Corporate governance 46-69
05. 06. 07. 08.
49
Ken Lever, Chief Executive Officer
See biography on pages 46 to 47
David Bauernfeind, Chief Financial Officer
See biography on pages 46 to 47
Executive Board Support Group:
Subramanian Gopalaratnam, Head of Innovation
Alexandra Hockenhull, Head of Corporate Communications and Investor Relations
Campbell Hair, Global HR Director
Milind Joshi, Head of Quality and Operations Excellence
Robert Myers, Director, Business Processing Services
Jim Sadler, Chief Information Officer
Gary Whitaker, Head of Legal and Company Secretary
01. Adrian Guttridge, Executive Director, Insurance Services
Business: Business Processing ServicesSkills and Experience: Before joining Xchanging, Adrian was Vice President of Business Processing Outsourcing, EMEA at Hewlett-Packard. In this role he was directly responsible for a business with 7,000 employees based on, near and offshore. In recent years Adrian has been running businesses wholly or substantially in financial services. He has a technology background and his 30 year career includes extensive experience specifically in the insurance sector, for example running the insurance practice for EDS (prior to its acquisition by HP), and in senior roles at Accenture and Marlborough Stirling. Appointment Date: December 2012
02. Joerg Brand, Executive Director, Financial Services
Business: Business Processing ServicesSkills and Experience: Before joining Xchanging, Joerg was a member of Deutsche Bank’s corporate finance M&A team in London. Prior to this, Joerg held a number of banking and corporate finance positions with Dresdner Kleinwort and Dresdner Bank in London, Luxembourg, New York and Buenos Aires.
Joerg joined Xchanging in 2002 as Business Development Manager driving expansion in Germany. He then moved to London to become Corporate Development Director in 2009 before taking up his current position in which he is authorised by the German financial supervisory agency (BaFin) and is responsible for two businesses that hold a banking licence. Appointment Date: March 2011
03. Nimish Soni, Executive Director, Enterprise Services
Business: Business Processing ServicesSkills and Experience: In addition to his Enterprise BPS responsibilities, Nimish also supports our other business sectors across the India and South East Asia region.Nimish joined Xchanging following the Group’s acquisition of Cambridge Solutions Ltd in 2009. Prior to his current role, Nimish held the position of Managing Director for the BPO and ITO Divisions of Xchanging India. He founded Cambridge BPO (formerly known as ProcessMind) in 2001.
Prior to founding ProcessMind, Nimish set up a captive centre in India for American Financial Group. He started his career with a five year period with Capgemini in the US. Appointment Date: May 2011
04. Andrew Binns, Executive Director, Technology
Business: TechnologySkills and Experience: Andrew’s career spans 27 years in the IT industry in outsourcing and consulting services. He has held positions with global responsibility within multinational companies spanning software, technology services, management consultancy and start-up ventures.
Prior to Xchanging, Andrew was CEO of global services at Temenos Group; a market leading provider of packaged banking software. Other senior roles include Managing Director of Aon BPO and Consulting, CEO of software company Netengines and Managing Director of the EMEA outsourcing business of Digital Equipment Corporation (now Hewlett-Packard). Appointment Date: January 2012
01. 02. 03. 04.
Executive Board
49 Xchanging plcAnnual report 2012
Corporate governance 46-69
05. Ed Cross, Executive Director, Procurement
Business: ProcurementSkills and Experience: Ed has been with Xchanging since 2003, when he joined as the UK Trading Services Director, responsible for the leadership of the UK trading spend portfolio. Ed has held a range of senior roles at Xchanging, most recently leading the Procurement business across Europe. Overall, he has 25 years’ experience in a variety of roles in procurement, supply chain and change management with over 15 years’ executive level outsourcing and consultancy experience. Prior to joining Xchanging, Ed held a number of senior level consulting and outsourcing positions with QP Group, ShareMax Inc. and PricewaterhouseCoopers. Appointment Date: April 2012
06. Stephen Scott, Group Director of Sales and Marketing
Business: Cross-sectorSkills and Experience: Stephen first joined Xchanging in 2006 as the Australian Relations Director. He rejoined Xchanging in 2009 following a period working in senior management positions at Aon and Westpac Banking Corporation, and in 2011 became the Australian Sales and Services Director.
Prior to Xchanging, Stephen worked in senior management positions at the Australian Federal Treasury and the Financial Services Institute of Australasia. Stephen has 16 years of experience working in a variety of industries including banking, insurance, government and internet new media. His roles have included sales, service, strategy and general management. Appointment Date: March 2012
07. Jon Stratford, Group Director of Corporate Development and Corporate Strategy
Business: CorporateSkills and Experience: Jon began his career at KPMG and is a qualified chartered accountant. He spent 10 years in investment banking advising on strategic acquisitions, disposals, financing and private equity. Jon joined Xchanging in 2006 as Corporate Development Director. He was responsible for leading the Xchanging IPO which took place in April 2007. Subsequently Jon worked as Chief Financial and Commercial Officer for Xchanging’s Americas region based in Chicago. Jon returned to the UK in his current role in August 2011. During 2012 Jon was also Insurance Services Executive Director on an interim basis. Appointment Date: May 2012
05. 06. 07.
50 Xchanging plc Annual report 2012 51
Directors’ report
The Directors present their report and the audited consolidated financial statements of the Group for the year ended 31 December 2012.
Principal activities and business reviewThe Group’s principal activities are the provision of a range of industry-specific processing services to the banking and insurance industries as well as technology, human resources and procurement services across industries. The Company acts as the holding company for the Group.
The Companies Act 2006 requires Xchanging to present a fair review of the Group’s business and a description of the principal risks and uncertainties facing the Group. The information which fulfils these requirements is provided in the sections of the Annual Report entitled Chairman’s statement, Chief Executive Officer’s statement, principal risks and uncertainties in 2012, Business review and Financial review, on pages 28 to 43, providing detailed information on the Group and its strategy, the operation of the businesses, and the results and financial position for the year ended 31 December 2012. These report on the principal risks and uncertainties facing the Group, trends and economic factors impacting the business and likely future developments.
DividendsThe Directors recommend a final dividend of 1 pence (2011: Nil) per ordinary share which, if approved by shareholders at the annual general meeting, will be paid on 22 May 2013 to those shareholders on the register at the close of business on 26 April 2013.
Research and developmentThe Group incurs development costs in the design of processes and systems that substantially improve those already installed in the business, which include business process mapping, process reorganisation and software development.
The amount capitalised in the year in respect of development expenditure was £3.7million (2011: £4.7 million).
Charitable donationsDonations to various international, national and local charities amounted to £55,000 during the year (2011: £53,000).
Directors and their interestsDetails of changes to the Board during the year, and up to the date of this report, are set out on pages 2 to 3.
The Directors’ interests in the shares and share options of the Company are shown on page 69.
Significant agreements The key customer and supplier contracts and other arrangements essential to the Group are described throughout the Business Review and in the Principal Risks and Uncertainties section on pages 24 to 27. Xchanging does not consider itself to be dependent on a single key supplier.
Significant agreements – change of control Upon a change of control (as variously defined in the respective agreements outlined below) of Xchanging plc, a number of significant agreements take effect, alter or terminate as follows:
Customer service agreements Under the terms of the agreement for the provision of information technology services by Xchanging Global Insurance Solutions Limited to the London Metal Exchange Limited (‘LME’), entered into on 8 December 2011, the LME may, if it has reasonable grounds for believing that Xchanging Global Insurance Solutions Limited will be incapable of providing the services or that Xchanging plc will be incapable of meeting its obligations under the guarantee (entered into between Xchanging plc and the LME on the same date) in each case as a result of that change of control, elect to terminate the contract. In addition, the LME may elect to terminate the contract in the event that Xchanging plc is acquired by a third party whose business competes with the LME.
Under the terms of the agreement for the provision of claims handling and related services by Xchanging Broking Services Limited to Aon Limited, entered into on 1 September 2006 (as amended on 10 March 2009 and 29 October 2010), Aon Limited may elect to continue to receive such services, or alternatively terminate the contract, in the event that Xchanging plc is acquired, if the acquirer of
Xchanging plc competes directly with Aon Limited for the provision of insurance services in the United Kingdom of the type being supported by Xchanging Broking Services Limited.
Enterprise Partnerships Under the terms of certain Enterprise Partnership shareholders’ agreements, the Enterprise Partner may elect to exercise options over the shares in the Enterprise Partnership, for a share value as variously defined in the respective agreements. The agreements are as follows: Deutsche Bank AG (‘DB’) may elect to call the Group’s shares in XTB under the terms of the shareholders’ agreement, entered into between DB and Xchanging Holdco No. 3 Limited on 26 May 2004. DB must exercise such call option within one month of the change of control of Xchanging plc.
Allianz Global Investors Kapitalanlagegesellschaft mbH (‘AGI’) may elect to call the Group’s shares in Fondsdepot Bank GmbH under the terms of the shareholders’ agreement, entered into between AGI and XTB on 21 August 2007. AGI must exercise such call option within 6 weeks of the change of control of Xchanging plc.
Revolving credit facility and term loan Under the terms of the £95 million term loan and revolving credit facility, entered into on 29 July 2011, and provided by a syndicate of banks to Xchanging plc, the lenders may elect to continue to provide such facility, or alternatively cancel it and require all monies borrowed under such facility to be repaid.
Directors and employees There are no agreements between the Company and its Directors or employees providing for compensation for loss of office or employment that occurs because of a takeover bid or change of control, other than in respect of Geoff Unwin, the Chairman. For more information please see page 66.
51 Xchanging plcAnnual report 2012
Corporate governance 46-69
Directors’ indemnities The Company’s Articles of Association contain a qualifying third party indemnity provision (as per the Companies Act 2006) that provides, for the financial year ended on 31 December 2012 and as at the date of this document, that the Company may pay for Directors’ indemnities out of its own assets. The Company has procured directors’ and officers’ insurance for this purpose.
Share capital At the date of this report, 240,310,919 ordinary shares (2011: 239,509,739) of 5 pence each have been issued, are fully paid up and are admitted to trading on the London Stock Exchange. The rights and obligations attaching to the Company’s ordinary shares, as well as the powers of the Company’s Directors, are set out in the Company’s Articles of Association, copies of which can be obtained from Companies House or from the Company’s website.
Substantial shareholders On 4 February 2013 the Company had been notified of the following material or notifiable interests in its issued share capital by persons other than the current Directors of the Company. Please see table.
Non-controlling interests The profits of the Xchanging Group Enterprise Partnerships in which non-controlling interests have an interest are not necessarily shared in proportion to the shareholding interest in that company, as each Enterprise Partnership has a distinct contractual method of profit share.Please see table.
Equal opportunitiesThe Group is committed to employment policies which follow best practice based on equal opportunities for all employees, irrespective of gender, race, nationality, colour, disability, marital status, sexual orientation, age or religion. All decisions relating to employment practices are objective, free from bias and based upon work criteria and individual merit. The Group’s policy is to offer appropriate training
Number of shares Percentage
Artemis Investment Management 26,977,690 11.23
Deccan Value Advisors LP 19,665,280 8.18
Fidelity International Limited 16,880,498 7.02
Legal & General Investment Mgmt Ltd 15,754,036 6.56
Odey Asset Management 15,656,561 6.52
Henderson Global Investors 13,185,997 5.49
T. Rowe Price International Inc 11,250,310 4.68
D. Andrews 9,450,909 3.93
BlackRock Investment Management Ltd 8,031,822 3.34
J.P. Morgan Asset Management 7,846,938 3.27
Non-controlling interests The non-controlling interests in the Group’s subsidiaries at 31 December 2012 are set out as follows:
Non-controlling interestInterest in Xchanging Group
Enterprise Partnership
The Corporation of Lloyd’s 25% interest in Ins-sure Holdings Limited 50% interest in Xchanging Claims
Services Limited
International Underwriting Association 25% interest in Ins-sure Holdings Limited
Deutsche Bank AG 44% interest in Xchanging etb GmbH
Sal. Oppenheim jr. & Cie. AG & Co. KGaA 5% interest in Xchanging etb GmbH
Allianz Global Investors Europe GmbH (formerly Allianz Global Investors Kapitalanlagegesellschaft mbH)
49% interest in Fondsdepot Bank GmbH
Non-controlling interest Interest in other Xchanging Group Companies
Scandent Holdings Mauritius Ltd (11.82%)25% interest in Xchanging Solutions Limited (formerly
Cambridge Solutions Limited)
Katra Finance Limited (3.77%)
Aon Minet Pension Scheme (2.7%)
Other (public) (6.71%)
SIA S.p.A. (formerly SIA-SSB S.p.A.) 1.3% interest in Xchanging Italy S.p.A. (formerly Kedrios S.p.A.)
Substantial shareholders
52 Xchanging plc Annual report 2012 53
Directors’ reportcontinued
and career development to disabled persons that are, as far as possible, identical to other employees and in line with best practice. In the event of a member of staff becoming disabled, the Group makes every effort to continue employment, arrange appropriate retraining and offer opportunities for promotion.
Policy on payment of creditorsThe Company aims to pay suppliers in accordance with the suppliers’ contract terms. The Company had an average of 55 days purchases outstanding (2011: 31 days) in trade payables in 2012.
Policy on financial instrumentsThe policy with respect to financial instruments is covered in the accounting policy (iii)(b) at note 2 on page 78 and note 36 to the financial statements.
Independent auditorsA resolution will be proposed at the 2013 AGM to reappoint our current auditors, PricewaterhouseCoopers LLP (‘PwC’), for 2013 and also to allow the Board to set their remuneration. The Board is satisfied that the external auditors remain independent and PwC have indicated their willingness to continue in office.
Statement of Directors’ responsibilities The Directors are responsible for preparing the Annual Report, the Remuneration Report and the financial statements in accordance with applicable law and regulations.
Company law requires the Directors to prepare financial statements for each financial year. Under that law, the Directors have prepared the Group and parent company financial statements in accordance with International Financial Reporting Standards (‘IFRS’) as adopted by the European Union (‘EU’), and the parent company financial statements in accordance with the United Kingdom Generally Accepted Accounting Practice (United Kingdom Accounting Standards and applicable law). Under company law, the Directors must not approve the financial statements unless they are satisfied that they give a true and fair view of the state of affairs of the Group and the Parent Company and of the profit or loss of the Group for that period. In preparing these financial statements, the Directors are required to:
Select suitable accounting policies and then apply them consistently.
Make judgements and accounting estimates that are reasonable and prudent.
State whether applicable IFRS, as adopted by the EU, have been followed, subject to any material departures disclosed and explained in the financial statements.
Prepare the financial statements on the going concern basis unless it is inappropriate to presume that the Company will continue in business.
The Directors are responsible for keeping adequate accounting records that are sufficient to show and explain the Company’s transactions and disclose with reasonable accuracy at any time the financial position of the Company and the Group and to enable them to ensure that the financial statements and the Remuneration Report comply with the Companies Act 2006 and, as regards the Group Financial Statements, Article 4 of the IAS Regulation. They are also responsible for safeguarding the assets of the Company and the Group and hence for taking reasonable steps for the prevention and detection of fraud and other irregularities.
Directors’ statement pursuant to the Disclosure and Transparency RulesEach of the Directors, whose names and functions are listed in the Board of Directors, on pages 46 to 47, confirm that, to the best of each person’s knowledge and belief: The financial statements, prepared in accordance with IFRS as adopted by the EU, give a true and fair view of the assets, liabilities, financial position and profit/(loss) of the Group and the Company.
The Directors’ Report contained in the Annual Report includes a fair review of the development and performance of the business and the position of the Company and Group, together with a description of the principal risks and uncertainties that they face.
The Directors are responsible for the maintenance and integrity of the Group’s website, www.xchanging.com. Legislation in the UK governing the preparation and dissemination of financial statements may differ from legislation in other jurisdictions.
Statement of disclosure of information to auditorsIn the case of each of the persons who are Directors of the Company at the date when the report was approved: So far as each of the Directors is aware, there is no relevant audit information of which the Company’s auditors are unaware.
Each of the Directors has taken all the steps he/she ought to have taken individually as a Director in order to make himself/herself aware of any relevant audit information and to establish that the Company’s auditors are aware of that information.
Corporate governance Details relating to the Company’s compliance with the UK Corporate Governance Code for the financial year are given in the Corporate Governance Report.
Going concernThe Directors have reviewed the liquidity position of the Group for the period ending 31 December 2014. The cash flows of the Group have been assessed against the Group’s available sources of finance on a monthly basis to determine the minimum and maximum expected levels of headroom. Based on this analysis and an assessment of the potential cash risks, the Directors have a reasonable expectation that the Group has adequate resources to continue in operational existence for the foreseeable future.
The Group therefore continues to adopt the going concern basis in preparing its consolidated financial statements.
Annual General Meeting The Annual General Meeting of the Company will be held at 34 Leadenhall Street, London, EC3A 1AX at 9.30am on Wednesday 15 May 2013. The notice convening the meeting, together with details of the business to be considered and explanatory notes for each resolution, is distributed separately to shareholders. It is also available on the Group’s website.
By order of the BoardGary WhitakerCompany Secretary 28 February 2013
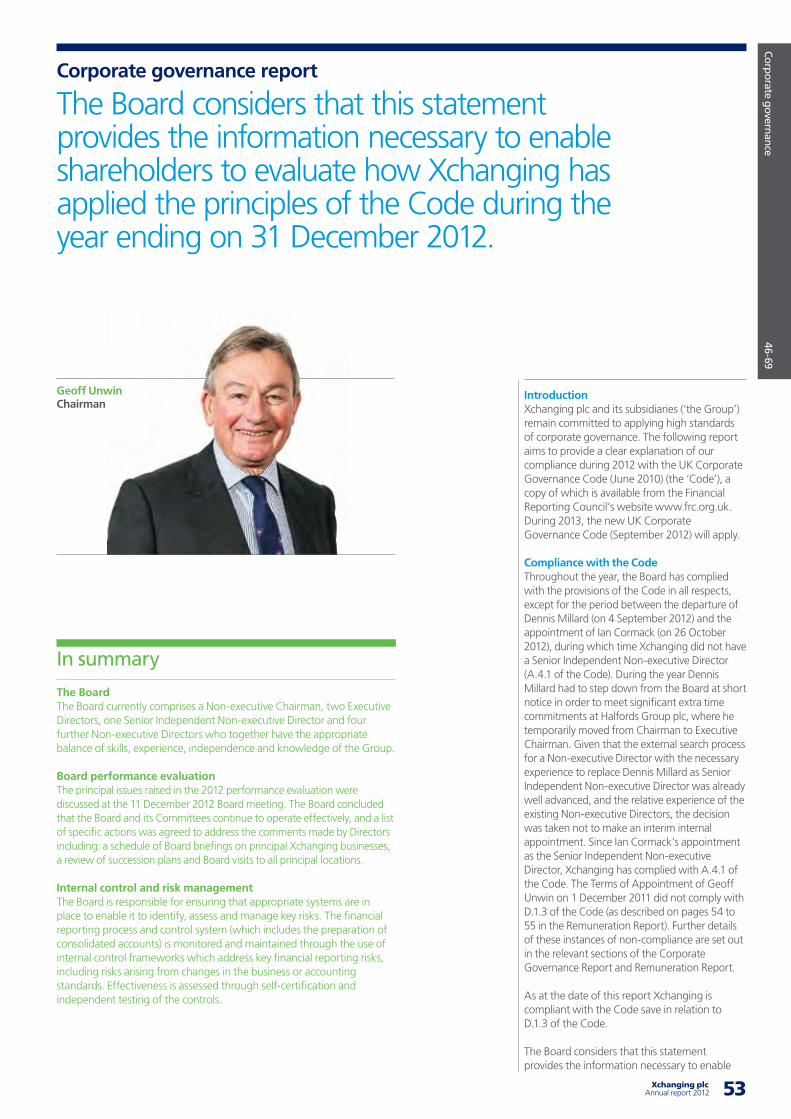
53 Xchanging plcAnnual report 2012
Corporate governance 46-69
Corporate governance report
The Board considers that this statement provides the information necessary to enable shareholders to evaluate how Xchanging has applied the principles of the Code during the year ending on 31 December 2012.
IntroductionXchanging plc and its subsidiaries (‘the Group’) remain committed to applying high standards of corporate governance. The following report aims to provide a clear explanation of our compliance during 2012 with the UK Corporate Governance Code (June 2010) (the ‘Code’), a copy of which is available from the Financial Reporting Council’s website www.frc.org.uk. During 2013, the new UK Corporate Governance Code (September 2012) will apply.
Compliance with the CodeThroughout the year, the Board has complied with the provisions of the Code in all respects, except for the period between the departure of Dennis Millard (on 4 September 2012) and the appointment of Ian Cormack (on 26 October 2012), during which time Xchanging did not have a Senior Independent Non-executive Director (A.4.1 of the Code). During the year Dennis Millard had to step down from the Board at short notice in order to meet significant extra time commitments at Halfords Group plc, where he temporarily moved from Chairman to Executive Chairman. Given that the external search process for a Non-executive Director with the necessary experience to replace Dennis Millard as Senior Independent Non-executive Director was already well advanced, and the relative experience of the existing Non-executive Directors, the decision was taken not to make an interim internal appointment. Since Ian Cormack’s appointment as the Senior Independent Non-executive Director, Xchanging has complied with A.4.1 of the Code. The Terms of Appointment of Geoff Unwin on 1 December 2011 did not comply with D.1.3 of the Code (as described on pages 54 to 55 in the Remuneration Report). Further details of these instances of non-compliance are set out in the relevant sections of the Corporate Governance Report and Remuneration Report.
As at the date of this report Xchanging is compliant with the Code save in relation to D.1.3 of the Code.
The Board considers that this statement provides the information necessary to enable
The BoardThe Board currently comprises a Non-executive Chairman, two Executive Directors, one Senior Independent Non-executive Director and four further Non-executive Directors who together have the appropriate balance of skills, experience, independence and knowledge of the Group.
Board performance evaluationThe principal issues raised in the 2012 performance evaluation were discussed at the 11 December 2012 Board meeting. The Board concluded that the Board and its Committees continue to operate effectively, and a list of specific actions was agreed to address the comments made by Directors including: a schedule of Board briefings on principal Xchanging businesses, a review of succession plans and Board visits to all principal locations.
Internal control and risk managementThe Board is responsible for ensuring that appropriate systems are in place to enable it to identify, assess and manage key risks. The financial reporting process and control system (which includes the preparation of consolidated accounts) is monitored and maintained through the use of internal control frameworks which address key financial reporting risks, including risks arising from changes in the business or accounting standards. Effectiveness is assessed through self-certification and independent testing of the controls.
In summary
Geoff Unwin Chairman
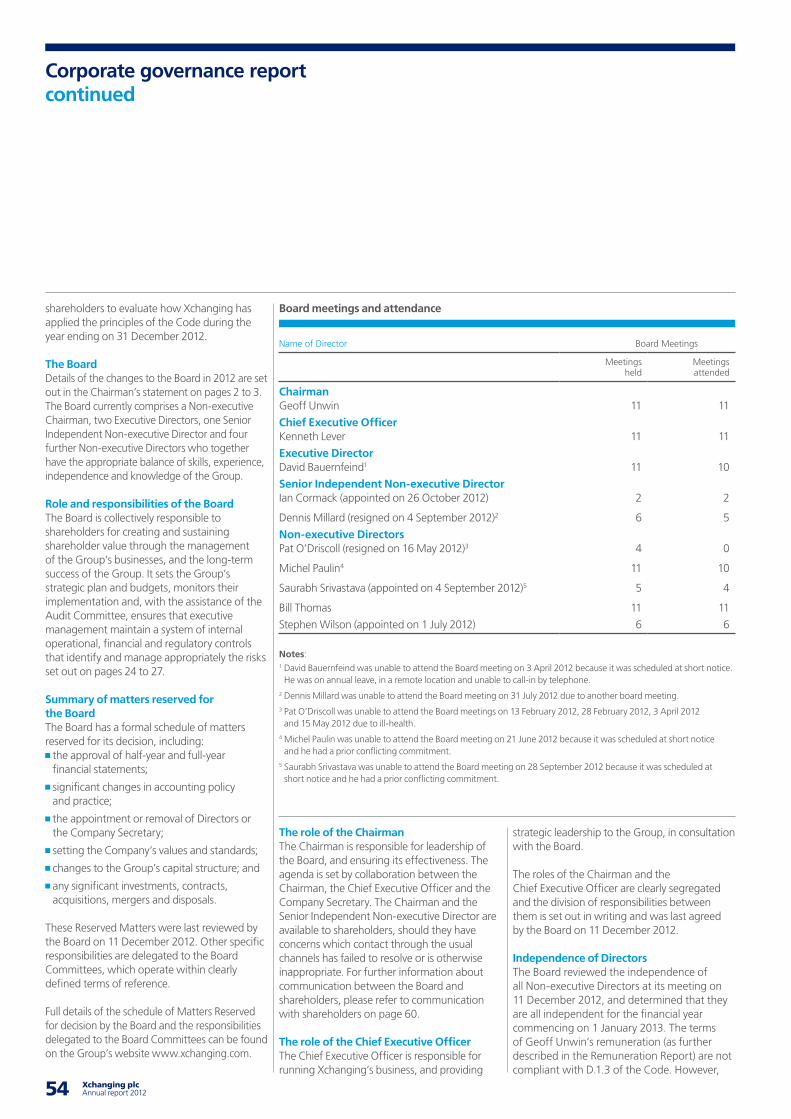
54 Xchanging plc Annual report 2012 55
Corporate governance reportcontinued
shareholders to evaluate how Xchanging has applied the principles of the Code during the year ending on 31 December 2012.
The BoardDetails of the changes to the Board in 2012 are set out in the Chairman’s statement on pages 2 to 3. The Board currently comprises a Non-executive Chairman, two Executive Directors, one Senior Independent Non-executive Director and four further Non-executive Directors who together have the appropriate balance of skills, experience, independence and knowledge of the Group.
Role and responsibilities of the BoardThe Board is collectively responsible to shareholders for creating and sustaining shareholder value through the management of the Group’s businesses, and the long-term success of the Group. It sets the Group’s strategic plan and budgets, monitors their implementation and, with the assistance of the Audit Committee, ensures that executive management maintain a system of internal operational, financial and regulatory controls that identify and manage appropriately the risks set out on pages 24 to 27.
Summary of matters reserved for the BoardThe Board has a formal schedule of matters reserved for its decision, including: the approval of half-year and full-year financial statements;
significant changes in accounting policy and practice;
the appointment or removal of Directors or the Company Secretary;
setting the Company’s values and standards;
changes to the Group’s capital structure; and
any significant investments, contracts, acquisitions, mergers and disposals.
These Reserved Matters were last reviewed by the Board on 11 December 2012. Other specific responsibilities are delegated to the Board Committees, which operate within clearly defined terms of reference.
Full details of the schedule of Matters Reserved for decision by the Board and the responsibilities delegated to the Board Committees can be found on the Group’s website www.xchanging.com.
The role of the ChairmanThe Chairman is responsible for leadership of the Board, and ensuring its effectiveness. The agenda is set by collaboration between the Chairman, the Chief Executive Officer and the Company Secretary. The Chairman and the Senior Independent Non-executive Director are available to shareholders, should they have concerns which contact through the usual channels has failed to resolve or is otherwise inappropriate. For further information about communication between the Board and shareholders, please refer to communication with shareholders on page 60.
The role of the Chief Executive OfficerThe Chief Executive Officer is responsible for running Xchanging’s business, and providing
strategic leadership to the Group, in consultation with the Board.
The roles of the Chairman and the Chief Executive Officer are clearly segregated and the division of responsibilities between them is set out in writing and was last agreed by the Board on 11 December 2012.
Independence of DirectorsThe Board reviewed the independence of all Non-executive Directors at its meeting on 11 December 2012, and determined that they are all independent for the financial year commencing on 1 January 2013. The terms of Geoff Unwin’s remuneration (as further described in the Remuneration Report) are not compliant with D.1.3 of the Code. However,
Board meetings and attendance
Name of Director Board Meetings
Meetings held
Meetings attended
Chairman Geoff Unwin 11 11
Chief Executive Officer Kenneth Lever 11 11
Executive Director David Bauernfeind1 11 10
Senior Independent Non-executive Director Ian Cormack (appointed on 26 October 2012) 2 2
Dennis Millard (resigned on 4 September 2012)2 6 5
Non-executive Directors Pat O’Driscoll (resigned on 16 May 2012)3 4 0
Michel Paulin4 11 10
Saurabh Srivastava (appointed on 4 September 2012)5 5 4
Bill Thomas 11 11
Stephen Wilson (appointed on 1 July 2012) 6 6
Notes:1 David Bauernfeind was unable to attend the Board meeting on 3 April 2012 because it was scheduled at short notice. He was on annual leave, in a remote location and unable to call-in by telephone.
2 Dennis Millard was unable to attend the Board meeting on 31 July 2012 due to another board meeting.3 Pat O’Driscoll was unable to attend the Board meetings on 13 February 2012, 28 February 2012, 3 April 2012 and 15 May 2012 due to ill-health.
4 Michel Paulin was unable to attend the Board meeting on 21 June 2012 because it was scheduled at short notice and he had a prior conflicting commitment.
5 Saurabh Srivastava was unable to attend the Board meeting on 28 September 2012 because it was scheduled at short notice and he had a prior conflicting commitment.
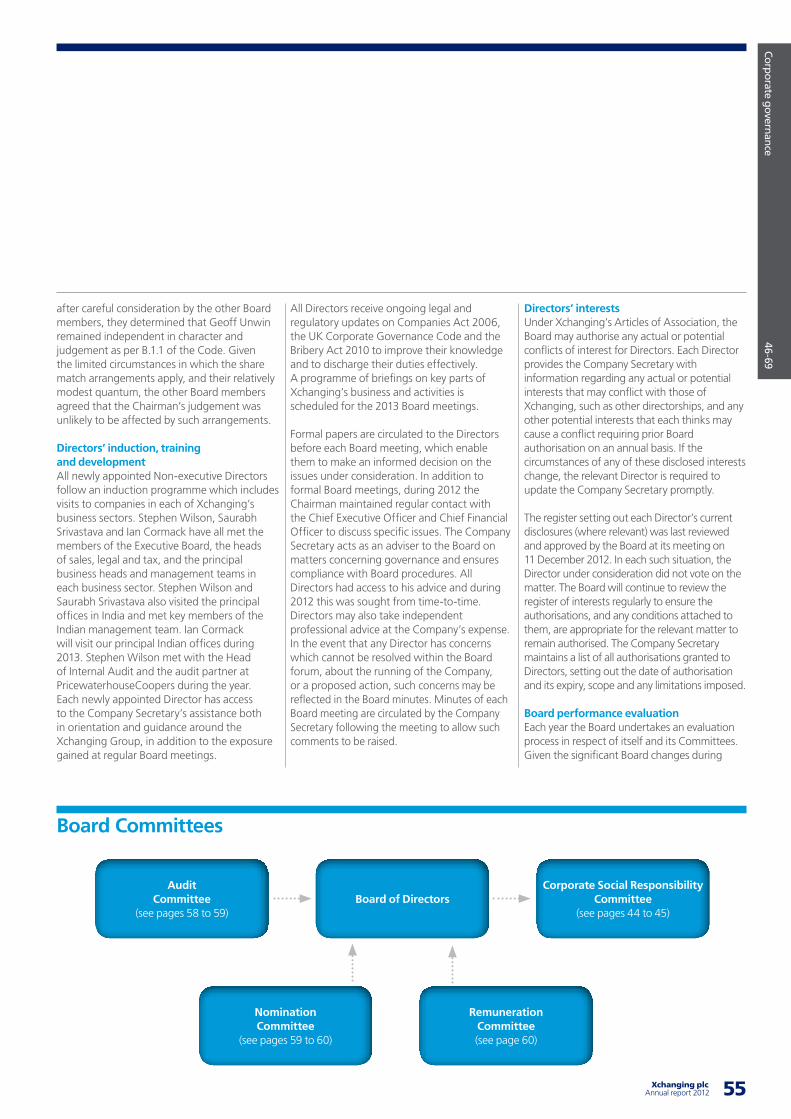
55 Xchanging plcAnnual report 2012
Corporate governance 46-69
All Directors receive ongoing legal and regulatory updates on Companies Act 2006, the UK Corporate Governance Code and the Bribery Act 2010 to improve their knowledge and to discharge their duties effectively. A programme of briefings on key parts of Xchanging’s business and activities is scheduled for the 2013 Board meetings.
Formal papers are circulated to the Directors before each Board meeting, which enable them to make an informed decision on the issues under consideration. In addition to formal Board meetings, during 2012 the Chairman maintained regular contact with the Chief Executive Officer and Chief Financial Officer to discuss specific issues. The Company Secretary acts as an adviser to the Board on matters concerning governance and ensures compliance with Board procedures. All Directors had access to his advice and during 2012 this was sought from time-to-time. Directors may also take independent professional advice at the Company’s expense. In the event that any Director has concerns which cannot be resolved within the Board forum, about the running of the Company, or a proposed action, such concerns may be reflected in the Board minutes. Minutes of each Board meeting are circulated by the Company Secretary following the meeting to allow such comments to be raised.
after careful consideration by the other Board members, they determined that Geoff Unwin remained independent in character and judgement as per B.1.1 of the Code. Given the limited circumstances in which the share match arrangements apply, and their relatively modest quantum, the other Board members agreed that the Chairman’s judgement was unlikely to be affected by such arrangements.
Directors’ induction, training and developmentAll newly appointed Non-executive Directors follow an induction programme which includes visits to companies in each of Xchanging’s business sectors. Stephen Wilson, Saurabh Srivastava and Ian Cormack have all met the members of the Executive Board, the heads of sales, legal and tax, and the principal business heads and management teams in each business sector. Stephen Wilson and Saurabh Srivastava also visited the principal offices in India and met key members of the Indian management team. Ian Cormack will visit our principal Indian offices during 2013. Stephen Wilson met with the Head of Internal Audit and the audit partner at PricewaterhouseCoopers during the year. Each newly appointed Director has access to the Company Secretary’s assistance both in orientation and guidance around the Xchanging Group, in addition to the exposure gained at regular Board meetings.
Directors’ interestsUnder Xchanging’s Articles of Association, the Board may authorise any actual or potential conflicts of interest for Directors. Each Director provides the Company Secretary with information regarding any actual or potential interests that may conflict with those of Xchanging, such as other directorships, and any other potential interests that each thinks may cause a conflict requiring prior Board authorisation on an annual basis. If the circumstances of any of these disclosed interests change, the relevant Director is required to update the Company Secretary promptly.
The register setting out each Director’s current disclosures (where relevant) was last reviewed and approved by the Board at its meeting on 11 December 2012. In each such situation, the Director under consideration did not vote on the matter. The Board will continue to review the register of interests regularly to ensure the authorisations, and any conditions attached to them, are appropriate for the relevant matter to remain authorised. The Company Secretary maintains a list of all authorisations granted to Directors, setting out the date of authorisation and its expiry, scope and any limitations imposed.
Board performance evaluationEach year the Board undertakes an evaluation process in respect of itself and its Committees. Given the significant Board changes during
Board Committees
Audit Committee
(see pages 58 to 59) Board of Directors
Corporate Social Responsibility Committee
(see pages 44 to 45)
Remuneration Committee (see page 60)
Nomination Committee
(see pages 59 to 60)
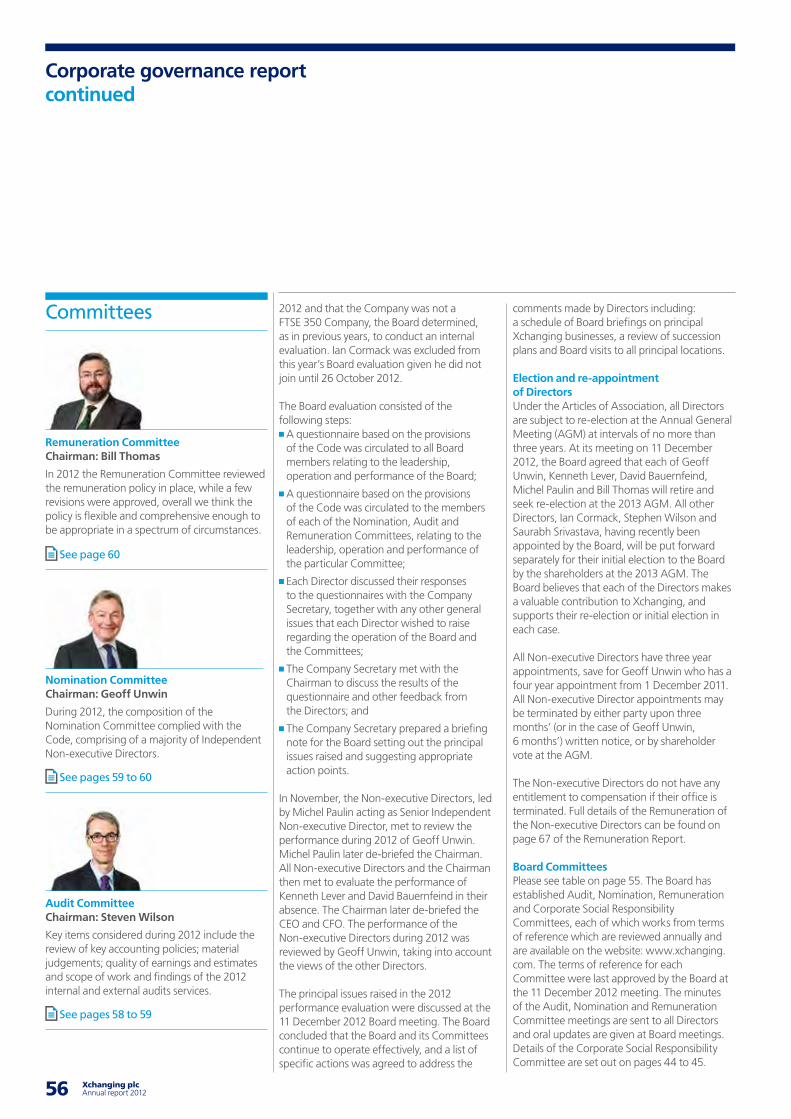
56 Xchanging plc Annual report 2012 57
2012 and that the Company was not a FTSE 350 Company, the Board determined, as in previous years, to conduct an internal evaluation. Ian Cormack was excluded from this year’s Board evaluation given he did not join until 26 October 2012.
The Board evaluation consisted of the following steps: A questionnaire based on the provisions of the Code was circulated to all Board members relating to the leadership, operation and performance of the Board;
A questionnaire based on the provisions of the Code was circulated to the members of each of the Nomination, Audit and Remuneration Committees, relating to the leadership, operation and performance of the particular Committee;
Each Director discussed their responses to the questionnaires with the Company Secretary, together with any other general issues that each Director wished to raise regarding the operation of the Board and the Committees;
The Company Secretary met with the Chairman to discuss the results of the questionnaire and other feedback from the Directors; and
The Company Secretary prepared a briefing note for the Board setting out the principal issues raised and suggesting appropriate action points.
In November, the Non-executive Directors, led by Michel Paulin acting as Senior Independent Non-executive Director, met to review the performance during 2012 of Geoff Unwin. Michel Paulin later de-briefed the Chairman. All Non-executive Directors and the Chairman then met to evaluate the performance of Kenneth Lever and David Bauernfeind in their absence. The Chairman later de-briefed the CEO and CFO. The performance of the Non-executive Directors during 2012 was reviewed by Geoff Unwin, taking into account the views of the other Directors.
The principal issues raised in the 2012 performance evaluation were discussed at the 11 December 2012 Board meeting. The Board concluded that the Board and its Committees continue to operate effectively, and a list of specific actions was agreed to address the
comments made by Directors including: a schedule of Board briefings on principal Xchanging businesses, a review of succession plans and Board visits to all principal locations.
Election and re-appointment of DirectorsUnder the Articles of Association, all Directors are subject to re-election at the Annual General Meeting (AGM) at intervals of no more than three years. At its meeting on 11 December 2012, the Board agreed that each of Geoff Unwin, Kenneth Lever, David Bauernfeind, Michel Paulin and Bill Thomas will retire and seek re-election at the 2013 AGM. All other Directors, Ian Cormack, Stephen Wilson and Saurabh Srivastava, having recently been appointed by the Board, will be put forward separately for their initial election to the Board by the shareholders at the 2013 AGM. The Board believes that each of the Directors makes a valuable contribution to Xchanging, and supports their re-election or initial election in each case.
All Non-executive Directors have three year appointments, save for Geoff Unwin who has a four year appointment from 1 December 2011. All Non-executive Director appointments may be terminated by either party upon three months’ (or in the case of Geoff Unwin, 6 months’) written notice, or by shareholder vote at the AGM.
The Non-executive Directors do not have any entitlement to compensation if their office is terminated. Full details of the Remuneration of the Non-executive Directors can be found on page 67 of the Remuneration Report.
Board CommitteesPlease see table on page 55. The Board has established Audit, Nomination, Remuneration and Corporate Social Responsibility Committees, each of which works from terms of reference which are reviewed annually and are available on the website: www.xchanging.com. The terms of reference for each Committee were last approved by the Board at the 11 December 2012 meeting. The minutes of the Audit, Nomination and Remuneration Committee meetings are sent to all Directors and oral updates are given at Board meetings. Details of the Corporate Social Responsibility Committee are set out on pages 44 to 45.
Committees
Remuneration CommitteeChairman: Bill Thomas
In 2012 the Remuneration Committee reviewed the remuneration policy in place, while a few revisions were approved, overall we think the policy is flexible and comprehensive enough to be appropriate in a spectrum of circumstances.
See page 60
Nomination CommitteeChairman: Geoff Unwin
During 2012, the composition of the Nomination Committee complied with the Code, comprising of a majority of Independent Non-executive Directors.
See pages 59 to 60
Audit CommitteeChairman: Steven Wilson
Key items considered during 2012 include the review of key accounting policies; material judgements; quality of earnings and estimates and scope of work and findings of the 2012 internal and external audits services.
See pages 58 to 59
Corporate governance reportcontinued
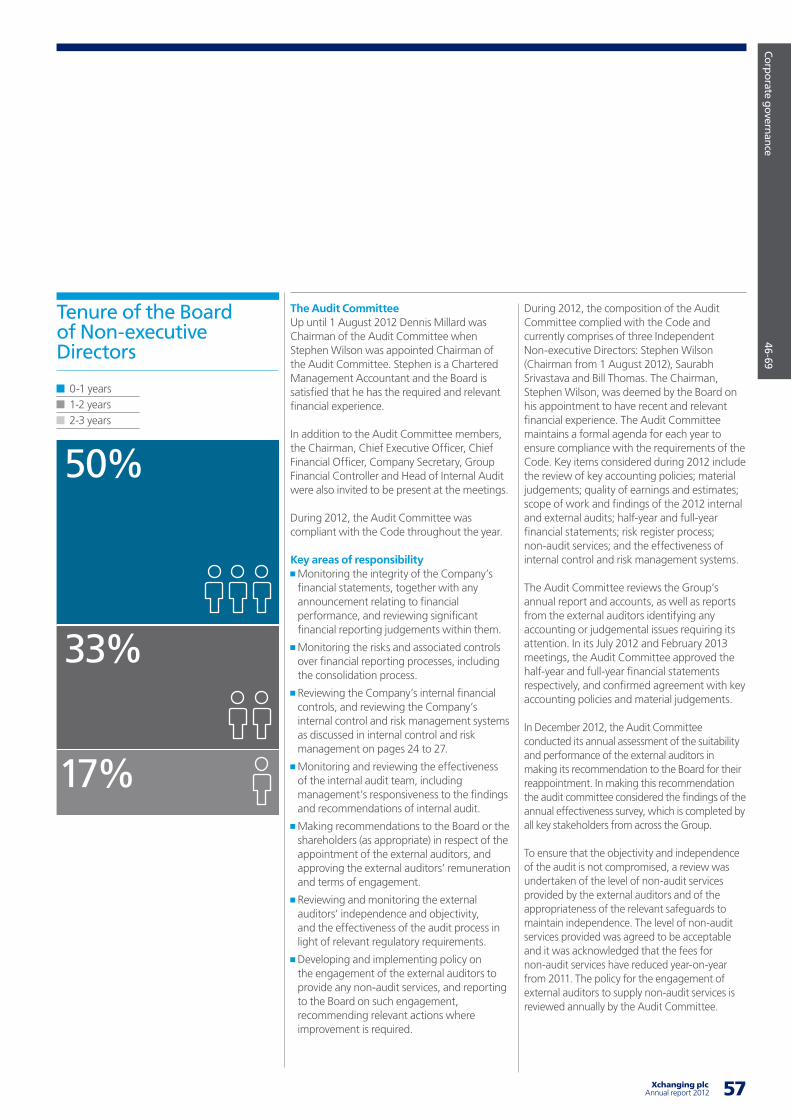
57 Xchanging plcAnnual report 2012
Corporate governance 46-69
Tenure of the Board of Non-executive Directors
0-1 years 1-2 years 2-3 years
50%
17%
33%
The Audit Committee Up until 1 August 2012 Dennis Millard was Chairman of the Audit Committee when Stephen Wilson was appointed Chairman of the Audit Committee. Stephen is a Chartered Management Accountant and the Board is satisfied that he has the required and relevant financial experience.
In addition to the Audit Committee members, the Chairman, Chief Executive Officer, Chief Financial Officer, Company Secretary, Group Financial Controller and Head of Internal Audit were also invited to be present at the meetings.
During 2012, the Audit Committee was compliant with the Code throughout the year.
Key areas of responsibility Monitoring the integrity of the Company’s financial statements, together with any announcement relating to financial performance, and reviewing significant financial reporting judgements within them.
Monitoring the risks and associated controls over financial reporting processes, including the consolidation process.
Reviewing the Company’s internal financial controls, and reviewing the Company’s internal control and risk management systems as discussed in internal control and risk management on pages 24 to 27.
Monitoring and reviewing the effectiveness of the internal audit team, including management’s responsiveness to the findings and recommendations of internal audit.
Making recommendations to the Board or the shareholders (as appropriate) in respect of the appointment of the external auditors, and approving the external auditors’ remuneration and terms of engagement.
Reviewing and monitoring the external auditors’ independence and objectivity, and the effectiveness of the audit process in light of relevant regulatory requirements.
Developing and implementing policy on the engagement of the external auditors to provide any non-audit services, and reporting to the Board on such engagement, recommending relevant actions where improvement is required.
During 2012, the composition of the Audit Committee complied with the Code and currently comprises of three Independent Non-executive Directors: Stephen Wilson (Chairman from 1 August 2012), Saurabh Srivastava and Bill Thomas. The Chairman, Stephen Wilson, was deemed by the Board on his appointment to have recent and relevant financial experience. The Audit Committee maintains a formal agenda for each year to ensure compliance with the requirements of the Code. Key items considered during 2012 include the review of key accounting policies; material judgements; quality of earnings and estimates; scope of work and findings of the 2012 internal and external audits; half-year and full-year financial statements; risk register process; non-audit services; and the effectiveness of internal control and risk management systems.
The Audit Committee reviews the Group’s annual report and accounts, as well as reports from the external auditors identifying any accounting or judgemental issues requiring its attention. In its July 2012 and February 2013 meetings, the Audit Committee approved the half-year and full-year financial statements respectively, and confirmed agreement with key accounting policies and material judgements.
In December 2012, the Audit Committee conducted its annual assessment of the suitability and performance of the external auditors in making its recommendation to the Board for their reappointment. In making this recommendation the audit committee considered the findings of the annual effectiveness survey, which is completed by all key stakeholders from across the Group.
To ensure that the objectivity and independence of the audit is not compromised, a review was undertaken of the level of non-audit services provided by the external auditors and of the appropriateness of the relevant safeguards to maintain independence. The level of non-audit services provided was agreed to be acceptable and it was acknowledged that the fees for non-audit services have reduced year-on-year from 2011. The policy for the engagement of external auditors to supply non-audit services is reviewed annually by the Audit Committee.
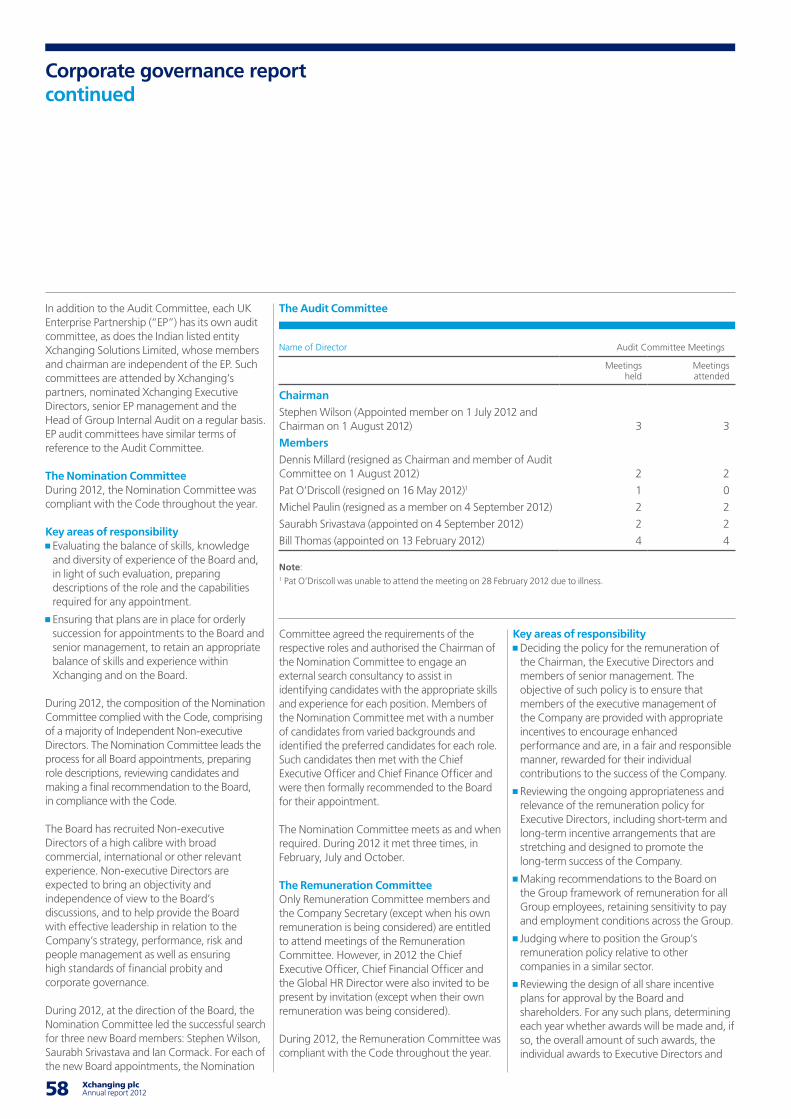
58 Xchanging plc Annual report 2012 59
Corporate governance reportcontinued
In addition to the Audit Committee, each UK Enterprise Partnership (“EP”) has its own audit committee, as does the Indian listed entity Xchanging Solutions Limited, whose members and chairman are independent of the EP. Such committees are attended by Xchanging’s partners, nominated Xchanging Executive Directors, senior EP management and the Head of Group Internal Audit on a regular basis. EP audit committees have similar terms of reference to the Audit Committee.
The Nomination Committee During 2012, the Nomination Committee was compliant with the Code throughout the year.
Key areas of responsibility Evaluating the balance of skills, knowledge and diversity of experience of the Board and, in light of such evaluation, preparing descriptions of the role and the capabilities required for any appointment.
Ensuring that plans are in place for orderly succession for appointments to the Board and senior management, to retain an appropriate balance of skills and experience within Xchanging and on the Board.
During 2012, the composition of the Nomination Committee complied with the Code, comprising of a majority of Independent Non-executive Directors. The Nomination Committee leads the process for all Board appointments, preparing role descriptions, reviewing candidates and making a final recommendation to the Board, in compliance with the Code.
The Board has recruited Non-executive Directors of a high calibre with broad commercial, international or other relevant experience. Non-executive Directors are expected to bring an objectivity and independence of view to the Board’s discussions, and to help provide the Board with effective leadership in relation to the Company’s strategy, performance, risk and people management as well as ensuring high standards of financial probity and corporate governance.
During 2012, at the direction of the Board, the Nomination Committee led the successful search for three new Board members: Stephen Wilson, Saurabh Srivastava and Ian Cormack. For each of the new Board appointments, the Nomination
Committee agreed the requirements of the respective roles and authorised the Chairman of the Nomination Committee to engage an external search consultancy to assist in identifying candidates with the appropriate skills and experience for each position. Members of the Nomination Committee met with a number of candidates from varied backgrounds and identified the preferred candidates for each role. Such candidates then met with the Chief Executive Officer and Chief Finance Officer and were then formally recommended to the Board for their appointment.
The Nomination Committee meets as and when required. During 2012 it met three times, in February, July and October.
The Remuneration CommitteeOnly Remuneration Committee members and the Company Secretary (except when his own remuneration is being considered) are entitled to attend meetings of the Remuneration Committee. However, in 2012 the Chief Executive Officer, Chief Financial Officer and the Global HR Director were also invited to be present by invitation (except when their own remuneration was being considered).
During 2012, the Remuneration Committee was compliant with the Code throughout the year.
Key areas of responsibility Deciding the policy for the remuneration of the Chairman, the Executive Directors and members of senior management. The objective of such policy is to ensure that members of the executive management of the Company are provided with appropriate incentives to encourage enhanced performance and are, in a fair and responsible manner, rewarded for their individual contributions to the success of the Company.
Reviewing the ongoing appropriateness and relevance of the remuneration policy for Executive Directors, including short-term and long-term incentive arrangements that are stretching and designed to promote the long-term success of the Company.
Making recommendations to the Board on the Group framework of remuneration for all Group employees, retaining sensitivity to pay and employment conditions across the Group.
Judging where to position the Group’s remuneration policy relative to other companies in a similar sector.
Reviewing the design of all share incentive plans for approval by the Board and shareholders. For any such plans, determining each year whether awards will be made and, if so, the overall amount of such awards, the individual awards to Executive Directors and
The Audit Committee
Name of Director Audit Committee Meetings
Meetings held
Meetings attended
Chairman
Stephen Wilson (Appointed member on 1 July 2012 and Chairman on 1 August 2012) 3 3
Members
Dennis Millard (resigned as Chairman and member of Audit Committee on 1 August 2012) 2 2
Pat O’Driscoll (resigned on 16 May 2012)1 1 0
Michel Paulin (resigned as a member on 4 September 2012) 2 2
Saurabh Srivastava (appointed on 4 September 2012) 2 2
Bill Thomas (appointed on 13 February 2012) 4 4
Note:1 Pat O’Driscoll was unable to attend the meeting on 28 February 2012 due to illness.
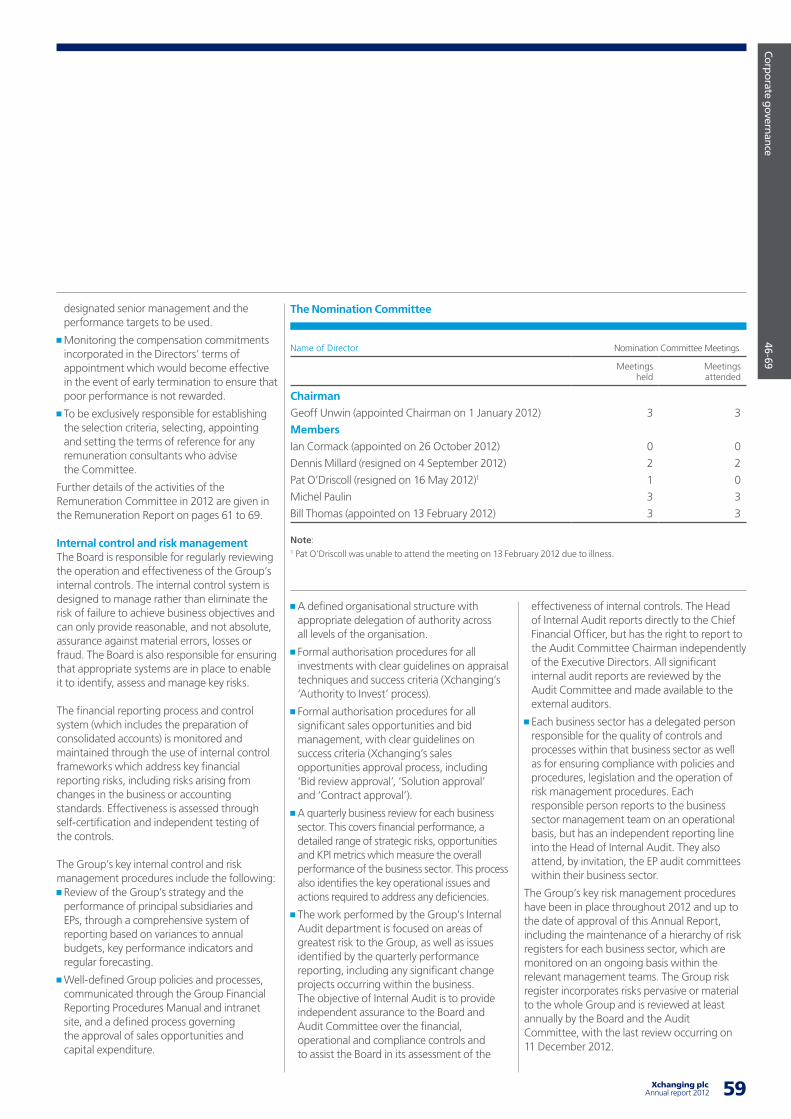
59 Xchanging plcAnnual report 2012
Corporate governance 46-69
designated senior management and the performance targets to be used.
Monitoring the compensation commitments incorporated in the Directors’ terms of appointment which would become effective in the event of early termination to ensure that poor performance is not rewarded.
To be exclusively responsible for establishing the selection criteria, selecting, appointing and setting the terms of reference for any remuneration consultants who advise the Committee.
Further details of the activities of the Remuneration Committee in 2012 are given in the Remuneration Report on pages 61 to 69.
Internal control and risk management The Board is responsible for regularly reviewing the operation and effectiveness of the Group’s internal controls. The internal control system is designed to manage rather than eliminate the risk of failure to achieve business objectives and can only provide reasonable, and not absolute, assurance against material errors, losses or fraud. The Board is also responsible for ensuring that appropriate systems are in place to enable it to identify, assess and manage key risks.
The financial reporting process and control system (which includes the preparation of consolidated accounts) is monitored and maintained through the use of internal control frameworks which address key financial reporting risks, including risks arising from changes in the business or accounting standards. Effectiveness is assessed through self-certification and independent testing of the controls.
The Group’s key internal control and risk management procedures include the following: Review of the Group’s strategy and the performance of principal subsidiaries and EPs, through a comprehensive system of reporting based on variances to annual budgets, key performance indicators and regular forecasting.
Well-defined Group policies and processes, communicated through the Group Financial Reporting Procedures Manual and intranet site, and a defined process governing the approval of sales opportunities and capital expenditure.
A defined organisational structure with appropriate delegation of authority across all levels of the organisation.
Formal authorisation procedures for all investments with clear guidelines on appraisal techniques and success criteria (Xchanging’s ‘Authority to Invest’ process).
Formal authorisation procedures for all significant sales opportunities and bid management, with clear guidelines on success criteria (Xchanging’s sales opportunities approval process, including ‘Bid review approval’, ‘Solution approval’ and ‘Contract approval’).
A quarterly business review for each business sector. This covers financial performance, a detailed range of strategic risks, opportunities and KPI metrics which measure the overall performance of the business sector. This process also identifies the key operational issues and actions required to address any deficiencies.
The work performed by the Group’s Internal Audit department is focused on areas of greatest risk to the Group, as well as issues identified by the quarterly performance reporting, including any significant change projects occurring within the business. The objective of Internal Audit is to provide independent assurance to the Board and Audit Committee over the financial, operational and compliance controls and to assist the Board in its assessment of the
effectiveness of internal controls. The Head of Internal Audit reports directly to the Chief Financial Officer, but has the right to report to the Audit Committee Chairman independently of the Executive Directors. All significant internal audit reports are reviewed by the Audit Committee and made available to the external auditors.
Each business sector has a delegated person responsible for the quality of controls and processes within that business sector as well as for ensuring compliance with policies and procedures, legislation and the operation of risk management procedures. Each responsible person reports to the business sector management team on an operational basis, but has an independent reporting line into the Head of Internal Audit. They also attend, by invitation, the EP audit committees within their business sector.
The Group’s key risk management procedures have been in place throughout 2012 and up to the date of approval of this Annual Report, including the maintenance of a hierarchy of risk registers for each business sector, which are monitored on an ongoing basis within the relevant management teams. The Group risk register incorporates risks pervasive or material to the whole Group and is reviewed at least annually by the Board and the Audit Committee, with the last review occurring on 11 December 2012.
The Nomination Committee
Name of Director Nomination Committee Meetings
Meetings held
Meetings attended
Chairman
Geoff Unwin (appointed Chairman on 1 January 2012) 3 3
Members
Ian Cormack (appointed on 26 October 2012) 0 0
Dennis Millard (resigned on 4 September 2012) 2 2
Pat O’Driscoll (resigned on 16 May 2012)1 1 0
Michel Paulin 3 3
Bill Thomas (appointed on 13 February 2012) 3 3
Note:1 Pat O’Driscoll was unable to attend the meeting on 13 February 2012 due to illness.
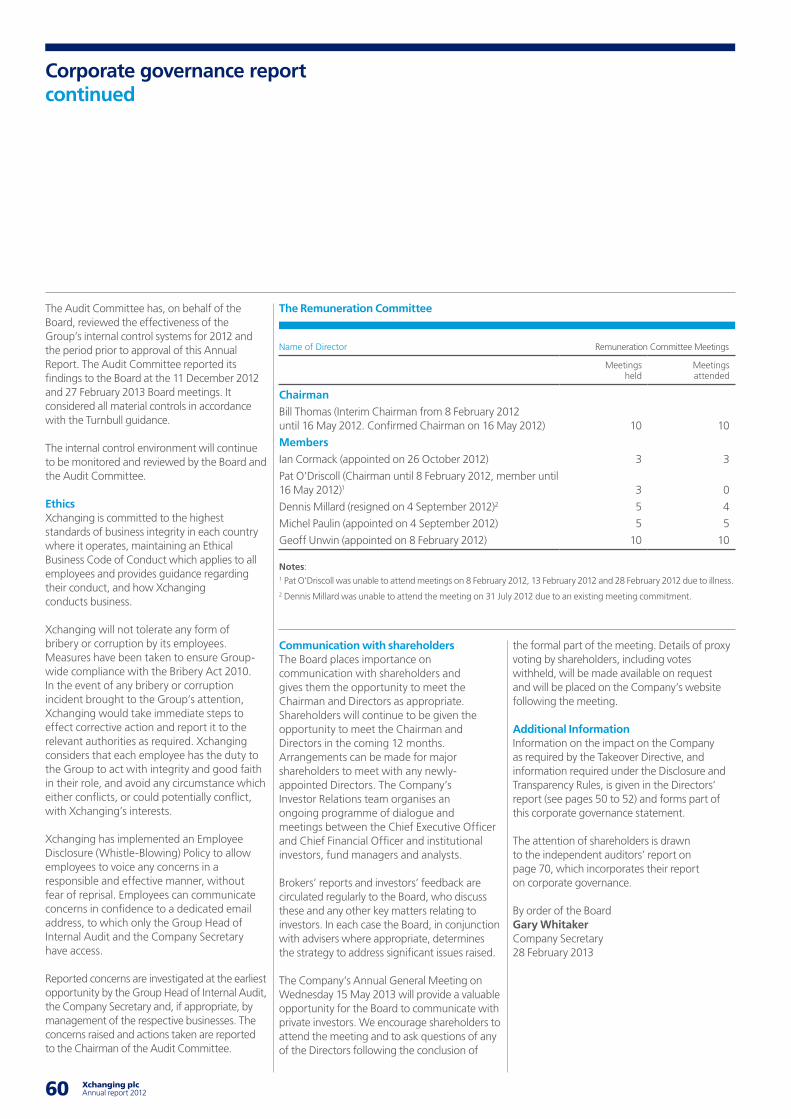
60 Xchanging plc Annual report 2012 61
Corporate governance reportcontinued
The Audit Committee has, on behalf of the Board, reviewed the effectiveness of the Group’s internal control systems for 2012 and the period prior to approval of this Annual Report. The Audit Committee reported its findings to the Board at the 11 December 2012 and 27 February 2013 Board meetings. It considered all material controls in accordance with the Turnbull guidance.
The internal control environment will continue to be monitored and reviewed by the Board and the Audit Committee.
EthicsXchanging is committed to the highest standards of business integrity in each country where it operates, maintaining an Ethical Business Code of Conduct which applies to all employees and provides guidance regarding their conduct, and how Xchanging conducts business.
Xchanging will not tolerate any form of bribery or corruption by its employees. Measures have been taken to ensure Group-wide compliance with the Bribery Act 2010. In the event of any bribery or corruption incident brought to the Group’s attention, Xchanging would take immediate steps to effect corrective action and report it to the relevant authorities as required. Xchanging considers that each employee has the duty to the Group to act with integrity and good faith in their role, and avoid any circumstance which either conflicts, or could potentially conflict, with Xchanging’s interests.
Xchanging has implemented an Employee Disclosure (Whistle-Blowing) Policy to allow employees to voice any concerns in a responsible and effective manner, without fear of reprisal. Employees can communicate concerns in confidence to a dedicated email address, to which only the Group Head of Internal Audit and the Company Secretary have access.
Reported concerns are investigated at the earliest opportunity by the Group Head of Internal Audit, the Company Secretary and, if appropriate, by management of the respective businesses. The concerns raised and actions taken are reported to the Chairman of the Audit Committee.
Communication with shareholdersThe Board places importance on communication with shareholders and gives them the opportunity to meet the Chairman and Directors as appropriate. Shareholders will continue to be given the opportunity to meet the Chairman and Directors in the coming 12 months. Arrangements can be made for major shareholders to meet with any newly-appointed Directors. The Company’s Investor Relations team organises an ongoing programme of dialogue and meetings between the Chief Executive Officer and Chief Financial Officer and institutional investors, fund managers and analysts.
Brokers’ reports and investors’ feedback are circulated regularly to the Board, who discuss these and any other key matters relating to investors. In each case the Board, in conjunction with advisers where appropriate, determines the strategy to address significant issues raised.
The Company’s Annual General Meeting on Wednesday 15 May 2013 will provide a valuable opportunity for the Board to communicate with private investors. We encourage shareholders to attend the meeting and to ask questions of any of the Directors following the conclusion of
the formal part of the meeting. Details of proxy voting by shareholders, including votes withheld, will be made available on request and will be placed on the Company’s website following the meeting.
Additional InformationInformation on the impact on the Company as required by the Takeover Directive, and information required under the Disclosure and Transparency Rules, is given in the Directors’ report (see pages 50 to 52) and forms part of this corporate governance statement.
The attention of shareholders is drawn to the independent auditors’ report on page 70, which incorporates their report on corporate governance.
By order of the BoardGary Whitaker Company Secretary 28 February 2013
The Remuneration Committee
Name of Director Remuneration Committee Meetings
Meetings held
Meetings attended
Chairman
Bill Thomas (Interim Chairman from 8 February 2012 until 16 May 2012. Confirmed Chairman on 16 May 2012) 10 10
Members
Ian Cormack (appointed on 26 October 2012) 3 3
Pat O’Driscoll (Chairman until 8 February 2012, member until 16 May 2012)1 3 0
Dennis Millard (resigned on 4 September 2012)2 5 4
Michel Paulin (appointed on 4 September 2012) 5 5
Geoff Unwin (appointed on 8 February 2012) 10 10
Notes:1 Pat O’Driscoll was unable to attend meetings on 8 February 2012, 13 February 2012 and 28 February 2012 due to illness.2 Dennis Millard was unable to attend the meeting on 31 July 2012 due to an existing meeting commitment.
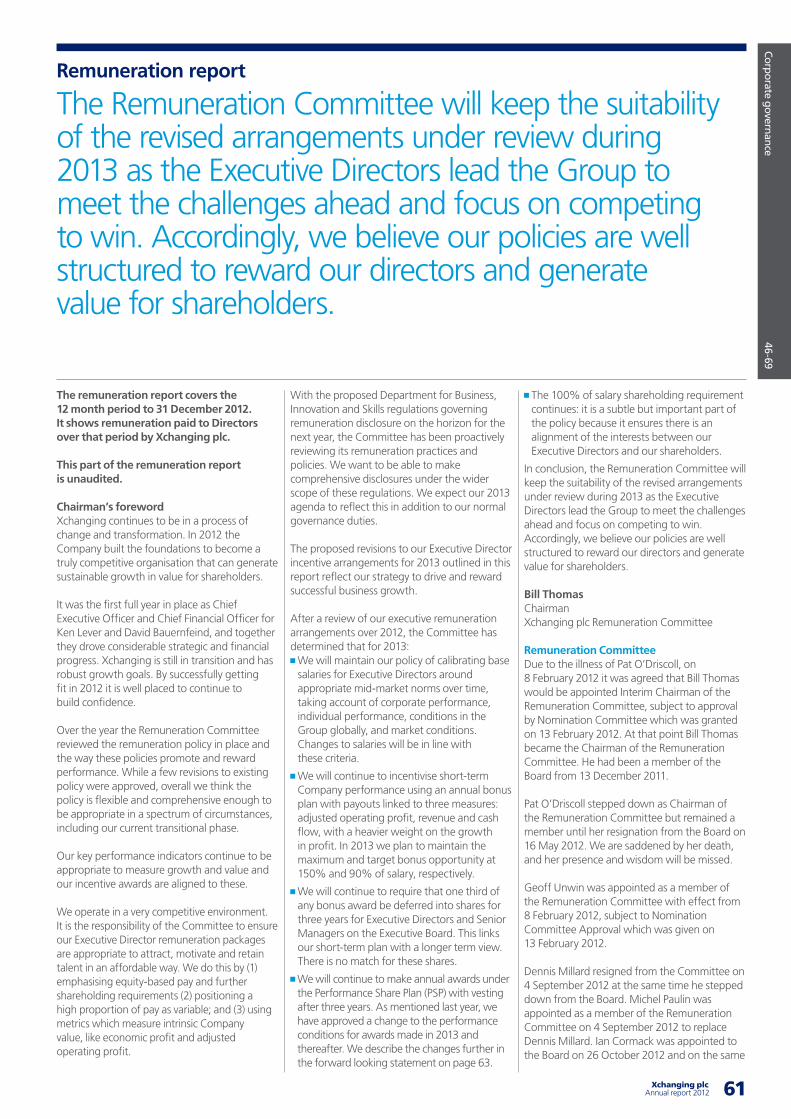
61 Xchanging plcAnnual report 2012
Corporate governance 46-69
The remuneration report covers the 12 month period to 31 December 2012. It shows remuneration paid to Directors over that period by Xchanging plc.
This part of the remuneration report is unaudited.
Chairman’s forewordXchanging continues to be in a process of change and transformation. In 2012 the Company built the foundations to become a truly competitive organisation that can generate sustainable growth in value for shareholders.
It was the first full year in place as Chief Executive Officer and Chief Financial Officer for Ken Lever and David Bauernfeind, and together they drove considerable strategic and financial progress. Xchanging is still in transition and has robust growth goals. By successfully getting fit in 2012 it is well placed to continue to build confidence.
Over the year the Remuneration Committee reviewed the remuneration policy in place and the way these policies promote and reward performance. While a few revisions to existing policy were approved, overall we think the policy is flexible and comprehensive enough to be appropriate in a spectrum of circumstances, including our current transitional phase.
Our key performance indicators continue to be appropriate to measure growth and value and our incentive awards are aligned to these.
We operate in a very competitive environment. It is the responsibility of the Committee to ensure our Executive Director remuneration packages are appropriate to attract, motivate and retain talent in an affordable way. We do this by (1) emphasising equity-based pay and further shareholding requirements (2) positioning a high proportion of pay as variable; and (3) using metrics which measure intrinsic Company value, like economic profit and adjusted operating profit.
With the proposed Department for Business, Innovation and Skills regulations governing remuneration disclosure on the horizon for the next year, the Committee has been proactively reviewing its remuneration practices and policies. We want to be able to make comprehensive disclosures under the wider scope of these regulations. We expect our 2013 agenda to reflect this in addition to our normal governance duties.
The proposed revisions to our Executive Director incentive arrangements for 2013 outlined in this report reflect our strategy to drive and reward successful business growth.
After a review of our executive remuneration arrangements over 2012, the Committee has determined that for 2013: We will maintain our policy of calibrating base salaries for Executive Directors around appropriate mid-market norms over time, taking account of corporate performance, individual performance, conditions in the Group globally, and market conditions. Changes to salaries will be in line with these criteria.
We will continue to incentivise short-term Company performance using an annual bonus plan with payouts linked to three measures: adjusted operating profit, revenue and cash flow, with a heavier weight on the growth in profit. In 2013 we plan to maintain the maximum and target bonus opportunity at 150% and 90% of salary, respectively.
We will continue to require that one third of any bonus award be deferred into shares for three years for Executive Directors and Senior Managers on the Executive Board. This links our short-term plan with a longer term view. There is no match for these shares.
We will continue to make annual awards under the Performance Share Plan (PSP) with vesting after three years. As mentioned last year, we have approved a change to the performance conditions for awards made in 2013 and thereafter. We describe the changes further in the forward looking statement on page 63.
The 100% of salary shareholding requirement continues: it is a subtle but important part of the policy because it ensures there is an alignment of the interests between our Executive Directors and our shareholders.
In conclusion, the Remuneration Committee will keep the suitability of the revised arrangements under review during 2013 as the Executive Directors lead the Group to meet the challenges ahead and focus on competing to win. Accordingly, we believe our policies are well structured to reward our directors and generate value for shareholders.
Bill Thomas Chairman Xchanging plc Remuneration Committee
Remuneration CommitteeDue to the illness of Pat O’Driscoll, on 8 February 2012 it was agreed that Bill Thomas would be appointed Interim Chairman of the Remuneration Committee, subject to approval by Nomination Committee which was granted on 13 February 2012. At that point Bill Thomas became the Chairman of the Remuneration Committee. He had been a member of the Board from 13 December 2011.
Pat O’Driscoll stepped down as Chairman of the Remuneration Committee but remained a member until her resignation from the Board on 16 May 2012. We are saddened by her death, and her presence and wisdom will be missed.
Geoff Unwin was appointed as a member of the Remuneration Committee with effect from 8 February 2012, subject to Nomination Committee Approval which was given on 13 February 2012.
Dennis Millard resigned from the Committee on 4 September 2012 at the same time he stepped down from the Board. Michel Paulin was appointed as a member of the Remuneration Committee on 4 September 2012 to replace Dennis Millard. Ian Cormack was appointed to the Board on 26 October 2012 and on the same
Remuneration report
The Remuneration Committee will keep the suitability of the revised arrangements under review during 2013 as the Executive Directors lead the Group to meet the challenges ahead and focus on competing to win. Accordingly, we believe our policies are well structured to reward our directors and generate value for shareholders.
62 Xchanging plc Annual report 2012 63
date he was appointed to the Remuneration Committee. He is the Senior Independent Director for the Company.
In summary, as of 31 December 2012, Bill Thomas, Geoff Unwin, Ian Cormack and Michel Paulin are members of the Remuneration Committee.
The Company Secretary is Secretary to the Remuneration Committee. Only Remuneration Committee members, the Company Secretary (except when his own remuneration is being directly considered) and the Global HR Director are entitled to attend meetings of the Remuneration Committee. However, the Chief Executive Officer (except when his own remuneration is being directly considered) and others including Directors may attend by invitation of the Chairman of the Remuneration Committee.
The Remuneration Committee’s primary purpose is to review the ongoing appropriateness of the remuneration policy as it applies to the Executive Directors and key senior management and to make recommendations on the framework for their remuneration and to determine their specific remuneration packages. In addition, the Remuneration Committee is responsible for monitoring the remuneration strategy and policy of the Group. In making its decisions, the Remuneration Committee considers both (i) the Employee, Social and Governance implications and (ii) the wider global employee compensation experience in making its decisions. For example, it receives annual reports on global pay budgets and employee pay benchmarking results. When overseeing variable pay matters, it is also mindful to ensure that inappropriate risk-taking is not incentivised.
The Remuneration Committee’s Terms of Reference can be found under the corporate governance section of the Xchanging website. The current Terms of Reference were approved by the Board on 11 December 2012.
The Remuneration Committee received advice from Towers Watson (our appointed advisers) and Clifford Chance during 2012. Towers Watson has also provided remuneration advice more widely to the Company with the permission of the Remuneration Committee. Towers Watson has signed the Remuneration
Consultants Code of Conduct and has made the code available to Xchanging. In 2012 Clifford Chance provided legal advice on the operation of share schemes, employment matters and legal advice more widely to the Company.
Remuneration policyXchanging’s remuneration policy is to ensure that we attract and retain key talent in order to create sustainable long-term value for shareholders. To help inform the Remuneration Committee, total remuneration is benchmarked periodically against companies of a similar size and international scope from the FTSE 250 (excluding financial services) in determining competitive remuneration levels for Executive Directors and senior executives. The Remuneration Committee has determined that this peer group remains appropriate for its UK-based executive talent.
Pay policy on the elements of pay may be amended during the year if the Remuneration Committee determines that it is needed to ensure the Company rewards its leaders for success and growth in a way that is neither excessive nor uncompetitive. The Remuneration Committee is committed to ensuring the Board’s approved business strategy clearly leads the drivers for variable pay plans. Regarding the overarching remuneration practice, the Remuneration Committee has agreed that the Executive Director remuneration philosophy for 2013 will remain as follows:
To position and maintain base salaries around competitive market practice over time. Mid-market base salary benchmarks will be determined by reference to the local geographic market for the role and its size and scope.
To reward our Executive Directors on Company success through use of a significant proportion of the remuneration opportunity for them in the form of variable compensation, conditional on sustainable Company performance. We will position the quantum of incentive pay so that there is a true distinction in total pay depending on the value and performance of the Company. To this end –
– Our annual bonus design is aligned to year-on-year increases in business performance beyond stretching thresholds and assessed each year for affordability. Performance
measures will be based on a balanced set of key value drivers of the business.
– Long-term incentives form part of our market competitive remuneration package. We make annual awards in the form of conditional shares because it aligns the interests of our executives with those of shareholders. Awards only vest when long-term sustainable returns to shareholders have been delivered.
– To encourage our Executive Directors and senior team to build a significant stake in the business over time.
The Remuneration Committee believes that the remuneration philosophy described above remains in the interests of shareholders and promotes the maintenance of a robust remuneration policy aligned with our strategic priorities. As stated in its terms of reference and in its corporate governance codes of duty, the Remuneration Committee will continue to monitor performance against the total remuneration policy to ensure that it achieves its aim of attracting, motivating and retaining the leaders and talent that is required to develop the Company to deliver shareholder value.
Remuneration for Executive Directors in 2013Remuneration packages for the Executive Directors will continue to consist of fixed pay and incentive pay. Fixed pay includes base salary, pension benefits and traditional benefits. Incentive pay includes eligibility in an annual bonus plan part of which includes a deferred share element, and awards under share based long-term incentive schemes. Following a review of remuneration policy the Remuneration Committee has approved some changes for 2013 to more closely align Xchanging’s executive incentive plans with our key value drivers. The Remuneration Committee believes the changes focus the existing structures on providing greater line of sight to both Xchanging investors and the Executive Directors.
Base salaryThe base salaries for the Executive Directors have been reviewed by the Remuneration Committee, taking into account the global pay budget, the pay policy in place and performance in the year reported on.
Remuneration reportcontinued
63 Xchanging plcAnnual report 2012
Corporate governance 46-69
“ To reward our Executive Directors on Company success through use of a significant proportion of the remuneration opportunity for them in the form of variable compensation, conditional on sustainable Company performance.”
Consideration was given to the 2013 salary budgets of the Group’s global workforce, which ranged between 2% and 11% depending on business unit and location.
There will be no amendment to the annual base pay earned by the Chief Executive Officer which will remain at £475,000 per annum. The Chief Financial Officer will receive a 5% increase in his annual base salary to £315,000.
Annual bonus plan for 2013Maximum annual bonus opportunity will remain at 150% of salary and the target opportunity, for reaching the challenging business plan for 2013, is almost 60% of maximum pay-out (i.e. 90% of base salary). Maintaining this policy reflects the current environment in which the business operates whilst also providing management with an incentive to deliver the agreed business strategy. Funding of the bonus pool begins when the threshold profit-based hurdles are achieved. As in 2012, the 2013 Xchanging Bonus plan for Executive Directors does not include a non-financial performance element. Performance will be measured over three key metrics: adjusted operating profit (50% of bonus);
revenue growth (30% of bonus); and
operating cash flow targets (20% of bonus).
For 2013, our adjusted operating profit target carries a greater weight than revenue or cash flow to maintain focus on an improvement in overall performance. Payment of bonuses will only commence after achieving stretching performance hurdles for each metric which are determined at the outset of the year. Each metric is considered separately and also in totality with targets set to ensure that the proportion spent is affordable and aligned with investor returns. Performance will be assessed between each respective hurdle rate and plan maximum on a sliding scale basis. The targets are set so that if achievable but challenging targets on a growth trajectory in all three metrics are met, then an amount equal to 90% of salary could pay out as a bonus payment.
All Executive Directors and management board members participate in the deferred bonus plan to ensure awards are based on sustainable Company performance and to align
management to shareholders. For our Executive Directors one third of any bonus earned will be deferred into nil cost options which will vest after three years and will continue to be exercisable for a further seven years. Should a participant in the plan leave before vesting, the award lapses and the deferred amount is no longer available to exercise. The Remuneration Committee has discretion to determine whether the award lapses. The policy for Executive Directors who give notice is to lapse their award. In accordance with best practice, the Remuneration Committee has also agreed to introduce specific claw-back provisions in 2013 on any deferred share element of the bonus.
Long-term incentives in 2013Over the course of 2012 the Committee undertook a review of existing long-term incentive arrangements to ensure that they remain appropriate. In assessing the arrangements the Committee was mindful of the following guiding principles for incentives: they should be simple to understand and communicate;
they should provide management with incentives that are appropriately geared and represent an acceptable cost to the Company and shareholders;
they should be based on goals that are challenging but achievable.
For 2013 it was determined that long-term incentive awards under the Xchanging plc 2007 Performance Share Plan (PSP) will continue under the current policy for Executive Directors, which is annual grants at 150% of salary under normal circumstances. Our policy continues to be that 0% to 100% of salary is in the form of a Basic award and 0% to 50% of salary is in the form of a Stretch award which is intended to reflect exceptional performance.
However, the Remuneration Committee has approved a revision to the performance conditions used to determine vesting of awards. For 2013, economic profit has replaced return on invested capital (“ROIC”) as a performance condition. Awards will continue to split between absolute total shareholder return (“TSR”) and economic profit on a two thirds to one third basis beginning with grants in 2013.
The Remuneration Committee believes that given the business progress made to date, growth in economic profit is now a better measure than ROIC to align pay to (i) value enhancing growth in the business and (ii) long-term shareholder value creation. In particular, the Remuneration Committee considers economic profit to more accurately reflect the underlying performance of the Company because it takes into account a charge for the operating assets used to deliver profit, with targets based on year-on-year growth. Economic profit is a measure that ties in profitability, a key component of our growth strategy, which ROIC overlooks. For example, in the short term a company could achieve a high ROIC even with a small profit by simply under-investing in the business.
Under current policy, our targets for each metric are reviewed annually and adjusted based on current forecasts and analysts’ expectations.
For 2013, the TSR growth targets will be calibrated to commence pay outs only if performance exceeds the notional cost of capital over the performance period. The Basic award will begin to vest if absolute TSR exceeds 10% compound growth per annum with 16.67% vesting for threshold performance and maximum vesting (or 66.67% of the total Basic award) if absolute TSR grows by 16.7% per annum over the three year period. The Stretch award will begin to vest where absolute TSR exceeds 16.7% per annum rising to maximum vesting (or 66.67% of the total Stretch award) for absolute TSR growth of 20% or more per annum. The TSR value is determind on an end-to-end basis, assumes dividends are reinvested and averages the start and end share price over three months before the relevant date. Vesting is calculated on a straight line basis.
The remaining one third of the award will be structured on a similar basis for economic profit. Vesting of that portion of the Basic award occurs if three year average economic profit (i.e. after a charge for tax and the cost of capital) is at least £22.3 million rising to 33.33% of the total Basic award vesting if three year average growth per annumn in economic profit is 15%. The Stretch element will begin to vest where three year average per annum economic profit growth exceeds 15% rising to maximum
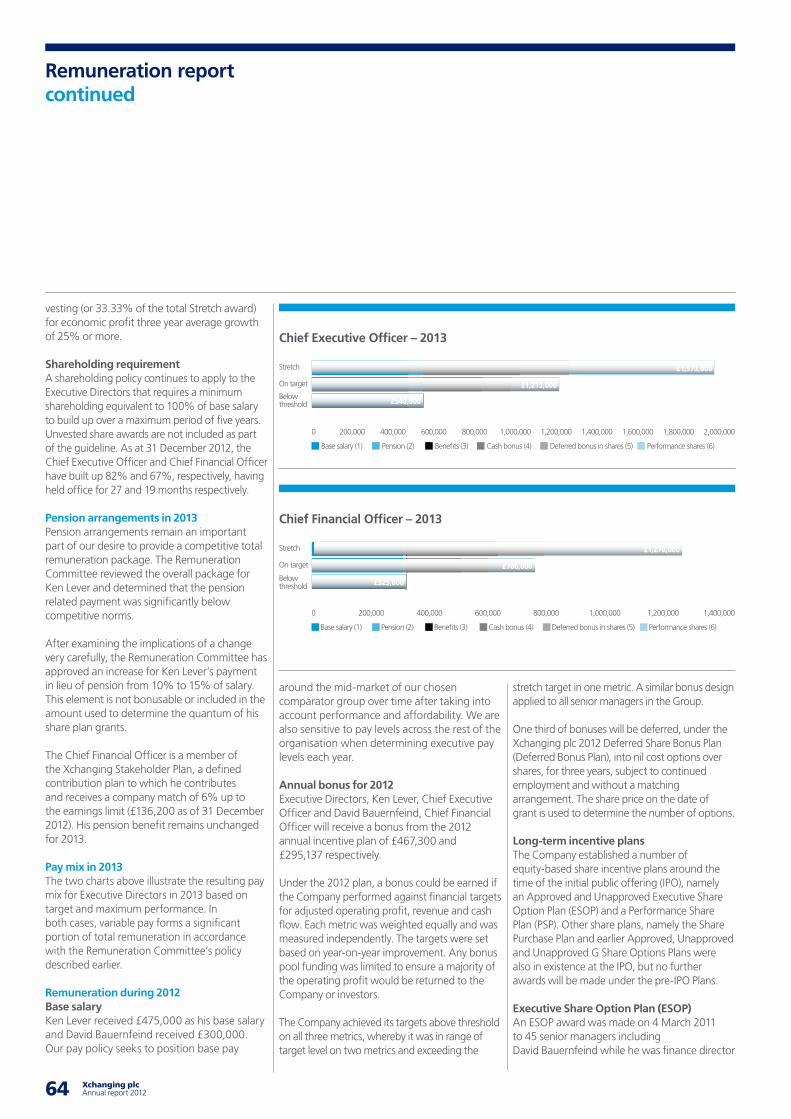
64 Xchanging plc Annual report 2012 65
vesting (or 33.33% of the total Stretch award) for economic profit three year average growth of 25% or more.
Shareholding requirementA shareholding policy continues to apply to the Executive Directors that requires a minimum shareholding equivalent to 100% of base salary to build up over a maximum period of five years. Unvested share awards are not included as part of the guideline. As at 31 December 2012, the Chief Executive Officer and Chief Financial Officer have built up 82% and 67%, respectively, having held office for 27 and 19 months respectively.
Pension arrangements in 2013Pension arrangements remain an important part of our desire to provide a competitive total remuneration package. The Remuneration Committee reviewed the overall package for Ken Lever and determined that the pension related payment was significantly below competitive norms.
After examining the implications of a change very carefully, the Remuneration Committee has approved an increase for Ken Lever’s payment in lieu of pension from 10% to 15% of salary. This element is not bonusable or included in the amount used to determine the quantum of his share plan grants.
The Chief Financial Officer is a member of the Xchanging Stakeholder Plan, a defined contribution plan to which he contributes and receives a company match of 6% up to the earnings limit (£136,200 as of 31 December 2012). His pension benefit remains unchanged for 2013.
Pay mix in 2013The two charts above illustrate the resulting pay mix for Executive Directors in 2013 based on target and maximum performance. In both cases, variable pay forms a significant portion of total remuneration in accordance with the Remuneration Committee’s policy described earlier.
Remuneration during 2012Base salary Ken Lever received £475,000 as his base salary and David Bauernfeind received £300,000. Our pay policy seeks to position base pay
around the mid-market of our chosen comparator group over time after taking into account performance and affordability. We are also sensitive to pay levels across the rest of the organisation when determining executive pay levels each year.
Annual bonus for 2012Executive Directors, Ken Lever, Chief Executive Officer and David Bauernfeind, Chief Financial Officer will receive a bonus from the 2012 annual incentive plan of £467,300 and £295,137 respectively.
Under the 2012 plan, a bonus could be earned if the Company performed against financial targets for adjusted operating profit, revenue and cash flow. Each metric was weighted equally and was measured independently. The targets were set based on year-on-year improvement. Any bonus pool funding was limited to ensure a majority of the operating profit would be returned to the Company or investors.
The Company achieved its targets above threshold on all three metrics, whereby it was in range of target level on two metrics and exceeding the
stretch target in one metric. A similar bonus design applied to all senior managers in the Group.
One third of bonuses will be deferred, under the Xchanging plc 2012 Deferred Share Bonus Plan (Deferred Bonus Plan), into nil cost options over shares, for three years, subject to continued employment and without a matching arrangement. The share price on the date of grant is used to determine the number of options.
Long-term incentive plansThe Company established a number of equity-based share incentive plans around the time of the initial public offering (IPO), namely an Approved and Unapproved Executive Share Option Plan (ESOP) and a Performance Share Plan (PSP). Other share plans, namely the Share Purchase Plan and earlier Approved, Unapproved and Unapproved G Share Options Plans were also in existence at the IPO, but no further awards will be made under the pre-IPO Plans.
Executive Share Option Plan (ESOP)An ESOP award was made on 4 March 2011 to 45 senior managers including David Bauernfeind while he was finance director
Chief Executive Officer – 2013
0 200,000 400,000 600,000 800,000 1,000,000 1,200,000 1,400,000 1,600,000 1,800,000 2,000,000
Belowthreshold
£1,973,000
On target £1,213,000
Stretch
£548,000
Benefits (3) Performance shares (6)Deferred bonus in shares (5)Cash bonus (4)Pension (2)Base salary (1)
Chief Financial Officer – 2013
Belowthreshold
£1,270,000
On target £766,000
Stretch
£325,000
Benefits (3) Performance shares (6)Deferred bonus in shares (5)Cash bonus (4)Pension (2)Base salary (1)
0 200,000 400,000 600,000 800,000 1,000,000 1,200,000 1,400,000
Remuneration reportcontinued
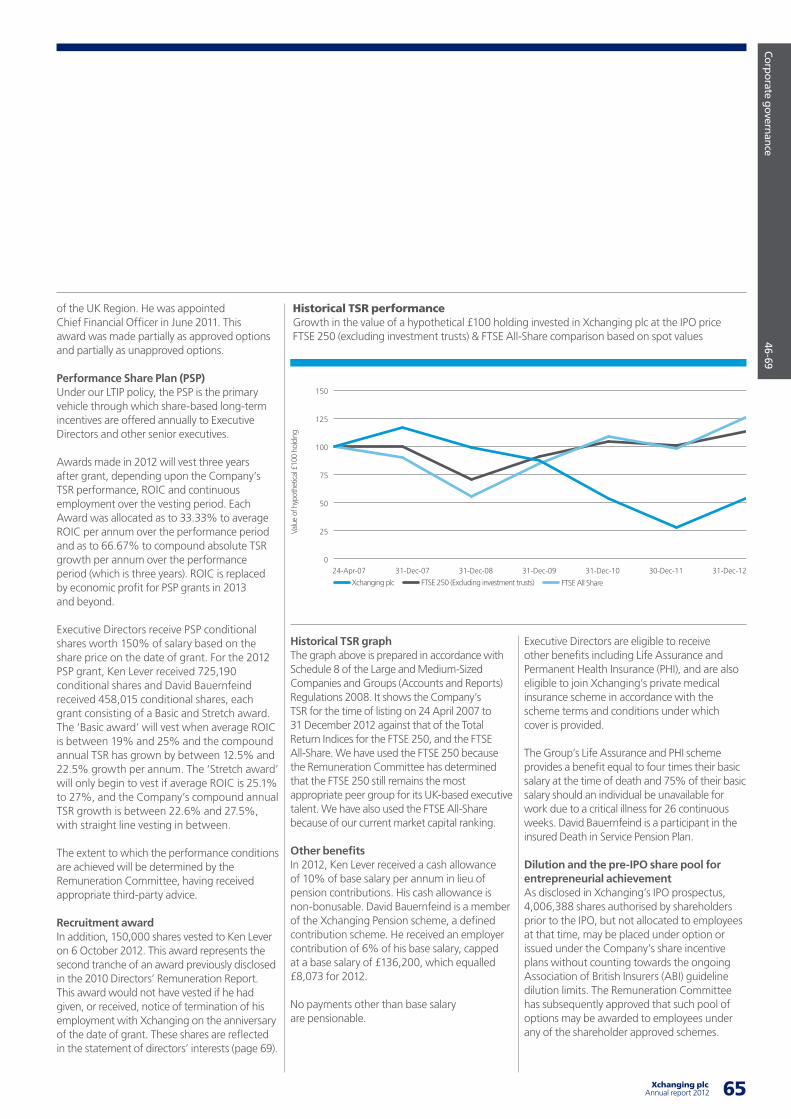
65 Xchanging plcAnnual report 2012
Corporate governance 46-69
of the UK Region. He was appointed Chief Financial Officer in June 2011. This award was made partially as approved options and partially as unapproved options.
Performance Share Plan (PSP) Under our LTIP policy, the PSP is the primary vehicle through which share-based long-term incentives are offered annually to Executive Directors and other senior executives.
Awards made in 2012 will vest three years after grant, depending upon the Company’s TSR performance, ROIC and continuous employment over the vesting period. Each Award was allocated as to 33.33% to average ROIC per annum over the performance period and as to 66.67% to compound absolute TSR growth per annum over the performance period (which is three years). ROIC is replaced by economic profit for PSP grants in 2013 and beyond.
Executive Directors receive PSP conditional shares worth 150% of salary based on the share price on the date of grant. For the 2012 PSP grant, Ken Lever received 725,190 conditional shares and David Bauernfeind received 458,015 conditional shares, each grant consisting of a Basic and Stretch award. The ‘Basic award’ will vest when average ROIC is between 19% and 25% and the compound annual TSR has grown by between 12.5% and 22.5% growth per annum. The ‘Stretch award’ will only begin to vest if average ROIC is 25.1% to 27%, and the Company’s compound annual TSR growth is between 22.6% and 27.5%, with straight line vesting in between.
The extent to which the performance conditions are achieved will be determined by the Remuneration Committee, having received appropriate third-party advice.
Recruitment awardIn addition, 150,000 shares vested to Ken Lever on 6 October 2012. This award represents the second tranche of an award previously disclosed in the 2010 Directors’ Remuneration Report. This award would not have vested if he had given, or received, notice of termination of his employment with Xchanging on the anniversary of the date of grant. These shares are reflected in the statement of directors’ interests (page 69).
Historical TSR graph The graph above is prepared in accordance with Schedule 8 of the Large and Medium-Sized Companies and Groups (Accounts and Reports) Regulations 2008. It shows the Company’s TSR for the time of listing on 24 April 2007 to 31 December 2012 against that of the Total Return Indices for the FTSE 250, and the FTSE All-Share. We have used the FTSE 250 because the Remuneration Committee has determined that the FTSE 250 still remains the most appropriate peer group for its UK-based executive talent. We have also used the FTSE All-Share because of our current market capital ranking.
Other benefits In 2012, Ken Lever received a cash allowance of 10% of base salary per annum in lieu of pension contributions. His cash allowance is non-bonusable. David Bauernfeind is a member of the Xchanging Pension scheme, a defined contribution scheme. He received an employer contribution of 6% of his base salary, capped at a base salary of £136,200, which equalled £8,073 for 2012.
No payments other than base salary are pensionable.
Executive Directors are eligible to receive other benefits including Life Assurance and Permanent Health Insurance (PHI), and are also eligible to join Xchanging’s private medical insurance scheme in accordance with the scheme terms and conditions under which cover is provided.
The Group’s Life Assurance and PHI scheme provides a benefit equal to four times their basic salary at the time of death and 75% of their basic salary should an individual be unavailable for work due to a critical illness for 26 continuous weeks. David Bauernfeind is a participant in the insured Death in Service Pension Plan.
Dilution and the pre-IPO share pool for entrepreneurial achievement As disclosed in Xchanging’s IPO prospectus, 4,006,388 shares authorised by shareholders prior to the IPO, but not allocated to employees at that time, may be placed under option or issued under the Company’s share incentive plans without counting towards the ongoing Association of British Insurers (ABI) guideline dilution limits. The Remuneration Committee has subsequently approved that such pool of options may be awarded to employees under any of the shareholder approved schemes.
Valu
e of
hyp
othe
tical
£10
0 ho
ldin
g
Xchanging plc FTSE 250 (Excluding investment trusts) FTSE All Share
0
25
50
75
100
125
150
31-Dec-1230-Dec-1131-Dec-1031-Dec-0931-Dec-0831-Dec-0724-Apr-07
Historical TSR performanceGrowth in the value of a hypothetical £100 holding invested in Xchanging plc at the IPO price FTSE 250 (excluding investment trusts) & FTSE All-Share comparison based on spot values
66 Xchanging plc Annual report 2012 67
Remuneration reportcontinued
Service contracts Executive Directors have service contracts with notice periods of 12 months from either the Director or the Company. This is in line with best practice for listed companies. The Company has the right to terminate the employment of an Executive Director without notice or with less than 12 months’ notice by making a payment in lieu of notice equal to the base salary the Executive Director would be entitled to receive during any unexpired period of the notice period.
Non-executive Directorships and other external appointmentsKen Lever continues to be a member of the Accounting Council for which he received fees of £15,000 during 2012. This is a professional body membership, not a Non-executive position of a listed entity.
He was also appointed a Non-executive Director of FM Insurance Company Limited, a subsidiary of FM Global, and has received fees of £28,000 during 2012.
Non-executive Directors Geoff Unwin was appointed Non-executive Director on 1 December 2011 which was for an initial term of four years unless terminated earlier by either party with six months’ notice.
Bill Thomas was appointed as Non-executive Director on 1 December 2011 for an initial term of three years.
Michel Paulin was appointed Non-executive Director on 1 January 2010, and he has been appointed for a period of three years from 27 April 2010.
Ian Cormack was appointed Non-executive Director on the Board on 26 October 2012 for an initial term of three years.
Stephen Wilson was appointed Non-executive Director on the Board on 1 July 2012 for an initial term of three years.
Saurabh Srivastava was appointed Non-executive Director on the Board on 4 September 2012 for an initial term of three years.
The fees paid to Non-executive Directors are reviewed regularly. In setting the fees, a review of current market practice is undertaken which takes into account time commitment and responsibilities. The fees payable to Non-executive Directors are ratified by the Board, based both on the recommendations of the Executive Directors and the Chairman. The fee policy for the Non-executive Directors is to pay an annual fee of £40,000, an additional fee of £10,000 per annum for chairing a Committee, and no separate fee for membership of a Committee. The Senior Independent Director receives a £10,000 top up to the standard fees, beyond any Committee Chairmanship. Our policy for fees for our Chairman of the Board is to ensure the fee structure attracts and retains the right calibre of candidate needed within the applicable corporate governance guidelines. The fee of Geoff Unwin is discussed further on page 67.
The Non-executive Directors do not participate in the Company’s incentive or pension schemes, nor do they receive any employee benefits. The Company will reimburse all expenses reasonably incurred by the Non-executive Directors in the performance of their duties. The Company has obtained appropriate directors’ and officers’ liability insurance. All fees to Non-executive Directors will cease to accrue with effect from the date of ceasing to be a Non-executive Director for whatever reason. No director is involved in setting their own pay. A Director is not present at any meetings where his pay is discussed.
Chairman of the BoardGeoff Unwin was appointed as a Non-executive Director on 1 December 2011 and was appointed Chairman on 1 January 2012.
Geoff Unwin receives a fee of £160,000 per annum which is subject to review after three years and thereafter annually.
On appointment, Geoff Unwin purchased with his own funds 270,908 shares in Xchanging which he is expected to hold for at least four years.
In the event that Xchanging is acquired by a third party for a price per share in excess of £1.00 before 2 December 2015 the Company will match Geoff Unwin’s purchased shares he still holds on a one for one basis.
Should Geoff Unwin cease to be a director at any time as a result of death, disability or any other reason but not including resignation before 2 December 2015 and before such date Xchanging is acquired by a third party for a price per share in excess of £1.00, the Board may in its sole discretion match Geoff Unwin’s purchased shares on a one for one basis.
Though the share matching and the absence of a requirement to hold the matched shares for a period of time is not compliant with D.1.3 of the Code, the terms of Geoff Unwin’s remuneration were discussed with the major shareholders in advance of his appointment. The Board has decided that this arrangement does not threaten his independence, nor does it alter his ability to steward the Company in a way which adheres to corporate governance standards.
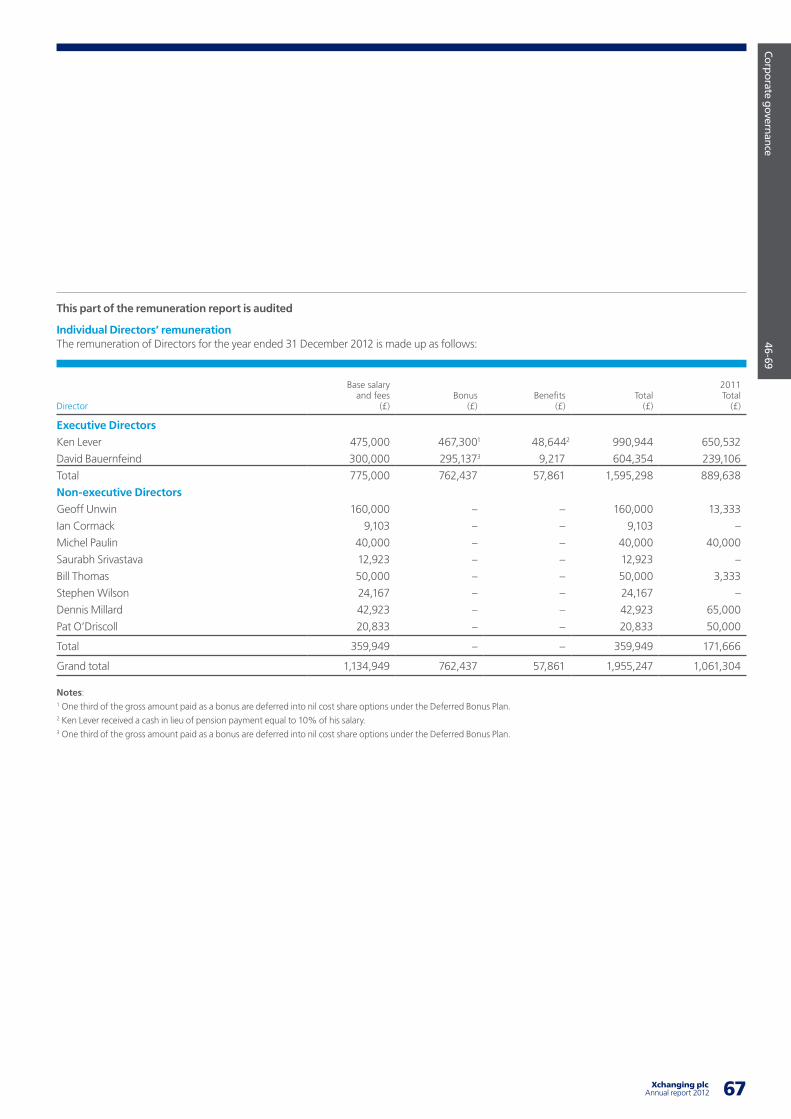
67 Xchanging plcAnnual report 2012
Corporate governance 46-69
This part of the remuneration report is audited
Individual Directors’ remunerationThe remuneration of Directors for the year ended 31 December 2012 is made up as follows:
Director
Base salary and fees
(£)Bonus
(£)Benefits
(£)Total
(£)
2011 Total
(£)
Executive Directors
Ken Lever 475,000 467,3001 48,6442 990,944 650,532
David Bauernfeind 300,000 295,1373 9,217 604,354 239,106
Total 775,000 762,437 57,861 1,595,298 889,638
Non-executive Directors
Geoff Unwin 160,000 – – 160,000 13,333
Ian Cormack 9,103 – – 9,103 –
Michel Paulin 40,000 – – 40,000 40,000
Saurabh Srivastava 12,923 – – 12,923 –
Bill Thomas 50,000 – – 50,000 3,333
Stephen Wilson 24,167 – – 24,167 –
Dennis Millard 42,923 – – 42,923 65,000
Pat O’Driscoll 20,833 – – 20,833 50,000
Total 359,949 – – 359,949 171,666
Grand total 1,134,949 762,437 57,861 1,955,247 1,061,304
Notes:1 One third of the gross amount paid as a bonus are deferred into nil cost share options under the Deferred Bonus Plan.2 Ken Lever received a cash in lieu of pension payment equal to 10% of his salary.3 One third of the gross amount paid as a bonus are deferred into nil cost share options under the Deferred Bonus Plan.
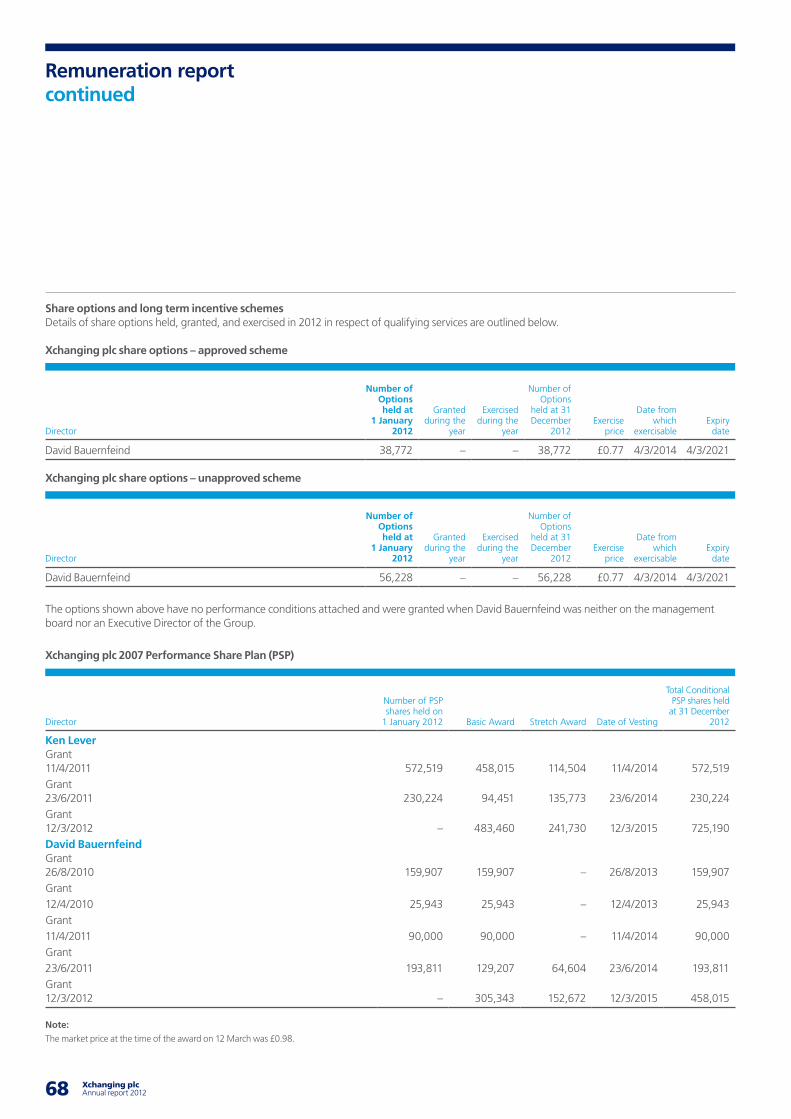
68 Xchanging plc Annual report 2012 69
Remuneration reportcontinued
Share options and long term incentive schemesDetails of share options held, granted, and exercised in 2012 in respect of qualifying services are outlined below.
Xchanging plc share options – approved scheme
Xchanging plc share options – unapproved scheme
The options shown above have no performance conditions attached and were granted when David Bauernfeind was neither on the management board nor an Executive Director of the Group.
Director
Number of Options held at
1 January 2012
Granted during the
year
Exercised during the
year
Number of Options
held at 31 December
2012Exercise
price
Date from which
exercisableExpiry
date
David Bauernfeind 38,772 – – 38,772 £0.77 4/3/2014 4/3/2021
Director
Number of Options held at
1 January 2012
Granted during the
year
Exercised during the
year
Number of Options
held at 31 December
2012Exercise
price
Date from which
exercisableExpiry
date
David Bauernfeind 56,228 – – 56,228 £0.77 4/3/2014 4/3/2021
Xchanging plc 2007 Performance Share Plan (PSP)
Director
Number of PSP shares held on
1 January 2012 Basic Award Stretch Award Date of Vesting
Total Conditional PSP shares held
at 31 December 2012
Ken Lever Grant 11/4/2011 572,519 458,015 114,504 11/4/2014 572,519Grant 23/6/2011 230,224 94,451 135,773 23/6/2014 230,224Grant 12/3/2012 – 483,460 241,730 12/3/2015 725,190David Bauernfeind Grant 26/8/2010 159,907 159,907 – 26/8/2013 159,907Grant12/4/2010 25,943 25,943 – 12/4/2013 25,943Grant11/4/2011 90,000 90,000 – 11/4/2014 90,000Grant23/6/2011 193,811 129,207 64,604 23/6/2014 193,811Grant 12/3/2012 – 305,343 152,672 12/3/2015 458,015
Note:
The market price at the time of the award on 12 March was £0.98.
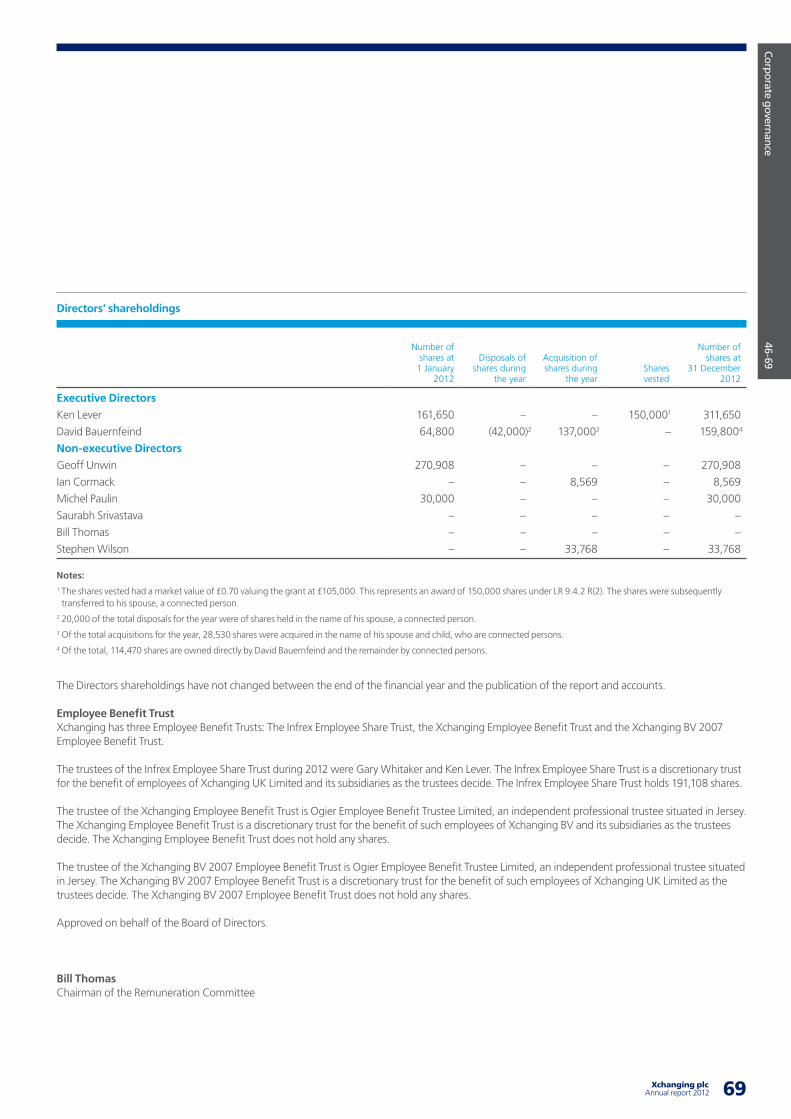
69 Xchanging plcAnnual report 2012
Corporate governance 46-69
Directors’ shareholdings
Number of shares at
1 January 2012
Disposals of shares during
the year
Acquisition of shares during
the yearShares vested
Number of shares at
31 December 2012
Executive Directors
Ken Lever 161,650 – – 150,0001 311,650
David Bauernfeind 64,800 (42,000)2 137,0003 – 159,8004
Non-executive Directors
Geoff Unwin 270,908 – – – 270,908
Ian Cormack – – 8,569 – 8,569
Michel Paulin 30,000 – – – 30,000
Saurabh Srivastava – – – – –
Bill Thomas – – – – –
Stephen Wilson – – 33,768 – 33,768
Notes:1 The shares vested had a market value of £0.70 valuing the grant at £105,000. This represents an award of 150,000 shares under LR 9.4.2 R(2). The shares were subsequently transferred to his spouse, a connected person.
2 20,000 of the total disposals for the year were of shares held in the name of his spouse, a connected person.3 Of the total acquisitions for the year, 28,530 shares were acquired in the name of his spouse and child, who are connected persons.4 Of the total, 114,470 shares are owned directly by David Bauernfeind and the remainder by connected persons.
The Directors shareholdings have not changed between the end of the financial year and the publication of the report and accounts.
Employee Benefit Trust Xchanging has three Employee Benefit Trusts: The Infrex Employee Share Trust, the Xchanging Employee Benefit Trust and the Xchanging BV 2007 Employee Benefit Trust.
The trustees of the Infrex Employee Share Trust during 2012 were Gary Whitaker and Ken Lever. The Infrex Employee Share Trust is a discretionary trust for the benefit of employees of Xchanging UK Limited and its subsidiaries as the trustees decide. The Infrex Employee Share Trust holds 191,108 shares.
The trustee of the Xchanging Employee Benefit Trust is Ogier Employee Benefit Trustee Limited, an independent professional trustee situated in Jersey. The Xchanging Employee Benefit Trust is a discretionary trust for the benefit of such employees of Xchanging BV and its subsidiaries as the trustees decide. The Xchanging Employee Benefit Trust does not hold any shares.
The trustee of the Xchanging BV 2007 Employee Benefit Trust is Ogier Employee Benefit Trustee Limited, an independent professional trustee situated in Jersey. The Xchanging BV 2007 Employee Benefit Trust is a discretionary trust for the benefit of such employees of Xchanging UK Limited as the trustees decide. The Xchanging BV 2007 Employee Benefit Trust does not hold any shares.
Approved on behalf of the Board of Directors.
Bill Thomas Chairman of the Remuneration Committee
70 Xchanging plc Annual report 2012 7170 Xchanging plc Annual report 2012 71
We have audited the Group financial statements of Xchanging plc for the year ended 31 December 2012, which comprise the Consolidated income statement, the Consolidated statement of comprehensive income, the Consolidated cash flow statement, the Reconciliation of net cash flow to movement in net cash, the Movement in net cash, the Consolidated balance sheet, the Consolidated statement of changes in equity, and the related notes. The financial reporting framework that has been applied in their preparation is applicable law and International Financial Reporting Standards (IFRSs) as adopted by the European Union.
Respective responsibilities of directors and auditors As explained more fully in the Statement of Directors’ responsibilities set out on page 52, the Directors are responsible for the preparation of the Group financial statements and for being satisfied that they give a true and fair view. Our responsibility is to audit and express an opinion on the Group financial statements in accordance with applicable law and International Standards on Auditing (UK and Ireland). Those standards require us to comply with the Auditing Practices Board’s Ethical Standards for Auditors.
This report, including the opinions, has been prepared for and only for the Company’s members as a body in accordance with Chapter 3 of Part 16 of the Companies Act 2006 and for no other purpose. We do not, in giving these opinions, accept or assume responsibility for any other purpose or to any other person to whom this report is shown or into whose hands it may come save where expressly agreed by our prior consent in writing.
Scope of the audit of the financial statements An audit involves obtaining evidence about the amounts and disclosures in the financial statements sufficient to give reasonable assurance that the financial statements are free from material misstatement, whether caused by fraud or error. This includes an assessment of: whether the accounting policies are appropriate to the Group’s circumstances and have been consistently applied and adequately disclosed; the reasonableness of significant accounting estimates made by the Directors; and the overall presentation of the financial statements. In addition, we read all the financial and non-financial information in the annual report to identify material inconsistencies with the audited financial statements. If we become aware of any apparent material misstatements or inconsistencies we consider the implications for our report.
Opinion on financial statements In our opinion the Group financial statements: give a true and fair view of the state of the Group’s affairs as at 31 December 2012 and of its profit and cash flows for the year then ended;
have been properly prepared in accordance with IFRSs as adopted by the European Union; and
have been prepared in accordance with the requirements of the Companies Act 2006 and Article 4 of the lAS Regulation.
Opinion on other matters prescribed by the Companies Act 2006 In our opinion: the information given in the Directors’ Report for the financial year for which the Group financial statements are prepared is consistent with the Group financial statements; and
the information given in the Corporate Governance Statement set out on pages 53 to 60 with respect to internal control and risk management systems and about share capital structures is consistent with the financial statements.
Matters on which we are required to report by exception We have nothing to report in respect of the following:
Under the Companies Act 2006 we are required to report to you if, in our opinion: certain disclosures of Directors’ remuneration specified by law are not made; or
we have not received all the information and explanations we require for our audit; or
a corporate governance statement has not been prepared by the Parent Company.
Under the Listing Rules we are required to review: the Directors’ statement, set out on page 52, in relation to going concern;
the part of the Corporate Governance Statement relating to the Company’s compliance with the nine provisions of the UK Corporate Governance Code specified for our review; and
certain elements of the report to shareholders by the Board on Directors’ remuneration.
Other matter We have reported separately on the Parent Company financial statements of Xchanging plc for the year ended 31 December 2012 and on the information in the Remuneration Report that is described as having been audited.
Paul Aitken (Senior Statutory Auditor)for and on behalf of PricewaterhouseCoopers LLPChartered Accountants and Statutory Auditors London
28 February 2013
Independent auditors’ report to the members of Xchanging plc on the Group financial statements
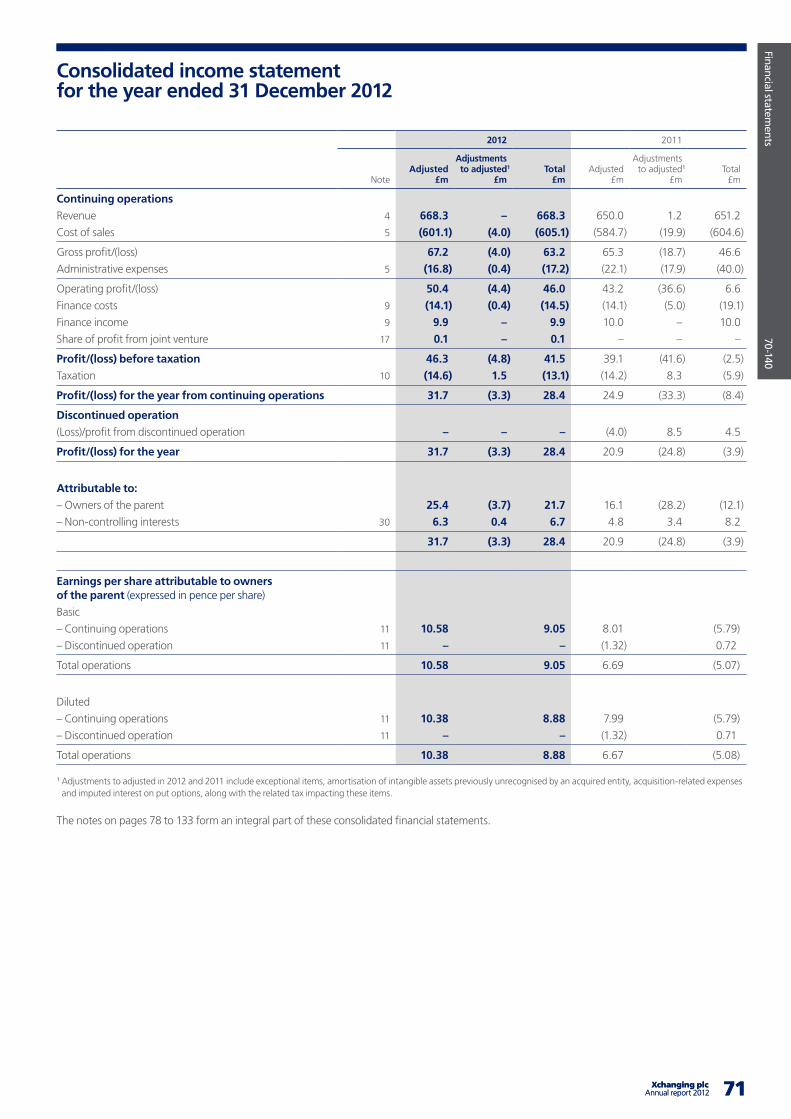
Company overview
X
X-X
X
71 Xchanging plcAnnual report 2012 71 Xchanging plcAnnual report 2012
Financial statements
70-140
Consolidated income statement for the year ended 31 December 2012
2012 2011
NoteAdjusted
£m
Adjustments to adjusted1
£mTotal
£mAdjusted
£m
Adjustmentsto adjusted1
£mTotal
£m
Continuing operations
Revenue 4 668.3 – 668.3 650.0 1.2 651.2
Cost of sales 5 (601.1) (4.0) (605.1) (584.7) (19.9) (604.6)
Gross profit/(loss) 67.2 (4.0) 63.2 65.3 (18.7) 46.6
Administrative expenses 5 (16.8) (0.4) (17.2) (22.1) (17.9) (40.0)
Operating profit/(loss) 50.4 (4.4) 46.0 43.2 (36.6) 6.6
Finance costs 9 (14.1) (0.4) (14.5) (14.1) (5.0) (19.1)
Finance income 9 9.9 – 9.9 10.0 – 10.0
Share of profit from joint venture 17 0.1 – 0.1 – – –
Profit/(loss) before taxation 46.3 (4.8) 41.5 39.1 (41.6) (2.5)
Taxation 10 (14.6) 1.5 (13.1) (14.2) 8.3 (5.9)
Profit/(loss) for the year from continuing operations 31.7 (3.3) 28.4 24.9 (33.3) (8.4)
Discontinued operation
(Loss)/profit from discontinued operation – – – (4.0) 8.5 4.5
Profit/(loss) for the year 31.7 (3.3) 28.4 20.9 (24.8) (3.9)
Attributable to:
– Owners of the parent 25.4 (3.7) 21.7 16.1 (28.2) (12.1)
– Non-controlling interests 30 6.3 0.4 6.7 4.8 3.4 8.2
31.7 (3.3) 28.4 20.9 (24.8) (3.9)
Earnings per share attributable to owners of the parent (expressed in pence per share)
Basic
– Continuing operations 11 10.58 9.05 8.01 (5.79)
– Discontinued operation 11 – – (1.32) 0.72
Total operations 10.58 9.05 6.69 (5.07)
Diluted
– Continuing operations 11 10.38 8.88 7.99 (5.79)
– Discontinued operation 11 – – (1.32) 0.71
Total operations 10.38 8.88 6.67 (5.08)
1 Adjustments to adjusted in 2012 and 2011 include exceptional items, amortisation of intangible assets previously unrecognised by an acquired entity, acquisition-related expenses and imputed interest on put options, along with the related tax impacting these items.
The notes on pages 78 to 133 form an integral part of these consolidated financial statements.
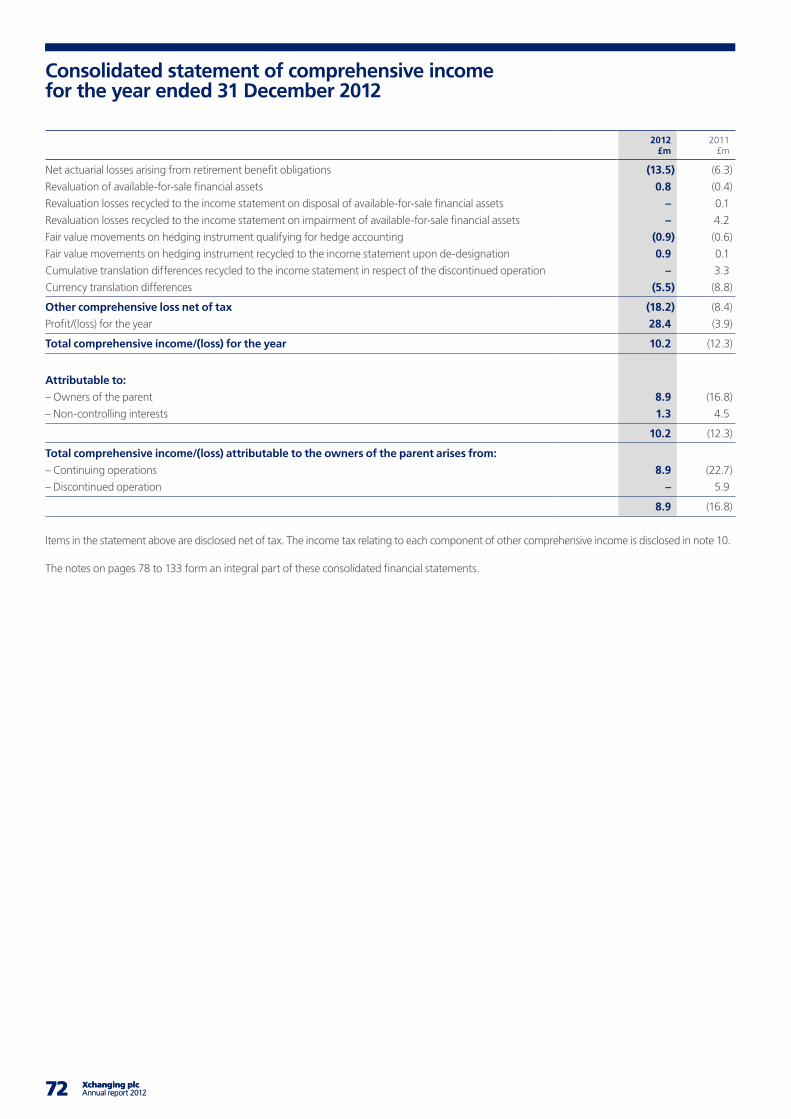
72 Xchanging plc Annual report 2012 7372 Xchanging plc Annual report 2012 73
Consolidated statement of comprehensive income for the year ended 31 December 2012
2012 £m
2011£m
Net actuarial losses arising from retirement benefit obligations (13.5) (6.3)
Revaluation of available-for-sale financial assets 0.8 (0.4)
Revaluation losses recycled to the income statement on disposal of available-for-sale financial assets – 0.1
Revaluation losses recycled to the income statement on impairment of available-for-sale financial assets – 4.2
Fair value movements on hedging instrument qualifying for hedge accounting (0.9) (0.6)
Fair value movements on hedging instrument recycled to the income statement upon de-designation 0.9 0.1
Cumulative translation differences recycled to the income statement in respect of the discontinued operation – 3.3
Currency translation differences (5.5) (8.8)
Other comprehensive loss net of tax (18.2) (8.4)
Profit/(loss) for the year 28.4 (3.9)
Total comprehensive income/(loss) for the year 10.2 (12.3)
Attributable to:
– Owners of the parent 8.9 (16.8)
– Non-controlling interests 1.3 4.5
10.2 (12.3)
Total comprehensive income/(loss) attributable to the owners of the parent arises from:
– Continuing operations 8.9 (22.7)
– Discontinued operation – 5.9
8.9 (16.8)
Items in the statement above are disclosed net of tax. The income tax relating to each component of other comprehensive income is disclosed in note 10.
The notes on pages 78 to 133 form an integral part of these consolidated financial statements.
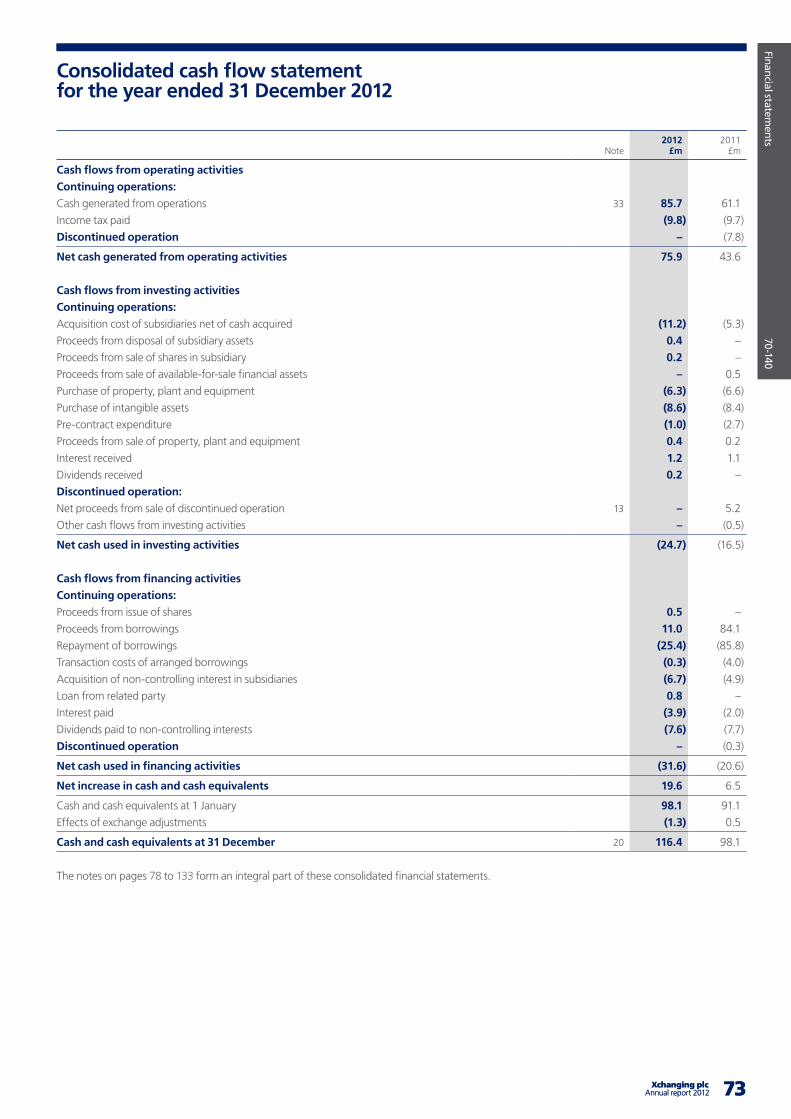
Company overview
X
X-X
X
73 Xchanging plcAnnual report 2012 73 Xchanging plcAnnual report 2012
Financial statements
70-140
Consolidated cash flow statement for the year ended 31 December 2012
Note2012
£m2011
£m
Cash flows from operating activities
Continuing operations:
Cash generated from operations 33 85.7 61.1
Income tax paid (9.8) (9.7)
Discontinued operation – (7.8)
Net cash generated from operating activities 75.9 43.6
Cash flows from investing activities
Continuing operations:
Acquisition cost of subsidiaries net of cash acquired (11.2) (5.3)
Proceeds from disposal of subsidiary assets 0.4 –
Proceeds from sale of shares in subsidiary 0.2 –
Proceeds from sale of available-for-sale financial assets – 0.5
Purchase of property, plant and equipment (6.3) (6.6)
Purchase of intangible assets (8.6) (8.4)
Pre-contract expenditure (1.0) (2.7)
Proceeds from sale of property, plant and equipment 0.4 0.2
Interest received 1.2 1.1
Dividends received 0.2 –
Discontinued operation:
Net proceeds from sale of discontinued operation 13 – 5.2
Other cash flows from investing activities – (0.5)
Net cash used in investing activities (24.7) (16.5)
Cash flows from financing activities
Continuing operations:
Proceeds from issue of shares 0.5 –
Proceeds from borrowings 11.0 84.1
Repayment of borrowings (25.4) (85.8)
Transaction costs of arranged borrowings (0.3) (4.0)
Acquisition of non-controlling interest in subsidiaries (6.7) (4.9)
Loan from related party 0.8 –
Interest paid (3.9) (2.0)
Dividends paid to non-controlling interests (7.6) (7.7)
Discontinued operation – (0.3)
Net cash used in financing activities (31.6) (20.6)
Net increase in cash and cash equivalents 19.6 6.5
Cash and cash equivalents at 1 January 98.1 91.1
Effects of exchange adjustments (1.3) 0.5
Cash and cash equivalents at 31 December 20 116.4 98.1
The notes on pages 78 to 133 form an integral part of these consolidated financial statements.
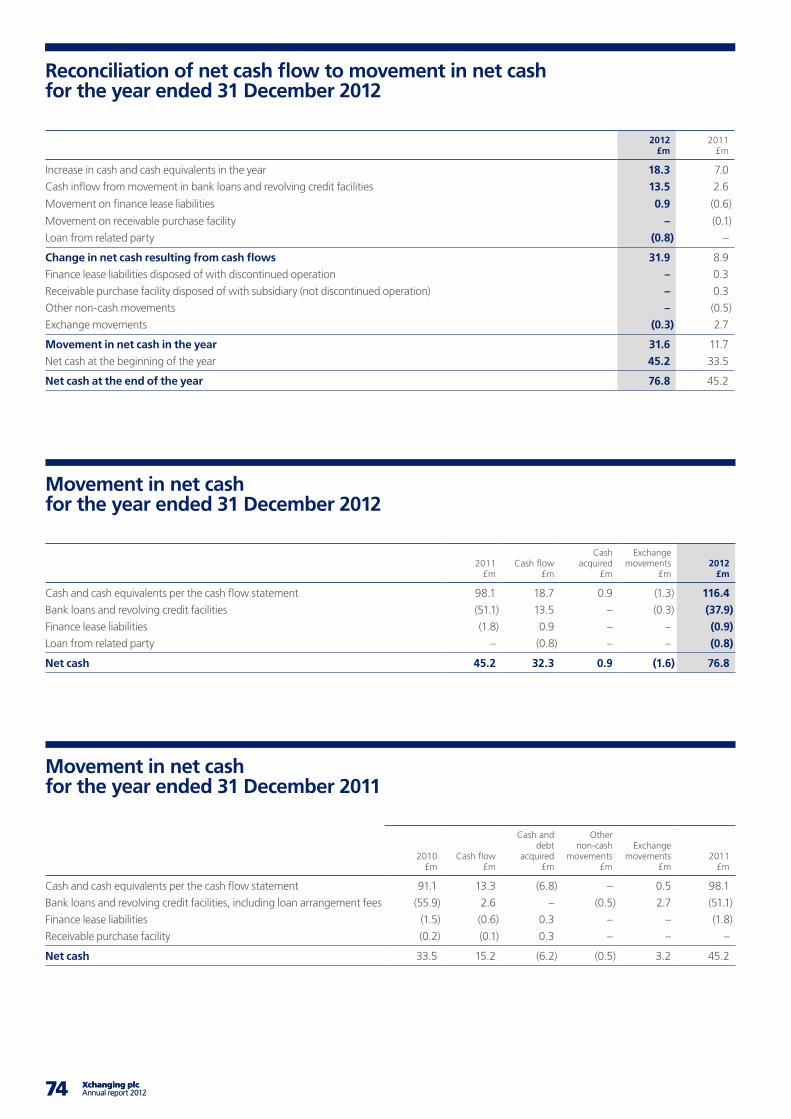
74 Xchanging plc Annual report 2012 7574 Xchanging plc Annual report 2012 75
2012 £m
2011£m
Increase in cash and cash equivalents in the year 18.3 7.0
Cash inflow from movement in bank loans and revolving credit facilities 13.5 2.6
Movement on finance lease liabilities 0.9 (0.6)
Movement on receivable purchase facility – (0.1)
Loan from related party (0.8) –
Change in net cash resulting from cash flows 31.9 8.9
Finance lease liabilities disposed of with discontinued operation – 0.3
Receivable purchase facility disposed of with subsidiary (not discontinued operation) – 0.3
Other non-cash movements – (0.5)
Exchange movements (0.3) 2.7
Movement in net cash in the year 31.6 11.7
Net cash at the beginning of the year 45.2 33.5
Net cash at the end of the year 76.8 45.2
Movement in net cash for the year ended 31 December 2012
2011£m
Cash flow£m
Cash acquired
£m
Exchangemovements
£m2012
£m
Cash and cash equivalents per the cash flow statement 98.1 18.7 0.9 (1.3) 116.4
Bank loans and revolving credit facilities (51.1) 13.5 – (0.3) (37.9)
Finance lease liabilities (1.8) 0.9 – – (0.9)
Loan from related party – (0.8) – – (0.8)
Net cash 45.2 32.3 0.9 (1.6) 76.8
Movement in net cash for the year ended 31 December 2011
2010£m
Cash flow£m
Cash and debt
acquired£m
Other non-cash
movements£m
Exchangemovements
£m2011
£m
Cash and cash equivalents per the cash flow statement 91.1 13.3 (6.8) – 0.5 98.1
Bank loans and revolving credit facilities, including loan arrangement fees (55.9) 2.6 – (0.5) 2.7 (51.1)
Finance lease liabilities (1.5) (0.6) 0.3 – – (1.8)
Receivable purchase facility (0.2) (0.1) 0.3 – – –
Net cash 33.5 15.2 (6.2) (0.5) 3.2 45.2
Reconciliation of net cash flow to movement in net cash for the year ended 31 December 2012
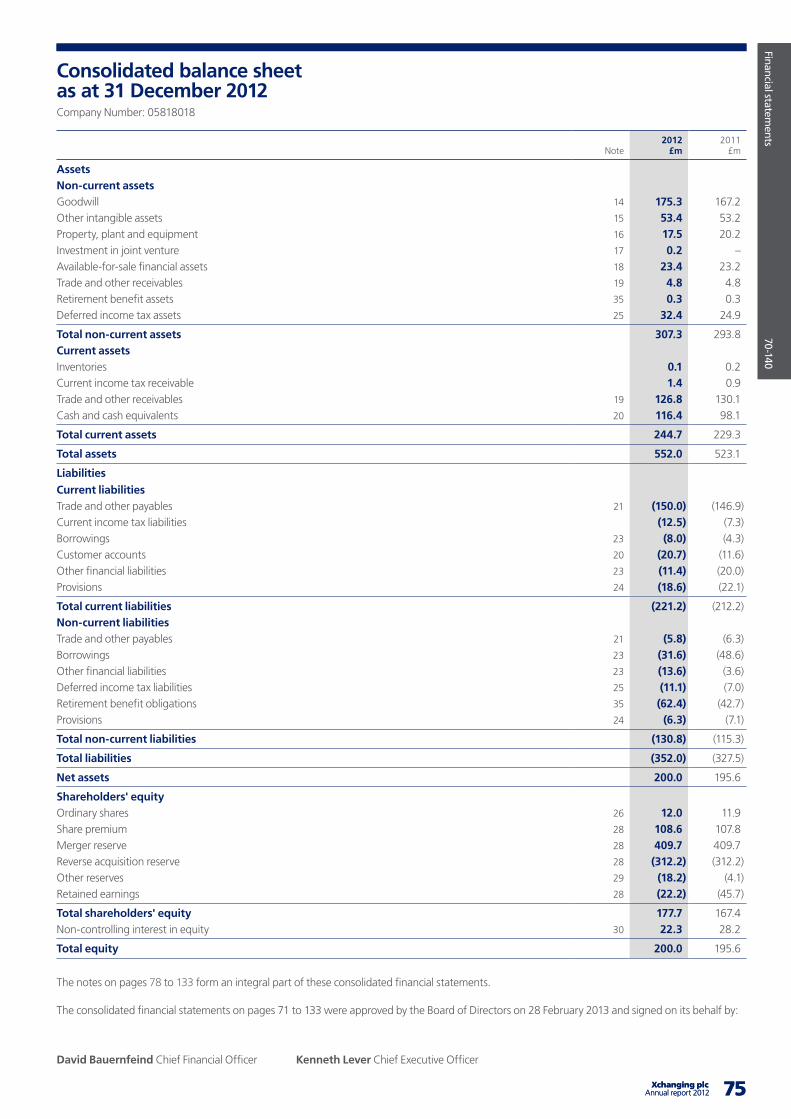
Company overview
X
X-X
X
75 Xchanging plcAnnual report 2012
Financial statements
70-140
75 Xchanging plcAnnual report 2012
Consolidated balance sheet as at 31 December 2012
Note2012
£m2011
£m
AssetsNon-current assetsGoodwill 14 175.3 167.2Other intangible assets 15 53.4 53.2Property, plant and equipment 16 17.5 20.2Investment in joint venture 17 0.2 –Available-for-sale financial assets 18 23.4 23.2Trade and other receivables 19 4.8 4.8Retirement benefit assets 35 0.3 0.3Deferred income tax assets 25 32.4 24.9
Total non-current assets 307.3 293.8Current assetsInventories 0.1 0.2Current income tax receivable 1.4 0.9Trade and other receivables 19 126.8 130.1Cash and cash equivalents 20 116.4 98.1
Total current assets 244.7 229.3
Total assets 552.0 523.1
Liabilities
Current liabilitiesTrade and other payables 21 (150.0) (146.9)Current income tax liabilities (12.5) (7.3)Borrowings 23 (8.0) (4.3)Customer accounts 20 (20.7) (11.6)Other financial liabilities 23 (11.4) (20.0)Provisions 24 (18.6) (22.1)
Total current liabilities (221.2) (212.2)Non-current liabilitiesTrade and other payables 21 (5.8) (6.3)Borrowings 23 (31.6) (48.6)Other financial liabilities 23 (13.6) (3.6)Deferred income tax liabilities 25 (11.1) (7.0)Retirement benefit obligations 35 (62.4) (42.7)Provisions 24 (6.3) (7.1)
Total non-current liabilities (130.8) (115.3)
Total liabilities (352.0) (327.5)
Net assets 200.0 195.6
Shareholders' equityOrdinary shares 26 12.0 11.9Share premium 28 108.6 107.8Merger reserve 28 409.7 409.7Reverse acquisition reserve 28 (312.2) (312.2)Other reserves 29 (18.2) (4.1)Retained earnings 28 (22.2) (45.7)
Total shareholders' equity 177.7 167.4Non-controlling interest in equity 30 22.3 28.2
Total equity 200.0 195.6
The notes on pages 78 to 133 form an integral part of these consolidated financial statements.
The consolidated financial statements on pages 71 to 133 were approved by the Board of Directors on 28 February 2013 and signed on its behalf by:
David Bauernfeind Chief Financial Officer Kenneth Lever Chief Executive Officer
Company Number: 05818018
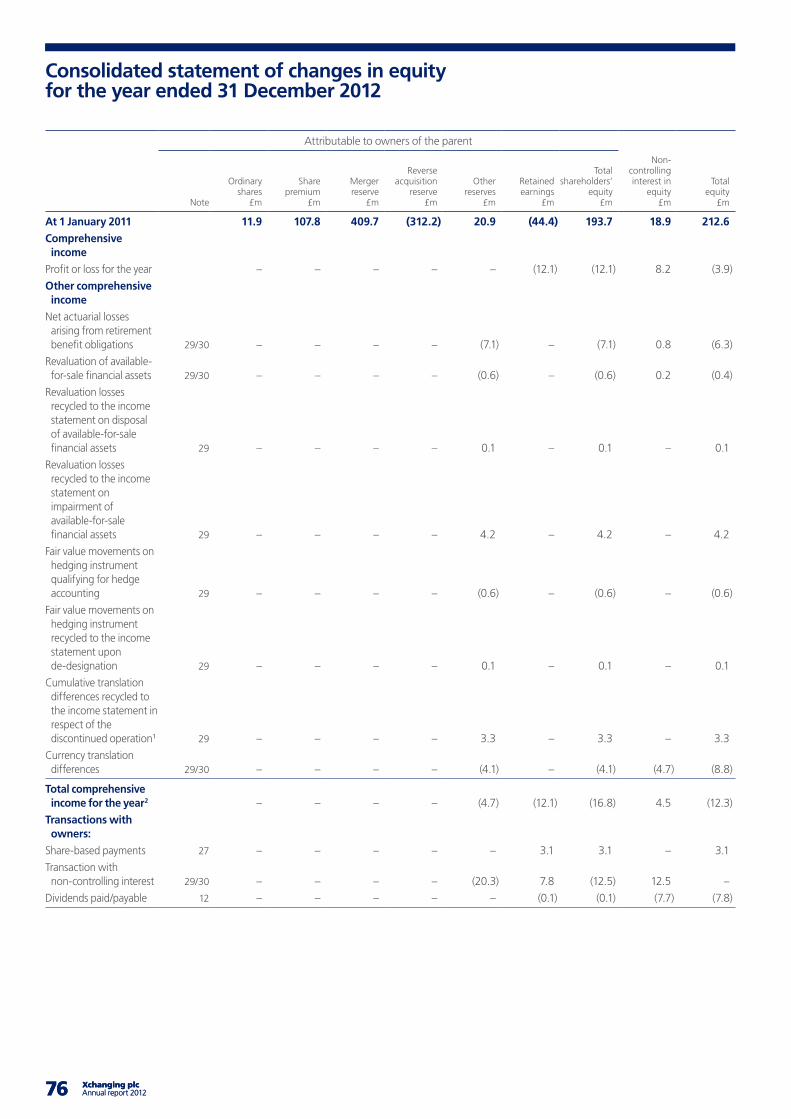
76 Xchanging plc Annual report 2012 7776 Xchanging plc Annual report 2012 77
Attributable to owners of the parent
Note
Ordinary shares
£m
Share premium
£m
Merger reserve
£m
Reverse acquisition
reserve£m
Other reserves
£m
Retained earnings
£m
Total shareholders’
equity£m
Non-controlling interest in
equity£m
Total equity
£m
At 1 January 2011 11.9 107.8 409.7 (312.2) 20.9 (44.4) 193.7 18.9 212.6
Comprehensive income
Profit or loss for the year – – – – – (12.1) (12.1) 8.2 (3.9)
Other comprehensive income
Net actuarial losses arising from retirement benefit obligations 29/30 – – – – (7.1) – (7.1) 0.8 (6.3)
Revaluation of available-for-sale financial assets 29/30 – – – – (0.6) – (0.6) 0.2 (0.4)
Revaluation losses recycled to the income statement on disposal of available-for-sale financial assets 29 – – – – 0.1 – 0.1 – 0.1
Revaluation losses recycled to the income statement on impairment of available-for-sale financial assets 29 – – – – 4.2 – 4.2 – 4.2
Fair value movements on hedging instrument qualifying for hedge accounting 29 – – – – (0.6) – (0.6) – (0.6)
Fair value movements on hedging instrument recycled to the income statement upon de-designation 29 – – – – 0.1 – 0.1 – 0.1
Cumulative translation differences recycled to the income statement in respect of the discontinued operation1 29 – – – – 3.3 – 3.3 – 3.3
Currency translation differences 29/30 – – – – (4.1) – (4.1) (4.7) (8.8)
Total comprehensive income for the year2 – – – – (4.7) (12.1) (16.8) 4.5 (12.3)
Transactions with owners:
Share-based payments 27 – – – – – 3.1 3.1 – 3.1
Transaction with non-controlling interest 29/30 – – – – (20.3) 7.8 (12.5) 12.5 –
Dividends paid/payable 12 – – – – – (0.1) (0.1) (7.7) (7.8)
Consolidated statement of changes in equity for the year ended 31 December 2012
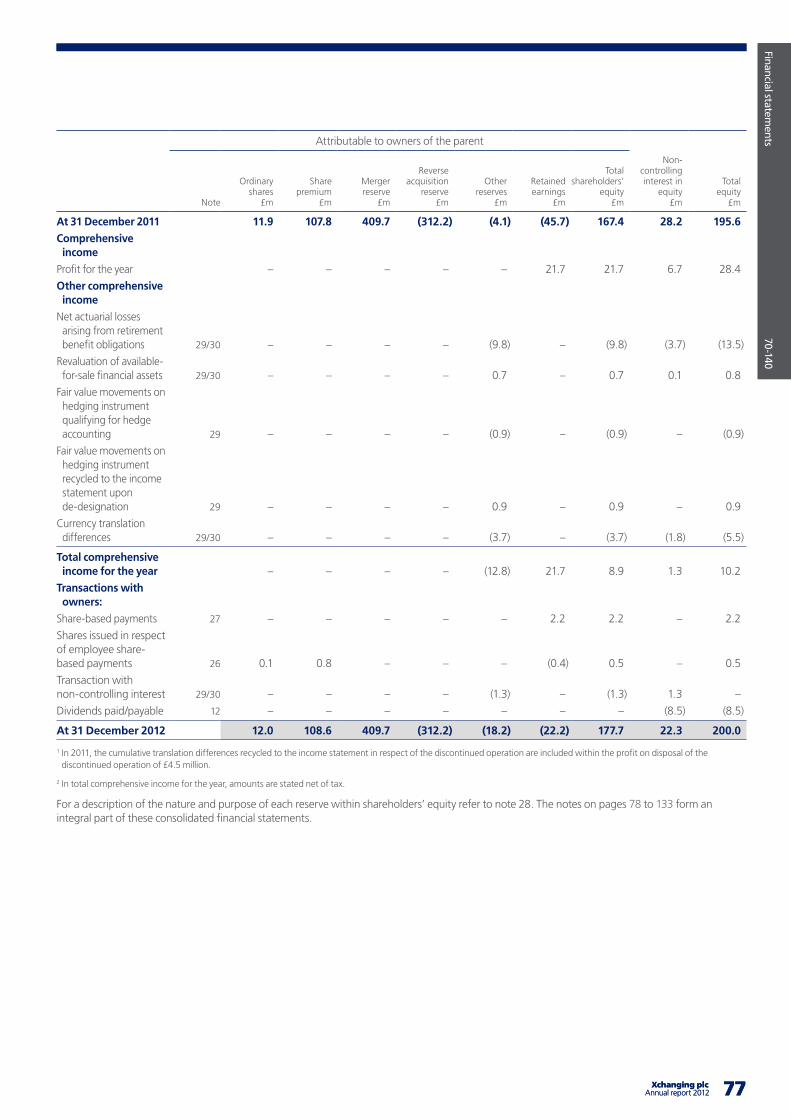
Company overview
X
X-X
X
77 Xchanging plcAnnual report 2012
Financial statements
70-140
77 Xchanging plcAnnual report 2012
Attributable to owners of the parent
Note
Ordinary shares
£m
Share premium
£m
Merger reserve
£m
Reverse acquisition
reserve£m
Other reserves
£m
Retained earnings
£m
Total shareholders’
equity£m
Non-controlling interest in
equity£m
Total equity
£m
At 31 December 2011 11.9 107.8 409.7 (312.2) (4.1) (45.7) 167.4 28.2 195.6
Comprehensive income
Profit for the year – – – – – 21.7 21.7 6.7 28.4
Other comprehensive income
Net actuarial losses arising from retirement benefit obligations 29/30 – – – – (9.8) – (9.8) (3.7) (13.5)
Revaluation of available-for-sale financial assets 29/30 – – – – 0.7 – 0.7 0.1 0.8
Fair value movements on hedging instrument qualifying for hedge accounting 29 – – – – (0.9) – (0.9) – (0.9)
Fair value movements on hedging instrument recycled to the income statement upon de-designation 29 – – – – 0.9 – 0.9 – 0.9
Currency translation differences 29/30 – – – – (3.7) – (3.7) (1.8) (5.5)
Total comprehensive income for the year – – – – (12.8) 21.7 8.9 1.3 10.2
Transactions with owners:
Share-based payments 27 – – – – – 2.2 2.2 – 2.2
Shares issued in respect of employee share-based payments 26 0.1 0.8 – – – (0.4) 0.5 – 0.5
Transaction with non-controlling interest 29/30 – – – – (1.3) – (1.3) 1.3 –
Dividends paid/payable 12 – – – – – – – (8.5) (8.5)
At 31 December 2012 12.0 108.6 409.7 (312.2) (18.2) (22.2) 177.7 22.3 200.0
1 In 2011, the cumulative translation differences recycled to the income statement in respect of the discontinued operation are included within the profit on disposal of the discontinued operation of £4.5 million.
2 In total comprehensive income for the year, amounts are stated net of tax.
For a description of the nature and purpose of each reserve within shareholders’ equity refer to note 28. The notes on pages 78 to 133 form an integral part of these consolidated financial statements.
78 Xchanging plc Annual report 2012 7978 Xchanging plc Annual report 2012 79
1 General informationXchanging plc (‘the Company’) and its subsidiaries (together ‘the Group’) provide a range of business processing services, primarily to the financial services and insurance industries, as well as procurement, and technology services across industries. The nature of the Group’s operations and its principal activities are discussed further on pages 4 to 15.
Xchanging plc is a public limited company incorporated and domiciled in the UK. The address of its registered office is 34 Leadenhall Street, London, EC3A 1AX. The Company’s ordinary shares are traded on the London Stock Exchange.
2 Principal accounting policiesThe principal accounting policies applied in the preparation of these financial statements are set out below. These policies have been consistently applied to both years presented, unless otherwise stated.
(i) Basis of preparation of the financial statementsThese financial statements have been prepared in accordance with the European Union (EU) endorsed International Financial Reporting Standards (IFRS), IFRIC interpretations and with those parts of the Companies Act 2006 applicable to companies reporting under IFRS. The consolidated financial statements have been prepared under the historical cost convention as modified by the revaluation of available-for-sale financial assets, other financial assets and financial liabilities at fair value through profit or loss.
The preparation of financial statements in conformity with IFRS requires the use of certain critical accounting estimates. It also requires management to exercise its judgement in the process of applying the Group’s accounting policies. The areas involving a higher degree of judgement or complexity, or areas where assumptions and estimates are significant to the consolidated financial statements are disclosed in note 3.
(ii) Going concernThe Directors have reviewed the liquidity position of the Group for the period to 31 December 2014. The cash flows of the Group have been assessed against the Group’s available sources of finance on a monthly basis to determine the level of headroom against committed bank facilities. Based on this analysis, and an assessment of the potential cash risks, the Directors have a reasonable expectation that the Group has adequate resources to continue in operational existence for the foreseeable future. The Group therefore continues to adopt the going concern basis in preparing its consolidated financial statements.
(iii) Changes in accounting policy and disclosure(a) New and amended standards and interpretations adopted by the GroupThere are no IFRSs or IFRIC interpretations that are effective for the first time for the financial year beginning on or after 1 January 2012 that would be expected to have a material impact on the Group (although they may affect the accounting for future transactions and events).
(b) New standards, amendments and interpretations issued, but not effective for the financial year beginning 1 January 2012 and not early adopted:A number of new standards and amendments to standards and interpretations are effective for annual periods beginning after 1 January 2012, and have not been applied in preparing these consolidated financial statements. None of these is expected to have a significant effect on the consolidated financial statements of the Group, except the following set out below:
Amendment to IAS 1, ‘Financial statement presentation’, regarding other comprehensive income. The main change resulting from these amendments is a requirement for entities to group items presented in ‘other comprehensive income’ (OCI) on the basis of whether they are potentially reclassifiable to profit or loss subsequently (reclassification adjustments). The amendments do not address which items are presented in OCI.
IFRS 13, ‘Fair value measurement’, aims to improve consistency and reduce complexity by providing a precise definition of fair value and a single source of fair value measurement and disclosure requirements for use across IFRSs. The requirements, which are largely aligned between IFRSs and US GAAP, do not extend the use of fair value accounting but provide guidance on how it should be applied where its use is already required or permitted by other standards within IFRSs or US GAAP.
IAS 19, ‘Employee benefits’, was amended in June 2011 and is effective from 1 January 2013. The impact on the Group will be as follows: to immediately recognise all past service costs; and to replace interest cost and expected return on plan assets with a net interest amount that is calculated by applying the discount rate to the net defined benefit liability (asset). If IAS19R had been adopted by the Group as at 31 December 2012, it is estimated that the operating expense and pension liabilities would have been higher by approximately £0.8 million.
IFRS 9, ‘Financial instruments’, addresses the classification, measurement and recognition of financial assets and financial liabilities. IFRS 9 was issued in November 2009 and October 2010. It replaces the parts of IAS 39 that relate to the classification and measurement of financial instruments. IFRS 9 requires financial assets to be classified into two measurement categories: those measured as at fair value and those measured at amortised cost. The determination is made at initial recognition. The classification depends on the entity’s business model for managing its financial instruments and the contractual cash flow characteristics of the instrument. For financial liabilities, the standard retains most of the IAS 39 requirements. The main change is that, in cases where the fair value option is taken for financial liabilities, the part of a fair value change due to an entity’s own credit risk is recorded in other comprehensive income rather than the income statement, unless this creates an accounting mismatch. The Group is yet to assess IFRS 9’s full impact and intends to adopt IFRS 9 no later than the accounting period beginning on or after 1 January 2015. The Group will also consider the impact of the remaining phases of IFRS 9 when completed by the Board.
Notes to the consolidated financial statements for the year ended 31 December 2012
Company overview
X
X-X
X
79 Xchanging plcAnnual report 2012
Financial statements
70-140
79 Xchanging plcAnnual report 2012
IFRS 10, ‘Consolidated financial statements’, builds on existing principles by identifying the concept of control as the determining factor in whether an entity should be included within the consolidated financial statements of the parent company. The standard provides additional guidance to assist in the determination of control where this is difficult to assess. The adoption of this new standard is not considered to have a material impact on the financial position or financial performance of the Group. The Group intends to adopt IFRS 10 no later than the accounting period beginning on or after 1 January 2013.
IFRS 12, ‘Disclosures of interests in other entities’, includes the disclosure requirements for all forms of interests in other entities, including joint arrangements, associates, special purpose vehicles and other off balance sheet vehicles. The adoption of this new standard is not considered to have a material impact on the financial position or financial performance of the Group. The Group intends to adopt IFRS 12 no later than the accounting period beginning on or after 1 January 2013.
There are no other IFRSs or IFRIC interpretations that are endorsed by the EU but are not yet effective that would be expected to have a material impact on the Group.
(iv) Basis of consolidation (a) SubsidiariesSubsidiaries are all entities (including special purpose entities such as an employee benefit trust) over which the Group has the power to govern the financial and operating policies generally accompanying a shareholding of more than 50% of the voting rights. The existence and effect of potential voting rights that are currently exercisable or convertible are considered when assessing whether the Group controls another entity. The Group also assesses existence of control where it does not own more than 50% of the voting rights but is able to govern the financial and operating policies by virtue of de-facto control. De-facto control arises in respect of the Group’s Enterprise Partnerships through the specific contractual arrangements giving the Group power over the financial and operating policies.
Subsidiaries are fully consolidated from the date on which control passes to the Group. They are deconsolidated from the date control ceases.
Accounting policies of subsidiaries have been changed where necessary to ensure consistency with the policies adopted by the Group.
Intercompany transactions, balances, income and expenses on transactions between Group companies are eliminated. Profits and losses resulting from intercompany transactions that are recognised in assets are also eliminated.
The Group recognises any non-controlling interest in the income statement, balance sheet and other comprehensive income based on the non-controlling interest’s proportionate share, except where there are specific contractual arrangements where this is not applicable, for example, where guaranteed dividends payable to non-controlling interests exist instead of proportionate profit-sharing arrangements.
(b) Joint ventureA joint venture is a contractual arrangement, which the Group has entered into with another party to undertake an economic activity that is subject to joint control. Joint control is the contractually agreed sharing of control over an economic activity, and exists only when the strategic, financial and operating decisions relating to the activity require the unanimous consent of the parties sharing the control.
Investment in joint venture is accounted for using the equity method of accounting, and is initially recognised at cost.
The Group’s share of its joint venture’s post-acquisition profit or loss is recognised in the consolidated income statement and its share of post-acquisition movements in other comprehensive income is recognised in the statement of comprehensive income. The cumulative post-acquisition movements are adjusted against the carrying amount of the investment.
Where necessary, adjustments are made to bring the accounting policies used under relevant local GAAP in the financial statement of the joint venture in line with those used by the Group under IFRS.
The investment in joint venture is reviewed for impairment annually. If any impairment indication exists, the recoverable amount of the asset is estimated in order to determine the extent of the impairment loss (if any). An impairment loss is recognised as an expense immediately.
The results of joint venture acquired during the year are included in the Group income statement from the effective date of acquisition.
The joint venture, Xchanging Malaysia Sdn. Bhd., has a financial year end of 30 June. In respect of each year ending 31 December, this company is included based on financial statements drawn up to that date. The company has a different financial year end, as the Group’s joint venture partner’s financial year end is 30 June and they are responsible for drawing up the annual financial accounts.
(c) Business combinationsThe Group applies the acquisition method to account for business combinations. A business combination is deemed to have occurred where the Group acquires a third-party business, either in whole or in part, so that it obtains overall operational and financial control of that business.
The consideration transferred for the acquisition of a business is the fair value of the assets transferred, the liabilities incurred to the former owner of the acquiree and the equity interests issued by the Group. The consideration transferred includes the fair value of any asset or liability resulting from a contingent consideration arrangement.
80 Xchanging plc Annual report 2012 8180 Xchanging plc Annual report 2012 81
Notes to the consolidated financial statements for the year ended 31 December 2012 continued
2 Principal accounting policies continuedAny contingent consideration to be transferred by the Group is recognised at fair value at the acquisition date. Subsequent changes to the fair value of the contingent consideration that is deemed to be an asset or a liability is recognised either in the income statement or as a change in other comprehensive income. Contingent consideration that is classified as equity is not remeasured, and its subsequent settlement is accounted for within equity.
Identifiable assets acquired and liabilities and contingent liabilities assumed in a business combination are measured initially at their fair values at acquisition date.
The Group recognises any non-controlling interest in the acquiree on an acquisition by acquisition basis, either at fair value or at the non-controlling interest’s proportionate share of the recognised amounts of the acquiree’s identifiable net assets.
Goodwill is initially measured as the excess of the aggregate of the consideration transferred and the fair value of non-controlling interest over the net identifiable assets acquired and the liabilities assumed. If the consideration is lower than the fair value of the net assets of the business acquired, the difference is recognised directly in the income statement.
Acquisition-related costs are expensed as incurred.
(d) Changes in ownership interests in subsidiaries without change of controlTransactions with non-controlling interests that do not result in loss of control are accounted for as equity transactions. That is, as transactions with the owners in their capacity as owners. The difference between fair value of any consideration paid and the relevant share acquired of the carrying value of net assets of the subsidiary is recorded in equity; specifically other reserves. Gains or losses arising on disposals to non-controlling interests are also recorded in equity.
(e) Disposal of subsidiariesWhen the Group ceases to have control of a subsidiary, any retained interests in the equity is re-measured to its fair value at the date when control is lost, with the change in the carrying amount recognised in profit or loss. Any amounts previously recognised in other comprehensive income or directly in equity, in respect of that subsidiary are accounted for as if the Group had directly disposed of the related assets and liabilities. This may mean that amounts previously recognised in other comprehensive income or taken directly to equity are recycled to the income statement.
(f) Discontinued operationA discontinued operation is a component of the Group’s business that represents a separate major line of business. This may be the whole of or part of a subsidiary’s operations. Classification as a discontinued operation occurs upon disposal or when the operation meets the criteria to be classified as held for sale, if earlier.
(v) Revenue recognition Revenue is measured at the fair value of the consideration received or receivable, excluding value added tax, rebates and discounts. It comprises the value of services provided for customer administration services, including investment administration services, business process services, software as a service, claims servicing, securities processing, maintenance contracts and software sales, software development services, procurement services, as well as human resources, finance and accounting services. The Group recognises revenue when the amount of revenue can be reliably measured, it is probable that future economic benefits will flow to the Group and when specific criteria have been met for each of the Group’s activities described below.
Customer administration servicesRevenue in respect of the provision of administration services comprises amounts receivable for subscription fees, a transaction charge for the provision of administration services and fees for other ad hoc services. Subscription fees are recognised in the income statement according to the period to which they relate. Transactional revenue for these services is recognised in the period in which the transaction takes place. Ad hoc revenue is recognised in the period in which the service is provided.
Business process servicesRevenue in respect of business process services contracts is divided into an implementation phase and a service provision phase.
Revenue in respect of the implementation phase is accounted for on a long-term contract basis, where it is separable from the provision of administration services. The percentage completion method is applied, based on the proportion of costs incurred to the total estimated costs. Profits are recognised on an implementation phase where the final outcome can be assessed with reasonable certainty. A full provision is made for all known or anticipated losses on each contract immediately, once forecast.
Revenue in respect of the provision of post-implementation administration services to business process services customers is recognised in the period to which the service relates.
Claims servicingRevenue from the servicing of claims is recognised over the period of the underlying service contract, where there is a defined service period. Revenue from incentive schemes associated with the provision of claims servicing is recognised on the basis of estimates of the amounts which are considered reasonably certain to be received.
Company overview
X
X-X
X
81 Xchanging plcAnnual report 2012
Financial statements
70-140
81 Xchanging plcAnnual report 2012
Securities processingRevenue from the provision of securities processing services is recognised according to the period to which the service relates, net of guaranteed rebates to customers.
Maintenance contracts, hosting services and software salesRevenue in respect of the rental or maintenance of computer software programs, information technology (IT) hardware, hosting and other services is recognised as earned. Billings are included in trade receivables in accordance with the terms of the relevant rental or maintenance contract. To the extent that billings are recorded in advance of the relevant revenue, such advance billings are included in deferred income.
Revenue from maintenance contracts is recognised on a straight-line basis over the term of the maintenance contract.
Revenue from the sale of perpetual software licences, including revenue relating to both the initial licence fee and implementation phase, is recognised over the length of the implementation of the software. Revenue from the sale of subsequent licences, where no implementation is required, is recognised when the significant risks and rewards of ownership are considered to have passed to the buyer and all obligations have been fulfilled; usually considered to occur on delivery of the licences to the buyer.
Software development servicesRevenue from software development services is recognised as related services are performed when the contract is based on time and materials or under the percentage completion basis where work is performed under a fixed price contract.
Procurement servicesRevenue from the provision of procurement services is recognised on a gross basis where the Group is responsible for the whole supply chain process and associated business process from end-to-end. Where the Group acts as an agent, revenue is recognised on a net basis. Revenue is recognised, net of guaranteed rebates to customers, according to the period to which the service relates and only when all obligations are fulfilled.
Human resources/finance and accounting servicesRevenue from the provision of human resources and finance and accounting services is recognised according to the period to which the service relates, net of guaranteed rebates to customers, when all obligations are fulfilled.
(vi) Deferred incomeDeferred income relating to claims handling income received at claim inception in our workers’ compensation business is released in line with an estimate of the cost to service the claims based on actuarial table profiles. The profiles determine, for each class of claim that the Group processes, the estimated life-cycle and work effort of a typical claim. The majority of this revenue is released over a two-year period.
Deferred income relating to software and IT hardware maintenance, software rental fees, and licence fees received in advance is predominantly in our insurance and technology business. This income is released over a straight-line basis over the contract or licence period.
(vii) Finance costs Finance costs are charged to the income statement using the effective interest rate method.
(viii) Finance incomeFinance income is reported in the income statement as it arises through the application of the effective interest rate method.
(ix) Dividend distributionsDividend distributions to the Company’s shareholders are recognised as a liability in the Group’s financial statements in the period in which the dividends are approved by the Company’s shareholders. Interim dividends are recognised when paid.
(x) Foreign currency transactions (a) Functional and presentation currency Items included in the financial statements of each of the Group’s subsidiaries are measured using the currency of the primary economic environment in which the subsidiaries operates (‘the functional currency’). The consolidated financial statements are presented in Sterling, which is the Company’s functional currency.
(b) Transactions and balances Foreign currency transactions are translated into the functional currency using the exchange rates prevailing at the dates of the transactions. Foreign exchange gains and losses resulting from the settlement of such transactions and from the translation at year end exchange rates of monetary assets and liabilities denominated in foreign currencies are recognised in the income statement, except when deferred in other comprehensive income as qualifying cash flow hedges and qualifying net investment hedges.
Foreign exchange gains and losses that relate to borrowings and cash and cash equivalents are presented in the income statement within ‘finance income or cost’. All other foreign exchange gains and losses are presented in the income statement within ‘foreign exchange (loss)/gain’ in cost of sales or administrative expenses.
82 Xchanging plc Annual report 2012 8382 Xchanging plc Annual report 2012 83
Notes to the consolidated financial statements for the year ended 31 December 2012 continued
2 Principal accounting policies continuedTranslation differences on non-monetary financial assets such as equities classified as available-for-sale are included in the revaluation reserve in equity through other comprehensive income.
Translation differences on non-monetary financial assets and liabilities such as equities held at fair value through profit or loss are recognised in profit or loss as part of the fair value gain or loss.
(c) Group companies The results and financial position of all the Group subsidiaries (none of which has the currency of a hyperinflationary economy) that have a functional currency different from the presentation currency are translated into the presentation currency as follows:
All assets and liabilities for each balance sheet presented are translated at the closing rate at the date of that balance sheet.
Income and expenses for each income statement are translated at monthly average exchange rates (unless this average is not a reasonable approximation of the cumulative effect of the rates prevailing on the transaction dates, in which case income and expenses are translated at the rate on the dates of the transactions).
All resulting currency translation differences are recognised as a separate component of equity.
On consolidation, currency translation differences arising from the translation of long-term monetary items designated as part of the net investment in foreign operation are taken to shareholders’ equity.
Goodwill and fair value adjustments arising on the acquisition of a foreign entity are treated as assets and liabilities of the foreign entity and translated at the closing rate.
Cumulative currency translation differences recognised in equity in respect of a subsidiary disposed of are recycled to the income statement in the same period that the disposal is recognised. The effect of the cumulative currency translation differences is taken into account in determining the gain or loss on disposal.
(xi) Derivative financial instruments and hedging activitiesDerivatives are initially recognised at fair value on the date a derivative contract is entered into and are subsequently remeasured at their fair value. The method of recognising the resulting gain or loss depends on whether the derivative is designated as a hedging instrument, and if so, the nature of the item being hedged. The Group designates certain derivatives as either:
(a) hedges of a particular risk associated with a recognised asset or liability or a highly probable forecast transaction (cash flow hedge); or
(b) hedges of a net investment in a foreign operation (net investment hedge).
The Group documents at the inception of the transaction the relationship between hedging instruments and hedged items, as well as its risk management objectives and strategy for undertaking various hedging transactions. The Group also documents its assessment, both at hedge inception and on an on-going basis, of whether the derivatives that are used in hedging transactions are highly effective in offsetting changes in fair values or cash flows of hedged items.
The full fair value of a hedging derivative is classified as a non-current asset or liability when the remaining maturity of the hedged item is more than 12 months, and as a current asset or liability when the remaining maturity of the hedged item is less than 12 months. Trading derivatives are classified as a current asset or liability.
a) Cash flow hedgeThe effective portion of changes in the fair value of derivatives that are designated and qualify as cash flow hedges is recognised in other comprehensive income. The gain or loss relating to the ineffective portion is recognised immediately in the income statement.
Amounts accumulated in equity are recycled in the income statement in the periods when the hedged item affects profit or loss (for example, when the forecast sale that is hedged takes place). The gain or loss relating to the effective portion of forward contracts hedging foreign currency revenues is recognised in the income statement within ‘revenue’.
When a hedging instrument expires or is sold, or when a hedge no longer meets the criteria for hedge accounting, any cumulative gain or loss existing in equity at that time remains in equity and is recognised when the forecast transaction is ultimately recognised in the income statement. When a forecast transaction is no longer expected to occur, the cumulative gain or loss that was reported in equity is immediately transferred to the income statement.
b) Net investment hedgeHedges of net investments in foreign operations are accounted for similarly to cash flow hedges.
Any gain or loss on the hedging instrument relating to the effective portion of the hedge is recognised in other comprehensive income. The gain or loss relating to the ineffective portion is recognised immediately in the income statement.
Gains and losses accumulated in equity are included in the income statement when the foreign operation is partially disposed of or sold.
Company overview
X
X-X
X
83 Xchanging plcAnnual report 2012
Financial statements
70-140
83 Xchanging plcAnnual report 2012
(xii) Goodwill Goodwill recognised under UK GAAP prior to the date of transition to IFRS, 1 January 2003, is stated at net book value at the date of transition. This goodwill had been amortised on a straight-line basis over its useful economic life (being 10 years).
Goodwill recognised subsequent to 1 January 2003, arising from the purchase of subsidiary undertakings, represents the excess of the fair value of the consideration paid over the fair value of the Group’s interest in net identifiable assets (including intangible assets), liabilities and contingent liabilities of the acquiree and the fair value of the non-controlling interest in the acquiree. After initial recognition, goodwill is stated at cost less any accumulated impairment losses. Goodwill recognised subsequent to 1 January 2003 is not subject to amortisation.
Gains and losses on the disposal of a subsidiary include the carrying amount of goodwill relating to the subsidiary sold.
For the purpose of impairment testing, goodwill acquired in a business combination is allocated to each of the CGUs, or groups of CGUs, that is expected to benefit from the synergies of the combination. Each unit or group of units to which the goodwill is allocated represents the lowest level within the entity at which the goodwill is monitored for internal management purposes.
Goodwill impairment reviews are undertaken annually or, more frequently if events or changes in circumstances indicate a potential impairment. The carrying value of goodwill is compared to the recoverable amount, which is the higher of value in use and the fair value less costs to sell. Any impairment is recognised immediately as an expense and is not subsequently reversed.
(xiii) Other intangible assets(a) Development costsWhere development costs meet the criteria for capitalisation, these are stated at cost less a provision for amortisation and any provision for impairment. Research costs are expensed as incurred.
Costs incurred during the development period of new contracts, including the costs of process and system designs that substantially improve those processes and systems already installed in either the Enterprise Partnerships or recently acquired subsidiaries, are treated as development costs. Expenditure relating to these clearly defined and identifiable development projects is recognised as an intangible asset only where costs can be reliably measured and after the following criteria have been met: The technical feasibility and commercial viability of the development project have been demonstrated.
The availability of adequate technical and financial resources and an intention to complete the project have been confirmed.
There is an ability to use or sell the project.
Future economic benefits are expected.
Costs that are capitalised comprise directly attributable incremental costs incurred during the development period, including wages and salaries of staff employed solely for the purpose of improving the processes and systems, and third-party costs. Development costs do not include restructuring costs, (including redundancy, early termination penalties and such like), which are expensed to the income statement as they are incurred.
Amortisation of development costs occurs on a straight-line basis over the life of the contract to which they relate (between six and 12 years). This period represents the useful life of the intangible asset.
(b) Software costsSoftware costs are stated at cost less accumulated amortisation and accumulated impairment losses.
Software costs include purchased software licences and software development expenditure, which are capitalised where they meet the criteria for recognition under IAS 38, ‘Intangible Assets’. Where the criteria for capitalisation are not met, software development expenditure is expensed as incurred.
Software development costs are amortised on a straight-line basis at an annual rate of 20% or over the life of the related contract, where appropriate, so as to write off the asset cost on a straight-line basis over the expected useful economic life. Purchased software is stated at cost and amortised on a straight-line basis over three years.
(c) Assets in the course of developmentAssets in the course of development are not amortised until the asset is brought into use.
Subsequent expenditure undertaken to ensure that an asset maintains its previously assessed standard of performance, for example, routine repairs and maintenance expenditure, is recognised in the income statement as it is incurred. Subsequent expenditure that significantly enhances an asset is capitalised.
(d) Contractual customer relationshipsContractual customer relationships are stated at cost less accumulated amortisation and accumulated impairment losses.
Contractual customer relationships are capitalised on acquisition where they meet the criteria for recognition under IFRS 3, ‘Business Combinations’, and IAS 38. Customer contractual relationships are amortised on a straight-line basis over the expected length of the customer relationship, which is between one and 10 years.
84 Xchanging plc Annual report 2012 8584 Xchanging plc Annual report 2012 85
Notes to the consolidated financial statements for the year ended 31 December 2012 continued
2 Principal accounting policies continued(xiv) Property, plant and equipmentProperty, plant and equipment is stated at cost less accumulated depreciation and accumulated impairment losses, except for assets in the course of development and land. Assets in the course of development are carried at cost less any recognised impairment. Depreciation commences when the assets are ready for their intended use. Land is carried at cost less any recognised impairment. No depreciation is charged on land.
The cost of property, plant and equipment is their purchase cost, together with any incidental costs of acquisition.
All repairs and maintenance are charged to the income statement during the financial period in which they are incurred.
Depreciation is calculated so as to write off the cost of the assets, less their estimated residual values, on a straight-line basis over the expected useful economic lives of the assets concerned. Depreciation is calculated over the following periods:
Buildings 20 years Leasehold improvements over the period of the lease Computer equipment three to five years Fixtures and fittings three to 10 years Motor vehicles four years
The assets’ residual values and useful lives are reviewed, and adjusted if appropriate, at each balance sheet date.
Gains and losses on disposals are determined by comparing the proceeds with the carrying amount and are recognised within the income statement.
(xv) Impairment of property, plant and equipment and intangible assets (including goodwill)Property plant and equipment, goodwill and other intangible assets are reviewed for impairment if a trigger event is deemed to have happened, unless the asset has an indefinite useful life, then these assets are reviewed at least annually. If any such indication exists, the recoverable amount of the asset is estimated in order to determine the extent of the impairment loss (if any). Where the asset does not generate cash flows that are independent from other assets, the Group estimates the recoverable amount of the cash-generating unit to which the asset belongs.
Recoverable amount is the higher of fair value less costs to sell and value in use. In assessing value in use, the estimated future cash flows are discounted to their present value using a discount rate that reflects the current market assessments of the time value of money. Future cash flows are adjusted to take account of any risks specific to an asset. Fair value less costs to sell is determined by reference to either the expected proceeds of sale or the expected discounted cash flows in respect of the asset, less any costs that are expected to be incurred to secure the sale.
If the recoverable amount of an asset (or cash-generating unit) is estimated to be less than its carrying amount, the carrying amount of the asset (cash-generating unit) is reduced to its recoverable amount. An impairment loss is recognised immediately as an expense in the income statement.
Where an impairment loss in respect of property, plant and equipment, and other intangible assets subsequently reverses, the carrying amount of the asset (cash-generating unit) is increased to the revised estimate of its recoverable amount, but only to the extent that the increased carrying amount does not exceed the carrying amount that would have been determined had no impairment loss been recognised for the asset (cash-generating unit) in prior years. A reversal of an impairment loss is recognised in the income statement immediately.
Any impairment losses identified in respect of goodwill are not reversed.
(xvi) Financial assetsClassificationThe Group classifies its financial assets into one of the following categories: loans and receivables, available-for-sale and financial assets at fair value through profit or loss. The classification depends on the purpose for which the financial assets were acquired. The Group determines the classification of its financial assets at initial recognition:
Loans and receivables are non-derivative financial assets with fixed or determinable payments that are not quoted in an active market. They are included in current assets, except for maturities greater than 12 months after the balance sheet date, which are classified as non-current assets.
Available-for-sale financial assets are non-derivatives that are either designated in this category or not classified in any of the other categories. They are included in non-current assets unless management intends to dispose of the investment within 12 months of the balance sheet date.
Financial assets at fair value through profit or loss includes residual equities purchased as part of a requisitioned trade on behalf of a client of the Financial Services sector and are held at their fair value until the opportunity arises to sell the equity as part of a new requisitioned trade by a client. They are included within current assets and classified as held-for-trading assets within trade and other receivables on the balance sheet.
Recognition and measurementRegular purchases and sales of financial assets are recognised on the trade date – the date on which the Group commits to purchase or sell the asset. Investments are initially recognised at fair value plus transaction costs for all financial assets not carried at fair value through profit or loss. Financial assets carried at fair value through profit or loss are initially recognised at fair value, and transaction costs are expensed in the income statement. Financial assets are derecognised when the rights to receive cash flows from the investments have expired or have been transferred and the Group has transferred substantially all risks and rewards of ownership. Available-for-sale financial assets are subsequently carried at fair value. Loans and receivables are carried at amortised cost using the effective interest rate method. Held-for-trading assets are carried at fair value through profit and loss.
Company overview
X
X-X
X
85 Xchanging plcAnnual report 2012
Financial statements
70-140
85 Xchanging plcAnnual report 2012
When securities classified as available-for-sale are sold or impaired, the accumulated fair value adjustments recognised in other comprehensive income are included in the income statement.
Dividends from available-for-sale equity instruments are recognised in the income statement as part of finance income when the Group’s right to receive payments is established. Gains or losses arising from changes in the fair values of other financial assets at fair value through profit and loss are presented within finance costs or income in the period in which they arise. Changes in the fair value of monetary and non-monetary securities classified as available-for-sale are recognised in other comprehensive income.
The fair values of quoted investments are based on current bid prices at the close of business on the balance sheet date.
Financial assets and liabilities are offset and the net amount reported in the balance sheet when there is a legally enforceable right to offset the recognised amounts and there is an intention to settle on a net basis, or to realise the asset and settle the liability simultaneously.
The Group assesses at each balance sheet date whether there is objective evidence that a financial asset or a group of financial assets is impaired. In the case of equity securities classified as available-for-sale, a significant or prolonged decline in the fair value of the security below its cost is considered to be an indicator that the securities are impaired. If any such evidence exists for available-for-sale financial assets, the cumulative loss – measured as the difference between the acquisition cost and the current fair value, less any impairment loss on that financial asset previously recognised in profit or loss – is removed from other comprehensive income and recognised in the income statement. Impairment losses recognised in the income statement on equity instruments are not reversed through the income statement. If, in a subsequent period, the fair value of a debt instrument classified as available-for-sale increases and the increase can be objectively related to an event occurring after the impairment loss was recognised in profit or loss, the impairment loss is reversed through the income statement.
(xvii) Put options granted to non-controlling shareholdersIn accordance with IAS 32, ‘Financial Instruments: Presentation’, when non-controlling interests hold put options that enable them to sell their investments to the Group, the net present value of the future payment is reflected as a financial liability in the consolidated balance sheet. At the end of each period, the valuation of the liability is reassessed with any changes recognised in the income statement for the period through finance costs.
(xviii) InventoriesInventories are stated at the lower of cost and net realisable value. Cost is determined by the first-in, first-out (FIFO) method. Net realisable value is the estimated selling price in the ordinary course of business, less applicable variable selling expenses.
(xix) Trade and other receivablesTrade and other receivables are recognised at fair value and subsequently measured at amortised cost less provision for impairment. A provision for the impairment of trade receivables is established when there is objective evidence that the Group will not be able to collect all amounts due according to the original terms of the receivables. Significant financial difficulties of the debtor, probability that the debtor will enter bankruptcy or financial reorganisation, and default or delinquency in payments are considered indicators that the trade receivable is impaired. The amount of the provision is the difference between the asset’s carrying amount and the present value of estimated future cash flows. Impaired debts are derecognised when they are assessed as uncollectible.
If, in a subsequent period, the amount of the impairment loss decreases and the decrease can be related objectively to an event occurring after the impairment was recognised (such as an improvement in the debtor’s credit rating), the reversal of the previously recognised impairment loss is recognised in the income statement.
Pre-contract costs comprise legal and other professional expenses and other directly attributable staff costs incurred in order to obtain specific customer contracts. Costs that are directly attributable to a contract are deferred when they are separately identifiable, can be reliably measured and it is probable that the contract will be awarded and the contract will result in future net cash inflows with a present value at least equal to all amounts recognised as an asset.
Pre-contract costs are included within trade and other receivables and are amortised on a straight-line basis over the life of the contract, starting from the date when the contract commences.
(xx) Cash and cash equivalentsCash and cash equivalents include cash in hand, demand deposits, short-term highly liquid investments which are readily convertible to cash and are subject to minimal risk of changes in value and bank overdrafts.
(xxi) Trade and other payablesTrade and other payables are recognised initially at fair value and subsequently measured at amortised cost using the effective interest method.
(xxii) BorrowingsBorrowings are recognised initially at fair value, net of transaction costs incurred. Borrowings are subsequently carried at amortised cost. Any difference between the proceeds (net of transaction costs) and the redemption value is recognised in the income statement over the period of the borrowings, using the effective interest method. Revolving credit facilities are shown within borrowings in current liabilities on the consolidated balance sheet.
86 Xchanging plc Annual report 2012 8786 Xchanging plc Annual report 2012 87
Notes to the consolidated financial statements for the year ended 31 December 2012 continued
2 Principal accounting policies continuedFees paid on the initial arrangement of debt facilities are recognised as transaction costs to the extent that some or all of the facility will be drawn down. Fees are capitalised as a prepayment against the borrowings and amortised over the period of the facility to which they relate.
An exchange or a modification of a debt facility arrangement is accounted for as an extinguishment where the terms of the new arrangement are substantially different to the original arrangement. Both qualitative and quantitative factors are considered in determining whether the terms of an arrangement have substantially changed.
On extinguishment, all unamortised transaction costs related to the extinguished facility are released to the income statement. All fees paid in respect of the exchange or modification of a debt facility are also taken directly to the income statement. These amounts are presented within finance costs.
(xxiii) Operating and finance leasesLeases in which a significant portion of the risks and rewards of ownership are retained by the lessor are classified as operating leases. Rental costs under operating leases are charged to the income statement on a straight-line basis over the lease term. Lease incentives provided by lessors to the Group are amortised over the lease term together with any related costs of acquiring the lease.
Assets held under finance leases are initially reported at the lower of the fair value of the assets and the present value of minimum lease payments with an equivalent liability categorised as appropriate under current or non-current liabilities. The asset is depreciated over the shorter of the lease term and its useful economic life. Finance charges are allocated to accounting periods over the period of the lease to produce a constant rate of return on the outstanding balance.
(xxiv) Taxation including deferred income taxThe tax expense for the period comprises current and deferred tax. Tax is recognised in the income statement, except to the extent that it relates to items recognised in other comprehensive income or directly in equity. In this case, the associated tax is also recognised in other comprehensive income or directly in equity, respectively.
The current income tax charge is calculated on the basis of the tax laws enacted or substantively enacted at the balance sheet date in the countries where the Company and its subsidiaries operate and generate taxable income.
Management periodically evaluates positions adopted in tax returns with respect to situations in which applicable tax regulation is subject to interpretation. It establishes provisions where appropriate on the basis of amounts expected to be paid to the tax authorities.
Deferred income tax is recognised, using the liability method, on temporary differences arising between the tax bases of assets and liabilities and their carrying amounts in the consolidated financial statements. However, deferred tax liabilities are not recognised if they arise from the initial recognition of goodwill; deferred income tax is not accounted for if it arises from initial recognition of an asset or liability in a transaction other than a business combination that at the time of the transaction affects neither accounting nor taxable profit or loss. Deferred income tax is determined using tax rates (and laws) that have been enacted or substantively enacted by the balance sheet date and are expected to apply when the related deferred income tax asset is realised or the deferred income tax liability is settled.
Deferred income tax assets are recognised only to the extent that it is probable that future taxable profit will be available against which the temporary differences can be utilised.
Deferred income tax is provided on temporary differences arising on investments in subsidiaries, except for a deferred income tax liability where the timing of the reversal of the temporary difference is controlled by the Group and it is probable that the temporary difference will not reverse in the foreseeable future.
Deferred income tax assets and liabilities are offset when there is a legally enforceable right to offset current tax assets against current tax liabilities and when the deferred income tax assets and liabilities relate to income taxes levied by the same taxation authority on either the same taxable entity or different taxable entities where there is an intention to settle the balances on a net basis.
(xxv) Employee benefit costs(a) Retirement benefit obligationsThe Group operates, or participates in, both defined contribution and defined benefit pension schemes. All the pension schemes are accounted for in accordance with IAS 19, ‘Employee Benefits’.
The defined benefit obligation is calculated annually by independent actuaries using the projected unit credit method. Scheme assets are measured using closing market values at the balance sheet date. Pension scheme liabilities are measured using the projected unit method and discounted at the current rate of return on a high quality corporate bond of equivalent term and currency to the liability. Variations between the scheme assets and liabilities identified as a result of these actuarial valuations (actuarial gains and losses) are recognised in full through other comprehensive income in the period in which they arise. Current service costs, expected returns on plan assets and interest costs are charged to the income statement. Past-service costs are recognised immediately in income, unless the changes to the pension plan are conditional on the employees remaining in service for a specified period of time (the vesting period). In this case, the past-service costs are amortised on a straight-line basis over the vesting period.
Company overview
X
X-X
X
87 Xchanging plcAnnual report 2012
Financial statements
70-140
87 Xchanging plcAnnual report 2012
The Group participates in a number of defined benefit schemes which are multi-employer schemes and where insufficient information exists to be able to account for the schemes as defined benefit plans as there is no consistent and reliable basis for allocating the obligations, plan assets and costs to individual entities participating in these schemes. In accordance with IAS 19, such schemes are accounted for as defined contribution schemes and contributions are charged to the income statement as incurred.
For defined contribution plans, the Group pays contributions to publicly or privately administered pension insurance plans on a mandatory, contractual or voluntary basis. The Group has no further payment obligations once the contributions have been paid. The contributions are recognised as employee benefit expense when they are due. Prepaid contributions are recognised as an asset to the extent that a cash refund or a reduction in the future payments is available.
(b) Share-based compensationThe Group operates a number of equity-settled, share-based compensation plans. The fair value of the employee services received in exchange for the grant of an equity-settled transaction, for example options, is recognised as an expense over the periods in which the performance conditions are fulfilled, ending on the vesting date of the award. The total amount to be expensed over the vesting period is determined by reference to the fair value of the equity instruments granted. Non-market vesting conditions are included in assumptions about the number of options that are expected to vest. At each balance sheet date, the entity revises its estimates of the number of options that are expected to vest. It recognises the impact of the revision to original estimates, if any, in the income statement, with a corresponding adjustment to equity. Awards, where vesting is conditional upon a market condition, are treated as vesting irrespective of whether or not the market condition is satisfied, provided that all other performance conditions are satisfied.
When the options are exercised, the Company issues new shares, except for the deferred bonus share plan, where shares are purchased on the open market to satisfy options exercised. The proceeds received, net of any directly attributable transaction costs, are credited to share capital (nominal value) and share premium when the options are exercised.
The grant by the Company of options over its equity instruments to the employees of subsidiary undertakings in the Group is treated as a capital contribution. The fair value of employee services received, measured by reference to the grant date fair value, is recognised in the Company accounts over the vesting period as an increase to investment in subsidiary undertakings, with a corresponding credit to equity.
(xxvi) ProvisionsProvisions are recognised when a present legal or constructive obligation exists as the result of a past event, it is probable that this will result in an outflow of resources and the amount of which can be reliably estimated.
Restructuring provisions are only recognised if an obligation exists at the balance sheet date, i.e. a formal plan exists and those affected by that plan have a valid expectation that the restructuring will be carried out. Employee termination payments are included within restructuring provisions. Provisions are not recognised for future operating losses.
Provisions are measured at the present value of the expenditures expected to be required to settle the obligation using a pre-tax rate that reflects current market assessments of the time value of money and the risks specific to the obligation. The increase in the provision due to passage of time is recognised as a finance cost.
(xxvii) Share capitalShare capital comprises the nominal value of all issued shares. On subscribing for shares, any excess consideration over the nominal value of the shares issued less any issue costs is credited to the share premium account.
(xxviii) Fair value estimationThe fair values of short-term loans and overdrafts with a maturity of less than one year are assumed to approximate to their book values. For loans due in more than one year the fair value of financial liabilities for disclosure purposes is estimated by discounting the future contractual cash flows at the market interest rate available to the Group for similar financial instruments. The fair value for quoted available-for-sale financial assets and held-for-trading equity securities is based on their quoted market price. The fair value of unquoted available-for-sale financial assets and held-for-trading equity securities is estimated by reference to a discounted cash flow calculation.
(xxix) Exceptional itemsExceptional items are those items that in the Directors’ view are required to be separately disclosed by virtue of their size or incidence, have been separately disclosed in order to improve a reader’s understanding of the financial statements. These include items relating to the restructuring of a significant part of the Group, impairment losses, expenditure relating to the integration and implementation of significant acquisitions and other one-off events or transactions.
(xxx) Segmental reportingOperating segments are reported in a manner consistent with the internal reporting provided to the chief operating decision-maker. The chief operating decision-maker, who is responsible for allocating resources and assessing performance of the operating segments, has been identified as the Executive Board.
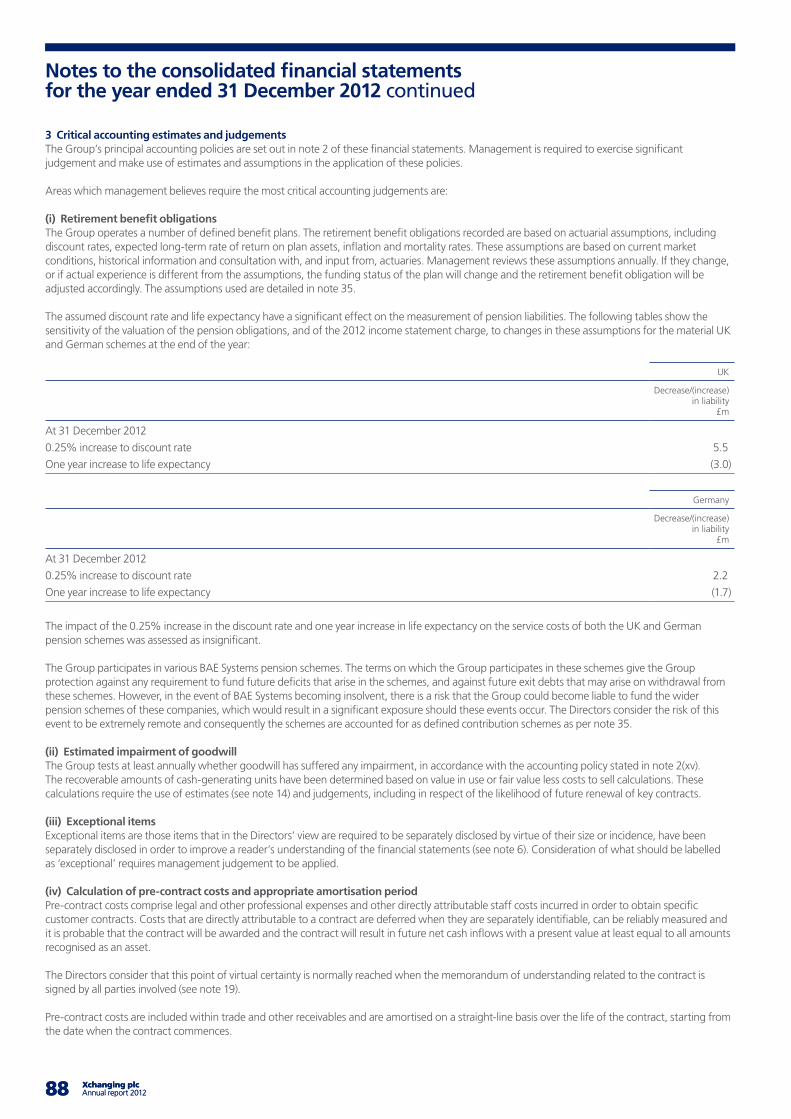
88 Xchanging plc Annual report 2012 8988 Xchanging plc Annual report 2012 89
Notes to the consolidated financial statements for the year ended 31 December 2012 continued
3 Critical accounting estimates and judgementsThe Group’s principal accounting policies are set out in note 2 of these financial statements. Management is required to exercise significant judgement and make use of estimates and assumptions in the application of these policies.
Areas which management believes require the most critical accounting judgements are:
(i) Retirement benefit obligationsThe Group operates a number of defined benefit plans. The retirement benefit obligations recorded are based on actuarial assumptions, including discount rates, expected long-term rate of return on plan assets, inflation and mortality rates. These assumptions are based on current market conditions, historical information and consultation with, and input from, actuaries. Management reviews these assumptions annually. If they change, or if actual experience is different from the assumptions, the funding status of the plan will change and the retirement benefit obligation will be adjusted accordingly. The assumptions used are detailed in note 35.
The assumed discount rate and life expectancy have a significant effect on the measurement of pension liabilities. The following tables show the sensitivity of the valuation of the pension obligations, and of the 2012 income statement charge, to changes in these assumptions for the material UK and German schemes at the end of the year:
UK
Decrease/(increase) in liability
£m
At 31 December 2012
0.25% increase to discount rate 5.5
One year increase to life expectancy (3.0)
Germany
Decrease/(increase) in liability
£m
At 31 December 2012
0.25% increase to discount rate 2.2
One year increase to life expectancy (1.7)
The impact of the 0.25% increase in the discount rate and one year increase in life expectancy on the service costs of both the UK and German pension schemes was assessed as insignificant.
The Group participates in various BAE Systems pension schemes. The terms on which the Group participates in these schemes give the Group protection against any requirement to fund future deficits that arise in the schemes, and against future exit debts that may arise on withdrawal from these schemes. However, in the event of BAE Systems becoming insolvent, there is a risk that the Group could become liable to fund the wider pension schemes of these companies, which would result in a significant exposure should these events occur. The Directors consider the risk of this event to be extremely remote and consequently the schemes are accounted for as defined contribution schemes as per note 35.
(ii) Estimated impairment of goodwillThe Group tests at least annually whether goodwill has suffered any impairment, in accordance with the accounting policy stated in note 2(xv). The recoverable amounts of cash-generating units have been determined based on value in use or fair value less costs to sell calculations. These calculations require the use of estimates (see note 14) and judgements, including in respect of the likelihood of future renewal of key contracts.
(iii) Exceptional itemsExceptional items are those items that in the Directors’ view are required to be separately disclosed by virtue of their size or incidence, have been separately disclosed in order to improve a reader’s understanding of the financial statements (see note 6). Consideration of what should be labelled as ‘exceptional’ requires management judgement to be applied.
(iv) Calculation of pre-contract costs and appropriate amortisation periodPre-contract costs comprise legal and other professional expenses and other directly attributable staff costs incurred in order to obtain specific customer contracts. Costs that are directly attributable to a contract are deferred when they are separately identifiable, can be reliably measured and it is probable that the contract will be awarded and the contract will result in future net cash inflows with a present value at least equal to all amounts recognised as an asset.
The Directors consider that this point of virtual certainty is normally reached when the memorandum of understanding related to the contract is signed by all parties involved (see note 19).
Pre-contract costs are included within trade and other receivables and are amortised on a straight-line basis over the life of the contract, starting from the date when the contract commences.
Company overview
X
X-X
X
89 Xchanging plcAnnual report 2012
Financial statements
70-140
89 Xchanging plcAnnual report 2012
(v) Assumptions on put optionsThree put options are accounted for as financial liabilities in accordance with paragraph 23 of IAS 32. These liabilities are carried at fair value through profit and loss, and measured at the present value of the future cash flows associated with them. The levels of these cash flows and the relevant discount rates used in the fair value calculations are based on future projections, and incorporate a certain element of management judgement (see note 23).
(vi) Income taxesThe Group is subject to income taxes in numerous jurisdictions. Judgement is required in determining the Group-wide provision for income taxes. There are many transactions and calculations for which the ultimate tax determination is uncertain. The Group recognises liabilities for anticipated tax audit issues based on estimates of whether additional taxes will be due. When the final tax outcome of these matters results in a difference to the amounts that were initially recognised, such differences will impact the current and deferred income tax assets and liabilities in the period in which such determination is made.
The Group is required to estimate the corporate tax in each of the jurisdictions in which it operates. This requires an estimation of the current tax liability together with an assessment of the temporary differences, which arise as a consequence of different accounting and tax treatments. These temporary differences result in deferred tax assets or liabilities, which are included within the balance sheet. Deferred tax assets are not recognised when it is more likely than not that the asset will not be realised in the future. This evaluation requires judgements to be made, including the forecast of future taxable income.
(vii) AcquisitionsWhen acquiring a business, the Group has to make judgements and best estimates about the fair value allocation of the purchase price. Judgement is applied in determining what part of a business transaction relates to the acquisition of that business. Parts of a business transaction that do not relate to the acquisition (for example, employee costs) are accounted for in accordance with the relevant accounting standard. The Group tests the valuation of goodwill on an annual basis and whenever events or circumstances indicate that the carrying amount may not be recoverable. These tests require the use of estimates (see note 3 (ii)).
(viii) Recognition including deferred and accrued incomeThe Group applies judgement in determining the most appropriate method to use in estimating the amount of revenue to be recognised in a financial period. Where applicable, service revenue is calculated using a percentage of completion basis. This method involves estimating future costs, margins and the deliverability of the project. For other contracts, judgement is applied to determine whether revenue should be recognised on a gross or net basis, based on whether the Group is acting as principal in the contract or as an agent. Judgement is also applied to determine the amount of revenue due under profit-sharing arrangements, and the amount of up-front fees that can be recognised as revenue, based on whether the up-front fee has been earned.
(ix) Valuation of provisionsDue to the nature of provisions, an element of their determination is based on estimates and judgements, including assumptions regarding the future anticipated cash outflows required to settle obligations, and the period over which these outflows will arise. The actual outcome of these uncertain factors may differ from these estimations, giving rise to differences with the estimated provisions. Any such differences between actual outcomes and the provisions recorded may impact the Group’s results over the periods involved. The timing of the outflow of resources required to settle these obligations is subject to similar uncertain factors. See note 24 for a discussion of critical estimates and judgements on specific provisions.
4 Segmental reportingManagement has determined the operating segments based on the information presented to and reviewed by the Executive Board, the chief operating decision-maker for the year, on which strategic decisions are based, resources are allocated and performance is assessed.
A brief description of each reportable segment is as follows: Insurance Services provides technology infrastructure and managed services for processing policies and premiums as well as handling claims, to the insurance market. It includes the workers’ compensation claims processing services business in Australia.
Financial Services provides securities processing, investment account administration and fund administration in Germany and Italy.
Technology provides technology infrastructure management services, insurance software (Xuber) and application management services to a range of customers.
Procurement and Other BPO provides procurement, HR, finance and accounting and other business processing services to a range of customers.
Corporate provides the infrastructure, resources and investment to sustain and grow the Group, including performance management, and business management functions.
Insurance Services and Financial Services form a significant part of our Business Processing Services offering.
Management uses external adjusted revenue and adjusted operating profit as measures of segment performance. Adjusted revenue excludes exceptional revenue items. Adjusted operating profit excludes exceptional items, amortisation of intangible assets previously unrecognised by an acquired entity and acquisition-related expenses. Interest income and expenditure are not allocated to sectors, as this type of activity is driven by the Group treasury function, which manages the cash position of the whole Group.
Management makes regular use of these measures to evaluate performance in the operating segments, both in absolute terms and comparatively from period to period, and to allocate resources among its operating segments. Management believes that these measures provide a better understanding, for both management and investors, of the operating results of its business segments for the year under review.
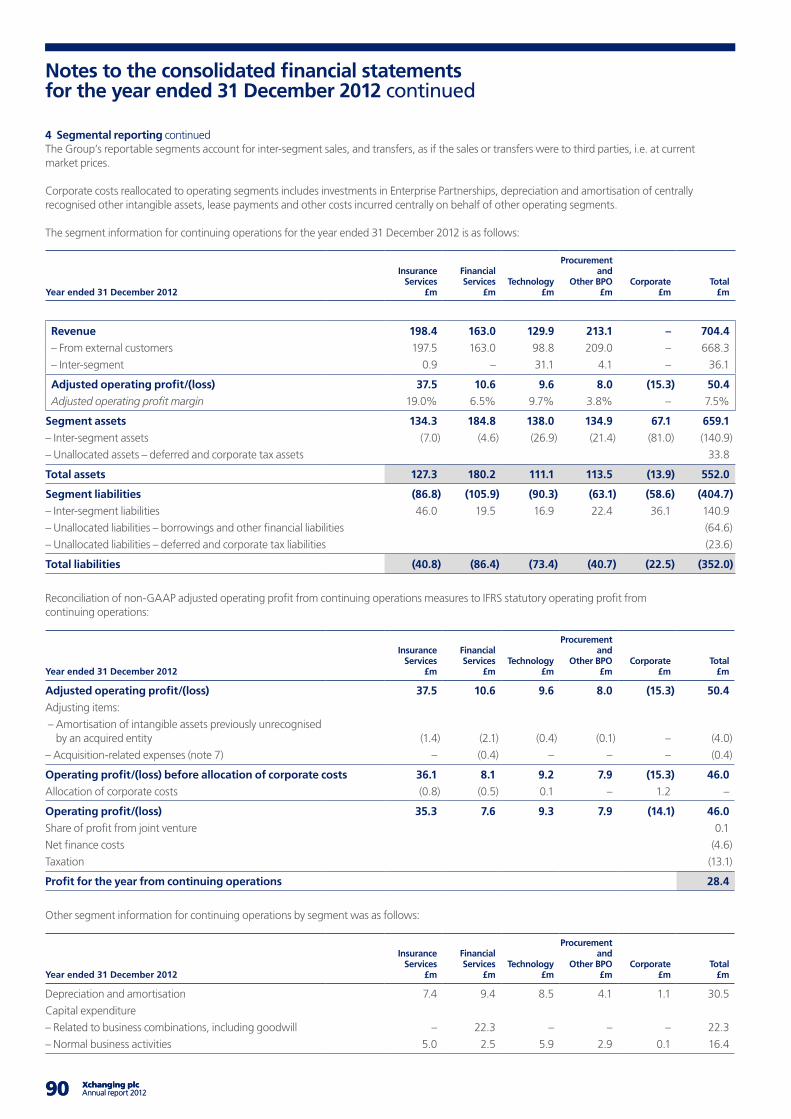
90 Xchanging plc Annual report 2012 9190 Xchanging plc Annual report 2012 91
Notes to the consolidated financial statements for the year ended 31 December 2012 continued
4 Segmental reporting continuedThe Group’s reportable segments account for inter-segment sales, and transfers, as if the sales or transfers were to third parties, i.e. at current market prices.
Corporate costs reallocated to operating segments includes investments in Enterprise Partnerships, depreciation and amortisation of centrally recognised other intangible assets, lease payments and other costs incurred centrally on behalf of other operating segments.
The segment information for continuing operations for the year ended 31 December 2012 is as follows:
Year ended 31 December 2012
Insurance Services
£m
Financial Services
£m Technology
£m
Procurement and
Other BPO £m
Corporate£m
Total £m
Revenue 198.4 163.0 129.9 213.1 – 704.4
– From external customers 197.5 163.0 98.8 209.0 – 668.3
– Inter-segment 0.9 – 31.1 4.1 – 36.1
Adjusted operating profit/(loss) 37.5 10.6 9.6 8.0 (15.3) 50.4
Adjusted operating profit margin 19.0% 6.5% 9.7% 3.8% – 7.5%
Segment assets 134.3 184.8 138.0 134.9 67.1 659.1
– Inter-segment assets (7.0) (4.6) (26.9) (21.4) (81.0) (140.9)
– Unallocated assets – deferred and corporate tax assets 33.8
Total assets 127.3 180.2 111.1 113.5 (13.9) 552.0
Segment liabilities (86.8) (105.9) (90.3) (63.1) (58.6) (404.7)
– Inter-segment liabilities 46.0 19.5 16.9 22.4 36.1 140.9
– Unallocated liabilities – borrowings and other financial liabilities (64.6)
– Unallocated liabilities – deferred and corporate tax liabilities (23.6)
Total liabilities (40.8) (86.4) (73.4) (40.7) (22.5) (352.0)
Reconciliation of non-GAAP adjusted operating profit from continuing operations measures to IFRS statutory operating profit from continuing operations:
Year ended 31 December 2012
Insurance Services
£m
Financial Services
£m Technology
£m
Procurement and
Other BPO £m
Corporate£m
Total £m
Adjusted operating profit/(loss) 37.5 10.6 9.6 8.0 (15.3) 50.4
Adjusting items:
– Amortisation of intangible assets previously unrecognised by an acquired entity (1.4) (2.1) (0.4) (0.1) – (4.0)
– Acquisition-related expenses (note 7) – (0.4) – – – (0.4)
Operating profit/(loss) before allocation of corporate costs 36.1 8.1 9.2 7.9 (15.3) 46.0
Allocation of corporate costs (0.8) (0.5) 0.1 – 1.2 –
Operating profit/(loss) 35.3 7.6 9.3 7.9 (14.1) 46.0
Share of profit from joint venture 0.1
Net finance costs (4.6)
Taxation (13.1)
Profit for the year from continuing operations 28.4
Other segment information for continuing operations by segment was as follows:
Year ended 31 December 2012
Insurance Services
£m
Financial Services
£m Technology
£m
Procurement and
Other BPO £m
Corporate£m
Total £m
Depreciation and amortisation 7.4 9.4 8.5 4.1 1.1 30.5
Capital expenditure
– Related to business combinations, including goodwill – 22.3 – – – 22.3
– Normal business activities 5.0 2.5 5.9 2.9 0.1 16.4
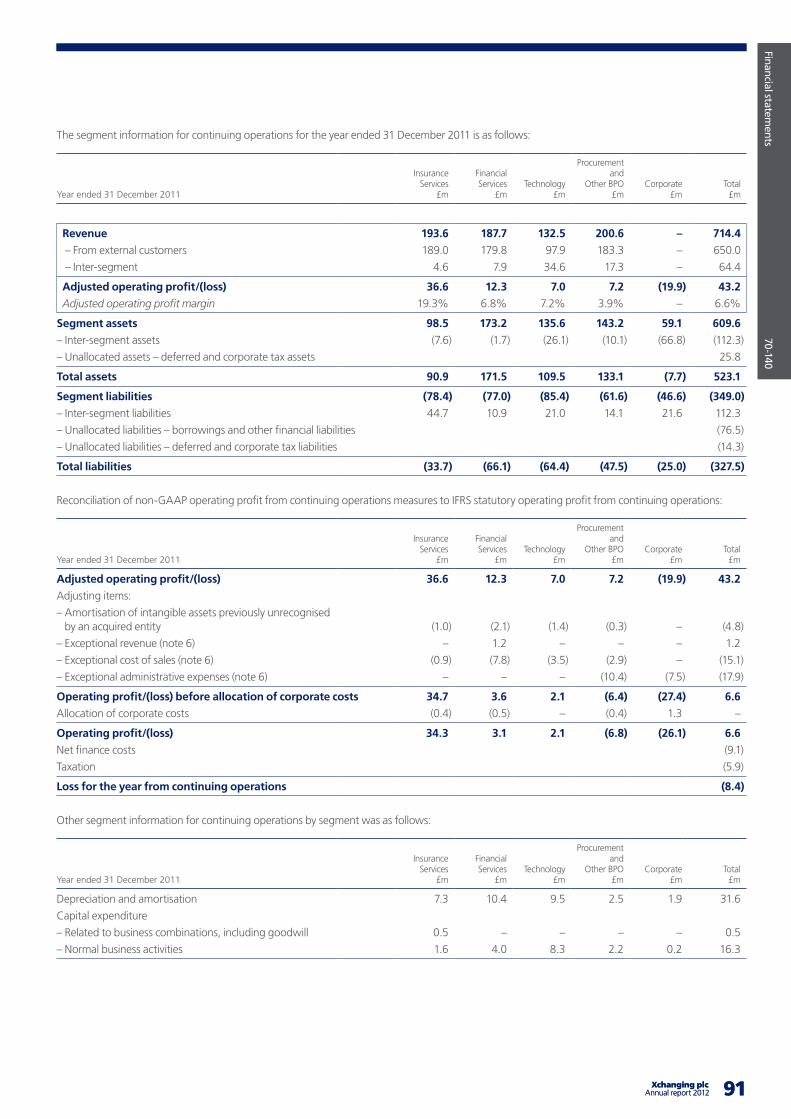
Company overview
X
X-X
X
91 Xchanging plcAnnual report 2012
Financial statements
70-140
91 Xchanging plcAnnual report 2012
The segment information for continuing operations for the year ended 31 December 2011 is as follows:
Year ended 31 December 2011
Insurance Services
£m
Financial Services
£m Technology
£m
Procurement and
Other BPO £m
Corporate£m
Total £m
Revenue 193.6 187.7 132.5 200.6 – 714.4
– From external customers 189.0 179.8 97.9 183.3 – 650.0
– Inter-segment 4.6 7.9 34.6 17.3 – 64.4
Adjusted operating profit/(loss) 36.6 12.3 7.0 7.2 (19.9) 43.2
Adjusted operating profit margin 19.3% 6.8% 7.2% 3.9% – 6.6%
Segment assets 98.5 173.2 135.6 143.2 59.1 609.6
– Inter-segment assets (7.6) (1.7) (26.1) (10.1) (66.8) (112.3)
– Unallocated assets – deferred and corporate tax assets 25.8
Total assets 90.9 171.5 109.5 133.1 (7.7) 523.1
Segment liabilities (78.4) (77.0) (85.4) (61.6) (46.6) (349.0)
– Inter-segment liabilities 44.7 10.9 21.0 14.1 21.6 112.3
– Unallocated liabilities – borrowings and other financial liabilities (76.5)
– Unallocated liabilities – deferred and corporate tax liabilities (14.3)
Total liabilities (33.7) (66.1) (64.4) (47.5) (25.0) (327.5)
Reconciliation of non-GAAP operating profit from continuing operations measures to IFRS statutory operating profit from continuing operations:
Year ended 31 December 2011
Insurance Services
£m
Financial Services
£m Technology
£m
Procurement and
Other BPO £m
Corporate£m
Total £m
Adjusted operating profit/(loss) 36.6 12.3 7.0 7.2 (19.9) 43.2
Adjusting items:
– Amortisation of intangible assets previously unrecognised by an acquired entity (1.0) (2.1) (1.4) (0.3) – (4.8)
– Exceptional revenue (note 6) – 1.2 – – – 1.2
– Exceptional cost of sales (note 6) (0.9) (7.8) (3.5) (2.9) – (15.1)
– Exceptional administrative expenses (note 6) – – – (10.4) (7.5) (17.9)
Operating profit/(loss) before allocation of corporate costs 34.7 3.6 2.1 (6.4) (27.4) 6.6
Allocation of corporate costs (0.4) (0.5) – (0.4) 1.3 –
Operating profit/(loss) 34.3 3.1 2.1 (6.8) (26.1) 6.6
Net finance costs (9.1)
Taxation (5.9)
Loss for the year from continuing operations (8.4)
Other segment information for continuing operations by segment was as follows:
Year ended 31 December 2011
Insurance Services
£m
Financial Services
£m Technology
£m
Procurement and
Other BPO £m
Corporate£m
Total £m
Depreciation and amortisation 7.3 10.4 9.5 2.5 1.9 31.6
Capital expenditure
– Related to business combinations, including goodwill 0.5 – – – – 0.5
– Normal business activities 1.6 4.0 8.3 2.2 0.2 16.3
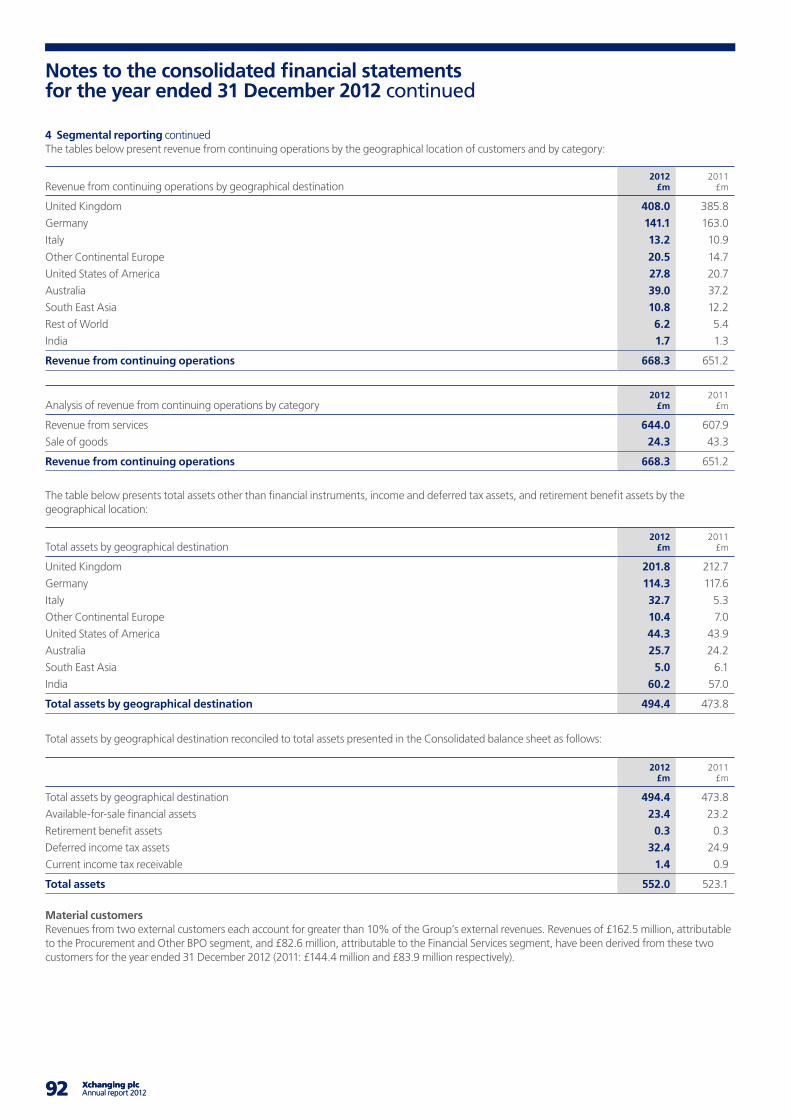
92 Xchanging plc Annual report 2012 9392 Xchanging plc Annual report 2012 93
Notes to the consolidated financial statements for the year ended 31 December 2012 continued
4 Segmental reporting continuedThe tables below present revenue from continuing operations by the geographical location of customers and by category:
Revenue from continuing operations by geographical destination2012
£m2011
£m
United Kingdom 408.0 385.8
Germany 141.1 163.0
Italy 13.2 10.9
Other Continental Europe 20.5 14.7
United States of America 27.8 20.7
Australia 39.0 37.2
South East Asia 10.8 12.2
Rest of World 6.2 5.4
India 1.7 1.3
Revenue from continuing operations 668.3 651.2
Analysis of revenue from continuing operations by category2012
£m2011
£m
Revenue from services 644.0 607.9
Sale of goods 24.3 43.3
Revenue from continuing operations 668.3 651.2
The table below presents total assets other than financial instruments, income and deferred tax assets, and retirement benefit assets by the geographical location:
Total assets by geographical destination2012
£m2011
£m
United Kingdom 201.8 212.7
Germany 114.3 117.6
Italy 32.7 5.3
Other Continental Europe 10.4 7.0
United States of America 44.3 43.9
Australia 25.7 24.2
South East Asia 5.0 6.1
India 60.2 57.0
Total assets by geographical destination 494.4 473.8
Total assets by geographical destination reconciled to total assets presented in the Consolidated balance sheet as follows:
2012 £m
2011£m
Total assets by geographical destination 494.4 473.8
Available-for-sale financial assets 23.4 23.2
Retirement benefit assets 0.3 0.3
Deferred income tax assets 32.4 24.9
Current income tax receivable 1.4 0.9
Total assets 552.0 523.1
Material customersRevenues from two external customers each account for greater than 10% of the Group’s external revenues. Revenues of £162.5 million, attributable to the Procurement and Other BPO segment, and £82.6 million, attributable to the Financial Services segment, have been derived from these two customers for the year ended 31 December 2012 (2011: £144.4 million and £83.9 million respectively).
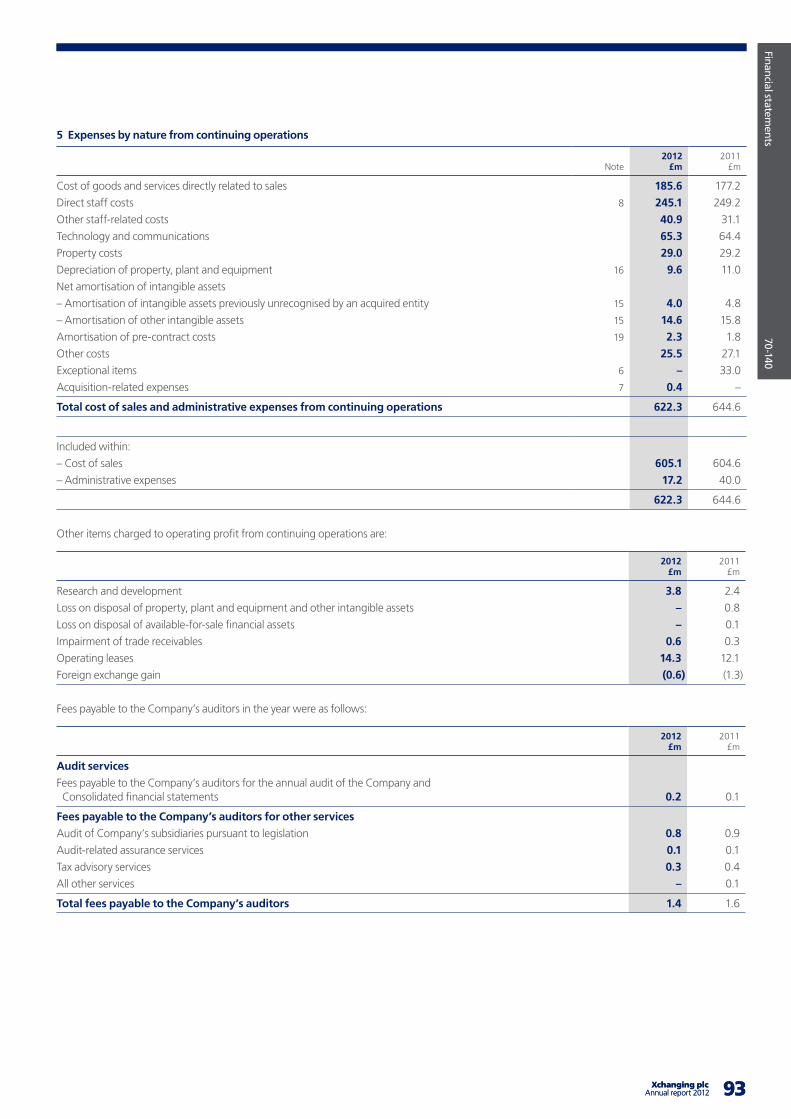
Company overview
X
X-X
X
93 Xchanging plcAnnual report 2012
Financial statements
70-140
93 Xchanging plcAnnual report 2012
5 Expenses by nature from continuing operations
Note2012
£m2011
£m
Cost of goods and services directly related to sales 185.6 177.2
Direct staff costs 8 245.1 249.2
Other staff-related costs 40.9 31.1
Technology and communications 65.3 64.4
Property costs 29.0 29.2
Depreciation of property, plant and equipment 16 9.6 11.0
Net amortisation of intangible assets
– Amortisation of intangible assets previously unrecognised by an acquired entity 15 4.0 4.8
– Amortisation of other intangible assets 15 14.6 15.8
Amortisation of pre-contract costs 19 2.3 1.8
Other costs 25.5 27.1
Exceptional items 6 – 33.0
Acquisition-related expenses 7 0.4 –
Total cost of sales and administrative expenses from continuing operations 622.3 644.6
Included within:
– Cost of sales 605.1 604.6
– Administrative expenses 17.2 40.0
622.3 644.6
Other items charged to operating profit from continuing operations are:
2012 £m
2011£m
Research and development 3.8 2.4
Loss on disposal of property, plant and equipment and other intangible assets – 0.8
Loss on disposal of available-for-sale financial assets – 0.1
Impairment of trade receivables 0.6 0.3
Operating leases 14.3 12.1
Foreign exchange gain (0.6) (1.3)
Fees payable to the Company’s auditors in the year were as follows:
2012 £m
2011£m
Audit services
Fees payable to the Company’s auditors for the annual audit of the Company and Consolidated financial statements 0.2 0.1
Fees payable to the Company’s auditors for other services
Audit of Company’s subsidiaries pursuant to legislation 0.8 0.9
Audit-related assurance services 0.1 0.1
Tax advisory services 0.3 0.4
All other services – 0.1
Total fees payable to the Company’s auditors 1.4 1.6
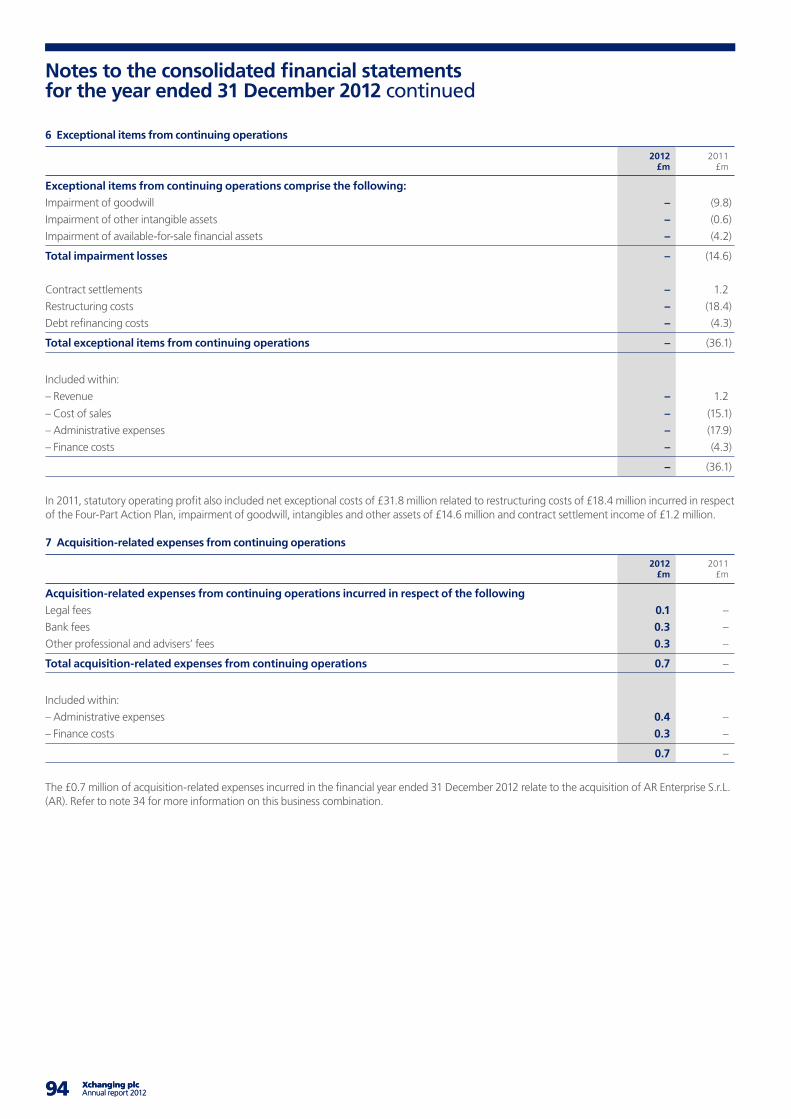
94 Xchanging plc Annual report 2012 9594 Xchanging plc Annual report 2012 95
Notes to the consolidated financial statements for the year ended 31 December 2012 continued
6 Exceptional items from continuing operations
2012 £m
2011£m
Exceptional items from continuing operations comprise the following:
Impairment of goodwill – (9.8)
Impairment of other intangible assets – (0.6)
Impairment of available-for-sale financial assets – (4.2)
Total impairment losses – (14.6)
Contract settlements – 1.2
Restructuring costs – (18.4)
Debt refinancing costs – (4.3)
Total exceptional items from continuing operations – (36.1)
Included within:
– Revenue – 1.2
– Cost of sales – (15.1)
– Administrative expenses – (17.9)
– Finance costs – (4.3)
– (36.1)
In 2011, statutory operating profit also included net exceptional costs of £31.8 million related to restructuring costs of £18.4 million incurred in respect of the Four-Part Action Plan, impairment of goodwill, intangibles and other assets of £14.6 million and contract settlement income of £1.2 million.
7 Acquisition-related expenses from continuing operations
2012 £m
2011£m
Acquisition-related expenses from continuing operations incurred in respect of the following
Legal fees 0.1 –
Bank fees 0.3 –
Other professional and advisers’ fees 0.3 –
Total acquisition-related expenses from continuing operations 0.7 –
Included within:
– Administrative expenses 0.4 –
– Finance costs 0.3 –
0.7 –
The £0.7 million of acquisition-related expenses incurred in the financial year ended 31 December 2012 relate to the acquisition of AR Enterprise S.r.L. (AR). Refer to note 34 for more information on this business combination.
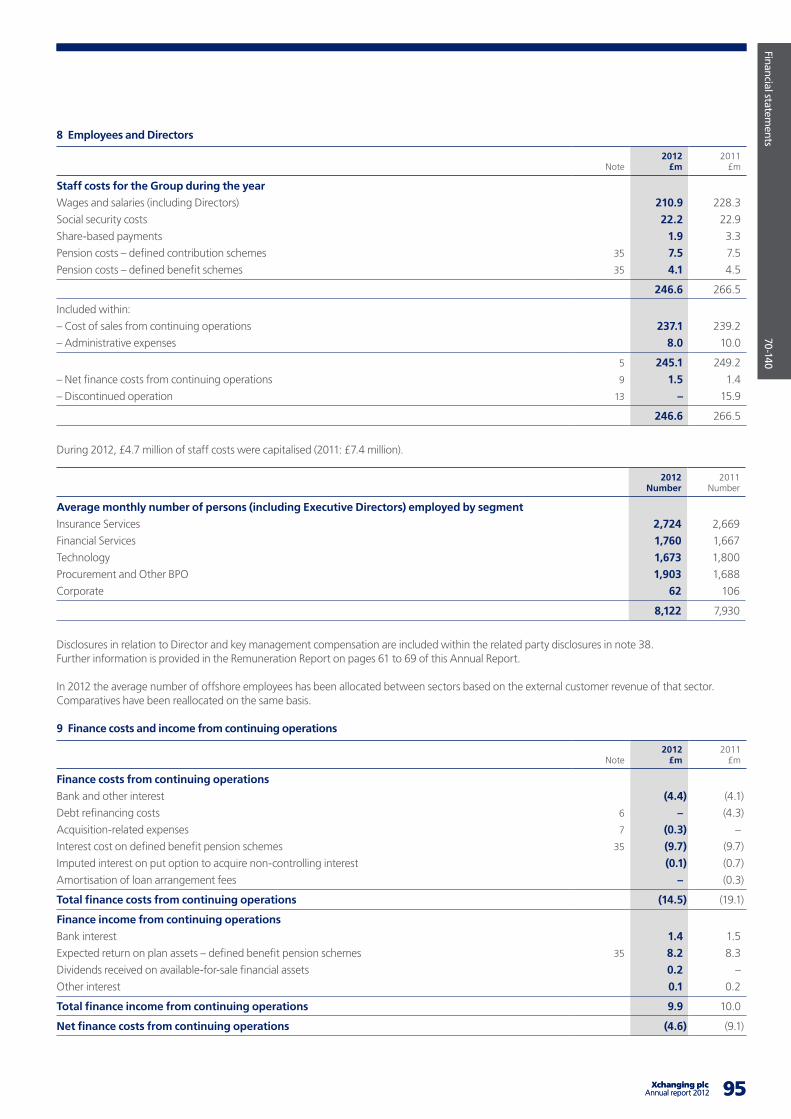
Company overview
X
X-X
X
95 Xchanging plcAnnual report 2012
Financial statements
70-140
95 Xchanging plcAnnual report 2012
8 Employees and Directors
Note2012
£m2011
£m
Staff costs for the Group during the year
Wages and salaries (including Directors) 210.9 228.3
Social security costs 22.2 22.9
Share-based payments 1.9 3.3
Pension costs – defined contribution schemes 35 7.5 7.5
Pension costs – defined benefit schemes 35 4.1 4.5
246.6 266.5
Included within:
– Cost of sales from continuing operations 237.1 239.2
– Administrative expenses 8.0 10.0
5 245.1 249.2
– Net finance costs from continuing operations 9 1.5 1.4
– Discontinued operation 13 – 15.9
246.6 266.5
During 2012, £4.7 million of staff costs were capitalised (2011: £7.4 million).
2012 Number
2011Number
Average monthly number of persons (including Executive Directors) employed by segment
Insurance Services 2,724 2,669
Financial Services 1,760 1,667
Technology 1,673 1,800
Procurement and Other BPO 1,903 1,688
Corporate 62 106
8,122 7,930
Disclosures in relation to Director and key management compensation are included within the related party disclosures in note 38. Further information is provided in the Remuneration Report on pages 61 to 69 of this Annual Report.
In 2012 the average number of offshore employees has been allocated between sectors based on the external customer revenue of that sector. Comparatives have been reallocated on the same basis.
9 Finance costs and income from continuing operations
Note2012
£m2011
£m
Finance costs from continuing operations
Bank and other interest (4.4) (4.1)
Debt refinancing costs 6 – (4.3)
Acquisition-related expenses 7 (0.3) –
Interest cost on defined benefit pension schemes 35 (9.7) (9.7)
Imputed interest on put option to acquire non-controlling interest (0.1) (0.7)
Amortisation of loan arrangement fees – (0.3)
Total finance costs from continuing operations (14.5) (19.1)
Finance income from continuing operations
Bank interest 1.4 1.5
Expected return on plan assets – defined benefit pension schemes 35 8.2 8.3
Dividends received on available-for-sale financial assets 0.2 –
Other interest 0.1 0.2
Total finance income from continuing operations 9.9 10.0
Net finance costs from continuing operations (4.6) (9.1)
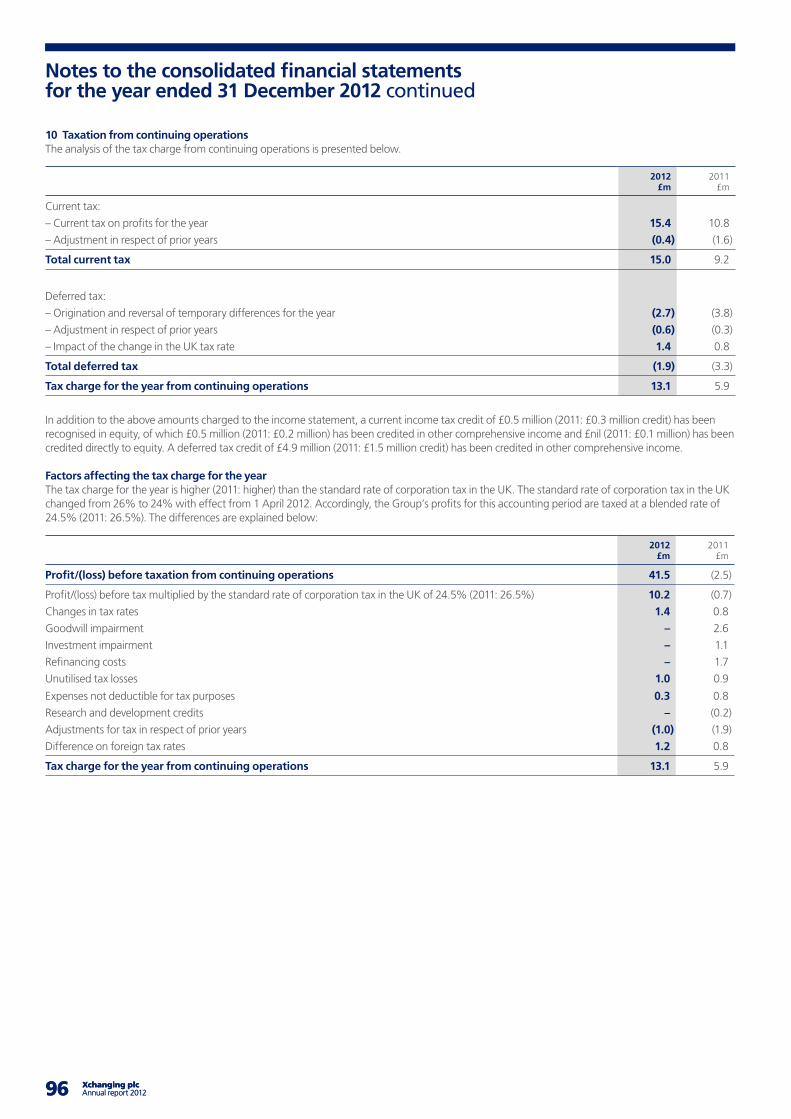
96 Xchanging plc Annual report 2012 9796 Xchanging plc Annual report 2012 97
Notes to the consolidated financial statements for the year ended 31 December 2012 continued
10 Taxation from continuing operationsThe analysis of the tax charge from continuing operations is presented below.
2012 £m
2011£m
Current tax:
– Current tax on profits for the year 15.4 10.8
– Adjustment in respect of prior years (0.4) (1.6)
Total current tax 15.0 9.2
Deferred tax:
– Origination and reversal of temporary differences for the year (2.7) (3.8)
– Adjustment in respect of prior years (0.6) (0.3)
– Impact of the change in the UK tax rate 1.4 0.8
Total deferred tax (1.9) (3.3)
Tax charge for the year from continuing operations 13.1 5.9
In addition to the above amounts charged to the income statement, a current income tax credit of £0.5 million (2011: £0.3 million credit) has been recognised in equity, of which £0.5 million (2011: £0.2 million) has been credited in other comprehensive income and £nil (2011: £0.1 million) has been credited directly to equity. A deferred tax credit of £4.9 million (2011: £1.5 million credit) has been credited in other comprehensive income.
Factors affecting the tax charge for the yearThe tax charge for the year is higher (2011: higher) than the standard rate of corporation tax in the UK. The standard rate of corporation tax in the UK changed from 26% to 24% with effect from 1 April 2012. Accordingly, the Group’s profits for this accounting period are taxed at a blended rate of 24.5% (2011: 26.5%). The differences are explained below:
2012 £m
2011£m
Profit/(loss) before taxation from continuing operations 41.5 (2.5)
Profit/(loss) before tax multiplied by the standard rate of corporation tax in the UK of 24.5% (2011: 26.5%) 10.2 (0.7)
Changes in tax rates 1.4 0.8
Goodwill impairment – 2.6
Investment impairment – 1.1
Refinancing costs – 1.7
Unutilised tax losses 1.0 0.9
Expenses not deductible for tax purposes 0.3 0.8
Research and development credits – (0.2)
Adjustments for tax in respect of prior years (1.0) (1.9)
Difference on foreign tax rates 1.2 0.8
Tax charge for the year from continuing operations 13.1 5.9
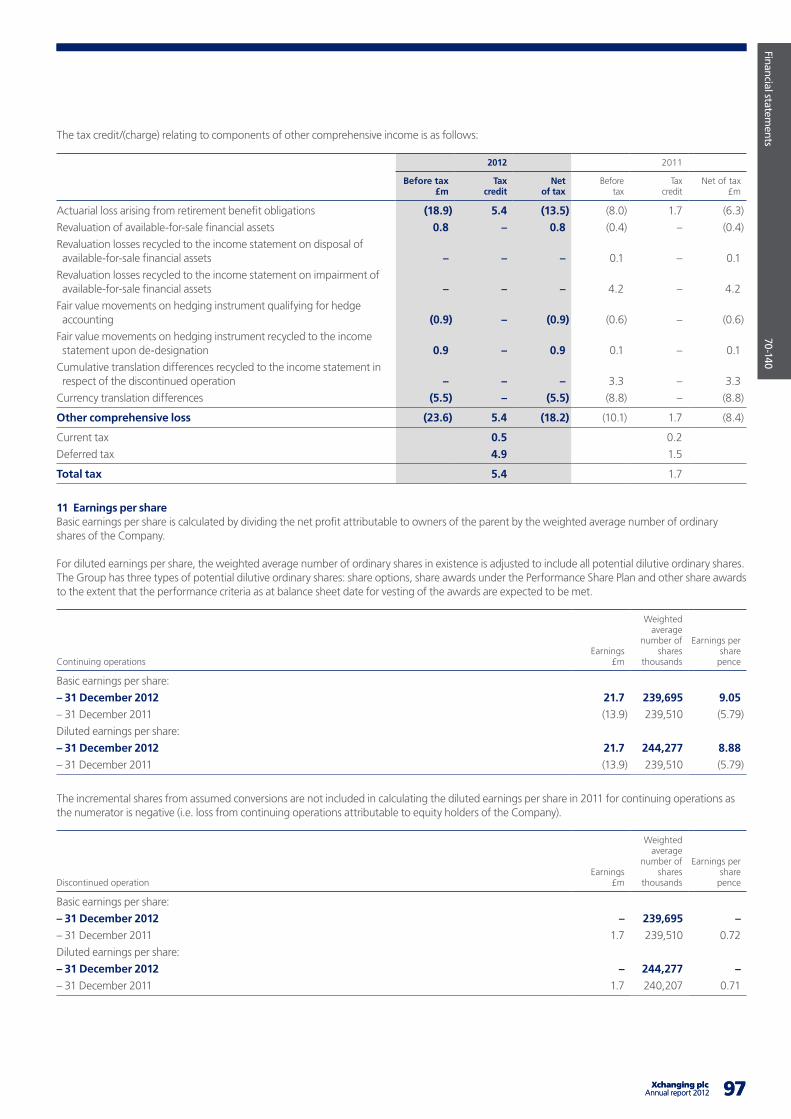
Company overview
X
X-X
X
97 Xchanging plcAnnual report 2012
Financial statements
70-140
97 Xchanging plcAnnual report 2012
The tax credit/(charge) relating to components of other comprehensive income is as follows:
2012 2011
Before tax £m
Tax credit
Net of tax
Before tax
Tax credit
Net of tax £m
Actuarial loss arising from retirement benefit obligations (18.9) 5.4 (13.5) (8.0) 1.7 (6.3)
Revaluation of available-for-sale financial assets 0.8 – 0.8 (0.4) – (0.4)
Revaluation losses recycled to the income statement on disposal of available-for-sale financial assets – – – 0.1 – 0.1
Revaluation losses recycled to the income statement on impairment of available-for-sale financial assets – – – 4.2 – 4.2
Fair value movements on hedging instrument qualifying for hedge accounting (0.9) – (0.9) (0.6) – (0.6)
Fair value movements on hedging instrument recycled to the income statement upon de-designation 0.9 – 0.9 0.1 – 0.1
Cumulative translation differences recycled to the income statement in respect of the discontinued operation – – – 3.3 – 3.3
Currency translation differences (5.5) – (5.5) (8.8) – (8.8)
Other comprehensive loss (23.6) 5.4 (18.2) (10.1) 1.7 (8.4)
Current tax 0.5 0.2
Deferred tax 4.9 1.5
Total tax 5.4 1.7
11 Earnings per shareBasic earnings per share is calculated by dividing the net profit attributable to owners of the parent by the weighted average number of ordinary shares of the Company.
For diluted earnings per share, the weighted average number of ordinary shares in existence is adjusted to include all potential dilutive ordinary shares. The Group has three types of potential dilutive ordinary shares: share options, share awards under the Performance Share Plan and other share awards to the extent that the performance criteria as at balance sheet date for vesting of the awards are expected to be met.
Continuing operations Earnings
£m
Weighted average
number of shares
thousands
Earnings per share
pence
Basic earnings per share:
– 31 December 2012 21.7 239,695 9.05
– 31 December 2011 (13.9) 239,510 (5.79)
Diluted earnings per share:
– 31 December 2012 21.7 244,277 8.88
– 31 December 2011 (13.9) 239,510 (5.79)
The incremental shares from assumed conversions are not included in calculating the diluted earnings per share in 2011 for continuing operations as the numerator is negative (i.e. loss from continuing operations attributable to equity holders of the Company).
Discontinued operation Earnings
£m
Weighted average
number of shares
thousands
Earnings per share
pence
Basic earnings per share:
– 31 December 2012 – 239,695 –
– 31 December 2011 1.7 239,510 0.72
Diluted earnings per share:
– 31 December 2012 – 244,277 –
– 31 December 2011 1.7 240,207 0.71
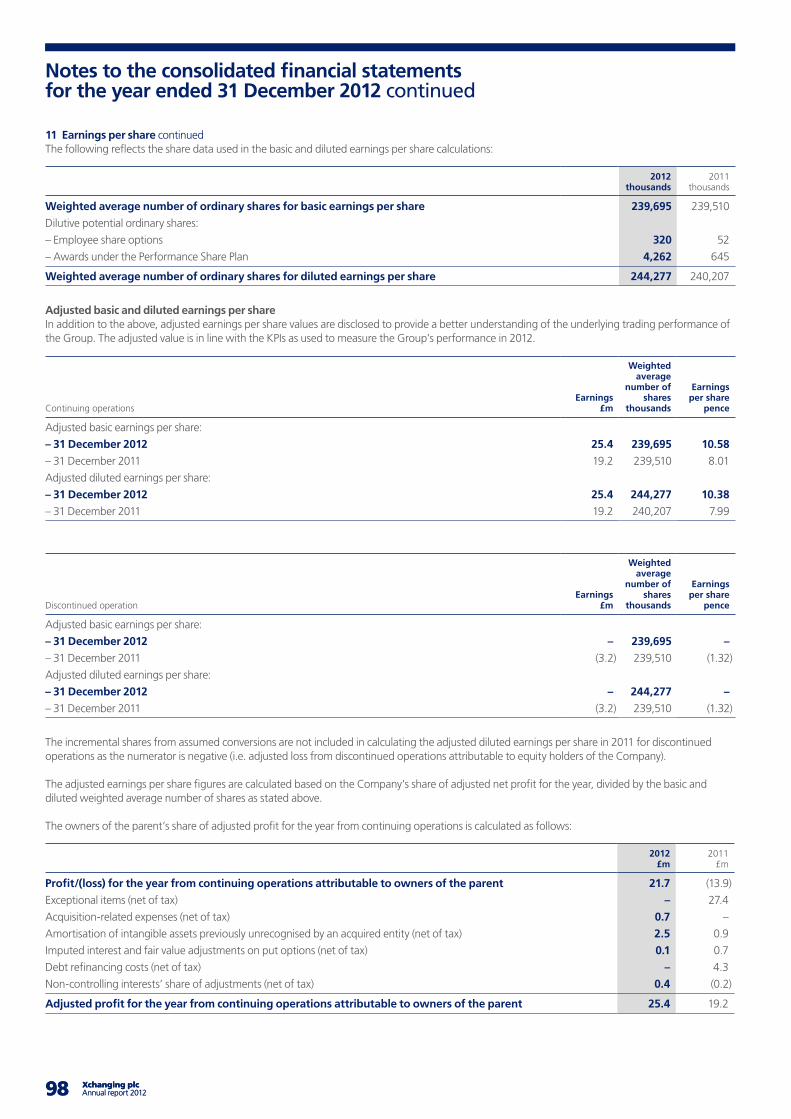
98 Xchanging plc Annual report 2012 9998 Xchanging plc Annual report 2012 99
Notes to the consolidated financial statements for the year ended 31 December 2012 continued
11 Earnings per share continuedThe following reflects the share data used in the basic and diluted earnings per share calculations:
2012
thousands2011
thousands
Weighted average number of ordinary shares for basic earnings per share 239,695 239,510
Dilutive potential ordinary shares:
– Employee share options 320 52
– Awards under the Performance Share Plan 4,262 645
Weighted average number of ordinary shares for diluted earnings per share 244,277 240,207
Adjusted basic and diluted earnings per shareIn addition to the above, adjusted earnings per share values are disclosed to provide a better understanding of the underlying trading performance of the Group. The adjusted value is in line with the KPIs as used to measure the Group’s performance in 2012.
Continuing operations Earnings
£m
Weighted average
number of shares
thousands
Earnings per share
pence
Adjusted basic earnings per share:
– 31 December 2012 25.4 239,695 10.58
– 31 December 2011 19.2 239,510 8.01
Adjusted diluted earnings per share:
– 31 December 2012 25.4 244,277 10.38
– 31 December 2011 19.2 240,207 7.99
Discontinued operation Earnings
£m
Weighted average
number of shares
thousands
Earnings per share
pence
Adjusted basic earnings per share:
– 31 December 2012 – 239,695 –
– 31 December 2011 (3.2) 239,510 (1.32)
Adjusted diluted earnings per share:
– 31 December 2012 – 244,277 –
– 31 December 2011 (3.2) 239,510 (1.32)
The incremental shares from assumed conversions are not included in calculating the adjusted diluted earnings per share in 2011 for discontinued operations as the numerator is negative (i.e. adjusted loss from discontinued operations attributable to equity holders of the Company).
The adjusted earnings per share figures are calculated based on the Company’s share of adjusted net profit for the year, divided by the basic and diluted weighted average number of shares as stated above.
The owners of the parent’s share of adjusted profit for the year from continuing operations is calculated as follows:
2012 £m
2011£m
Profit/(loss) for the year from continuing operations attributable to owners of the parent 21.7 (13.9)
Exceptional items (net of tax) – 27.4
Acquisition-related expenses (net of tax) 0.7 –
Amortisation of intangible assets previously unrecognised by an acquired entity (net of tax) 2.5 0.9
Imputed interest and fair value adjustments on put options (net of tax) 0.1 0.7
Debt refinancing costs (net of tax) – 4.3
Non-controlling interests’ share of adjustments (net of tax) 0.4 (0.2)
Adjusted profit for the year from continuing operations attributable to owners of the parent 25.4 19.2
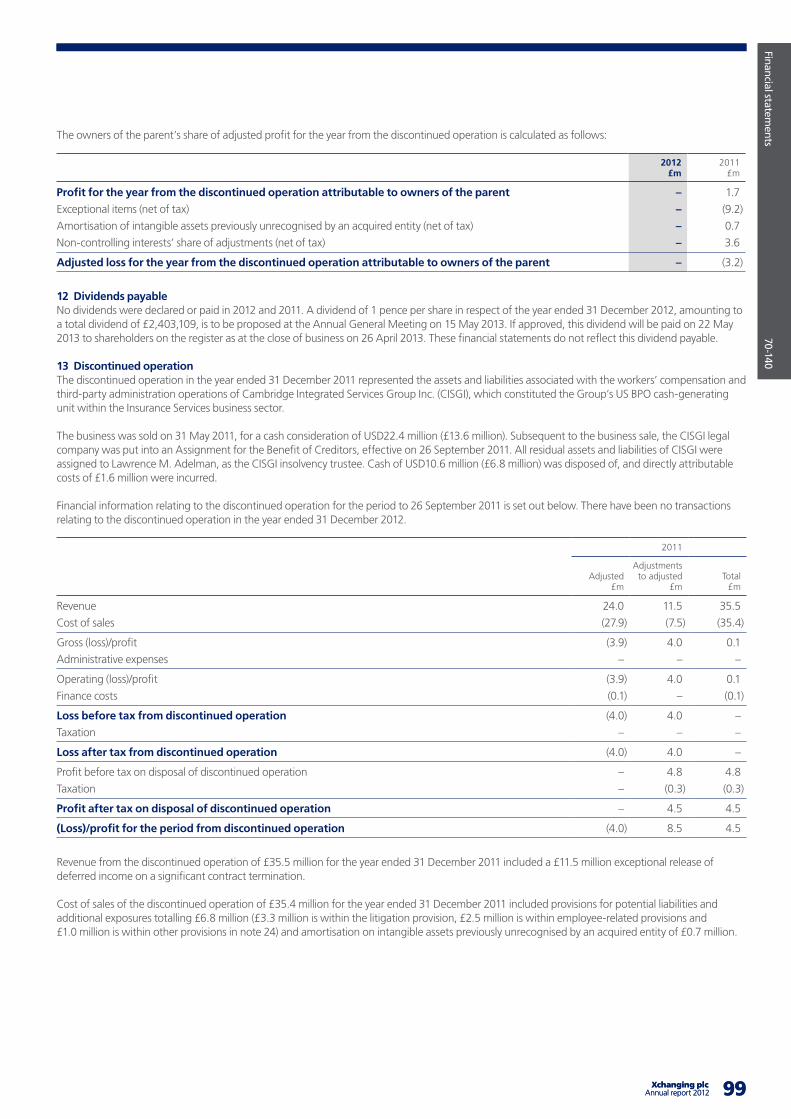
Company overview
X
X-X
X
99 Xchanging plcAnnual report 2012
Financial statements
70-140
99 Xchanging plcAnnual report 2012
The owners of the parent’s share of adjusted profit for the year from the discontinued operation is calculated as follows:
2012 £m
2011£m
Profit for the year from the discontinued operation attributable to owners of the parent – 1.7
Exceptional items (net of tax) – (9.2)
Amortisation of intangible assets previously unrecognised by an acquired entity (net of tax) – 0.7
Non-controlling interests’ share of adjustments (net of tax) – 3.6
Adjusted loss for the year from the discontinued operation attributable to owners of the parent – (3.2)
12 Dividends payableNo dividends were declared or paid in 2012 and 2011. A dividend of 1 pence per share in respect of the year ended 31 December 2012, amounting to a total dividend of £2,403,109, is to be proposed at the Annual General Meeting on 15 May 2013. If approved, this dividend will be paid on 22 May 2013 to shareholders on the register as at the close of business on 26 April 2013. These financial statements do not reflect this dividend payable.
13 Discontinued operationThe discontinued operation in the year ended 31 December 2011 represented the assets and liabilities associated with the workers’ compensation and third-party administration operations of Cambridge Integrated Services Group Inc. (CISGI), which constituted the Group’s US BPO cash-generating unit within the Insurance Services business sector.
The business was sold on 31 May 2011, for a cash consideration of USD22.4 million (£13.6 million). Subsequent to the business sale, the CISGI legal company was put into an Assignment for the Benefit of Creditors, effective on 26 September 2011. All residual assets and liabilities of CISGI were assigned to Lawrence M. Adelman, as the CISGI insolvency trustee. Cash of USD10.6 million (£6.8 million) was disposed of, and directly attributable costs of £1.6 million were incurred.
Financial information relating to the discontinued operation for the period to 26 September 2011 is set out below. There have been no transactions relating to the discontinued operation in the year ended 31 December 2012.
2011
Adjusted£m
Adjustments to adjusted
£mTotal
£m
Revenue 24.0 11.5 35.5
Cost of sales (27.9) (7.5) (35.4)
Gross (loss)/profit (3.9) 4.0 0.1
Administrative expenses – – –
Operating (loss)/profit (3.9) 4.0 0.1
Finance costs (0.1) – (0.1)
Loss before tax from discontinued operation (4.0) 4.0 –
Taxation – – –
Loss after tax from discontinued operation (4.0) 4.0 –
Profit before tax on disposal of discontinued operation – 4.8 4.8
Taxation – (0.3) (0.3)
Profit after tax on disposal of discontinued operation – 4.5 4.5
(Loss)/profit for the period from discontinued operation (4.0) 8.5 4.5
Revenue from the discontinued operation of £35.5 million for the year ended 31 December 2011 included a £11.5 million exceptional release of deferred income on a significant contract termination.
Cost of sales of the discontinued operation of £35.4 million for the year ended 31 December 2011 included provisions for potential liabilities and additional exposures totalling £6.8 million (£3.3 million is within the litigation provision, £2.5 million is within employee-related provisions and £1.0 million is within other provisions in note 24) and amortisation on intangible assets previously unrecognised by an acquired entity of £0.7 million.
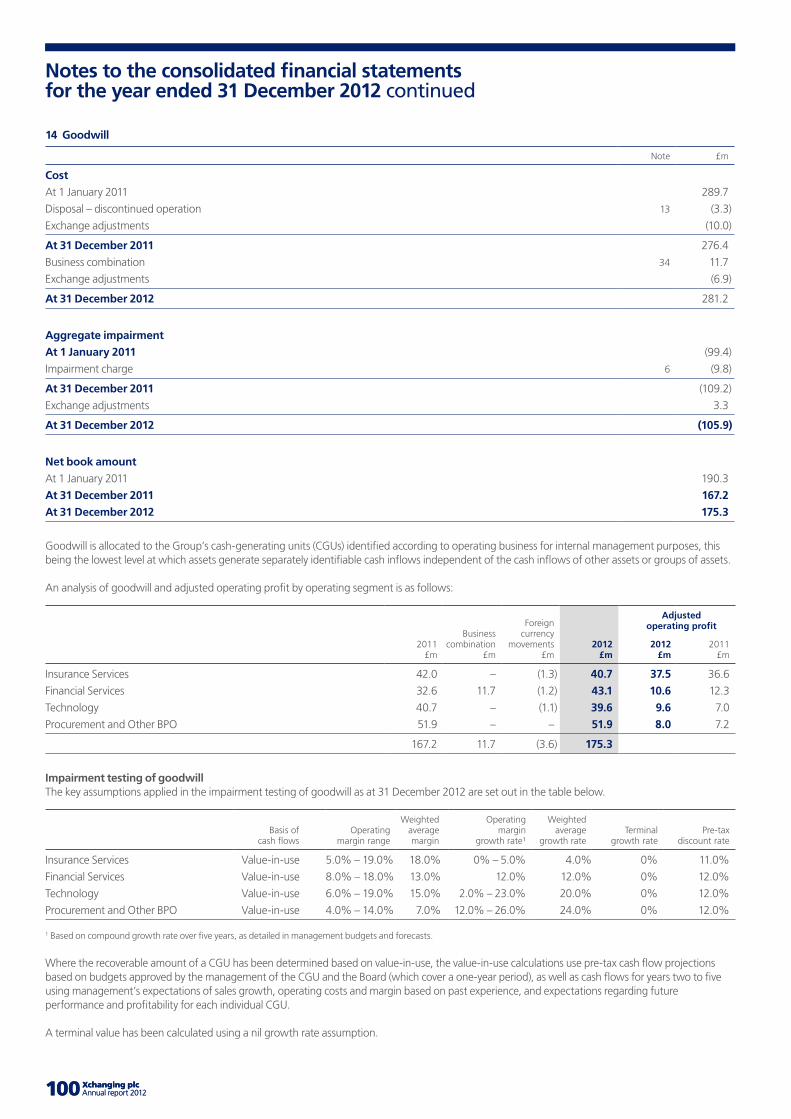
100 Xchanging plc Annual report 2012 101100 Xchanging plc Annual report 2012 101
Notes to the consolidated financial statements for the year ended 31 December 2012 continued
14 Goodwill
Note £m
Cost
At 1 January 2011 289.7
Disposal – discontinued operation 13 (3.3)
Exchange adjustments (10.0)
At 31 December 2011 276.4
Business combination 34 11.7
Exchange adjustments (6.9)
At 31 December 2012 281.2
Aggregate impairment
At 1 January 2011 (99.4)
Impairment charge 6 (9.8)
At 31 December 2011 (109.2)
Exchange adjustments 3.3
At 31 December 2012 (105.9)
Net book amount
At 1 January 2011 190.3
At 31 December 2011 167.2
At 31 December 2012 175.3
Goodwill is allocated to the Group’s cash-generating units (CGUs) identified according to operating business for internal management purposes, this being the lowest level at which assets generate separately identifiable cash inflows independent of the cash inflows of other assets or groups of assets.
An analysis of goodwill and adjusted operating profit by operating segment is as follows:
2011 £m
Business combination
£m
Foreign currency
movements £m
2012 £m
Adjusted operating profit
2012 £m
2011 £m
Insurance Services 42.0 – (1.3) 40.7 37.5 36.6
Financial Services 32.6 11.7 (1.2) 43.1 10.6 12.3
Technology 40.7 – (1.1) 39.6 9.6 7.0
Procurement and Other BPO 51.9 – – 51.9 8.0 7.2
167.2 11.7 (3.6) 175.3
Impairment testing of goodwillThe key assumptions applied in the impairment testing of goodwill as at 31 December 2012 are set out in the table below.
Basis of cash flows
Operating margin range
Weighted average margin
Operating margin
growth rate¹
Weighted average
growth rateTerminal
growth ratePre-tax
discount rate
Insurance Services Value-in-use 5.0% – 19.0% 18.0% 0% – 5.0% 4.0% 0% 11.0%
Financial Services Value-in-use 8.0% – 18.0% 13.0% 12.0% 12.0% 0% 12.0%
Technology Value-in-use 6.0% – 19.0% 15.0% 2.0% – 23.0% 20.0% 0% 12.0%
Procurement and Other BPO Value-in-use 4.0% – 14.0% 7.0% 12.0% – 26.0% 24.0% 0% 12.0%
1 Based on compound growth rate over five years, as detailed in management budgets and forecasts.
Where the recoverable amount of a CGU has been determined based on value-in-use, the value-in-use calculations use pre-tax cash flow projections based on budgets approved by the management of the CGU and the Board (which cover a one-year period), as well as cash flows for years two to five using management’s expectations of sales growth, operating costs and margin based on past experience, and expectations regarding future performance and profitability for each individual CGU.
A terminal value has been calculated using a nil growth rate assumption.
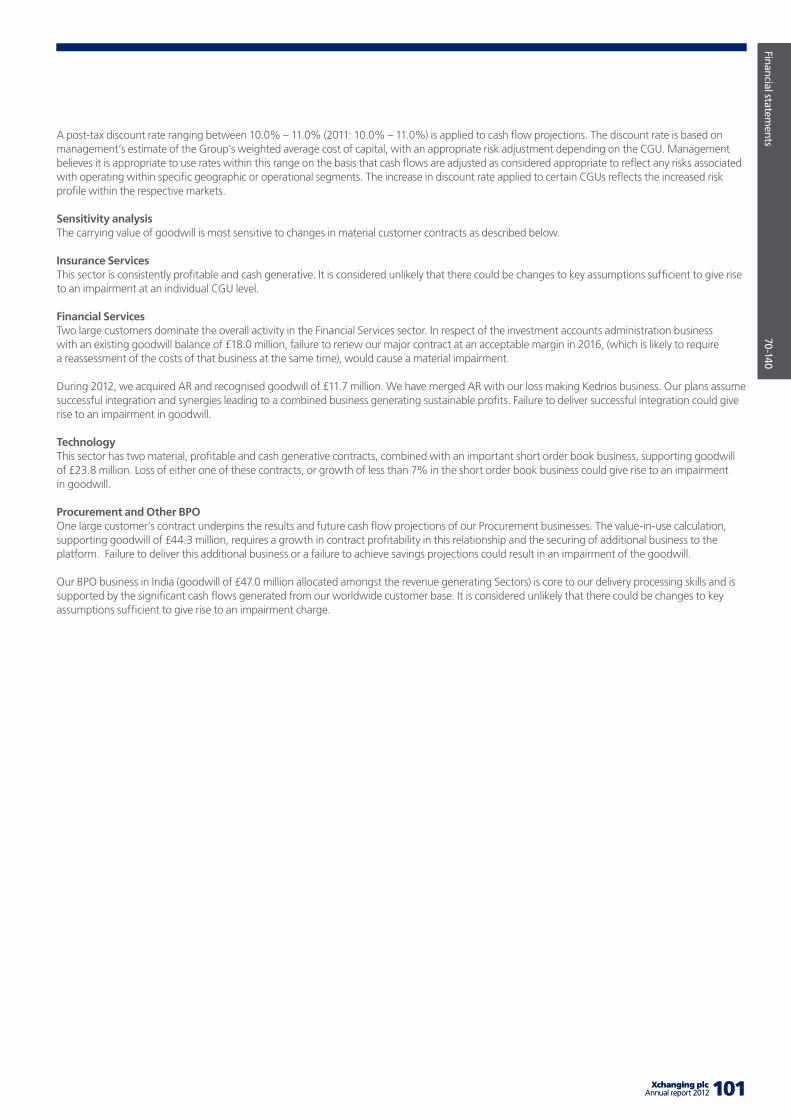
Company overview
X
X-X
X
101 Xchanging plcAnnual report 2012
Financial statements
70-140
101 Xchanging plcAnnual report 2012
A post-tax discount rate ranging between 10.0% – 11.0% (2011: 10.0% – 11.0%) is applied to cash flow projections. The discount rate is based on management’s estimate of the Group’s weighted average cost of capital, with an appropriate risk adjustment depending on the CGU. Management believes it is appropriate to use rates within this range on the basis that cash flows are adjusted as considered appropriate to reflect any risks associated with operating within specific geographic or operational segments. The increase in discount rate applied to certain CGUs reflects the increased risk profile within the respective markets.
Sensitivity analysisThe carrying value of goodwill is most sensitive to changes in material customer contracts as described below.
Insurance ServicesThis sector is consistently profitable and cash generative. It is considered unlikely that there could be changes to key assumptions sufficient to give rise to an impairment at an individual CGU level.
Financial ServicesTwo large customers dominate the overall activity in the Financial Services sector. In respect of the investment accounts administration business with an existing goodwill balance of £18.0 million, failure to renew our major contract at an acceptable margin in 2016, (which is likely to require a reassessment of the costs of that business at the same time), would cause a material impairment.
During 2012, we acquired AR and recognised goodwill of £11.7 million. We have merged AR with our loss making Kedrios business. Our plans assume successful integration and synergies leading to a combined business generating sustainable profits. Failure to deliver successful integration could give rise to an impairment in goodwill.
TechnologyThis sector has two material, profitable and cash generative contracts, combined with an important short order book business, supporting goodwill of £23.8 million. Loss of either one of these contracts, or growth of less than 7% in the short order book business could give rise to an impairment in goodwill.
Procurement and Other BPOOne large customer’s contract underpins the results and future cash flow projections of our Procurement businesses. The value-in-use calculation, supporting goodwill of £44.3 million, requires a growth in contract profitability in this relationship and the securing of additional business to the platform. Failure to deliver this additional business or a failure to achieve savings projections could result in an impairment of the goodwill.
Our BPO business in India (goodwill of £47.0 million allocated amongst the revenue generating Sectors) is core to our delivery processing skills and is supported by the significant cash flows generated from our worldwide customer base. It is considered unlikely that there could be changes to key assumptions sufficient to give rise to an impairment charge.
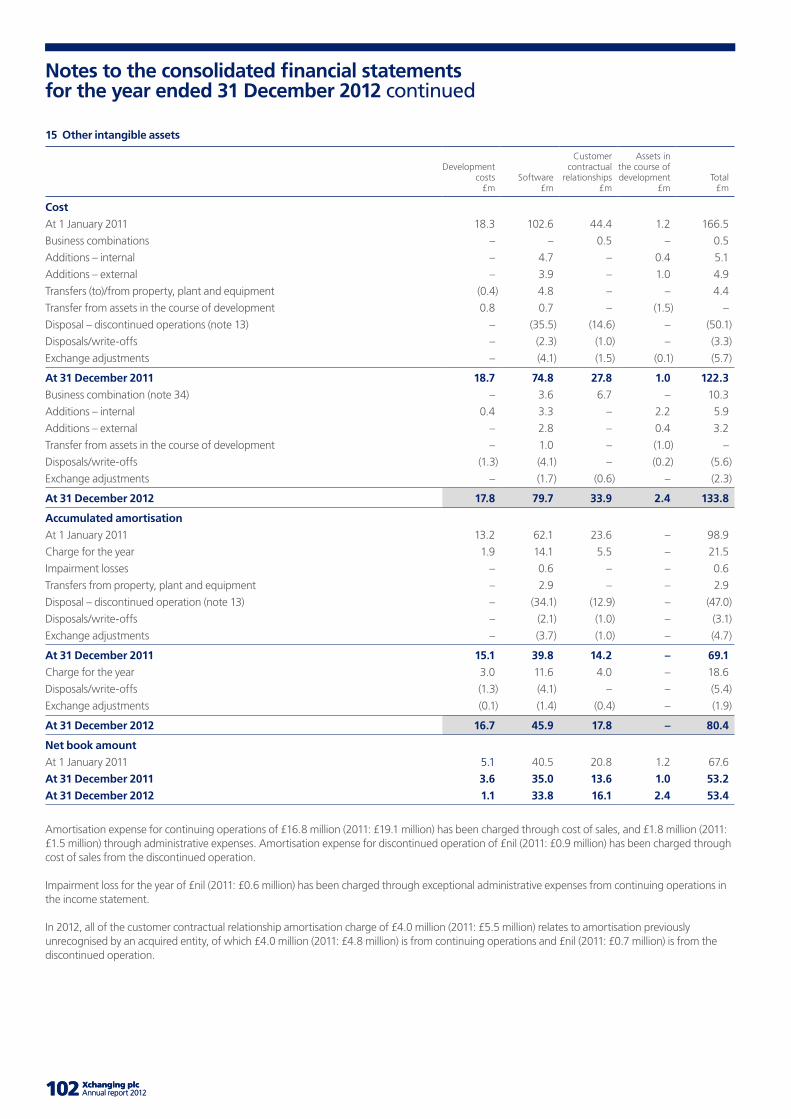
102 Xchanging plc Annual report 2012 103102 Xchanging plc Annual report 2012 103
Notes to the consolidated financial statements for the year ended 31 December 2012 continued
15 Other intangible assets
Development costs
£mSoftware
£m
Customer contractual
relationships£m
Assets inthe course of development
£mTotal
£m
Cost
At 1 January 2011 18.3 102.6 44.4 1.2 166.5
Business combinations – – 0.5 – 0.5
Additions – internal – 4.7 – 0.4 5.1
Additions – external – 3.9 – 1.0 4.9
Transfers (to)/from property, plant and equipment (0.4) 4.8 – – 4.4
Transfer from assets in the course of development 0.8 0.7 – (1.5) –
Disposal – discontinued operations (note 13) – (35.5) (14.6) – (50.1)
Disposals/write-offs – (2.3) (1.0) – (3.3)
Exchange adjustments – (4.1) (1.5) (0.1) (5.7)
At 31 December 2011 18.7 74.8 27.8 1.0 122.3
Business combination (note 34) – 3.6 6.7 – 10.3
Additions – internal 0.4 3.3 – 2.2 5.9
Additions – external – 2.8 – 0.4 3.2
Transfer from assets in the course of development – 1.0 – (1.0) –
Disposals/write-offs (1.3) (4.1) – (0.2) (5.6)
Exchange adjustments – (1.7) (0.6) – (2.3)
At 31 December 2012 17.8 79.7 33.9 2.4 133.8
Accumulated amortisation
At 1 January 2011 13.2 62.1 23.6 – 98.9
Charge for the year 1.9 14.1 5.5 – 21.5
Impairment losses – 0.6 – – 0.6
Transfers from property, plant and equipment – 2.9 – – 2.9
Disposal – discontinued operation (note 13) – (34.1) (12.9) – (47.0)
Disposals/write-offs – (2.1) (1.0) – (3.1)
Exchange adjustments – (3.7) (1.0) – (4.7)
At 31 December 2011 15.1 39.8 14.2 – 69.1
Charge for the year 3.0 11.6 4.0 – 18.6
Disposals/write-offs (1.3) (4.1) – – (5.4)
Exchange adjustments (0.1) (1.4) (0.4) – (1.9)
At 31 December 2012 16.7 45.9 17.8 – 80.4
Net book amount
At 1 January 2011 5.1 40.5 20.8 1.2 67.6
At 31 December 2011 3.6 35.0 13.6 1.0 53.2
At 31 December 2012 1.1 33.8 16.1 2.4 53.4
Amortisation expense for continuing operations of £16.8 million (2011: £19.1 million) has been charged through cost of sales, and £1.8 million (2011: £1.5 million) through administrative expenses. Amortisation expense for discontinued operation of £nil (2011: £0.9 million) has been charged through cost of sales from the discontinued operation.
Impairment loss for the year of £nil (2011: £0.6 million) has been charged through exceptional administrative expenses from continuing operations in the income statement.
In 2012, all of the customer contractual relationship amortisation charge of £4.0 million (2011: £5.5 million) relates to amortisation previously unrecognised by an acquired entity, of which £4.0 million (2011: £4.8 million) is from continuing operations and £nil (2011: £0.7 million) is from the discontinued operation.
Company overview
X
X-X
X
103 Xchanging plcAnnual report 2012
Financial statements
70-140
103 Xchanging plcAnnual report 2012
Significant individual assets, which are included in the balances above, are as follows:
Software Xuber is the Group’s internally generated, global insurance application platform, and provides support for the full insurance cycle including quotation, claim notification as well as payment and settlement. The asset has a carrying amount as at 31 December 2012 of £11.8 million (2011: £11.5 million) and is made up of several components being amortised to 2016.
Abgeltungssteuer is the German withholding tax processing system developed to provide regulatory tax reporting requirements for financial services customers based in Germany. The asset has a carrying amount as at 31 December 2012 of £2.0 million (2011: £2.6 million) and the remaining amortisation period is two years and nine months.
A front-end software platform for financial services customers based in Germany. This software ensures the ability to deliver the requested transaction services in line with the lifetime of the contract. The asset has a carrying amount as at 31 December 2012 of £2.5 million (2011: £3.5 million) and is being amortised to 2015.
Funds administration processing platforms, including costs of migration of new customers on to the platform. The asset has a carrying amount as at 31 December 2012 of £3.9 million (2011: £5.2 million), and is made up of several components being amortised up to 2019.
IT platform and software acquired with AR during the year relates to a comprehensive information technology (IT) solution for the securities brokerage and asset management industry in Italy. The asset has a carrying amount of £3.6 million, and is being amortised to 2017.
Assets in the course of development Netsett is the Group’s internally generated, global (re)insurance and accounting net settlement service. It is a netting and settlement solution designed to deliver operational efficiency, transparency, and capital efficiency benefits to participants through the implementation of a centralised, multi-lateral, multi-currency engine platform for premium and claims flows within and between global cedents, brokers and carriers. The asset has a carrying amount as at 31 December 2012 of £2.5 million (2011: £0.2 million). This software development is in pilot phase and will be launched in 2013.
Customer contractual relationships Open architecture customer contracts relating to investment fund administration. The asset has a carrying amount as at 31 December 2012 of £7.0 million (2011: £8.3 million) and the remaining amortisation period is seven years and three months.
Contractual relationship relating to the Victoria workers’ compensation contract. The asset has a carrying amount as at 31 December 2012 of £1.2 million (2011: £2.5 million) and the remaining amortisation period is to 2014.
Brokerage and Asset management customers acquired as part of the acquisition of AR in 2012. These assets have a carrying amount of £6.7 million and are being amortised to 2022.
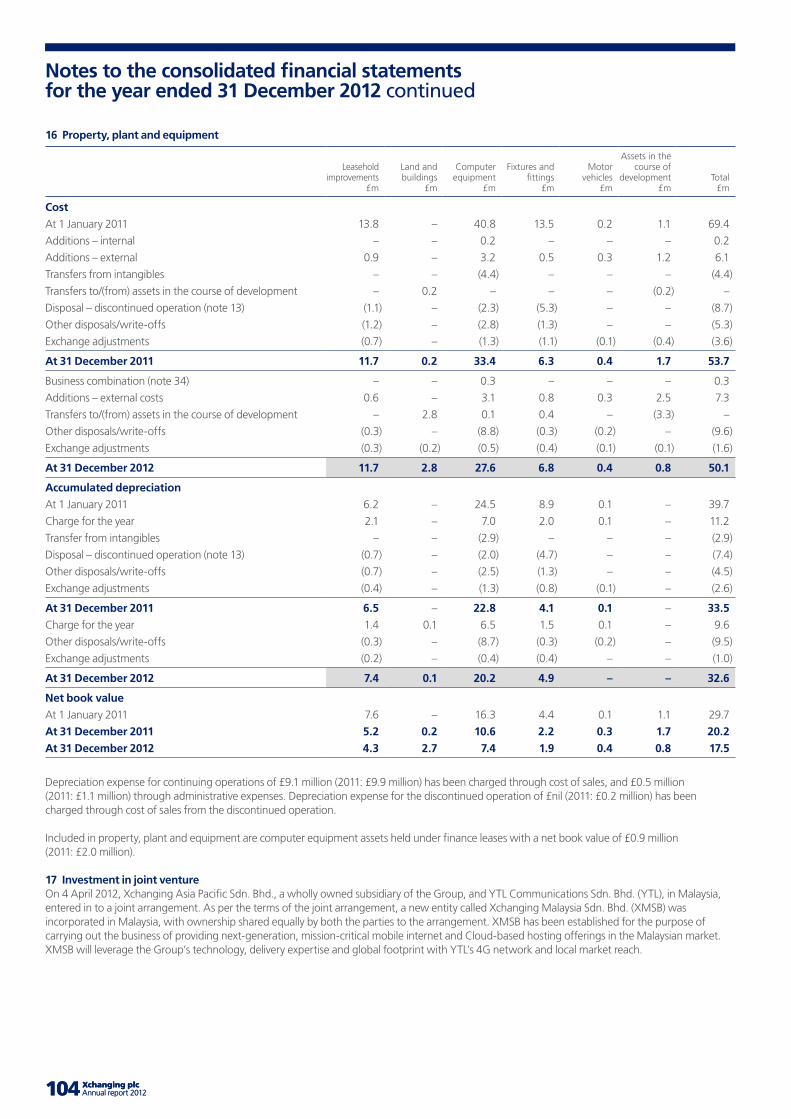
104 Xchanging plc Annual report 2012 105104 Xchanging plc Annual report 2012 105
Notes to the consolidated financial statements for the year ended 31 December 2012 continued
16 Property, plant and equipment
Leasehold improvements
£m
Land and buildings
£m
Computer equipment
£m
Fixtures and fittings
£m
Motor vehicles
£m
Assets in the course of
development £m
Total £m
Cost
At 1 January 2011 13.8 – 40.8 13.5 0.2 1.1 69.4
Additions – internal – – 0.2 – – – 0.2
Additions – external 0.9 – 3.2 0.5 0.3 1.2 6.1
Transfers from intangibles – – (4.4) – – – (4.4)
Transfers to/(from) assets in the course of development – 0.2 – – – (0.2) –
Disposal – discontinued operation (note 13) (1.1) – (2.3) (5.3) – – (8.7)
Other disposals/write-offs (1.2) – (2.8) (1.3) – – (5.3)
Exchange adjustments (0.7) – (1.3) (1.1) (0.1) (0.4) (3.6)
At 31 December 2011 11.7 0.2 33.4 6.3 0.4 1.7 53.7
Business combination (note 34) – – 0.3 – – – 0.3
Additions – external costs 0.6 – 3.1 0.8 0.3 2.5 7.3
Transfers to/(from) assets in the course of development – 2.8 0.1 0.4 – (3.3) –
Other disposals/write-offs (0.3) – (8.8) (0.3) (0.2) – (9.6)
Exchange adjustments (0.3) (0.2) (0.5) (0.4) (0.1) (0.1) (1.6)
At 31 December 2012 11.7 2.8 27.6 6.8 0.4 0.8 50.1
Accumulated depreciation
At 1 January 2011 6.2 – 24.5 8.9 0.1 – 39.7
Charge for the year 2.1 – 7.0 2.0 0.1 – 11.2
Transfer from intangibles – – (2.9) – – – (2.9)
Disposal – discontinued operation (note 13) (0.7) – (2.0) (4.7) – – (7.4)
Other disposals/write-offs (0.7) – (2.5) (1.3) – – (4.5)
Exchange adjustments (0.4) – (1.3) (0.8) (0.1) – (2.6)
At 31 December 2011 6.5 – 22.8 4.1 0.1 – 33.5
Charge for the year 1.4 0.1 6.5 1.5 0.1 – 9.6
Other disposals/write-offs (0.3) – (8.7) (0.3) (0.2) – (9.5)
Exchange adjustments (0.2) – (0.4) (0.4) – – (1.0)
At 31 December 2012 7.4 0.1 20.2 4.9 – – 32.6
Net book value
At 1 January 2011 7.6 – 16.3 4.4 0.1 1.1 29.7
At 31 December 2011 5.2 0.2 10.6 2.2 0.3 1.7 20.2
At 31 December 2012 4.3 2.7 7.4 1.9 0.4 0.8 17.5
Depreciation expense for continuing operations of £9.1 million (2011: £9.9 million) has been charged through cost of sales, and £0.5 million (2011: £1.1 million) through administrative expenses. Depreciation expense for the discontinued operation of £nil (2011: £0.2 million) has been charged through cost of sales from the discontinued operation.
Included in property, plant and equipment are computer equipment assets held under finance leases with a net book value of £0.9 million (2011: £2.0 million).
17 Investment in joint ventureOn 4 April 2012, Xchanging Asia Pacific Sdn. Bhd., a wholly owned subsidiary of the Group, and YTL Communications Sdn. Bhd. (YTL), in Malaysia, entered in to a joint arrangement. As per the terms of the joint arrangement, a new entity called Xchanging Malaysia Sdn. Bhd. (XMSB) was incorporated in Malaysia, with ownership shared equally by both the parties to the arrangement. XMSB has been established for the purpose of carrying out the business of providing next-generation, mission-critical mobile internet and Cloud-based hosting offerings in the Malaysian market. XMSB will leverage the Group’s technology, delivery expertise and global footprint with YTL’s 4G network and local market reach.
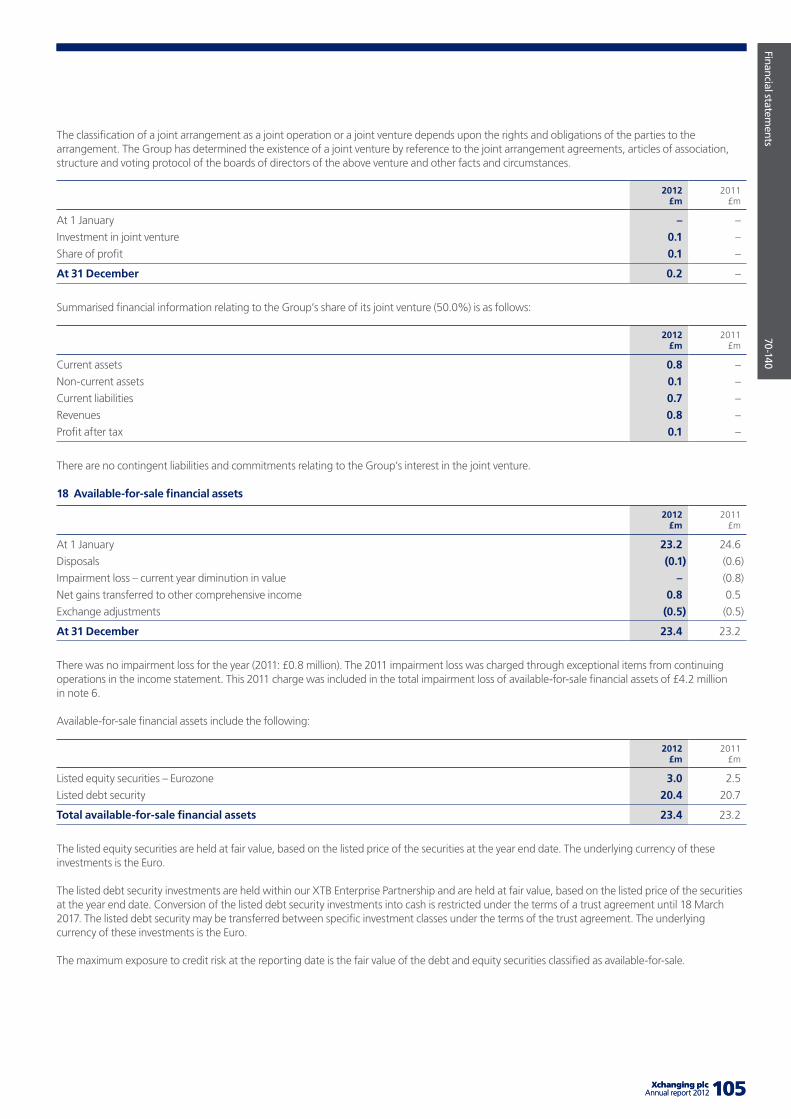
Company overview
X
X-X
X
105 Xchanging plcAnnual report 2012
Financial statements
70-140
105 Xchanging plcAnnual report 2012
The classification of a joint arrangement as a joint operation or a joint venture depends upon the rights and obligations of the parties to the arrangement. The Group has determined the existence of a joint venture by reference to the joint arrangement agreements, articles of association, structure and voting protocol of the boards of directors of the above venture and other facts and circumstances.
2012 £m
2011£m
At 1 January – –
Investment in joint venture 0.1 –
Share of profit 0.1 –
At 31 December 0.2 –
Summarised financial information relating to the Group’s share of its joint venture (50.0%) is as follows:
2012 £m
2011£m
Current assets 0.8 –
Non-current assets 0.1 –
Current liabilities 0.7 –
Revenues 0.8 –
Profit after tax 0.1 –
There are no contingent liabilities and commitments relating to the Group’s interest in the joint venture.
18 Available-for-sale financial assets
2012 £m
2011£m
At 1 January 23.2 24.6
Disposals (0.1) (0.6)
Impairment loss – current year diminution in value – (0.8)
Net gains transferred to other comprehensive income 0.8 0.5
Exchange adjustments (0.5) (0.5)
At 31 December 23.4 23.2
There was no impairment loss for the year (2011: £0.8 million). The 2011 impairment loss was charged through exceptional items from continuing operations in the income statement. This 2011 charge was included in the total impairment loss of available-for-sale financial assets of £4.2 million in note 6.
Available-for-sale financial assets include the following:
2012 £m
2011£m
Listed equity securities – Eurozone 3.0 2.5
Listed debt security 20.4 20.7
Total available-for-sale financial assets 23.4 23.2
The listed equity securities are held at fair value, based on the listed price of the securities at the year end date. The underlying currency of these investments is the Euro.
The listed debt security investments are held within our XTB Enterprise Partnership and are held at fair value, based on the listed price of the securities at the year end date. Conversion of the listed debt security investments into cash is restricted under the terms of a trust agreement until 18 March 2017. The listed debt security may be transferred between specific investment classes under the terms of the trust agreement. The underlying currency of these investments is the Euro.
The maximum exposure to credit risk at the reporting date is the fair value of the debt and equity securities classified as available-for-sale.
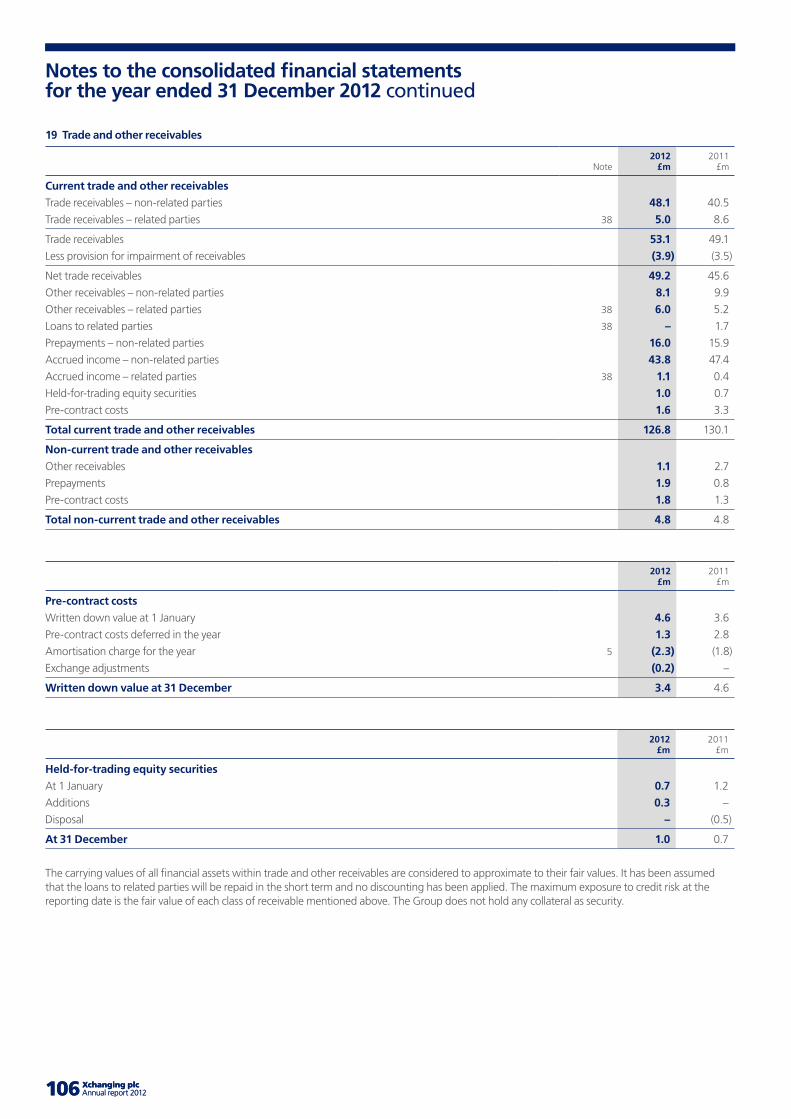
106 Xchanging plc Annual report 2012 107106 Xchanging plc Annual report 2012 107
Notes to the consolidated financial statements for the year ended 31 December 2012 continued
19 Trade and other receivables
Note2012
£m2011
£m
Current trade and other receivables
Trade receivables – non-related parties 48.1 40.5
Trade receivables – related parties 38 5.0 8.6
Trade receivables 53.1 49.1
Less provision for impairment of receivables (3.9) (3.5)
Net trade receivables 49.2 45.6
Other receivables – non-related parties 8.1 9.9
Other receivables – related parties 38 6.0 5.2
Loans to related parties 38 – 1.7
Prepayments – non-related parties 16.0 15.9
Accrued income – non-related parties 43.8 47.4
Accrued income – related parties 38 1.1 0.4
Held-for-trading equity securities 1.0 0.7
Pre-contract costs 1.6 3.3
Total current trade and other receivables 126.8 130.1
Non-current trade and other receivables
Other receivables 1.1 2.7
Prepayments 1.9 0.8
Pre-contract costs 1.8 1.3
Total non-current trade and other receivables 4.8 4.8
2012 £m
2011£m
Pre-contract costs
Written down value at 1 January 4.6 3.6
Pre-contract costs deferred in the year 1.3 2.8
Amortisation charge for the year 5 (2.3) (1.8)
Exchange adjustments (0.2) –
Written down value at 31 December 3.4 4.6
2012 £m
2011£m
Held-for-trading equity securities
At 1 January 0.7 1.2
Additions 0.3 –
Disposal – (0.5)
At 31 December 1.0 0.7
The carrying values of all financial assets within trade and other receivables are considered to approximate to their fair values. It has been assumed that the loans to related parties will be repaid in the short term and no discounting has been applied. The maximum exposure to credit risk at the reporting date is the fair value of each class of receivable mentioned above. The Group does not hold any collateral as security.
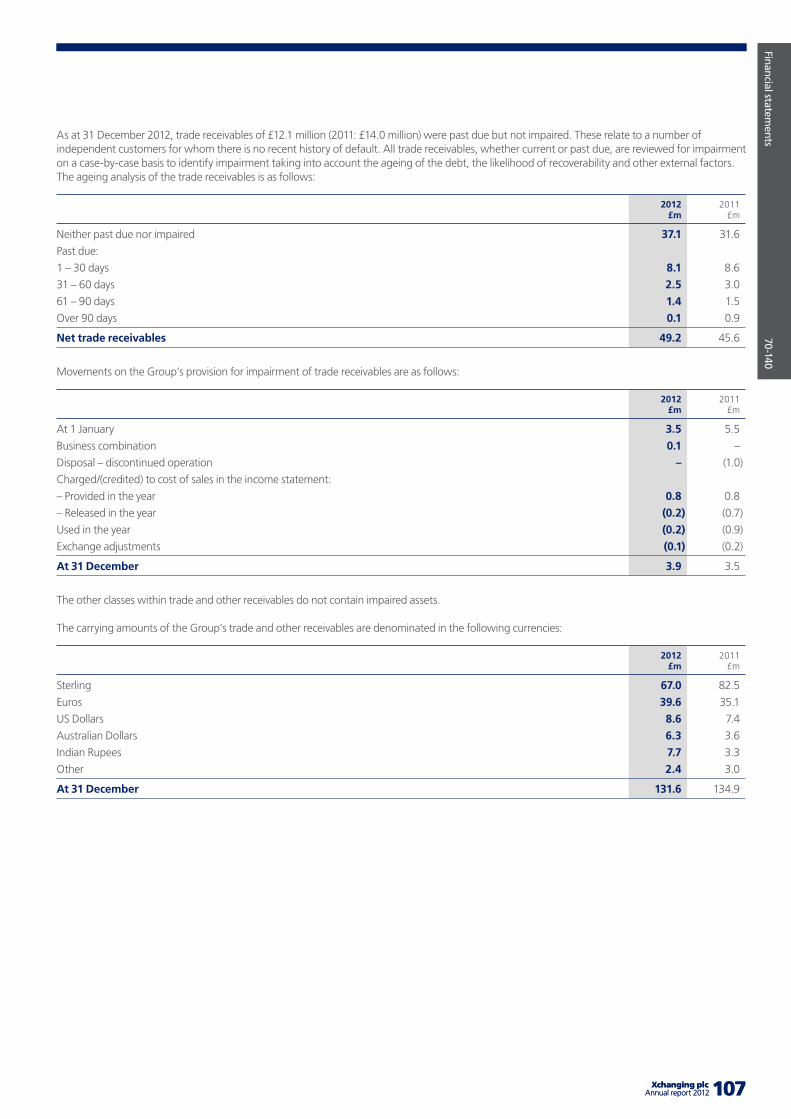
Company overview
X
X-X
X
107 Xchanging plcAnnual report 2012
Financial statements
70-140
107 Xchanging plcAnnual report 2012
As at 31 December 2012, trade receivables of £12.1 million (2011: £14.0 million) were past due but not impaired. These relate to a number of independent customers for whom there is no recent history of default. All trade receivables, whether current or past due, are reviewed for impairment on a case-by-case basis to identify impairment taking into account the ageing of the debt, the likelihood of recoverability and other external factors. The ageing analysis of the trade receivables is as follows:
2012 £m
2011£m
Neither past due nor impaired 37.1 31.6
Past due:
1 – 30 days 8.1 8.6
31 – 60 days 2.5 3.0
61 – 90 days 1.4 1.5
Over 90 days 0.1 0.9
Net trade receivables 49.2 45.6
Movements on the Group’s provision for impairment of trade receivables are as follows:
2012 £m
2011£m
At 1 January 3.5 5.5
Business combination 0.1 –
Disposal – discontinued operation – (1.0)
Charged/(credited) to cost of sales in the income statement:
– Provided in the year 0.8 0.8
– Released in the year (0.2) (0.7)
Used in the year (0.2) (0.9)
Exchange adjustments (0.1) (0.2)
At 31 December 3.9 3.5
The other classes within trade and other receivables do not contain impaired assets.
The carrying amounts of the Group’s trade and other receivables are denominated in the following currencies:
2012 £m
2011£m
Sterling 67.0 82.5
Euros 39.6 35.1
US Dollars 8.6 7.4
Australian Dollars 6.3 3.6
Indian Rupees 7.7 3.3
Other 2.4 3.0
At 31 December 131.6 134.9
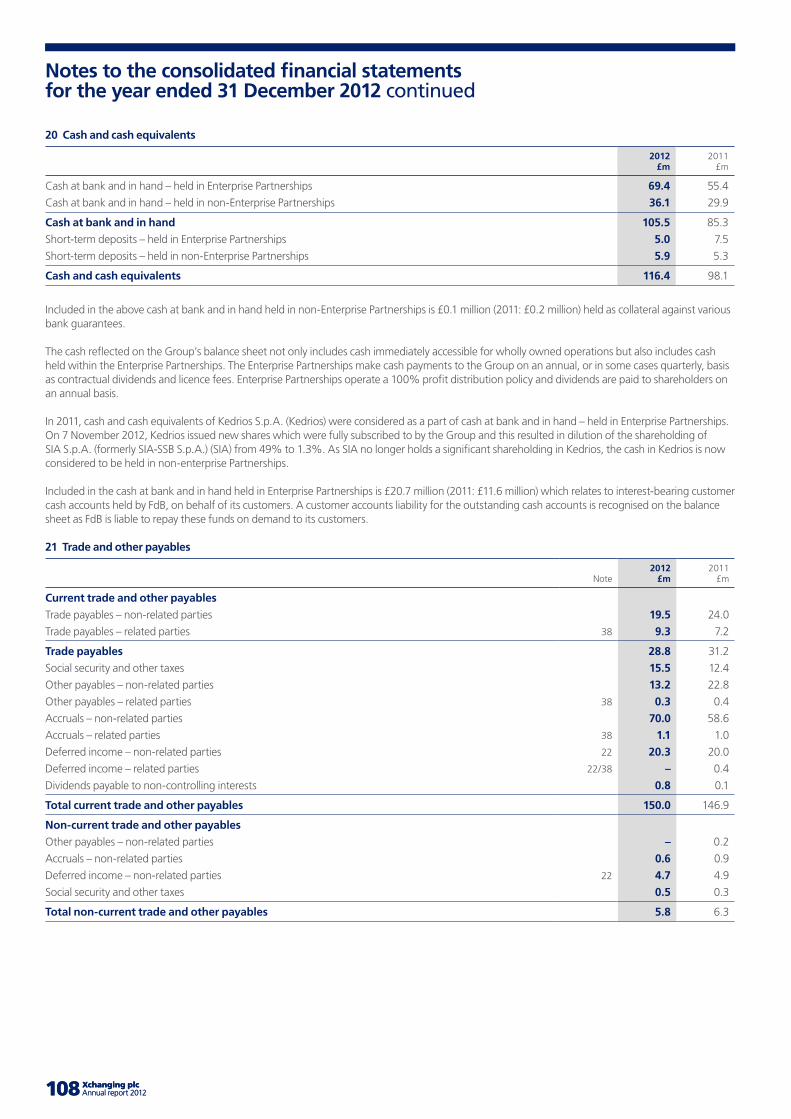
108 Xchanging plc Annual report 2012 109108 Xchanging plc Annual report 2012 109
Notes to the consolidated financial statements for the year ended 31 December 2012 continued
20 Cash and cash equivalents
2012 £m
2011£m
Cash at bank and in hand – held in Enterprise Partnerships 69.4 55.4
Cash at bank and in hand – held in non-Enterprise Partnerships 36.1 29.9
Cash at bank and in hand 105.5 85.3
Short-term deposits – held in Enterprise Partnerships 5.0 7.5
Short-term deposits – held in non-Enterprise Partnerships 5.9 5.3
Cash and cash equivalents 116.4 98.1
Included in the above cash at bank and in hand held in non-Enterprise Partnerships is £0.1 million (2011: £0.2 million) held as collateral against various bank guarantees.
The cash reflected on the Group’s balance sheet not only includes cash immediately accessible for wholly owned operations but also includes cash held within the Enterprise Partnerships. The Enterprise Partnerships make cash payments to the Group on an annual, or in some cases quarterly, basis as contractual dividends and licence fees. Enterprise Partnerships operate a 100% profit distribution policy and dividends are paid to shareholders on an annual basis.
In 2011, cash and cash equivalents of Kedrios S.p.A. (Kedrios) were considered as a part of cash at bank and in hand – held in Enterprise Partnerships. On 7 November 2012, Kedrios issued new shares which were fully subscribed to by the Group and this resulted in dilution of the shareholding of SIA S.p.A. (formerly SIA-SSB S.p.A.) (SIA) from 49% to 1.3%. As SIA no longer holds a significant shareholding in Kedrios, the cash in Kedrios is now considered to be held in non-enterprise Partnerships.
Included in the cash at bank and in hand held in Enterprise Partnerships is £20.7 million (2011: £11.6 million) which relates to interest-bearing customer cash accounts held by FdB, on behalf of its customers. A customer accounts liability for the outstanding cash accounts is recognised on the balance sheet as FdB is liable to repay these funds on demand to its customers.
21 Trade and other payables
Note2012
£m2011
£m
Current trade and other payables
Trade payables – non-related parties 19.5 24.0
Trade payables – related parties 38 9.3 7.2
Trade payables 28.8 31.2
Social security and other taxes 15.5 12.4
Other payables – non-related parties 13.2 22.8
Other payables – related parties 38 0.3 0.4
Accruals – non-related parties 70.0 58.6
Accruals – related parties 38 1.1 1.0
Deferred income – non-related parties 22 20.3 20.0
Deferred income – related parties 22/38 – 0.4
Dividends payable to non-controlling interests 0.8 0.1
Total current trade and other payables 150.0 146.9
Non-current trade and other payables
Other payables – non-related parties – 0.2
Accruals – non-related parties 0.6 0.9
Deferred income – non-related parties 22 4.7 4.9
Social security and other taxes 0.5 0.3
Total non-current trade and other payables 5.8 6.3
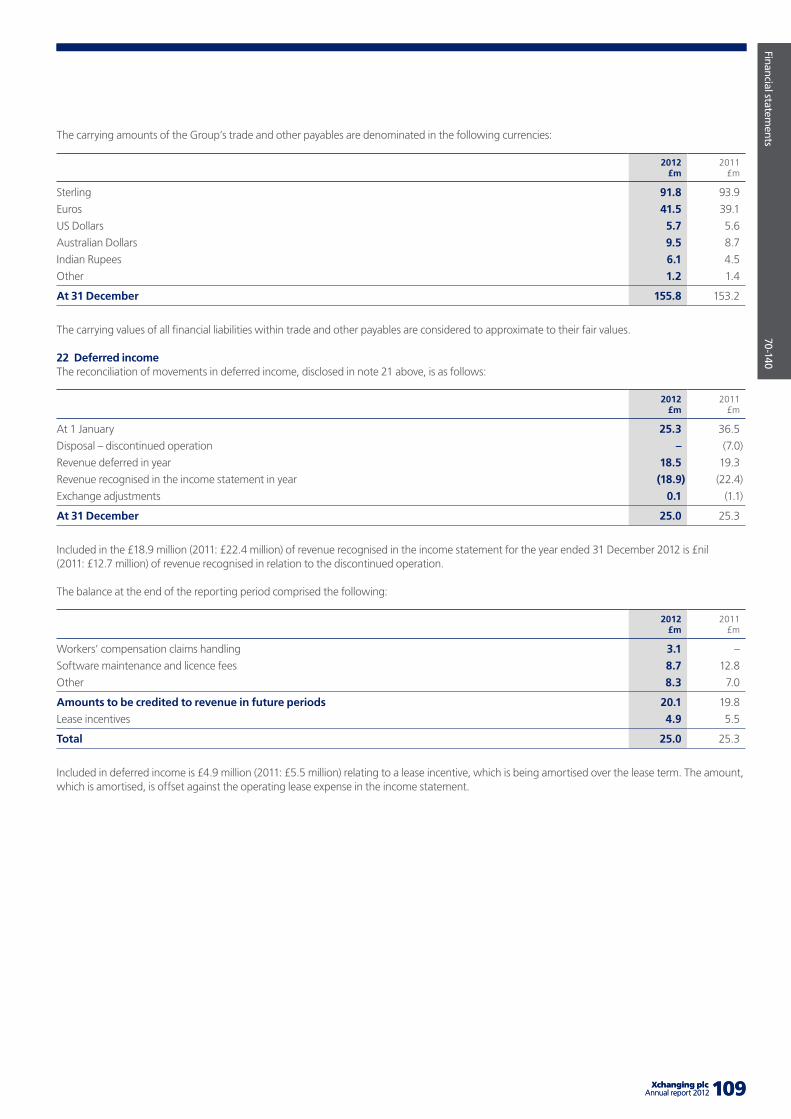
Company overview
X
X-X
X
109 Xchanging plcAnnual report 2012
Financial statements
70-140
109 Xchanging plcAnnual report 2012
The carrying amounts of the Group’s trade and other payables are denominated in the following currencies:
2012 £m
2011£m
Sterling 91.8 93.9
Euros 41.5 39.1
US Dollars 5.7 5.6
Australian Dollars 9.5 8.7
Indian Rupees 6.1 4.5
Other 1.2 1.4
At 31 December 155.8 153.2
The carrying values of all financial liabilities within trade and other payables are considered to approximate to their fair values.
22 Deferred incomeThe reconciliation of movements in deferred income, disclosed in note 21 above, is as follows:
2012 £m
2011£m
At 1 January 25.3 36.5
Disposal – discontinued operation – (7.0)
Revenue deferred in year 18.5 19.3
Revenue recognised in the income statement in year (18.9) (22.4)
Exchange adjustments 0.1 (1.1)
At 31 December 25.0 25.3
Included in the £18.9 million (2011: £22.4 million) of revenue recognised in the income statement for the year ended 31 December 2012 is £nil (2011: £12.7 million) of revenue recognised in relation to the discontinued operation.
The balance at the end of the reporting period comprised the following:
2012 £m
2011£m
Workers’ compensation claims handling 3.1 –
Software maintenance and licence fees 8.7 12.8
Other 8.3 7.0
Amounts to be credited to revenue in future periods 20.1 19.8
Lease incentives 4.9 5.5
Total 25.0 25.3
Included in deferred income is £4.9 million (2011: £5.5 million) relating to a lease incentive, which is being amortised over the lease term. The amount, which is amortised, is offset against the operating lease expense in the income statement.
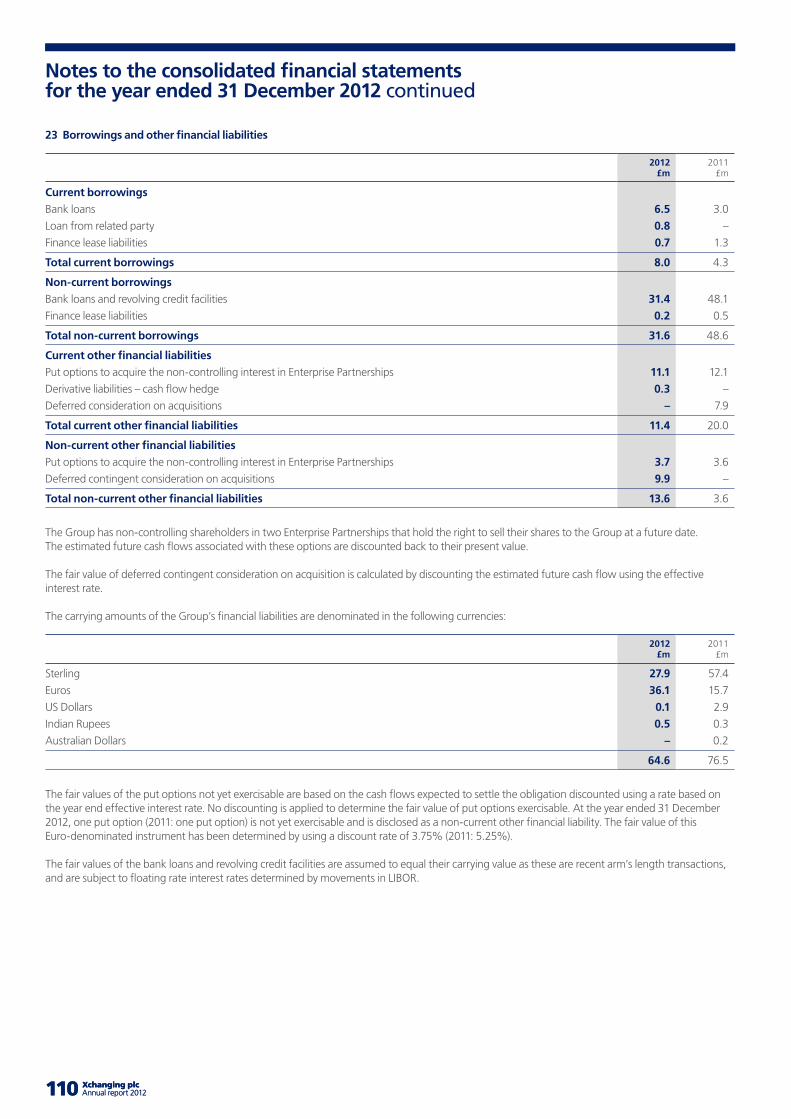
110 Xchanging plc Annual report 2012 111110 Xchanging plc Annual report 2012 111
Notes to the consolidated financial statements for the year ended 31 December 2012 continued
23 Borrowings and other financial liabilities
2012 £m
2011£m
Current borrowings
Bank loans 6.5 3.0
Loan from related party 0.8 –
Finance lease liabilities 0.7 1.3
Total current borrowings 8.0 4.3
Non-current borrowings
Bank loans and revolving credit facilities 31.4 48.1
Finance lease liabilities 0.2 0.5
Total non-current borrowings 31.6 48.6
Current other financial liabilities
Put options to acquire the non-controlling interest in Enterprise Partnerships 11.1 12.1
Derivative liabilities – cash flow hedge 0.3 –
Deferred consideration on acquisitions – 7.9
Total current other financial liabilities 11.4 20.0
Non-current other financial liabilities
Put options to acquire the non-controlling interest in Enterprise Partnerships 3.7 3.6
Deferred contingent consideration on acquisitions 9.9 –
Total non-current other financial liabilities 13.6 3.6
The Group has non-controlling shareholders in two Enterprise Partnerships that hold the right to sell their shares to the Group at a future date. The estimated future cash flows associated with these options are discounted back to their present value.
The fair value of deferred contingent consideration on acquisition is calculated by discounting the estimated future cash flow using the effective interest rate.
The carrying amounts of the Group’s financial liabilities are denominated in the following currencies:
2012 £m
2011£m
Sterling 27.9 57.4
Euros 36.1 15.7
US Dollars 0.1 2.9
Indian Rupees 0.5 0.3
Australian Dollars – 0.2
64.6 76.5
The fair values of the put options not yet exercisable are based on the cash flows expected to settle the obligation discounted using a rate based on the year end effective interest rate. No discounting is applied to determine the fair value of put options exercisable. At the year ended 31 December 2012, one put option (2011: one put option) is not yet exercisable and is disclosed as a non-current other financial liability. The fair value of this Euro-denominated instrument has been determined by using a discount rate of 3.75% (2011: 5.25%).
The fair values of the bank loans and revolving credit facilities are assumed to equal their carrying value as these are recent arm’s length transactions, and are subject to floating rate interest rates determined by movements in LIBOR.
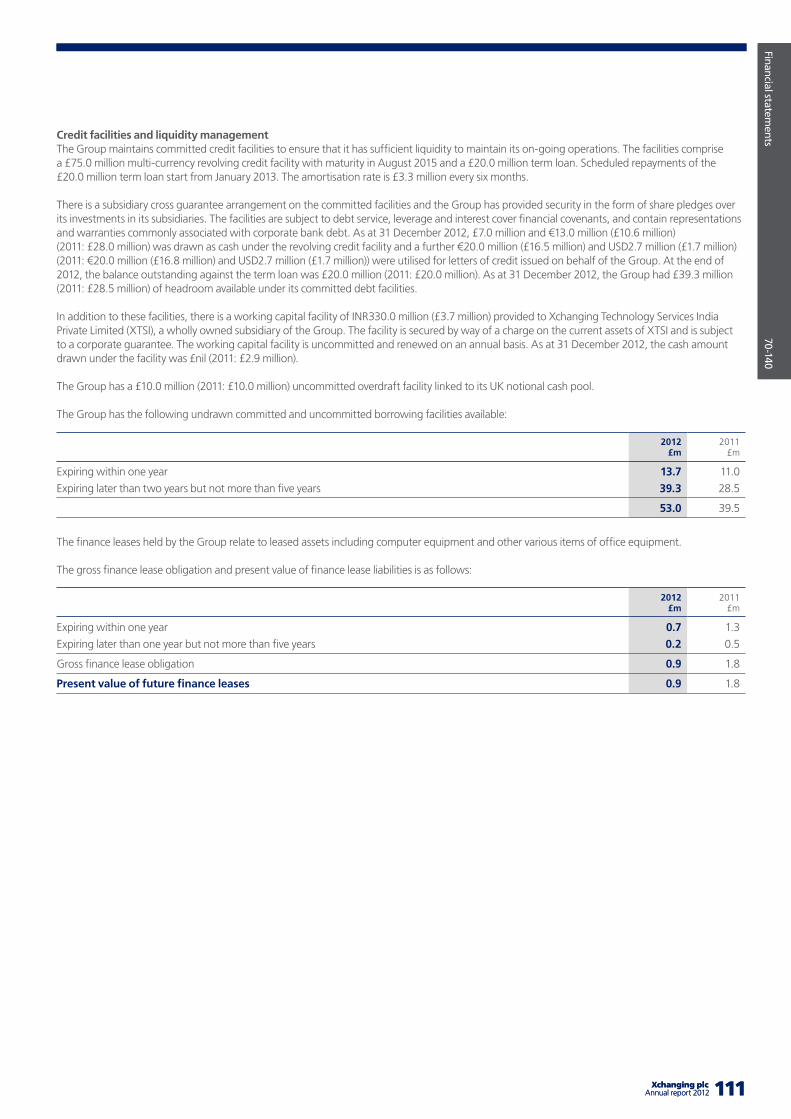
Company overview
X
X-X
X
111 Xchanging plcAnnual report 2012
Financial statements
70-140
111 Xchanging plcAnnual report 2012
Credit facilities and liquidity managementThe Group maintains committed credit facilities to ensure that it has sufficient liquidity to maintain its on-going operations. The facilities comprise a £75.0 million multi-currency revolving credit facility with maturity in August 2015 and a £20.0 million term loan. Scheduled repayments of the £20.0 million term loan start from January 2013. The amortisation rate is £3.3 million every six months.
There is a subsidiary cross guarantee arrangement on the committed facilities and the Group has provided security in the form of share pledges over its investments in its subsidiaries. The facilities are subject to debt service, leverage and interest cover financial covenants, and contain representations and warranties commonly associated with corporate bank debt. As at 31 December 2012, £7.0 million and €13.0 million (£10.6 million) (2011: £28.0 million) was drawn as cash under the revolving credit facility and a further €20.0 million (£16.5 million) and USD2.7 million (£1.7 million) (2011: €20.0 million (£16.8 million) and USD2.7 million (£1.7 million)) were utilised for letters of credit issued on behalf of the Group. At the end of 2012, the balance outstanding against the term loan was £20.0 million (2011: £20.0 million). As at 31 December 2012, the Group had £39.3 million (2011: £28.5 million) of headroom available under its committed debt facilities.
In addition to these facilities, there is a working capital facility of INR330.0 million (£3.7 million) provided to Xchanging Technology Services India Private Limited (XTSI), a wholly owned subsidiary of the Group. The facility is secured by way of a charge on the current assets of XTSI and is subject to a corporate guarantee. The working capital facility is uncommitted and renewed on an annual basis. As at 31 December 2012, the cash amount drawn under the facility was £nil (2011: £2.9 million).
The Group has a £10.0 million (2011: £10.0 million) uncommitted overdraft facility linked to its UK notional cash pool.
The Group has the following undrawn committed and uncommitted borrowing facilities available:
2012 £m
2011£m
Expiring within one year 13.7 11.0
Expiring later than two years but not more than five years 39.3 28.5
53.0 39.5
The finance leases held by the Group relate to leased assets including computer equipment and other various items of office equipment.
The gross finance lease obligation and present value of finance lease liabilities is as follows:
2012 £m
2011£m
Expiring within one year 0.7 1.3
Expiring later than one year but not more than five years 0.2 0.5
Gross finance lease obligation 0.9 1.8
Present value of future finance leases 0.9 1.8
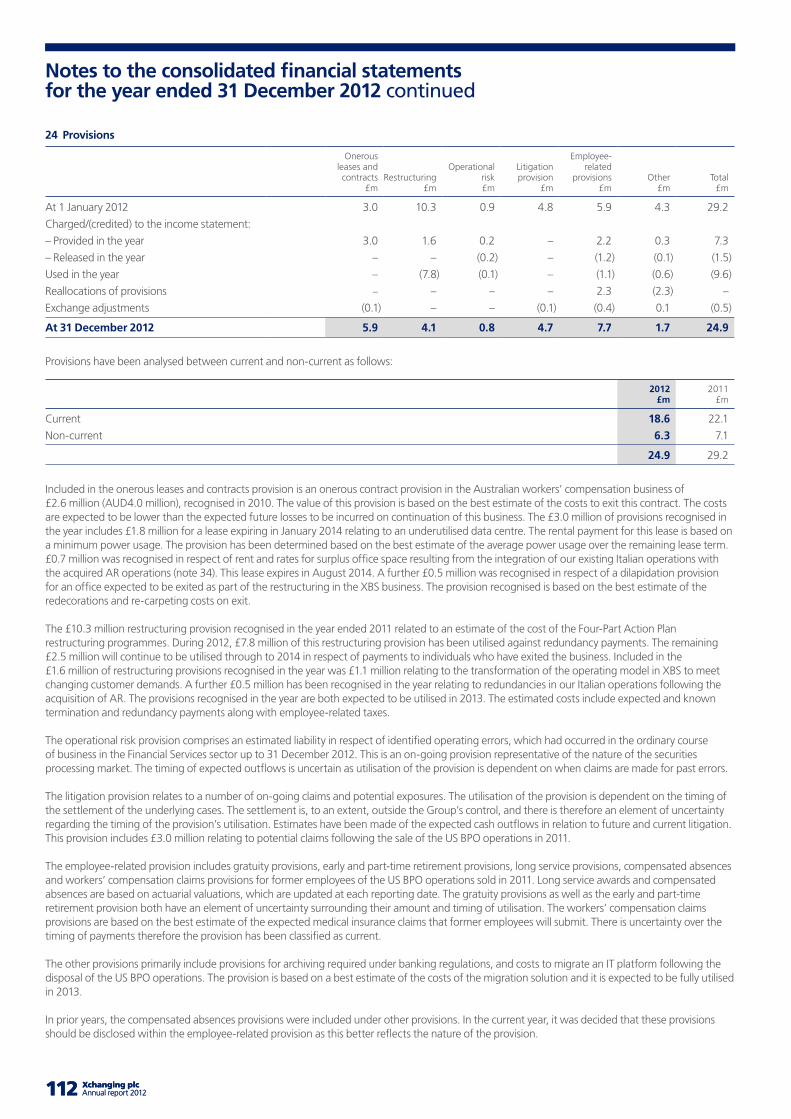
112 Xchanging plc Annual report 2012 113112 Xchanging plc Annual report 2012 113
Notes to the consolidated financial statements for the year ended 31 December 2012 continued
24 Provisions
Onerous leases and contracts
£mRestructuring
£m
Operational risk £m
Litigation provision
£m
Employee-related
provisions £m
Other £m
Total £m
At 1 January 2012 3.0 10.3 0.9 4.8 5.9 4.3 29.2
Charged/(credited) to the income statement:
– Provided in the year 3.0 1.6 0.2 – 2.2 0.3 7.3
– Released in the year – – (0.2) – (1.2) (0.1) (1.5)
Used in the year – (7.8) (0.1) – (1.1) (0.6) (9.6)
Reallocations of provisions – – – – 2.3 (2.3) –
Exchange adjustments (0.1) – – (0.1) (0.4) 0.1 (0.5)
At 31 December 2012 5.9 4.1 0.8 4.7 7.7 1.7 24.9
Provisions have been analysed between current and non-current as follows:
2012 £m
2011£m
Current 18.6 22.1
Non-current 6.3 7.1
24.9 29.2
Included in the onerous leases and contracts provision is an onerous contract provision in the Australian workers’ compensation business of £2.6 million (AUD4.0 million), recognised in 2010. The value of this provision is based on the best estimate of the costs to exit this contract. The costs are expected to be lower than the expected future losses to be incurred on continuation of this business. The £3.0 million of provisions recognised in the year includes £1.8 million for a lease expiring in January 2014 relating to an underutilised data centre. The rental payment for this lease is based on a minimum power usage. The provision has been determined based on the best estimate of the average power usage over the remaining lease term. £0.7 million was recognised in respect of rent and rates for surplus office space resulting from the integration of our existing Italian operations with the acquired AR operations (note 34). This lease expires in August 2014. A further £0.5 million was recognised in respect of a dilapidation provision for an office expected to be exited as part of the restructuring in the XBS business. The provision recognised is based on the best estimate of the redecorations and re-carpeting costs on exit.
The £10.3 million restructuring provision recognised in the year ended 2011 related to an estimate of the cost of the Four-Part Action Plan restructuring programmes. During 2012, £7.8 million of this restructuring provision has been utilised against redundancy payments. The remaining £2.5 million will continue to be utilised through to 2014 in respect of payments to individuals who have exited the business. Included in the £1.6 million of restructuring provisions recognised in the year was £1.1 million relating to the transformation of the operating model in XBS to meet changing customer demands. A further £0.5 million has been recognised in the year relating to redundancies in our Italian operations following the acquisition of AR. The provisions recognised in the year are both expected to be utilised in 2013. The estimated costs include expected and known termination and redundancy payments along with employee-related taxes.
The operational risk provision comprises an estimated liability in respect of identified operating errors, which had occurred in the ordinary course of business in the Financial Services sector up to 31 December 2012. This is an on-going provision representative of the nature of the securities processing market. The timing of expected outflows is uncertain as utilisation of the provision is dependent on when claims are made for past errors.
The litigation provision relates to a number of on-going claims and potential exposures. The utilisation of the provision is dependent on the timing of the settlement of the underlying cases. The settlement is, to an extent, outside the Group’s control, and there is therefore an element of uncertainty regarding the timing of the provision’s utilisation. Estimates have been made of the expected cash outflows in relation to future and current litigation. This provision includes £3.0 million relating to potential claims following the sale of the US BPO operations in 2011.
The employee-related provision includes gratuity provisions, early and part-time retirement provisions, long service provisions, compensated absences and workers’ compensation claims provisions for former employees of the US BPO operations sold in 2011. Long service awards and compensated absences are based on actuarial valuations, which are updated at each reporting date. The gratuity provisions as well as the early and part-time retirement provision both have an element of uncertainty surrounding their amount and timing of utilisation. The workers’ compensation claims provisions are based on the best estimate of the expected medical insurance claims that former employees will submit. There is uncertainty over the timing of payments therefore the provision has been classified as current.
The other provisions primarily include provisions for archiving required under banking regulations, and costs to migrate an IT platform following the disposal of the US BPO operations. The provision is based on a best estimate of the costs of the migration solution and it is expected to be fully utilised in 2013.
In prior years, the compensated absences provisions were included under other provisions. In the current year, it was decided that these provisions should be disclosed within the employee-related provision as this better reflects the nature of the provision.
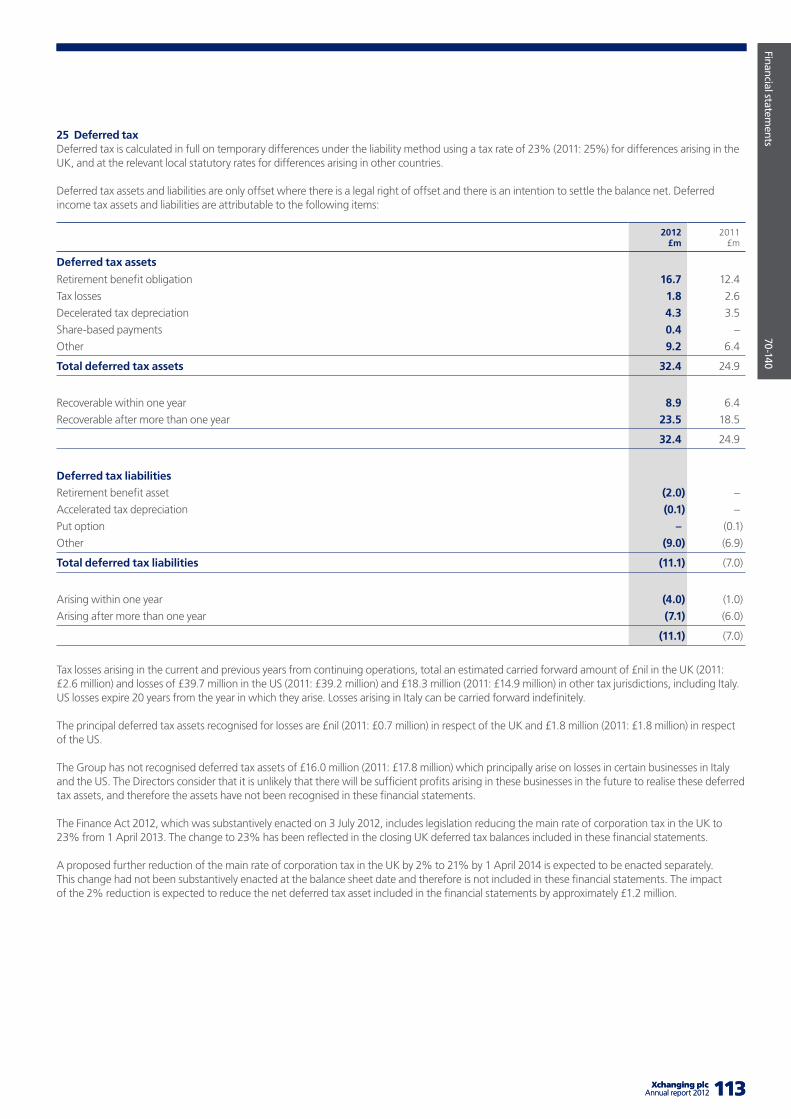
Company overview
X
X-X
X
113 Xchanging plcAnnual report 2012
Financial statements
70-140
113 Xchanging plcAnnual report 2012
25 Deferred tax Deferred tax is calculated in full on temporary differences under the liability method using a tax rate of 23% (2011: 25%) for differences arising in the UK, and at the relevant local statutory rates for differences arising in other countries.
Deferred tax assets and liabilities are only offset where there is a legal right of offset and there is an intention to settle the balance net. Deferred income tax assets and liabilities are attributable to the following items:
2012 £m
2011£m
Deferred tax assets
Retirement benefit obligation 16.7 12.4
Tax losses 1.8 2.6
Decelerated tax depreciation 4.3 3.5
Share-based payments 0.4 –
Other 9.2 6.4
Total deferred tax assets 32.4 24.9
Recoverable within one year 8.9 6.4
Recoverable after more than one year 23.5 18.5
32.4 24.9
Deferred tax liabilities
Retirement benefit asset (2.0) –
Accelerated tax depreciation (0.1) –
Put option – (0.1)
Other (9.0) (6.9)
Total deferred tax liabilities (11.1) (7.0)
Arising within one year (4.0) (1.0)
Arising after more than one year (7.1) (6.0)
(11.1) (7.0)
Tax losses arising in the current and previous years from continuing operations, total an estimated carried forward amount of £nil in the UK (2011: £2.6 million) and losses of £39.7 million in the US (2011: £39.2 million) and £18.3 million (2011: £14.9 million) in other tax jurisdictions, including Italy. US losses expire 20 years from the year in which they arise. Losses arising in Italy can be carried forward indefinitely.
The principal deferred tax assets recognised for losses are £nil (2011: £0.7 million) in respect of the UK and £1.8 million (2011: £1.8 million) in respect of the US.
The Group has not recognised deferred tax assets of £16.0 million (2011: £17.8 million) which principally arise on losses in certain businesses in Italy and the US. The Directors consider that it is unlikely that there will be sufficient profits arising in these businesses in the future to realise these deferred tax assets, and therefore the assets have not been recognised in these financial statements.
The Finance Act 2012, which was substantively enacted on 3 July 2012, includes legislation reducing the main rate of corporation tax in the UK to 23% from 1 April 2013. The change to 23% has been reflected in the closing UK deferred tax balances included in these financial statements.
A proposed further reduction of the main rate of corporation tax in the UK by 2% to 21% by 1 April 2014 is expected to be enacted separately. This change had not been substantively enacted at the balance sheet date and therefore is not included in these financial statements. The impact of the 2% reduction is expected to reduce the net deferred tax asset included in the financial statements by approximately £1.2 million.
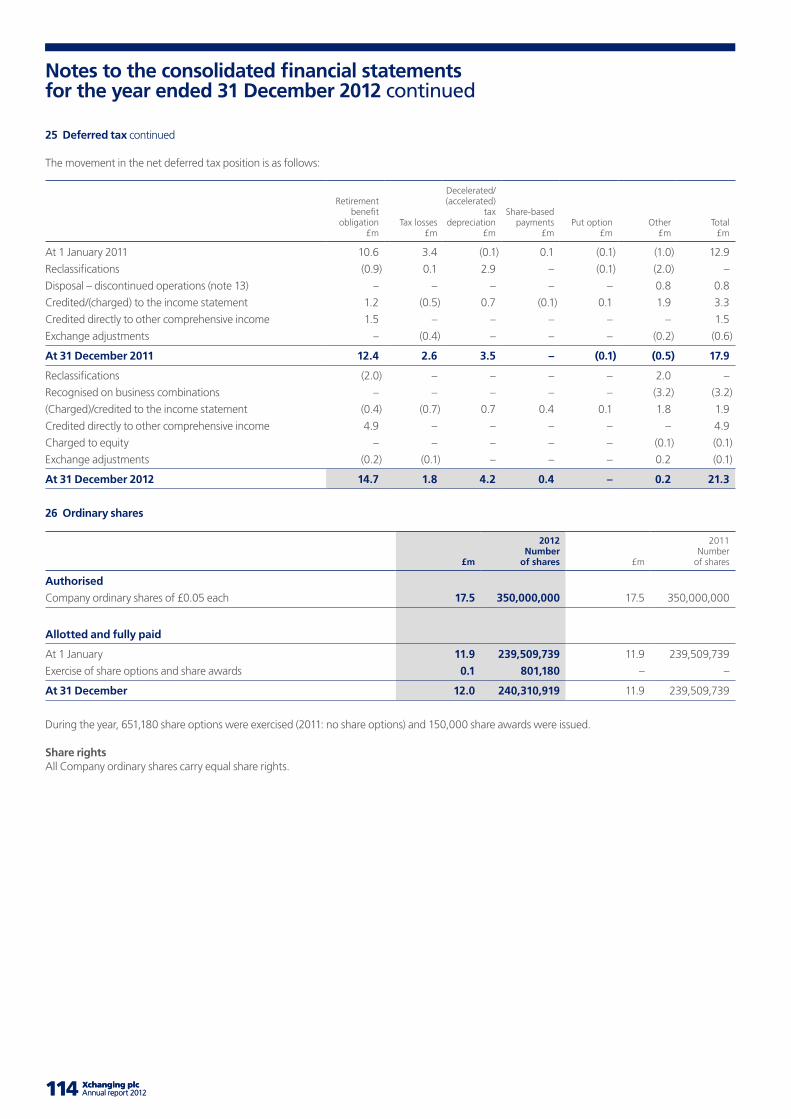
114 Xchanging plc Annual report 2012 115114 Xchanging plc Annual report 2012 115
Notes to the consolidated financial statements for the year ended 31 December 2012 continued
25 Deferred tax continued
The movement in the net deferred tax position is as follows:
Retirement benefit
obligation£m
Tax losses£m
Decelerated/ (accelerated)
tax depreciation
£m
Share-based payments
£mPut option
£mOther
£mTotal
£m
At 1 January 2011 10.6 3.4 (0.1) 0.1 (0.1) (1.0) 12.9
Reclassifications (0.9) 0.1 2.9 – (0.1) (2.0) –
Disposal – discontinued operations (note 13) – – – – – 0.8 0.8
Credited/(charged) to the income statement 1.2 (0.5) 0.7 (0.1) 0.1 1.9 3.3
Credited directly to other comprehensive income 1.5 – – – – – 1.5
Exchange adjustments – (0.4) – – – (0.2) (0.6)
At 31 December 2011 12.4 2.6 3.5 – (0.1) (0.5) 17.9
Reclassifications (2.0) – – – – 2.0 –
Recognised on business combinations – – – – – (3.2) (3.2)
(Charged)/credited to the income statement (0.4) (0.7) 0.7 0.4 0.1 1.8 1.9
Credited directly to other comprehensive income 4.9 – – – – – 4.9
Charged to equity – – – – – (0.1) (0.1)
Exchange adjustments (0.2) (0.1) – – – 0.2 (0.1)
At 31 December 2012 14.7 1.8 4.2 0.4 – 0.2 21.3
26 Ordinary shares
£m
2012Number
of shares £m
2011Number
of shares
Authorised
Company ordinary shares of £0.05 each 17.5 350,000,000 17.5 350,000,000
Allotted and fully paid
At 1 January 11.9 239,509,739 11.9 239,509,739
Exercise of share options and share awards 0.1 801,180 – –
At 31 December 12.0 240,310,919 11.9 239,509,739
During the year, 651,180 share options were exercised (2011: no share options) and 150,000 share awards were issued.
Share rightsAll Company ordinary shares carry equal share rights.
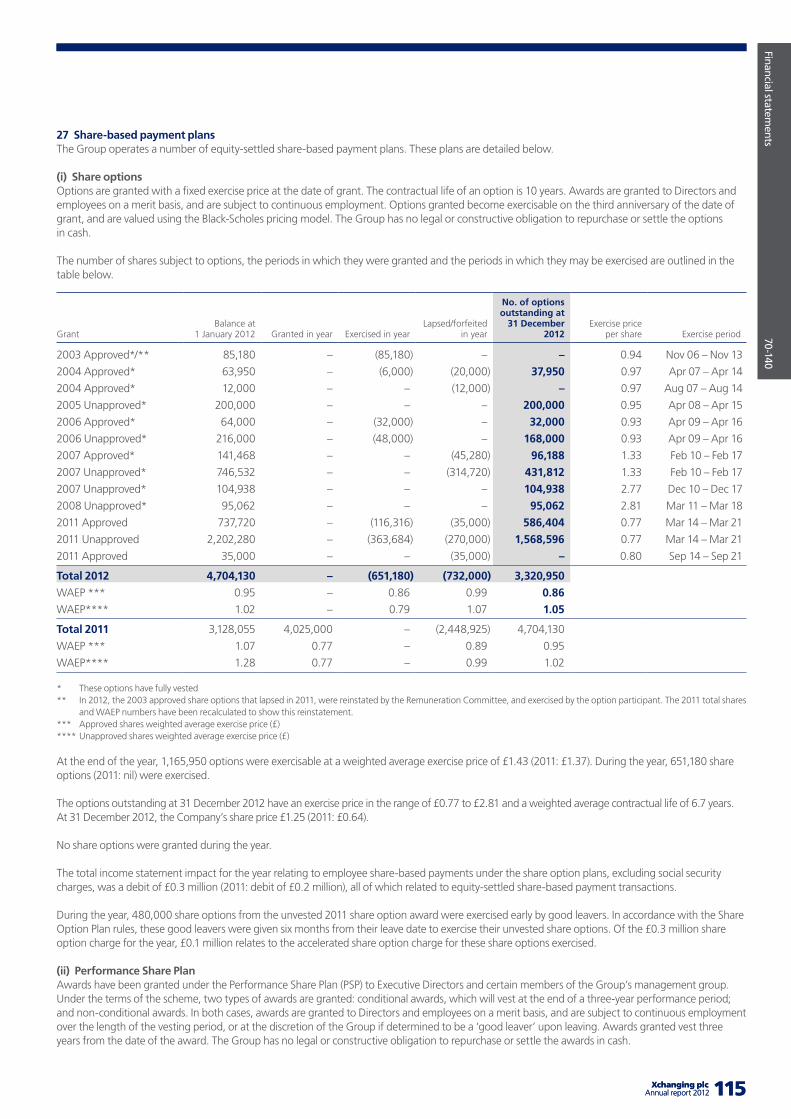
Company overview
X
X-X
X
115 Xchanging plcAnnual report 2012
Financial statements
70-140
115 Xchanging plcAnnual report 2012
27 Share-based payment plans The Group operates a number of equity-settled share-based payment plans. These plans are detailed below.
(i) Share optionsOptions are granted with a fixed exercise price at the date of grant. The contractual life of an option is 10 years. Awards are granted to Directors and employees on a merit basis, and are subject to continuous employment. Options granted become exercisable on the third anniversary of the date of grant, and are valued using the Black-Scholes pricing model. The Group has no legal or constructive obligation to repurchase or settle the options in cash.
The number of shares subject to options, the periods in which they were granted and the periods in which they may be exercised are outlined in the table below.
Grant Balance at
1 January 2012 Granted in year Exercised in yearLapsed/forfeited
in year
No. of options outstanding at
31 December 2012
Exercise price per share Exercise period
2003 Approved*/** 85,180 – (85,180) – – 0.94 Nov 06 – Nov 13
2004 Approved* 63,950 – (6,000) (20,000) 37,950 0.97 Apr 07 – Apr 14
2004 Approved* 12,000 – – (12,000) – 0.97 Aug 07 – Aug 14
2005 Unapproved* 200,000 – – – 200,000 0.95 Apr 08 – Apr 15
2006 Approved* 64,000 – (32,000) – 32,000 0.93 Apr 09 – Apr 16
2006 Unapproved* 216,000 – (48,000) – 168,000 0.93 Apr 09 – Apr 16
2007 Approved* 141,468 – – (45,280) 96,188 1.33 Feb 10 – Feb 17
2007 Unapproved* 746,532 – – (314,720) 431,812 1.33 Feb 10 – Feb 17
2007 Unapproved* 104,938 – – – 104,938 2.77 Dec 10 – Dec 17
2008 Unapproved* 95,062 – – – 95,062 2.81 Mar 11 – Mar 18
2011 Approved 737,720 – (116,316) (35,000) 586,404 0.77 Mar 14 – Mar 21
2011 Unapproved 2,202,280 – (363,684) (270,000) 1,568,596 0.77 Mar 14 – Mar 21
2011 Approved 35,000 – – (35,000) – 0.80 Sep 14 – Sep 21
Total 2012 4,704,130 – (651,180) (732,000) 3,320,950
WAEP *** 0.95 – 0.86 0.99 0.86
WAEP**** 1.02 – 0.79 1.07 1.05
Total 2011 3,128,055 4,025,000 – (2,448,925) 4,704,130
WAEP *** 1.07 0.77 – 0.89 0.95
WAEP**** 1.28 0.77 – 0.99 1.02
* These options have fully vested** In 2012, the 2003 approved share options that lapsed in 2011, were reinstated by the Remuneration Committee, and exercised by the option participant. The 2011 total shares
and WAEP numbers have been recalculated to show this reinstatement.*** Approved shares weighted average exercise price (£)**** Unapproved shares weighted average exercise price (£)
At the end of the year, 1,165,950 options were exercisable at a weighted average exercise price of £1.43 (2011: £1.37). During the year, 651,180 share options (2011: nil) were exercised.
The options outstanding at 31 December 2012 have an exercise price in the range of £0.77 to £2.81 and a weighted average contractual life of 6.7 years. At 31 December 2012, the Company’s share price £1.25 (2011: £0.64).
No share options were granted during the year.
The total income statement impact for the year relating to employee share-based payments under the share option plans, excluding social security charges, was a debit of £0.3 million (2011: debit of £0.2 million), all of which related to equity-settled share-based payment transactions.
During the year, 480,000 share options from the unvested 2011 share option award were exercised early by good leavers. In accordance with the Share Option Plan rules, these good leavers were given six months from their leave date to exercise their unvested share options. Of the £0.3 million share option charge for the year, £0.1 million relates to the accelerated share option charge for these share options exercised.
(ii) Performance Share Plan Awards have been granted under the Performance Share Plan (PSP) to Executive Directors and certain members of the Group’s management group. Under the terms of the scheme, two types of awards are granted: conditional awards, which will vest at the end of a three-year performance period; and non-conditional awards. In both cases, awards are granted to Directors and employees on a merit basis, and are subject to continuous employment over the length of the vesting period, or at the discretion of the Group if determined to be a ‘good leaver’ upon leaving. Awards granted vest three years from the date of the award. The Group has no legal or constructive obligation to repurchase or settle the awards in cash.
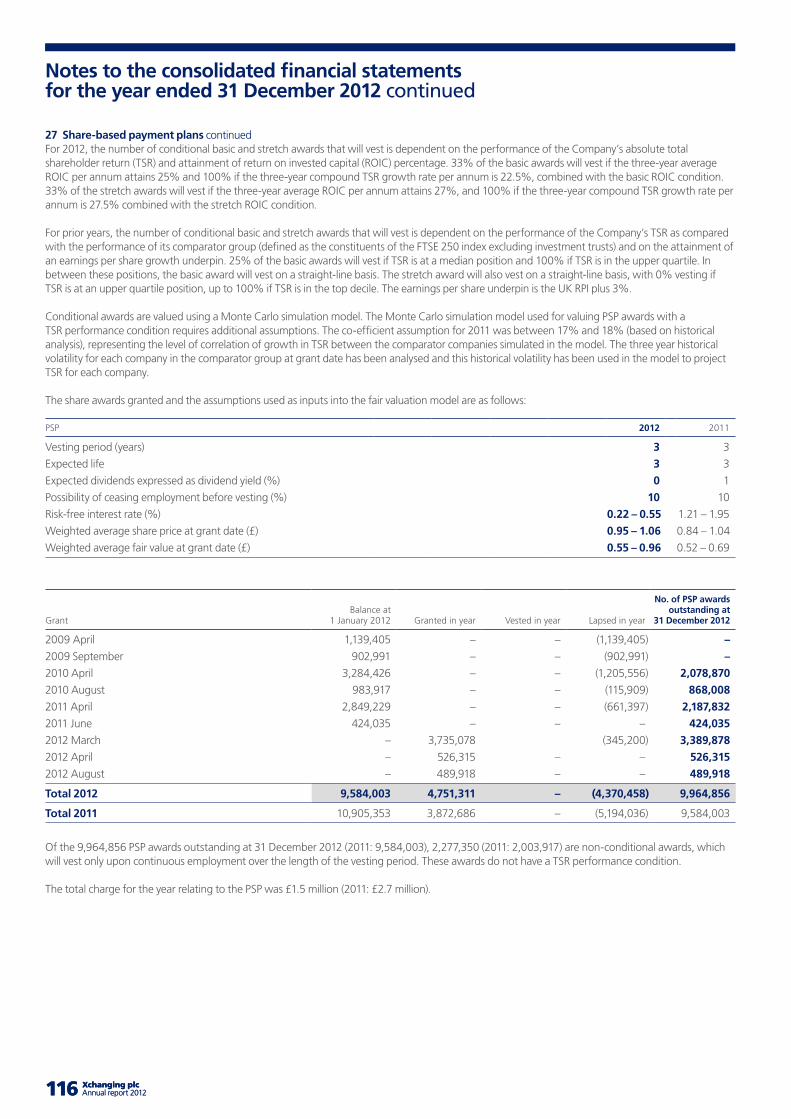
116 Xchanging plc Annual report 2012 117116 Xchanging plc Annual report 2012 117
Notes to the consolidated financial statements for the year ended 31 December 2012 continued
27 Share-based payment plans continued For 2012, the number of conditional basic and stretch awards that will vest is dependent on the performance of the Company’s absolute total shareholder return (TSR) and attainment of return on invested capital (ROIC) percentage. 33% of the basic awards will vest if the three-year average ROIC per annum attains 25% and 100% if the three-year compound TSR growth rate per annum is 22.5%, combined with the basic ROIC condition. 33% of the stretch awards will vest if the three-year average ROIC per annum attains 27%, and 100% if the three-year compound TSR growth rate per annum is 27.5% combined with the stretch ROIC condition.
For prior years, the number of conditional basic and stretch awards that will vest is dependent on the performance of the Company’s TSR as compared with the performance of its comparator group (defined as the constituents of the FTSE 250 index excluding investment trusts) and on the attainment of an earnings per share growth underpin. 25% of the basic awards will vest if TSR is at a median position and 100% if TSR is in the upper quartile. In between these positions, the basic award will vest on a straight-line basis. The stretch award will also vest on a straight-line basis, with 0% vesting if TSR is at an upper quartile position, up to 100% if TSR is in the top decile. The earnings per share underpin is the UK RPI plus 3%.
Conditional awards are valued using a Monte Carlo simulation model. The Monte Carlo simulation model used for valuing PSP awards with a TSR performance condition requires additional assumptions. The co-efficient assumption for 2011 was between 17% and 18% (based on historical analysis), representing the level of correlation of growth in TSR between the comparator companies simulated in the model. The three year historical volatility for each company in the comparator group at grant date has been analysed and this historical volatility has been used in the model to project TSR for each company.
The share awards granted and the assumptions used as inputs into the fair valuation model are as follows:
PSP 2012 2011
Vesting period (years) 3 3
Expected life 3 3
Expected dividends expressed as dividend yield (%) 0 1
Possibility of ceasing employment before vesting (%) 10 10
Risk-free interest rate (%) 0.22 – 0.55 1.21 – 1.95
Weighted average share price at grant date (£) 0.95 – 1.06 0.84 – 1.04
Weighted average fair value at grant date (£) 0.55 – 0.96 0.52 – 0.69
GrantBalance at
1 January 2012 Granted in year Vested in year Lapsed in year
No. of PSP awards outstanding at
31 December 2012
2009 April 1,139,405 – – (1,139,405) –
2009 September 902,991 – – (902,991) –
2010 April 3,284,426 – – (1,205,556) 2,078,870
2010 August 983,917 – – (115,909) 868,008
2011 April 2,849,229 – – (661,397) 2,187,832
2011 June 424,035 – – – 424,035
2012 March – 3,735,078 (345,200) 3,389,878
2012 April – 526,315 – – 526,315
2012 August – 489,918 – – 489,918
Total 2012 9,584,003 4,751,311 – (4,370,458) 9,964,856
Total 2011 10,905,353 3,872,686 – (5,194,036) 9,584,003
Of the 9,964,856 PSP awards outstanding at 31 December 2012 (2011: 9,584,003), 2,277,350 (2011: 2,003,917) are non-conditional awards, which will vest only upon continuous employment over the length of the vesting period. These awards do not have a TSR performance condition.
The total charge for the year relating to the PSP was £1.5 million (2011: £2.7 million).
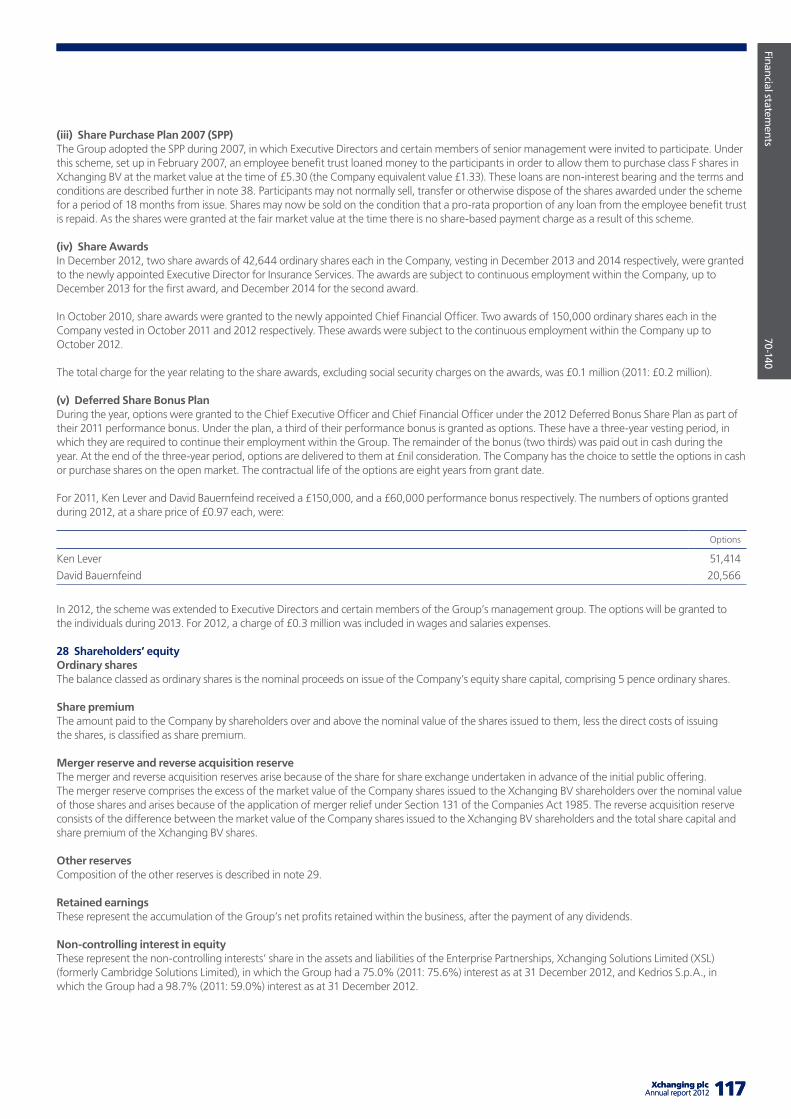
Company overview
X
X-X
X
117 Xchanging plcAnnual report 2012
Financial statements
70-140
117 Xchanging plcAnnual report 2012
(iii) Share Purchase Plan 2007 (SPP)The Group adopted the SPP during 2007, in which Executive Directors and certain members of senior management were invited to participate. Under this scheme, set up in February 2007, an employee benefit trust loaned money to the participants in order to allow them to purchase class F shares in Xchanging BV at the market value at the time of £5.30 (the Company equivalent value £1.33). These loans are non-interest bearing and the terms and conditions are described further in note 38. Participants may not normally sell, transfer or otherwise dispose of the shares awarded under the scheme for a period of 18 months from issue. Shares may now be sold on the condition that a pro-rata proportion of any loan from the employee benefit trust is repaid. As the shares were granted at the fair market value at the time there is no share-based payment charge as a result of this scheme.
(iv) Share AwardsIn December 2012, two share awards of 42,644 ordinary shares each in the Company, vesting in December 2013 and 2014 respectively, were granted to the newly appointed Executive Director for Insurance Services. The awards are subject to continuous employment within the Company, up to December 2013 for the first award, and December 2014 for the second award.
In October 2010, share awards were granted to the newly appointed Chief Financial Officer. Two awards of 150,000 ordinary shares each in the Company vested in October 2011 and 2012 respectively. These awards were subject to the continuous employment within the Company up to October 2012.
The total charge for the year relating to the share awards, excluding social security charges on the awards, was £0.1 million (2011: £0.2 million).
(v) Deferred Share Bonus PlanDuring the year, options were granted to the Chief Executive Officer and Chief Financial Officer under the 2012 Deferred Bonus Share Plan as part of their 2011 performance bonus. Under the plan, a third of their performance bonus is granted as options. These have a three-year vesting period, in which they are required to continue their employment within the Group. The remainder of the bonus (two thirds) was paid out in cash during the year. At the end of the three-year period, options are delivered to them at £nil consideration. The Company has the choice to settle the options in cash or purchase shares on the open market. The contractual life of the options are eight years from grant date.
For 2011, Ken Lever and David Bauernfeind received a £150,000, and a £60,000 performance bonus respectively. The numbers of options granted during 2012, at a share price of £0.97 each, were:
Options
Ken Lever 51,414
David Bauernfeind 20,566
In 2012, the scheme was extended to Executive Directors and certain members of the Group’s management group. The options will be granted to the individuals during 2013. For 2012, a charge of £0.3 million was included in wages and salaries expenses.
28 Shareholders’ equityOrdinary sharesThe balance classed as ordinary shares is the nominal proceeds on issue of the Company’s equity share capital, comprising 5 pence ordinary shares.
Share premiumThe amount paid to the Company by shareholders over and above the nominal value of the shares issued to them, less the direct costs of issuing the shares, is classified as share premium.
Merger reserve and reverse acquisition reserveThe merger and reverse acquisition reserves arise because of the share for share exchange undertaken in advance of the initial public offering. The merger reserve comprises the excess of the market value of the Company shares issued to the Xchanging BV shareholders over the nominal value of those shares and arises because of the application of merger relief under Section 131 of the Companies Act 1985. The reverse acquisition reserve consists of the difference between the market value of the Company shares issued to the Xchanging BV shareholders and the total share capital and share premium of the Xchanging BV shares.
Other reservesComposition of the other reserves is described in note 29.
Retained earningsThese represent the accumulation of the Group’s net profits retained within the business, after the payment of any dividends.
Non-controlling interest in equityThese represent the non-controlling interests’ share in the assets and liabilities of the Enterprise Partnerships, Xchanging Solutions Limited (XSL) (formerly Cambridge Solutions Limited), in which the Group had a 75.0% (2011: 75.6%) interest as at 31 December 2012, and Kedrios S.p.A., in which the Group had a 98.7% (2011: 59.0%) interest as at 31 December 2012.
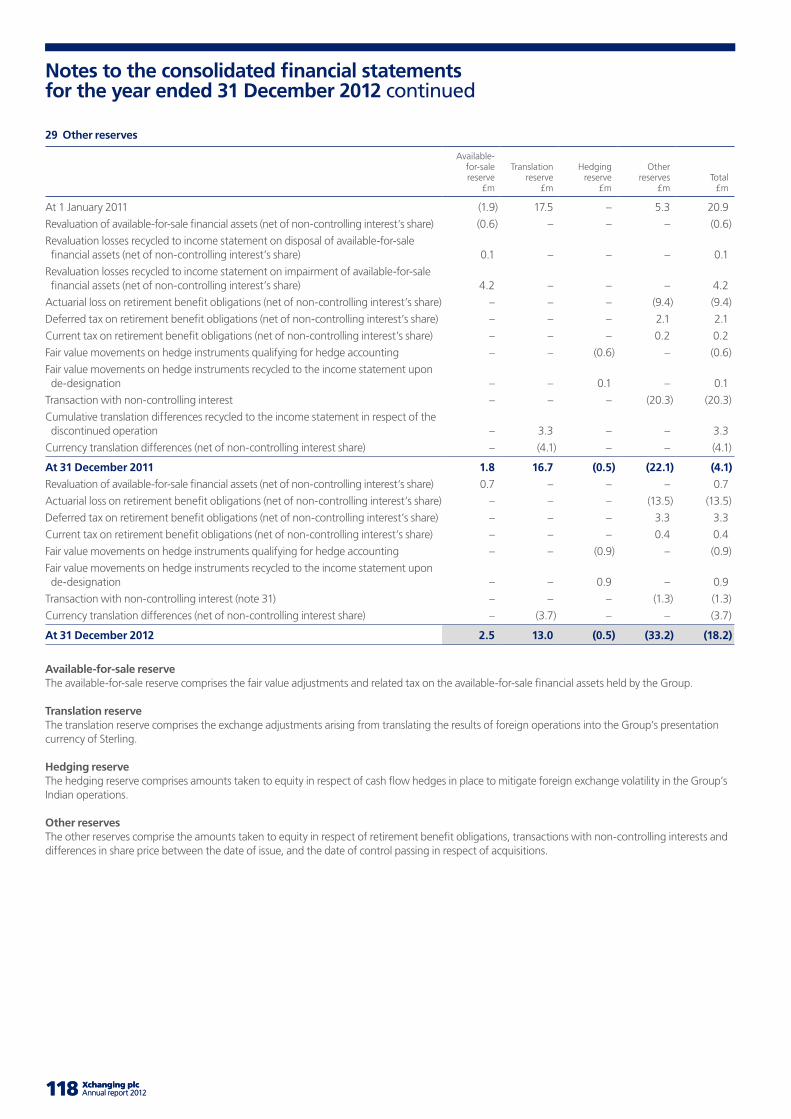
118 Xchanging plc Annual report 2012 119118 Xchanging plc Annual report 2012 119
Notes to the consolidated financial statements for the year ended 31 December 2012 continued
29 Other reserves
Available- for-sale reserve
£m
Translation reserve
£m
Hedging reserve
£m
Other reserves
£mTotal
£m
At 1 January 2011 (1.9) 17.5 – 5.3 20.9
Revaluation of available-for-sale financial assets (net of non-controlling interest‘s share) (0.6) – – – (0.6)
Revaluation losses recycled to income statement on disposal of available-for-sale financial assets (net of non-controlling interest’s share) 0.1 – – – 0.1
Revaluation losses recycled to income statement on impairment of available-for-sale financial assets (net of non-controlling interest’s share) 4.2 – – – 4.2
Actuarial loss on retirement benefit obligations (net of non-controlling interest’s share) – – – (9.4) (9.4)
Deferred tax on retirement benefit obligations (net of non-controlling interest’s share) – – – 2.1 2.1
Current tax on retirement benefit obligations (net of non-controlling interest’s share) – – – 0.2 0.2
Fair value movements on hedge instruments qualifying for hedge accounting – – (0.6) – (0.6)
Fair value movements on hedge instruments recycled to the income statement upon de-designation – – 0.1 – 0.1
Transaction with non-controlling interest – – – (20.3) (20.3)
Cumulative translation differences recycled to the income statement in respect of the discontinued operation – 3.3 – – 3.3
Currency translation differences (net of non-controlling interest share) – (4.1) – – (4.1)
At 31 December 2011 1.8 16.7 (0.5) (22.1) (4.1)
Revaluation of available-for-sale financial assets (net of non-controlling interest‘s share) 0.7 – – – 0.7
Actuarial loss on retirement benefit obligations (net of non-controlling interest’s share) – – – (13.5) (13.5)
Deferred tax on retirement benefit obligations (net of non-controlling interest’s share) – – – 3.3 3.3
Current tax on retirement benefit obligations (net of non-controlling interest’s share) – – – 0.4 0.4
Fair value movements on hedge instruments qualifying for hedge accounting – – (0.9) – (0.9)
Fair value movements on hedge instruments recycled to the income statement upon de-designation – – 0.9 – 0.9
Transaction with non-controlling interest (note 31) – – – (1.3) (1.3)
Currency translation differences (net of non-controlling interest share) – (3.7) – – (3.7)
At 31 December 2012 2.5 13.0 (0.5) (33.2) (18.2)
Available-for-sale reserveThe available-for-sale reserve comprises the fair value adjustments and related tax on the available-for-sale financial assets held by the Group.
Translation reserveThe translation reserve comprises the exchange adjustments arising from translating the results of foreign operations into the Group’s presentation currency of Sterling.
Hedging reserveThe hedging reserve comprises amounts taken to equity in respect of cash flow hedges in place to mitigate foreign exchange volatility in the Group’s Indian operations.
Other reservesThe other reserves comprise the amounts taken to equity in respect of retirement benefit obligations, transactions with non-controlling interests and differences in share price between the date of issue, and the date of control passing in respect of acquisitions.
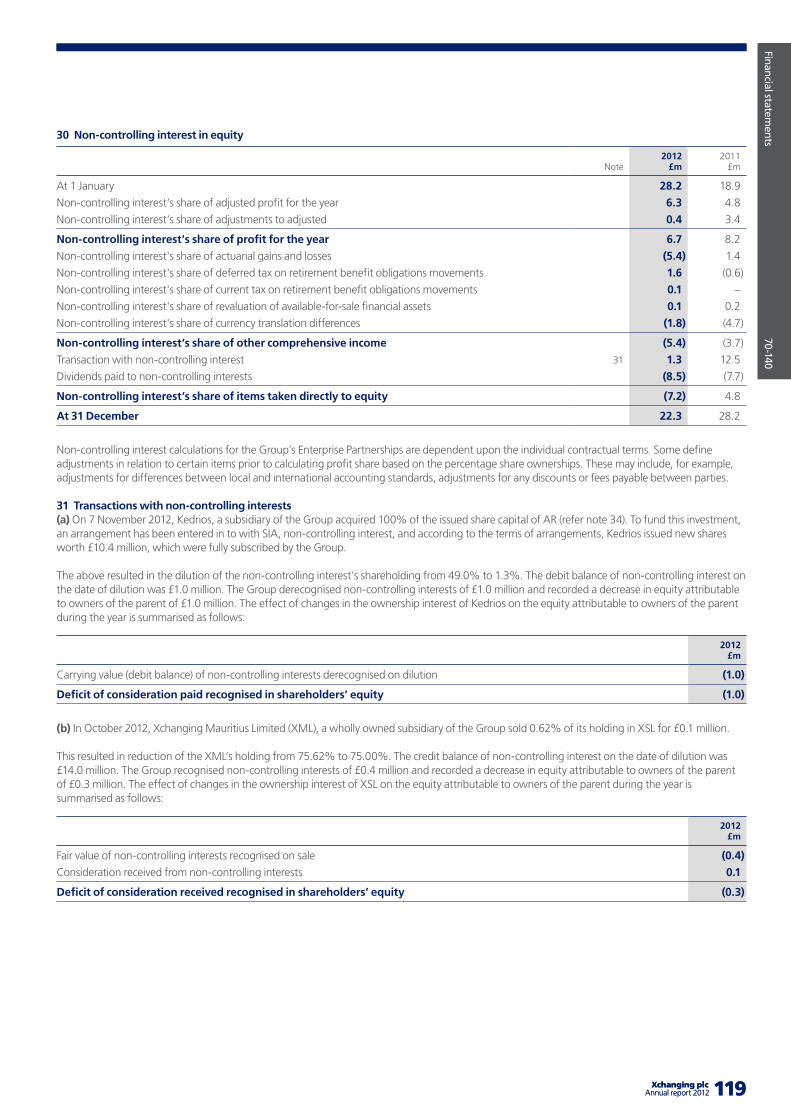
Company overview
X
X-X
X
119 Xchanging plcAnnual report 2012
Financial statements
70-140
119 Xchanging plcAnnual report 2012
30 Non-controlling interest in equity
Note2012
£m2011
£m
At 1 January 28.2 18.9
Non-controlling interest’s share of adjusted profit for the year 6.3 4.8
Non-controlling interest’s share of adjustments to adjusted 0.4 3.4
Non-controlling interest's share of profit for the year 6.7 8.2
Non-controlling interest's share of actuarial gains and losses (5.4) 1.4
Non-controlling interest's share of deferred tax on retirement benefit obligations movements 1.6 (0.6)
Non-controlling interest's share of current tax on retirement benefit obligations movements 0.1 –
Non-controlling interest's share of revaluation of available-for-sale financial assets 0.1 0.2
Non-controlling interest's share of currency translation differences (1.8) (4.7)
Non-controlling interest’s share of other comprehensive income (5.4) (3.7)
Transaction with non-controlling interest 31 1.3 12.5
Dividends paid to non-controlling interests (8.5) (7.7)
Non-controlling interest’s share of items taken directly to equity (7.2) 4.8
At 31 December 22.3 28.2
Non-controlling interest calculations for the Group’s Enterprise Partnerships are dependent upon the individual contractual terms. Some define adjustments in relation to certain items prior to calculating profit share based on the percentage share ownerships. These may include, for example, adjustments for differences between local and international accounting standards, adjustments for any discounts or fees payable between parties.
31 Transactions with non-controlling interests(a) On 7 November 2012, Kedrios, a subsidiary of the Group acquired 100% of the issued share capital of AR (refer note 34). To fund this investment, an arrangement has been entered in to with SIA, non-controlling interest, and according to the terms of arrangements, Kedrios issued new shares worth £10.4 million, which were fully subscribed by the Group.
The above resulted in the dilution of the non-controlling interest’s shareholding from 49.0% to 1.3%. The debit balance of non-controlling interest on the date of dilution was £1.0 million. The Group derecognised non-controlling interests of £1.0 million and recorded a decrease in equity attributable to owners of the parent of £1.0 million. The effect of changes in the ownership interest of Kedrios on the equity attributable to owners of the parent during the year is summarised as follows:
2012 £m
Carrying value (debit balance) of non-controlling interests derecognised on dilution (1.0)
Deficit of consideration paid recognised in shareholders’ equity (1.0)
(b) In October 2012, Xchanging Mauritius Limited (XML), a wholly owned subsidiary of the Group sold 0.62% of its holding in XSL for £0.1 million.
This resulted in reduction of the XML’s holding from 75.62% to 75.00%. The credit balance of non-controlling interest on the date of dilution was £14.0 million. The Group recognised non-controlling interests of £0.4 million and recorded a decrease in equity attributable to owners of the parent of £0.3 million. The effect of changes in the ownership interest of XSL on the equity attributable to owners of the parent during the year is summarised as follows:
2012 £m
Fair value of non-controlling interests recognised on sale (0.4)
Consideration received from non-controlling interests 0.1
Deficit of consideration received recognised in shareholders’ equity (0.3)
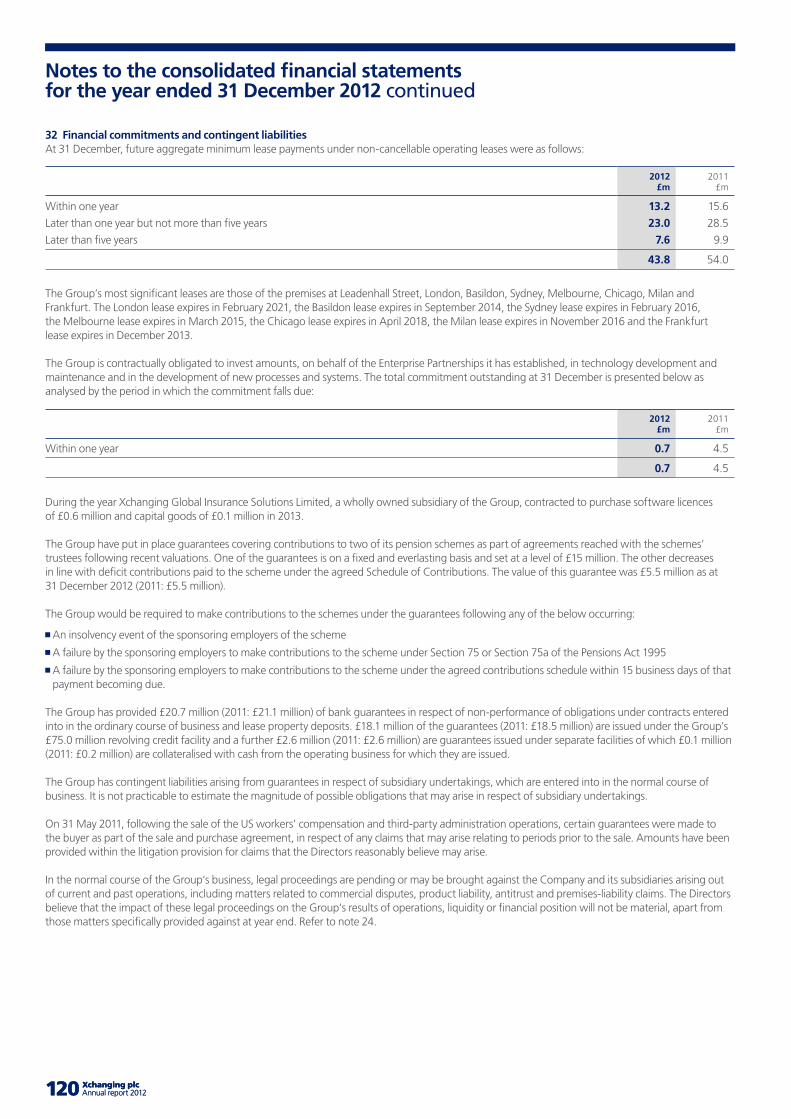
120 Xchanging plc Annual report 2012 121120 Xchanging plc Annual report 2012 121
Notes to the consolidated financial statements for the year ended 31 December 2012 continued
32 Financial commitments and contingent liabilitiesAt 31 December, future aggregate minimum lease payments under non-cancellable operating leases were as follows:
2012 £m
2011£m
Within one year 13.2 15.6
Later than one year but not more than five years 23.0 28.5
Later than five years 7.6 9.9
43.8 54.0
The Group’s most significant leases are those of the premises at Leadenhall Street, London, Basildon, Sydney, Melbourne, Chicago, Milan and Frankfurt. The London lease expires in February 2021, the Basildon lease expires in September 2014, the Sydney lease expires in February 2016, the Melbourne lease expires in March 2015, the Chicago lease expires in April 2018, the Milan lease expires in November 2016 and the Frankfurt lease expires in December 2013.
The Group is contractually obligated to invest amounts, on behalf of the Enterprise Partnerships it has established, in technology development and maintenance and in the development of new processes and systems. The total commitment outstanding at 31 December is presented below as analysed by the period in which the commitment falls due:
2012 £m
2011£m
Within one year 0.7 4.5
0.7 4.5
During the year Xchanging Global Insurance Solutions Limited, a wholly owned subsidiary of the Group, contracted to purchase software licences of £0.6 million and capital goods of £0.1 million in 2013.
The Group have put in place guarantees covering contributions to two of its pension schemes as part of agreements reached with the schemes’ trustees following recent valuations. One of the guarantees is on a fixed and everlasting basis and set at a level of £15 million. The other decreases in line with deficit contributions paid to the scheme under the agreed Schedule of Contributions. The value of this guarantee was £5.5 million as at 31 December 2012 (2011: £5.5 million).
The Group would be required to make contributions to the schemes under the guarantees following any of the below occurring:
An insolvency event of the sponsoring employers of the scheme
A failure by the sponsoring employers to make contributions to the scheme under Section 75 or Section 75a of the Pensions Act 1995
A failure by the sponsoring employers to make contributions to the scheme under the agreed contributions schedule within 15 business days of that payment becoming due.
The Group has provided £20.7 million (2011: £21.1 million) of bank guarantees in respect of non-performance of obligations under contracts entered into in the ordinary course of business and lease property deposits. £18.1 million of the guarantees (2011: £18.5 million) are issued under the Group’s £75.0 million revolving credit facility and a further £2.6 million (2011: £2.6 million) are guarantees issued under separate facilities of which £0.1 million (2011: £0.2 million) are collateralised with cash from the operating business for which they are issued.
The Group has contingent liabilities arising from guarantees in respect of subsidiary undertakings, which are entered into in the normal course of business. It is not practicable to estimate the magnitude of possible obligations that may arise in respect of subsidiary undertakings.
On 31 May 2011, following the sale of the US workers’ compensation and third-party administration operations, certain guarantees were made to the buyer as part of the sale and purchase agreement, in respect of any claims that may arise relating to periods prior to the sale. Amounts have been provided within the litigation provision for claims that the Directors reasonably believe may arise.
In the normal course of the Group‘s business, legal proceedings are pending or may be brought against the Company and its subsidiaries arising out of current and past operations, including matters related to commercial disputes, product liability, antitrust and premises-liability claims. The Directors believe that the impact of these legal proceedings on the Group‘s results of operations, liquidity or financial position will not be material, apart from those matters specifically provided against at year end. Refer to note 24.
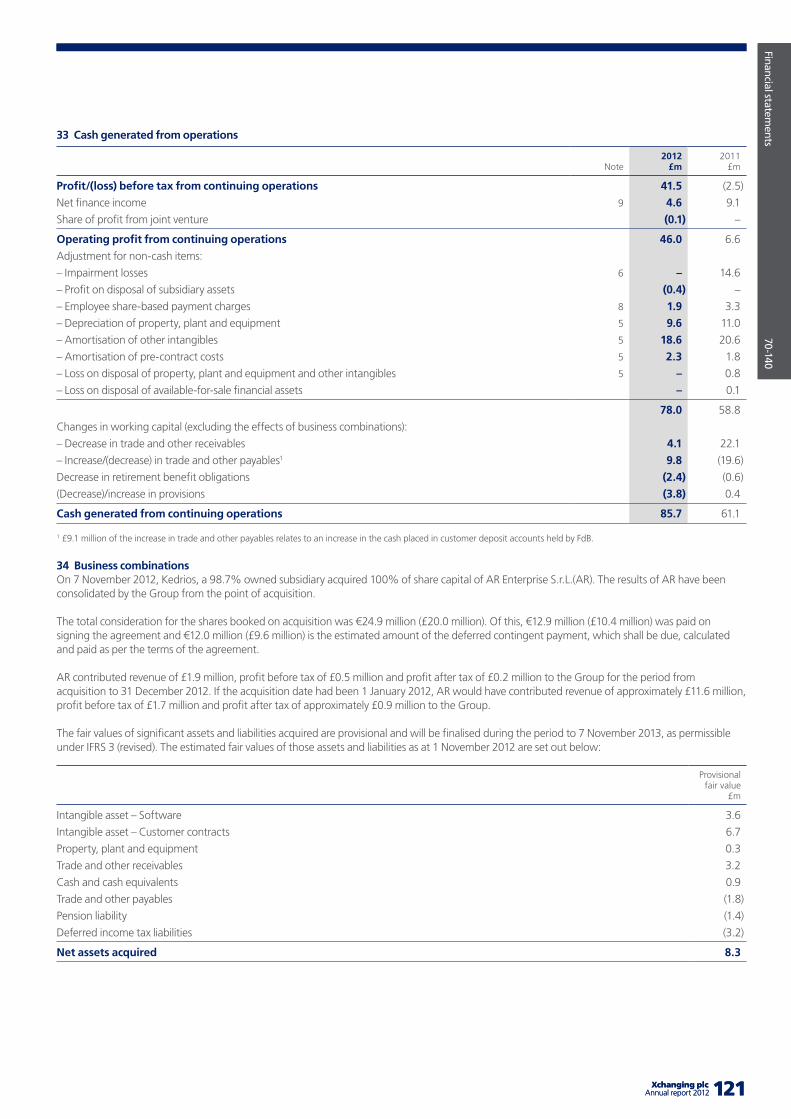
Company overview
X
X-X
X
121 Xchanging plcAnnual report 2012
Financial statements
70-140
121 Xchanging plcAnnual report 2012
33 Cash generated from operations
Note2012
£m2011
£m
Profit/(loss) before tax from continuing operations 41.5 (2.5)
Net finance income 9 4.6 9.1
Share of profit from joint venture (0.1) –
Operating profit from continuing operations 46.0 6.6
Adjustment for non-cash items:
– Impairment losses 6 – 14.6
– Profit on disposal of subsidiary assets (0.4) –
– Employee share-based payment charges 8 1.9 3.3
– Depreciation of property, plant and equipment 5 9.6 11.0
– Amortisation of other intangibles 5 18.6 20.6
– Amortisation of pre-contract costs 5 2.3 1.8
– Loss on disposal of property, plant and equipment and other intangibles 5 – 0.8
– Loss on disposal of available-for-sale financial assets – 0.1
78.0 58.8
Changes in working capital (excluding the effects of business combinations):
– Decrease in trade and other receivables 4.1 22.1
– Increase/(decrease) in trade and other payables1 9.8 (19.6)
Decrease in retirement benefit obligations (2.4) (0.6)
(Decrease)/increase in provisions (3.8) 0.4
Cash generated from continuing operations 85.7 61.1
1 £9.1 million of the increase in trade and other payables relates to an increase in the cash placed in customer deposit accounts held by FdB.
34 Business combinations On 7 November 2012, Kedrios, a 98.7% owned subsidiary acquired 100% of share capital of AR Enterprise S.r.L.(AR). The results of AR have been consolidated by the Group from the point of acquisition.
The total consideration for the shares booked on acquisition was €24.9 million (£20.0 million). Of this, €12.9 million (£10.4 million) was paid on signing the agreement and €12.0 million (£9.6 million) is the estimated amount of the deferred contingent payment, which shall be due, calculated and paid as per the terms of the agreement.
AR contributed revenue of £1.9 million, profit before tax of £0.5 million and profit after tax of £0.2 million to the Group for the period from acquisition to 31 December 2012. If the acquisition date had been 1 January 2012, AR would have contributed revenue of approximately £11.6 million, profit before tax of £1.7 million and profit after tax of approximately £0.9 million to the Group.
The fair values of significant assets and liabilities acquired are provisional and will be finalised during the period to 7 November 2013, as permissible under IFRS 3 (revised). The estimated fair values of those assets and liabilities as at 1 November 2012 are set out below:
Provisional fair value
£m
Intangible asset – Software 3.6
Intangible asset – Customer contracts 6.7
Property, plant and equipment 0.3
Trade and other receivables 3.2
Cash and cash equivalents 0.9
Trade and other payables (1.8)
Pension liability (1.4)
Deferred income tax liabilities (3.2)
Net assets acquired 8.3
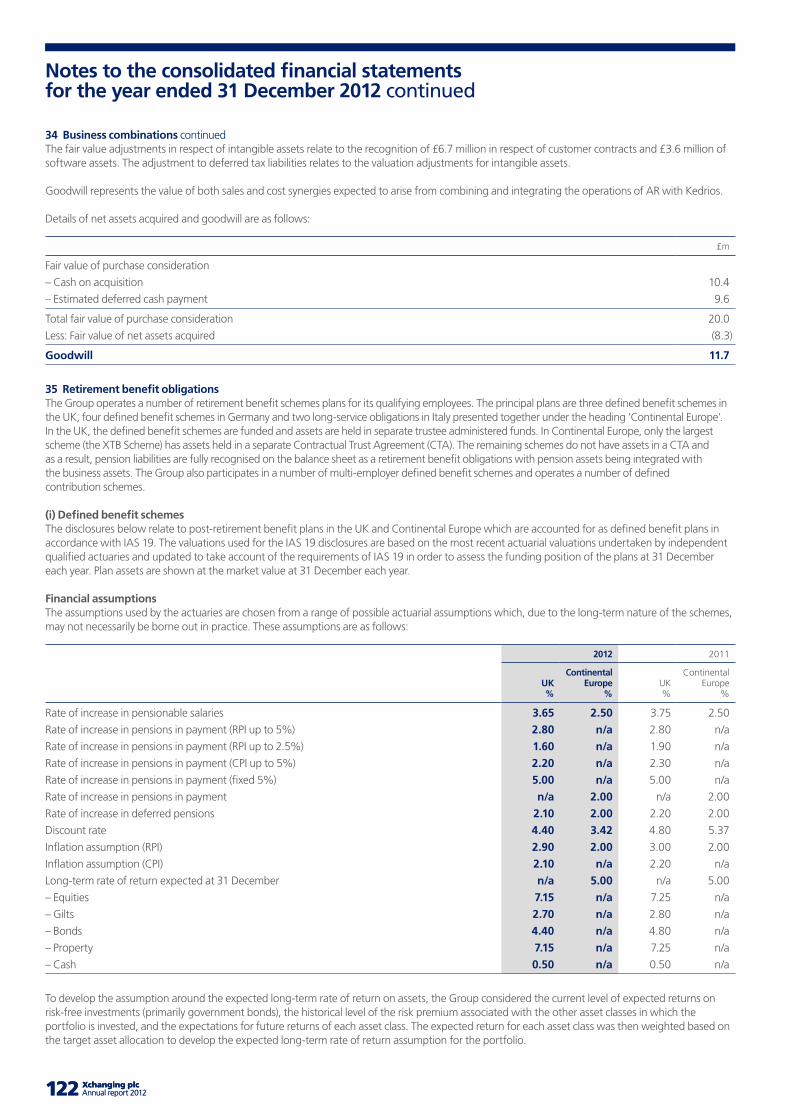
122 Xchanging plc Annual report 2012 123122 Xchanging plc Annual report 2012 123
Notes to the consolidated financial statements for the year ended 31 December 2012 continued
34 Business combinations continuedThe fair value adjustments in respect of intangible assets relate to the recognition of £6.7 million in respect of customer contracts and £3.6 million of software assets. The adjustment to deferred tax liabilities relates to the valuation adjustments for intangible assets.
Goodwill represents the value of both sales and cost synergies expected to arise from combining and integrating the operations of AR with Kedrios.
Details of net assets acquired and goodwill are as follows:
£m
Fair value of purchase consideration
– Cash on acquisition 10.4
– Estimated deferred cash payment 9.6
Total fair value of purchase consideration 20.0
Less: Fair value of net assets acquired (8.3)
Goodwill 11.7
35 Retirement benefit obligationsThe Group operates a number of retirement benefit schemes plans for its qualifying employees. The principal plans are three defined benefit schemes in the UK, four defined benefit schemes in Germany and two long-service obligations in Italy presented together under the heading ‘Continental Europe’. In the UK, the defined benefit schemes are funded and assets are held in separate trustee administered funds. In Continental Europe, only the largest scheme (the XTB Scheme) has assets held in a separate Contractual Trust Agreement (CTA). The remaining schemes do not have assets in a CTA and as a result, pension liabilities are fully recognised on the balance sheet as a retirement benefit obligations with pension assets being integrated with the business assets. The Group also participates in a number of multi-employer defined benefit schemes and operates a number of defined contribution schemes.
(i) Defined benefit schemesThe disclosures below relate to post-retirement benefit plans in the UK and Continental Europe which are accounted for as defined benefit plans in accordance with IAS 19. The valuations used for the IAS 19 disclosures are based on the most recent actuarial valuations undertaken by independent qualified actuaries and updated to take account of the requirements of IAS 19 in order to assess the funding position of the plans at 31 December each year. Plan assets are shown at the market value at 31 December each year.
Financial assumptionsThe assumptions used by the actuaries are chosen from a range of possible actuarial assumptions which, due to the long-term nature of the schemes, may not necessarily be borne out in practice. These assumptions are as follows:
2012 2011
UK%
Continental Europe
%UK%
Continental Europe
%
Rate of increase in pensionable salaries 3.65 2.50 3.75 2.50
Rate of increase in pensions in payment (RPI up to 5%) 2.80 n/a 2.80 n/a
Rate of increase in pensions in payment (RPI up to 2.5%) 1.60 n/a 1.90 n/a
Rate of increase in pensions in payment (CPI up to 5%) 2.20 n/a 2.30 n/a
Rate of increase in pensions in payment (fixed 5%) 5.00 n/a 5.00 n/a
Rate of increase in pensions in payment n/a 2.00 n/a 2.00
Rate of increase in deferred pensions 2.10 2.00 2.20 2.00
Discount rate 4.40 3.42 4.80 5.37
Inflation assumption (RPI) 2.90 2.00 3.00 2.00
Inflation assumption (CPI) 2.10 n/a 2.20 n/a
Long-term rate of return expected at 31 December n/a 5.00 n/a 5.00
– Equities 7.15 n/a 7.25 n/a
– Gilts 2.70 n/a 2.80 n/a
– Bonds 4.40 n/a 4.80 n/a
– Property 7.15 n/a 7.25 n/a
– Cash 0.50 n/a 0.50 n/a
To develop the assumption around the expected long-term rate of return on assets, the Group considered the current level of expected returns on risk-free investments (primarily government bonds), the historical level of the risk premium associated with the other asset classes in which the portfolio is invested, and the expectations for future returns of each asset class. The expected return for each asset class was then weighted based on the target asset allocation to develop the expected long-term rate of return assumption for the portfolio.
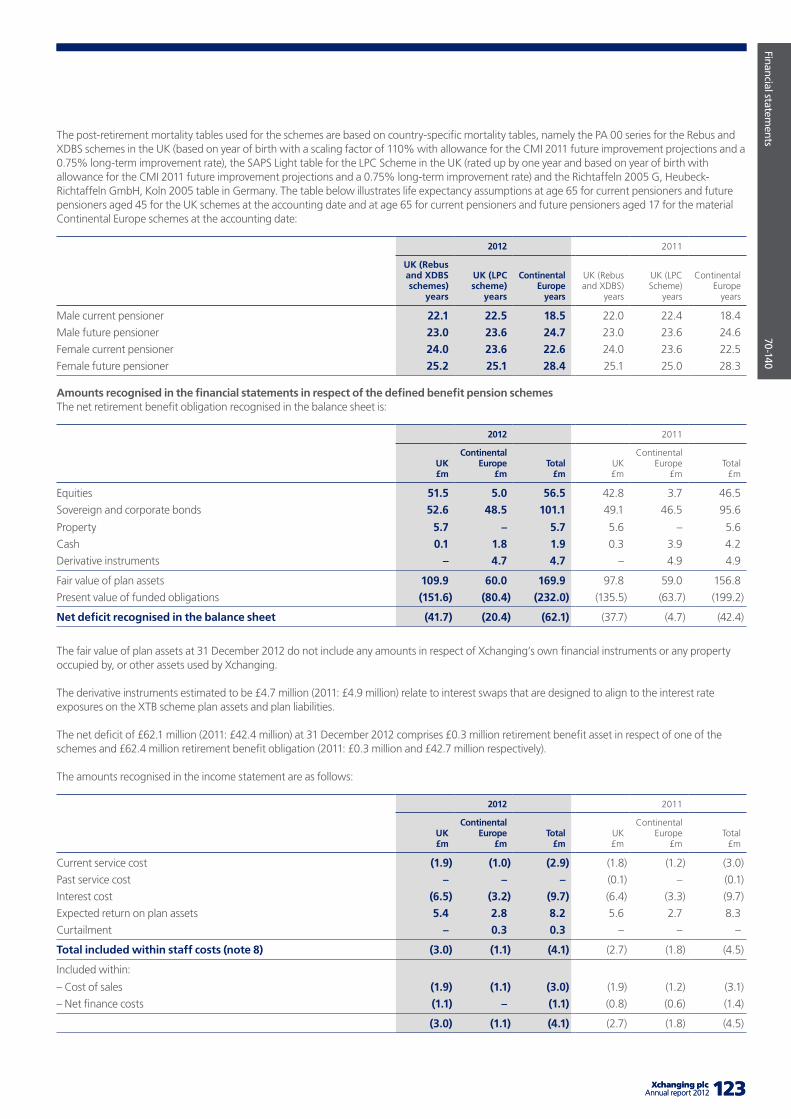
Company overview
X
X-X
X
123 Xchanging plcAnnual report 2012
Financial statements
70-140
123 Xchanging plcAnnual report 2012
The post-retirement mortality tables used for the schemes are based on country-specific mortality tables, namely the PA 00 series for the Rebus and XDBS schemes in the UK (based on year of birth with a scaling factor of 110% with allowance for the CMI 2011 future improvement projections and a 0.75% long-term improvement rate), the SAPS Light table for the LPC Scheme in the UK (rated up by one year and based on year of birth with allowance for the CMI 2011 future improvement projections and a 0.75% long-term improvement rate) and the Richtaffeln 2005 G, Heubeck-Richtaffeln GmbH, Koln 2005 table in Germany. The table below illustrates life expectancy assumptions at age 65 for current pensioners and future pensioners aged 45 for the UK schemes at the accounting date and at age 65 for current pensioners and future pensioners aged 17 for the material Continental Europe schemes at the accounting date:
2012 2011
UK (Rebus and XDBS schemes)
years
UK (LPC scheme)
years
Continental Europe
years
UK (Rebus and XDBS)
years
UK (LPC Scheme)
years
Continental Europe
years
Male current pensioner 22.1 22.5 18.5 22.0 22.4 18.4
Male future pensioner 23.0 23.6 24.7 23.0 23.6 24.6
Female current pensioner 24.0 23.6 22.6 24.0 23.6 22.5
Female future pensioner 25.2 25.1 28.4 25.1 25.0 28.3
Amounts recognised in the financial statements in respect of the defined benefit pension schemesThe net retirement benefit obligation recognised in the balance sheet is:
2012 2011
UK£m
Continental Europe
£mTotal
£mUK£m
Continental Europe
£mTotal
£m
Equities 51.5 5.0 56.5 42.8 3.7 46.5
Sovereign and corporate bonds 52.6 48.5 101.1 49.1 46.5 95.6
Property 5.7 – 5.7 5.6 – 5.6
Cash 0.1 1.8 1.9 0.3 3.9 4.2
Derivative instruments – 4.7 4.7 – 4.9 4.9
Fair value of plan assets 109.9 60.0 169.9 97.8 59.0 156.8
Present value of funded obligations (151.6) (80.4) (232.0) (135.5) (63.7) (199.2)
Net deficit recognised in the balance sheet (41.7) (20.4) (62.1) (37.7) (4.7) (42.4)
The fair value of plan assets at 31 December 2012 do not include any amounts in respect of Xchanging’s own financial instruments or any property occupied by, or other assets used by Xchanging.
The derivative instruments estimated to be £4.7 million (2011: £4.9 million) relate to interest swaps that are designed to align to the interest rate exposures on the XTB scheme plan assets and plan liabilities.
The net deficit of £62.1 million (2011: £42.4 million) at 31 December 2012 comprises £0.3 million retirement benefit asset in respect of one of the schemes and £62.4 million retirement benefit obligation (2011: £0.3 million and £42.7 million respectively).
The amounts recognised in the income statement are as follows:
2012 2011
UK£m
Continental Europe
£mTotal
£mUK£m
Continental Europe
£mTotal
£m
Current service cost (1.9) (1.0) (2.9) (1.8) (1.2) (3.0)
Past service cost – – – (0.1) – (0.1)
Interest cost (6.5) (3.2) (9.7) (6.4) (3.3) (9.7)
Expected return on plan assets 5.4 2.8 8.2 5.6 2.7 8.3
Curtailment – 0.3 0.3 – – –
Total included within staff costs (note 8) (3.0) (1.1) (4.1) (2.7) (1.8) (4.5)
Included within:
– Cost of sales (1.9) (1.1) (3.0) (1.9) (1.2) (3.1)
– Net finance costs (1.1) – (1.1) (0.8) (0.6) (1.4)
(3.0) (1.1) (4.1) (2.7) (1.8) (4.5)
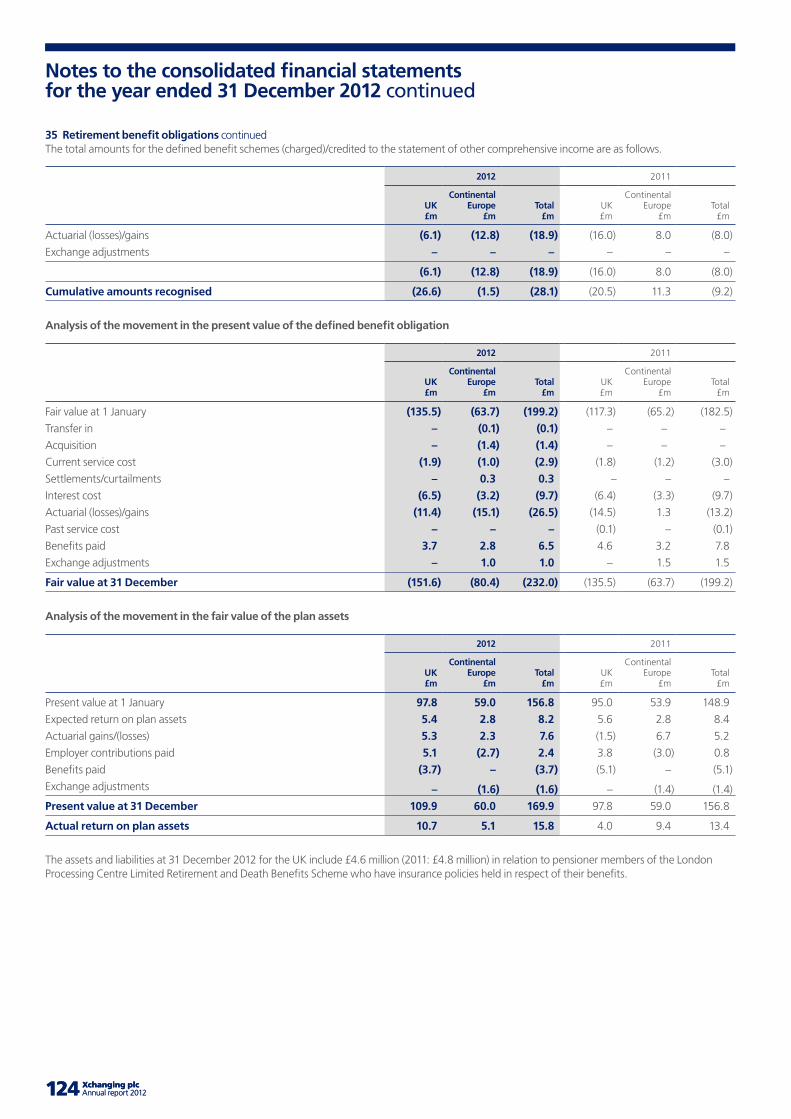
124 Xchanging plc Annual report 2012 125124 Xchanging plc Annual report 2012 125
Notes to the consolidated financial statements for the year ended 31 December 2012 continued
35 Retirement benefit obligations continuedThe total amounts for the defined benefit schemes (charged)/credited to the statement of other comprehensive income are as follows.
2012 2011
UK£m
Continental Europe
£mTotal
£mUK£m
Continental Europe
£mTotal
£m
Actuarial (losses)/gains (6.1) (12.8) (18.9) (16.0) 8.0 (8.0)
Exchange adjustments – – – – – –
(6.1) (12.8) (18.9) (16.0) 8.0 (8.0)
Cumulative amounts recognised (26.6) (1.5) (28.1) (20.5) 11.3 (9.2)
Analysis of the movement in the present value of the defined benefit obligation
2012 2011
UK£m
Continental Europe
£mTotal
£mUK£m
Continental Europe
£mTotal
£m
Fair value at 1 January (135.5) (63.7) (199.2) (117.3) (65.2) (182.5)
Transfer in – (0.1) (0.1) – – –
Acquisition – (1.4) (1.4) – – –
Current service cost (1.9) (1.0) (2.9) (1.8) (1.2) (3.0)
Settlements/curtailments – 0.3 0.3 – – –
Interest cost (6.5) (3.2) (9.7) (6.4) (3.3) (9.7)
Actuarial (losses)/gains (11.4) (15.1) (26.5) (14.5) 1.3 (13.2)
Past service cost – – – (0.1) – (0.1)
Benefits paid 3.7 2.8 6.5 4.6 3.2 7.8
Exchange adjustments – 1.0 1.0 – 1.5 1.5
Fair value at 31 December (151.6) (80.4) (232.0) (135.5) (63.7) (199.2)
Analysis of the movement in the fair value of the plan assets
2012 2011
UK£m
Continental Europe
£mTotal
£mUK£m
Continental Europe
£mTotal
£m
Present value at 1 January 97.8 59.0 156.8 95.0 53.9 148.9
Expected return on plan assets 5.4 2.8 8.2 5.6 2.8 8.4
Actuarial gains/(losses) 5.3 2.3 7.6 (1.5) 6.7 5.2
Employer contributions paid 5.1 (2.7) 2.4 3.8 (3.0) 0.8
Benefits paid (3.7) – (3.7) (5.1) – (5.1)
Exchange adjustments – (1.6) (1.6) – (1.4) (1.4)
Present value at 31 December 109.9 60.0 169.9 97.8 59.0 156.8
Actual return on plan assets 10.7 5.1 15.8 4.0 9.4 13.4
The assets and liabilities at 31 December 2012 for the UK include £4.6 million (2011: £4.8 million) in relation to pensioner members of the London Processing Centre Limited Retirement and Death Benefits Scheme who have insurance policies held in respect of their benefits.
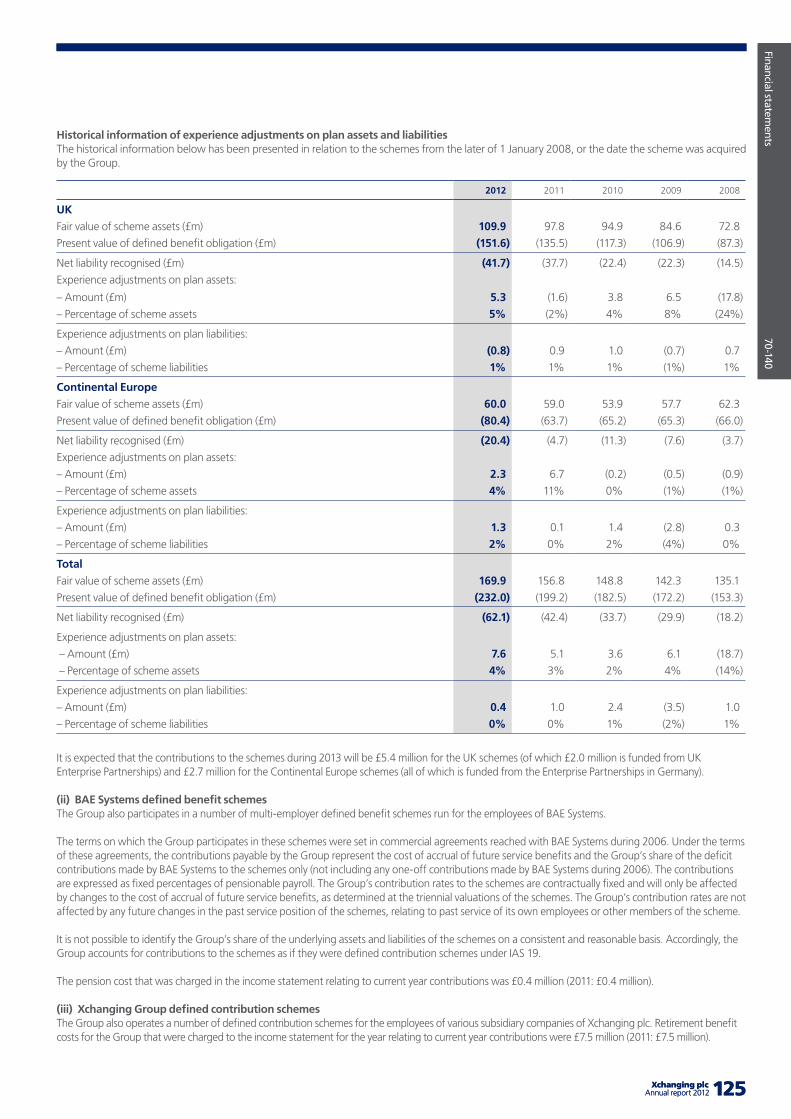
Company overview
X
X-X
X
125 Xchanging plcAnnual report 2012
Financial statements
70-140
125 Xchanging plcAnnual report 2012
Historical information of experience adjustments on plan assets and liabilitiesThe historical information below has been presented in relation to the schemes from the later of 1 January 2008, or the date the scheme was acquired by the Group.
2012 2011 2010 2009 2008
UK
Fair value of scheme assets (£m) 109.9 97.8 94.9 84.6 72.8
Present value of defined benefit obligation (£m) (151.6) (135.5) (117.3) (106.9) (87.3)
Net liability recognised (£m) (41.7) (37.7) (22.4) (22.3) (14.5)
Experience adjustments on plan assets:
– Amount (£m) 5.3 (1.6) 3.8 6.5 (17.8)
– Percentage of scheme assets 5% (2%) 4% 8% (24%)
Experience adjustments on plan liabilities:
– Amount (£m) (0.8) 0.9 1.0 (0.7) 0.7
– Percentage of scheme liabilities 1% 1% 1% (1%) 1%
Continental Europe
Fair value of scheme assets (£m) 60.0 59.0 53.9 57.7 62.3
Present value of defined benefit obligation (£m) (80.4) (63.7) (65.2) (65.3) (66.0)
Net liability recognised (£m) (20.4) (4.7) (11.3) (7.6) (3.7)
Experience adjustments on plan assets:
– Amount (£m) 2.3 6.7 (0.2) (0.5) (0.9)
– Percentage of scheme assets 4% 11% 0% (1%) (1%)
Experience adjustments on plan liabilities:
– Amount (£m) 1.3 0.1 1.4 (2.8) 0.3
– Percentage of scheme liabilities 2% 0% 2% (4%) 0%
Total
Fair value of scheme assets (£m) 169.9 156.8 148.8 142.3 135.1
Present value of defined benefit obligation (£m) (232.0) (199.2) (182.5) (172.2) (153.3)
Net liability recognised (£m) (62.1) (42.4) (33.7) (29.9) (18.2)
Experience adjustments on plan assets:
– Amount (£m) 7.6 5.1 3.6 6.1 (18.7)
– Percentage of scheme assets 4% 3% 2% 4% (14%)
Experience adjustments on plan liabilities:
– Amount (£m) 0.4 1.0 2.4 (3.5) 1.0
– Percentage of scheme liabilities 0% 0% 1% (2%) 1%
It is expected that the contributions to the schemes during 2013 will be £5.4 million for the UK schemes (of which £2.0 million is funded from UK Enterprise Partnerships) and £2.7 million for the Continental Europe schemes (all of which is funded from the Enterprise Partnerships in Germany).
(ii) BAE Systems defined benefit schemesThe Group also participates in a number of multi-employer defined benefit schemes run for the employees of BAE Systems.
The terms on which the Group participates in these schemes were set in commercial agreements reached with BAE Systems during 2006. Under the terms of these agreements, the contributions payable by the Group represent the cost of accrual of future service benefits and the Group’s share of the deficit contributions made by BAE Systems to the schemes only (not including any one-off contributions made by BAE Systems during 2006). The contributions are expressed as fixed percentages of pensionable payroll. The Group’s contribution rates to the schemes are contractually fixed and will only be affected by changes to the cost of accrual of future service benefits, as determined at the triennial valuations of the schemes. The Group’s contribution rates are not affected by any future changes in the past service position of the schemes, relating to past service of its own employees or other members of the scheme.
It is not possible to identify the Group’s share of the underlying assets and liabilities of the schemes on a consistent and reasonable basis. Accordingly, the Group accounts for contributions to the schemes as if they were defined contribution schemes under IAS 19.
The pension cost that was charged in the income statement relating to current year contributions was £0.4 million (2011: £0.4 million).
(iii) Xchanging Group defined contribution schemesThe Group also operates a number of defined contribution schemes for the employees of various subsidiary companies of Xchanging plc. Retirement benefit costs for the Group that were charged to the income statement for the year relating to current year contributions were £7.5 million (2011: £7.5 million).
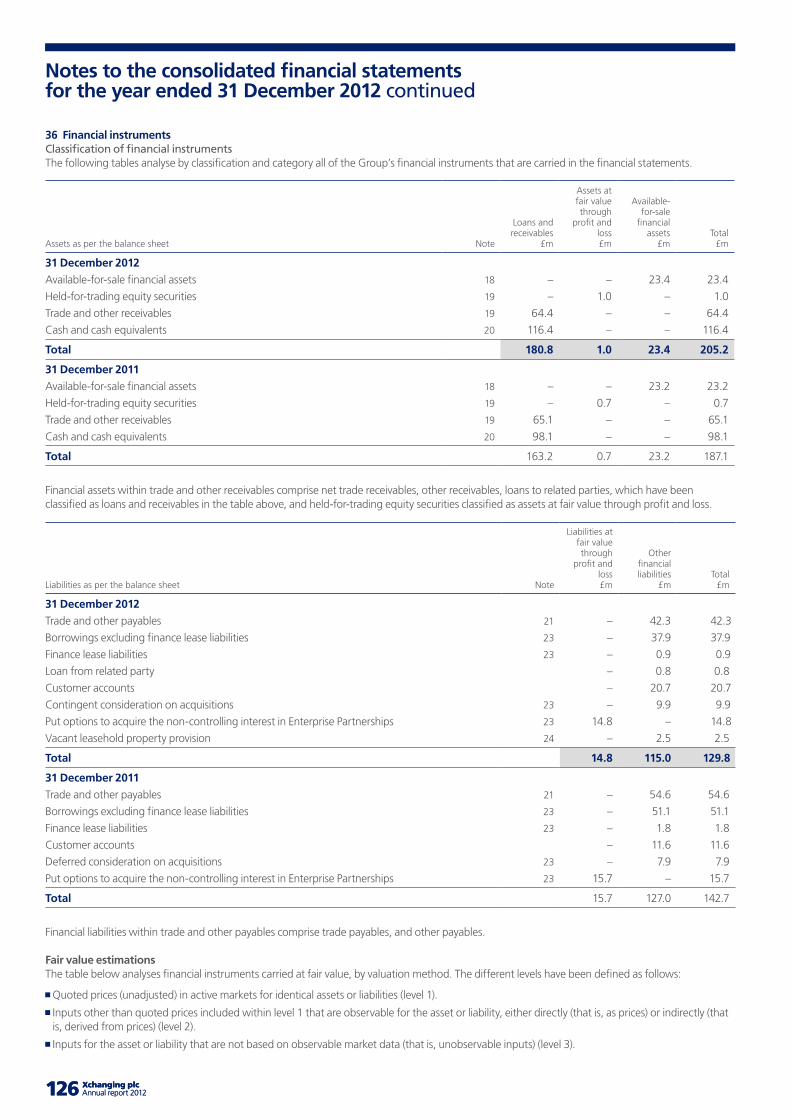
126 Xchanging plc Annual report 2012 127126 Xchanging plc Annual report 2012 127
Notes to the consolidated financial statements for the year ended 31 December 2012 continued
36 Financial instrumentsClassification of financial instrumentsThe following tables analyse by classification and category all of the Group’s financial instruments that are carried in the financial statements.
Assets as per the balance sheet Note
Loans and receivables
£m
Assets at fair value through
profit and loss £m
Available- for-sale
financial assets
£mTotal
£m
31 December 2012
Available-for-sale financial assets 18 – – 23.4 23.4
Held-for-trading equity securities 19 – 1.0 – 1.0
Trade and other receivables 19 64.4 – – 64.4
Cash and cash equivalents 20 116.4 – – 116.4
Total 180.8 1.0 23.4 205.2
31 December 2011
Available-for-sale financial assets 18 – – 23.2 23.2
Held-for-trading equity securities 19 – 0.7 – 0.7
Trade and other receivables 19 65.1 – – 65.1
Cash and cash equivalents 20 98.1 – – 98.1
Total 163.2 0.7 23.2 187.1
Financial assets within trade and other receivables comprise net trade receivables, other receivables, loans to related parties, which have been classified as loans and receivables in the table above, and held-for-trading equity securities classified as assets at fair value through profit and loss.
Liabilities as per the balance sheet Note
Liabilities at fair value through
profit and loss £m
Other financial liabilities
£mTotal
£m
31 December 2012
Trade and other payables 21 – 42.3 42.3
Borrowings excluding finance lease liabilities 23 – 37.9 37.9
Finance lease liabilities 23 – 0.9 0.9
Loan from related party – 0.8 0.8
Customer accounts – 20.7 20.7
Contingent consideration on acquisitions 23 – 9.9 9.9
Put options to acquire the non-controlling interest in Enterprise Partnerships 23 14.8 – 14.8
Vacant leasehold property provision 24 – 2.5 2.5
Total 14.8 115.0 129.8
31 December 2011
Trade and other payables 21 – 54.6 54.6
Borrowings excluding finance lease liabilities 23 – 51.1 51.1
Finance lease liabilities 23 – 1.8 1.8
Customer accounts – 11.6 11.6
Deferred consideration on acquisitions 23 – 7.9 7.9
Put options to acquire the non-controlling interest in Enterprise Partnerships 23 15.7 – 15.7
Total 15.7 127.0 142.7
Financial liabilities within trade and other payables comprise trade payables, and other payables.
Fair value estimationsThe table below analyses financial instruments carried at fair value, by valuation method. The different levels have been defined as follows:
Quoted prices (unadjusted) in active markets for identical assets or liabilities (level 1).
Inputs other than quoted prices included within level 1 that are observable for the asset or liability, either directly (that is, as prices) or indirectly (that is, derived from prices) (level 2).
Inputs for the asset or liability that are not based on observable market data (that is, unobservable inputs) (level 3).
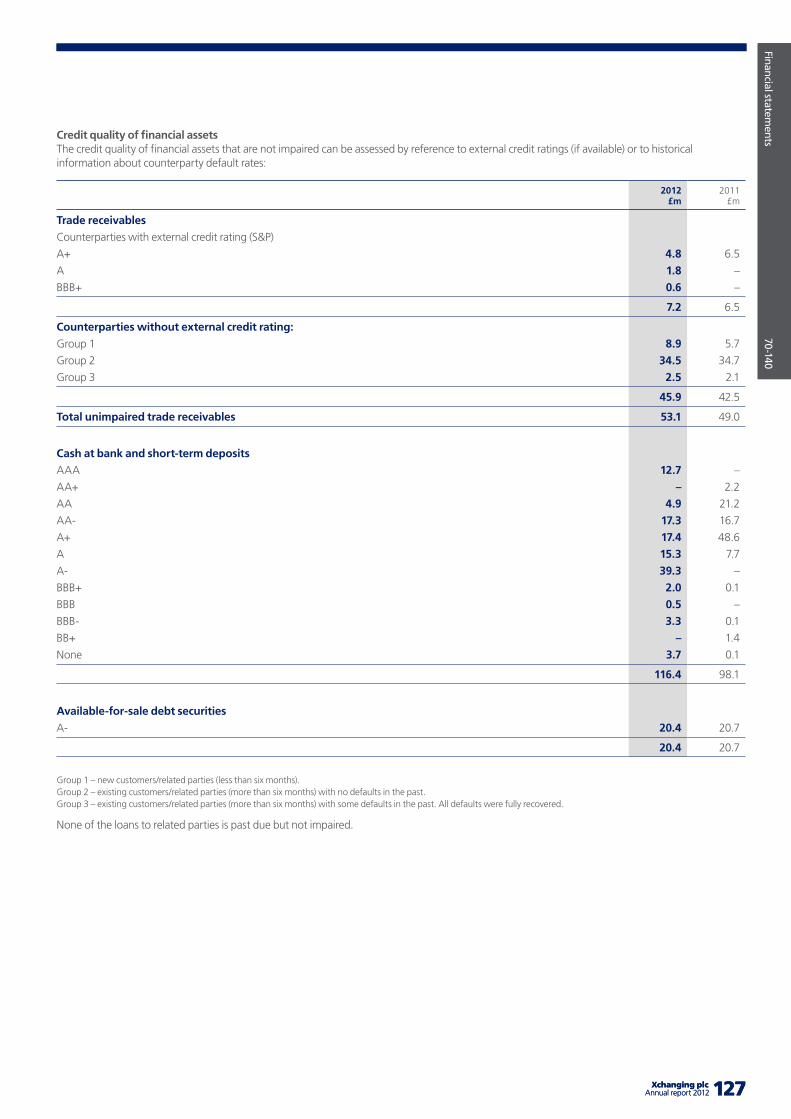
Company overview
X
X-X
X
127 Xchanging plcAnnual report 2012
Financial statements
70-140
127 Xchanging plcAnnual report 2012
Credit quality of financial assetsThe credit quality of financial assets that are not impaired can be assessed by reference to external credit ratings (if available) or to historical information about counterparty default rates:
2012 £m
2011£m
Trade receivables
Counterparties with external credit rating (S&P)
A+ 4.8 6.5
A 1.8 –
BBB+ 0.6 –
7.2 6.5
Counterparties without external credit rating:
Group 1 8.9 5.7
Group 2 34.5 34.7
Group 3 2.5 2.1
45.9 42.5
Total unimpaired trade receivables 53.1 49.0
Cash at bank and short-term deposits
AAA 12.7 –
AA+ – 2.2
AA 4.9 21.2
AA- 17.3 16.7
A+ 17.4 48.6
A 15.3 7.7
A- 39.3 –
BBB+ 2.0 0.1
BBB 0.5 –
BBB- 3.3 0.1
BB+ – 1.4
None 3.7 0.1
116.4 98.1
Available-for-sale debt securities
A- 20.4 20.7
20.4 20.7
Group 1 – new customers/related parties (less than six months).Group 2 – existing customers/related parties (more than six months) with no defaults in the past.Group 3 – existing customers/related parties (more than six months) with some defaults in the past. All defaults were fully recovered.
None of the loans to related parties is past due but not impaired.
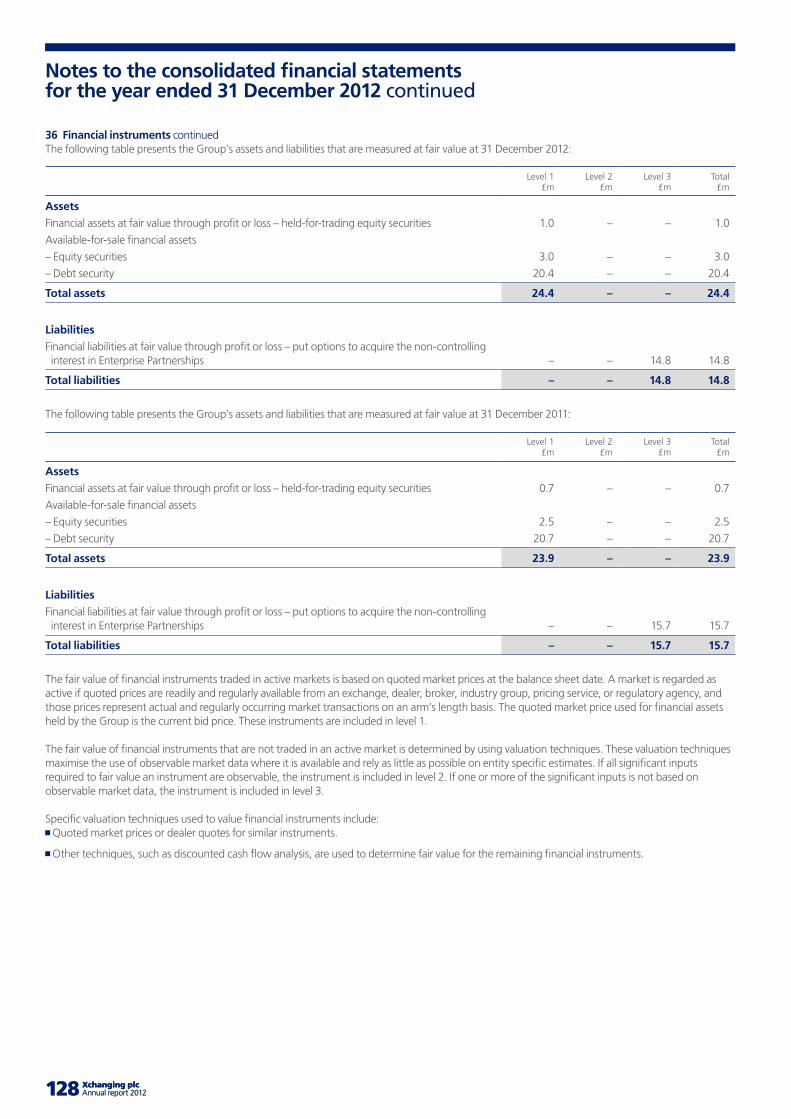
128 Xchanging plc Annual report 2012 129128 Xchanging plc Annual report 2012 129
Notes to the consolidated financial statements for the year ended 31 December 2012 continued
36 Financial instruments continuedThe following table presents the Group’s assets and liabilities that are measured at fair value at 31 December 2012:
Level 1£m
Level 2 £m
Level 3 £m
Total £m
Assets
Financial assets at fair value through profit or loss – held-for-trading equity securities 1.0 – – 1.0
Available-for-sale financial assets
– Equity securities 3.0 – – 3.0
– Debt security 20.4 – – 20.4
Total assets 24.4 – – 24.4
Liabilities
Financial liabilities at fair value through profit or loss – put options to acquire the non-controlling interest in Enterprise Partnerships – – 14.8 14.8
Total liabilities – – 14.8 14.8
The following table presents the Group’s assets and liabilities that are measured at fair value at 31 December 2011:
Level 1£m
Level 2 £m
Level 3 £m
Total £m
Assets
Financial assets at fair value through profit or loss – held-for-trading equity securities 0.7 – – 0.7
Available-for-sale financial assets
– Equity securities 2.5 – – 2.5
– Debt security 20.7 – – 20.7
Total assets 23.9 – – 23.9
Liabilities
Financial liabilities at fair value through profit or loss – put options to acquire the non-controlling interest in Enterprise Partnerships – – 15.7 15.7
Total liabilities – – 15.7 15.7
The fair value of financial instruments traded in active markets is based on quoted market prices at the balance sheet date. A market is regarded as active if quoted prices are readily and regularly available from an exchange, dealer, broker, industry group, pricing service, or regulatory agency, and those prices represent actual and regularly occurring market transactions on an arm’s length basis. The quoted market price used for financial assets held by the Group is the current bid price. These instruments are included in level 1.
The fair value of financial instruments that are not traded in an active market is determined by using valuation techniques. These valuation techniques maximise the use of observable market data where it is available and rely as little as possible on entity specific estimates. If all significant inputs required to fair value an instrument are observable, the instrument is included in level 2. If one or more of the significant inputs is not based on observable market data, the instrument is included in level 3.
Specific valuation techniques used to value financial instruments include: Quoted market prices or dealer quotes for similar instruments.
Other techniques, such as discounted cash flow analysis, are used to determine fair value for the remaining financial instruments.
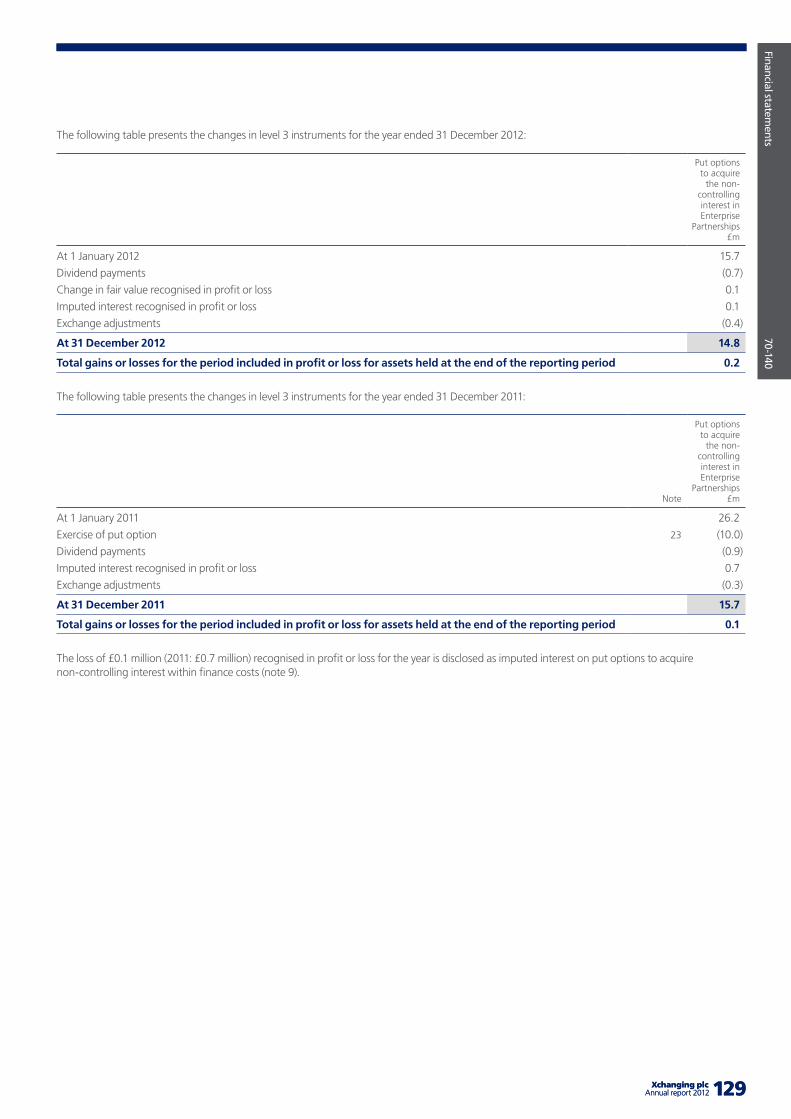
Company overview
X
X-X
X
129 Xchanging plcAnnual report 2012
Financial statements
70-140
129 Xchanging plcAnnual report 2012
The following table presents the changes in level 3 instruments for the year ended 31 December 2012:
Put options to acquire
the non-controlling interest in Enterprise
Partnerships £m
At 1 January 2012 15.7
Dividend payments (0.7)
Change in fair value recognised in profit or loss 0.1
Imputed interest recognised in profit or loss 0.1
Exchange adjustments (0.4)
At 31 December 2012 14.8
Total gains or losses for the period included in profit or loss for assets held at the end of the reporting period 0.2
The following table presents the changes in level 3 instruments for the year ended 31 December 2011:
Note
Put options to acquire
the non-controlling interest in Enterprise
Partnerships £m
At 1 January 2011 26.2
Exercise of put option 23 (10.0)
Dividend payments (0.9)
Imputed interest recognised in profit or loss 0.7
Exchange adjustments (0.3)
At 31 December 2011 15.7
Total gains or losses for the period included in profit or loss for assets held at the end of the reporting period 0.1
The loss of £0.1 million (2011: £0.7 million) recognised in profit or loss for the year is disclosed as imputed interest on put options to acquire non-controlling interest within finance costs (note 9).
130 Xchanging plc Annual report 2012 131130 Xchanging plc Annual report 2012 131
Notes to the consolidated financial statements for the year ended 31 December 2012 continued
37 Financial risk managementThe multinational nature of the Group’s operations and their financing exposes it to a variety of financial risks: market risk (including foreign exchange risk, fair value interest rate risk, cash flow interest rate risk), credit risk and liquidity risk. The Group’s overall risk management programme focuses on the unpredictability of financial markets and seeks to minimise potential adverse effects on the Group’s financial performance. The Group may use derivative financial instruments to hedge certain risk exposures but the Group does not undertake any speculative trading in financial instruments.
The Group’s treasury function acts as a service centre and all treasury activity takes place within a formal control framework under policies that are approved by the Board. Compliance with key policies and exposure limits is monitored through regular reporting of treasury activities and reviews by internal audit.
Interest rate riskThe Group’s exposure to the risk of changes in market interest rates arises primarily from long-term debt obligations, which carry a floating interest rate charge. The Group reviews its interest rate exposure against acceptable risk profiles on a periodic basis and may enter into interest rate swap agreements in order to achieve an acceptable balance of fixed and floating rate interest exposure. Currently all financial liabilities are subject to floating rate interest.
The Group holds a Euro-denominated financial asset, which carries a fixed coupon.
Working capital is generally held in variable rate operational accounts, with surplus cash placed on fixed rate short-term deposits.
The Group has used a sensitivity analysis technique that measures the estimated impact on the income statement and equity of a reasonably possible change in market interest rates of 25bps to 100bps for each class of financial instruments, with all other variables held constant. The sensitivity analysis is based on the following assumptions: Changes in market interest rates affect interest income or expense of variable interest financial instruments; and
Changes in market interest rates only affect interest income or expense in relation to financial instruments with fixed interest rates if these are recognised at their fair value.
With all other variables held constant the Group has assessed that this reasonably possible change in market interest rates does not present a material exposure to the Group’s balance sheet and income statement.
Foreign exchange riskThe international nature of the Group’s operations exposes the Group to a number of foreign currencies. The Group does not hedge foreign currency profit and loss translation exposures and the reported results may therefore be affected by currency fluctuations.
The Group is not generally subject to foreign exchange transaction exposure except in its Indian operations where revenues are generated in Sterling, US Dollars and Euros and the cost base is primarily in Indian Rupees. Under the Group’s foreign exchange risk management policy, exposures may be hedged with forward foreign exchange contracts when the underlying cash flows are deemed to be highly probable. It is the Group’s policy to negotiate the terms of the hedge derivatives to match the terms of the underlying cash flows in order to maximise hedge effectiveness. At 31 December 2012 the Group had forward FX contracts of £11.4 million, €3.3 million and USD8.2 million (2011: £4.8 million and USD4.8 million) in place to mitigate foreign exchange volatility relative to the Indian Rupee. Of these, £10.6 million, €2.9 million and USD7.4 million (2011: £4.7 million and USD4.2 million) were designated as cash flow hedges of highly probable US Dollar, Euro and Sterling revenue. The cash flow hedges were assessed to be highly effective as at the year end date and a net unrealised loss of £0.3 million (2011: £0.6 million net unrealised loss) was recognised in equity. The cash flow hedges have been transacted to fix the INR value of USD, GPB and EUR cash flows expected to arise during the period January 2013 to November 2013.
The Group has used a sensitivity analysis technique that measures the estimated impact on the income statement and equity of a reasonably possible change in foreign currency exchange rates for each class of financial instruments, with all other variables held constant. The sensitivity analysis is based on material non-functional currency financial instruments within each entity within the Group.
The Group has assessed that a reasonably possible change of 10.0% in non-functional currency foreign exchange rate does not present a material exposure to the Group’s balance sheet and income statement. Foreign exchange sensitivity on the Group’s assets other than financial instruments is not included in this assessment.
Credit riskCredit risks arise from the possibility that customers may not be able to settle their obligations as agreed. To manage this risk, the Group periodically assesses the financial reliability of customers, taking into account their financial position, past experience and other factors. Individual risk limits are set accordingly. Receivable balances are monitored on an on-going basis with the result that the Group’s exposure to bad debts is not material. The Group has a concentration of credit risk with respect to trade receivables due to the nature and structure of the Enterprise Partnerships. An analysis of all debts, which are past due, is included in note 19. Credit risk assessments are performed when signing up new customers. Credit risk is mitigated to an extent by the profile of companies with whom the Group has entered into Enterprise Partnerships, being blue chip companies.
With respect to credit risk arising from the other financial assets of the Group, the principal assets being cash and cash equivalents, the Group’s exposure to credit risk arises from default of the counterparty. The Group’s treasury function only transacts with counterparties that have a strong investment grade rating from a credit rating agency and ensures that no exposure to any one institution at any given time exceeds the Board-approved exposure limit.
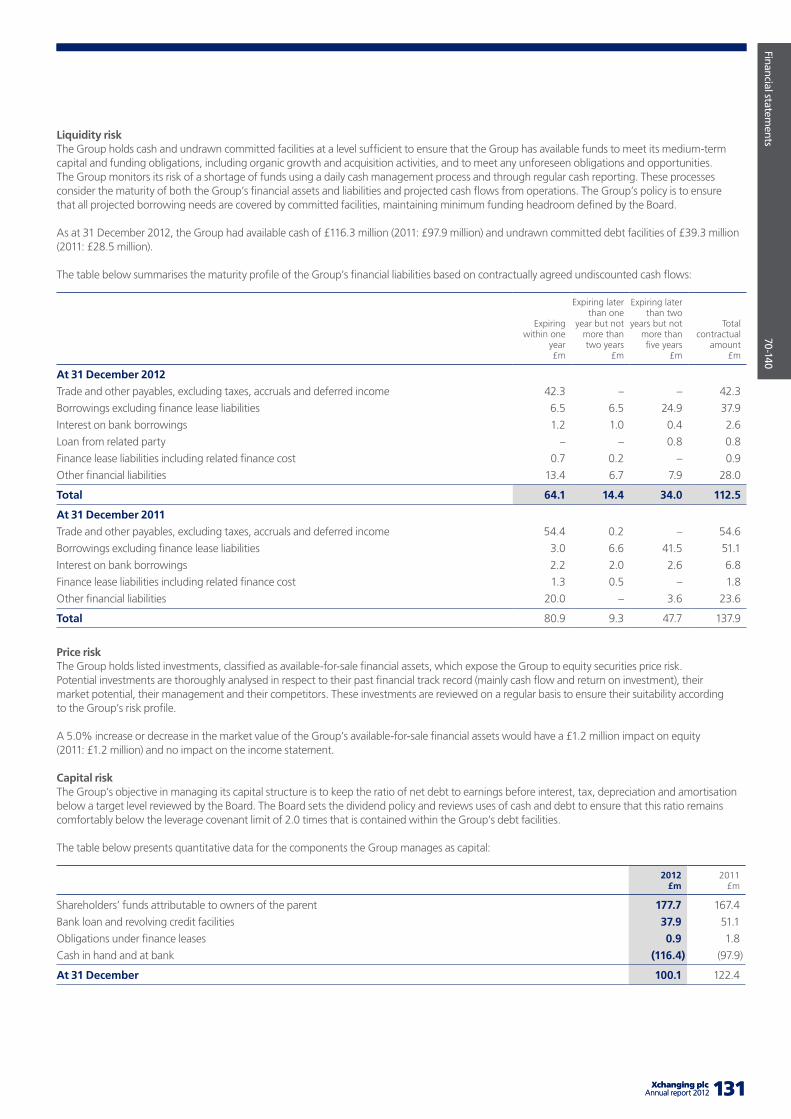
Company overview
X
X-X
X
131 Xchanging plcAnnual report 2012
Financial statements
70-140
131 Xchanging plcAnnual report 2012
Liquidity riskThe Group holds cash and undrawn committed facilities at a level sufficient to ensure that the Group has available funds to meet its medium-term capital and funding obligations, including organic growth and acquisition activities, and to meet any unforeseen obligations and opportunities. The Group monitors its risk of a shortage of funds using a daily cash management process and through regular cash reporting. These processes consider the maturity of both the Group’s financial assets and liabilities and projected cash flows from operations. The Group’s policy is to ensure that all projected borrowing needs are covered by committed facilities, maintaining minimum funding headroom defined by the Board.
As at 31 December 2012, the Group had available cash of £116.3 million (2011: £97.9 million) and undrawn committed debt facilities of £39.3 million (2011: £28.5 million).
The table below summarises the maturity profile of the Group’s financial liabilities based on contractually agreed undiscounted cash flows:
Expiring within one
year £m
Expiring later than one
year but not more than two years
£m
Expiring later than two
years but not more than five years
£m
Total contractual
amount £m
At 31 December 2012
Trade and other payables, excluding taxes, accruals and deferred income 42.3 – – 42.3
Borrowings excluding finance lease liabilities 6.5 6.5 24.9 37.9
Interest on bank borrowings 1.2 1.0 0.4 2.6
Loan from related party – – 0.8 0.8
Finance lease liabilities including related finance cost 0.7 0.2 – 0.9
Other financial liabilities 13.4 6.7 7.9 28.0
Total 64.1 14.4 34.0 112.5
At 31 December 2011
Trade and other payables, excluding taxes, accruals and deferred income 54.4 0.2 – 54.6
Borrowings excluding finance lease liabilities 3.0 6.6 41.5 51.1
Interest on bank borrowings 2.2 2.0 2.6 6.8
Finance lease liabilities including related finance cost 1.3 0.5 – 1.8
Other financial liabilities 20.0 – 3.6 23.6
Total 80.9 9.3 47.7 137.9
Price riskThe Group holds listed investments, classified as available-for-sale financial assets, which expose the Group to equity securities price risk. Potential investments are thoroughly analysed in respect to their past financial track record (mainly cash flow and return on investment), their market potential, their management and their competitors. These investments are reviewed on a regular basis to ensure their suitability according to the Group’s risk profile.
A 5.0% increase or decrease in the market value of the Group’s available-for-sale financial assets would have a £1.2 million impact on equity (2011: £1.2 million) and no impact on the income statement.
Capital risk The Group’s objective in managing its capital structure is to keep the ratio of net debt to earnings before interest, tax, depreciation and amortisation below a target level reviewed by the Board. The Board sets the dividend policy and reviews uses of cash and debt to ensure that this ratio remains comfortably below the leverage covenant limit of 2.0 times that is contained within the Group’s debt facilities.
The table below presents quantitative data for the components the Group manages as capital:
2012 £m
2011£m
Shareholders’ funds attributable to owners of the parent 177.7 167.4
Bank loan and revolving credit facilities 37.9 51.1
Obligations under finance leases 0.9 1.8
Cash in hand and at bank (116.4) (97.9)
At 31 December 100.1 122.4
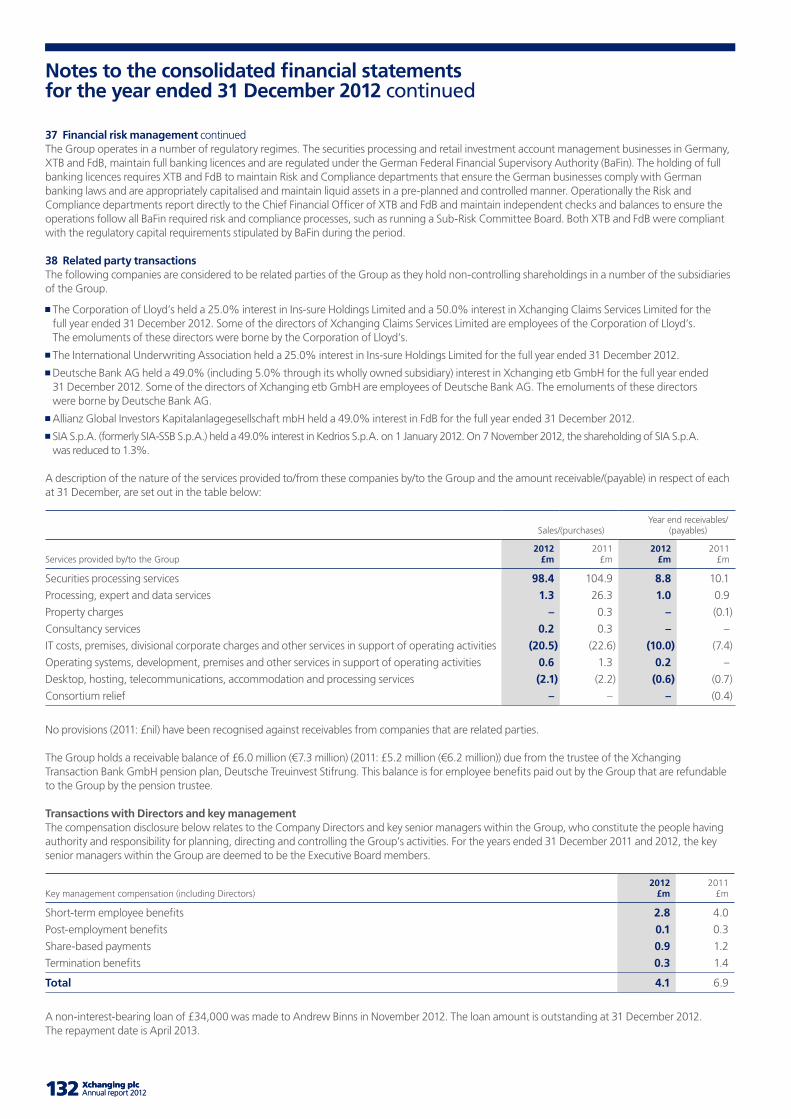
132 Xchanging plc Annual report 2012 133133132 Xchanging plc Annual report 2012 133
37 Financial risk management continuedThe Group operates in a number of regulatory regimes. The securities processing and retail investment account management businesses in Germany, XTB and FdB, maintain full banking licences and are regulated under the German Federal Financial Supervisory Authority (BaFin). The holding of full banking licences requires XTB and FdB to maintain Risk and Compliance departments that ensure the German businesses comply with German banking laws and are appropriately capitalised and maintain liquid assets in a pre-planned and controlled manner. Operationally the Risk and Compliance departments report directly to the Chief Financial Officer of XTB and FdB and maintain independent checks and balances to ensure the operations follow all BaFin required risk and compliance processes, such as running a Sub-Risk Committee Board. Both XTB and FdB were compliant with the regulatory capital requirements stipulated by BaFin during the period.
38 Related party transactionsThe following companies are considered to be related parties of the Group as they hold non-controlling shareholdings in a number of the subsidiaries of the Group.
The Corporation of Lloyd’s held a 25.0% interest in Ins-sure Holdings Limited and a 50.0% interest in Xchanging Claims Services Limited for the full year ended 31 December 2012. Some of the directors of Xchanging Claims Services Limited are employees of the Corporation of Lloyd’s. The emoluments of these directors were borne by the Corporation of Lloyd’s.
The International Underwriting Association held a 25.0% interest in Ins-sure Holdings Limited for the full year ended 31 December 2012.
Deutsche Bank AG held a 49.0% (including 5.0% through its wholly owned subsidiary) interest in Xchanging etb GmbH for the full year ended 31 December 2012. Some of the directors of Xchanging etb GmbH are employees of Deutsche Bank AG. The emoluments of these directors were borne by Deutsche Bank AG.
Allianz Global Investors Kapitalanlagegesellschaft mbH held a 49.0% interest in FdB for the full year ended 31 December 2012.
SIA S.p.A. (formerly SIA-SSB S.p.A.) held a 49.0% interest in Kedrios S.p.A. on 1 January 2012. On 7 November 2012, the shareholding of SIA S.p.A. was reduced to 1.3%.
A description of the nature of the services provided to/from these companies by/to the Group and the amount receivable/(payable) in respect of each at 31 December, are set out in the table below:
Sales/(purchases)Year end receivables/
(payables)
Services provided by/to the Group2012
£m2011
£m2012
£m2011
£m
Securities processing services 98.4 104.9 8.8 10.1
Processing, expert and data services 1.3 26.3 1.0 0.9
Property charges – 0.3 – (0.1)
Consultancy services 0.2 0.3 – –
IT costs, premises, divisional corporate charges and other services in support of operating activities (20.5) (22.6) (10.0) (7.4)
Operating systems, development, premises and other services in support of operating activities 0.6 1.3 0.2 –
Desktop, hosting, telecommunications, accommodation and processing services (2.1) (2.2) (0.6) (0.7)
Consortium relief – – – (0.4)
No provisions (2011: £nil) have been recognised against receivables from companies that are related parties.
The Group holds a receivable balance of £6.0 million (€7.3 million) (2011: £5.2 million (€6.2 million)) due from the trustee of the Xchanging Transaction Bank GmbH pension plan, Deutsche Treuinvest Stifrung. This balance is for employee benefits paid out by the Group that are refundable to the Group by the pension trustee.
Transactions with Directors and key managementThe compensation disclosure below relates to the Company Directors and key senior managers within the Group, who constitute the people having authority and responsibility for planning, directing and controlling the Group’s activities. For the years ended 31 December 2011 and 2012, the key senior managers within the Group are deemed to be the Executive Board members.
Key management compensation (including Directors)2012
£m2011
£m
Short-term employee benefits 2.8 4.0
Post-employment benefits 0.1 0.3
Share-based payments 0.9 1.2
Termination benefits 0.3 1.4
Total 4.1 6.9
A non-interest-bearing loan of £34,000 was made to Andrew Binns in November 2012. The loan amount is outstanding at 31 December 2012. The repayment date is April 2013.
Notes to the consolidated financial statements for the year ended 31 December 2012 continued
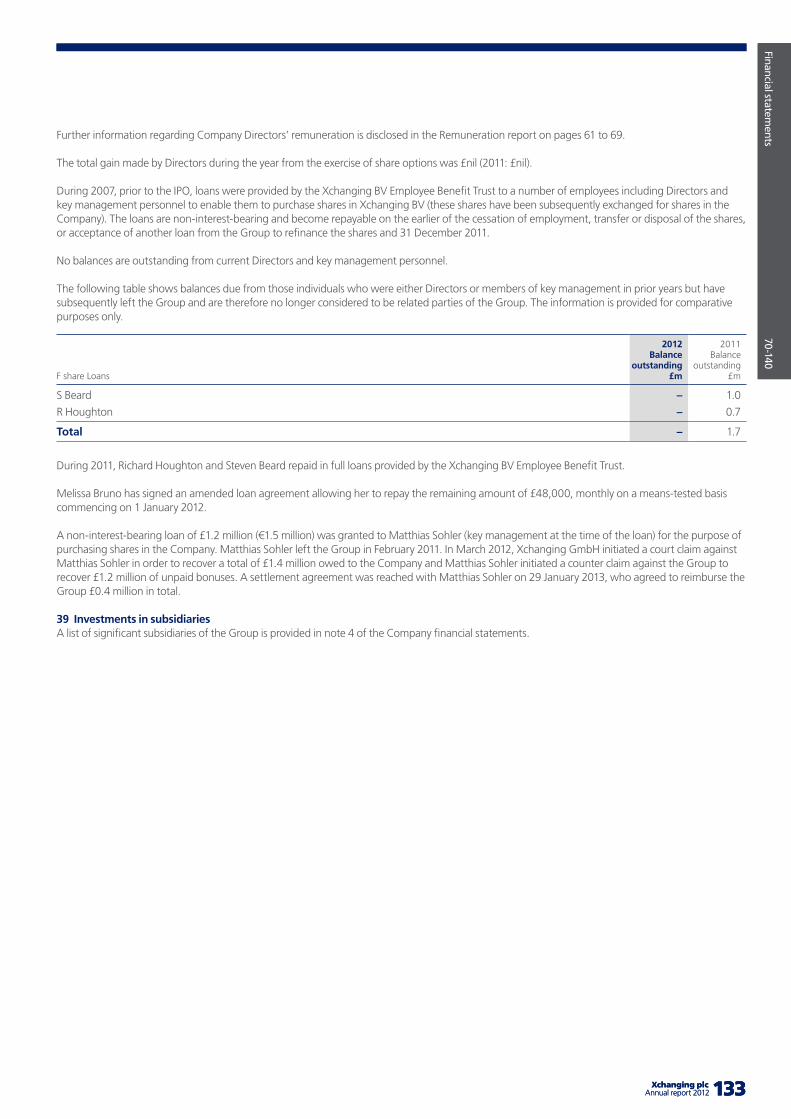
Company overview
X
X-X
X
133 Xchanging plcAnnual report 2012
Financial statements
70-140
133 Xchanging plcAnnual report 2012 133
Further information regarding Company Directors’ remuneration is disclosed in the Remuneration report on pages 61 to 69.
The total gain made by Directors during the year from the exercise of share options was £nil (2011: £nil).
During 2007, prior to the IPO, loans were provided by the Xchanging BV Employee Benefit Trust to a number of employees including Directors and key management personnel to enable them to purchase shares in Xchanging BV (these shares have been subsequently exchanged for shares in the Company). The loans are non-interest-bearing and become repayable on the earlier of the cessation of employment, transfer or disposal of the shares, or acceptance of another loan from the Group to refinance the shares and 31 December 2011.
No balances are outstanding from current Directors and key management personnel.
The following table shows balances due from those individuals who were either Directors or members of key management in prior years but have subsequently left the Group and are therefore no longer considered to be related parties of the Group. The information is provided for comparative purposes only.
F share Loans
2012 Balance
outstanding £m
2011 Balance
outstanding £m
S Beard – 1.0
R Houghton – 0.7
Total – 1.7
During 2011, Richard Houghton and Steven Beard repaid in full loans provided by the Xchanging BV Employee Benefit Trust.
Melissa Bruno has signed an amended loan agreement allowing her to repay the remaining amount of £48,000, monthly on a means-tested basis commencing on 1 January 2012.
A non-interest-bearing loan of £1.2 million (€1.5 million) was granted to Matthias Sohler (key management at the time of the loan) for the purpose of purchasing shares in the Company. Matthias Sohler left the Group in February 2011. In March 2012, Xchanging GmbH initiated a court claim against Matthias Sohler in order to recover a total of £1.4 million owed to the Company and Matthias Sohler initiated a counter claim against the Group to recover £1.2 million of unpaid bonuses. A settlement agreement was reached with Matthias Sohler on 29 January 2013, who agreed to reimburse the Group £0.4 million in total.
39 Investments in subsidiariesA list of significant subsidiaries of the Group is provided in note 4 of the Company financial statements.
134 Xchanging plc Annual report 2012 135134 Xchanging plc Annual report 2012 135
Independent auditors’ report to the members of Xchanging plc on the parent company financial statements
We have audited the Parent Company financial statements of Xchanging plc for the year ended 31 December 2012 which comprise the Company balance sheet, the Company cash flow statement, Reconciliation of operating loss to net cash inflow/(outflow) from operating activities and the related notes. The financial reporting framework that has been applied in their preparation is applicable law and United Kingdom Accounting Standards (United Kingdom Generally Accepted Accounting Practice).
Respective responsibilities of directors and auditors As explained more fully in the Statement of Directors’ responsibilities set out on page 52, the Directors are responsible for the preparation of the Parent Company financial statements and for being satisfied that they give a true and fair view. Our responsibility is to audit and express an opinion on the Parent Company financial statements in accordance with applicable law and International Standards on Auditing (UK and Ireland). Those standards require us to comply with the Auditing Practices Board’s Ethical Standards for Auditors.
This report, including the opinions, has been prepared for and only for the company’s members as a body in accordance with Chapter 3 of Part 16 of the Companies Act 2006 and for no other purpose. We do not, in giving these opinions, accept or assume responsibility for any other purpose or to any other person to whom this report is shown or into whose hands it may come save where expressly agreed by our prior consent in writing.
Scope of the audit of the financial statementsAn audit involves obtaining evidence about the amounts and disclosures in the financial statements sufficient to give reasonable assurance that the financial statements are free from material misstatement, whether caused by fraud or error. This includes an assessment of: whether the accounting policies are appropriate to the Parent Company’s circumstances and have been consistently applied and adequately disclosed; the reasonableness of significant accounting estimates made by the Directors; and the overall presentation of the financial statements. In addition, we read all the financial and non-financial information in the annual report to identify material inconsistencies with the audited financial statements. If we become aware of any apparent material misstatements or inconsistencies we consider the implications for our report.
Opinion on financial statements In our opinion the Parent Company financial statements: Give a true and fair view of the state of the Company’s affairs as at 31 December 2012 and of its cash flows for the year then ended;
Have been properly prepared in accordance with United Kingdom Generally Accepted Accounting Practice; and
Have been prepared in accordance with the requirements of the Companies Act 2006.
Opinion on other matters prescribed by the Companies Act 2006 In our opinion: The part of the Remuneration report to be audited has been properly prepared in accordance with the Companies Act 2006; and
The information given in the Directors’ report for the financial year for which the Parent Company financial statements are prepared is consistent with the Parent Company financial statements.
Matters on which we are required to report by exception We have nothing to report in respect of the following matters where the Companies Act 2006 requires us to report to you if, in our opinion: Adequate accounting records have not been kept by the Parent Company, or returns adequate for our audit have not been received from branches not visited by us; or
The Parent Company financial statements and the part of the Remuneration report to be audited are not in agreement with the accounting records and returns; or
Certain disclosures of Directors’ remuneration specified by law are not made; or
We have not received all the information and explanations we require for our audit.
Other matterWe have reported separately on the Group financial statements of Xchanging plc for the year ended 31 December 2012.
Paul Aitken (Senior Statutory Auditor)for and on behalf of PricewaterhouseCoopers LLPChartered Accountants and Statutory Auditors London
28 February 2013
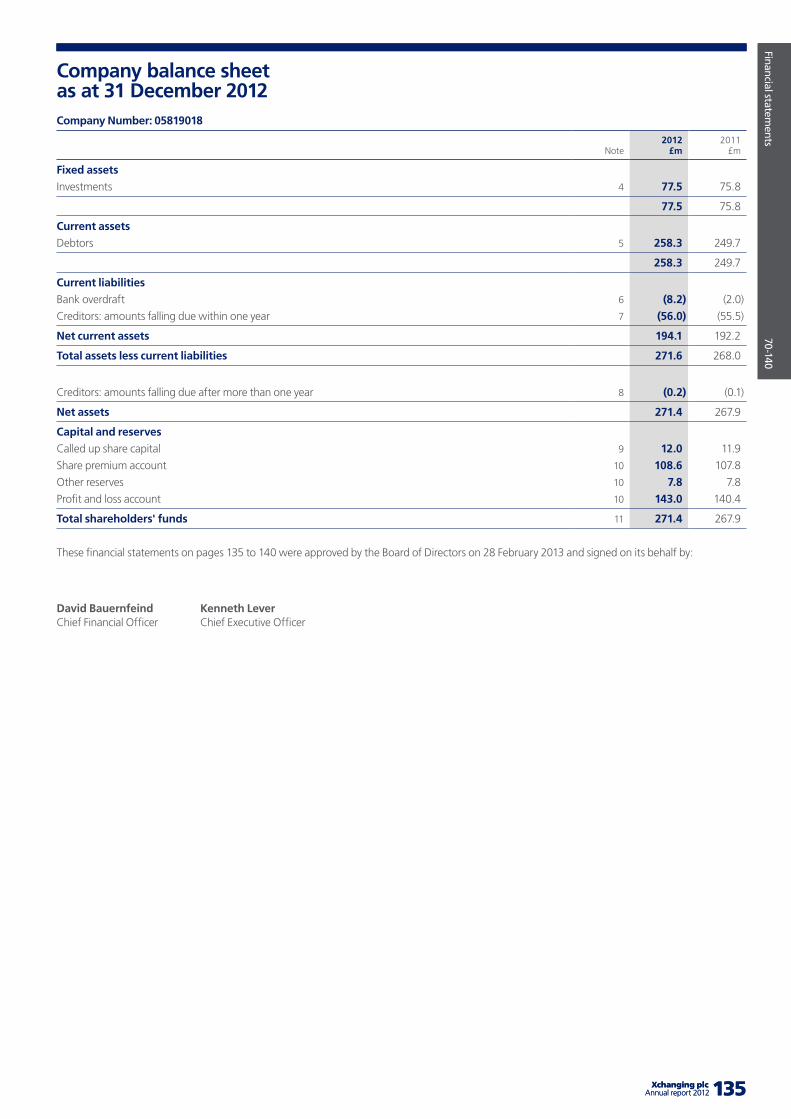
Company overview
X
X-X
X
135 Xchanging plcAnnual report 2012 135 Xchanging plcAnnual report 2012
Financial statements
70-140
Note2012
£m2011
£m
Fixed assets
Investments 4 77.5 75.8
77.5 75.8
Current assets
Debtors 5 258.3 249.7
258.3 249.7
Current liabilities
Bank overdraft 6 (8.2) (2.0)
Creditors: amounts falling due within one year 7 (56.0) (55.5)
Net current assets 194.1 192.2
Total assets less current liabilities 271.6 268.0
Creditors: amounts falling due after more than one year 8 (0.2) (0.1)
Net assets 271.4 267.9
Capital and reserves
Called up share capital 9 12.0 11.9
Share premium account 10 108.6 107.8
Other reserves 10 7.8 7.8
Profit and loss account 10 143.0 140.4
Total shareholders' funds 11 271.4 267.9
These financial statements on pages 135 to 140 were approved by the Board of Directors on 28 February 2013 and signed on its behalf by:
David Bauernfeind Kenneth Lever Chief Financial Officer Chief Executive Officer
Company balance sheet as at 31 December 2012Company Number: 05819018
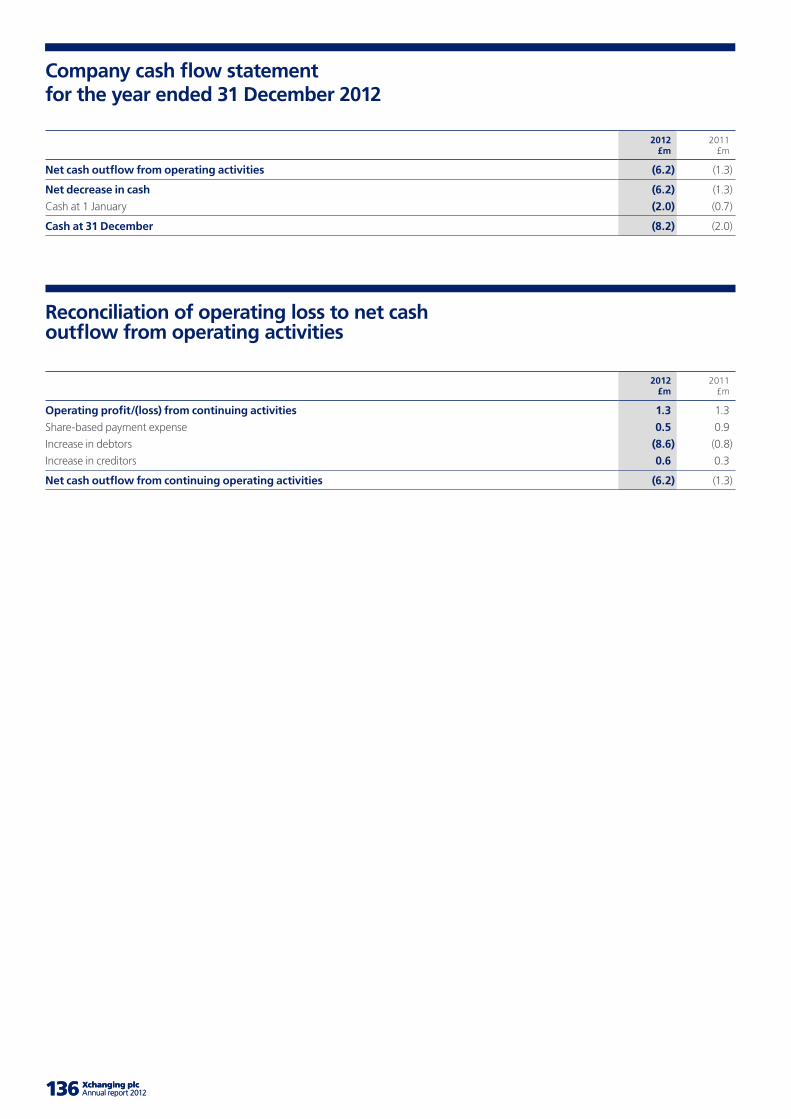
136 Xchanging plc Annual report 2012 137136 Xchanging plc Annual report 2012 137
2012 £m
2011£m
Net cash outflow from operating activities (6.2) (1.3)
Net decrease in cash (6.2) (1.3)
Cash at 1 January (2.0) (0.7)
Cash at 31 December (8.2) (2.0)
Reconciliation of operating loss to net cash outflow from operating activities
2012 £m
2011£m
Operating profit/(loss) from continuing activities 1.3 1.3
Share-based payment expense 0.5 0.9
Increase in debtors (8.6) (0.8)
Increase in creditors 0.6 0.3
Net cash outflow from continuing operating activities (6.2) (1.3)
Company cash flow statementfor the year ended 31 December 2012
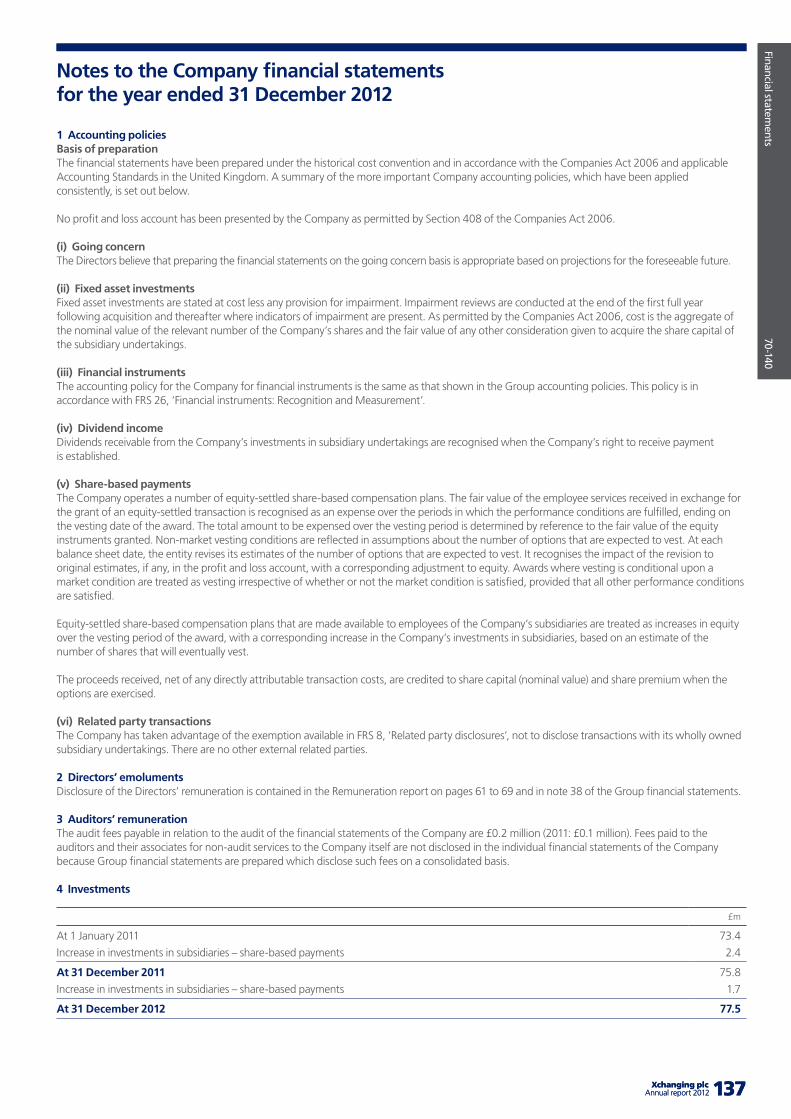
Company overview
X
X-X
X
137 Xchanging plcAnnual report 2012 137 Xchanging plcAnnual report 2012
Financial statements
70-140
1 Accounting policiesBasis of preparationThe financial statements have been prepared under the historical cost convention and in accordance with the Companies Act 2006 and applicable Accounting Standards in the United Kingdom. A summary of the more important Company accounting policies, which have been applied consistently, is set out below.
No profit and loss account has been presented by the Company as permitted by Section 408 of the Companies Act 2006.
(i) Going concernThe Directors believe that preparing the financial statements on the going concern basis is appropriate based on projections for the foreseeable future.
(ii) Fixed asset investmentsFixed asset investments are stated at cost less any provision for impairment. Impairment reviews are conducted at the end of the first full year following acquisition and thereafter where indicators of impairment are present. As permitted by the Companies Act 2006, cost is the aggregate of the nominal value of the relevant number of the Company’s shares and the fair value of any other consideration given to acquire the share capital of the subsidiary undertakings.
(iii) Financial instrumentsThe accounting policy for the Company for financial instruments is the same as that shown in the Group accounting policies. This policy is in accordance with FRS 26, ‘Financial instruments: Recognition and Measurement’.
(iv) Dividend incomeDividends receivable from the Company’s investments in subsidiary undertakings are recognised when the Company’s right to receive payment is established.
(v) Share-based paymentsThe Company operates a number of equity-settled share-based compensation plans. The fair value of the employee services received in exchange for the grant of an equity-settled transaction is recognised as an expense over the periods in which the performance conditions are fulfilled, ending on the vesting date of the award. The total amount to be expensed over the vesting period is determined by reference to the fair value of the equity instruments granted. Non-market vesting conditions are reflected in assumptions about the number of options that are expected to vest. At each balance sheet date, the entity revises its estimates of the number of options that are expected to vest. It recognises the impact of the revision to original estimates, if any, in the profit and loss account, with a corresponding adjustment to equity. Awards where vesting is conditional upon a market condition are treated as vesting irrespective of whether or not the market condition is satisfied, provided that all other performance conditions are satisfied.
Equity-settled share-based compensation plans that are made available to employees of the Company’s subsidiaries are treated as increases in equity over the vesting period of the award, with a corresponding increase in the Company’s investments in subsidiaries, based on an estimate of the number of shares that will eventually vest.
The proceeds received, net of any directly attributable transaction costs, are credited to share capital (nominal value) and share premium when the options are exercised.
(vi) Related party transactionsThe Company has taken advantage of the exemption available in FRS 8, ‘Related party disclosures’, not to disclose transactions with its wholly owned subsidiary undertakings. There are no other external related parties.
2 Directors’ emolumentsDisclosure of the Directors’ remuneration is contained in the Remuneration report on pages 61 to 69 and in note 38 of the Group financial statements.
3 Auditors’ remunerationThe audit fees payable in relation to the audit of the financial statements of the Company are £0.2 million (2011: £0.1 million). Fees paid to the auditors and their associates for non-audit services to the Company itself are not disclosed in the individual financial statements of the Company because Group financial statements are prepared which disclose such fees on a consolidated basis.
4 Investments
£m
At 1 January 2011 73.4
Increase in investments in subsidiaries – share-based payments 2.4
At 31 December 2011 75.8
Increase in investments in subsidiaries – share-based payments 1.7
At 31 December 2012 77.5
Notes to the Company financial statementsfor the year ended 31 December 2012
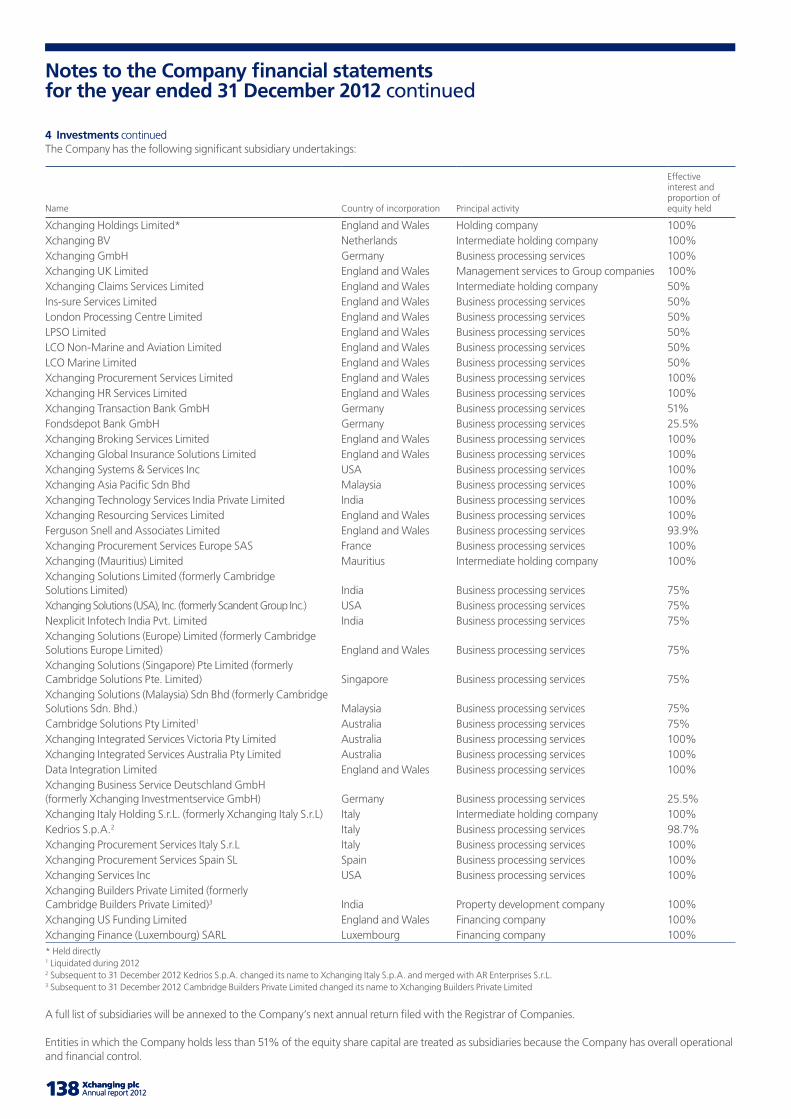
138 Xchanging plc Annual report 2012 139138 Xchanging plc Annual report 2012 139
Notes to the Company financial statements for the year ended 31 December 2012 continued
4 Investments continuedThe Company has the following significant subsidiary undertakings:
Name Country of incorporation Principal activity
Effective interest and proportion of equity held
Xchanging Holdings Limited* England and Wales Holding company 100%Xchanging BV Netherlands Intermediate holding company 100%Xchanging GmbH Germany Business processing services 100%Xchanging UK Limited England and Wales Management services to Group companies 100%Xchanging Claims Services Limited England and Wales Intermediate holding company 50%Ins-sure Services Limited England and Wales Business processing services 50%London Processing Centre Limited England and Wales Business processing services 50%LPSO Limited England and Wales Business processing services 50%LCO Non-Marine and Aviation Limited England and Wales Business processing services 50%LCO Marine Limited England and Wales Business processing services 50%Xchanging Procurement Services Limited England and Wales Business processing services 100%Xchanging HR Services Limited England and Wales Business processing services 100%Xchanging Transaction Bank GmbH Germany Business processing services 51%Fondsdepot Bank GmbH Germany Business processing services 25.5%Xchanging Broking Services Limited England and Wales Business processing services 100%Xchanging Global Insurance Solutions Limited England and Wales Business processing services 100%Xchanging Systems & Services Inc USA Business processing services 100%Xchanging Asia Pacific Sdn Bhd Malaysia Business processing services 100%Xchanging Technology Services India Private Limited India Business processing services 100%Xchanging Resourcing Services Limited England and Wales Business processing services 100%Ferguson Snell and Associates Limited England and Wales Business processing services 93.9%Xchanging Procurement Services Europe SAS France Business processing services 100%Xchanging (Mauritius) Limited Mauritius Intermediate holding company 100%Xchanging Solutions Limited (formerly Cambridge Solutions Limited) India Business processing services 75%Xchanging Solutions (USA), Inc. (formerly Scandent Group Inc.) USA Business processing services 75%Nexplicit Infotech India Pvt. Limited India Business processing services 75%Xchanging Solutions (Europe) Limited (formerly Cambridge Solutions Europe Limited) England and Wales Business processing services 75%Xchanging Solutions (Singapore) Pte Limited (formerly Cambridge Solutions Pte. Limited) Singapore Business processing services 75%Xchanging Solutions (Malaysia) Sdn Bhd (formerly Cambridge Solutions Sdn. Bhd.) Malaysia Business processing services 75%Cambridge Solutions Pty Limited1 Australia Business processing services 75%Xchanging Integrated Services Victoria Pty Limited Australia Business processing services 100%Xchanging Integrated Services Australia Pty Limited Australia Business processing services 100%Data Integration Limited England and Wales Business processing services 100%Xchanging Business Service Deutschland GmbH (formerly Xchanging Investmentservice GmbH) Germany Business processing services 25.5%Xchanging Italy Holding S.r.L. (formerly Xchanging Italy S.r.L) Italy Intermediate holding company 100%Kedrios S.p.A.2 Italy Business processing services 98.7%Xchanging Procurement Services Italy S.r.L Italy Business processing services 100%Xchanging Procurement Services Spain SL Spain Business processing services 100%Xchanging Services Inc USA Business processing services 100%Xchanging Builders Private Limited (formerly Cambridge Builders Private Limited)3 India Property development company 100%Xchanging US Funding Limited England and Wales Financing company 100%Xchanging Finance (Luxembourg) SARL Luxembourg Financing company 100%* Held directly 1 Liquidated during 2012 2 Subsequent to 31 December 2012 Kedrios S.p.A. changed its name to Xchanging Italy S.p.A. and merged with AR Enterprises S.r.L. 3 Subsequent to 31 December 2012 Cambridge Builders Private Limited changed its name to Xchanging Builders Private Limited
A full list of subsidiaries will be annexed to the Company’s next annual return filed with the Registrar of Companies.
Entities in which the Company holds less than 51% of the equity share capital are treated as subsidiaries because the Company has overall operational and financial control.
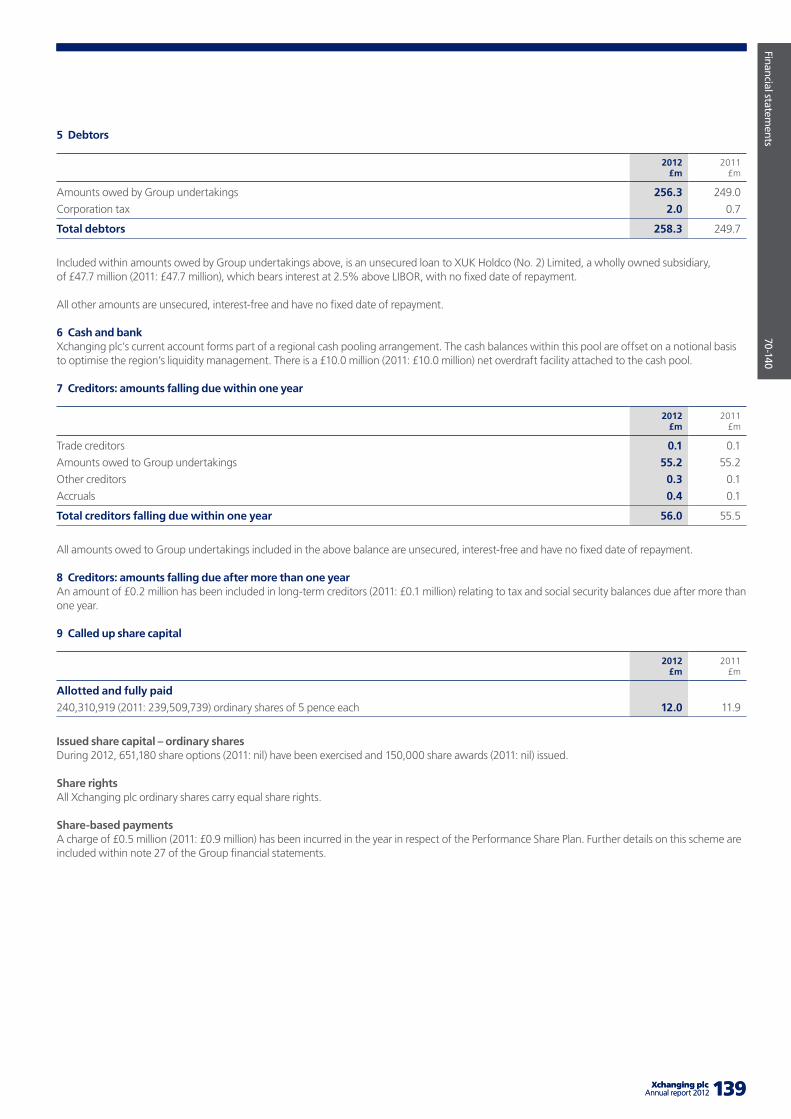
Company overview
X
X-X
X
139 Xchanging plcAnnual report 2012 139 Xchanging plcAnnual report 2012
Financial statements
70-140
5 Debtors
2012 £m
2011£m
Amounts owed by Group undertakings 256.3 249.0
Corporation tax 2.0 0.7
Total debtors 258.3 249.7
Included within amounts owed by Group undertakings above, is an unsecured loan to XUK Holdco (No. 2) Limited, a wholly owned subsidiary, of £47.7 million (2011: £47.7 million), which bears interest at 2.5% above LIBOR, with no fixed date of repayment.
All other amounts are unsecured, interest-free and have no fixed date of repayment.
6 Cash and bankXchanging plc’s current account forms part of a regional cash pooling arrangement. The cash balances within this pool are offset on a notional basis to optimise the region’s liquidity management. There is a £10.0 million (2011: £10.0 million) net overdraft facility attached to the cash pool.
7 Creditors: amounts falling due within one year
2012 £m
2011£m
Trade creditors 0.1 0.1
Amounts owed to Group undertakings 55.2 55.2
Other creditors 0.3 0.1
Accruals 0.4 0.1
Total creditors falling due within one year 56.0 55.5
All amounts owed to Group undertakings included in the above balance are unsecured, interest-free and have no fixed date of repayment.
8 Creditors: amounts falling due after more than one yearAn amount of £0.2 million has been included in long-term creditors (2011: £0.1 million) relating to tax and social security balances due after more than one year.
9 Called up share capital
2012 £m
2011£m
Allotted and fully paid
240,310,919 (2011: 239,509,739) ordinary shares of 5 pence each 12.0 11.9
Issued share capital – ordinary sharesDuring 2012, 651,180 share options (2011: nil) have been exercised and 150,000 share awards (2011: nil) issued.
Share rightsAll Xchanging plc ordinary shares carry equal share rights.
Share-based paymentsA charge of £0.5 million (2011: £0.9 million) has been incurred in the year in respect of the Performance Share Plan. Further details on this scheme are included within note 27 of the Group financial statements.
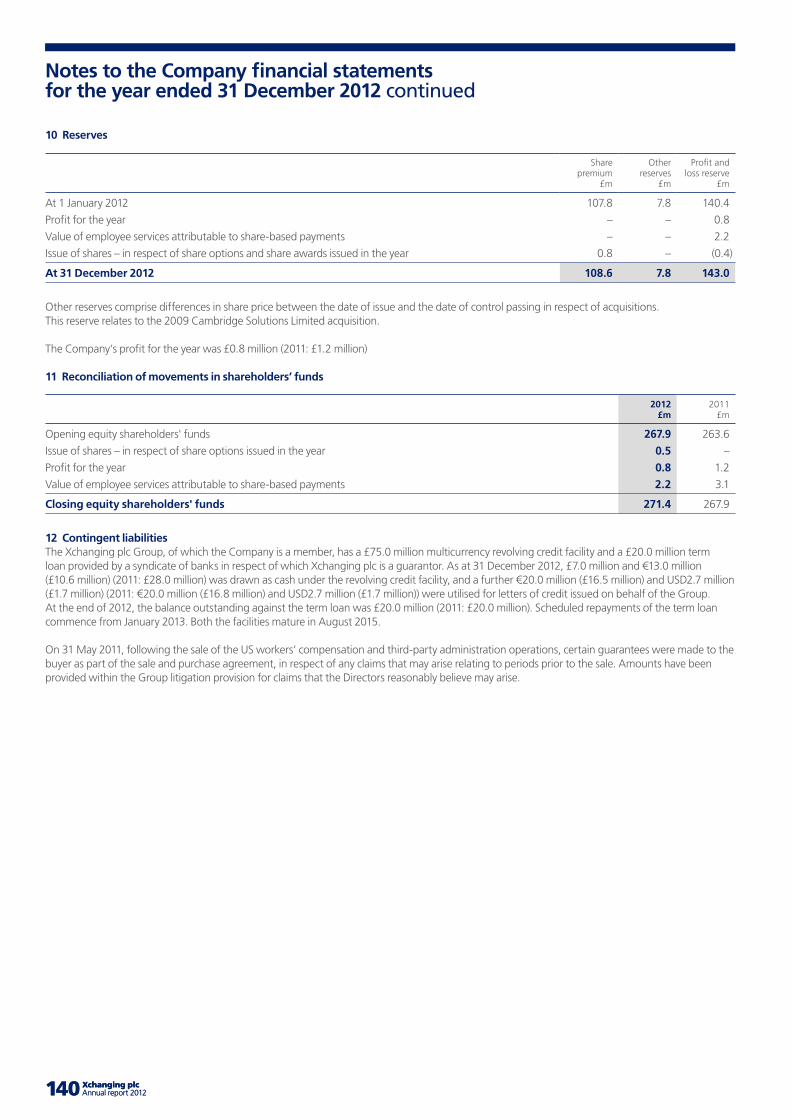
140 Xchanging plc Annual report 2012 141141140 Xchanging plc Annual report 2012 141
Notes to the Company financial statements for the year ended 31 December 2012 continued
10 Reserves
Share premium
£m
Other reserves
£m
Profit and loss reserve
£m
At 1 January 2012 107.8 7.8 140.4
Profit for the year – – 0.8
Value of employee services attributable to share-based payments – – 2.2
Issue of shares – in respect of share options and share awards issued in the year 0.8 – (0.4)
At 31 December 2012 108.6 7.8 143.0
Other reserves comprise differences in share price between the date of issue and the date of control passing in respect of acquisitions. This reserve relates to the 2009 Cambridge Solutions Limited acquisition.
The Company’s profit for the year was £0.8 million (2011: £1.2 million)
11 Reconciliation of movements in shareholders’ funds
2012 £m
2011£m
Opening equity shareholders' funds 267.9 263.6
Issue of shares – in respect of share options issued in the year 0.5 –
Profit for the year 0.8 1.2
Value of employee services attributable to share-based payments 2.2 3.1
Closing equity shareholders' funds 271.4 267.9
12 Contingent liabilitiesThe Xchanging plc Group, of which the Company is a member, has a £75.0 million multicurrency revolving credit facility and a £20.0 million term loan provided by a syndicate of banks in respect of which Xchanging plc is a guarantor. As at 31 December 2012, £7.0 million and €13.0 million (£10.6 million) (2011: £28.0 million) was drawn as cash under the revolving credit facility, and a further €20.0 million (£16.5 million) and USD2.7 million (£1.7 million) (2011: €20.0 million (£16.8 million) and USD2.7 million (£1.7 million)) were utilised for letters of credit issued on behalf of the Group. At the end of 2012, the balance outstanding against the term loan was £20.0 million (2011: £20.0 million). Scheduled repayments of the term loan commence from January 2013. Both the facilities mature in August 2015.
On 31 May 2011, following the sale of the US workers’ compensation and third-party administration operations, certain guarantees were made to the buyer as part of the sale and purchase agreement, in respect of any claims that may arise relating to periods prior to the sale. Amounts have been provided within the Group litigation provision for claims that the Directors reasonably believe may arise.
Company overview
X
X-X
X
141 Xchanging plcAnnual report 2012 141 Xchanging plcAnnual report 2012 141
Shareholder information
Other inform
ation 141-143
Share price informationThe Company’s share price can be found on the Company’s corporate website at www.xchanging.com within the Investor Relations section.
Shares onlineEquiniti Limited provides a range of shareholder information online. Shareholders can access their shareholdings and find advice on transferring shares and updating their details on www.shareview.co.uk
ShareGiftShareholders who only have a small number of shares whose value makes it uneconomic to sell them may wish to consider donating them to charity through ShareGift, the independent charity share donation scheme (registered charity no. 1052686). Further information about ShareGift may be obtained from Equiniti Limited or from ShareGift on +44 (0)20 7337 0501 or at www.sharegift.org. There are no implications for capital gains tax purposes (no gain or loss) on gifts of shares to charity and it is also possible to claim income tax relief.
Shareholder enquiriesFor queries concerning shareholdings, contact Xchanging’s registrars, Equiniti Limited, whose details are below.
Shareholders who have any questions about the Group’s business should contact Xchanging’s Investor Relations team on +44 (0)20 7780 6999 or email [email protected]
Shareholder fraudFraud is on the increase and many shareholders are targeted every year. If you have any reason to believe that you may have been the target of a fraud, or attempted fraud in relation to your shareholding, please contact Equiniti Limited immediately.
Company registration number5819018
Company’s registered officeXchanging plc 34 Leadenhall Street London EC3A 1AX United Kingdom
Registrars Equiniti Limited Aspect House Spencer Road Lancing West Sussex BN99 6DA United Kingdom Telephone: +44 (0)871 384 2030 Overseas tel: +44 (0)121 415 7047
The helpline is open from 8.30 am Monday to Friday. UK calls to 0871 numbers are charged at 8 pence per minute from a BT landline and other telephone providers’ costs may vary.
AuditorsPricewaterhouseCoopers LLP 1 Embankment Place London WC2N 6RH United Kingdom Tel: +44 (0)20 7583 5000
BankersLloyds TSB Bank plc City Office Gillingham PO Box 72 Bailey Drive Gillingham Business Park Kent ME8 0LS United Kingdom
Corporate brokersCitigroup Citigroup Centre Canada Square London E14 5LB United Kingdom Tel: +44 (0)20 7986 4000 Fax: +44 (0)20 7986 2266
Espirito Santo 10 Paternoster Square London EC4M 7AL Tel: +44 (0)20 7456 9191 Fax: +44 (0)20 7456 9189
Financial public relationsThe Maitland Consultancy Limited Orion House 5 Upper St. Martin’s Lane London WC2H 9EA Tel: +44 20 7379 5151 Fax: +44 20 7379 6161
Financial calendar15 May 2013 Annual General Meeting 30 June 2013 Half year end 31 July 2013 Announcement of half-year results 31 December 2013 Financial year end
142 Xchanging plc Annual report 2012 143
Glossary of terms
AAGI – Allianz Global Investors Kapitalanlagesellschaft mbH.AGM – Annual General Meeting.Adjusted operating profit – excludes exceptional items, amortisation of intangible assets previously unrecognised by an acquired entity, acquisition costs, and non-recurring operational items that the Directors believe will aid the reader’s understanding of the accounts.Adjusted earnings per share – Xchanging’s share of adjusted profit for the year divided by the weighted average basic number of Xchanging plc shares in issue for the year ended 31 December.AR – AR Enterprises S.r.L.Articles or Articles of Association – the Articles of association of Xchanging plc.
BBaFin – German Federal Financial Supervisory Authority overseeing banking, insurance, securities and asset management.Board of Directors – the Board of Directors of Xchanging plc, comprising Geoff Unwin, Ken Lever, David Bauernfeind, Michel Paulin, Bill Thomas, Stephen Wilson, Saurabh Srivastava and Ian Cormack. BPaaS – Business processing as a ServiceBPO – Business Process Outsourcing.BPS – Business Processing Services.
CCAD – Computer-aided design.CAM – Computer-aided manufacturing.CAGR – compound annual growth rate. Cambridge – Cambridge Solutions Limited has been renamed as Xchanging Solutions Limited.Cash conversion – is calculated as operating cash flow divided by adjusted operating profit.Cedent – A party to an insurance contract who passes financial obligation for certain potential losses to the insurer.CEO – Chief Executive Officer.CFO – Chief Financial Officer.CLASS – Claims Loss Advice and Settlement System.Cloud computing – is the provision of fully managed consumption-based services over high speed internet infrastructure.CO
2e – equivalent carbon dioxide.Combined Code – the Combined Code published in June 2008 by the Financial Reporting Council. Company – Xchanging plc.CRM system – customer relationship management system.CSR – Corporate Social Responsibility.CTA – Contractual Trust Arrangement.
DDI – Data Integration Limited, one of the UK’s leading networking, security and communication technology providers, acquired by Xchanging in June 2010.DB – Deutsche Bank AG.Directors – the Board of Directors of Xchanging plc, comprising Geoff Unwin, Ken Lever, David Bauernfeind, Michel Paulin, Bill Thomas, Stephen Wilson, Saurabh Srivastava and Ian Cormack. Disclosure and Transparency Rules – the disclosure and transparency rules of the UK Listing Authority. EEBIT – see adjusted operating profit.EBITDA – adjusted operating profit before depreciation and amortisation.Economic profit – Adjusted operating profit less a charge for tax and a charge for cost of invested capital.EdW – Entschädigungseinrichtung derWertpapierhandelsunternehmen.EP – Enterprise Partnership, a corporate partnership between Xchanging and a customer.ESG – Employee, Social and Governance.ESOP – Executive Share Option Plan.EU – European Union.Executive Board – the Executive Board of Xchanging are listed on pages 48 to 49.
FFdB – Fondsdepot Bank GmbH, an EP between Xchanging and AGI in Germany.FRS – Financial Reporting Standards.FSA – Financial Services Authority. FSB – FondsServiceBank GmbH.Four Part Action Plan – Xchanging’s Four Part Action Plan developed in 2011 includes performing a strategic and intrinsic value review, generating operational improvements, revenue growth and cash flow funding structure.
GGPO – Gainshare Procurement Outsourcing model.Group – Xchanging plc and its subsidiaries and subsidiary undertakings.
HHR – Human resources.
IIaaS – Infrastructure as a Service.IAS – International Accounting Standards. IFRIC – International Financial Reporting Interpretations Committee.IFRS – International Financial Reporting Standards.IMR – Insurers’ Market Repository.IP – intellectual property.IPO – initial public offering.IRIS – International Insurance and Reinsurance Solution.IT – information technology.ITIL – information technology infrastructure library.ITO – information technology outsourcing.IUA – International Underwriting Association of London is the world’s largest representative organisation for international and wholesale insurance and reinsurance companies.
JJV – Joint venture.
KKedrios – Kedrios S.p.A., representing the partnership between Xchanging and SIA S.p.A. in Italy.KPI – key performance indicator.
LLCH – London’s Clearing House.The Leading Edge Programme – Xchanging’s HR initiative which selects employees from each region and business to develop into the Company’s future executives.LME – London Metal Exchange.London insurance market – comprises insurance and reinsurance companies, Lloyd’s syndicates, P & I clubs, and brokers with the core of its activity being the conduct of internationally traded insurance and reinsurance business.LMA – London Market Association provides professional, technical support to the Lloyd’s underwriting community and represents their interests.
NNearshore – near to the customer’s premises, typically in a cheaper region of the same country.Non-executive Directors – the Non-executive Directors of Xchanging are listed on pages 46 to 47.
143 Xchanging plcAnnual report 2012
Other inform
ation 141-143
OOffshore – another country or region where costs are lower. On-site – where Xchanging operations are located at the customer’s site.Operating cash flow – is calculated as operating profit (EBIT) plus non-cash items and working capital movements less capital expenditure and dividends to non-controlling interests.OTC – over the counter.
PPaaS– Platform as a Service.PSP – Performance Share Plan.PwC – PricewaterhouseCoopers.
RRevenue visibility – recurring revenue comprising three components: annuity, volume at risk and renewals.RFP – Request for Proposals.RPI – Retail Price Index.
SSaaS – Software as a Service.SDF – service delivery framework.SEE – social, ethical and environmental.SIA S.p.A. – formerly SIA-SSB S.p.A. A European financial and payment systems services provider and Xchanging’s partner in the Kedrios partnership. Six Sigma – a process optimisation methodology, which seeks to improve outputs through eliminating errors and variance.Solvency II – the updated set of regulatory requirements for insurance firms operating in the European Union, effective 1 January 2013.Special Economic Zone – a region within a country where economic growth is promoted through local economic and legal incentives.SPP – Share Purchase Plan.SWIFT – Society for Worldwide Interbank Financial Telecommunication. TTESA – The Electronics Securities Architecture, our proprietary trading software.TPA – Third party adviser.TRC – Treasury Risk Committee.TSR – Total shareholder return.
UUK Corporate Governance Code – the UK Corporate Governance Code published in June 2010 by the Financial Reporting Council.UK Critical National Infrastructure – The national infrastructure comprises the facilities, systems, sites and networks necessary for the delivery of the essential services upon which daily life in the UK depends.UK GAAP – UK Generally Accepted Accounting Practice.
XXBS – Xchanging Broking Services Limited. Xchanging – Xchanging plc and its subsidiaries and subsidiary undertakings.Xchanging Italy S.p.A. – An Xchanging company comprised of Kedrios and AR formed on 1 February 2013.Xchanging Malaysia Sdn. Bhd. – Joint venture with YTL Communications.XIS – Ins-sure Holdings Limited, an EP between Xchanging, Lloyd’s of London and the International Underwriting Association in the UK.XMB – Xchanging Management Board.XPC – Xchanging Performance Committee.XTB – Xchanging Transaction Bank GmbH, an EP between Xchanging, Deutsche Bank and Sal Oppenheim in Germany. XTS – Xchanging Technology Services, Xchanging’s technology businesses in the UK.Xuber – Xchanging’s Insurance software business.
YYTL – YTL Communications Sdn. Bhd. of Malaysia, a subsidiary of YTL Power International Berhad, and joint venture partner with Xchanging in Xchanging Malaysia Sdn. Bhd.

144 Xchanging plc Annual report 2012
Notes

Designed and produced by MerchantCantos www.merchantcantos.com
Printed by Pureprint Group using their environmental print technology, a guaranteed, low carbon, low waste, independently audited process that reduces the environmental impact of the printing process. Pureprint Group is a CarbonNeutral® company and is certified to Environmental Management System, ISO 14001 and registered to EMAS, the Eco Management and Audit Scheme.
This report is printed utilising vegetable based inks on Heaven 42, which is sourced from well managed forests independently certified according to the rules of the Forest Stewardship Council.
Xchanging34 Leadenhall StreetLondonEC3A 1AXUK
T: +44 20 7780 6999F: +44 20 7780 6998
Registered in England and Wales company number 5819018
Foundations for growth
Fou
nd
ation
s for grow
th Xch
ang
ing A
nn
ual rep
ort 2012
Annual report 2012