FOSSIL FUELS IN THE TRANSITION - Division on Earth and Life Studies
59
FOSSIL FUELS IN THE TRANSITION Gene Whitney, Ph.D. Energy Section Research Manager October 12, 2009 Presented to the Board on Earth Sciences and Resources National Research Council of the National Academies Thanks to Dr. Paul Parfomak, Larry Parker, and Brent Yacobucci on whose work some of this talk is based.
Transcript of FOSSIL FUELS IN THE TRANSITION - Division on Earth and Life Studies
FOSSIL FUELS IN THE TRANSITION
Gene Whitney, Ph.D.Energy Section Research Manager
October 12, 2009
Presented to the Board on Earth Sciences and ResourcesNational Research Council of the National Academies
Thanks to Dr. Paul Parfomak, Larry Parker, and Brent Yacobucci on whose work some of this talk is based.
CRS-2
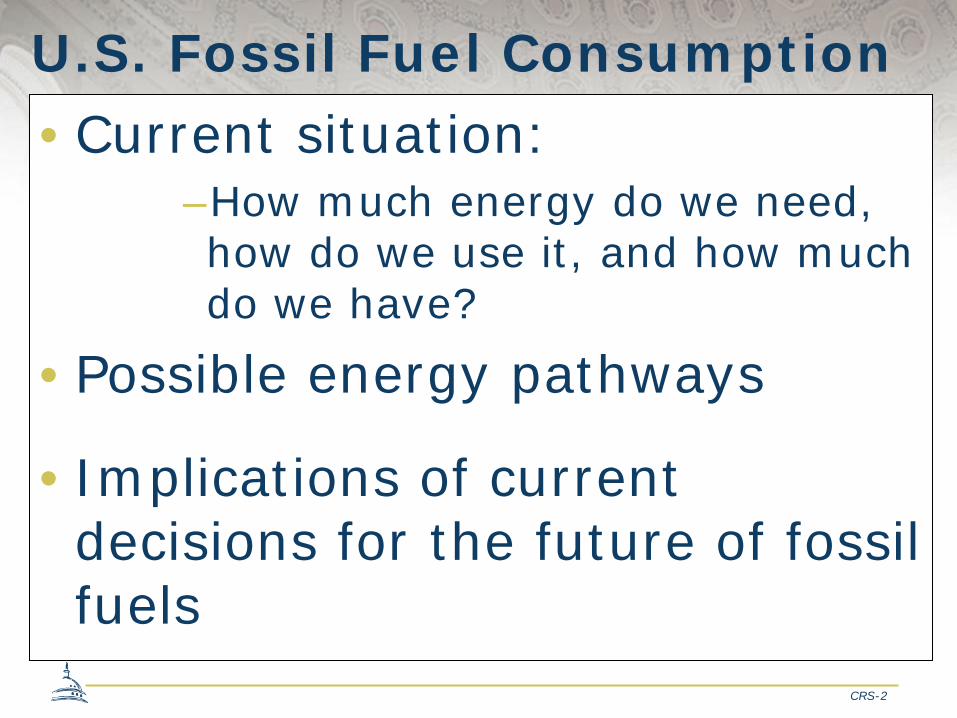
U.S. Fossil Fuel Consumption
•Current situation: –How much energy do we need, how do we use it, and how much do we have?
•Possible energy pathways
•Implications of current decisions for the future of fossil fuels

CRS-3
U.S. Total Energy and Renewable Energy Consumption by Source 2007
EIA, Annual Energy Review 2007
Nuclear electric
84% of U.S. energy comes from fossil fuels
CRS-4
U.S. Fossil Fuel Consumption
•How much do we use?

Energy Flow, 2008(Quadrillion Btu)
EIA Annual Energy Review 2008 http://www eia doe gov/aer/pdf/pages/sec1 3 pdf
Coal 22.42
Natural Gas 23.84
Petroleum 37.14
Nuclear electric 8.46
Renewable energy 7.30

CRS-6
Primary Energy Consumption by Source and Sector, 2008(Quadrillion Btu)
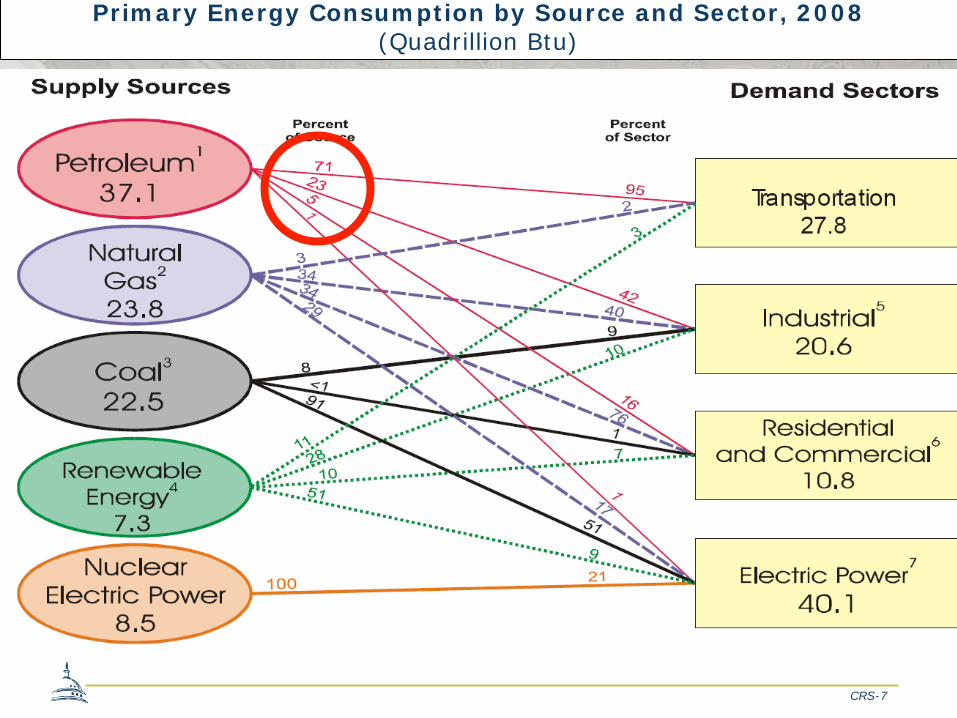
CRS-7
Primary Energy Consumption by Source and Sector, 2008(Quadrillion Btu)
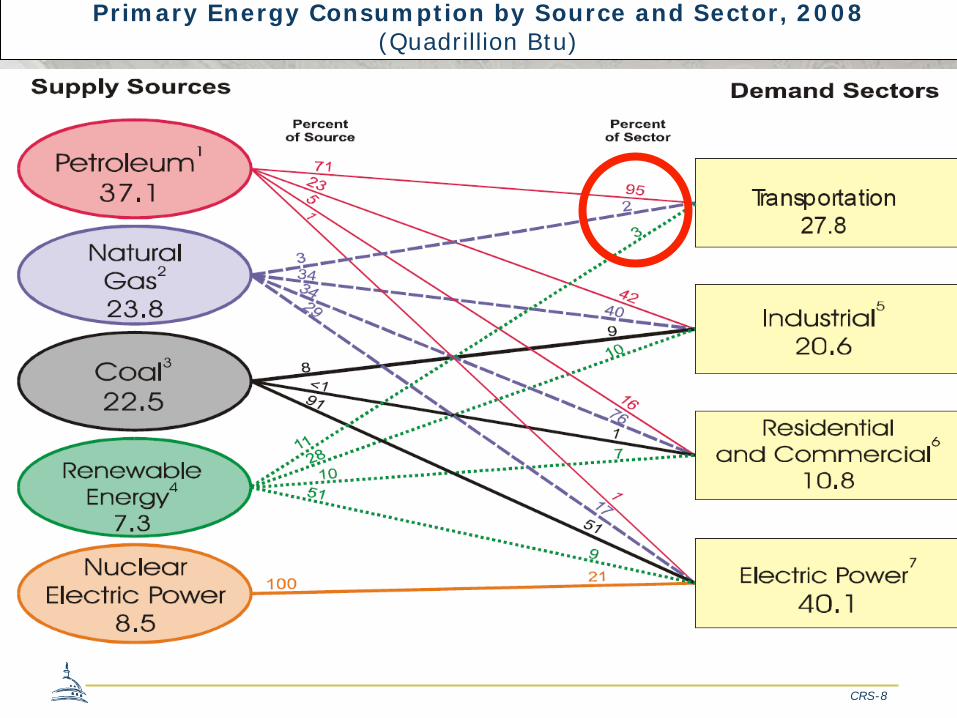
CRS-8
Primary Energy Consumption by Source and Sector, 2008(Quadrillion Btu)

CRS-9
Primary Energy Consumption by Source and Sector, 2008(Quadrillion Btu)

CRS-10
Primary Energy Consumption by Source and Sector, 2008(Quadrillion Btu)

CRS-11
Primary Energy Consumption by Source and Sector, 2008(Quadrillion Btu)

Title
Source: Historical production and proved reserves figures are from Energy Information Administration, undiscovered technically recoverable resource value is from U.S. Geological Survey, and discovered and undiscovered sub-economic resources uses the lower estimate for oil shale resources from RAND as a minimum.Notes: Discovered and undiscovered sub-economic resources would include poor quality or small deposits of conventional oil, some deposits of oil sands, and various other forms of oil deposits such as oil shale.
Oil ShaleMethaneHydrates
Oil Sands
Shale Gas
Conventional Oil and Gas
Deposits
How much do we have?

CRS-13
U.S. Proved Reserves of Oil = 21.3 billion barrels
U.S. Proved Reserves of Natural Gas
= 237.7 trillion cubic feet
EIA, December, 2007,http://tonto.eia.doe.gov/dnav/pet/pet_crd_pres_dcu_NUS_a.htm

CRS-14
Technically Recoverable Crude Oil, Natural Gas, and Natural Gas Liquids Resource Estimates, 2007
EIA Annual Energy Review 2008
U.S. Proved Reserves of Oil = 21.3 billion barrelsU.S. Proved Reserves of Natural Gas = 237.7 trillion cubic feet
CRS-15
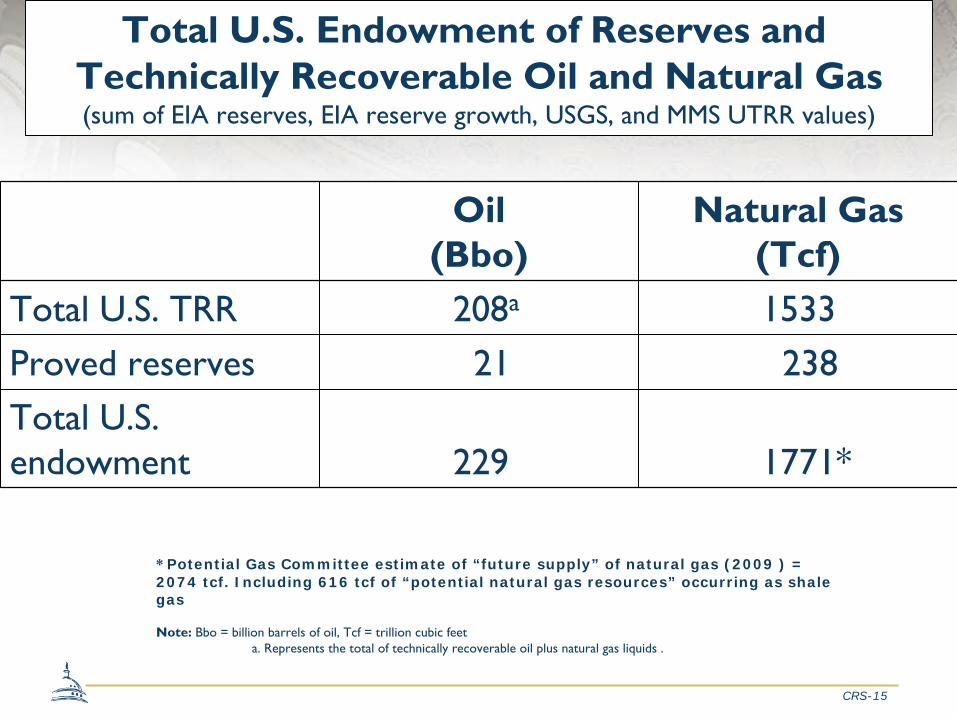
Total U.S. Endowment of Reserves and Technically Recoverable Oil and Natural Gas(sum of EIA reserves, EIA reserve growth, USGS, and MMS UTRR values)
Oil(Bbo)
Natural Gas(Tcf)
Total U.S. TRR 208a 1533Proved reserves 21 238Total U.S. endowment 229 1771*
* Potential Gas Committee estimate of “future supply” of natural gas (2009 ) = 2074 tcf. Including 616 tcf of “potential natural gas resources” occurring as shale gas
Note:
Bbo
= billion barrels of oil, Tcf
= trillion cubic feeta. Represents the total of technically recoverable oil plus natural gas liquids .
CRS-16
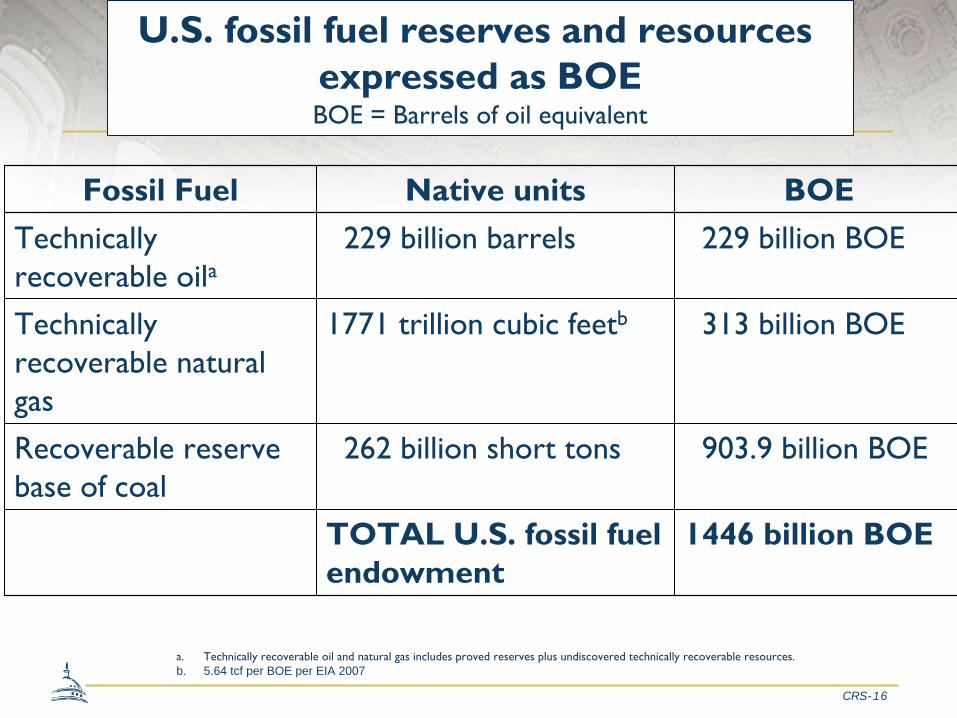
U.S. fossil fuel reserves and resources expressed as BOEBOE = Barrels of oil equivalent
Fossil Fuel Native units BOETechnically recoverable oila
229 billion barrels 229 billion BOE
Technically recoverable natural gas
1771 trillion cubic feetb 313 billion BOE
Recoverable reserve base of coal
262 billion short tons 903.9 billion BOE
TOTAL U.S. fossil fuel endowment
1446 billion BOE
a.
Technically recoverable oil and natural gas includes proved reserves plus undiscovered technically recoverable resources.b. 5.64 tcf per BOE per EIA 2007
CRS-17

CRS-18

CRS-19Source: Chesapeake Energy 2009 Investor Presentation: http://www.chk.com/Investors/Documents/Latest_IR_Presentation.pdf
natural gas
^

CRS-20
Annual U.S. Coal Production
EIA: http://www.eia.doe.gov/emeu/aer/pdf/pages/sec7_6.pdf
CRS-21
title
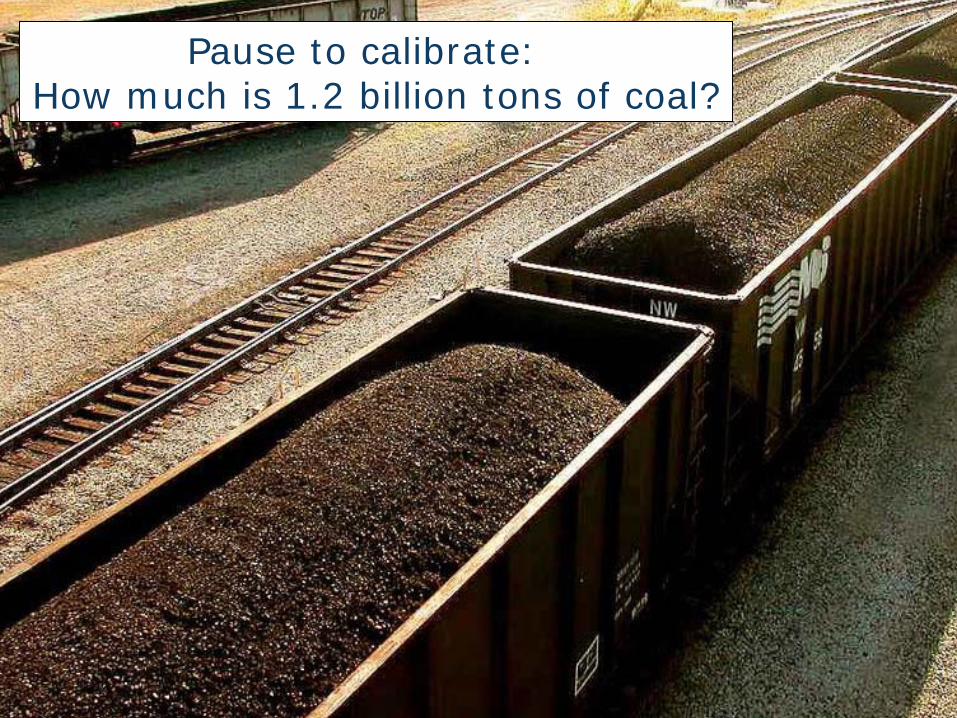
Pause to calibrate: How much is 1.2 billion tons of coal?
CRS-22
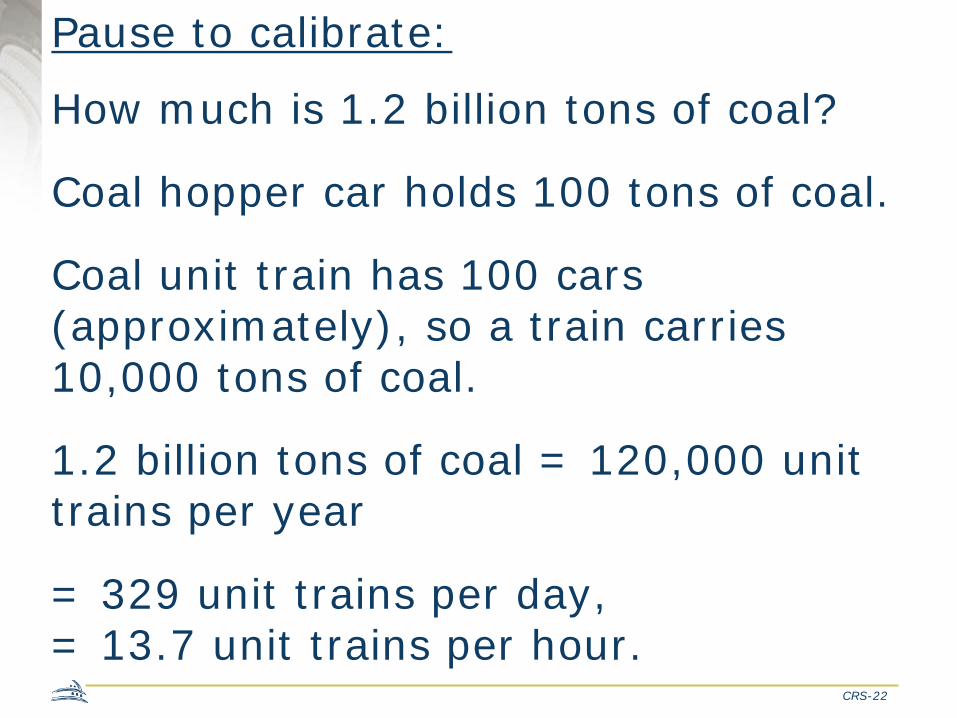
Pause to calibrate:
How much is 1.2 billion tons of coal?
Coal hopper car holds 100 tons of coal.
Coal unit train has 100 cars (approximately), so a train carries 10,000 tons of coal.
1.2 billion tons of coal = 120,000 unit trains per year
= 329 unit trains per day, = 13.7 unit trains per hour.

CRS-23
title
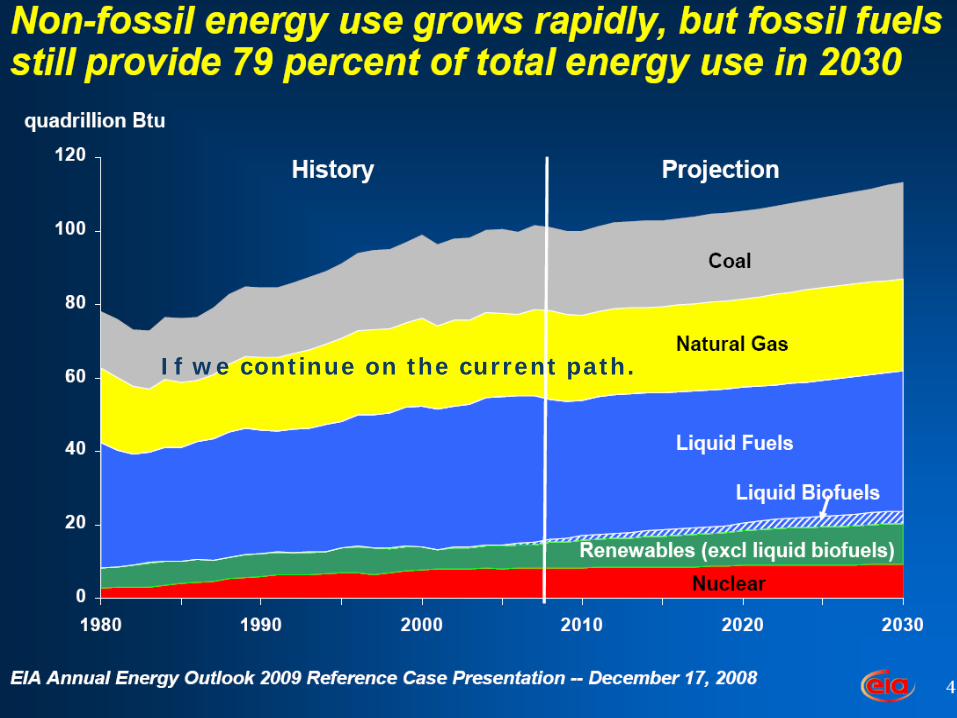
If we continue on the current path.
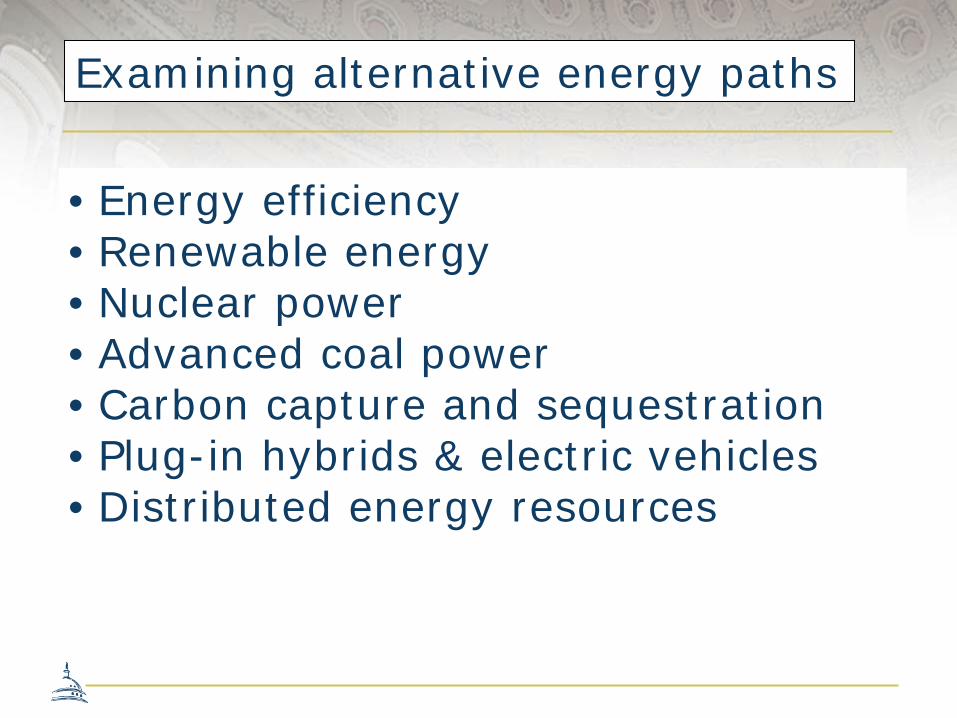
Examining alternative energy paths
• Energy efficiency• Renewable energy• Nuclear power• Advanced coal power• Carbon capture and sequestration• Plug-in hybrids & electric vehicles• Distributed energy resources
CRS-26
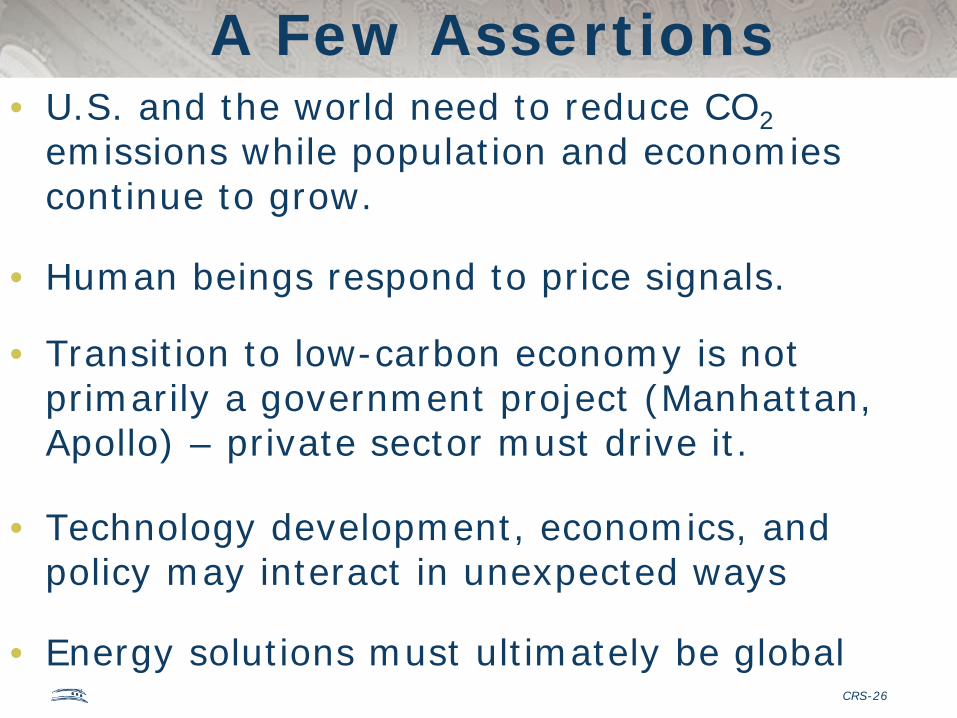
• U.S. and the world need to reduce CO2 emissions while population and economies continue to grow.
• Human beings respond to price signals.
• Transition to low-carbon economy is not primarily a government project (Manhattan, Apollo) – private sector must drive it.
• Technology development, economics, and policy may interact in unexpected ways
• Energy solutions must ultimately be global
A Few Assertions

CRS-27
Goal: Reduce U.S. CO2 emissions to 1990 levels by 2030.
CRS-28
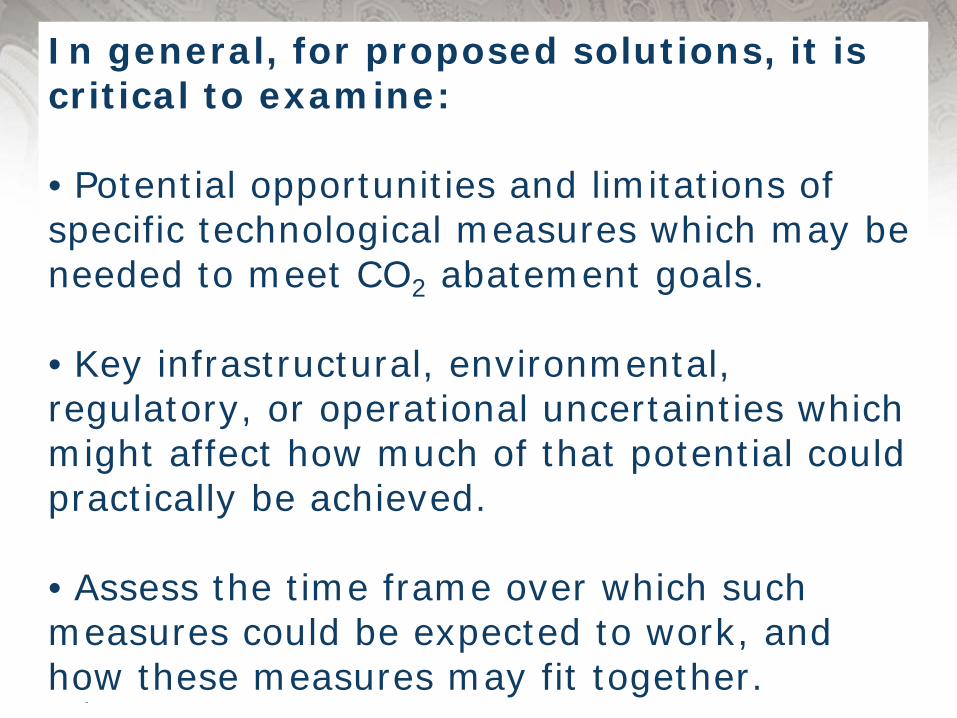
In general, for proposed solutions, it is critical to examine:
• Potential opportunities and limitations of specific technological measures which may be needed to meet CO2 abatement goals.
• Key infrastructural, environmental, regulatory, or operational uncertainties which might affect how much of that potential could practically be achieved.
• Assess the time frame over which such measures could be expected to work, and how these measures may fit together.

Electricity-Efficiency Potential not being realized: 5-7% vs. 30% deemed possible.
Impacts from Electricity-Efficiency Initiatives not as effective as projected – measures not adopted.
Point of action is often at the “light socket” level.
Uncertainty about the Efficiency Opportunity because of historical underachievement
Will codes and laws improve this?
U.S. Energy Options and Future Energy Mix:Energy Efficiency and Conservation

CRS-30
Solar – Expensive + transmission requirements
Wind PowerToday’s technology could meet 20% of electric demand Transmission Requirements – who pays?
12,000 – 20,000 miles of new transmission neededTransmission Grid Operation Uncertainty
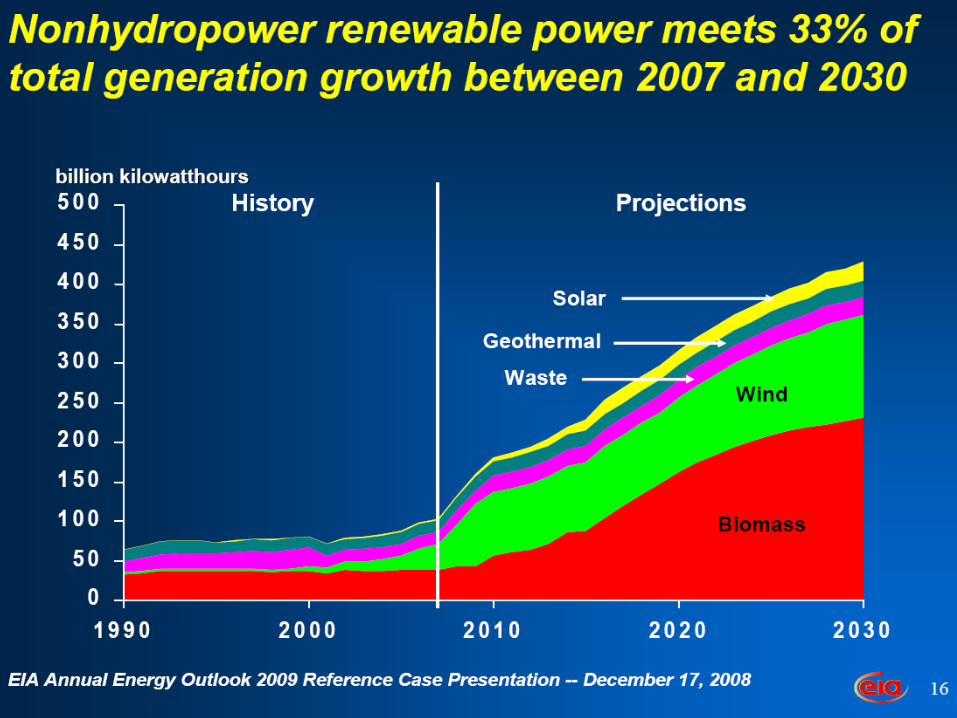
Biomass Power GenerationBiomass Fuel SupplyFood competitionCarbon offsets vs. biomass
U.S. Energy Options and Future Energy Mix:Renewable Energy Technologies
CRS-32
Non‐Fuel Total Total
Technology O&M
Cost Fuel Cost Operating
Costs Capital Return
Annualized $/Mwh
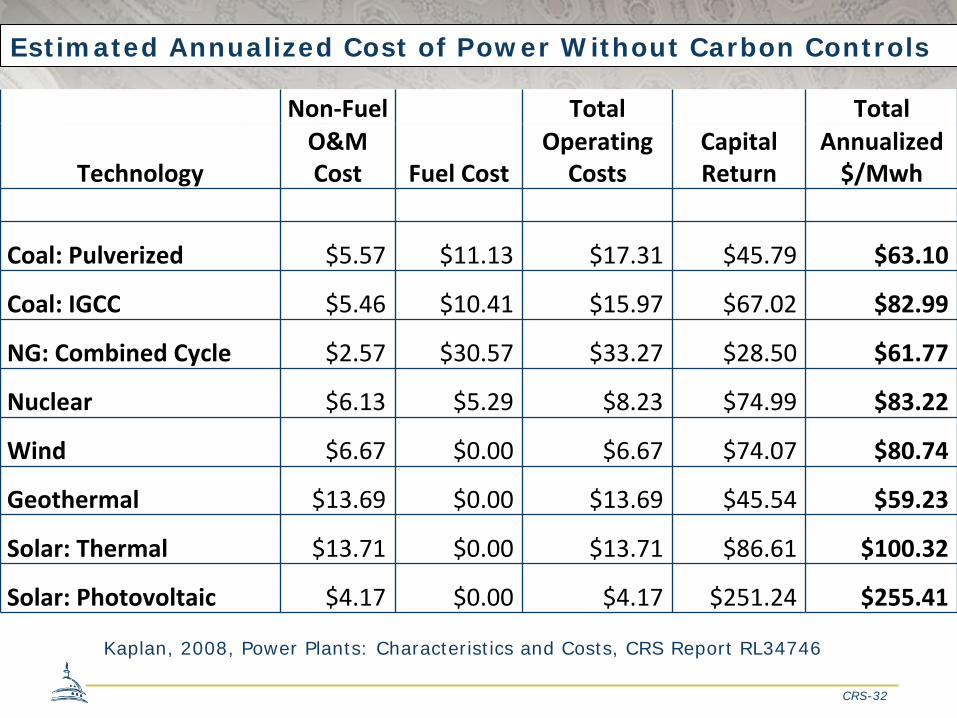
Coal: Pulverized $5.57 $11.13 $17.31 $45.79 $63.10
Coal: IGCC $5.46 $10.41 $15.97 $67.02 $82.99
NG: Combined Cycle $2.57 $30.57 $33.27 $28.50 $61.77
Nuclear $6.13 $5.29 $8.23 $74.99 $83.22
Wind $6.67 $0.00 $6.67 $74.07 $80.74
Geothermal $13.69 $0.00 $13.69 $45.54 $59.23
Solar: Thermal $13.71 $0.00 $13.71 $86.61 $100.32
Solar: Photovoltaic $4.17 $0.00 $4.17 $251.24 $255.41
Kaplan, 2008, Power Plants: Characteristics and Costs, CRS Report RL34746
Estimated Annualized Cost of Power Without Carbon Controls

Source: National Renewable Energy Laboratory (2008).
Wind Power Resources in the United States
Most wind potential lies far from load centers.
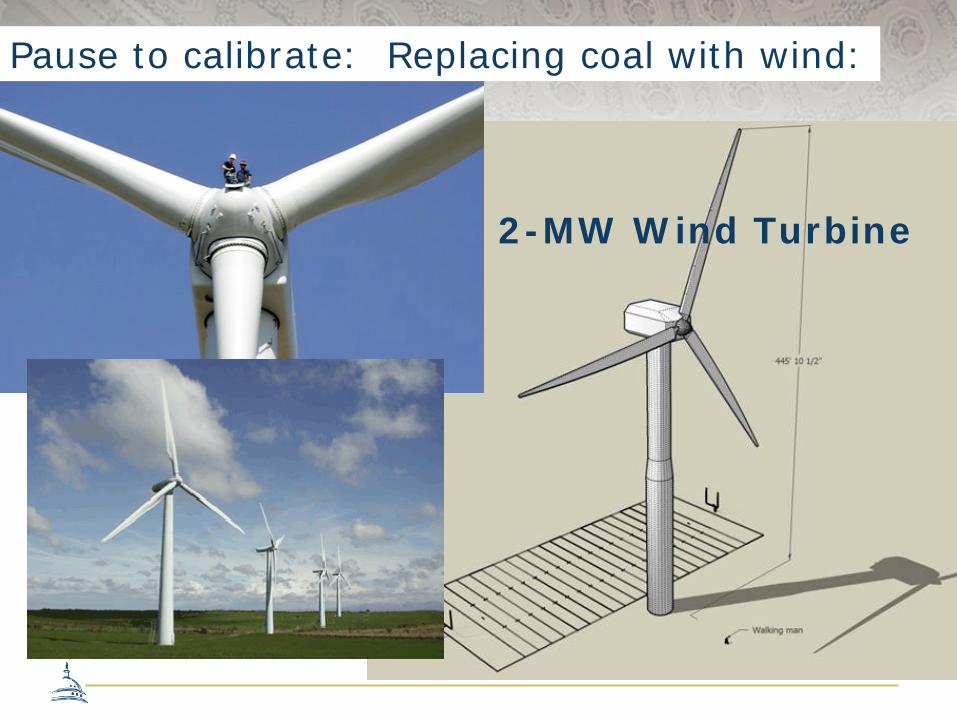
2-MW Wind Turbine
Pause to calibrate: Replacing coal with wind:

CRS-35
Energy Source Number of Generators
Generator Nameplate Capacity
Net Summer Capacity
Net Winter Capacity
Coal 1470 336040 312738 314944Petroleum 3743 62394 56068 60528Natural Gas 5439 449389 392876 422184Other Gases 105 2663 2313 2292Nuclear 104 105764 100266 101765Hydroelectric Conventional 3992 77644 77885 77369Wind 389 16596 16515 16541Solar Thermal and Photovoltaic 38 503 502 422Wood and Wood Derived Fuels 346 7510 6704 6745Geothermal 224 3233 2214 2362Other Biomass 1299 4834 4134 4214Pumped Storage 151 20355 21886 21799Other 42 866 788 814Total 17342 1087791 994888 1031978
U.S. Electrical Generating Capacity, by fuel(megawatts, 2007)
EIA Electric Power Annual 2007, http://www.eia.doe.gov/cneaf/electricity/epa/epat2p2.html
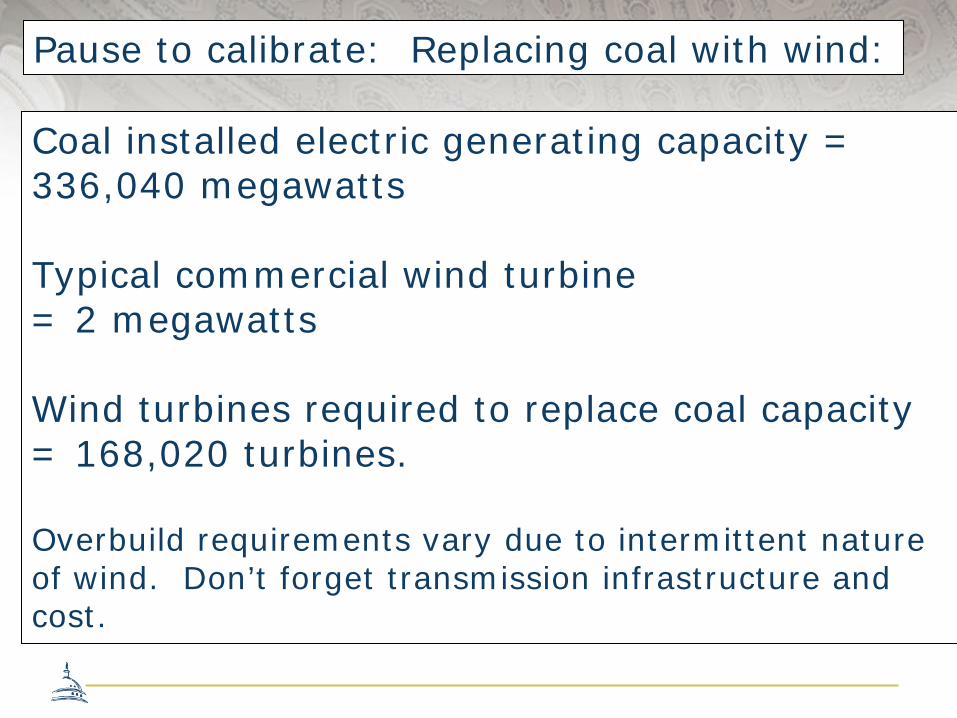
Pause to calibrate: Replacing coal with wind:
Coal installed electric generating capacity = 336,040 megawatts
Typical commercial wind turbine = 2 megawatts
Wind turbines required to replace coal capacity = 168,020 turbines.
Overbuild requirements vary due to intermittent nature of wind. Don’t forget transmission infrastructure and cost.

CRS-37
• Many analysts have high expectations for CCS
• CCS Technology Uncertainty – no commercial product exists – no operational CCS plant exists
• Even cap-and-trade requirements may not be sufficient to spur CCS deployment
• EOR may be transitionmechanism for infra-structure development
IPCC Carbon Capture and Storage, 2005http://www.ipcc.ch/pdf/special-reports/srccs/srccs_summaryforpolicymakers.pd
U.S. Energy Options and Future Energy Mix:Carbon Capture and Sequestration

CRS-38
Pause to calibrate: Carbon Capture and Sequestration
EIA Report #: DOE/EIA-0573(2007), http://www.eia.doe.gov/oiaf/1605/ggrpt/flowchart.html

CRS-39
Pause to calibrate: CCS
Weyburn, Sask., sequestration project: 1 million metric tonnes of CO2 per year.
Total CO2 emissions from coal and natural gas electricity generation = 2.278 billion tons per year.
If we can capture and store HALF of those emissions, i.e., 1.139 billion tons per year, we would need 1,139 projects the size of Weyburn.
= 23 Weyburn-sized projects for each of the 50 states if coal plants were evenly distributed, but……

CRS-40
• Efficiency improvement from 33% to 46%• Uncertainty in Advanced Coal Plant Financing and Permitting
U.S. Energy Options and Future Energy Mix:Advanced Coal-fired Power Generation

CRS-41
“The cost of building and operating coal plants with and without CCS systems, the cost of natural gas, nuclear power and renewable sources of power, the cost of emissions offsets from outside the utility sector, and ultimately the market price of CO2 itself are all variables that will dictate the decisions of future power plant developers. These variables are all highly uncertain from today’s perspective and may create a set of economic drivers dramatically different from those anticipated by policymakers.”
Ken Berlin and Robert M. Sussman, Center for American Progress (May 2007)
Who knows the answer…..?

CRS-42
• Cost• Safety• Nuclear Waste Disposal• Nuclear Proliferation constraints• Existing infrastructure nearing obsolescence• Nuclear Power Construction Uncertainty
• Time and capital required are problematic• Proposed construction schedules improbable• NIMBY
104 reactors at 65 sites in 31 states generating 20% of U.S. electricity
U.S. Energy Options and Future Energy Mix:Nuclear Energy
CRS-43
Electric passenger cars
“The fundamental reasons why the electric car has not attained the popularity it deserves are (1) The failure of the manufacturers to properly educate the general public regarding the utility of the electric; (2) The failure of [power companies] to make it easy to own and operate the electric by an adequate distribution of charging and boosting stations. The early electrics of limited speed, range and utility produced popular impressions which still exist.”
U.S. Energy Options and Future Energy Mix:Electrifying the U.S. transportation system

CRS-44
U.S. Energy Options and Future Energy Mix
“The fundamental reasons why the electric car has not attained the popularity it deserves are (1) The failure of the manufacturers to properly educate the general public regarding the utility of the electric; (2) The failure of [power companies] to make it easy to own and operate the electric by an adequate distribution of charging and boosting stations. The early electrics of limited speed, range and utility produced popular impressions which still exist.”
Electrical World Journal, 1916 (quoted by Sergey Brin in NYT 10-9-09)
Electric passenger cars
U.S. Energy Options and Future Energy Mix:Electrifying the U.S. transportation system

CRS-45
• Affordability -• Volume – Need 50% of new car sales by 2025• Emissions of engines to support batteries• Capacity of electrical generating and transmission system• Infrastructure requirements for charging or battery exchange• ….in addition to onboard fuel
U.S. Energy Options and Future Energy MixU.S. Energy Options and Future Energy Mix:Electrifying the U.S. transportation system
CRS-46
U.S. Energy Options and Future Energy Mix
CRS-47
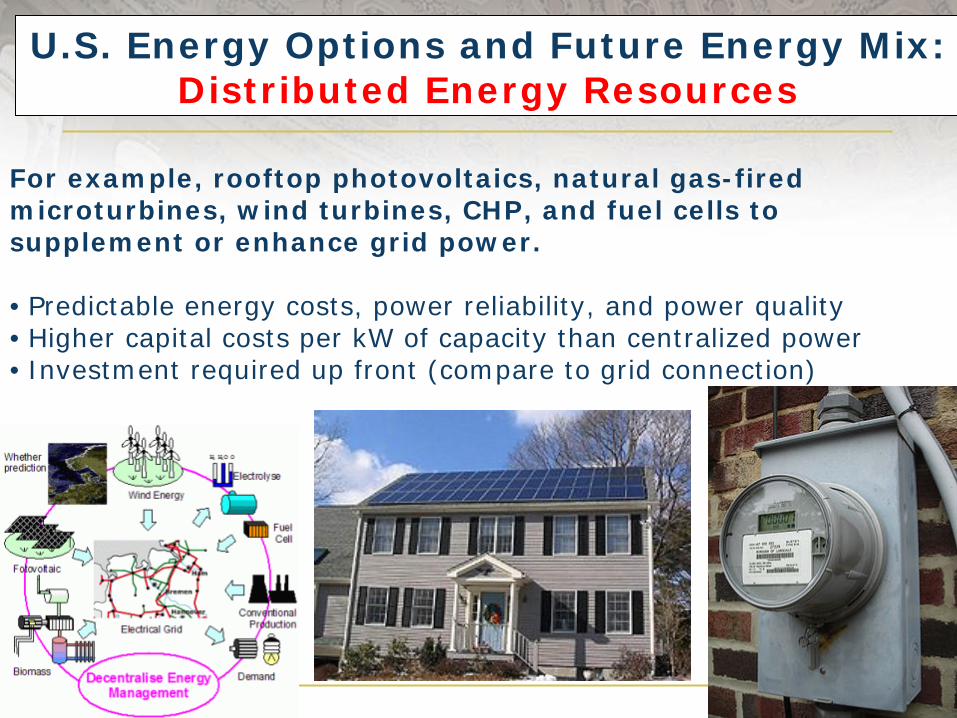
For example, rooftop photovoltaics, natural gas-fired microturbines, wind turbines, CHP, and fuel cells to supplement or enhance grid power.
• Predictable energy costs, power reliability, and power quality• Higher capital costs per kW of capacity than centralized power• Investment required up front (compare to grid connection)
U.S. Energy Options and Future Energy MixU.S. Energy Options and Future Energy Mix:Distributed Energy Resources

CRS-48
• Energy efficiency—Can the United States overcome socioeconomic barriers to achieve four times more potential savings than ever before?
• Renewable energy—Will there be enough transmission for wind power? Is there enough land to grow the needed biomass?
• Nuclear power—Could the United States build new plants fast enough to matter?
• Advanced coal power—Will banks fund them and regulators approve them?
• Carbon capture and sequestration—Will the technology be commercially deployable in 10 years, 25 years, or never?
• Plug-in hybrid electric vehicles—How much “low carbon” electricity would be available to charge their batteries?
• Distributed energy resources—Would carbon costs change distributed energy economics enough to spur deployment?
U.S. Energy Future: A few key questions:
CRS-49
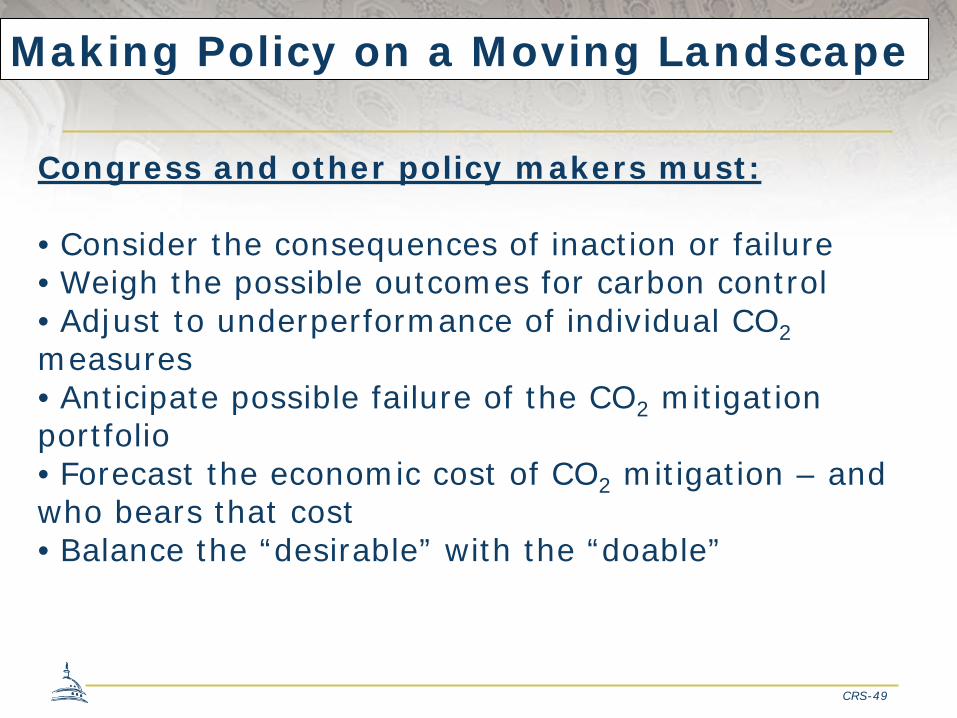
Congress and other policy makers must:
• Consider the consequences of inaction or failure• Weigh the possible outcomes for carbon control• Adjust to underperformance of individual CO2 measures• Anticipate possible failure of the CO2 mitigation portfolio• Forecast the economic cost of CO2 mitigation – and who bears that cost• Balance the “desirable” with the “doable”
Making Policy on a Moving Landscape

CRS-50
H.R. 2454 (Waxman-Markey)1428 pages
Energy
RES, CCS, clean transportation, smart grid, nuclear, energy efficiency, green jobs
Climate Change
Cap-and-trade, agriculture, adaptation, exporting clean technology

CRS-51
Simplified Emission Allowance Distribution—2016
H.R. 2454 (Waxman-Markey)

CRS-52
Simplified Emission Allowance Distribution—2030
H.R. 2454 (Waxman-Markey)
(Parker and Yacobucci, 2009)(Parker and Yacobucci 2009 CRS Report R40809)
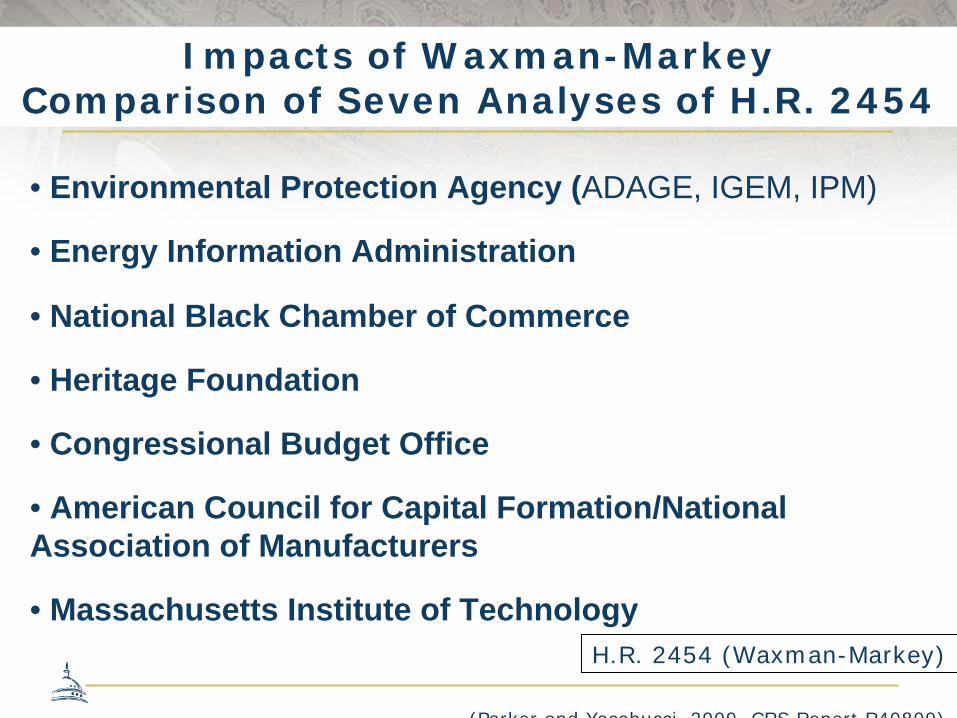
Impacts of Waxman-MarkeyComparison of Seven Analyses of H.R. 2454
H.R. 2454 (Waxman-Markey)
• Environmental Protection Agency (ADAGE, IGEM, IPM)
• Energy Information Administration
• National Black Chamber of Commerce
• Heritage Foundation
• Congressional Budget Office
• American Council for Capital Formation/National Association of Manufacturers
• Massachusetts Institute of Technology
(Parker and Yacobucci 2009 CRS Report R40809)
CRS-54
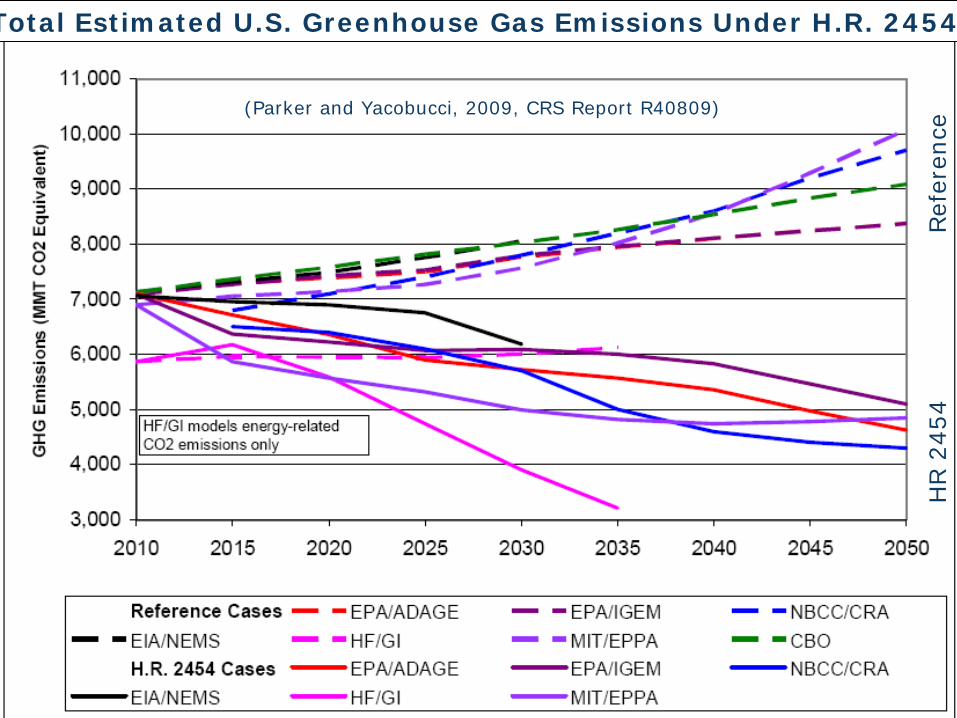
Total Estimated U.S. Greenhouse Gas Emissions Under H.R. 2454
(Parker and Yacobucci, 2009, CRS Report R40809)
Ref
eren
ceH
R 2
454

Fossil Energy Consumption Impacts from H.R. 2454
(Parker and Yacobucci, 2009, CRS Report R40809)

CRS-56
Senate Energy and Climate Change Bills
S. 1624 The American Clean Energy Leadership Act of 2009 (532 pages)
RES, national transmission grid, cyber grid protection, offshore O&G leasing, energy innovation, market transparency
S. 1733 The Clean Energy Jobs and American Power Act (Kerry-Boxer) (821 pages)
RES, CCS, cap-and-trade, water efficiency, nuclear, offshore O&G leasing, energy R&D, adaptation, natural resource protection

RESTORE ECONOMY
MORE OFFSHORE
USE MORENATURAL GAS
R&D
COAL
TAX CREDITS
IMPROVE ENERGY SECURITY
RENOVATEELECTRICAL GRID
EXPAND NUCLEARPOWER
REDUCE ENERGYCOSTS
REDUCE CO2EMISSIONS
REDUCE OILIMPORTS
ELECTRIFY TRANSPORTATION
SYSTEM
CAPTURE ANDSEQUESTER
CARBON
EXPAND DOMESTICPRODUCTION
EXPAND RENEWABLEENERGY
IMPROVE EFFICIENCY MANDATEGREEN BUILDINGS
PROMOTECONSERVATION
U.S. Energy Policy

CRS-58
Contact slide
Gene Whitney, Ph.D.Energy Section Research ManagerCongressional Research ServiceLibrary of Congress101 Independence Ave., SEWashington, DC 20504