Formulating a Copy Service Fee Schedule for the … 17, 2013 · 1 Formulating a Copy Service Fee...
24
1 Formulating a Copy Service Fee Schedule for the California Division of Workers’ Compensation October 17, 2013 Submitted to: State of California Department of Industrial Relations Submitted by: Berkeley Research Group, LLC Gregory J. Nachtwey, Project Director Esther Z. Hirsh Jake Seefer
Transcript of Formulating a Copy Service Fee Schedule for the … 17, 2013 · 1 Formulating a Copy Service Fee...
1
FormulatingaCopyServiceFeeScheduleforthe
CaliforniaDivisionofWorkers’Compensation
October17,2013
Submitted to: State of California Department of Industrial Relations Submitted by: Berkeley Research Group, LLC
Gregory J. Nachtwey, Project Director Esther Z. Hirsh Jake Seefer
2
TableofContents
I. INTRODUCTION ................................................................................................................................ 3
II. SUMMARY OF CONCLUSIONS AND RECOMMENDATIONS .............................................................. 3
III. SOURCES OF DATA ........................................................................................................................... 4
IV. METHODOLOGY AND RATIONALE ................................................................................................... 5
V. POLICY ISSUES RELATED TO COPY COST FEE SCHEDULES AND SUGGESTED REGULATORY
RESPONSES ....................................................................................................................................... 9
A. Level of Acrimony .................................................................................................. 9
B. Collection Issues .................................................................................................. 10
C. Proposed Policy Response ................................................................................... 10
D. Copy and Related Services ................................................................................... 12
E. Registration Requirement .................................................................................... 13
F. Electronic Records ............................................................................................... 13
3
I. INTRODUCTION
This report is submitted to the Department of Industrial Relations, Division of Workers’
Compensation (DWC) by Berkeley Research Group. Senate Bill 863 requires the DWC to implement a
schedule of reasonable maximum fees for copying and related services. This report was prepared to
assist the DWC in determining the appropriate maximum fee for services. We also discuss the policy
issues that should be addressed by regulations regarding the implementation of the schedules, in order
to have a fair, transparent and orderly transition to use of the schedules. This report is presented in five
chapters: this introduction; our summary of conclusions and recommendations; a listing of the data and
other material we collected and considered; a discussion of analytical methodologies employed; and our
recommendations with respect to facilitating the use of the schedules. An appendix contains exhibits
documenting our calculations.
II. SUMMARYOFCONCLUSIONSANDRECOMMENDATIONS
We have analyzed the data detailed in the next section, communicated with stakeholders and
conducted research regarding the practices of other jurisdictions and other systems. Based on our
review and analysis, we have concluded that the most cost effective and fair method for paying for copy
costs is to institute a single price for copy sets, regardless of the number of pages involved (up to 1,000
pages) or the difficulty in retrieval of documents. For such a method to succeed, the implementation of
strict regulations governing its use is required. We discuss proposed regulations in Section V of this
Report.
4
Based on our analysis, we have concluded that the cost of each initial copy set should be
$103.55.1 Additional copy sets should be made available at $.10 per page if paper and for a nominal
lump sum fee of $5.00 if electronic. We provide the rationale for our conclusion in Section IV. However,
we must caveat our conclusion with this important condition: the proposed fee schedule is feasible only
if there is prompt payment of copy services invoices by the payer. Accordingly, as discussed further in
Section IV, we recommend the implementation of a tiered price to reflect the average estimated
business expense for collection and uncertainty when payment is not made promptly.
In order to prevent abuses of the new system, we recommend requiring that each subpoena be
supported by the declaration of the attorney seeking documents that the subpoena was issued in good
faith, is not duplicative and seeks documents necessary to pursue the applicant’s claim.
III. SOURCESOFDATA
In formulating our opinions, we collected and analyzed data relevant to copy costs from the
following sources:
1. Applicant Copy Services Firms within the State of California (598,342 Observations);
2. Defense Copy Services Firms within the State of California (1,647 Observations between 2011
and 2013) serving the entertainment, and retail food and groceries industries;
3. Published data from other states and from other systems within California.
4. Profit and overhead costs associated with the claims processing industry.
1 Exhibit 1
5
IV. METHODOLOGYANDRATIONALE
We began our assignment by speaking to a number of different stakeholders involved in the
procuring, preparation of and payment for copying and related services. It became clear almost
immediately that the system was riven with distrust and that it had essentially broken down, with each
side feeling justified in its approach to pricing. Applicant copy services accuse payers of unreasonable
delay or refusal, and they build the cost of collections and bad debts into their fees. Payers accuse the
applicant copy services of puffing the bills, and they reject the bills or offer only discounted payments.
We believe that it is essential to break this vicious cycle of inefficiency, which is why we are
proposing a lump sum payment system. The advantage of a flat rate is to simplify the process, as well as
to reduce the number of areas of potential disagreement between Applicant copy services and payers.
We propose that the DWC institute a schedule in accordance with the guidelines we have provided, with
payment due within 60 days from receipt of invoice. If a proper invoice is not paid within 60 days, a
higher fee should be applied to take account of the increased collection costs and uncertainty. A flat
rate fee schedule can reduce or eliminate reliance on the system of lien enforcement, which is
cumbersome, expensive and unnecessary.
The definition of a fair market value is a price at which buyers and sellers with a reasonable
knowledge of pertinent facts and not acting under any compulsion are willing to do business.2 We
found two distinct markets for copy services in California workers’ compensation. In one market,
applicant copy services perform work for the attorneys for injured workers, then look to the employer
or insurer (i.e., a third party) for payment. In the other market, defense copy services perform work for
the employers or insurers who contract and pay for the service. Payers contend that defense copy
2 http://www.merriam‐webster.com/dictionary/fair%20market%20value
6
services exemplify the fair market value because both the copy service and the payer are voluntarily
doing business with one another. Applicant copy services contend that the defense copy market is not
comparable because the defense market is characterized by ongoing relationships, volume discounts,
and hassle‐free payment. Applicant copy services contend that the prices actually paid by defendants
for applicant copy services, whether by voluntary payment or by settlement of a lien, reflect a fair
market value since these are amounts that defendant ultimately agreed to pay.
Although neither the defense copy segment of the market nor the resolutions of applicant copy
billings segment is exclusively determinative of a fair market value for applicant copy services, we find
that both are informative. We conclude that the average payment for defense copy services is a useful
indicator of the fair market value of copy services where payment is prompt and free of disputes. The
average payment for applicant copy services is not a useful indicator of fair market value in these
circumstances because the payers for applicant copy services are under compulsion of law to do
business with the copy services selected by the injured worker’s attorney.
We conclude, however, that the average payment for applicant copy services is a good indicator
of the fair market value when the seller (the copy service) has to repeatedly rebill, pursue collection, and
risk prolonged delay or nonpayment, and when the payer’s alternative to settlement is to engage in
litigation that often requires multiple hearings.
Therefore, we take the defense copy market as an initial approximation of the fair market value
of copy services when the bills are paid promptly and without disputes, and we take the average
payment of applicant copy service bills as an approximation of the fair market value of copy services
when payment is uncertain and delayed. In addition, we consider the effective rates of other states as
an indicator of the fair market value of copy service when the bills are paid promptly and without
disputes.
7
We were able to obtain data on 598,342 transactions from applicant copy services, 1,647
transactions with defense copy services (i.e., insurers and employers), and pricing rules from 16 states.
As discussed above, we did not believe that applicant data (i.e., the 598,342 transactions) was applicable
to settings where payment is prompt and undisputed. As explained later, we conclude that the
applicant copy service data is applicable to settings where collection entails greater effort and
uncertainty. The detailed applicant transaction data was used, however, to determine the average
number of pages copied per assignment. See Exhibit 1 attached to this report for more detail. We then
examined the payment schedules adopted by other states, where possible. We were able to obtain per
page pricing data from 16 states and we used these as our “comparables” for pricing. See Exhibits 2(a)
through (c). The 16 states listed in the exhibit are the only ones for which we were able to locate pricing
data by means of internet searches. We applied each of the state pricing schemes to the number of
pages (less than or equal to 1,000 pages) from the applicant copy services data set, resulting in a mean
payment of $98.13 per transaction among the 16 states.3
This per transaction amount already includes an adjustment to account for copy service profit
and overhead of 27.4 percent.4 Exhibit 2 (e) shows how we arrived at this percentage using data
applicable to administrative‐related firms. We utilized the IBISWorld Industry Report data relating to
medical claims processing services, the industry most analogous to workers’ compensation copy
services, to obtain the following percentages: 13.0% profit (earnings before interest and tax) and 14.4%
for rent and utilities. 27.4% is the sum of these and reflects the need to compensate copy firms for both
reasonable profit and certain fixed expenses that are not likely contemplated in the states’ pricing
frameworks.
3 Exhibit 2(a) 4 Exhibit 2(e)
8
We then analyzed the 1,647 transactions from defense copy services. The mean payment made
was $108.98.5 The average of the state data (after adjusted for profit and overhead and when applied
to a typical number of copies) and the defense data yielded our recommended amount of $103.55 for
the initial set of documents responsive to a subpoena.6
After concluding our interviews and reviewing the data, we concluded that the major costs of
providing documents copies were the costs of retrieving the documents, rather than the actual per page
copy costs, which is one reason why our lump sum payment proposal disregards the number of pages in
a copy set. There are occasional outliers which may be so exceptionally large as to justify a higher fee,
but we would propose keeping these to a minimum by requiring that any copy service desiring special
consideration demonstrate that the pages copied exceeded one thousand pages. While there will be
other variables in terms of effort required to access the records, these are averaged into the flat fee.
Only the excessive page count for paper records should be grounds for an exception to the flat fee.
In cases where the copy company incurs additional business expense, aging receivables, and risk
of non‐payment, however, neither the defense copy market nor the other state’s fee schedules are
comparable. In those cases, the average payment on the 592,927 applicant copy service transactions
(with less than or equal to 1,000 pages) is the best available indicator of the fair cost of the service
including all associated business expenses. As demonstrated in Exhibit 4(a) the cost is considerably
higher than our earlier determined $103.55 and the typical cost per copy event of $251.20 is a
5 Exhibit 3(a) 6 Exhibit 1
9
reasonable estimate of fair market value.7 Exhibit 4(b) shows the distribution of applicant copy payment
amounts.8
As stated earlier, one of our major goals is to streamline the system to eliminate protracted
payment disputes. This will require that any document subpoena be issued in good faith. It seems
prudent to require the attorney who requests the documents to issue a declaration to that effect in
order to prevent abuse of the system by over‐issuance of subpoenas. We revisit this idea in our
discussion of policy considerations.
V. POLICYISSUESRELATEDTOCOPYCOSTFEESCHEDULESAND
SUGGESTEDREGULATORYRESPONSES
The following are our observations based on interviews and discussions with numerous
participants in the workers’ compensation system. They are generalizations and we do not assert that
they are true in every instance.
A. LevelofAcrimony
Providers and payers for copy services in the workers’ compensation system display a
remarkable level of acrimony and distrust
Applicant representatives believe that insurance companies are untrustworthy and that they
withhold relevant documents unless served with a subpoena that requires them to declare under
penalty of perjury that they have provided all responsive documents. They perceive copy services which
are under contract with insurance carriers as under their control.
7 Exhibit 4(a) 8 Exhibit 4(b)

10
Defense representatives believe that applicant attorneys are somehow benefitting from the
copy services industry (as well as other industries that service injured workers) and that they needlessly
duplicate document requests/subpoenas in order to attain some kind of benefit, whether it be in the
form of money or perquisites received from copy services.
B. CollectionIssues
Both applicants and defendants complain about the unwieldy and lengthy procedures to collect
payment for copying costs from insurance carriers. There is a “chicken and egg” situation where
applicant copy firms allegedly add all sorts of charges to their bills to account for the uncertainties and
difficulties of collection and length of time till payment, whereas the insurance companies refuse timely
payment because they object to the amount of the bills. Applicant copy firms decry being forced to
engage in a lien collection process by insurers. On the other hand, defense attorneys complain about
being presented with inflated bills that required them to litigate copy cost lien claims, when applicant
copy firms merely send low‐paid representatives. SB 863 creates a more expeditious procedure for
resolving billing disputes, but there is a high opportunity cost to engage in this system which applicants
decry as unfair.
C. ProposedPolicyResponse
It seems overly optimistic at this point to expect applicants and defendants to use the same
copy service, given that there is the perception that it is not uncommon for there to be substantial
disparity in the size of document productions obtained by each party relative to the same document
source. Although it may be possible to institute a rule that there be only one document production
where documents are sought from a third party, e.g., a prior employer or doctor, we recommend
continuing to permit the use of applicant and defense copying services at this time, but revisiting this
question after the fee schedules have been in effect for enough time to measure their effects.
11
It seems like some problems could be solved if the pre‐lawsuit production of documents also
required the custodian of records to issue a declaration that all responsive documents have been
produced. Then there would be no apparent basis for a second request via subpoena after the suit is
filed. We recommend amending the regulations to create such a requirement as a condition of payment
for pre‐litigation production of documents. We have also been informed that some applicant copy
services will issue document subpoenas without attorney approval or even knowledge. We recommend
that the DWC consider requiring that all document subpoenas must be supported by attorneys’
declarations of necessity as discussed below.
Collection proceedings appear to consume an unreasonable amount of resources, including
judicial time. Although the new procedure ameliorates this to some extent, we recommend adopting
the single fee described previously for each document request or subpoena (with copies to non‐
requesting parties at $ .10 per page assuming standard paper copies or in accordance with Evidence
Code Section 1158 where the copies are nonstandard). The fee schedule adopted by the DWC should
operate as a “safe harbor” for copy services, such that as long as a copy service complies with the
schedule, there is no excuse for nonpayment for appropriately requested records. An insurance
company who delays payment beyond 60 days from presentation of the invoice should be required to
pay substantially more money, perhaps the $251.20 which represents the mean of the applicant copy
service data, in order to motivate compliance with the regulation.9
To ensure that copy services are not issuing subpoenas without attorney knowledge, we
recommend consideration of a requirement that each attorney who requests the issuance of a
subpoena file a declaration that the subpoena is issued in good faith, is not duplicative and the records
9 Exhibit 4(a)
12
sought are necessary to the litigation of the applicant’s claim. That declaration would become part of
the documentation submitted for payment.
The flat fee per job or per subpoena will create an opportunity for abuse if a single job can be
split into two or three jobs to double or triple the fees. When two or three separate jobs are actually
necessary, there may still be suspicion and accusations of abuse. To minimize these disputes, the
regulations should define what constitutes a single job for payment of the flat fee. The contested‐
payment fee will be an incentive for payers to be cautious about contesting a bill on the ground that the
job was improperly split. Some other incentive may need to be created to discourage copy services
from improperly splitting jobs.
D. CopyandRelatedServices
S.B. 863 amends the California Labor Code to add Section 5307.9, which provides that the
administrative director shall adopt a schedule of reasonable maximum fees for “copy and related
services.” The scope of permissible services must be specified by the schedule.
In our review of the workers’ compensation system, we observed that applicant copy services
perform many tasks that would be performed by attorneys or paralegals in analogous civil litigation
circumstances. It is our view that such paralegal services do not fall within the purview of the phrase
“copy and related services.” We are informed that in the California workers’ compensation community,
unlike in some other contexts, that phrase is generally construed to mean not only the retrieval and
copying of documents responsive to a duly issued subpoena, but also the preparation of the subpoena
and the service of the subpoena and in some cases the advance of the witness fee. Our recommended
fee for uncontested payments includes the retrieval and copying, but does not include the preparation
and service of the subpoena and associated documents nor reimbursement for witness fees advanced.
An additional allowance for document preparation and service may be added to our recommended fee
13
for uncontested payments, as well as reimbursement of witness fees advanced. For the contested
payment situation, however, our recommended fee represents the average total payment including all
associated services and including reimbursement of witness fees paid, so where the recommended fee
in contested payment situations is applicable, no additional allowance is indicated under any
circumstances (other than records exceeding 1000 pages).
E. RegistrationRequirement
We have been informed that much of the abuse in the system comes from unregistered
applicant copy services. This has not been verified. However, we recommend requiring the use of a
registered service to qualify for payment. Registered copiers cannot be convicted felons, must have a
notary public involved in the management, must be bonded, must carry an identification card issued
by the county clerk, and are statutorily responsible for maintaining the integrity and confidentiality of
information obtained (Business & Professions Code section 22450 et seq.). This would be one way of
trying to protect injured workers’ privacy as well as possibly reducing unprofessional practices.
F. ElectronicRecords
Increasingly, electronic records are becoming the norm, rather than the exception. For some
time, health care providers and employers have been transitioning from paper to electronic records and
it is foreseeable that paper (and/or microfilm and other tangible media) records will become rare in the
future. It has been reported to us that the workers’ compensation system has been slow to transition to
electronic records sharing, but even so, there should be significant changes over the next several years.
As the years pass, the need for copy services may disappear altogether because of the ease with which
electronic records may be shared.
File sharing applications, such as “Hightail” (formerly called “You Send It”) and “Drop Box,”
already exist and are widely used in civil litigation. These services charge for their use (e.g., Hightail
14
charges $160 per year for unlimited file sharing), but they do not have per page or per subpoena
charges. Use of electronic records will greatly decrease the cost of records retrieval and transmission.
Our review of the copy service data indicates that relatively few productions will be of sufficient
magnitude to require even the use of file sharing services. The DWC may want to consider creating a
flat fee for electronic records transmission.
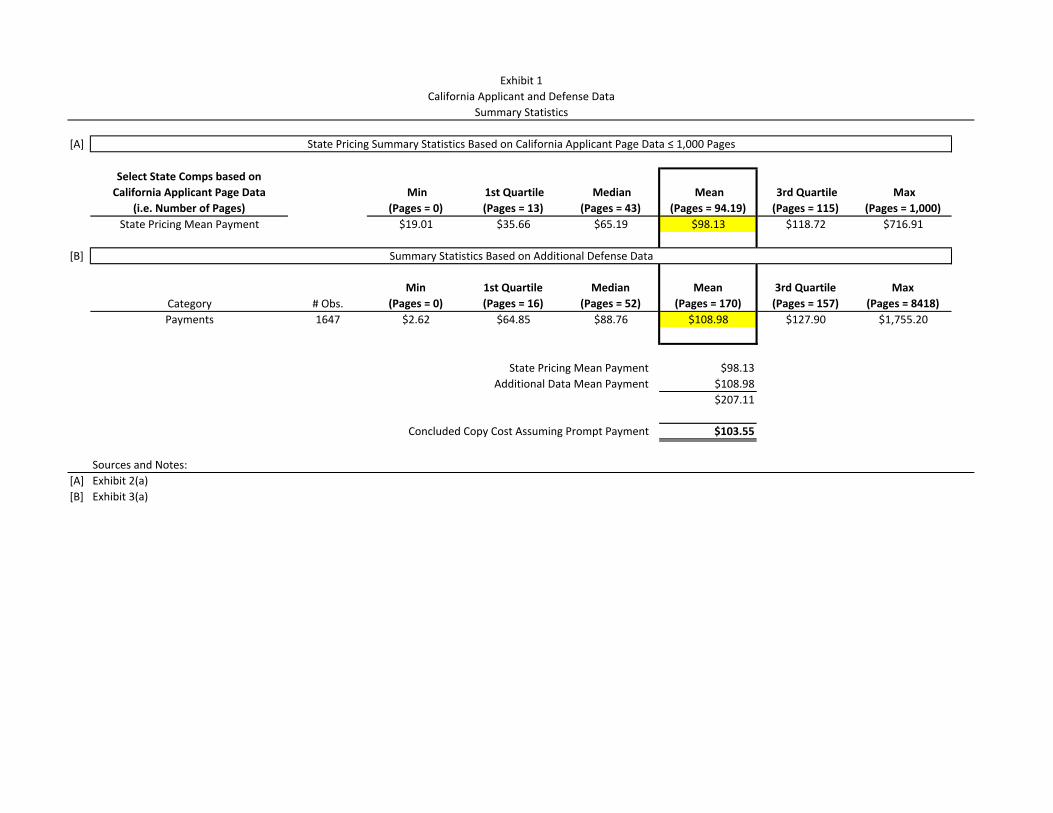
Exhibit 1
California Applicant and Defense Data
Summary Statistics
[A] State Pricing Summary Statistics Based on California Applicant Page Data ≤ 1,000 Pages
Select State Comps based on
California Applicant Page Data
(i.e. Number of Pages)
Min
(Pages = 0)
1st Quartile
(Pages = 13)
Median
(Pages = 43)
Mean
(Pages = 94.19)
3rd Quartile
(Pages = 115)
Max
(Pages = 1,000)
State Pricing Mean Payment $19.01 $35.66 $65.19 $98.13 $118.72 $716.91
[B] Summary Statistics Based on Additional Defense Data
Category # Obs.
Min
(Pages = 0)
1st Quartile
(Pages = 16)
Median
(Pages = 52)
Mean
(Pages = 170)
3rd Quartile
(Pages = 157)
Max
(Pages = 8418)
Payments 1647 $2.62 $64.85 $88.76 $108.98 $127.90 $1,755.20
State Pricing Mean Payment $98.13
Additional Data Mean Payment $108.98
$207.11
Concluded Copy Cost Assuming Prompt Payment $103.55
Sources and Notes:
[A] Exhibit 2(a)
[B] Exhibit 3(a)
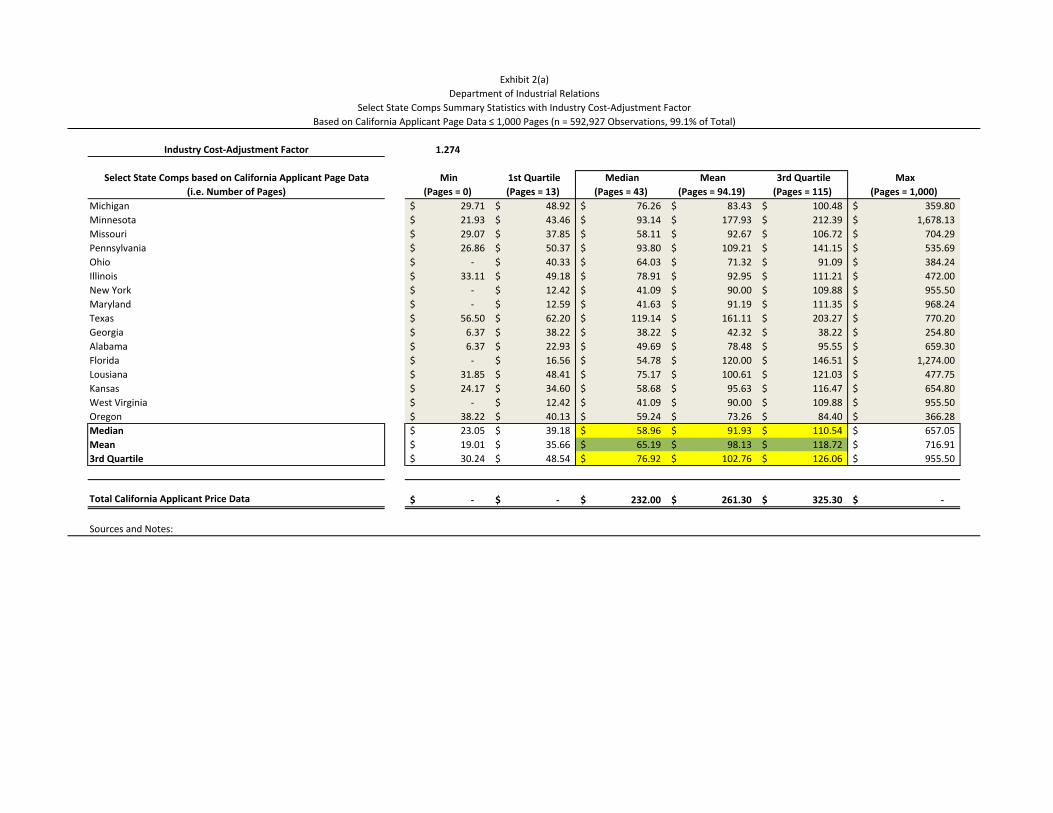
Exhibit 2(a)
Department of Industrial Relations
Select State Comps Summary Statistics with Industry Cost‐Adjustment Factor
Based on California Applicant Page Data ≤ 1,000 Pages (n = 592,927 Observations, 99.1% of Total)
Industry Cost‐Adjustment Factor 1.274
Select State Comps based on California Applicant Page Data
(i.e. Number of Pages)
Min
(Pages = 0)
1st Quartile
(Pages = 13)
Median
(Pages = 43)
Mean
(Pages = 94.19)
3rd Quartile
(Pages = 115)
Max
(Pages = 1,000)
Michigan 29.71$ 48.92$ 76.26$ 83.43$ 100.48$ 359.80$
Minnesota 21.93$ 43.46$ 93.14$ 177.93$ 212.39$ 1,678.13$
Missouri 29.07$ 37.85$ 58.11$ 92.67$ 106.72$ 704.29$
Pennsylvania 26.86$ 50.37$ 93.80$ 109.21$ 141.15$ 535.69$
Ohio ‐$ 40.33$ 64.03$ 71.32$ 91.09$ 384.24$
Illinois 33.11$ 49.18$ 78.91$ 92.95$ 111.21$ 472.00$
New York ‐$ 12.42$ 41.09$ 90.00$ 109.88$ 955.50$
Maryland ‐$ 12.59$ 41.63$ 91.19$ 111.35$ 968.24$
Texas 56.50$ 62.20$ 119.14$ 161.11$ 203.27$ 770.20$
Georgia 6.37$ 38.22$ 38.22$ 42.32$ 38.22$ 254.80$
Alabama 6.37$ 22.93$ 49.69$ 78.48$ 95.55$ 659.30$
Florida ‐$ 16.56$ 54.78$ 120.00$ 146.51$ 1,274.00$
Lousiana 31.85$ 48.41$ 75.17$ 100.61$ 121.03$ 477.75$
Kansas 24.17$ 34.60$ 58.68$ 95.63$ 116.47$ 654.80$
West Virginia ‐$ 12.42$ 41.09$ 90.00$ 109.88$ 955.50$
Oregon 38.22$ 40.13$ 59.24$ 73.26$ 84.40$ 366.28$
Median 23.05$ 39.18$ 58.96$ 91.93$ 110.54$ 657.05$
Mean 19.01$ 35.66$ 65.19$ 98.13$ 118.72$ 716.91$
3rd Quartile 30.24$ 48.54$ 76.92$ 102.76$ 126.06$ 955.50$
Total California Applicant Price Data ‐$ ‐$ 232.00$ 261.30$ 325.30$ ‐$
Sources and Notes:

Exhibit 2(b)
Department of Industrial Relations
Select State Comps Summary Statistics with Industry Cost‐Adjustment Factor
Based on California Applicant Page Data ≤ 500 Pages (n = 577,254 Observations, 96.5% of Total)
Industry Cost‐Adjustment Factor 1.274
Select State Comps based on California Applicant Page Data
(i.e. Number of Pages)
Min
(Pages = 0)
1st Quartile
(Pages = 13)
Median
(Pages = 41)
Mean
(Pages = 78.43)
3rd Quartile
(Pages = 106)
Max
(Pages = 500)
Michigan 29.71$ 48.92$ 74.78$ 78.52$ 97.84$ 213.29$
Minnesota 21.93$ 43.46$ 89.83$ 152.51$ 197.48$ 850.03$
Missouri 29.07$ 37.85$ 56.76$ 82.03$ 100.65$ 366.66$
Pennsylvania 26.86$ 50.37$ 91.13$ 101.56$ 137.06$ 312.74$
Ohio ‐$ 40.33$ 62.45$ 65.74$ 88.11$ 218.62$
Illinois 33.11$ 49.18$ 77.26$ 86.25$ 107.28$ 268.16$
New York ‐$ 12.42$ 39.18$ 74.94$ 101.28$ 471.38$
Maryland ‐$ 12.59$ 39.70$ 75.94$ 102.63$ 484.12$
Texas 56.50$ 62.20$ 115.35$ 148.97$ 194.78$ 521.64$
Georgia 6.37$ 38.22$ 38.22$ 38.81$ 38.22$ 127.40$
Alabama 6.37$ 22.93$ 48.41$ 68.34$ 89.82$ 340.80$
Florida ‐$ 16.56$ 52.23$ 99.92$ 135.04$ 637.00$
Lousiana 31.85$ 48.41$ 73.89$ 93.18$ 115.30$ 318.50$
Kansas 24.17$ 34.60$ 57.08$ 85.51$ 109.25$ 368.15$
West Virginia 12.74$ 25.16$ 51.92$ 87.68$ 114.02$ 490.49$
Oregon 38.22$ 40.13$ 57.97$ 68.11$ 81.54$ 207.03$
Median 23.05$ 39.18$ 57.52$ 83.77$ 104.96$ 353.73$
Mean 19.81$ 36.46$ 64.13$ 88.00$ 113.14$ 387.25$
3rd Quartile 30.24$ 48.54$ 75.40$ 94.87$ 120.23$ 485.71$
Total California Applicant Price Data ‐$ ‐$ 232.00$ 261.30$ 325.30$ ‐$
Sources and Notes:
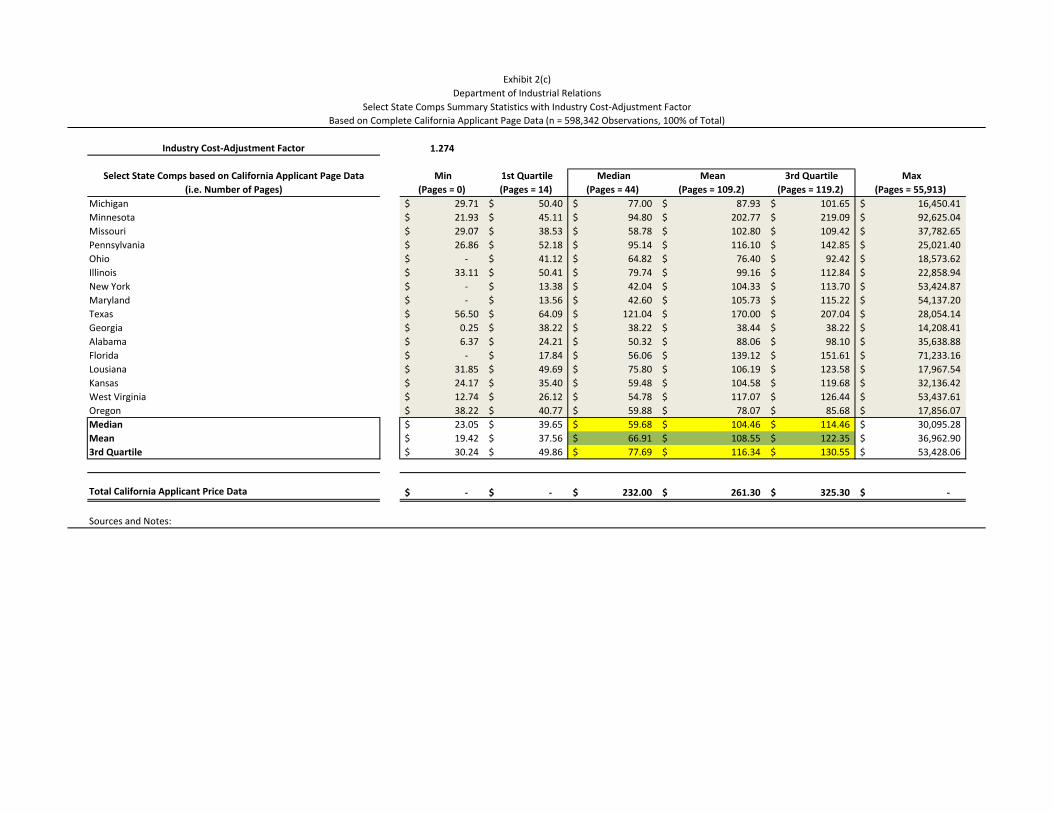
Exhibit 2(c)
Department of Industrial Relations
Select State Comps Summary Statistics with Industry Cost‐Adjustment Factor
Based on Complete California Applicant Page Data (n = 598,342 Observations, 100% of Total)
Industry Cost‐Adjustment Factor 1.274
Select State Comps based on California Applicant Page Data
(i.e. Number of Pages)
Min
(Pages = 0)
1st Quartile
(Pages = 14)
Median
(Pages = 44)
Mean
(Pages = 109.2)
3rd Quartile
(Pages = 119.2)
Max
(Pages = 55,913)
Michigan 29.71$ 50.40$ 77.00$ 87.93$ 101.65$ 16,450.41$
Minnesota 21.93$ 45.11$ 94.80$ 202.77$ 219.09$ 92,625.04$
Missouri 29.07$ 38.53$ 58.78$ 102.80$ 109.42$ 37,782.65$
Pennsylvania 26.86$ 52.18$ 95.14$ 116.10$ 142.85$ 25,021.40$
Ohio ‐$ 41.12$ 64.82$ 76.40$ 92.42$ 18,573.62$
Illinois 33.11$ 50.41$ 79.74$ 99.16$ 112.84$ 22,858.94$
New York ‐$ 13.38$ 42.04$ 104.33$ 113.70$ 53,424.87$
Maryland ‐$ 13.56$ 42.60$ 105.73$ 115.22$ 54,137.20$
Texas 56.50$ 64.09$ 121.04$ 170.00$ 207.04$ 28,054.14$
Georgia 0.25$ 38.22$ 38.22$ 38.44$ 38.22$ 14,208.41$
Alabama 6.37$ 24.21$ 50.32$ 88.06$ 98.10$ 35,638.88$
Florida ‐$ 17.84$ 56.06$ 139.12$ 151.61$ 71,233.16$
Lousiana 31.85$ 49.69$ 75.80$ 106.19$ 123.58$ 17,967.54$
Kansas 24.17$ 35.40$ 59.48$ 104.58$ 119.68$ 32,136.42$
West Virginia 12.74$ 26.12$ 54.78$ 117.07$ 126.44$ 53,437.61$
Oregon 38.22$ 40.77$ 59.88$ 78.07$ 85.68$ 17,856.07$
Median 23.05$ 39.65$ 59.68$ 104.46$ 114.46$ 30,095.28$
Mean 19.42$ 37.56$ 66.91$ 108.55$ 122.35$ 36,962.90$
3rd Quartile 30.24$ 49.86$ 77.69$ 116.34$ 130.55$ 53,428.06$
Total California Applicant Price Data ‐$ ‐$ 232.00$ 261.30$ 325.30$ ‐$
Sources and Notes:
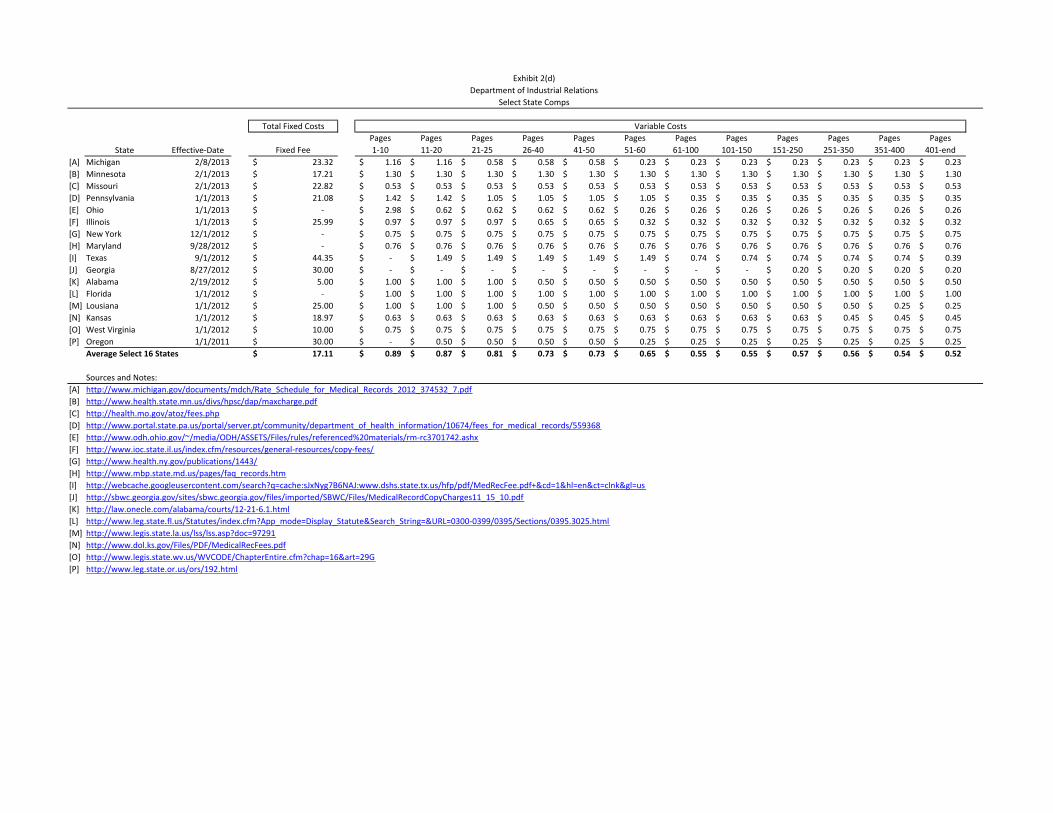
Exhibit 2(d)
Department of Industrial Relations
Select State Comps
Total Fixed Costs Variable Costs
State Effective‐Date Fixed Fee
Pages
1‐10
Pages
11‐20
Pages
21‐25
Pages
26‐40
Pages
41‐50
Pages
51‐60
Pages
61‐100
Pages
101‐150
Pages
151‐250
Pages
251‐350
Pages
351‐400
Pages
401‐end
[A] Michigan 2/8/2013 23.32$ 1.16$ 1.16$ 0.58$ 0.58$ 0.58$ 0.23$ 0.23$ 0.23$ 0.23$ 0.23$ 0.23$ 0.23$
[B] Minnesota 2/1/2013 17.21$ 1.30$ 1.30$ 1.30$ 1.30$ 1.30$ 1.30$ 1.30$ 1.30$ 1.30$ 1.30$ 1.30$ 1.30$
[C] Missouri 2/1/2013 22.82$ 0.53$ 0.53$ 0.53$ 0.53$ 0.53$ 0.53$ 0.53$ 0.53$ 0.53$ 0.53$ 0.53$ 0.53$
[D] Pennsylvania 1/1/2013 21.08$ 1.42$ 1.42$ 1.05$ 1.05$ 1.05$ 1.05$ 0.35$ 0.35$ 0.35$ 0.35$ 0.35$ 0.35$
[E] Ohio 1/1/2013 ‐$ 2.98$ 0.62$ 0.62$ 0.62$ 0.62$ 0.26$ 0.26$ 0.26$ 0.26$ 0.26$ 0.26$ 0.26$
[F] Illinois 1/1/2013 25.99$ 0.97$ 0.97$ 0.97$ 0.65$ 0.65$ 0.32$ 0.32$ 0.32$ 0.32$ 0.32$ 0.32$ 0.32$
[G] New York 12/1/2012 ‐$ 0.75$ 0.75$ 0.75$ 0.75$ 0.75$ 0.75$ 0.75$ 0.75$ 0.75$ 0.75$ 0.75$ 0.75$
[H] Maryland 9/28/2012 ‐$ 0.76$ 0.76$ 0.76$ 0.76$ 0.76$ 0.76$ 0.76$ 0.76$ 0.76$ 0.76$ 0.76$ 0.76$
[I] Texas 9/1/2012 44.35$ ‐$ 1.49$ 1.49$ 1.49$ 1.49$ 1.49$ 0.74$ 0.74$ 0.74$ 0.74$ 0.74$ 0.39$
[J] Georgia 8/27/2012 30.00$ ‐$ ‐$ ‐$ ‐$ ‐$ ‐$ ‐$ ‐$ 0.20$ 0.20$ 0.20$ 0.20$
[K] Alabama 2/19/2012 5.00$ 1.00$ 1.00$ 1.00$ 0.50$ 0.50$ 0.50$ 0.50$ 0.50$ 0.50$ 0.50$ 0.50$ 0.50$
[L] Florida 1/1/2012 ‐$ 1.00$ 1.00$ 1.00$ 1.00$ 1.00$ 1.00$ 1.00$ 1.00$ 1.00$ 1.00$ 1.00$ 1.00$
[M] Lousiana 1/1/2012 25.00$ 1.00$ 1.00$ 1.00$ 0.50$ 0.50$ 0.50$ 0.50$ 0.50$ 0.50$ 0.50$ 0.25$ 0.25$
[N] Kansas 1/1/2012 18.97$ 0.63$ 0.63$ 0.63$ 0.63$ 0.63$ 0.63$ 0.63$ 0.63$ 0.63$ 0.45$ 0.45$ 0.45$
[O] West Virginia 1/1/2012 10.00$ 0.75$ 0.75$ 0.75$ 0.75$ 0.75$ 0.75$ 0.75$ 0.75$ 0.75$ 0.75$ 0.75$ 0.75$
[P] Oregon 1/1/2011 30.00$ ‐$ 0.50$ 0.50$ 0.50$ 0.50$ 0.25$ 0.25$ 0.25$ 0.25$ 0.25$ 0.25$ 0.25$
Average Select 16 States 17.11$ 0.89$ 0.87$ 0.81$ 0.73$ 0.73$ 0.65$ 0.55$ 0.55$ 0.57$ 0.56$ 0.54$ 0.52$
Sources and Notes:
[A] http://www.michigan.gov/documents/mdch/Rate_Schedule_for_Medical_Records_2012_374532_7.pdf
[B] http://www.health.state.mn.us/divs/hpsc/dap/maxcharge.pdf
[C] http://health.mo.gov/atoz/fees.php
[D] http://www.portal.state.pa.us/portal/server.pt/community/department_of_health_information/10674/fees_for_medical_records/559368
[E] http://www.odh.ohio.gov/~/media/ODH/ASSETS/Files/rules/referenced%20materials/rm‐rc3701742.ashx
[F] http://www.ioc.state.il.us/index.cfm/resources/general‐resources/copy‐fees/
[G] http://www.health.ny.gov/publications/1443/
[H] http://www.mbp.state.md.us/pages/faq_records.htm
[I] http://webcache.googleusercontent.com/search?q=cache:sJxNyg7B6NAJ:www.dshs.state.tx.us/hfp/pdf/MedRecFee.pdf+&cd=1&hl=en&ct=clnk&gl=us
[J] http://sbwc.georgia.gov/sites/sbwc.georgia.gov/files/imported/SBWC/Files/MedicalRecordCopyCharges11_15_10.pdf
[K] http://law.onecle.com/alabama/courts/12‐21‐6.1.html
[L] http://www.leg.state.fl.us/Statutes/index.cfm?App_mode=Display_Statute&Search_String=&URL=0300‐0399/0395/Sections/0395.3025.html
[M] http://www.legis.state.la.us/lss/lss.asp?doc=97291
[N] http://www.dol.ks.gov/Files/PDF/MedicalRecFees.pdf
[O] http://www.legis.state.wv.us/WVCODE/ChapterEntire.cfm?chap=16&art=29G
[P] http://www.leg.state.or.us/ors/192.html
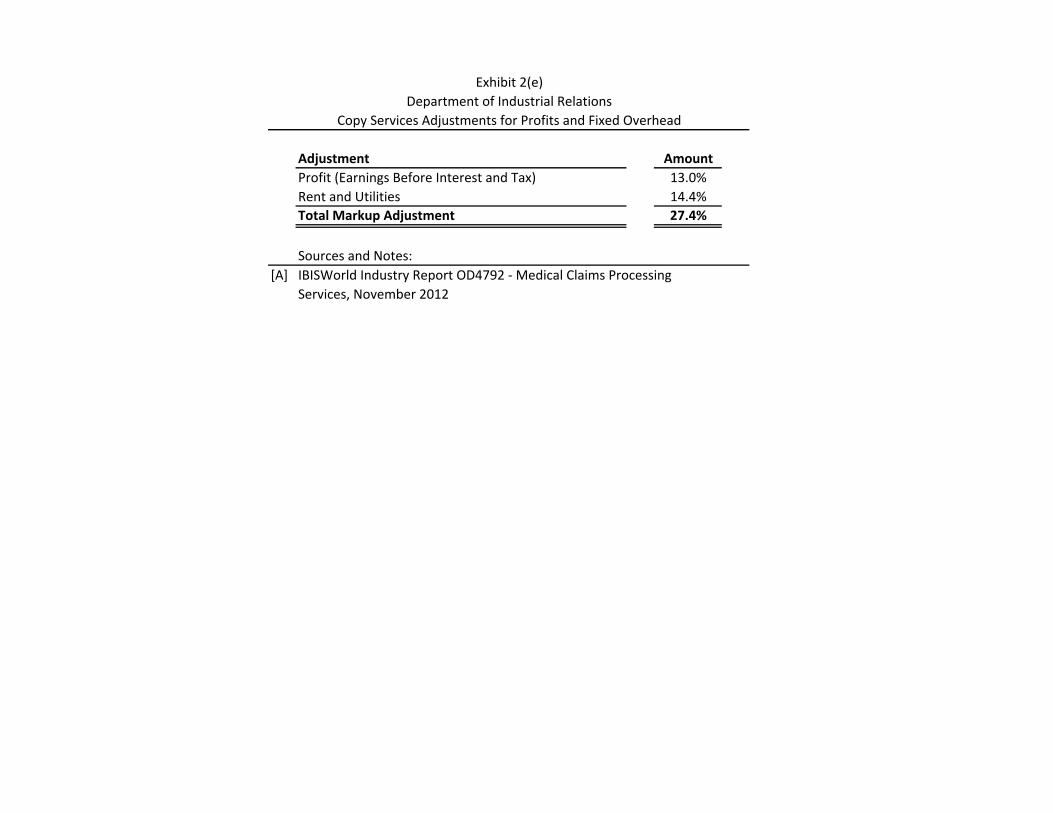
Exhibit 2(e)
Department of Industrial Relations
Copy Services Adjustments for Profits and Fixed Overhead
Adjustment Amount
Profit (Earnings Before Interest and Tax) 13.0%
Rent and Utilities 14.4%
Total Markup Adjustment 27.4%
Sources and Notes:
[A] IBISWorld Industry Report OD4792 ‐ Medical Claims Processing
Services, November 2012
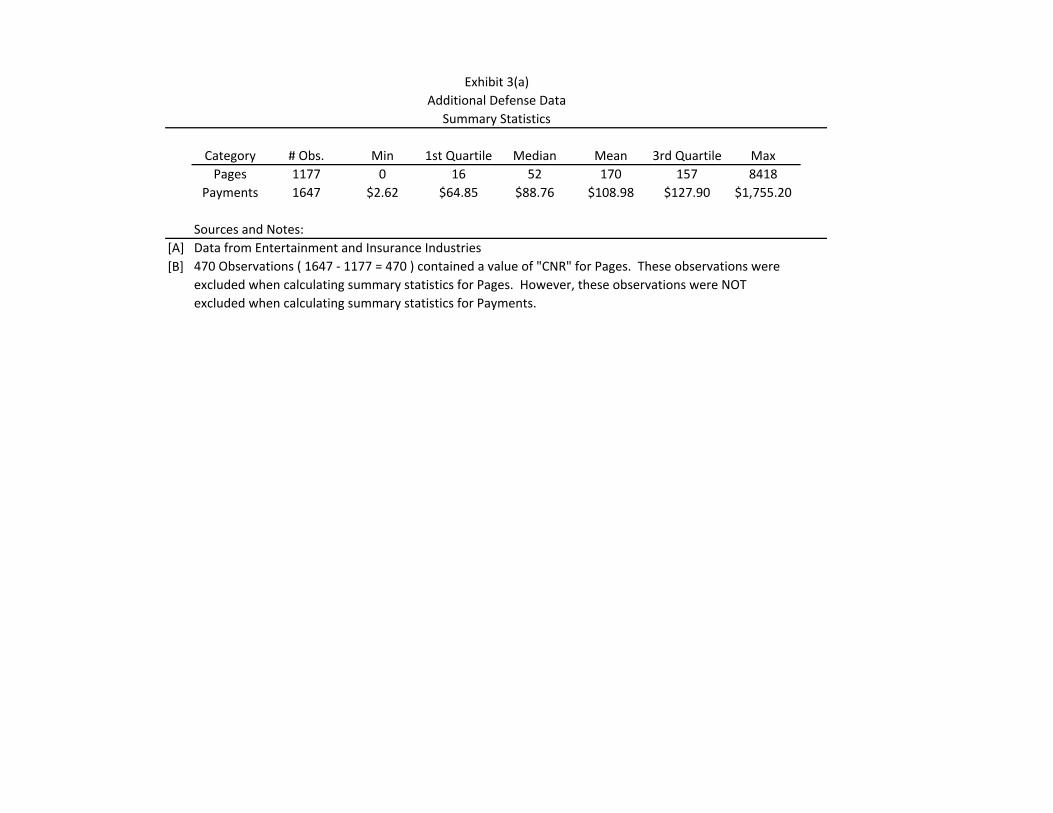
Exhibit 3(a)
Additional Defense Data
Summary Statistics
Category # Obs. Min 1st Quartile Median Mean 3rd Quartile Max
Pages 1177 0 16 52 170 157 8418
Payments 1647 $2.62 $64.85 $88.76 $108.98 $127.90 $1,755.20
Sources and Notes:
[A] Data from Entertainment and Insurance Industries
[B] 470 Observations ( 1647 ‐ 1177 = 470 ) contained a value of "CNR" for Pages. These observations were
excluded when calculating summary statistics for Pages. However, these observations were NOT
excluded when calculating summary statistics for Payments.
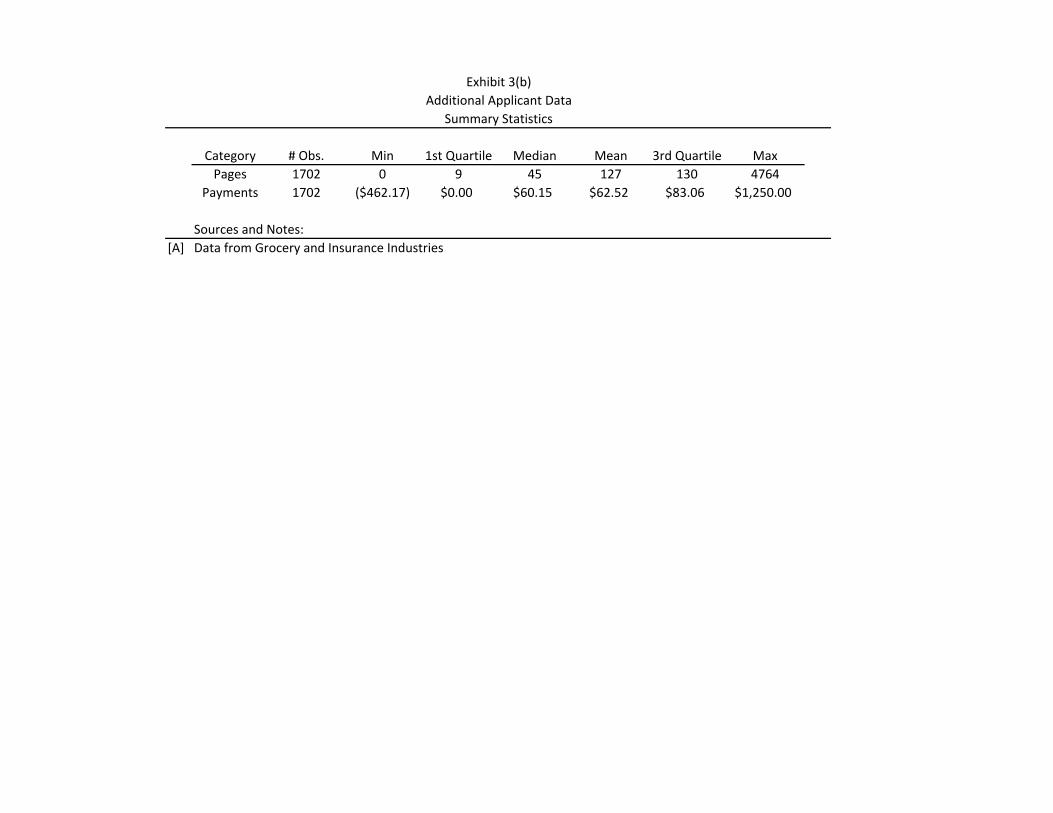
Exhibit 3(b)
Additional Applicant Data
Summary Statistics
Category # Obs. Min 1st Quartile Median Mean 3rd Quartile Max
Pages 1702 0 9 45 127 130 4764
Payments 1702 ($462.17) $0.00 $60.15 $62.52 $83.06 $1,250.00
Sources and Notes:
[A] Data from Grocery and Insurance Industries
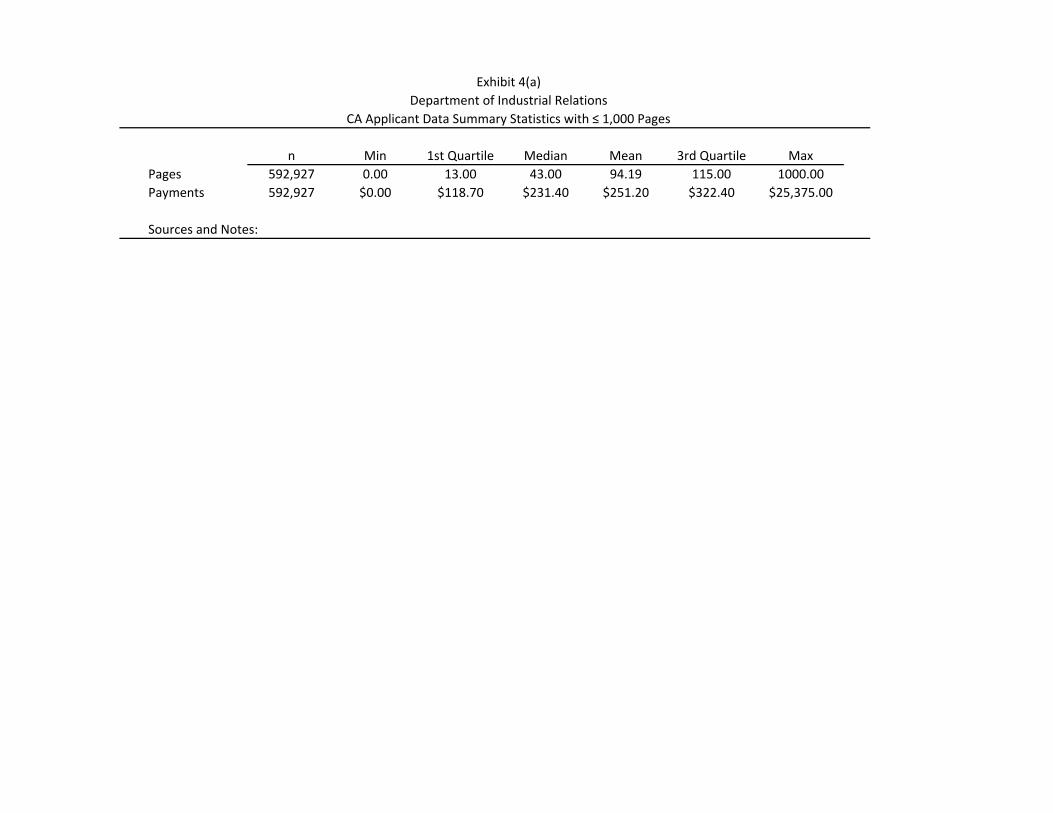
Exhibit 4(a)
Department of Industrial Relations
CA Applicant Data Summary Statistics with ≤ 1,000 Pages
n Min 1st Quartile Median Mean 3rd Quartile Max
Pages 592,927 0.00 13.00 43.00 94.19 115.00 1000.00
Payments 592,927 $0.00 $118.70 $231.40 $251.20 $322.40 $25,375.00
Sources and Notes:
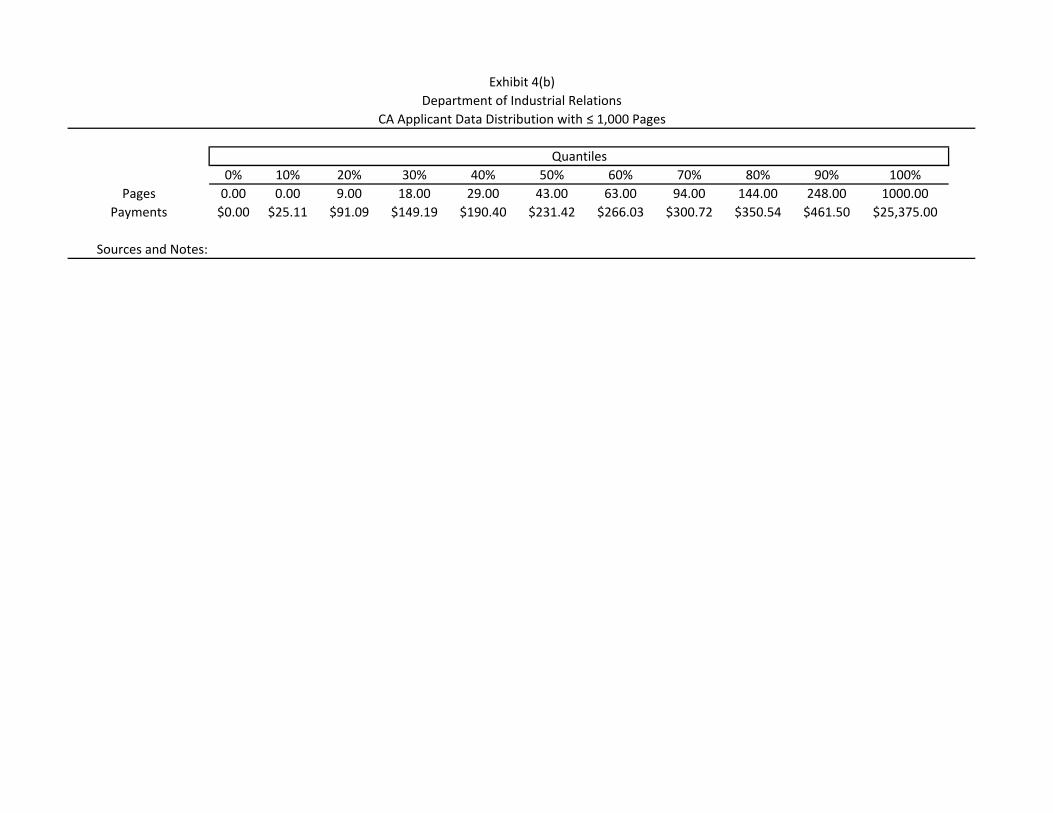
Exhibit 4(b)
Department of Industrial Relations
CA Applicant Data Distribution with ≤ 1,000 Pages
Quantiles
0% 10% 20% 30% 40% 50% 60% 70% 80% 90% 100%
Pages 0.00 0.00 9.00 18.00 29.00 43.00 63.00 94.00 144.00 248.00 1000.00
Payments $0.00 $25.11 $91.09 $149.19 $190.40 $231.42 $266.03 $300.72 $350.54 $461.50 $25,375.00
Sources and Notes: