Formula Compute a standard deviation with the Raw-Score Method Previously learned the deviation...
77
-
Upload
tabitha-jordan -
Category
Documents
-
view
231 -
download
2
Transcript of Formula Compute a standard deviation with the Raw-Score Method Previously learned the deviation...


Formula

Compute a standard deviation with the Raw-Score Method
• Previously learned the deviation formula– Good to see “what's going on”
• Raw score formula – Easier to calculate than the deviation formula– Not as intuitive as the deviation formula
• They are algebraically the same!!

Raw-Score Formula
Note: This is the formula for both and S

Step 1: Create a table
Coffee X
X2
4 10 22 2 6

Step 2: Square each value
CoffeeX
X2
4 1610 10022 4842 46 36

Step 3: Sum
CoffeeX
X2
4 1610 10022 4842 46 36
X = 44 X2 = 640

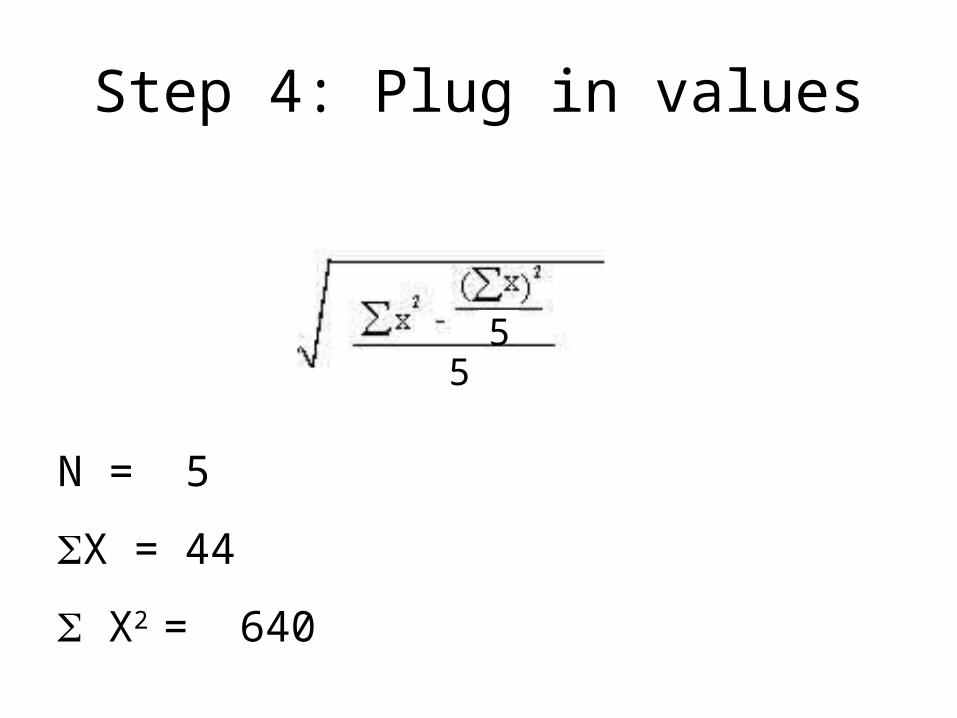
Step 4: Plug in values
N = 5
X = 44
X2 = 640
Step 4: Plug in values
N = 5
X = 44
X2 = 640
55

Step 4: Plug in values
N = 5
X = 44
X2 = 640
5544

Step 4: Plug in values
N = 5
X = 44
X2 = 640
5544
640

Step 5: Solve!
5544
6401936

Step 5: Solve!
5544
6401936387.2

Step 5: Solve!
5544
6401936387.250.56
Answer = 7.11

Practice
• Use the raw score formula and find the standard deviation of:
6, 3, 4, 10, 8

X X2
6 363 94 16
10 1008 64
X = 31 X2 = 225

N = 5
X = 31
X2 = 225
5531
225

5544
2251936192.2
2.56 =


Ŝ
• What if we want to use a sample standard deviation to estimate the population ?
• We need to make one small change to the formula to do this
• You need to make the s an “unbiased estimator”

Ŝ
• To do that you use Ŝ– This provides an estimate of the populations
variability

Remember

Just “ - 1”
Ŝ

Remember
S =

Just “ - 1”
Ŝ =-1

Why?
• The first formula is biased -- its answer tends to be too small
• Don’t worry about why -- unless you want too!!

Practice!
• Below is data from 5 people in this class. What is the estimated standard deviation of all the students in this class? Use the Ŝ raw score formula.
• Neuroticism scores
12, 15, 22, 10, 9

X X2 12 144 15 225 22 484 10 100 9 81 X = 68 X2 = 1034

N = 5
X = 68
X2 = 1034
5 - 1568
1034

4544
10341936924.8
5.22 =


Variance
• The last step in calculating a standard deviation is to find the square root
• The number you are fining the square root of is the variance!
2 = population variance
Ŝ 2 = sample variance used to estimate 2

Variance
S 2, 2 =
Ŝ 2 =

Variance
- 1Ŝ 2 =
S 2, 2 =

There are 12 different formulas!
• Standard Deviation– Deviation Formula , S, Ŝ– Raw Formula , S, Ŝ
• Variance– Deviation Formula 2, S 2, Ŝ 2 – Raw Formula 2, S 2, Ŝ 2

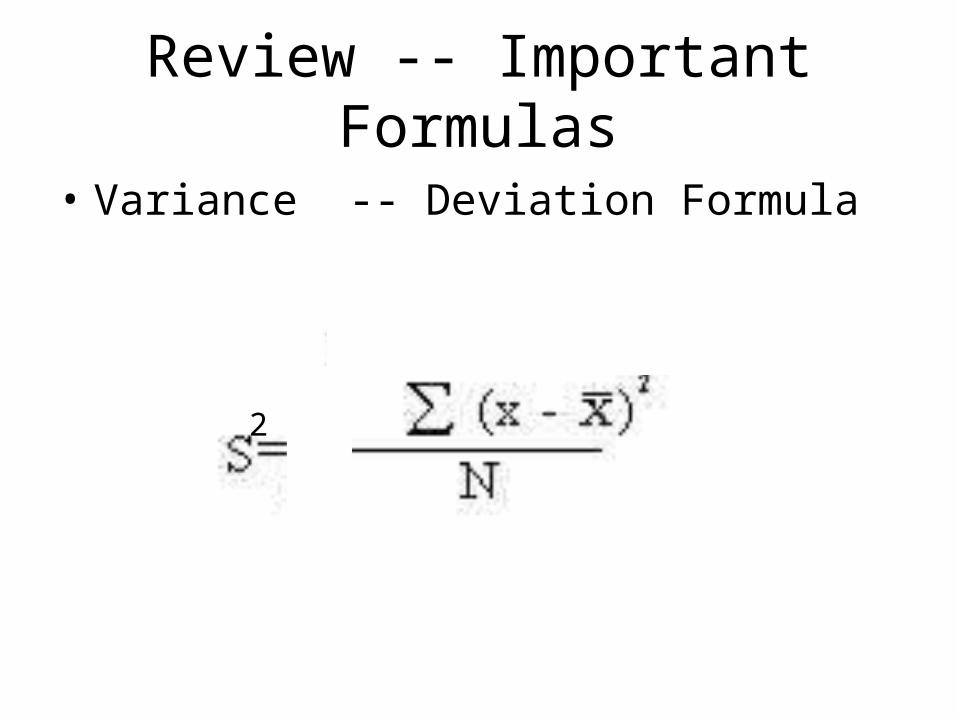
Review -- Important Formulas
• Standard Deviation -- Deviation Formula
=
Ŝ =

Review -- Important Formulas
• Standard Deviation -- Deviation Formula

Review -- Important Formulas
• Variance -- Deviation Formula
2 =
Ŝ 2 =
Review -- Important Formulas
• Variance -- Deviation Formula
2

Review -- Important Formulas
• Standard Deviation -- Raw Formula
and S =
Ŝ =- 1

Review -- Important Formulas
• Variance -- Raw Formula
2 and S2 =
Ŝ 2 =- 1

How to know which to use
• 1) Does the question want a standard deviation or a variance (most of the time standard deviations are used)
• 2) Is the group of scores a sample or population?
• 3) If it’s a sample, do you want to generalize the findings to a population?

Practice
• You are interested in how citizens of the US feel about the president. You asked 8 people to rate the president on a 10 point scale. Describe how the country feels about the president -- be sure to report a measure of central tendency and the standard deviation.
8, 4, 9, 10, 6, 5, 7, 9

Central Tendency
8, 4, 9, 10, 6, 5, 7, 9
4, 5, 6, 7, 8, 9, 9, 10
Mean = 7.25
Median = (4.5) = 7.5
Mode = 9

Standard Deviation• Want to use Ŝ

Standard Deviation X X2
8 64
4 16
9 81
10 100
6 36
5 25
7 49
9 81
= 58 = 452
• Want to use Ŝ
-1

Standard Deviation X X2
8 64
4 16
9 81
10 100
6 36
5 25
7 49
9 81
= 58 = 452
• Want to use Ŝ
-1
45258 8
8 - 1

Standard Deviation X X2
8 64
4 16
9 81
10 100
6 36
5 25
7 49
9 81
= 58 = 452
• Want to use Ŝ
-1
58452 8
8 - 1

Standard Deviation X X2
8 64
4 16
9 81
10 100
6 36
5 25
7 49
9 81
= 58 = 452
• Want to use Ŝ
-1
452 420.5
7

Standard Deviation X X2
8 64
4 16
9 81
10 100
6 36
5 25
7 49
9 81
= 58 = 452
• Want to use Ŝ
-1
2.12


Boxplots
• The boxplot graphically displays three different characteristics of the distribution– Extreme scores– Interquartile range– Median

Boxplot
100N =
NEUR
40
30
20
10
0

Boxplot
100N =
NEUR
40
30
20
10
0
Interquartile range
25th - 75th percentile

Boxplot
100N =
NEUR
40
30
20
10
0
Extreme Scores

Boxplot
100N =
NEUR
40
30
20
10
0
Median

Boxplot
100N =
NEUR
40
30
20
10
0
Skew -- Look at the “whiskers” to determine if the distribution is skewed


Create a boxplot
• Create a boxplot with this data set
2, 5, 6, 10, 14, 16, 29, 40, 56, 62, 82, 99

Create a boxplot
• Create a boxplot with this data set
2, 5, 6, 10, 14, 16, 29, 40, 56, 62, 82, 99
Median =
25th =
75th =
Lowest =
Highest =

Create a boxplot
• Create a boxplot with this data set
2, 5, 6, 10, 14, 16, 29, 40, 56, 62, 82, 99
Median = 22.5
25th = 6
75th = 62
Lowest = 2
Highest = 99

12N =
VAR00004
120
100
80
60
40
20
0
-20

Neuroticism
130130N =
MNEURCNEUR
4.5
4.0
3.5
3.0
2.5
2.0
1.5
1.0

Extraversion
130130N =
MEXTRACEXTRA
5.0
4.5
4.0
3.5
3.0
2.5
2.0
106120
15272

Conscientiousness
128128N =
MCONCCON
5
4
3
2
1
0

99999N =
VAR00006VAR00005VAR00004VAR00003VAR00002
120
100
80
60
40
20
0
-20
A
B
C
D
E
Which distribution has a positive skew?

99999N =
VAR00006VAR00005VAR00004VAR00003VAR00002
120
100
80
60
40
20
0
-20
A
B
C
D
E
Which distribution has a negative skew?

99999N =
VAR00006VAR00005VAR00004VAR00003VAR00002
120
100
80
60
40
20
0
-20
A
B
C
D
E
Which distribution is most compact?

99999N =
VAR00006VAR00005VAR00004VAR00003VAR00002
120
100
80
60
40
20
0
-20
A
B
C
D
E
Which distribution has a median close to 25?

99999N =
VAR00006VAR00005VAR00004VAR00003VAR00002
120
100
80
60
40
20
0
-20
A
B
C
D
E
Which distribution is most symmetrical?

99999N =
VAR00006VAR00005VAR00004VAR00003VAR00002
120
100
80
60
40
20
0
-20
A
B
C
D
E
Which distribution has has the largest range?

Practice
• Make a box plot using the simple frequency distribution of Satisfaction with Life scores on page 27

Practice
• Page 67
• 3.25
• 3.28

Practice
• 3.25
• Use S “hat”
• 33.16

Practice
• 3.28
• Use S “hat”
• A = 1.90• B = 1.55
• B is more consistent