Forming Analysis of Natural Fibre Composites · Forming Analysis of Natural Fibre Composites ......
238
Forming Analysis of Natural Fibre Composites Wentian Wang December 2015 A thesis submitted for the degree of Doctor of Philosophy of the Australian National University
Transcript of Forming Analysis of Natural Fibre Composites · Forming Analysis of Natural Fibre Composites ......
Forming Analysis of Natural Fibre
Composites
Wentian Wang
December 2015
A thesis submitted for the degree of Doctor of Philosophy
of the Australian National University

III
Declaration
This thesis is an account of research undertaken between February 2012 and December
2015 at The Research School of Engineering, College of Engineering and Computer
Science, Australian National University, Canberra, Australia.
Except where acknowledged in the customary manner, the material presented in
this thesis is, to the best of my knowledge, original and has not been submitted in whole
or part for a degree in any university.

IV
V
Publications
Journal Publications:
1. W. Wang, A. Lowe, S. Kalyanasundaram. "Study on continuous flax fibre
reinforced polypropylene composite in stamp forming process." Advanced
Composites Letters, vol. 22, pp. 86-89, 2013.
2. W. Wang, S. Venkatesan, A. Sexton, S. Kalyanasundaram. “Stamp Forming of
Polypropylene based Polymer-Metal Laminates: The Effect of Process
Parameters on Spring Back.” Advanced Materials Research vol. 875-877, pp
423-427, 2014.
3. W. Wang, A. Lowe, S. Kalyanasundaram. "Effect of Chemical Treatments on
Flax Fibre Reinforced Polypropylene Composites on Tensile and Dome Forming
Behaviour." International Journal of Molecular Sciences, vol. 16, pp. 6202-
6216, 2015.
4. W. Wang, A. Lowe, S. Davey, N. A. Zanjani, S. Kalyanasundaram.
"Establishing a new Forming Limint Curve for a flax fibre reinforced
polypropylene composite through stretch forming experiments." Composite Part
A: Applied Science and Manufacturing, vol. 77, pp. 114-123, 2015.
VI
5. Nima A. Zanjani, W. Wang, S. Kalyanasundaram. “The effect of fibre
orientation on the formability and failure behaviour of a woven self-reinforced
composite during stamp forming.” ASME – Journal of Manufacturing Science
and Engineering, 2015. doi:10.1115/1.4030894
6. W. Wang, A. Lowe, S. Kalyanasundaram. “Investigating the forming limits of a
flax fibre reinforced polypropylene composite in different conditions of the
water treatment.” International Journal of Advanced Manufacturing Technology,
vol. 87, pp. 103-113, 2016
VII
Conference Publications:
1. W. Wang, S. Venkatesan, A. Sexton, S. Kalyanasundaram. “Stamp forming of
polypropylene based polymer-Metal laminates: The effect of process parameters
on spring back.” International Conference on Advanced Material and
Manufacturing Science (ICAMMS), Beijing, China, December 2012.
2. W. Wang, S. Kalyanasundaram. “Dome forming study on polypropylene
aluminium laminate.” International Conference on Mechanical Engineering and
Material Science (MEMS), Shanghai, China, December 2012.
3. W. Wang, S. Kalyanasundaram. “Forming analysis of chopped flax fibre
reinforced polypropylene composites.” European Conference on Composite
Materials, Seville, Spain, June 2014.
4. W. Wang, A. Lowe, S. Kalyanasundaram. “Non-linear quasi-isotropic material
modelling of chopped flax fibre reinforced polypropylene composites in stamp
forming.” 8th Australasian Congress on Applied Mechanics (ACAM 8),
Melbourne, Australia, November 2014.
5. W. Wang, A. Lowe, S. Kalyanasundaram. “Effect of weave structure on flax
fibres reinforced polypropylene composites in stamp forming.” 8th Australasian
Congress on Applied Mechanics (ACAM 8), Melbourne, Australia, November
2014.

VIII

IX
Awards
1. Awarded with the 2nd place for Postgraduate Student Best Paper Award, 8th
Australasian Congress on Applied Mechanics (ACAM 8), Melbourne, Australia,
November 2014.

X
XI
Acknowledgements
I would like to thank A/Prof. Shankar Kalyanasundaram, my supervisor in chief, for the
opportunity to be a part of this great research. I would also like to thank my advisers Dr.
Adrian Lowe for his support during my PhD studies.
This project would not have been successful without the advice, support and
knowledge provided by Anthony Sexton, Sebastian Davey, and Nima Akhavan Zanjani.
I am forever indebted to them for helping me with the equipment and software and for
their patience with my questions from the beginning.
Thank you to my colleagues Jae Nam and Davood Rahiminejad for their
discussions, support and help in overcoming problems that we have encountered in this
research project.
I would also like to thank my cosines (Yunke Yu and Gang Zhang) who shared a
great childhood with me. Their support was, is and will always be my best motivation
and determination for pursuing success.
I can never thank my father (Yi Wang) and mother (Lihui Wen) enough for their
support, without which I never would have achieved so much in my life. My biggest
thanks are to my wife Yili Wang. She is the reason I could put all of myself into this
challenging research project. Her support, encouragement, and love during my PhD
studies, especially in those difficult moments, became the true motivation for me to
carry on. It is the best present from the life that our daughter will join our family shortly,
and she will be attending my graduation ceremony with the whole family. It will
definitely be the memory of the life for sharing this great moment with my princess.

XII
XIII
Abstract
Weight reduction can significantly contribute to reducing Green House Gas (GHG)
emissions from vehicles. In addition to the significant increase in the demand on
transportation due to the increase in global population, there is an urgent need to reduce
the weight of vehicles to increase their fuel efficiency and therefore to reduce global
GHG emissions. Driven by ecological and economic interests, there has been an
increasing use of plant based material systems in various applications over the past
decade. Currently, one of the main challenges in using these material systems for use in
automotive components is to understand the forming behaviour of this class of material
systems.
This work is designed to answer two key questions regarding the forming of natural
fibre composites. The first one is when does failure initiate in this class of material
systems, and what is the most effective measure for predicting it? To answer this
question, hourglass samples with varying sample widths are stretched and then formed
through the stamping press machine. The ARAMIS™ system beneath the press machine
provides displacement and strain deformation which could be used to determine the
failure behaviour of the composites. This study proposes a new FLC for woven
composites, which is more effectively in predicting the failure behaviour of the natural
fibre composite than the conventional method as it can successfully eliminate the path
dependency effect. This innovative failure criterion has been proven to be more
effective than the existing failure criterion through FEA simulations. The second
question that the current work tries to answer is how to improve the formability of
natural fibre composites. The approach here is to perform dome forming tests in
different treatment conditions, namely preheating, water treatment, and tailored blanks.

Abstract
XIV
It is found that, among all treatment, the water treatment works the best, and is more
effective than the conventional treatment of preheating. Woven composite with a
tailored shape becomes much more formable due to its woven nature of fibre
reinforcement, while such improvement is insignificant in nonwoven composites. This
study lays a foundation for rapid forming of this class of material system, and will in
turn lead to possible weight savings in future vehicles.
XV
Nomenclature
C.A
CNFC
DSC
E
FEA
FLC
FLD
FML
FTIR
GHG
M.A
NFC
PEEK
PLA
PML
PPS
R
T
TG
t
TGA
Cloudy Ammonia
Chopped natural fibre composite
Differential Scanning Calorimetry
Modulus
Finite Element Analysis
Forming Limit Curve
Forming Limit Diagram
Fibre Metal Laminate
Fourier Transform Infrared spectroscopy
Green-House Gas
Maleic acid
Natural fibre composite
Polyether ether ketone
Polylactic acid
Polymer metal laminate
Polyphenylene Sulphide
Radius
Temperature
Thermogravimetry
time
Thermogravimetric Analysis

Nomenclature
XVI
V
ρ
λ
β
𝜎
휀1
Volume
density
Lame’s Constant
Strain Ratio
Stress
Major Strain
휀2
휀𝑋
휀𝑌
∆휀𝑋
∆휀𝑌
휀𝐹𝑖𝑏𝑟𝑒
Minor Strain
Strain along the X direction
Strain along the Y direction
Incremental Strain along the X direction
Incremental Strain along the Y direction
Amount of strain acting on the fibres
XVII
Table of Contents
Chapter 1 Introduction ................................................................................................... 1
1.1 Motivation ............................................................................................................... 1
1.2 Research objectives ................................................................................................. 2
1.3 Thesis Structure ....................................................................................................... 2
Chapter 2 Literature Review ........................................................................................ 5
2.1 Introduction ............................................................................................................. 5
2.2 Fibre reinforced composites .................................................................................... 5
2.2.1 Natural fibres .................................................................................................... 7
2.2.2 Natural fibre reinforced polymer composites ................................................. 10
2.3 Composite forming ................................................................................................ 15
2.4 Failure behaviour and failure criteria for composite materials ............................. 21
2.4.1 Failure behaviour ............................................................................................ 21
2.4.2 Failure criteria ................................................................................................. 25
2.5 Finite element analysis .......................................................................................... 36
2.5.1 Implicit method ............................................................................................... 36
2.5.2 Explicit method ............................................................................................... 37
2.5.3 Shell formulation ............................................................................................ 39
2.5.4 FEA simulations of composite forming .......................................................... 41
2.6 Summary ............................................................................................................... 45
Chapter 3 Materials and Methodology ....................................................................... 47
3.1 Introduction ........................................................................................................... 47
3.2 Materials ................................................................................................................ 47
3.3 Treatment methods ................................................................................................ 48
3.3.1 Preheating ....................................................................................................... 49
3.3.2 Chemical treatments ....................................................................................... 52
3.3.3 Tailored blanks ............................................................................................... 53
Table of Content
XVIII
3.4 Experimental setup ................................................................................................ 54
3.4.1 Tensile Tests ................................................................................................... 54
3.4.2 Stretch forming ............................................................................................... 55
3.4.3 Dome forming tests......................................................................................... 60
3.5 Summary ............................................................................................................... 60
Chapter 4 Characterisation of Mechanical Properties .............................................. 63
4.1 Introduction ........................................................................................................... 63
4.2 Preheating treatments ............................................................................................ 64
4.2.1 Effect of temperature on tensile properties ..................................................... 64
4.2.2 Mechanisms behind thermal degradation ....................................................... 65
4.3 Chemical treatments .............................................................................................. 67
4.3.1 Composites behaviour during moisture ingress and egress ............................ 67
4.3.2 Variations of the mechanical properties ......................................................... 71
4.4 Summary ............................................................................................................... 77
Chapter 5 Stretch Forming Tests ................................................................................ 79
5.1 Introduction ........................................................................................................... 79
5.2 Experimental observations .................................................................................... 80
5.2.1 NFC materials ................................................................................................. 81
5.2.1.1 Evolution of surface strain ratios ............................................................. 82
5.2.1.2 Fibre strain calculations ........................................................................... 90
5.2.1.3 Anomolies observed in the conventional FLD ........................................ 95
5.2.1.4 Investigation on the path dependency effect on the conventional FLC... 98
5.2.1.5 Establishing the new FLC for the composite ......................................... 101
5.2.1.6 Comparison with the Maximum Strain failure criterion........................ 106
5.2.2 CNFC materials ............................................................................................ 107
5.2.2.1 Evolution of surface strain ratios ........................................................... 108
5.2.2.2 Constructing the FLC ............................................................................ 111
5.3 FEA simulations .................................................................................................. 114
XIX
5.3.1 Material models ............................................................................................ 114
5.3.2 Model parameters ......................................................................................... 115
5.3.3 Implementing the failure criterion in FEA simulations ................................ 116
5.3.4 NFC materials ............................................................................................... 118
5.3.4.1 Evolution of strain path at the pole ........................................................ 118
5.3.4.2 Comparison between the new FLC with the Maximum Strain failure
criterion .................................................................................................................. 119
5.3.4.3 Predicting failure in different conditions of water treatment ................. 124
5.3.5 CNFC materials ............................................................................................ 125
5.3.5.1 Evolution of strain path at the pole ........................................................ 125
5.3.5.2 Validating the FLC ................................................................................ 127
5.4 Summary ............................................................................................................. 129
Chapter 6 Dome Forming Tests ................................................................................. 133
6.1 Introduction ......................................................................................................... 133
6.2 Experimental observations .................................................................................. 134
6.2.1 NFC materials ............................................................................................... 134
6.2.1.1 Failure depths in dome forming tests ..................................................... 135
6.2.1.2 Examination on failure regions .............................................................. 139
6.2.1.3 Effect of treatments on forming modes ................................................. 146
6.2.2 CNFC materials ............................................................................................ 157
6.2.2.1 Failure depths in dome forming tests ..................................................... 157
6.2.2.2 Examination on the failure regions ........................................................ 161
6.2.2.3 Effect of treatments on forming modes ................................................. 164
6.3 FEA simulations .................................................................................................. 174
6.3.1 NFC materials ............................................................................................... 175
6.3.1.1 Strain evolution at the points of interest ............................................... 176
6.3.1.2 Validating the new FLC in different forming conditions ..................... 178
Table of Content
XX
6.3.1.3 In-plane displacement at the flange region ........................................... 179
6.3.2 CNFC materials ............................................................................................ 182
6.3.2.1 Strain evolution at the points of interest ................................................ 182
6.3.2.2 Validating the FLC in different forming conditions .............................. 183
6.3.2.3 In-plane displacement at the flange region ............................................ 185
6.4 Summary ............................................................................................................. 188
Chapter 7 Conclusions and Future Work................................................................. 191
7.1 Introduction ......................................................................................................... 191
7.2 Contributions ....................................................................................................... 191
7.3 Future work ......................................................................................................... 193
Bibliography ................................................................................................................ 195
XXI
List of Figures
Figure 2.1: Composite manufacturing process [20] .......................................................... 7
Figure 2.2: Subdivisions of natural fibres based on their origin, from [16]...................... 8
Figure 2.3: Structure of a typical biofibre [16] ................................................................. 9
Figure 2.4: Failure envelope for 90° unidirectional laminae [90]. .................................. 27
Figure 2.5: The path-dependent FLC constructed by Zanjani et al. [73] ........................ 32
Figure 2.6: The three-dimensional FLD proposed by Sexton [19]. ................................ 34
Figure 2.7: Flow chart of the material model [19]. ......................................................... 43
Figure 3.1: The pre-consolidated composites. (a) NFC; (b) CNFC ................................ 48
Figure 3.2: The equipment used for the preheating treatment. (a) heat press; (b) heat
chamber ........................................................................................................................... 50
Figure 3.3: Schematic of the equipment used for preparing FTIR specimens. 1:
temperature controller; 2: nitrogen-gas bottle; 3: rotameter; 4: thermocouple; 5:
stainless-steel boat; 6: horizontal electric furnace .......................................................... 51
Figure 3.4: Experimental geometries of the tailored blanks ........................................... 54
Figure 3.5: The Instron™ 4505 testing frame used in the tensile tests ........................... 55
Figure 3.6: Integration of the ARAMIS™ system with the stamping press ................... 56
Figure 3.7: Hourglass geometries (a); and the effect of sample width on the forming
mode of the sample (b) .................................................................................................... 58
Figure 3.8 Schematic of the lock-ring used in stretch forming tests ............................... 58
Figure 4.1: High temperature tensile behaviour of natural fibre composites. (a) NFC; (b)
CNFC. ............................................................................................................................. 64
Figure 4.2: FTIR curves of the NFC at 23 ˚C, 120 ˚C and 150 ˚C ................................. 65
Figure 4.3: TG mass curve of flax/pp composite ............................................................ 65
List of Figures
XXII
Figure 4.4: Differential Scanning Calorimetry (DSC) curves of the flax reinforced
polypropylene composite ................................................................................................ 66
Figure 4.5: The rate of solution uptake, and subsequent moisture egress from saturation
for the NFC rectangular samples, (a) Moisture ingression process; (b) Moisture
egression process............................................................................................................. 68
Figure 4.6: The rate of solution uptake, and subsequent moisture egress from saturation
for the CNFC rectangular samples, (a) Moisture ingression process; (b) Moisture
egression process............................................................................................................. 68
Figure 4.7: Optical micrographs of NFC composite (left) and the CNFC composite
(right). The top images are of the composite surface while the bottom images are of the
central cross-section. ....................................................................................................... 70
Figure 4.8: Variations in mechanical properties of the NFC under different chemical
treatments obtained through tensile tests, (a) tensile strain; (b) tensile modulus; and (c)
strength ............................................................................................................................ 71
Figure 4.9: Tensile property data for CNFC samples under various aqueous treatments
showing (a) tensile strain; (b) tensile modulus; and (c) strength. ................................... 73
Figure 4.10: Electron microscope images of CNFC reinforced PP composites showing
(a) untreated; (b) saturated; and (c) redried samples that have been fractured under
simple tensile testing ....................................................................................................... 76
Figure 5.1: Typical strain evolution at the pole in a stretch forming test ....................... 80
Figure 5.2: Evolution of contours of surface strain ratio (deformation mode) and FLD
for UF200 specimen. ....................................................................................................... 82
Figure 5.3: Evolution of contours of surface strain ratio (deformation mode) and FLD,
(a) UF100; (b) UO100..................................................................................................... 84
Figure 5.4: Evolution of contours of surface strain ratio (deformation mode) and FLD,
(a) UF70; (b) UO70......................................................................................................... 86
XXIII
Figure 5.5: Evolution of contours of surface strain ratio (deformation mode) and FLD,
(a) UF25; (b) UO25. ........................................................................................................ 88
Figure 5.6: Illustration of how to calculate fibre strain (a) overview; (b) normal strain in
the x direction; (c) normal strain in the y direction; and (d) shear strain ........................ 91
Figure 5.7: Flow chart of the Python script developed for the ARAMIS™ system. ...... 95
Figure 5.8: Surface strain distributions of the UF100 and UO100 specimens at the stage
of failure (a) the conventional FLD; (b) the new FLD.................................................... 96
Figure 5.9: Comparison of a tensile specimen (left) with a UO70 specimen (right) (a)
tested samples; (b) the evolution of the strain path on the conventional FLD (left) and
on the new FLD (right) ................................................................................................... 98
Figure 5.10: Strain evolutions (a) the UO70 specimen; (b) the tensile specimen......... 100
Figure 5.11: Formation of the new FLC for the untreated composite. From left to right
at top: formed specimens are F25, F70, F100 and F200. .............................................. 102
Figure 5.12: The new FLCs for the composite in different conditions of water treatment.
The tested samples are F25, F70, F100, and F200 (water-treated, redried, and untreated
from top to bottom, respectively) .................................................................................. 104
Figure 5.13: Comparison between the new FLC and the Maximum Strain failure
criterion ......................................................................................................................... 106
Figure 5.14: Evolution of contours of surface strain ratio (deformation mode) and FLD.
(a) U200; (b) U100; (c) U70; and (d) U25 .................................................................... 109
Figure 5.15: FLC of the CNFC materials obtained from stretch forming tests ............ 112
Figure 5.16: Effect of water treatment on FLC for CNFC materials ............................ 113
Figure 5.17: Layup of model geometries ...................................................................... 116
Figure 5.18: Flow chart of the user-defined material routine for NFCs ....................... 117
Figure 5.19: Comparison of strain evolution at the pole between experimental
observations and FEA simulations (a) 0°/90° samples; (b) 45°/-45° samples .............. 118
List of Figures
XXIV
Figure 5.20: Typical failure regions observed in the formed specimens (circled) and as
predicted by the new FLC in FEA simulations (red patches) (a) F25; and (b) O25 ..... 119
Figure 5.21: Comparison of the forming depths for NFC materials ............................. 121
Figure 5.22: Strain ratio of the failure regions in 45°/-45° specimens. Left: regions of
failure predicted by FEA simulations (coloured in red); right: Strain ratio distribution of
the top-right quarter of the specimen ............................................................................ 123
Figure 5.23: Comparison of forming depths observed in experiments, and as predicted
by the FEA simulations ................................................................................................. 125
Figure 5.24: Strain evolution of the pole for untreated CNFCs .................................... 125
Figure 5.25: The failure regions observed in tested samples (left), and as predicted by
FEA simulations (right). ............................................................................................... 127
Figure 5.26: Comparison of the failure depths for CNFC materials ............................. 129
Figure 6.1: Comparison of forming depths ................................................................... 135
Figure 6.2: Failure depths of NFCs at different temperatures ...................................... 137
Figure 6.3: Surface contour plot of fibre strains from (a) the 120˚C experimental case;
(b) the 150˚C experimental case ................................................................................... 139
Figure 6.4: Microscopic examination of the fracture .................................................... 140
Figure 6.5: Tested samples formed (a) below 100˚C; (b) between 100˚C and 150˚C; (c)
at 160˚C; (d) close-up view of fibre pull out with some fibre breakage in the sample
formed at 160˚C. ........................................................................................................... 141
Figure 6.6: Buckling of a flax/pp composite tested at 120˚C ....................................... 143
Figure 6.7: Water-treated natural fibre composites after forming to a depth of 55 mm. (a)
diameter of 180 mm; (b) diameter of 200 mm .............................................................. 144
Figure 6.8: The R65 specimen (a) from the right camera of the ARAMIS system; (b) the
tested sample ................................................................................................................. 145
XXV
Figure 6.9: Comparison of surface strain distribution at the stage of failure at different
forming temperatures. (a) FLD; (b) Quantitative illustrations ...................................... 147
Figure 6.10: Comparisons of surface strain distribution in different conditions of water
treatment. (a) FLD; (b) Quantitative illustrations ......................................................... 150
Figure 6.11: Surface strain evolutions of water-treated specimen at a forming depth of
20 mm, and 30 mm. (a) FLD; (b) Quantitative illustrations ......................................... 153
Figure 6.12: Comparison of surface strain deformation (a) FLD; (b) Quantitative
illustrations .................................................................................................................... 155
Figure 6.13: Comparison of the forming depths of CNFC materials, at the onset of strain
concentration (white bars) and at catastrophic failure (yellow bars). ........................... 157
Figure 6.14: Failure depths of CNFCs at different temperatures: at the onset of strain
concentration (blue) and catastrophic failure (red). ...................................................... 159
Figure 6.15: Surface contour plots of composites formed at 23 °C (a); 130 °C (b); and
150 °C (c). ..................................................................................................................... 161
Figure 6.16: The CNFC sample. (a) Typical failure regions; (b) Typical punch load
versus displacement curve; (c) Sample formed at a temperature of 160°C. ................. 162
Figure 6.17: Comparison of surface strain distributions of CNFCs at different forming
temperatures, (a) FLD; (b) Quantitative illustrations. ................................................... 165
Figure 6.18: Comparison of surface strain distributions of CNFCs in different
conditions of the water treatment. (a) FLD; (b) Quantitative illustrations ................... 168
Figure 6.19: Comparison of surface strain distributions at different depths of the water-
treated sample. (a) FLD; (b) Quantitative illustrations ................................................. 170
Figure 6.20: Comparison of surface strain deformation of tailored CNFC samples. (a)
FLD; (b) Quantitative illustrations ................................................................................ 172
Figure 6.21: Locations of points of interest (A, B and C) ............................................ 175
List of Figures
XXVI
Figure 6.22: Strain evolution at points of interest. (a) Untreated; (b) Water-treated; and
(c) Redried..................................................................................................................... 176
Figure 6.23: Comparison of failure regions observed on the formed samples and those
suggested by FEA simulations, left: untreated; right: redried. ..................................... 178
Figure 6.24: Comparison of failure depths observed in experiments (blue) and those
suggested by the new FLC (red). .................................................................................. 179
Figure 6.25: Flange displacement of the composite at a forming depth of 19 mm. (a)
untreated; (b) water-treated; (c) redried; and (d) water-treated specimen at a forming
depth of 40 mm ............................................................................................................. 181
Figure 6.26: Strain evolution at points of interest for (a) Untreated; (b) Water-treated;
and (c) Redried samples. ............................................................................................... 182
Figure 6.27: Comparison of failure regions observed in formed CNFC samples and that
suggested by FEA simulations (red). Left: untreated; Middle: water-treated; Right:
redried. .......................................................................................................................... 184
Figure 6.28: Comparison of forming depths observed in experiments (blue) and those
suggested by FLC (red) in different forming conditions .............................................. 185
Figure 6.29: Flange displacement of the CNFC at a forming depth of 10 mm. (a)
untreated; (b) saturated; (c) redried specimen; and (d) the saturated specimen at a
forming depth of 17 mm ............................................................................................... 187

XXVII
List of Tables
Table 2.1: Cell wall polymers responsible for the properties of lignocellulosics fibres ... 9
Table 2.2: Summary of deformation modes and corresponding strain ratio for sheet
metals .............................................................................................................................. 31
Table 3.1: Specifications of the ARAMIS™ system ...................................................... 56
Table 3.2: Parameters and corresponding levels used in stretch forming experiment .... 59
Table 3.3: The treatments and their levels applied in dome forming tests ..................... 60
Table 5.1: Comparison of regions where failure initiates ............................................. 120

List of Figures
XXVIII
List of Tables
1
Chapter 1
Introduction
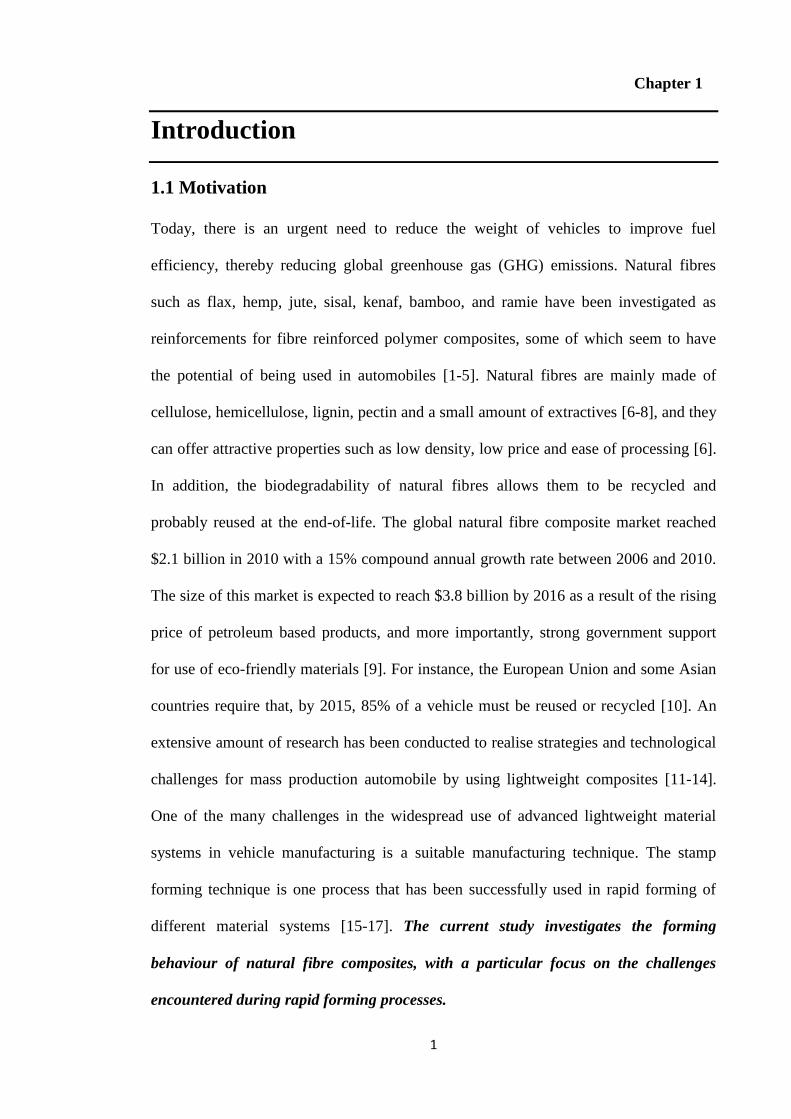
1.1 Motivation
Today, there is an urgent need to reduce the weight of vehicles to improve fuel
efficiency, thereby reducing global greenhouse gas (GHG) emissions. Natural fibres
such as flax, hemp, jute, sisal, kenaf, bamboo, and ramie have been investigated as
reinforcements for fibre reinforced polymer composites, some of which seem to have
the potential of being used in automobiles [1-5]. Natural fibres are mainly made of
cellulose, hemicellulose, lignin, pectin and a small amount of extractives [6-8], and they
can offer attractive properties such as low density, low price and ease of processing [6].
In addition, the biodegradability of natural fibres allows them to be recycled and
probably reused at the end-of-life. The global natural fibre composite market reached
$2.1 billion in 2010 with a 15% compound annual growth rate between 2006 and 2010.
The size of this market is expected to reach $3.8 billion by 2016 as a result of the rising
price of petroleum based products, and more importantly, strong government support
for use of eco-friendly materials [9]. For instance, the European Union and some Asian
countries require that, by 2015, 85% of a vehicle must be reused or recycled [10]. An
extensive amount of research has been conducted to realise strategies and technological
challenges for mass production automobile by using lightweight composites [11-14].
One of the many challenges in the widespread use of advanced lightweight material
systems in vehicle manufacturing is a suitable manufacturing technique. The stamp
forming technique is one process that has been successfully used in rapid forming of
different material systems [15-17]. The current study investigates the forming
behaviour of natural fibre composites, with a particular focus on the challenges
encountered during rapid forming processes.
Introduction
2
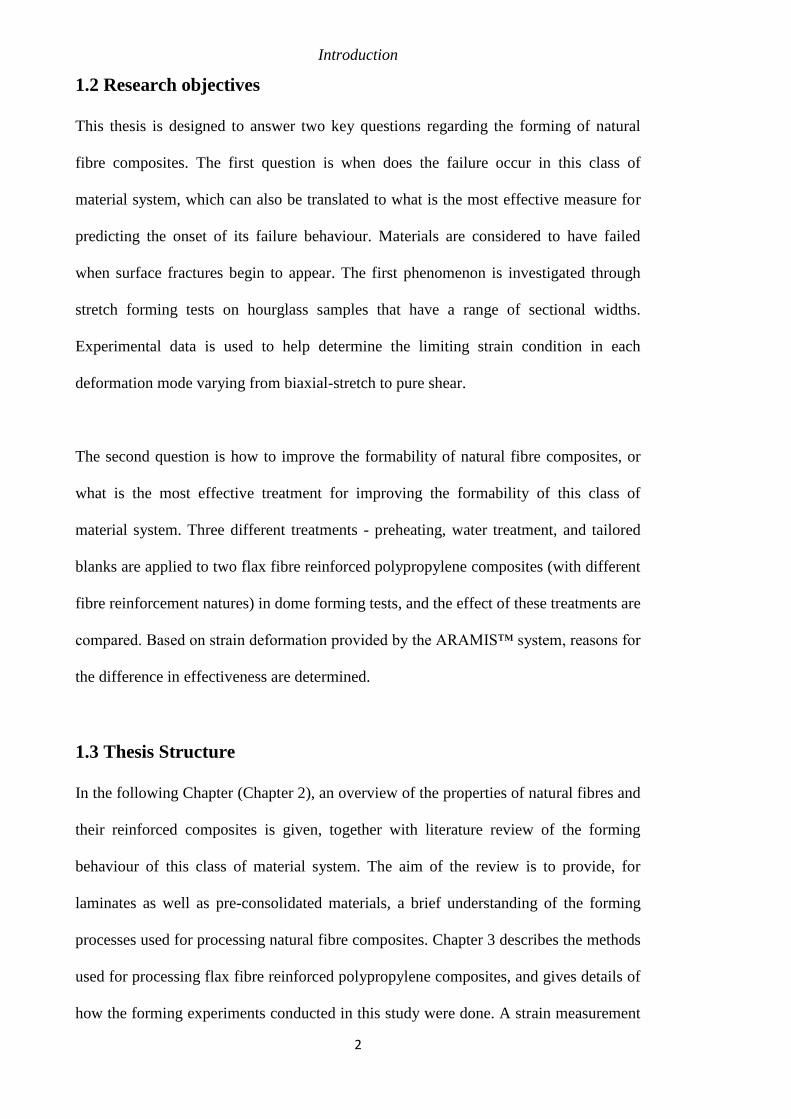
1.2 Research objectives
This thesis is designed to answer two key questions regarding the forming of natural
fibre composites. The first question is when does the failure occur in this class of
material system, which can also be translated to what is the most effective measure for
predicting the onset of its failure behaviour. Materials are considered to have failed
when surface fractures begin to appear. The first phenomenon is investigated through
stretch forming tests on hourglass samples that have a range of sectional widths.
Experimental data is used to help determine the limiting strain condition in each
deformation mode varying from biaxial-stretch to pure shear.
The second question is how to improve the formability of natural fibre composites, or
what is the most effective treatment for improving the formability of this class of
material system. Three different treatments - preheating, water treatment, and tailored
blanks are applied to two flax fibre reinforced polypropylene composites (with different
fibre reinforcement natures) in dome forming tests, and the effect of these treatments are
compared. Based on strain deformation provided by the ARAMIS™ system, reasons for
the difference in effectiveness are determined.
1.3 Thesis Structure
In the following Chapter (Chapter 2), an overview of the properties of natural fibres and
their reinforced composites is given, together with literature review of the forming
behaviour of this class of material system. The aim of the review is to provide, for
laminates as well as pre-consolidated materials, a brief understanding of the forming
processes used for processing natural fibre composites. Chapter 3 describes the methods
used for processing flax fibre reinforced polypropylene composites, and gives details of
how the forming experiments conducted in this study were done. A strain measurement

§1.3 Thesis Structure
3
system, the ARAMIS system, is used study the forming behaviour of composite
materials. Chapters 4, 5, and 6 give detailed observations of the forming tests performed
on the two natural fibre composites used. FEA simulations are also developed to obtain
the information which cannot be observed during forming as well as to examine the
effectiveness of failure criteria proposed in this study. The aim of these three Chapters
is to provide answers to the two key questions set out in Section 1.2. Finally,
conclusions and recommendations for future work are presented in Chapter 7.

Introduction
4
§2.1 Introduction
5
Chapter 2
Literature Review
2.1 Introduction
This Chapter presents an overview of background knowledge related to forming of
composite materials, both in experiments and in FEA simulations. The properties of
fibres and their reinforced composites are studied. The methods that have been used in
forming composite materials are reviewed, with a particular interest in the failure
behaviour of composite materials. Finally, the procedure of developing FEA
simulations is described in detail.
2.2 Fibre reinforced composites
Most materials can be categorised into one of the following four classes: metal, ceramic,
polymer and composite. Composite materials are made of two or more different
materials, and usually consist of fibres to carry the load and a matrix to transfer the load
between the fibres. Therefore, the fibres usually have high strength and stiffness,
whereas the matrix has a higher elongation to failure. Based on the type of polymer
used to create the matrix, fibre reinforced composites can be classified into two different
categories of thermoset and thermoplastic. Common matrices for thermoset materials
include vinylester, epoxies, polyesters and so on, whereas thermoplastic materials
usually have matrices such as Polypropylene (PP), Poly-ether-ether-ketone (PEEK), and
Polyphenyle Sulphide (PPS) [18].
Thermoset composites use chemical cross-linking of low weight monomers and a
prepolymer to form a high weight polymer network, resulting in a very low viscosity
liquid. Thermoset matrices are typically liquid or malleable prior to curing, during
Literature Review
6
which thermoset resin is heated to melting and then recrystallizes which occurs through
the cross-link of the molecular chain. Due to the nature of the cross-linking of the
polymer molecules in thermosets, the polymer cannot convert back to a liquid form
after the initial cure, meaning that thermoset composites must be cured in their final
configuration in a mold [12]. This irreversible process is usually achieved through the
application of temperature through heating or UV light radiation, or pressure or a
combination of both. This process can also be carried out through a catalyst or agent.
The advantages of thermoset composites include very low creep, stress relaxation,
increased bond strengths between the fibres and matrices, maintaining the mechanical
characteristics at high temperatures, and exhibiting good chemical resistance [18, 19].
In contrast, thermoplastic composites are typically solid and liquefy when heated above
their melting temperatures, and then re-solidify when the temperature drops below the
re-crystallization temperature. Thermoplastic composites have many advantages over
thermoset, including high temperature damage tolerance, high fracture resistance, low
manufacture cost, high recyclability, infinite shelf life, ease of material handling, better
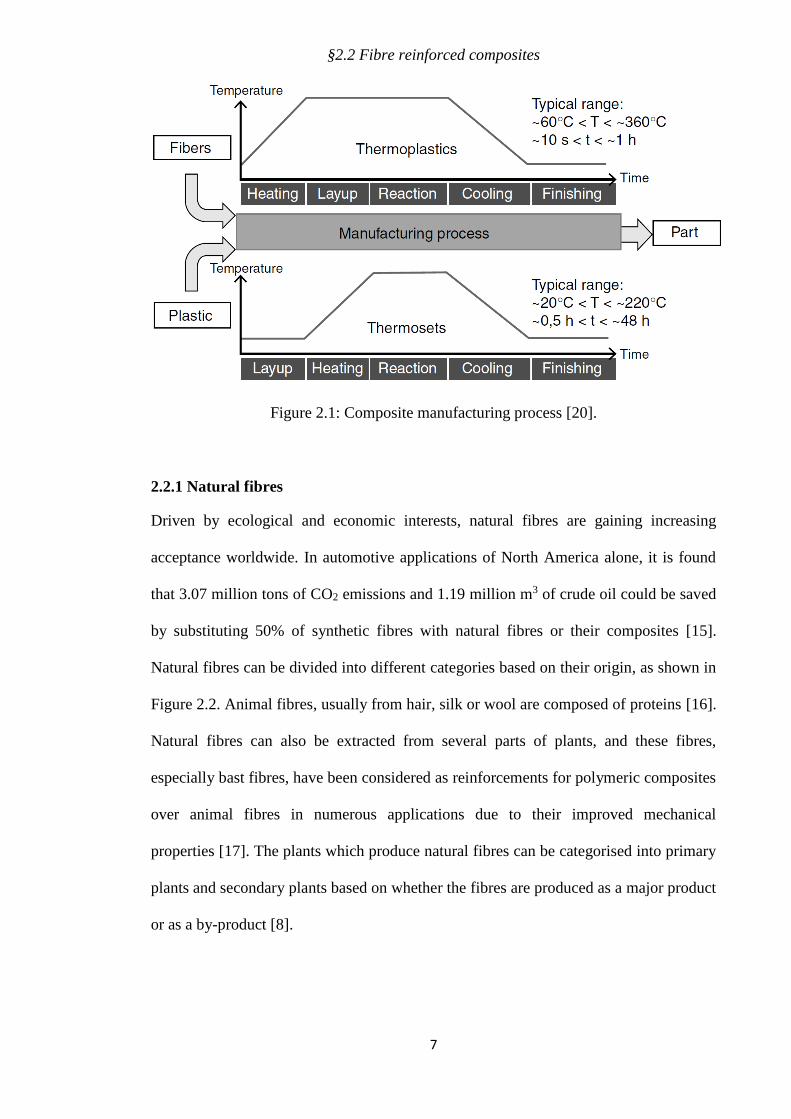
toughness, and large strain to failure [18, 19]. Due to the difference in the nature of
thermoplastic and thermoset, the manufacturing procedures of composites can be
illustrated from the Figure 2.1. Thermoset composites require heating such that the
matrices can flow. Because of the matrix cures into a fixed cross-linked solid, the curing
process limits the time available for material processing and adding new features [20].
The extended forming time of thermoset composites compared to thermoplastic
composites is one of the major reasons of the increased use of thermoplastic composites,
especially in industries where there is a need of mass production to meet market demand.
§2.2 Fibre reinforced composites
7
Figure 2.1: Composite manufacturing process [20].
2.2.1 Natural fibres
Driven by ecological and economic interests, natural fibres are gaining increasing
acceptance worldwide. In automotive applications of North America alone, it is found
that 3.07 million tons of CO2 emissions and 1.19 million m3 of crude oil could be saved
by substituting 50% of synthetic fibres with natural fibres or their composites [15].
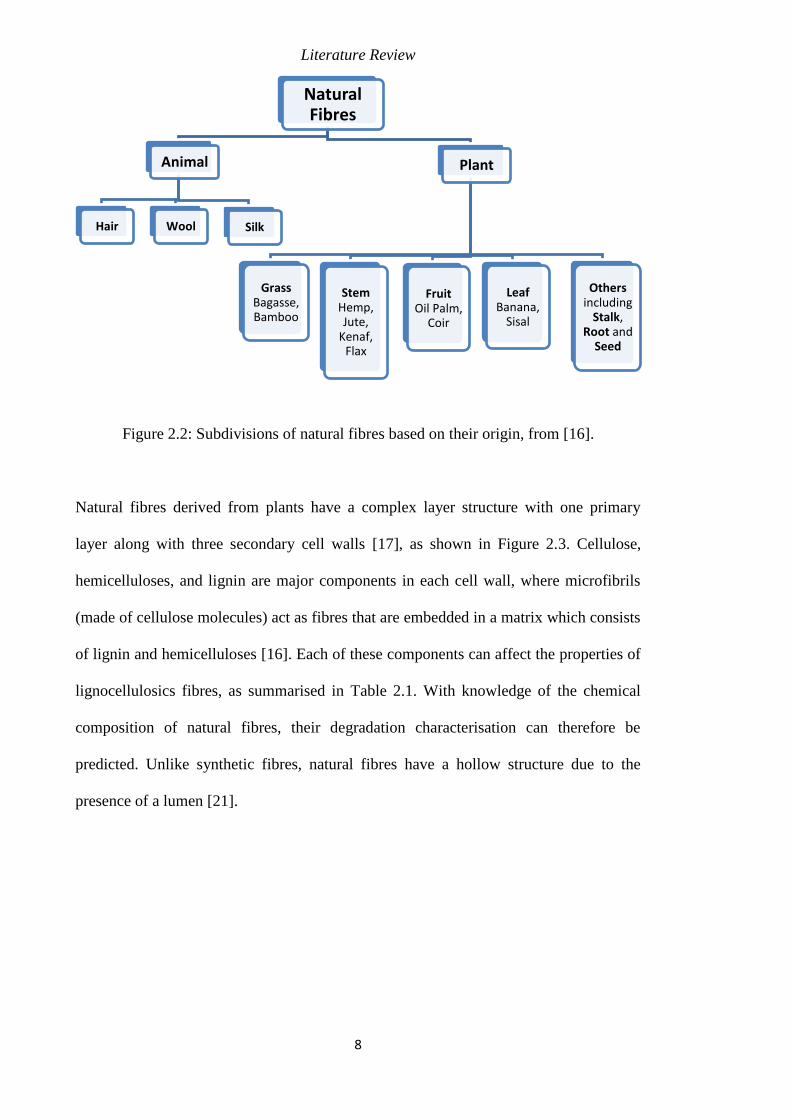
Natural fibres can be divided into different categories based on their origin, as shown in
Figure 2.2. Animal fibres, usually from hair, silk or wool are composed of proteins [16].
Natural fibres can also be extracted from several parts of plants, and these fibres,
especially bast fibres, have been considered as reinforcements for polymeric composites
over animal fibres in numerous applications due to their improved mechanical
properties [17]. The plants which produce natural fibres can be categorised into primary
plants and secondary plants based on whether the fibres are produced as a major product
or as a by-product [8].
Literature Review
8
Figure 2.2: Subdivisions of natural fibres based on their origin, from [16].
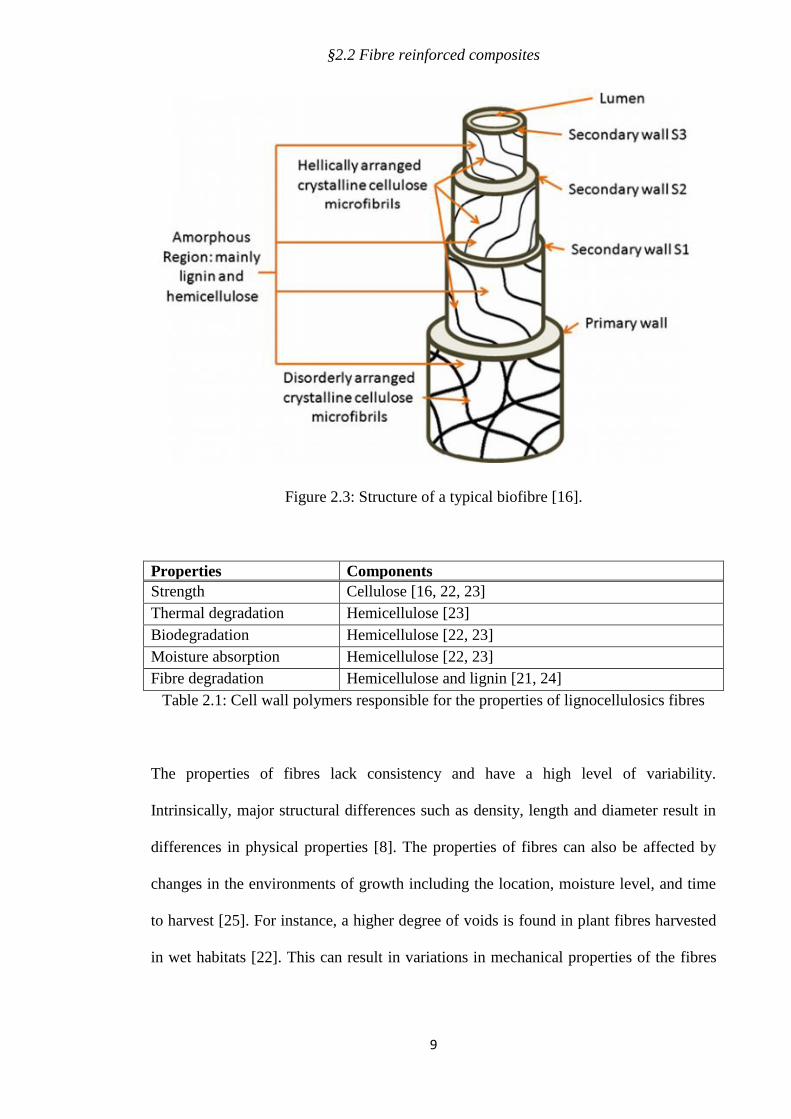
Natural fibres derived from plants have a complex layer structure with one primary
layer along with three secondary cell walls [17], as shown in Figure 2.3. Cellulose,
hemicelluloses, and lignin are major components in each cell wall, where microfibrils
(made of cellulose molecules) act as fibres that are embedded in a matrix which consists
of lignin and hemicelluloses [16]. Each of these components can affect the properties of
lignocellulosics fibres, as summarised in Table 2.1. With knowledge of the chemical
composition of natural fibres, their degradation characterisation can therefore be
predicted. Unlike synthetic fibres, natural fibres have a hollow structure due to the
presence of a lumen [21].
Natural Fibres
Animal
Hair Wool Silk
Plant
Grass Bagasse, Bamboo
Stem Hemp, Jute,
Kenaf, Flax
FruitOil Palm,
Coir
LeafBanana,
Sisal
Othersincluding
Stalk, Root and
Seed
§2.2 Fibre reinforced composites
9
Figure 2.3: Structure of a typical biofibre [16].
Properties Components
Strength Cellulose [16, 22, 23]
Thermal degradation Hemicellulose [23]
Biodegradation Hemicellulose [22, 23]
Moisture absorption Hemicellulose [22, 23]
Fibre degradation Hemicellulose and lignin [21, 24]
Table 2.1: Cell wall polymers responsible for the properties of lignocellulosics fibres
The properties of fibres lack consistency and have a high level of variability.
Intrinsically, major structural differences such as density, length and diameter result in
differences in physical properties [8]. The properties of fibres can also be affected by
changes in the environments of growth including the location, moisture level, and time
to harvest [25]. For instance, a higher degree of voids is found in plant fibres harvested
in wet habitats [22]. This can result in variations in mechanical properties of the fibres
Literature Review
10
as well as a higher saturation level when the fibre undergoes a moisture absorption
process [22, 25].
Each component that comes from natural fibres is compostable, meaning the application
of natural fibres makes energy saving possible. Beside biodegradation the recyclability
of natural fibres could extend their useful lives, minimizing raw material consumption,
and storing carbon for a longer period of time. This could in turn leads to a reduction in
global impact on environment. Le Duigou et al. [26] studied the recycling capacity of
flax/PLLA (poly(L-lactide)) bio-composites with a fibre weight fraction of 20% and
30%. Mechanical properties of composites were evaluated at beginning of the test and
right after each of repeated injection process. The property retention observed in the
experiment indicates the promising recyclability of this class of material systems.
Furthermore, Bourmaud et al. [27, 28] have shown that composites of Polypropylene
and vegetal fibres are recyclable following the European directive of using/recycling of
at least 95% of a worn vehicle weight by 2015. This finding agrees with the conclusions
from Srebrenkoska et al. [29, 30]. It was found that recycling of rice hulls or kenaf
fibres reinforced polypropylene composites is promising due to their properties remain
largely unchanged after the recycling process. It is also noted that PLA-based
composites are more sensitive to processing cycles than PP-based composites.
2.2.2 Natural fibre reinforced polymer composites
Compared to thermoset polymers, thermoplastic polymers have several advantages, and
the one most relevant to rapid forming is their ability to be reshaped [31]. Recyclability
is another major advantage of thermoplastic over thermoset [24]. Polypropylene (PP) is
a good choice for the matrix of natural fibre reinforcements due to its low cost, low
§2.2 Fibre reinforced composites
11
processing temperature (to facilitate the low thermal stability of natural fibres), and
strong hydrophobic character (which protects the hydrophilic natural fibres) [25].
Many attempts have been made to study the shortcomings of natural fibres, efforts
directed to maximise their applications in a range of industries. In general, there are two
major issues associated with natural fibre composites: low thermal resistance as well as
moisture absorption. Due to their inherently low elongation-to-failure, natural fibre
composites usually require additional treatments before forming into parts having a high
level of complexity. In auto parts manufacturing, the poor thermal resistance of natural
fibre composites is a critical barrier for widespread use because the conventional
treatment, preheating, is often not applicable to this class of material system.
Thermogravimetric analysis (TGA) has been frequently used to study the thermal
stability of natural fibres. In a typical situation, the fibre suffers a slow weight drop
when it is subjected to heat, followed by a sharp drop over a narrow range of
temperatures and finally returns back to the stable state as reactants are exhausted [17].
Due to similar characteristics, natural fibres usually share a similar TGA curve in which
almost 60% of the thermal decomposition takes place between 215˚C and 300˚C [32]. It
has been reported that lignin starts degrading at lower temperatures compared to the
other major constituents of natural fibres, cellulose and hemicellulose [33]. A better
thermal resistance can therefore be anticipated in natural fibres with low lignin content,
such as flax fibres [34], or in those natural fibres in which the lignin has been removed
by chemical treatments [33]. The thermal degradation of natural fibres is therefore an
important issue associated with manufacturing natural fibres reinforced composites,
especially since preheating is traditionally used to improve the formability of
composites during rapid forming.
Literature Review
12
The variations in structure as well as properties of natural fibres result in variation in the
performance of natural fibre reinforced composites when they are subjected to moisture
absorption processes. Athijayamani et al. [35] studied the performance of a roselle/sisal
fibre reinforced polyester hybrid composite when subjected to moisture ingression
process, and the maximum weight gain reported was 4%. A significantly higher
saturation level was observed by Wang et al. [36] for rice hulls/low density
polyethylene composites which reached a stable weight gain of 17% after being
immersed in distilled water for approximately 100 minutes.
Reduced mechanical properties of sisal/polypropylene composites have been observed
in tensile tests as a result of increased water uptake, time of immersion, and fibre
loading [37], and the driving mechanisms behind these variations was determined as the
weakening of the fibre/matrix interface. Le Duigou et al. [38] investigated a flax fibre
reinforced PLA composite with 20% fibre loading, and the composite, when saturated,
exhibited an almost halved strength, and significantly reduced stiffness, but a doubled
elongation-to-failure (compared to the untreated condition). This research also showed
that variations in elongation-to-failure were temporary, while those in strength and
stiffness were permanent. Through SEM examination of fractured surfaces, the changes
in mechanical behaviour of the composite were explained by fibre plasticization as well
as increased ductility of the PLA matrix. Similar observations have also been reported
on a sisal fibre reinforced polypropylene composite [39].
Variations in mechanical properties are reported when natural fibres are exposed to
different chemical solutions. Methacanon et al. [22] investigated variations in the tensile
properties of water hyacinth, reed, roselle and sisal fibres caused by moisture absorption
processes. A considerable increase in tensile strength was reported in all fibre yarns, and
§2.2 Fibre reinforced composites
13
the study attributed these observations to a higher amount and better orientation of
crystalline cellulose in fibres. Extra extensions and elongations were also found in wet
yarns compared to dry equivalents as the absorbed water behaved like a lubricant so that
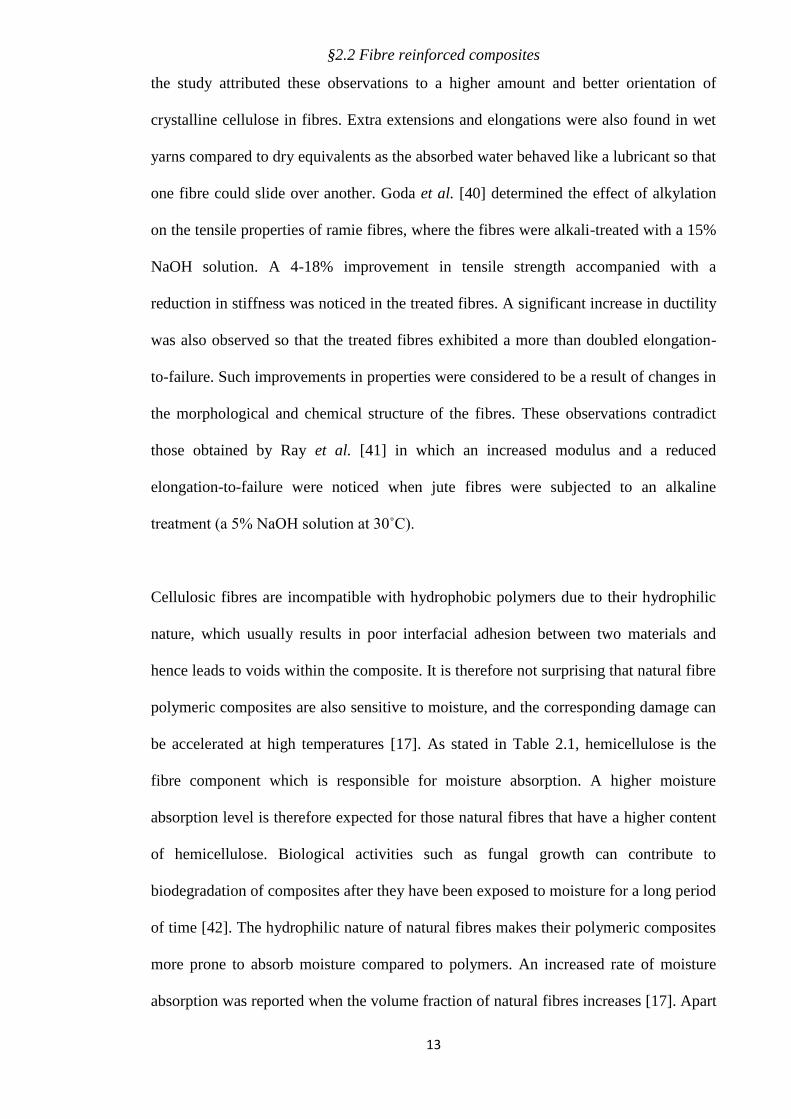
one fibre could slide over another. Goda et al. [40] determined the effect of alkylation
on the tensile properties of ramie fibres, where the fibres were alkali-treated with a 15%
NaOH solution. A 4-18% improvement in tensile strength accompanied with a
reduction in stiffness was noticed in the treated fibres. A significant increase in ductility
was also observed so that the treated fibres exhibited a more than doubled elongation-
to-failure. Such improvements in properties were considered to be a result of changes in
the morphological and chemical structure of the fibres. These observations contradict
those obtained by Ray et al. [41] in which an increased modulus and a reduced
elongation-to-failure were noticed when jute fibres were subjected to an alkaline
treatment (a 5% NaOH solution at 30˚C).
Cellulosic fibres are incompatible with hydrophobic polymers due to their hydrophilic
nature, which usually results in poor interfacial adhesion between two materials and
hence leads to voids within the composite. It is therefore not surprising that natural fibre
polymeric composites are also sensitive to moisture, and the corresponding damage can
be accelerated at high temperatures [17]. As stated in Table 2.1, hemicellulose is the
fibre component which is responsible for moisture absorption. A higher moisture
absorption level is therefore expected for those natural fibres that have a higher content
of hemicellulose. Biological activities such as fungal growth can contribute to
biodegradation of composites after they have been exposed to moisture for a long period
of time [42]. The hydrophilic nature of natural fibres makes their polymeric composites
more prone to absorb moisture compared to polymers. An increased rate of moisture
absorption was reported when the volume fraction of natural fibres increases [17]. Apart
Literature Review
14
from natural fibres, moisture exposure can also alter the interfacial conditions between
different constituents of the composite. Under such circumstances, intermolecular
hydrogen bonds are established between the water molecules and the cellulosic fibres,
causing reduced adhesion between the fibre and the matrix [17]. A weakened
fibre/matrix interface is also attributed to the fact that cellulosic fibres tend to swell
when the composite absorbs solutions [43].
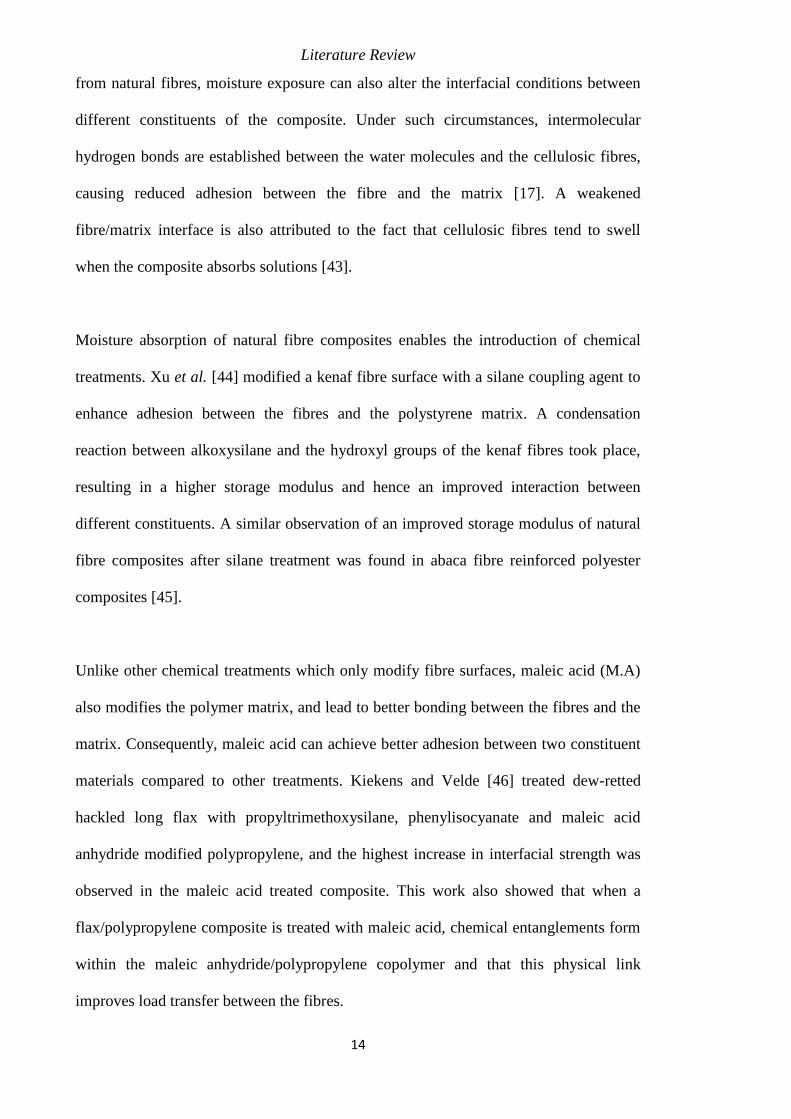
Moisture absorption of natural fibre composites enables the introduction of chemical
treatments. Xu et al. [44] modified a kenaf fibre surface with a silane coupling agent to
enhance adhesion between the fibres and the polystyrene matrix. A condensation
reaction between alkoxysilane and the hydroxyl groups of the kenaf fibres took place,
resulting in a higher storage modulus and hence an improved interaction between
different constituents. A similar observation of an improved storage modulus of natural
fibre composites after silane treatment was found in abaca fibre reinforced polyester
composites [45].
Unlike other chemical treatments which only modify fibre surfaces, maleic acid (M.A)
also modifies the polymer matrix, and lead to better bonding between the fibres and the
matrix. Consequently, maleic acid can achieve better adhesion between two constituent
materials compared to other treatments. Kiekens and Velde [46] treated dew-retted
hackled long flax with propyltrimethoxysilane, phenylisocyanate and maleic acid
anhydride modified polypropylene, and the highest increase in interfacial strength was
observed in the maleic acid treated composite. This work also showed that when a
flax/polypropylene composite is treated with maleic acid, chemical entanglements form
within the maleic anhydride/polypropylene copolymer and that this physical link
improves load transfer between the fibres.
§2.3 Composite forming
15
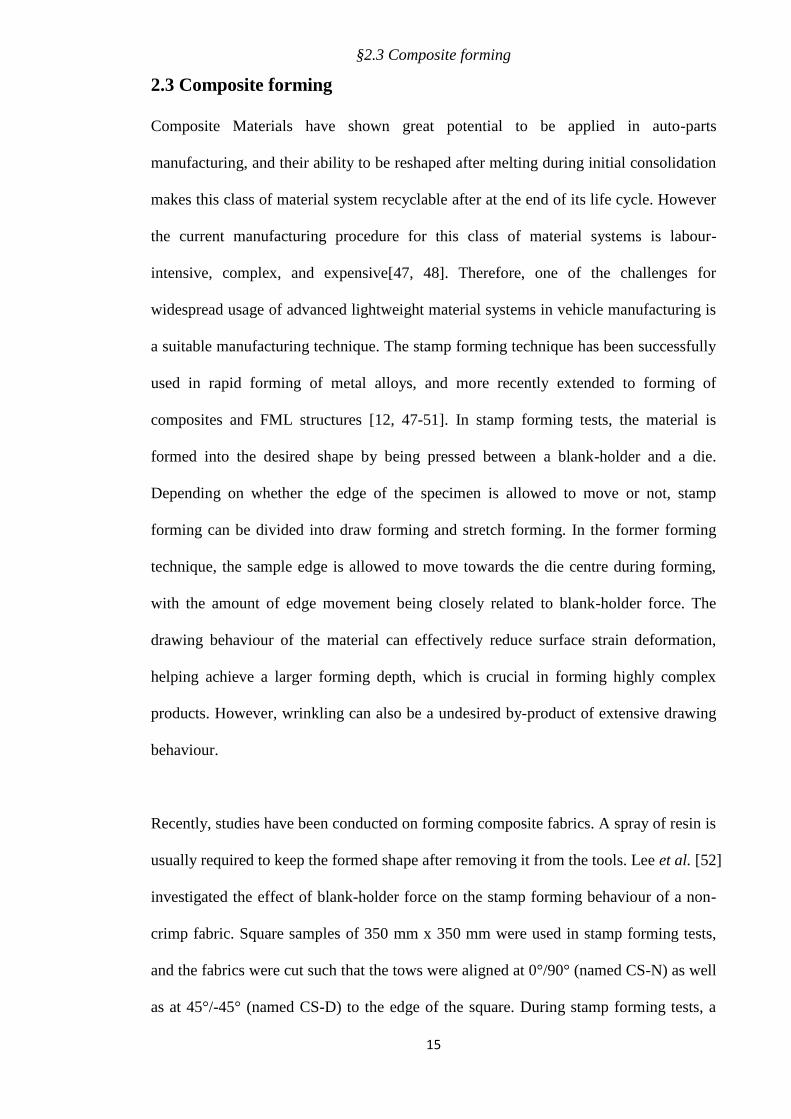
2.3 Composite forming
Composite Materials have shown great potential to be applied in auto-parts
manufacturing, and their ability to be reshaped after melting during initial consolidation
makes this class of material system recyclable after at the end of its life cycle. However
the current manufacturing procedure for this class of material systems is labour-
intensive, complex, and expensive[47, 48]. Therefore, one of the challenges for
widespread usage of advanced lightweight material systems in vehicle manufacturing is
a suitable manufacturing technique. The stamp forming technique has been successfully
used in rapid forming of metal alloys, and more recently extended to forming of
composites and FML structures [12, 47-51]. In stamp forming tests, the material is
formed into the desired shape by being pressed between a blank-holder and a die.
Depending on whether the edge of the specimen is allowed to move or not, stamp
forming can be divided into draw forming and stretch forming. In the former forming
technique, the sample edge is allowed to move towards the die centre during forming,
with the amount of edge movement being closely related to blank-holder force. The
drawing behaviour of the material can effectively reduce surface strain deformation,
helping achieve a larger forming depth, which is crucial in forming highly complex
products. However, wrinkling can also be a undesired by-product of extensive drawing
behaviour.
Recently, studies have been conducted on forming composite fabrics. A spray of resin is
usually required to keep the formed shape after removing it from the tools. Lee et al. [52]
investigated the effect of blank-holder force on the stamp forming behaviour of a non-
crimp fabric. Square samples of 350 mm x 350 mm were used in stamp forming tests,
and the fabrics were cut such that the tows were aligned at 0°/90° (named CS-N) as well
as at 45°/-45° (named CS-D) to the edge of the square. During stamp forming tests, a
Literature Review
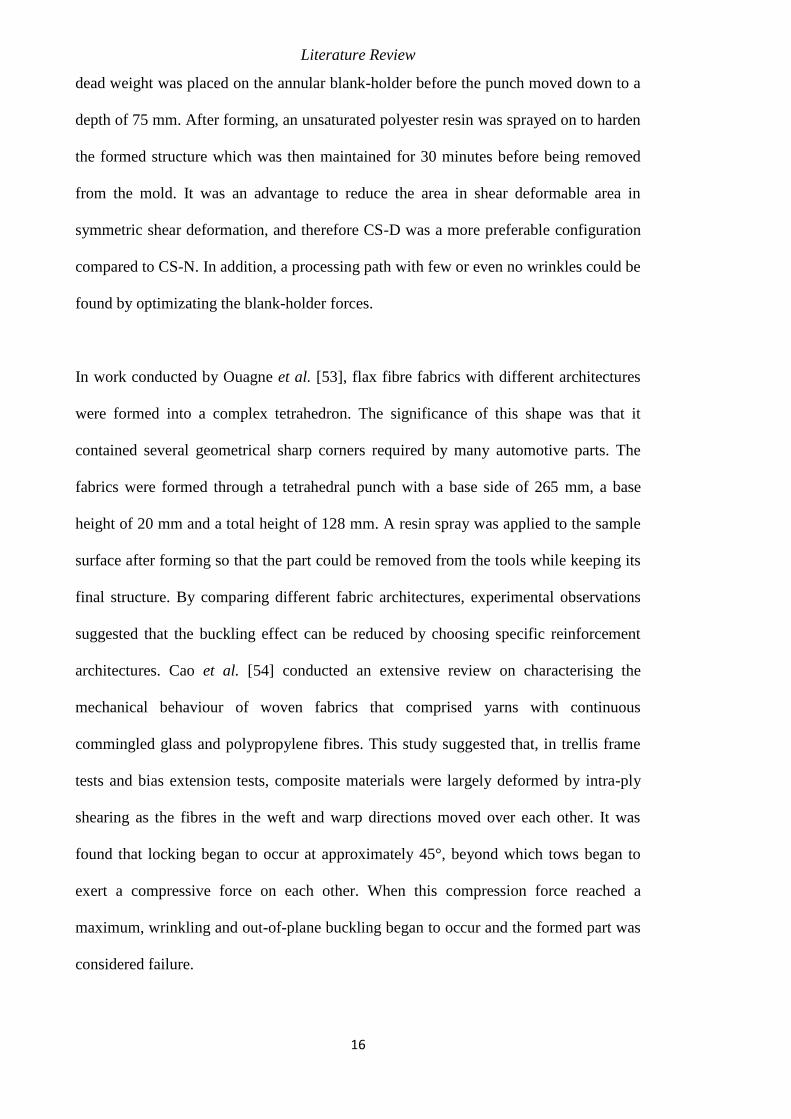
16
dead weight was placed on the annular blank-holder before the punch moved down to a
depth of 75 mm. After forming, an unsaturated polyester resin was sprayed on to harden
the formed structure which was then maintained for 30 minutes before being removed
from the mold. It was an advantage to reduce the area in shear deformable area in
symmetric shear deformation, and therefore CS-D was a more preferable configuration
compared to CS-N. In addition, a processing path with few or even no wrinkles could be
found by optimizating the blank-holder forces.
In work conducted by Ouagne et al. [53], flax fibre fabrics with different architectures
were formed into a complex tetrahedron. The significance of this shape was that it
contained several geometrical sharp corners required by many automotive parts. The
fabrics were formed through a tetrahedral punch with a base side of 265 mm, a base
height of 20 mm and a total height of 128 mm. A resin spray was applied to the sample
surface after forming so that the part could be removed from the tools while keeping its
final structure. By comparing different fabric architectures, experimental observations
suggested that the buckling effect can be reduced by choosing specific reinforcement
architectures. Cao et al. [54] conducted an extensive review on characterising the
mechanical behaviour of woven fabrics that comprised yarns with continuous
commingled glass and polypropylene fibres. This study suggested that, in trellis frame
tests and bias extension tests, composite materials were largely deformed by intra-ply
shearing as the fibres in the weft and warp directions moved over each other. It was
found that locking began to occur at approximately 45°, beyond which tows began to
exert a compressive force on each other. When this compression force reached a
maximum, wrinkling and out-of-plane buckling began to occur and the formed part was
considered failure.
§2.3 Composite forming
17
In addition to composite fabrics, the forming behaviour of pre-consolidated composite
also becomes of great interest to researchers. Hou [55] performed draw forming tests on
a pre-consolidated unidirectional glass fibre reinforced polypropylene composite. The
prepreg was consolidated by firstly placing a mold filled with 8 layers in a press which
was heated to 180°C. After a pre-heating period of 15 minutes, a pressure of 1.5 MPa
was applied to the mold for 5 minutes, after which it was cooled to room temperature
under pressure. The composite was heated above the melting temperature of
polypropylene before forming by the cold metal tool. Most fibre buckling was observed
at an angle of 45° to the fibre direction, and the centre of the composite experienced the
most thickness reduction, while zero reduction in the flange region.
Hwang and Hwang [31] also conducted high temperature forming experiments,
although unlike most other studies where the whole composite was heated prior to
forming, the specimen was locally heated. This method saved the energy usually wasted
while transferring the sample from the heat chamber to the stamping press machine.
Unidirectional carbon fibre/nylon (6 layers) composites were formed at different heated
ranges, working temperature, and holding time, and the quality of the formed parts were
evaluated macroscopically for part angle and microscopically for delamination and fibre
buckling. Experimental observations indicated that, although wrinkling was still
observed at the flange region, the locally heated part was comparable to the wholly
heated part in terms of maximum load as well as final angle.
Hou [55] studied the forming behaviour of glass fibre reinforced polyetherimide (PEI)
through stamp forming tests where the composite was heated to a maximum of 120°C
prior to the forming operation. It was concluded that a proper temperature and blank
holder force was crucial to good quality in the formed parts. This finding was agreeable
Literature Review
18
with another research work which analysed the stamp forming of preconsolidated sheets
of unidirectional glass fibre reinforced polypropylene composites under various
experimental parameters such as forming speed and forming temperature [56]. This
study created a novel rod-bed model to form complex three-dimensional parts. This
study found that high preheat temperature was essential for good formability due to
intra-ply shear deformation at high forming temperatures. It was also noted that the out-
of-plane fibre wrinkling was eliminated at a forming temperature of 180°C. Sadighi et
al. [57] investigated the effects of laminate stacking sequence on the forming of glass
fibre reinforced polypropylene composite at elevated temperatures. It was concluded
that the flange regions in the composite changed with different laminate stacking
combinations. There was a significant reduction in the drawing behaviour along the
45°/-45° stacking scheme while the 0°/90° stacking sequence exhibited significant draw.
No obvious change was observed in the wrinkling behaviour of the composites with
varying stacking combinations.
Stamp forming tests are usually performed on consolidated composites [58], like the
studies mentioned above, and these require a separate consolidation process prior to
forming. This means that the voids within the material could be eliminated before
molding, but at a higher cost. An alternative is therefore to perform consolidation and
forming in a single process, which offers potential for cost reduction. For instance,
Trudel-Boucher et al. [59] transferred and then formed E-glass reinforced
polypropylene fabrics immediately after reaching a temperature of 200°C in a natural
conventional oven. There were four separate stages during the forming process
including closing the mold, applying pressure, holding the pressure and finally opening
the mold. Composites made from un-consolidated fabrics were compared with pre-
consolidated composites, and showed comparable flexural properties at low fabric
§2.3 Composite forming
19
densities, but lower flexural strength at high fabric densities. This result suggests stamp
forming process using this class of material system is promising.
Wakeman et al. [60] formed a glass fibre reinforced polypropylene composite through a
similar method where the material was heated in an oven before forming and
consolidated with a cold tool. The optimum compression parameters were identified
when the reductions in cycle time were given higher priorities over the pressures and
times required for minimum porosity. This work also pointed out that the transfer time
between oven and press must be minimised to prevent the material from cooling too
much. On average, the transfer time was approximately 30 seconds. By putting the oven
next to the press machine, Cabrera et al. [61] managed to transfer the mold with a
heated all-polypropylene laminate inside in approximately 3 seconds with a negligible
drop in temperature.
Stretch forming tests, on the other hand, require that the sample edge is completely
fixed during forming. This forming technique has been widely applied to metals [62-67],
and recently to Fibre-Metal Laminates (FML) [19, 68-70] Polymer-Metal Laminate
(PML) [71, 72], and composites [47, 73]. Due to the restricted drawing behaviour of
materials during forming, materials would experience higher surface strains and much
less wrinkling at the cost of surface fracture at smaller forming depths.
One of the main drivers of conducting stretch forming experiments is to establish the
forming limits of the materials at different deformation modes. To achieve this, a
number of designs on experimental geometries have been proposed for stretch forming
tests. Nakazima et al. [74] proposed a rectangular specimen with varying middle section
widths. When the width of rectangular a specimen was increased, the sample
Literature Review
20
experienced increased lateral restriction during forming, which prevents the sample
from being drawn into the die cavity. This would also result in a forming mode closer to
biaxial stretch. It is argued that failure would initiate at regions other than pole when
applying rectangular specimens, and hence incapable of obtaining the forming limit of
the desired forming mode. To ensure that failure initiates at the centre of a composite
specimen (the point of interest for the purpose of FLD), Raghavan [75] proposed a new
design of sample geometry where a radius was cut from each edge of a rectangular
sample. However, this design was, sometimes difficult, to obtain a deformation mode of
pure shear. Zanjani et al. [73] found that in stretch forming tests, the deformation mode
of pure shear can be obtained at the pole of small rectangular specimens, with the fibres
oriented 45°/-45° to the stretching axis. This allowed one to construct the complete FLC
from stretch forming tests.
Sexton et al. [68] investigated room temperature formability of a fibre metal laminate
system comprised of aluminium and a self-reinforcing polypropylene composite. A real-
time three-dimensional photogrammetric measuring system was used to acquire surface
strain evolution during forming. This work studied the meridian strain distribution of
the FML, and the comparison of it to that of aluminium suggested that FML structure
can indeed have superior formability than monolithic metallic alloys. Zanjani and
Kalyanasundaram [47] compared the forming behaviour of glass-fibre reinforced
polypropylene composites (GRPP) and self-reinforced polypropylene composites
(SRPP). In the stretch forming tests conducted in this work, the specimens were cut into
a circular shape with varying widths to determine the effect of aspect ratio. The induced
strain deformation was measured from a pair of high speed, high resolution CCD
cameras by using a Digit Image Correlation (DIC) technique. Three points at the pole, at
some distance from the pole in the longitudinal direction, and at some distance from the
§2.4 Failure behaviour and failure criteria for composite materials
21
pole in the 45° to the fibre direction were selected to analyse the strain evolution of two
composites. It was concluded that GRPP composites exhibit significantly higher
formability under shear deformation than SRPP composites. In addition, the
combination of sample’s width and boundary conditions applied is a determinant factor
on the formability of woven composites.
2.4 Failure behaviour and failure criteria for composite materials
2.4.1 Failure behaviour
The failure behaviour of fibre reinforced composites is strongly dependent on the
material structural organization. The damage initiation and development in the material
is controlled by the properties of matrix, fibre-matrix interface and material structural
organization [76].
Gorbatikh and Lomov [76] described the typical sequence of damage in the situation
where a composite was loaded in the longitudinal direction with an increased tensile
load. The first damage typically appears in the form of transverse cracks which usually
initiate inside the yarns with the highest local fibre volume fraction or at yarn
boundaries, depending on the textile architectures. Transverse cracks would propagate
along the yarn direction, and the number of cracks is increased until saturation is
reached when loading is further increased. Once transverse cracks are well developed,
they further propagate as local delaminations. The onset and propagation of
delamination depend on the interlaminar fracture toughness of the composite. When the
transverse strength of longitudinal yarns is exceeded by the local stresses, splitting
would initiate. Finally, massive breakage of fibres in the longitudinal yarns begins. It is
noted that the strain at which it happens is usually below the ultimate strain of fibres
due to inefficient stress transfer caused by fibre crimp and developed delaminations.
Literature Review
22
Matrix cracks is also a typical mechanism observed in textile composites, and the onset
of which usually starts as micro-debonding at fibre-matrix interface [76]. De Greef et al.
[77] observed quasi-elliptical shape yarn cross-sections in a carbon-epoxy twill
composite. Fibre interface debonds appeared firstly on yarn boundaries, and later inside
yarns which then grew into transverse cracks. A similar situation was also found in a
carbon-epoxy 3D woven orthogonal non-crimp composite by Bogdanovich et al. [78].
However, in natural fibre reinforced composites which have a low transverse stiffness,
the initiation of matrix cracks can be delayed until later stages of loading [76]. Kersani
et al. [79] found that the onset of matrix cracks starts just before the entire woven flax-
epoxy composite fails or never appear at all.
Traditionally composite materials were manufactured using thermoset matrices, and an
extensive number of studies have been carried out to investigate the failure behaviour of
this class of material systems. The research conducted by Roundi et al. [80] examined
the fatigue behaviour of glass/epoxy composite materials subjected to cyclic tensile tests
under different stress ratios and the stacking sequence ([02/902]s; [902/02]s; [03/90]s;
[903/0]s). All experiments were performed at room temperature through a tensile
machine equipped with 100 kN loading cell, according to the standard test method
ASTM D3039/D3039 M. The displacement rate was 1 mm/min with a frequency of 10
Hz. Specimens were tested under various maximum stress levels, and the applied stress
ratio (the ratio between the minimum and maximum applied stress) varied between 0.1
and 0.5. Experimental results showed that it is more adequate to use the [03/90]s fibre
orientations to achieve the maximum fatigue life. The fatigue strength of the composite
was found to increase with stress ratio values for all fibre orientations. Fatigue life,
however, decreases significantly with decreasing stress ratios.
§2.4 Failure behaviour and failure criteria for composite materials
23
Ma et al. [81] studied on-axis tensile tests of unidirectional carbon fibre reinforced
epoxy laminates. Two typical fracture modes of splitting and the step-like mode were
observed in the composite, while all 0° laminates showed the step-like fracture mode in
tensile tests. To further investigated the fracture process of the laminate, step-by-step
tensile tests were carried out, which stopped at strains of 0.2%, 0.8% and 1.3%. Based
on observation of fracture surface vertical to the fibre direction under SEM, no
delamination occurred and only few large-scale cracks could be observed, suggesting
the dominating failure mode of cohesive failure. It was also found in the work that most
of the cracks propagated along the thickness direction in the unidirectional carbon fibre
reinforced epoxy composite. Similar findings were obtained by Mayen et al. [82] where
the fracture mechanisms of a carbon fibre/epoxy laminate [+75/0/-75]s under uniaxial
loading tests. In this work, transversal crack propagation was found as the dominating
failure mechanism as fibres kept a significant amount of epoxy resin on the surface.
Unlike most studies that focused on the overall performance of thermoset composite,
Wang et al. [83] examined the effect of different surface treatment of reinforcing fibres
on fibre-matrix adhesion of a carbon/epoxy composite. The Polyacrylonitrile based
AKSAca A-42 carbon fibres with a bulk density of 1.78g/cm3 were treated with a
mixture of H2SO4 and HNO (3:1 in volume) for a treatment time of varying from 15
mins to 60 mins with an increment of 15 mins. Adhesion strength at the interface
between carbon fibres and epoxy resins was measured in a microbond test. Failure
samples from the microbond test were then examined with field emission SEM to verify
the location and mode of the failure. There was a clear evidence that interfacial
separation, caused by poor adhesion, was the main failure mode of the composite. It was
also found that both interfacial shear strength and fracture toughness of the interface
were improved after an optimum 15-30 mins of surface treatment, and these properties
Literature Review
24
started to decline when treatment duration was prolonged beyond 30 mins.
Thermoplastic composites have higher fracture toughness and higher strain to failure
compared to thermoset composites, leading to different failure behaviour seen from
experiments. Venkatesan [18] studied the forming behaviour of two different
composites through draw forming tests. The first one was a glass fibre reinforced
polypropylene composite (Twintex), and the second was a self-reinforced
polypropylene composite (Curv). Both were pre-consolidated before forming. Circular
blanks with a diameter of 180 mm were formed into a hemispherical dome structure.
Three different experimental parameters, including blank-holder force ranging from 2
kN to 14 kN, feed rate ranging from 20 mm/s to 60 mm/s were selected in this study. By
examining the formed parts, no matrix cracking, delamination, fibre breakage, or fibre
pull-out was observed. However, wrinkling at the flange region was observed frequently
on both composites that were formed at low blank-holder forces. Increasing the blank-
holder force can effectively reduce the amount of wrinkling, thereby improving the
quality of the formed structure. The similar observation was also obtained in other
researches [84]. All-PP composites were stretched to failure in tensile tests, and
examination on the fracture section revealed that the failure is characterised by fibre
breakage leading to matrix damage. Although considerable thinning is noticed, no
failure is initiated in the matrix. Similar finding was also obtained by Romhany et al.
[85]. Twintex exhibited a different forming behaviour compared to Curv due to
significantly higher stiffness of the glass fibres compared to the polypropylene fibres. A
detailed examination on the failure behaviour of Twintex was outside the scope of this
study, however fibre breakages are seen when samples were stretched to failure in
tensile tests.
§2.4 Failure behaviour and failure criteria for composite materials
25
Davey et al. [86] performed stamp forming tests on a carbon fibre reinforced PEEK
composite. Circular discs of samples were formed into a dome structure through a 300
kN double-action mechanical press machine, and the test was not ceased until the
initiation of failure in the specimen. It was found that the failure was observed in the
carbon fibres, primarily due to the significantly lower failure strain of carbon fibres
compared to that of the polypropylene matrix. Asumani et al. [87] studied the failure
behaviour of kenaf fibre reinforced polypropylene composites with kenaf fibres
prepared with alkaline treatment, or a combination of alkaline treatment and three-
aminopropyltriethoxysilane treatment. SEM examination on the failure surface of the
composite (with a fibre content of 30% and treated with 6% NaOH before silane)
indicates that the fracture is characterized by fibre breakage.
2.4.2 Failure criteria
An extensive number of research have been carried out to determine the conditions
beyond which failure initiates in composite materials. A number of failure criteria have
been established upon mathematical models built by authors with strong understandings
on the failure behaviour of composites. These failure criteria, including non-interactive
and interpolation criteria, have been applied to fibre reinforced composites for
predicting on their failure behaviour. Among all, the Maximum Strain and the
Maximum Stress are two of the simplest.
The Maximum Stress failure criteria can be expressed as [88]:
𝑿𝑪 < 𝝈𝟏𝟏 < 𝑿𝑻, 𝒀𝑪 < 𝝈𝟐𝟐 < 𝒀𝑻, 𝒁𝑪 < 𝝈𝟑𝟑 < 𝒁𝑻,
|𝛕𝟐𝟑| < 𝐐, |𝛕𝟏𝟑| < 𝐑, |𝛕𝟏𝟐| < 𝐒 (2.1)
where XT, YT, and ZT are the tensile material normal strengths; XC, YC, and ZC are the
compressive material normal strengths (and have negative values); and Q, R and S are
Literature Review
26
the material shear strengths. The composite material is considered failed when one of
the criteria above is met.
The Maximum Strain failure criteria can be expressed as [88]:
𝑿𝜺𝑪 < 𝜺𝟏𝟏 < 𝑿𝜺𝑻, 𝒀𝜺𝑪 < 𝜺𝟐𝟐 < 𝒀𝜺𝑻, 𝒁𝜺𝑪 < 𝜺𝟑𝟑 < 𝒁𝜺𝑻,
|𝝉𝟐𝟑| < 𝑸𝜺, |𝝉𝟏𝟑| < 𝑹𝜺, |𝝉𝟏𝟐| < 𝑺𝜺 (2.2)
where XԑT, YԑT, and ZԑT are the tensile material normal failure strains; XԑC, YԑC, and ZԑC
are the compressive material normal failure strains (and have negative values); and Qԑ,
Rԑ and Sԑ are the material shear failure strains. The composite material is considered to
have failed when one of the criteria above is met.
The Tsai-Hill failure criterion considers interactions between the failure modes which
are ignored in both the Maximum Stress theory and the Maximum Strain theory. The
full multi-axial Tsai-Hill failure surface can be written as [88]:
(𝛔𝟏𝟏𝐗)𝟐
+ (𝛔𝟐𝟐𝐘)𝟐
+ (𝛔𝟑𝟑𝐙)𝟐
+ (𝛕𝟐𝟑𝐐)𝟐
+ (𝛕𝟏𝟑𝐑)𝟐
+ (𝛕𝟏𝟐𝐒)𝟐
−𝛔𝟏𝟏×𝛔𝟐𝟐×(𝟏
𝐗𝟐+𝟏
𝐘𝟐−𝟏
𝐙𝟐) − 𝛔𝟏𝟏×𝛔𝟑𝟑×(
𝟏
𝐗𝟐−𝟏
𝐘𝟐+𝟏
𝐙𝟐)
−𝛔𝟐𝟐×𝛔𝟑𝟑×(𝟏
𝐗𝟐+
𝟏
𝐘𝟐+
𝟏
𝐙𝟐) = 𝟏 (2.3)
where in order to incorporate different tensile and compressive strengths:
𝐗 = {𝐗𝐓 𝛔𝟏𝟏 ≥ 𝟎 𝐗𝐂 𝛔𝟏𝟏 ≤ 𝟎
, 𝐘 = {𝐘𝐓 𝛔𝟐𝟐 ≥ 𝟎 𝐘𝐂 𝛔𝟐𝟐 ≤ 𝟎
, 𝐙 = {𝐙𝐓 𝛔𝟑𝟑 ≥ 𝟎 𝐙𝐂 𝛔𝟑𝟑 ≤ 𝟎
(2.4)
Based on the Maximum Strain failure criteria, Hart-Smith [89, 90] applied
modifications using a micromechanical approach and suggested a truncated failure
envelope in biaxial tension as well as biaxial compression, as shown in Figure 2.4. The
truncated Maximum Strain failure model predicts a more conservative failure envelope
in in-plane shear where the reduction in strength is approximately 60%. The interactions
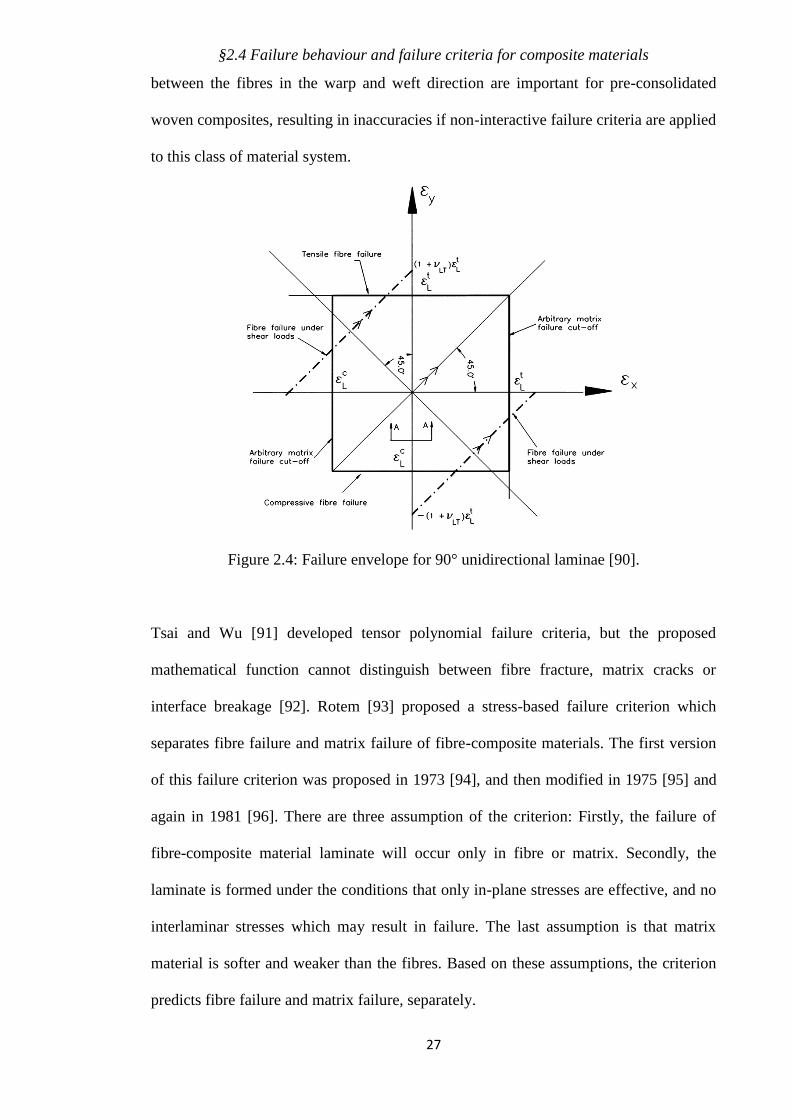
§2.4 Failure behaviour and failure criteria for composite materials
27
between the fibres in the warp and weft direction are important for pre-consolidated
woven composites, resulting in inaccuracies if non-interactive failure criteria are applied
to this class of material system.
Figure 2.4: Failure envelope for 90° unidirectional laminae [90].
Tsai and Wu [91] developed tensor polynomial failure criteria, but the proposed
mathematical function cannot distinguish between fibre fracture, matrix cracks or
interface breakage [92]. Rotem [93] proposed a stress-based failure criterion which
separates fibre failure and matrix failure of fibre-composite materials. The first version
of this failure criterion was proposed in 1973 [94], and then modified in 1975 [95] and
again in 1981 [96]. There are three assumption of the criterion: Firstly, the failure of
fibre-composite material laminate will occur only in fibre or matrix. Secondly, the
laminate is formed under the conditions that only in-plane stresses are effective, and no
interlaminar stresses which may result in failure. The last assumption is that matrix
material is softer and weaker than the fibres. Based on these assumptions, the criterion
predicts fibre failure and matrix failure, separately.
Literature Review
28
Fibre failure criterion:
𝝈𝑨 ≥ 𝑺𝑨+ (2.5)
𝝈𝑨 ≥ 𝑺𝑨 − (2.6)
Where S is the composite lamina strength, the index A denotes the axial direction, +
indicates tensile strength and − indicates compressive strength.
Matrix failure criterion:
(𝑬𝒎(𝜺𝑨)𝜺𝑨
± 𝑺𝒎)𝟐 + (
𝝈𝑻
± 𝑺𝑻)𝟐 + (
𝝈𝑨𝑻
𝑺𝑨𝑻)𝟐 ≥ 𝟏 (2.7)
Where the subscript m index stands for the matrix material, T is for transverse
directions (to the fibres), and AT is for shear in a plane axis that is transverse to the
fibre direction. The first term expresses the relative shear strength, and the second term
is the relative normal stress in the transverse direction. The third term is for the axial
stress in the matrix, which is smaller than the other and usually neglected.
The predictions of this failure criterion were then compared with some experimental
results of laminate materials [97]. A large discrepancy was noted in some cases due to
the huge scatter in the experimental results, the arbitrary selection of some tests, and
material properties. In some experimental cases, the failure of materials is due to a
failure mode of buckling and hence not covered by this criterion.
A similar stress-based failure criterion, namely Grant-Sanders method, was developed at
British Aerospace Defence [98], and this failure criterion could predict failure mode as
well as failure location. Unlike Rotem’s failure criterion which distinguishes between
fibre failure and matrix failure, this failure criterion is separated as initial failure and
final failure. The final failure means that the laminate is either incapable of taking
further load or fibre breakages occurred. The initial failure is a non-catastrophic event

§2.4 Failure behaviour and failure criteria for composite materials
29
following which the failed piles gradually shed load, and it is induced in transverse
tension and compression. In some cases, final failure is predicted prior to initial failure
and when this happens, the initial and final failure envelope coincide.
Initial failure:
Transverse tension/compression:
𝝈𝟐 ≥ 𝑭𝟐𝒕 (2.8)
𝝈𝟐 ≤ 𝑭𝟐𝒄 (2.9)
Where 𝜎2 is transverse shear, F2t is allowable transverse tensile stress, and F2c is
allowable transverse compressive stress.
Combined shear and transverse tension:
(𝝈𝟐
𝑭𝟐𝒕)𝟐 + (
𝝉𝟏𝟐
𝑭𝟏𝟐)𝟐 ≥ 𝟏 (2.10)
Where 𝜏12 is shear stress, and F12 is allowable shear stress.
Final failure:
Longitudinal tension/compression
𝝈𝟏 ≥ 𝑭𝟏𝒕 (2.11)
𝝈𝟏 ≤ 𝑭𝟏𝒄 (2.12)
Where 𝜎1 is longitudinal stress (along the fibre direction)
In-plane shear:
|𝝉𝟏𝟐| ≥ 𝑭𝟏𝟐 (2.13)
Combined longitudinal compression and shear:
𝝈𝟏
𝑯𝟏𝒄+|𝝉𝟏𝟐|
𝑯𝟏𝟐 ≥ 𝟏 (2.14)
Literature Review
30
Where 𝐻1𝑐 and 𝐻12 are parameters for shear-compression, and these two parameters
may be the same as F1c and F12 respectively, but are not necessarily so, depending on
what is known about the material performance.
Delamination:
𝝉𝟏𝟐 × 𝒕𝒆 ≥ 𝒘𝒄𝒓 (2.15)
Where 𝑡𝑒 is effective ply thickness, and 𝑤𝑐𝑟 is delamination criterion
Instead of defining the failure criterion in the space of stress or strain, energy based
failure models have also been developed. It is argued that the stress or strain based
theories are quite reasonable for materials showing a linear stress/strain behaviour,
whereas energy based criteria would be more approachable for materials exhibiting a
non-linear behaviour [99]. The first model was developed by Sandhu [100], which was
built from independent strain energy parameters in the longitudinal, transverse and shear
directions. A restatement of this model was presented in the work conducted by Wolfe
and Butalia [99], where the theory has been extended to include a variety of ply-
unloading mechanism as well as to apply stress or strain loading of composite laminates.
It is important to note that most theoretical failure models are derived from
unidirectional lamina or laminates made from unidirectional lamina layers. These
failure criteria do not account for weave structures, whereas the behaviour of woven
composites is highly affected by interactions between their different constituents. In
addition, most failure criteria stated in the review were built based on fibre reinforced
thermoset composites, and thermoplastic composites are much more ductile than
thermoset [101]. This difference in failure behaviour would also influence the
applicability of failure criteria, such that in the literature fibre breakage is prevalently
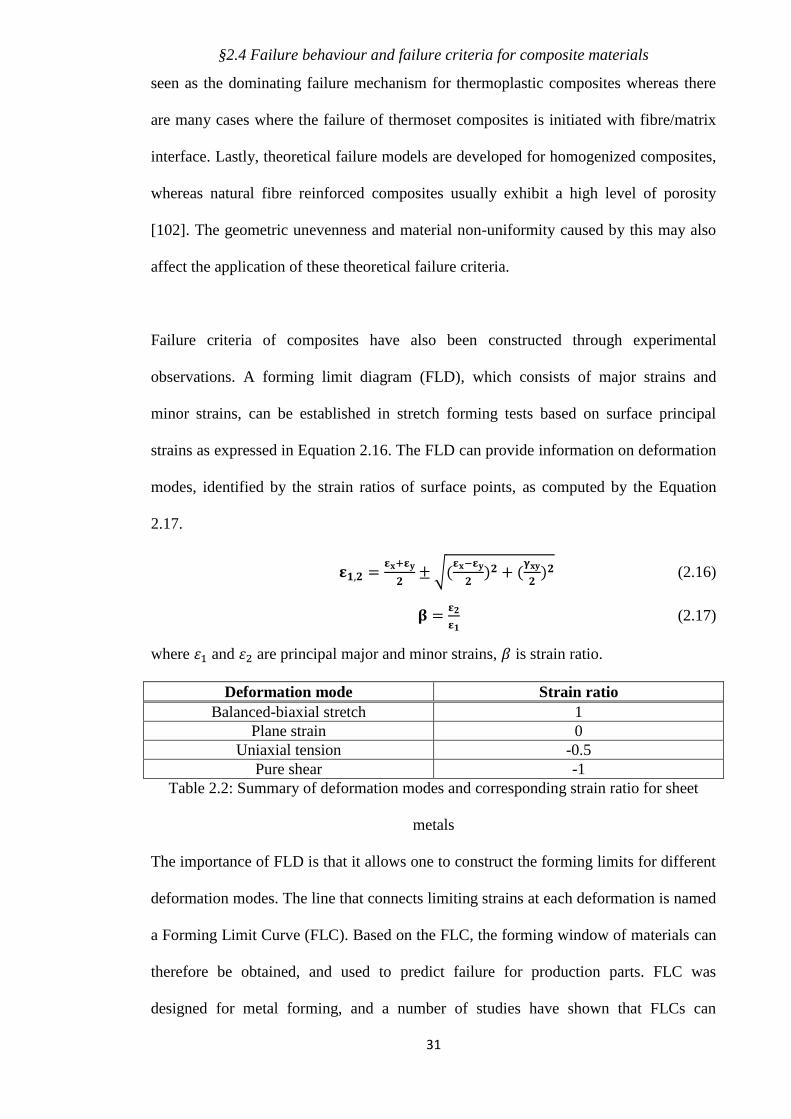
§2.4 Failure behaviour and failure criteria for composite materials
31
seen as the dominating failure mechanism for thermoplastic composites whereas there
are many cases where the failure of thermoset composites is initiated with fibre/matrix
interface. Lastly, theoretical failure models are developed for homogenized composites,
whereas natural fibre reinforced composites usually exhibit a high level of porosity
[102]. The geometric unevenness and material non-uniformity caused by this may also
affect the application of these theoretical failure criteria.
Failure criteria of composites have also been constructed through experimental
observations. A forming limit diagram (FLD), which consists of major strains and
minor strains, can be established in stretch forming tests based on surface principal
strains as expressed in Equation 2.16. The FLD can provide information on deformation
modes, identified by the strain ratios of surface points, as computed by the Equation
2.17.
𝛆𝟏,𝟐 =𝛆𝐱+𝛆𝐲
𝟐±√(
𝛆𝐱−𝛆𝐲
𝟐)𝟐 + (
𝛄𝐱𝐲
𝟐)𝟐 (2.16)
𝛃 =𝛆𝟐
𝛆𝟏 (2.17)
where 휀1 and 휀2 are principal major and minor strains, 𝛽 is strain ratio.
Deformation mode Strain ratio
Balanced-biaxial stretch 1
Plane strain 0
Uniaxial tension -0.5
Pure shear -1
Table 2.2: Summary of deformation modes and corresponding strain ratio for sheet
metals
The importance of FLD is that it allows one to construct the forming limits for different
deformation modes. The line that connects limiting strains at each deformation is named
a Forming Limit Curve (FLC). Based on the FLC, the forming window of materials can
therefore be obtained, and used to predict failure for production parts. FLC was
designed for metal forming, and a number of studies have shown that FLCs can
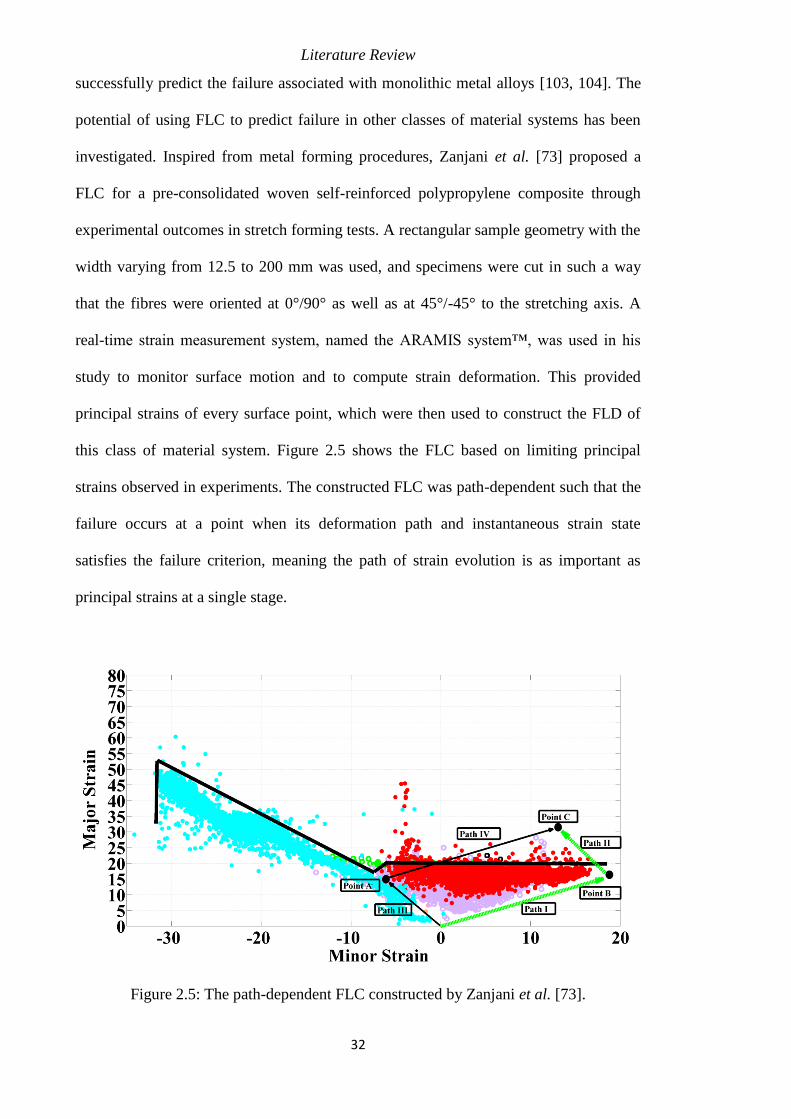
Literature Review
32
successfully predict the failure associated with monolithic metal alloys [103, 104]. The
potential of using FLC to predict failure in other classes of material systems has been
investigated. Inspired from metal forming procedures, Zanjani et al. [73] proposed a
FLC for a pre-consolidated woven self-reinforced polypropylene composite through
experimental outcomes in stretch forming tests. A rectangular sample geometry with the
width varying from 12.5 to 200 mm was used, and specimens were cut in such a way
that the fibres were oriented at 0°/90° as well as at 45°/-45° to the stretching axis. A
real-time strain measurement system, named the ARAMIS system™, was used in his
study to monitor surface motion and to compute strain deformation. This provided
principal strains of every surface point, which were then used to construct the FLD of
this class of material system. Figure 2.5 shows the FLC based on limiting principal
strains observed in experiments. The constructed FLC was path-dependent such that the
failure occurs at a point when its deformation path and instantaneous strain state
satisfies the failure criterion, meaning the path of strain evolution is as important as
principal strains at a single stage.
Figure 2.5: The path-dependent FLC constructed by Zanjani et al. [73].
§2.4 Failure behaviour and failure criteria for composite materials
33
Sexton [19] investigated a fibre metal laminate based self-reinforcing polypropylene
composite in stretch forming tests. Samples had a self-reinforced polypropylene
composite core sandwich structure between two pieces of 5005 H34 aluminum layers.
Hourglass samples with widths from 25 to 200 mm were formed into hemispherical
domes using a stamping press machine. Prior or to forming, a tightening torque was
applied to each of six M12 bolts to fix the specimen between the blank-holder and the
lock-ring, preventing the edge of the composite from being drawn into the die cavity. It
was found that the failure behaviour of the fibre-metal laminate structure was more
complex than just considering principal strains, as the failed data point of one specimen
could lie in the unfailed region of another specimen. High shear strain deformation was
the reason that an unfailed point can withstand a higher major strain than a failed point.
Under shear deformation, fibres did not experience the highest strain, and the
polypropylene matrix could withstand higher strain deformation than the fibres. To
overcome this, a three-dimensional FLD was proposed, as shown in Figure 2.6. This
three-dimensional FLD considers principal angle as a key parameter in addition to
principal strains.
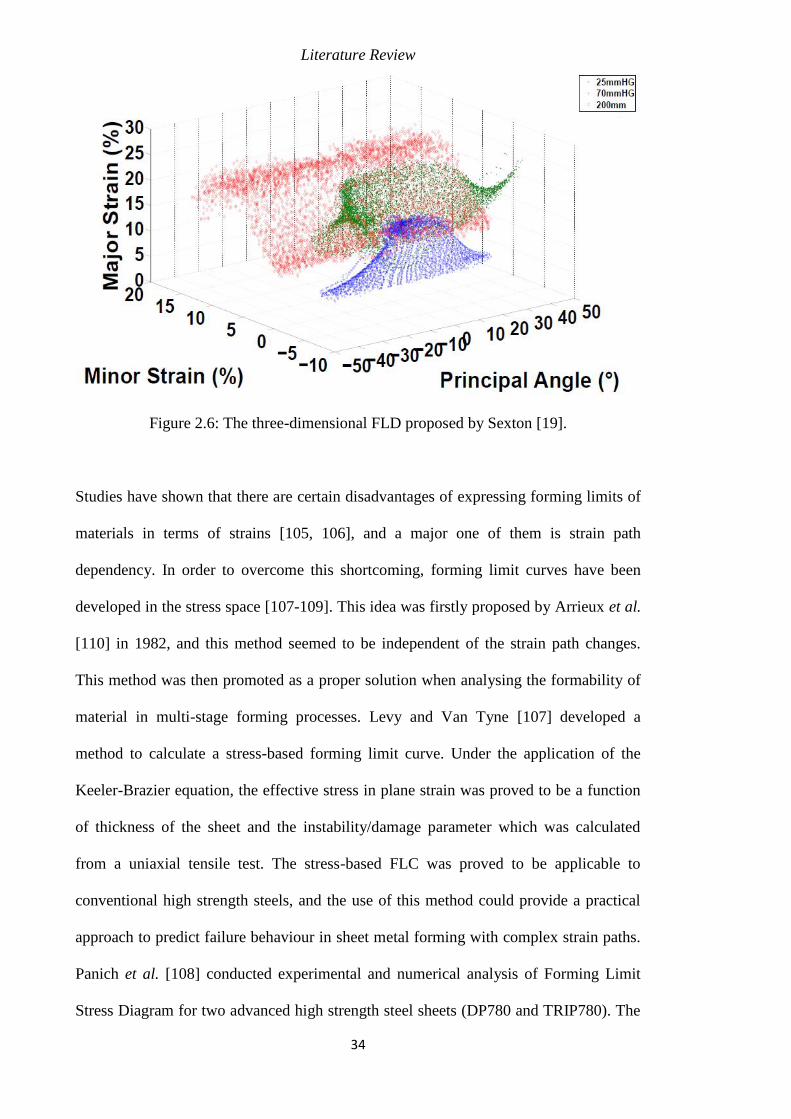
Literature Review
34
Figure 2.6: The three-dimensional FLD proposed by Sexton [19].
Studies have shown that there are certain disadvantages of expressing forming limits of
materials in terms of strains [105, 106], and a major one of them is strain path
dependency. In order to overcome this shortcoming, forming limit curves have been
developed in the stress space [107-109]. This idea was firstly proposed by Arrieux et al.
[110] in 1982, and this method seemed to be independent of the strain path changes.
This method was then promoted as a proper solution when analysing the formability of
material in multi-stage forming processes. Levy and Van Tyne [107] developed a
method to calculate a stress-based forming limit curve. Under the application of the
Keeler-Brazier equation, the effective stress in plane strain was proved to be a function
of thickness of the sheet and the instability/damage parameter which was calculated
from a uniaxial tensile test. The stress-based FLC was proved to be applicable to
conventional high strength steels, and the use of this method could provide a practical
approach to predict failure behaviour in sheet metal forming with complex strain paths.
Panich et al. [108] conducted experimental and numerical analysis of Forming Limit
Stress Diagram for two advanced high strength steel sheets (DP780 and TRIP780). The
§2.4 Failure behaviour and failure criteria for composite materials
35
stress-based forming limit curve was experimentally determined by means of the
Nakazima forming tests which were performed based on the international standard ISO
120004-2 on a 600 kN Erichsen sheet metal testing machine. Analytical calculations of
FLSD were carried out based on a combination of Marciniak-Kuczinsky (M-K) model,
the Swift hardening law, and the Yid20000-2d yield criterion. There was a slight
underestimation of the experimental FLD under uniaxial tension load. From the hole
expansion test conducted in the work, it was verified that the conventional strain-based
FLD was insufficient for predicting material failure, whereas the stress-based FLD
could more precisely describe the forming limits of both high strength steels. However,
it was also found that the accuracy of the stress-based FLD depended strongly on the
yield function and hardening law used in the calculations. Although stress-based
forming limit curve seemed to be valid for predicting the failure behaviour of the metals,
the application of this method to composite forming is still questionable. Apart from the
dependency on the selection of yield functions, as stated above, the application of stress
measurement in practice could be less convenient and accurate than strain measurement.
Several issues have also been noticed when applying FLC to material systems other
than metal alloys. Firstly, it has been mentioned that, due to strain path dependency
effect, surface principal strains at a single stage are not enough to predict failure [19,
73]. An additional variable other than principal strains, or a new FLC with different
parameters might be needed, and the accuracy of the FLC with three variables has not
been verified yet in the literature. Secondly, it still remains questionable whether the
FLC is more effective than theoretical failure criteria such as the Maximum Strain
failure criteria. Thirdly, although an extensive amount of research has been conducted in
constructing FLCs from stretch forming tests, few has applied the FLC to predict failure
Literature Review
36
in other forming practices, for instance draw forming tests. All of these issues need to
be addressed properly before applying the FLC in the mass production process.
In summary, additional research effort is required to find theoretically valid and
practical failure criteria for pre-consolidated woven natural fibre composites, and this
forms an essential part of this research work.
2.5 Finite element analysis
In engineering design, numerical simulation is an essential tool that can reduce the trial
and error part of product development [111-114]. In addition, simulating the forming
behaviour of a material using Finite Element Models can provide information which
cannot be gained experimentally. For the rapid forming simulations conducted in this
work, two formulations can be used: implicit and explicit. In implicit procedure, the
state at t+Δt is determined based on information at time t+Δt, whereas it is based on
information at time t in explicit procedure [115].
2.5.1 Implicit method
Under the consideration of quasi-static problem, The implicit method can be expressed
in terms of Equations 2.18 – 2.24 [116]. Firstly, the discretised equilibrium Equation for
the finite element model is:
𝐏𝐍 − 𝐈𝐍 = 𝐌𝐍𝐌�̈�𝐌 (2.18)
where 𝑃𝑁 is the external force vector; 𝐼𝑁 is the internal force vector; 𝑀𝑁𝑀 is the mass
matrix; and �̈�𝑀 is the acceleration vector.
The internal forces are given by:
𝐈𝐍 = ∫𝛃𝐍: 𝛔 𝐝𝐕 (2.19)
§2.5 Finite element analysis
37
Where V is the current volume of the model, 𝜎(𝑥) is the stress at a point currently
located at position x, 𝛽𝑁(𝑥) is the strain rate-displacement rate transformation defined
from the interpolation assumption in the element.
In static equilibrium, the d’Alembert forces are almost constant with time, implying the
following expression.
𝐌𝐌𝐍�̈�𝐌 ≈ 𝟎 (2.20)
ABAQUS/Standard uses Newton’s method to solve for static equilibrium. By applying
the Taylor’s series expansion, an estimated solution at iteration (i) and 𝑢(𝑖)𝑁 can be
obtained:
𝐏𝐍 − 𝐈𝐍 + (𝛛𝐏𝐍
𝐮𝐌−𝛛𝐈𝐍
𝐮𝐌) 𝐂𝐌 +⋯ = 𝟎 (2.21)
Therefore,
𝐊𝐍𝐌×𝐂𝐌 = 𝐏𝐍 − 𝐈𝐍 (2.22)
𝐊𝐍𝐌 =𝛛𝐏𝐍
𝐮𝐌−𝛛𝐈𝐍
𝐮𝐌 (2.23)
where 𝐾𝑁𝑀 is the system’s tangent stiffness, or Jacobian matrix.
The incremental displacement can also be updated as:
∆𝐮(𝐢+𝟏)𝐍 = ∆𝐮𝐢
𝐍 + 𝐂𝐢𝐍 (2.24)
where ∆𝑢(𝑖+1)𝑁 is the incremental displacement at the increment of i+1; ∆𝑢𝑖
𝑁 is the
incremental displacement at the increment of i; 𝐶𝑁 is the correlation to the solution at
the degree of freedom N at the increment of i.
2.5.2 Explicit method
The explicit method was originally developed to solve dynamic problems involving
deformable bodies [115]. ABAQUS/Explicit method solves for a state of dynamic
equilibrium at the current time increment (t).
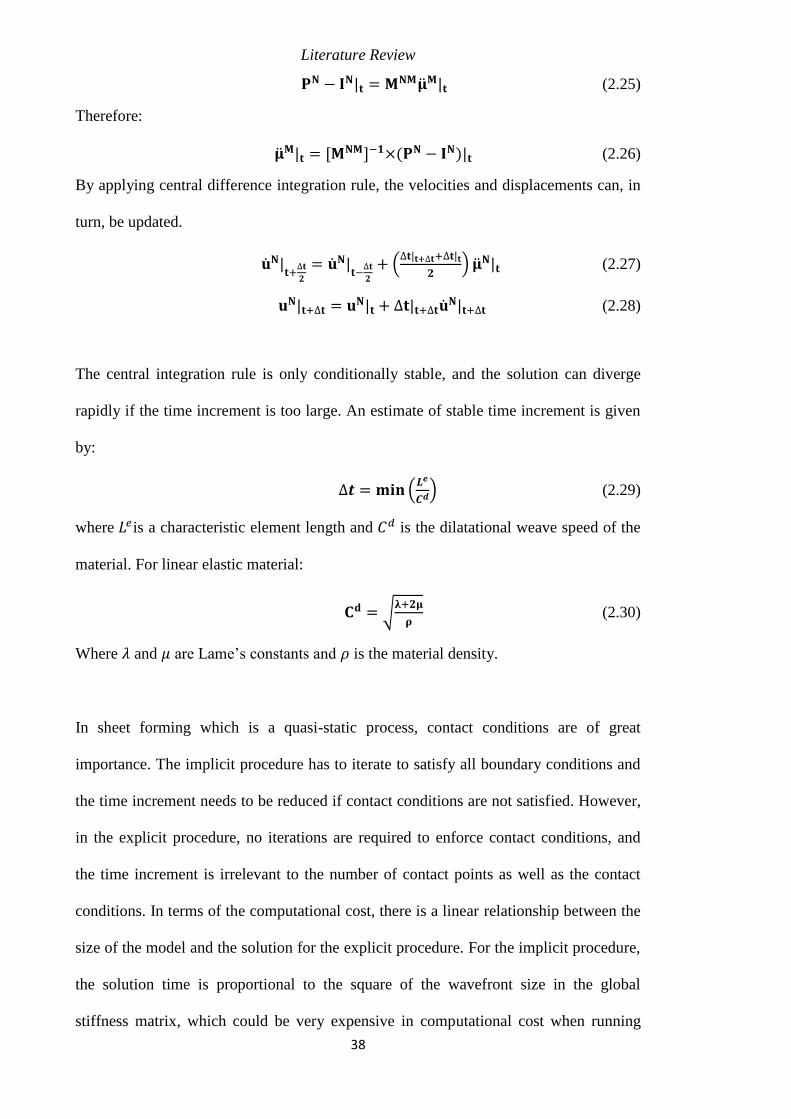
Literature Review
38
𝐏𝐍 − 𝐈𝐍|𝐭 = 𝐌𝐍𝐌�̈�𝐌|𝐭 (2.25)
Therefore:
�̈�𝐌|𝐭 = [𝐌𝐍𝐌]−𝟏×(𝐏𝐍 − 𝐈𝐍)|𝐭 (2.26)
By applying central difference integration rule, the velocities and displacements can, in
turn, be updated.
�̇�𝐍|𝐭+∆𝐭
𝟐
= �̇�𝐍|𝐭−∆𝐭
𝟐
+ (∆𝐭|𝐭+∆𝐭+∆𝐭|𝐭
𝟐) �̈�𝐍|𝐭 (2.27)
𝐮𝐍|𝐭+∆𝐭 = 𝐮𝐍|𝐭 + ∆𝐭|𝐭+∆𝐭�̇�
𝐍|𝐭+∆𝐭 (2.28)
The central integration rule is only conditionally stable, and the solution can diverge
rapidly if the time increment is too large. An estimate of stable time increment is given
by:
∆𝒕 = 𝐦𝐢𝐧 (𝑳𝒆
𝑪𝒅) (2.29)
where 𝐿𝑒is a characteristic element length and 𝐶𝑑 is the dilatational weave speed of the
material. For linear elastic material:
𝐂𝐝 = √𝛌+𝟐𝛍
𝛒 (2.30)
Where 𝜆 and 𝜇 are Lame’s constants and 𝜌 is the material density.
In sheet forming which is a quasi-static process, contact conditions are of great
importance. The implicit procedure has to iterate to satisfy all boundary conditions and
the time increment needs to be reduced if contact conditions are not satisfied. However,
in the explicit procedure, no iterations are required to enforce contact conditions, and
the time increment is irrelevant to the number of contact points as well as the contact
conditions. In terms of the computational cost, there is a linear relationship between the
size of the model and the solution for the explicit procedure. For the implicit procedure,
the solution time is proportional to the square of the wavefront size in the global
stiffness matrix, which could be very expensive in computational cost when running

§2.5 Finite element analysis
39
large size models or 3D simulations [115]. Therefore, the implicit procedure offers a
lower solution cost at small model size, and less solution cost-effective at large model
size.
2.5.3 Shell formulation
Compared to solid elements, shell elements can provide good accuracy with
considerable savings in computational costs when modelling blanks in rapid forming
simulations [12]. ABAQUS/Standard offers a shell element called S4 or S4R where R
stands for reduced integration. The geometric descriptions of shell elements are
presented in Equations 2.31-2.41 [117].
The position of a material point in the shell is defined as:
𝐱(𝐒𝐢) = �̅�(𝐒𝛂) + 𝐟𝟑𝟑̅̅ ̅̅ (𝐒𝛂)𝐭𝟑(𝐒𝛂)𝐒𝟑 (2.31)
Where the subscript i and other Romans in the Equations below range from 1 to 3; 𝛼
and other lower Greek subscripts in the Equations below represent the quantities in the
reference surface of the shell range from 1 to 2; 𝑡3 is the normal to the reference surface
of the shell.
The gradient of the position can therefore be represented as:
𝛛𝐗
𝛛𝐒𝛃=
𝛛�̅�
𝛛𝐒𝛃+ 𝐟𝟑𝟑̅̅ ̅̅
𝛛𝐭𝟑
𝛛𝐒𝛃𝐒𝟑 ,
𝛛𝐗
𝛛𝐒𝟑= 𝐟𝟑𝟑̅̅ ̅̅ 𝐭𝟑 (2.32)
Where we have neglected derivative of 𝑓33̅̅ ̅̅ with respect to 𝑆𝛽, and the thickness increase
factor 𝑓33̅̅ ̅̅ is assumed to be independent of S3.
In the deformation state, the local, orthonormal shell directions 𝑡𝑖 can be defined as
follow:
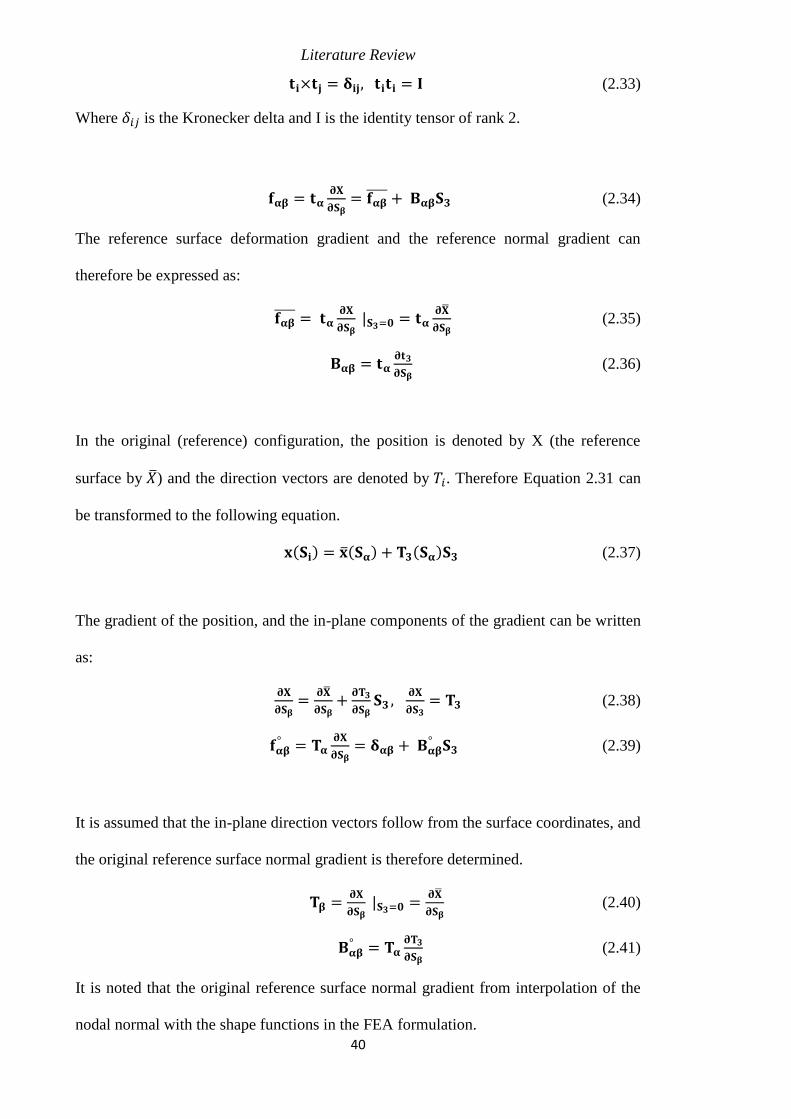
Literature Review
40
𝐭𝐢×𝐭𝐣 = 𝛅𝐢𝐣, 𝐭𝐢𝐭𝐢 = 𝐈 (2.33)
Where 𝛿𝑖𝑗 is the Kronecker delta and I is the identity tensor of rank 2.
𝐟𝛂𝛃 = 𝐭𝛂𝛛𝐗
𝛛𝐒𝛃= 𝐟𝛂𝛃̅̅ ̅̅ + 𝐁𝛂𝛃𝐒𝟑 (2.34)
The reference surface deformation gradient and the reference normal gradient can
therefore be expressed as:
𝐟𝛂𝛃̅̅ ̅̅ = 𝐭𝛂𝛛𝐗
𝛛𝐒𝛃 |𝐒𝟑=𝟎 = 𝐭𝛂
𝛛�̅�
𝛛𝐒𝛃 (2.35)
𝐁𝛂𝛃 = 𝐭𝛂𝛛𝐭𝟑
𝛛𝐒𝛃 (2.36)
In the original (reference) configuration, the position is denoted by X (the reference
surface by �̅�) and the direction vectors are denoted by 𝑇𝑖. Therefore Equation 2.31 can
be transformed to the following equation.
𝐱(𝐒𝐢) = �̅�(𝐒𝛂) + 𝐓𝟑(𝐒𝛂)𝐒𝟑 (2.37)
The gradient of the position, and the in-plane components of the gradient can be written
as:
𝛛𝐗
𝛛𝐒𝛃=
𝛛�̅�
𝛛𝐒𝛃+𝛛𝐓𝟑
𝛛𝐒𝛃𝐒𝟑 ,
𝛛𝐗
𝛛𝐒𝟑= 𝐓𝟑 (2.38)
𝐟𝛂𝛃° = 𝐓𝛂
𝛛𝐗
𝛛𝐒𝛃= 𝛅𝛂𝛃 + 𝐁𝛂𝛃
° 𝐒𝟑 (2.39)
It is assumed that the in-plane direction vectors follow from the surface coordinates, and
the original reference surface normal gradient is therefore determined.
𝐓𝛃 =𝛛𝐗
𝛛𝐒𝛃 |𝐒𝟑=𝟎 =
𝛛�̅�
𝛛𝐒𝛃 (2.40)
𝐁𝛂𝛃° = 𝐓𝛂
𝛛𝐓𝟑
𝛛𝐒𝛃 (2.41)
It is noted that the original reference surface normal gradient from interpolation of the
nodal normal with the shape functions in the FEA formulation.
§2.5 Finite element analysis
41
2.5.4 FEA simulations of composite forming
Typically, in composite forming there are two modelling methods: micro- and macro-
level methods [18]. A micro-mechanical simulation models the individual fibres and the
matrix in each layer of the laminate structure, and this method can generate accurate
results, but at a high computational cost. In macro-mechanical modelling, the composite
material is considered a homogeneous structure. In either method, the way the material
is modelled is of great importance to the accuracy of the model. Boisse et al. [118]
developed a FEA simulation of woven fabrics forming where fibres and matrix were
modelled individually. The mechanical behaviour of the material in tension was
determined through bi-axial stretching tests, where different strain ratios ranging from 0
to 2 were used. It was found that the behaviour of the material was non-linear and the
non-linearity zone was increased with decreasing the strain ratio value. In addition to
using the biaxial stretching tests, picture-frame tests were also applied to obtain the in-
plane shear behaviour of the composite. By incorporating these mechanical properties,
the process of deep drawing of a square box was simulated and then compared in two
different ways: tension only as well as tension plus shear. The numerical simulations
suggested that the rotation angles were reduced when shear stiffness was taken into
account, which was closer to reality.
Vanclooster et al. [119] undertook forming experiments of glass fibre reinforced
polypropylene fabrics to validate commercial simulations. During experiments, a local
shear profile of the formed shape was obtained in sequential steps. A reference pattern
was sprayed to the surface of a pre-consolidated woven fabric, and based on the way the
pattern varied the shear angle of the deformed sheet could be obtained through a DIC
(Digital Image Correlation) technique. Similar to Boisse’s work, two approaches were
compared. The first was the kinematic approach that only considered un-resisted in-
Literature Review
42
plane shear as the deformation mechanism, and this failed to predict fibre re-orientation
during forming. The second approach adopted a more refined mechanical simulation
where both the shear and tensile behaviour of the fabric were taken into account. A
‘biphase’ model with a thermo-visco-elastic matrix and elastic fibres was used in this
simulation. The total stress was given by the sum of three components from: the elastic
properties based on in-plane shear behaviour of the fabric; the matrix material through a
Maxwell model; and the behaviour of the reinforcement in the fibre directions. All three
components were uncoupled. This method gave a reasonably good prediction of fibre
reorientation, and deviations between experiments and simulations could be explained
by the ‘over-simplified’ material model and the lack of coupling between the tensile and
shear behaviour. Based on the findings observed by Boisse et al. [118] and Vanclooster
et al. [119] both the tensile and shear behaviour of the composite fabric should be taken
into account to ensure an accurate numerical simulation. Lee et al. [120] analysed the
biaxial stretch forming behaviour of glass-fibre reinforced thermoplastic composite with
a random fibre orientation under various forming parameters such as punch speed,
temperature, and fibre volume fraction. This study found that the difference between
experimental and numerical simulation was due to the inability of the material model to
incorporate the effect of strain rate on the mechanical responses of the material.
Built-in material models are usually available in commercial FEA software. However, a
user-defined material routine has been used to model more complicated material
behaviour [121]. Sexton [19] modelled a glass-fibre reinforced polypropylene
composite through a user-defined material routine, and the flow chart of the material
model is shown in Figure 2.7. Due to the non-linearity nature of material stiffness in
both the fibre and shear directions, the coefficients in the stiffness matrix were
expressed as functions of strains.
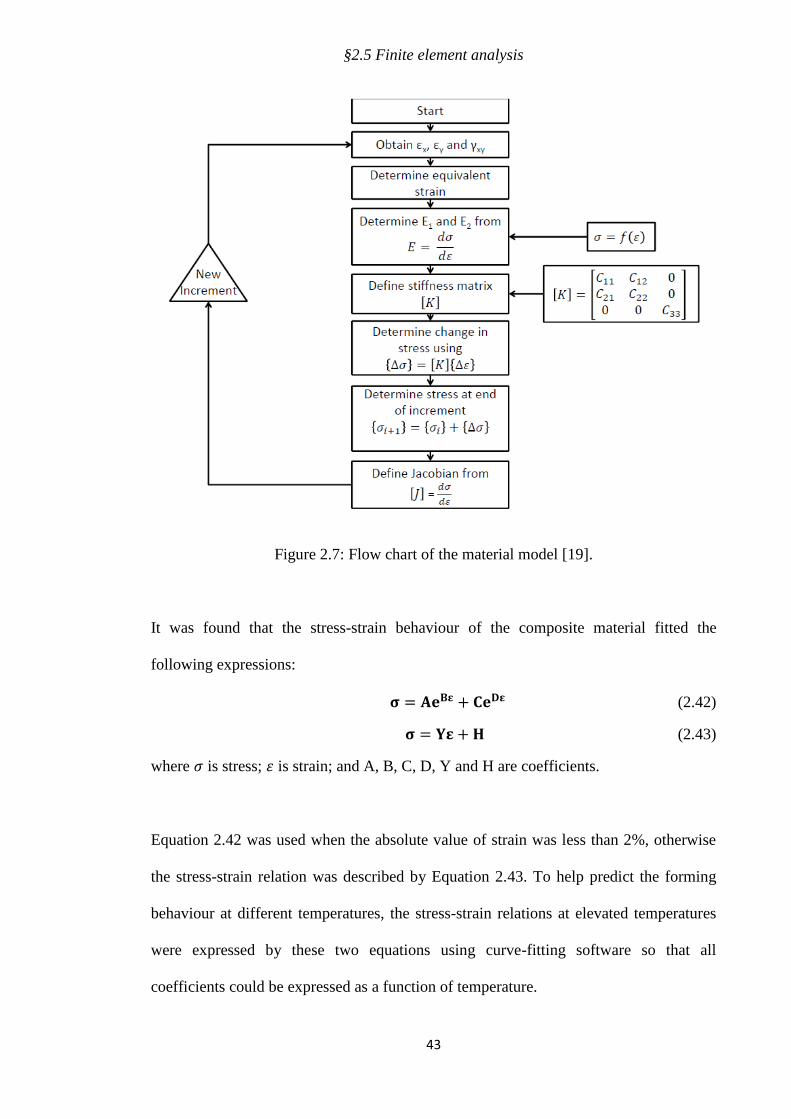
§2.5 Finite element analysis
43
Figure 2.7: Flow chart of the material model [19].
It was found that the stress-strain behaviour of the composite material fitted the
following expressions:
𝛔 = 𝐀𝐞𝐁𝛆 + 𝐂𝐞𝐃𝛆 (2.42)
𝛔 = 𝐘𝛆 + 𝐇 (2.43)
where 𝜎 is stress; 휀 is strain; and A, B, C, D, Y and H are coefficients.
Equation 2.42 was used when the absolute value of strain was less than 2%, otherwise
the stress-strain relation was described by Equation 2.43. To help predict the forming
behaviour at different temperatures, the stress-strain relations at elevated temperatures
were expressed by these two equations using curve-fitting software so that all
coefficients could be expressed as a function of temperature.
Literature Review
44
As well as a suitable material model, contact conditions are another essential component
of FEA models. When a circular sample is formed into a hemispherical dome structure
with its edge being clamped, the tension in the sheet increases with the punch
displacement. If there is no friction between the composite and the tool, the greatest
strain will be at the pole, which is where failure will occur. Under high friction
conditions, the pole of the specimen stops deforming beyond a certain punch depth, and
the maximum strain deformation appears some distance from the pole where failure by
splitting is expected [122]. Because at small forming depths the maximum strain
deformation spreads from the pole to nearby regions, a less lubricated contact
conditions result in lower strain profile along the diameter of the specimen [19]. In
some applications, a very high friction value was defined when the contact layers were
assumed not able to slide against each other [50].
Previous studies have shown that the steady state friction coefficient between the
thermoplastic composite and the tools can vary from 0.05 at high temperatures, low
sliding speeds, and high pressures to 0.5 at low temperatures, high sliding speeds, and
low pressures [123]. Much higher friction values were not uncommon. Harrison et al.
[124] examined the effect of the coefficient of friction in press forming of a 0°/90°
cross-ply thermoplastic composite at elevated temperatures. The first simulation used an
artificially high value of coefficient of friction, 5.0, to account for the rapid cooling,
freezing and reduction in mobility of the thermoplastic matrix composite during
forming. A more realistic value of 0.3 was used in a second simulation. It was found
that the localised shear zones were suppressed by a high coefficient of friction, and a
higher material stiffness promoted shear localisation when the amount of friction was
more realistic.
§2.6 Summary
45
An essential application of numerical simulation is to provide information which cannot
be observed experimentally. Davey et al. [86] developed FEA models in
ABAQUS/Standard to simulate the forming behaviour of a pre-consolidated carbon
fibre reinforced polyether ether ketone (PEEK) composite in draw forming tests. In the
FEA simulation, a linear orthotropic material model, based on mechanical properties
obtained from experiments and the literature, was assigned to the composite material.
For dome forming tests, a real-time strain measurement system was used to monitor
surface motion. However, the flange region of the composite was blocked by the tool,
making it impossible to observe the forming behaviour of this region. Flow behaviour
was observed from the FEA simulations, where much larger displacements were
experienced in the fibre directions compared to at 45° to them. This was primarily due
to much higher stiffness to carbon fibres compared to the PEEK matrix.
2.6 Summary
This Chapter has summarised the literature regarding the structure of natural fibre
composites, and surveyed possible treatments that can help this class of material system
achieve better formability. It has also reviewed composite forming and how to simulate
forming experiments using FEA modelling. While an extensive amount of research has
been done on the forming of composite materials, there are still two unanswered
questions in the field, and this work was designed to answer them.
The first question is, how to form this class of material system? Untreated natural fibres
usually cannot withstand a high level of extension, and poor formability is therefore
expected when the composite is formed without receiving any additional treatment. In
addition, preheating, which is the traditional method of improving the forming
behaviour of composite materials, may not be applicable because of possible thermal
Literature Review
46
degradation of natural fibres at low temperatures. Even if this treatment works, are there
any other treatments (either physical or chemical) that might be more? The current work
also investigates the effect of the weave structure by comparing two different natural
fibre composites which have the same constituent material, similar fibre fraction and
thickness, but different weave structure.
The second question is that, what is the best measure of predicting the failure of the
composite? Most failure models stated in the literature review were developed for
finished composites subjected to uniaxial loading but not for damage during forming.
More importantly these criteria do not account the weave structures in which
interactions between the fibres and the matrix are important. Also, according to the
literature, the conventional FLC may not be applicable to composite materials.
Additional research effort is therefore needed to obtain valid failure criteria for woven
composite materials.
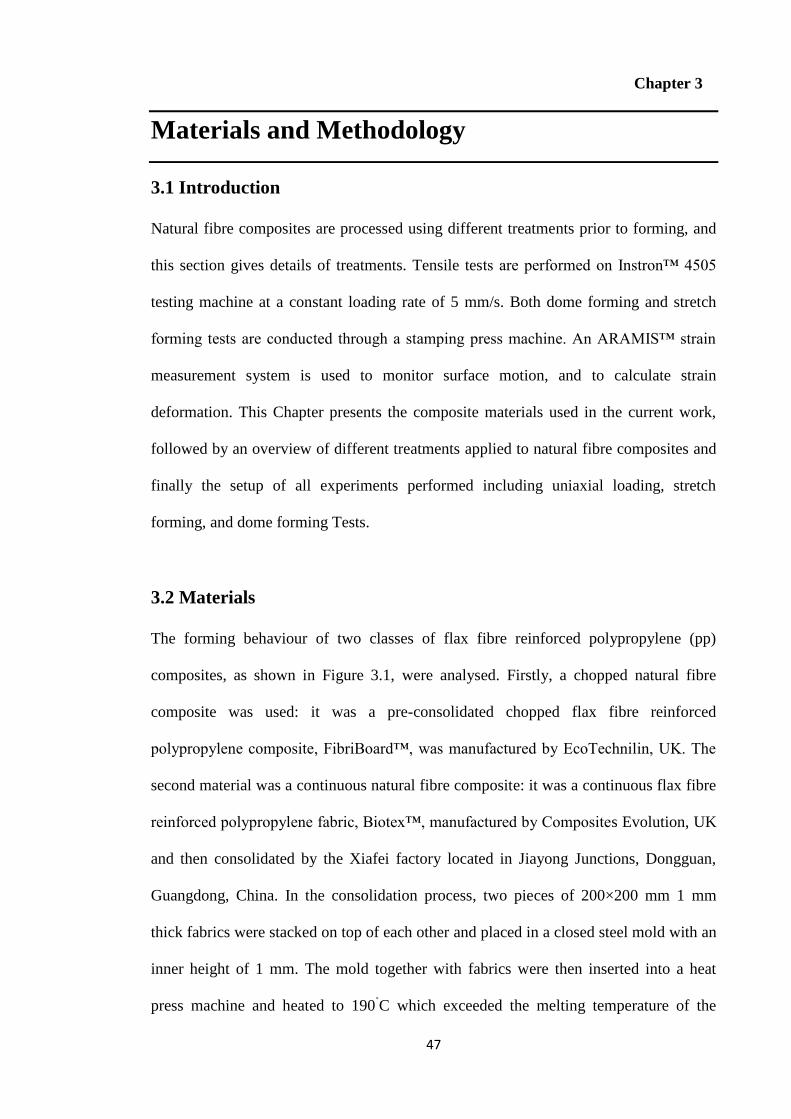
47
Chapter 3
Materials and Methodology
3.1 Introduction
Natural fibre composites are processed using different treatments prior to forming, and
this section gives details of treatments. Tensile tests are performed on Instron™ 4505
testing machine at a constant loading rate of 5 mm/s. Both dome forming and stretch
forming tests are conducted through a stamping press machine. An ARAMIS™ strain
measurement system is used to monitor surface motion, and to calculate strain
deformation. This Chapter presents the composite materials used in the current work,
followed by an overview of different treatments applied to natural fibre composites and
finally the setup of all experiments performed including uniaxial loading, stretch
forming, and dome forming Tests.
3.2 Materials
The forming behaviour of two classes of flax fibre reinforced polypropylene (pp)
composites, as shown in Figure 3.1, were analysed. Firstly, a chopped natural fibre
composite was used: it was a pre-consolidated chopped flax fibre reinforced
polypropylene composite, FibriBoard™, was manufactured by EcoTechnilin, UK. The
second material was a continuous natural fibre composite: it was a continuous flax fibre
reinforced polypropylene fabric, Biotex™, manufactured by Composites Evolution, UK
and then consolidated by the Xiafei factory located in Jiayong Junctions, Dongguan,
Guangdong, China. In the consolidation process, two pieces of 200×200 mm 1 mm
thick fabrics were stacked on top of each other and placed in a closed steel mold with an
inner height of 1 mm. The mold together with fabrics were then inserted into a heat
press machine and heated to 190˚C which exceeded the melting temperature of the
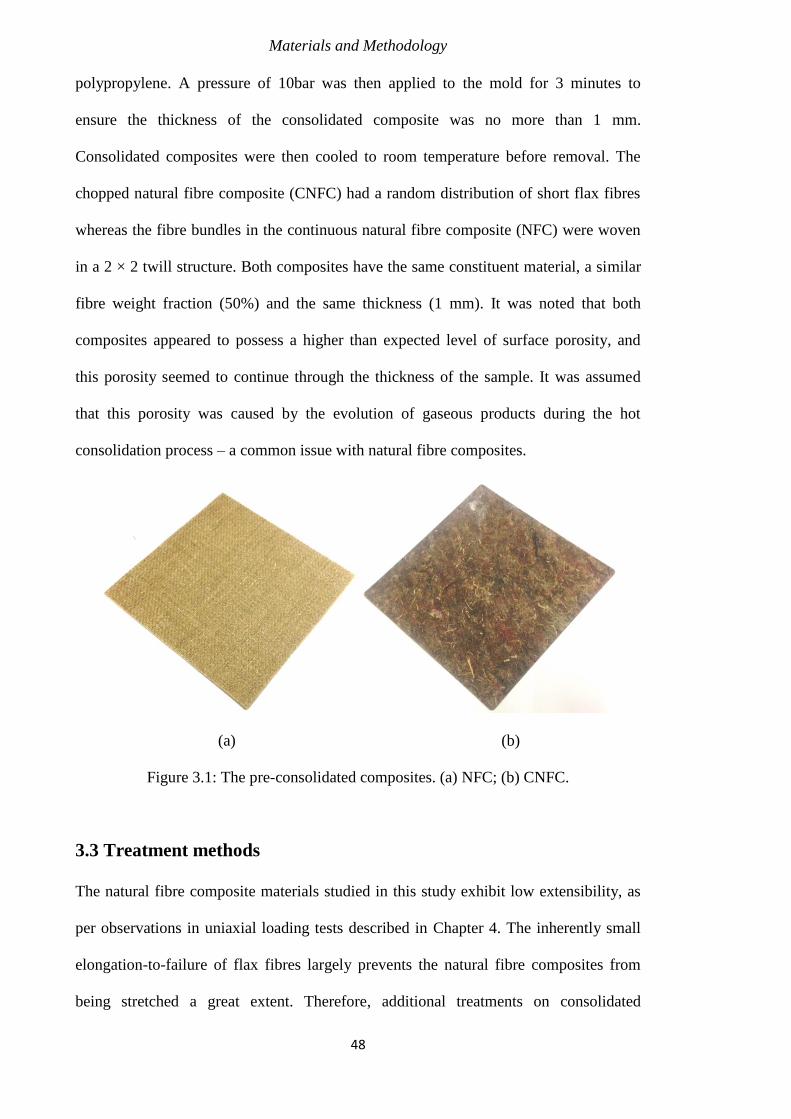
Materials and Methodology
48
polypropylene. A pressure of 10bar was then applied to the mold for 3 minutes to
ensure the thickness of the consolidated composite was no more than 1 mm.
Consolidated composites were then cooled to room temperature before removal. The
chopped natural fibre composite (CNFC) had a random distribution of short flax fibres
whereas the fibre bundles in the continuous natural fibre composite (NFC) were woven
in a 2 × 2 twill structure. Both composites have the same constituent material, a similar
fibre weight fraction (50%) and the same thickness (1 mm). It was noted that both
composites appeared to possess a higher than expected level of surface porosity, and
this porosity seemed to continue through the thickness of the sample. It was assumed
that this porosity was caused by the evolution of gaseous products during the hot
consolidation process – a common issue with natural fibre composites.
(a) (b)
Figure 3.1: The pre-consolidated composites. (a) NFC; (b) CNFC.
3.3 Treatment methods
The natural fibre composite materials studied in this study exhibit low extensibility, as
per observations in uniaxial loading tests described in Chapter 4. The inherently small
elongation-to-failure of flax fibres largely prevents the natural fibre composites from
being stretched a great extent. Therefore, additional treatments on consolidated
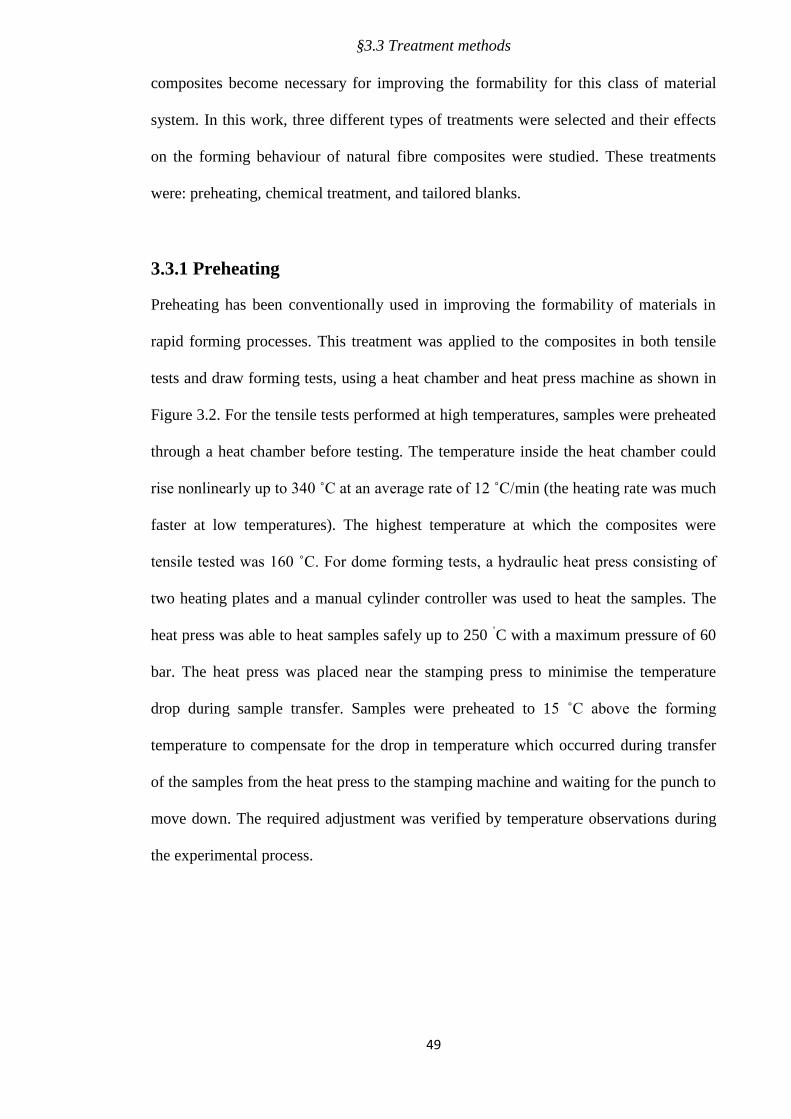
§3.3 Treatment methods
49
composites become necessary for improving the formability for this class of material
system. In this work, three different types of treatments were selected and their effects
on the forming behaviour of natural fibre composites were studied. These treatments
were: preheating, chemical treatment, and tailored blanks.
3.3.1 Preheating
Preheating has been conventionally used in improving the formability of materials in
rapid forming processes. This treatment was applied to the composites in both tensile
tests and draw forming tests, using a heat chamber and heat press machine as shown in
Figure 3.2. For the tensile tests performed at high temperatures, samples were preheated
through a heat chamber before testing. The temperature inside the heat chamber could
rise nonlinearly up to 340 ˚C at an average rate of 12 ˚C/min (the heating rate was much
faster at low temperatures). The highest temperature at which the composites were
tensile tested was 160 ˚C. For dome forming tests, a hydraulic heat press consisting of
two heating plates and a manual cylinder controller was used to heat the samples. The
heat press was able to heat samples safely up to 250 ˚C with a maximum pressure of 60
bar. The heat press was placed near the stamping press to minimise the temperature
drop during sample transfer. Samples were preheated to 15 ˚C above the forming
temperature to compensate for the drop in temperature which occurred during transfer
of the samples from the heat press to the stamping machine and waiting for the punch to
move down. The required adjustment was verified by temperature observations during
the experimental process.
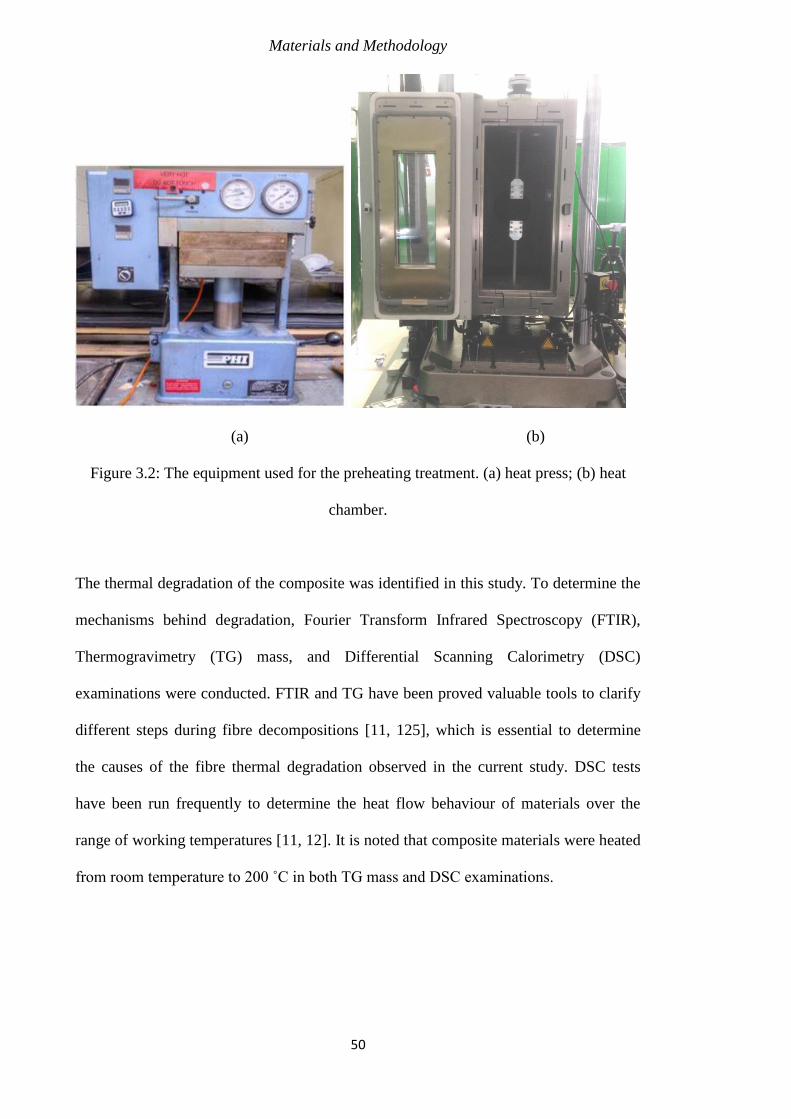
Materials and Methodology
50
(a) (b)
Figure 3.2: The equipment used for the preheating treatment. (a) heat press; (b) heat
chamber.
The thermal degradation of the composite was identified in this study. To determine the
mechanisms behind degradation, Fourier Transform Infrared Spectroscopy (FTIR),
Thermogravimetry (TG) mass, and Differential Scanning Calorimetry (DSC)
examinations were conducted. FTIR and TG have been proved valuable tools to clarify
different steps during fibre decompositions [11, 125], which is essential to determine
the causes of the fibre thermal degradation observed in the current study. DSC tests
have been run frequently to determine the heat flow behaviour of materials over the
range of working temperatures [11, 12]. It is noted that composite materials were heated
from room temperature to 200 ˚C in both TG mass and DSC examinations.
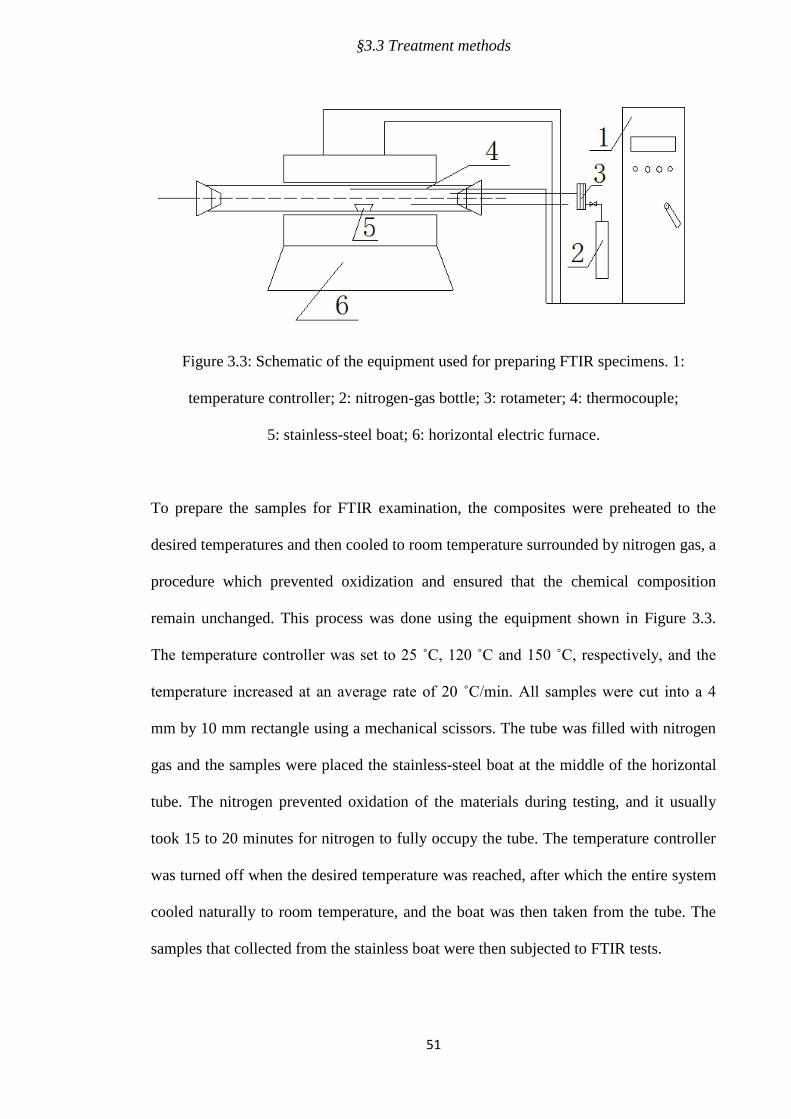
§3.3 Treatment methods
51
Figure 3.3: Schematic of the equipment used for preparing FTIR specimens. 1:
temperature controller; 2: nitrogen-gas bottle; 3: rotameter; 4: thermocouple;
5: stainless-steel boat; 6: horizontal electric furnace.
To prepare the samples for FTIR examination, the composites were preheated to the
desired temperatures and then cooled to room temperature surrounded by nitrogen gas, a
procedure which prevented oxidization and ensured that the chemical composition
remain unchanged. This process was done using the equipment shown in Figure 3.3.
The temperature controller was set to 25 ˚C, 120 ˚C and 150 ˚C, respectively, and the
temperature increased at an average rate of 20 ˚C/min. All samples were cut into a 4
mm by 10 mm rectangle using a mechanical scissors. The tube was filled with nitrogen
gas and the samples were placed the stainless-steel boat at the middle of the horizontal
tube. The nitrogen prevented oxidation of the materials during testing, and it usually
took 15 to 20 minutes for nitrogen to fully occupy the tube. The temperature controller
was turned off when the desired temperature was reached, after which the entire system
cooled naturally to room temperature, and the boat was then taken from the tube. The
samples that collected from the stainless boat were then subjected to FTIR tests.
Materials and Methodology
52
3.3.2 Chemical treatments
It is an important part of the scope to investigate whether there are other treatments, in
additional to the conventional method (preheating), which can effectively improve the
formability of natural fibre composites, and equally important to determine whether
these treatments are more effective than preheating. Chemical treatments are being seen
as effective methods to modify natural fibre based composites to improve their
formability. Distilled water, a 0.5 M Sodium Hydroxide solution (NaOH), a 12%wt
M.A. solution and a Cloudy Ammonia (C.A.) solution with 20 g/L of ammonia were
selected to determine the effect of chemical treatments on the physical and tensile
properties of the samples. To determine the saturation characteristics in each solution at
ambient temperature, samples were placed in plastic containers filled with chemical
solutions up to a depth of 35 mm. A circular hole was drilled in the middle of the lid
and sealed with a piece of flexible parafilm to create a gas bleeding mechanism and
ensure safe testing conditions. The variations in sample weights were recorded
accordingly during solution uptake, and subsequent moisture egress from saturation. A
precision weighing balance, an A&D GX-400 milligram scale, was used to weigh
samples. This balance system can measure weights ranging from 0.02 g to 410 g with
precision of 0.001 g and error of 0.01 g. The balance was calibrated prior to each use,
and was re-zeroed before measuring the weight of each sample (which was lightly
mopped to remove surface moisture).
Three sample conditions were trialled: untreated, saturated, and dried. Untreated
samples were cut from the as-received material with no chemical treatment; saturated
testing was performed on samples that had reached a consistent weight gain; and dried
testing was performed on samples that had been saturated, and then subsequently dried.
Variations in tensile properties were observed between different conditions, and the
§3.3 Treatment methods
53
mechanism behind these changes was investigated using Scanning Electron Microscope
(SEM) examinations on fractured surfaces. All samples were lightly platinum coated
before SEM examinations using a Hitachi 4300 Field Emission Electron Microscope.
Water treatment was applied to composites in all forming practices conducted in this
study, including dome forming tests and stretch forming tests. During these tests, the
composites were formed in untreated, water-treated and redried conditions, respectively.
3.3.3 Tailored blanks
Unlike the preheating and chemical treatments which alter the material properties, the
application of tailored blanks could help the composites achieve better formability by
using particular sample geometries. Tailored blanks called for specific sample shapes in
which areas were cut out along fibre directions from sample edges. In dome forming
tests, the tailored shape introduces unbalanced restriction on material flow (less
restriction along fibre directions). Compared to a fully circular sample, blanks tailored
in this way experienced less restriction in the longitudinal and transverse directions,
resulting in less strain deformation on the flax fibres. The amount of strain deformation
acting on the flax fibres is a key factor in composite failure, as the fibres possess a
significantly lower elongation-to-failure compared to that of the polypropylene matrix.
Figure 3.4 shows experimental geometries of the tailored blanks. By varying the inner
radius of the tailored blank, R65, R75, and R85 specimens (the number indicates that
the inner radius in mm) are used in experiments.
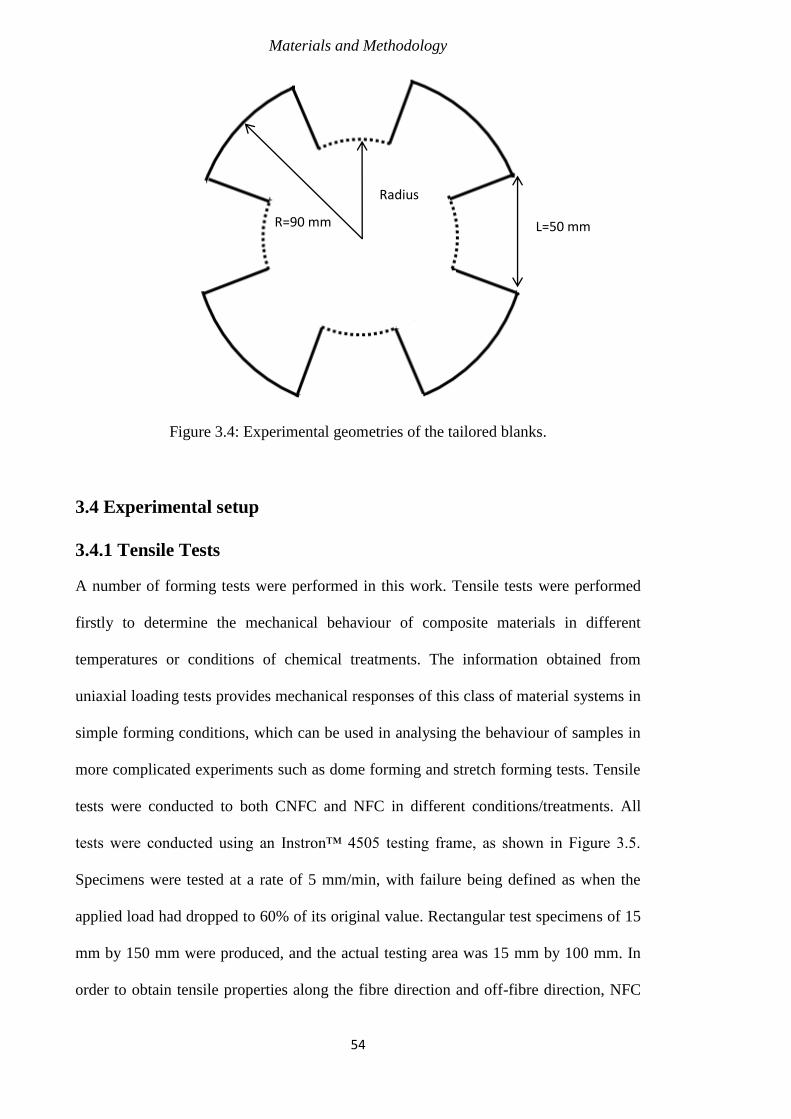
Materials and Methodology
54
Figure 3.4: Experimental geometries of the tailored blanks.
3.4 Experimental setup
3.4.1 Tensile Tests
A number of forming tests were performed in this work. Tensile tests were performed
firstly to determine the mechanical behaviour of composite materials in different
temperatures or conditions of chemical treatments. The information obtained from
uniaxial loading tests provides mechanical responses of this class of material systems in
simple forming conditions, which can be used in analysing the behaviour of samples in
more complicated experiments such as dome forming and stretch forming tests. Tensile
tests were conducted to both CNFC and NFC in different conditions/treatments. All
tests were conducted using an Instron™ 4505 testing frame, as shown in Figure 3.5.
Specimens were tested at a rate of 5 mm/min, with failure being defined as when the
applied load had dropped to 60% of its original value. Rectangular test specimens of 15
mm by 150 mm were produced, and the actual testing area was 15 mm by 100 mm. In
order to obtain tensile properties along the fibre direction and off-fibre direction, NFC
Radius
R=90 mm L=50 mm
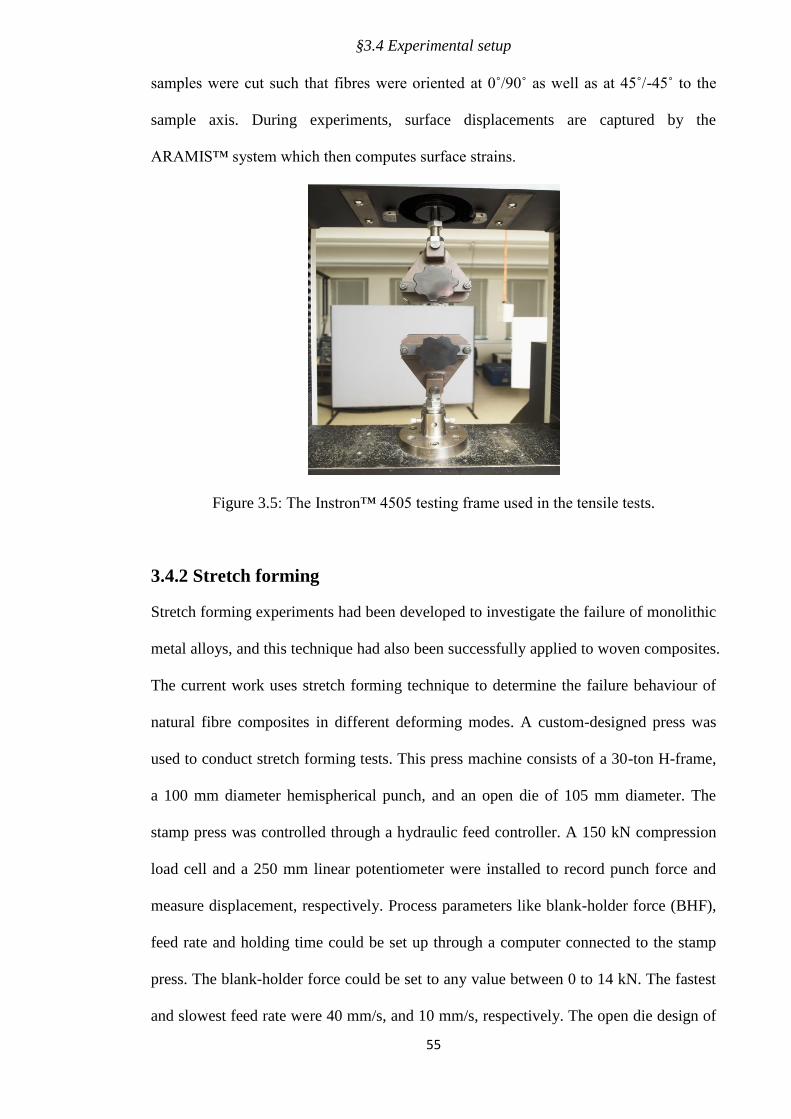
§3.4 Experimental setup
55
samples were cut such that fibres were oriented at 0˚/90˚ as well as at 45˚/-45˚ to the
sample axis. During experiments, surface displacements are captured by the
ARAMIS™ system which then computes surface strains.
Figure 3.5: The Instron™ 4505 testing frame used in the tensile tests.
3.4.2 Stretch forming
Stretch forming experiments had been developed to investigate the failure of monolithic
metal alloys, and this technique had also been successfully applied to woven composites.
The current work uses stretch forming technique to determine the failure behaviour of
natural fibre composites in different deforming modes. A custom-designed press was
used to conduct stretch forming tests. This press machine consists of a 30-ton H-frame,
a 100 mm diameter hemispherical punch, and an open die of 105 mm diameter. The
stamp press was controlled through a hydraulic feed controller. A 150 kN compression
load cell and a 250 mm linear potentiometer were installed to record punch force and
measure displacement, respectively. Process parameters like blank-holder force (BHF),
feed rate and holding time could be set up through a computer connected to the stamp
press. The blank-holder force could be set to any value between 0 to 14 kN. The fastest
and slowest feed rate were 40 mm/s, and 10 mm/s, respectively. The open die design of
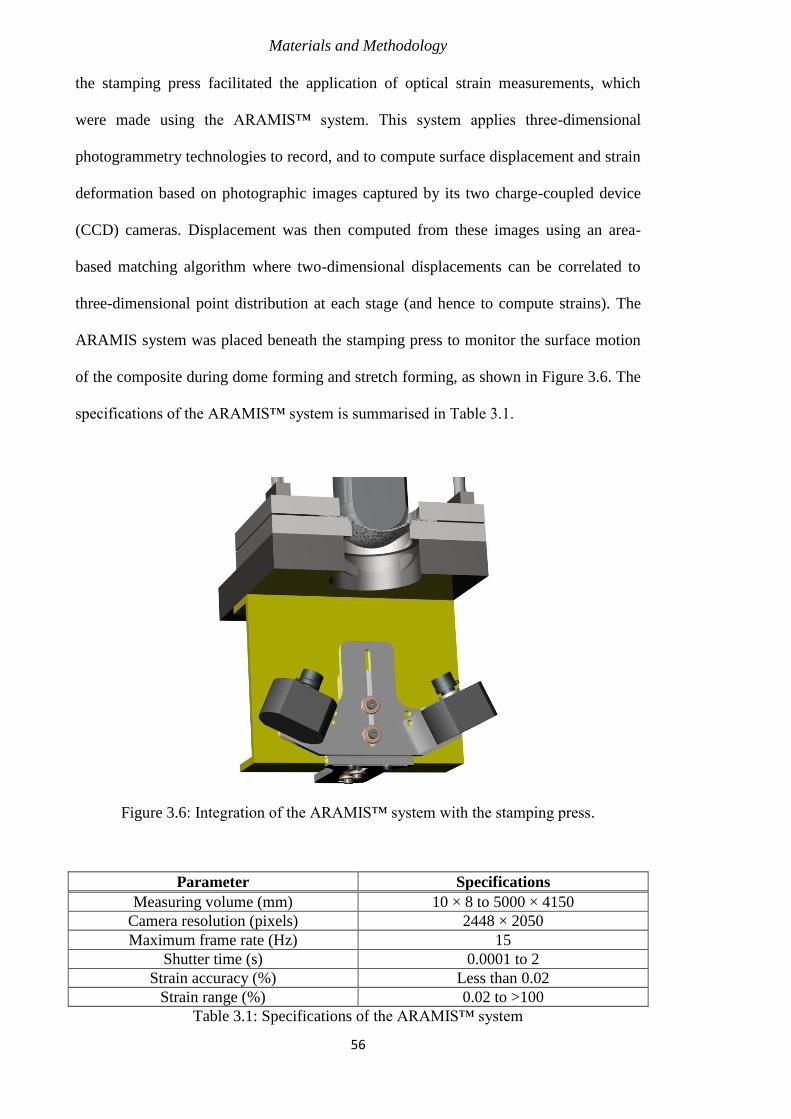
Materials and Methodology
56
the stamping press facilitated the application of optical strain measurements, which
were made using the ARAMIS™ system. This system applies three-dimensional
photogrammetry technologies to record, and to compute surface displacement and strain
deformation based on photographic images captured by its two charge-coupled device
(CCD) cameras. Displacement was then computed from these images using an area-
based matching algorithm where two-dimensional displacements can be correlated to
three-dimensional point distribution at each stage (and hence to compute strains). The
ARAMIS system was placed beneath the stamping press to monitor the surface motion
of the composite during dome forming and stretch forming, as shown in Figure 3.6. The
specifications of the ARAMIS™ system is summarised in Table 3.1.
Figure 3.6: Integration of the ARAMIS™ system with the stamping press.
Parameter Specifications
Measuring volume (mm) 10 × 8 to 5000 × 4150
Camera resolution (pixels) 2448 × 2050
Maximum frame rate (Hz) 15
Shutter time (s) 0.0001 to 2
Strain accuracy (%) Less than 0.02
Strain range (%) 0.02 to >100
Table 3.1: Specifications of the ARAMIS™ system
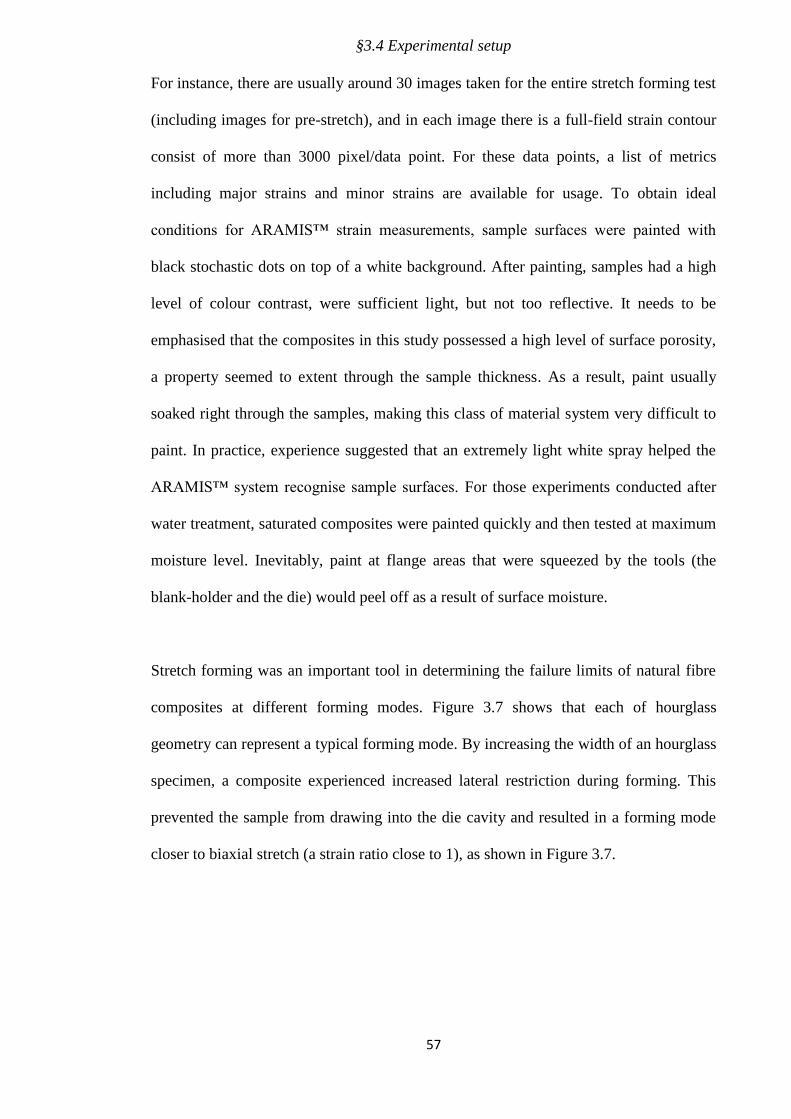
§3.4 Experimental setup
57
For instance, there are usually around 30 images taken for the entire stretch forming test
(including images for pre-stretch), and in each image there is a full-field strain contour
consist of more than 3000 pixel/data point. For these data points, a list of metrics
including major strains and minor strains are available for usage. To obtain ideal
conditions for ARAMIS™ strain measurements, sample surfaces were painted with
black stochastic dots on top of a white background. After painting, samples had a high
level of colour contrast, were sufficient light, but not too reflective. It needs to be
emphasised that the composites in this study possessed a high level of surface porosity,
a property seemed to extent through the sample thickness. As a result, paint usually
soaked right through the samples, making this class of material system very difficult to
paint. In practice, experience suggested that an extremely light white spray helped the
ARAMIS™ system recognise sample surfaces. For those experiments conducted after
water treatment, saturated composites were painted quickly and then tested at maximum
moisture level. Inevitably, paint at flange areas that were squeezed by the tools (the
blank-holder and the die) would peel off as a result of surface moisture.
Stretch forming was an important tool in determining the failure limits of natural fibre
composites at different forming modes. Figure 3.7 shows that each of hourglass
geometry can represent a typical forming mode. By increasing the width of an hourglass
specimen, a composite experienced increased lateral restriction during forming. This
prevented the sample from drawing into the die cavity and resulted in a forming mode
closer to biaxial stretch (a strain ratio close to 1), as shown in Figure 3.7.
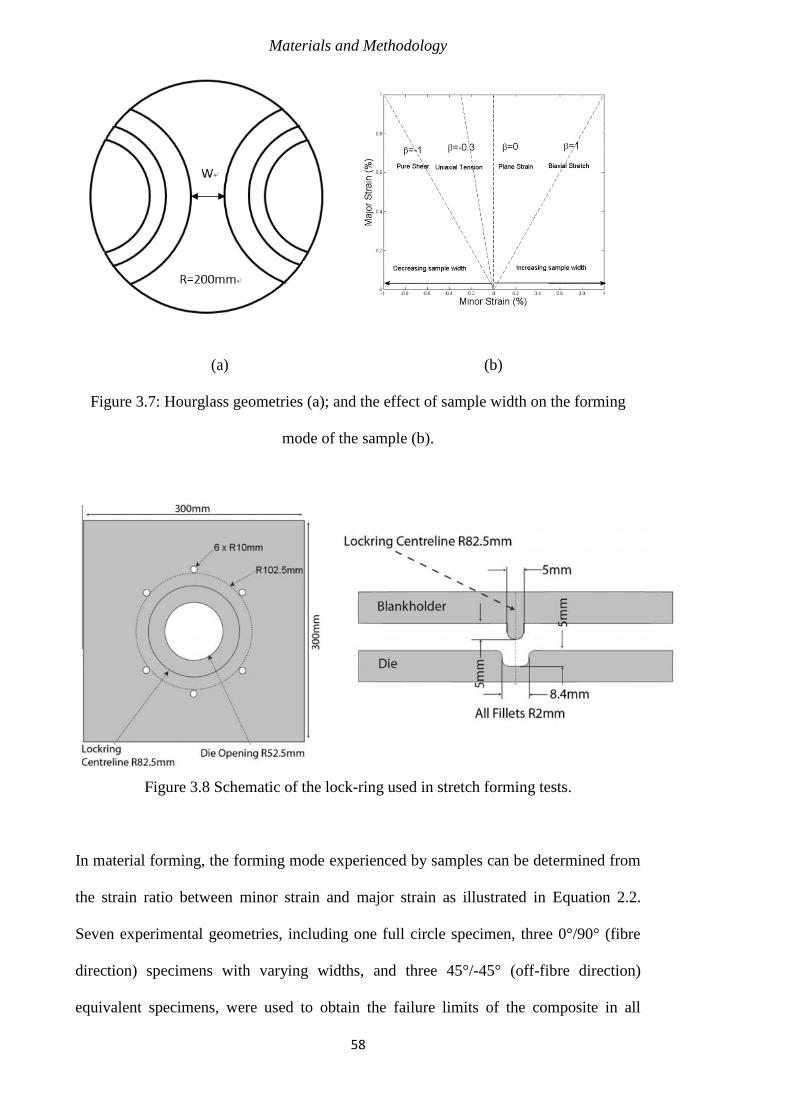
Materials and Methodology
58
(a) (b)
Figure 3.7: Hourglass geometries (a); and the effect of sample width on the forming
mode of the sample (b).
Figure 3.8 Schematic of the lock-ring used in stretch forming tests.
In material forming, the forming mode experienced by samples can be determined from
the strain ratio between minor strain and major strain as illustrated in Equation 2.2.
Seven experimental geometries, including one full circle specimen, three 0°/90° (fibre
direction) specimens with varying widths, and three 45°/-45° (off-fibre direction)
equivalent specimens, were used to obtain the failure limits of the composite in all
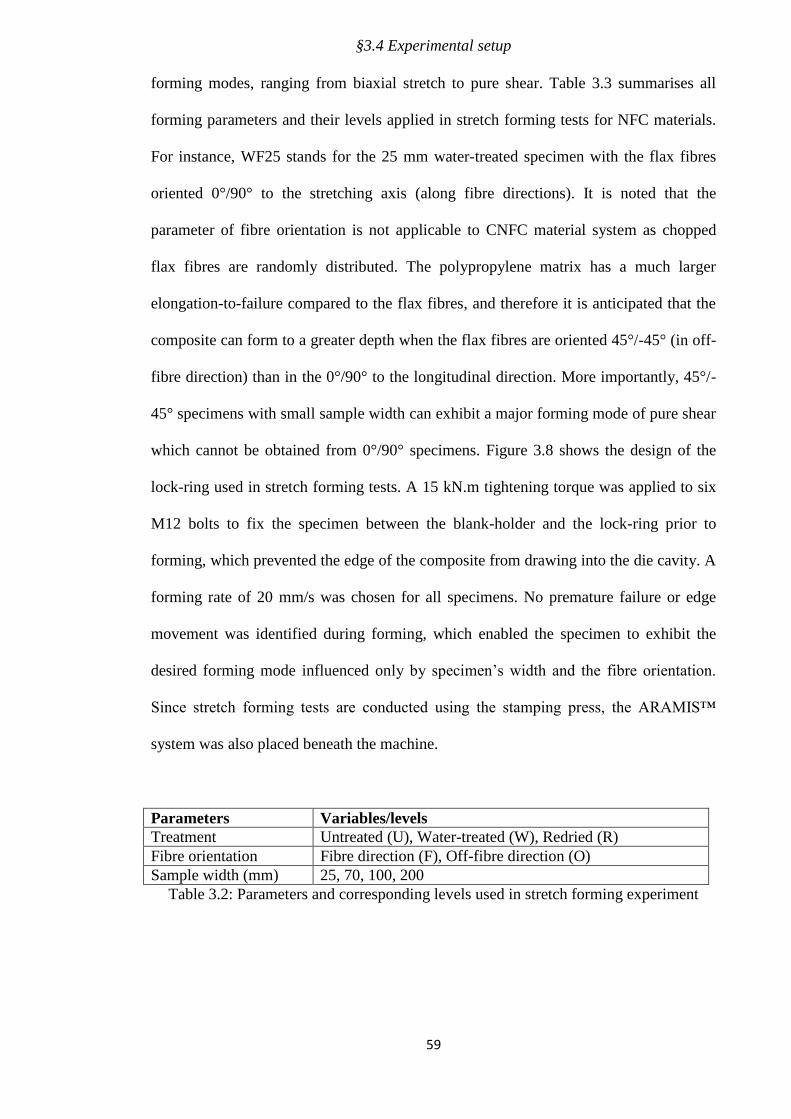
§3.4 Experimental setup
59
forming modes, ranging from biaxial stretch to pure shear. Table 3.3 summarises all
forming parameters and their levels applied in stretch forming tests for NFC materials.
For instance, WF25 stands for the 25 mm water-treated specimen with the flax fibres
oriented 0°/90° to the stretching axis (along fibre directions). It is noted that the
parameter of fibre orientation is not applicable to CNFC material system as chopped
flax fibres are randomly distributed. The polypropylene matrix has a much larger
elongation-to-failure compared to the flax fibres, and therefore it is anticipated that the
composite can form to a greater depth when the flax fibres are oriented 45°/-45° (in off-
fibre direction) than in the 0°/90° to the longitudinal direction. More importantly, 45°/-
45° specimens with small sample width can exhibit a major forming mode of pure shear
which cannot be obtained from 0°/90° specimens. Figure 3.8 shows the design of the
lock-ring used in stretch forming tests. A 15 kN.m tightening torque was applied to six
M12 bolts to fix the specimen between the blank-holder and the lock-ring prior to
forming, which prevented the edge of the composite from drawing into the die cavity. A
forming rate of 20 mm/s was chosen for all specimens. No premature failure or edge
movement was identified during forming, which enabled the specimen to exhibit the
desired forming mode influenced only by specimen’s width and the fibre orientation.
Since stretch forming tests are conducted using the stamping press, the ARAMIS™
system was also placed beneath the machine.
Parameters Variables/levels
Treatment Untreated (U), Water-treated (W), Redried (R)
Fibre orientation Fibre direction (F), Off-fibre direction (O)
Sample width (mm) 25, 70, 100, 200
Table 3.2: Parameters and corresponding levels used in stretch forming experiment
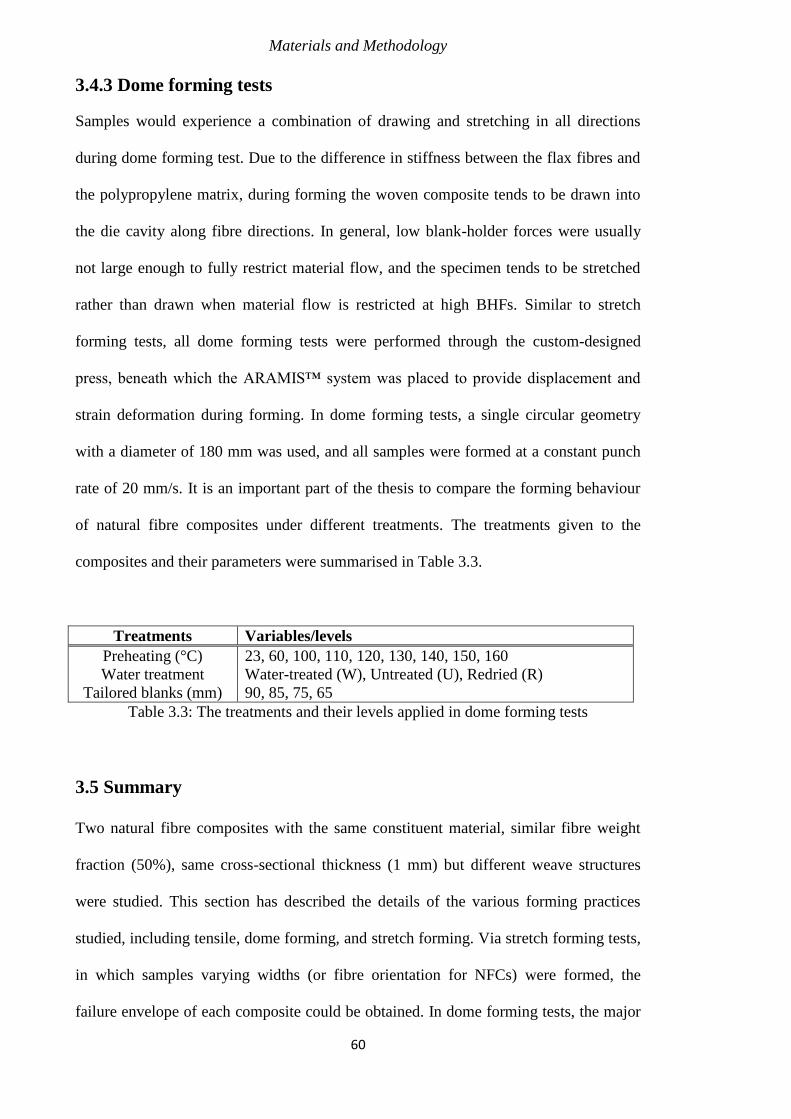
Materials and Methodology
60
3.4.3 Dome forming tests
Samples would experience a combination of drawing and stretching in all directions
during dome forming test. Due to the difference in stiffness between the flax fibres and
the polypropylene matrix, during forming the woven composite tends to be drawn into
the die cavity along fibre directions. In general, low blank-holder forces were usually
not large enough to fully restrict material flow, and the specimen tends to be stretched
rather than drawn when material flow is restricted at high BHFs. Similar to stretch
forming tests, all dome forming tests were performed through the custom-designed
press, beneath which the ARAMIS™ system was placed to provide displacement and
strain deformation during forming. In dome forming tests, a single circular geometry
with a diameter of 180 mm was used, and all samples were formed at a constant punch
rate of 20 mm/s. It is an important part of the thesis to compare the forming behaviour
of natural fibre composites under different treatments. The treatments given to the
composites and their parameters were summarised in Table 3.3.
Treatments Variables/levels
Preheating (°C) 23, 60, 100, 110, 120, 130, 140, 150, 160
Water treatment Water-treated (W), Untreated (U), Redried (R)
Tailored blanks (mm) 90, 85, 75, 65
Table 3.3: The treatments and their levels applied in dome forming tests
3.5 Summary
Two natural fibre composites with the same constituent material, similar fibre weight
fraction (50%), same cross-sectional thickness (1 mm) but different weave structures
were studied. This section has described the details of the various forming practices
studied, including tensile, dome forming, and stretch forming. Via stretch forming tests,
in which samples varying widths (or fibre orientation for NFCs) were formed, the
failure envelope of each composite could be obtained. In dome forming tests, the major

§3.5 Summary
61
forming mechanisms were more complicated, since the sample edge was not fixed and
the composite could be drawn into the die cavity. The effect of different treatments was
also able to be investigated by analysing the behaviour of composites under different
conditions. The ARAMIS™ system was used for all tests to provide data on strain
deformation of sample surfaces, which is of great importance for constructing failure
envelopes as well as determining the forming behaviour of each sort of composite.

Materials and Methodology
62
63
Chapter 4
Characterisation of Mechanical Properties
4.1 Introduction
In tensile tests samples are stretched at a constant rate of 5 mm/s until failure for both
NFC and CNFC. As mentioned previously, NFC stands for natural fibre composite and
refers to the continuous flax/pp composites manufactured by Composites Evolution in
UK. CNFC (Chopped natural fibre composites) refers to the chopped flax/pp composite
manufactured by EcoTechnilin, UK. Both material systems are stretched at different
temperatures ranging from room temperature to 160 ˚C, or in different conditions of
chemical treatment including water, NaOH, C.A and M.A. The understanding on
mechanical properties can aid analysis under the complicated forming situations
presented in Chapters 5 and 6. The variations in mechanical responses of this class of
material system could help compare the effectiveness of different treatments, and a
particular focus is paid to changes in stiffness and elongation-to-failure as they are key
to the forming behaviour of composites in rapid forming. A significant drop in
formability is observed when the both composite materials are uniaxial loaded at
temperatures higher than 140 ˚C, and the mechanism behind this observation is
determined from the observations in FTIR, TG mass and DSC examinations. This
section shows that the chemical treatments have the potential to outperform preheating
in improving the formability of natural fibre composites. The causes of change in
mechanical responses in chemical treatments are also determined through SEM
examinations on the fractured surfaces.
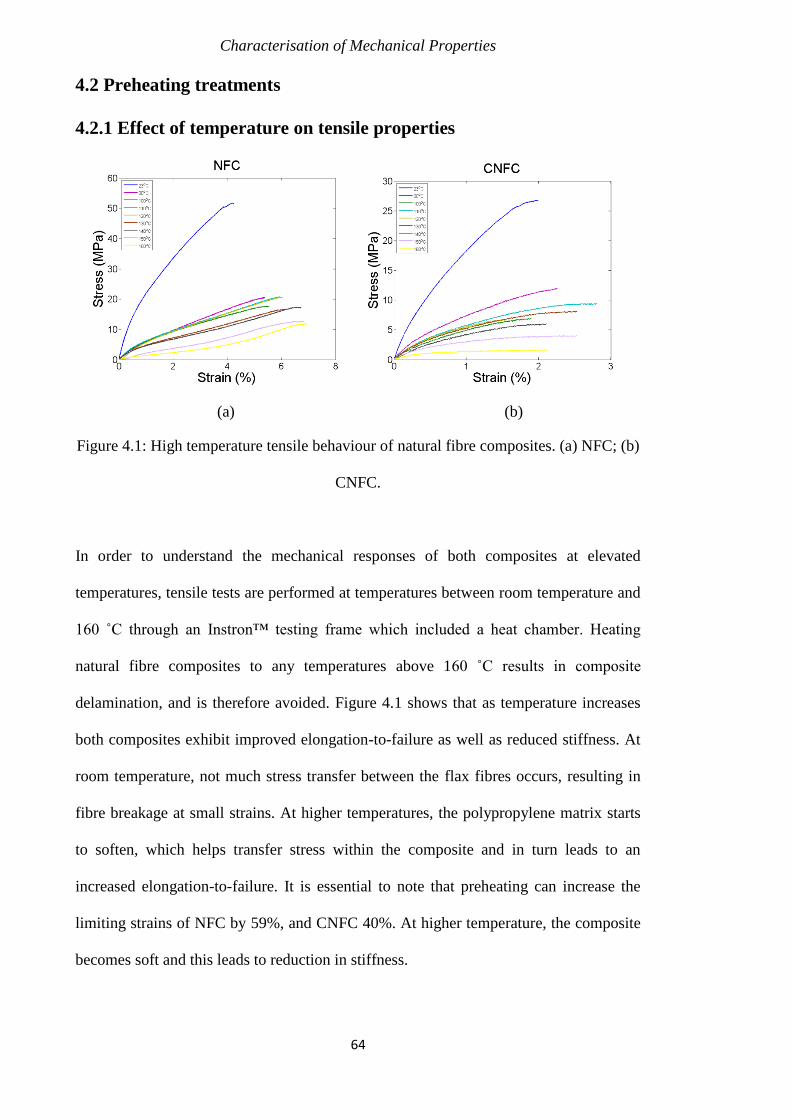
Characterisation of Mechanical Properties
64
4.2 Preheating treatments
4.2.1 Effect of temperature on tensile properties
(a) (b)
Figure 4.1: High temperature tensile behaviour of natural fibre composites. (a) NFC; (b)
CNFC.
In order to understand the mechanical responses of both composites at elevated
temperatures, tensile tests are performed at temperatures between room temperature and
160 ˚C through an Instron™ testing frame which included a heat chamber. Heating
natural fibre composites to any temperatures above 160 ˚C results in composite
delamination, and is therefore avoided. Figure 4.1 shows that as temperature increases
both composites exhibit improved elongation-to-failure as well as reduced stiffness. At
room temperature, not much stress transfer between the flax fibres occurs, resulting in
fibre breakage at small strains. At higher temperatures, the polypropylene matrix starts
to soften, which helps transfer stress within the composite and in turn leads to an
increased elongation-to-failure. It is essential to note that preheating can increase the
limiting strains of NFC by 59%, and CNFC 40%. At higher temperature, the composite
becomes soft and this leads to reduction in stiffness.
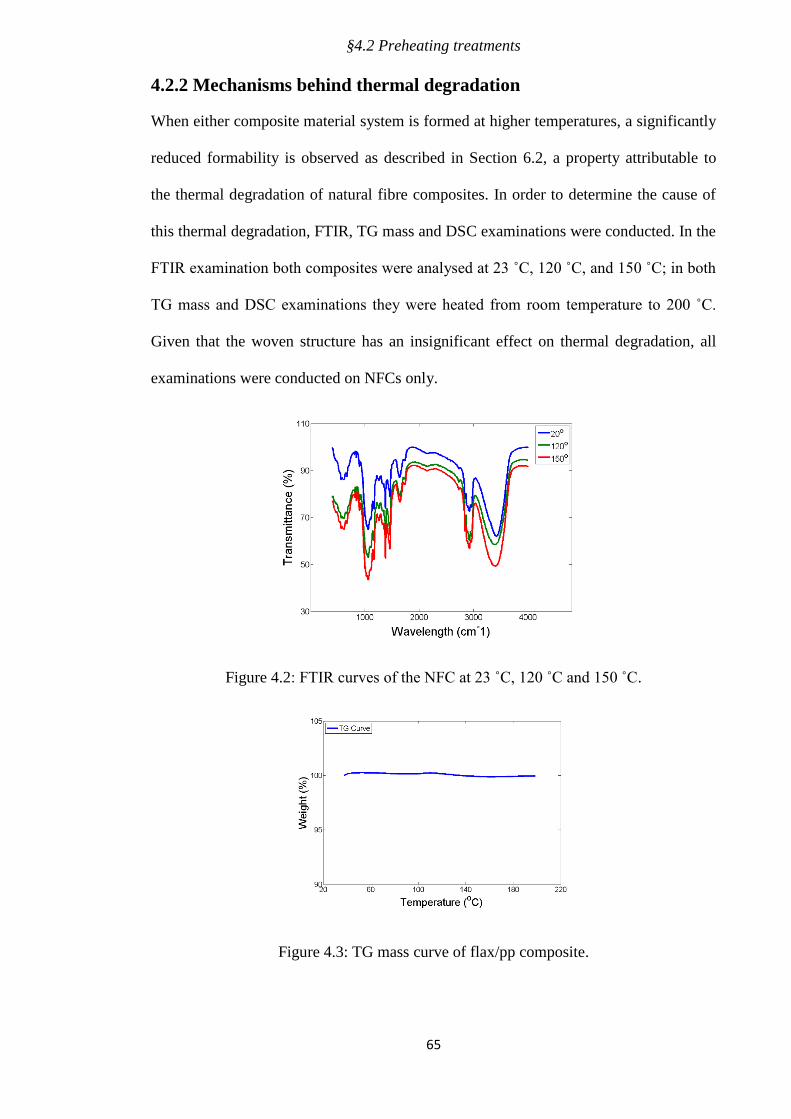
§4.2 Preheating treatments
65
4.2.2 Mechanisms behind thermal degradation
When either composite material system is formed at higher temperatures, a significantly
reduced formability is observed as described in Section 6.2, a property attributable to
the thermal degradation of natural fibre composites. In order to determine the cause of
this thermal degradation, FTIR, TG mass and DSC examinations were conducted. In the
FTIR examination both composites were analysed at 23 ˚C, 120 ˚C, and 150 ˚C; in both
TG mass and DSC examinations they were heated from room temperature to 200 ˚C.
Given that the woven structure has an insignificant effect on thermal degradation, all
examinations were conducted on NFCs only.
Figure 4.2: FTIR curves of the NFC at 23 ˚C, 120 ˚C and 150 ˚C.
Figure 4.3: TG mass curve of flax/pp composite.
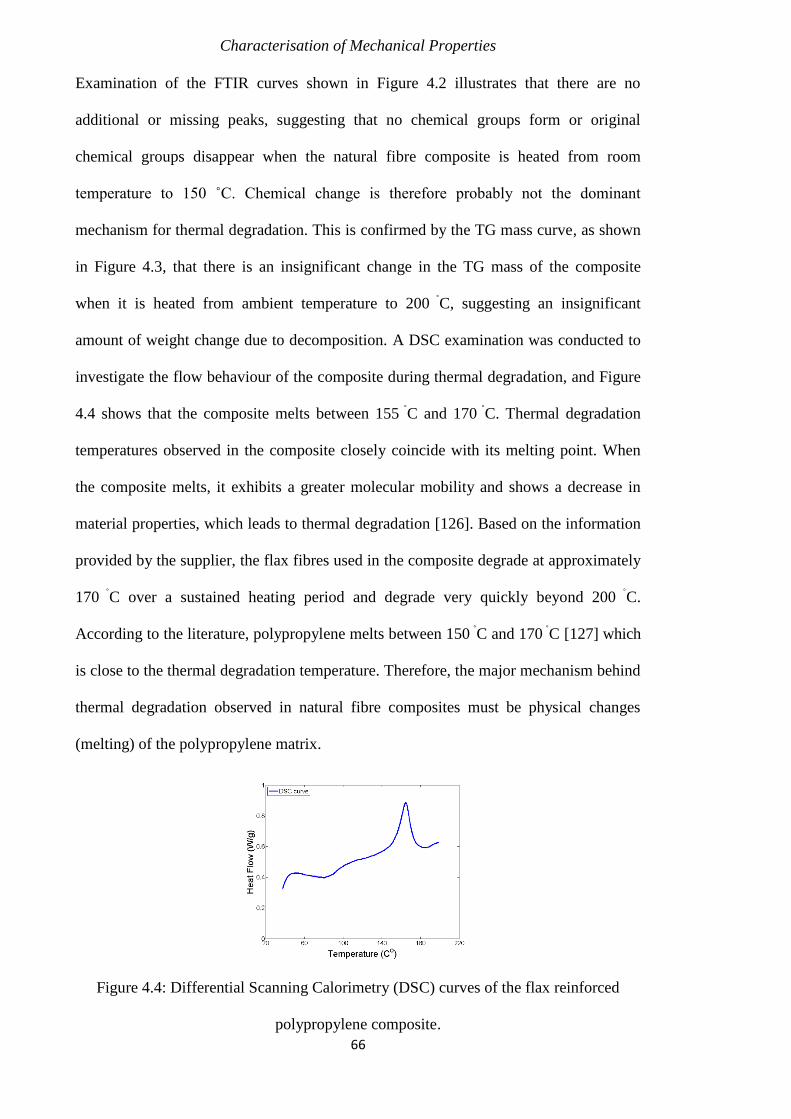
Characterisation of Mechanical Properties
66
Examination of the FTIR curves shown in Figure 4.2 illustrates that there are no
additional or missing peaks, suggesting that no chemical groups form or original
chemical groups disappear when the natural fibre composite is heated from room
temperature to 150 ˚C. Chemical change is therefore probably not the dominant
mechanism for thermal degradation. This is confirmed by the TG mass curve, as shown
in Figure 4.3, that there is an insignificant change in the TG mass of the composite
when it is heated from ambient temperature to 200 ˚C, suggesting an insignificant
amount of weight change due to decomposition. A DSC examination was conducted to
investigate the flow behaviour of the composite during thermal degradation, and Figure
4.4 shows that the composite melts between 155 ˚C and 170 ˚C. Thermal degradation
temperatures observed in the composite closely coincide with its melting point. When
the composite melts, it exhibits a greater molecular mobility and shows a decrease in
material properties, which leads to thermal degradation [126]. Based on the information
provided by the supplier, the flax fibres used in the composite degrade at approximately
170 ˚C over a sustained heating period and degrade very quickly beyond 200 ˚C.
According to the literature, polypropylene melts between 150 ˚C and 170 ˚C [127] which
is close to the thermal degradation temperature. Therefore, the major mechanism behind
thermal degradation observed in natural fibre composites must be physical changes
(melting) of the polypropylene matrix.
Figure 4.4: Differential Scanning Calorimetry (DSC) curves of the flax reinforced
polypropylene composite.
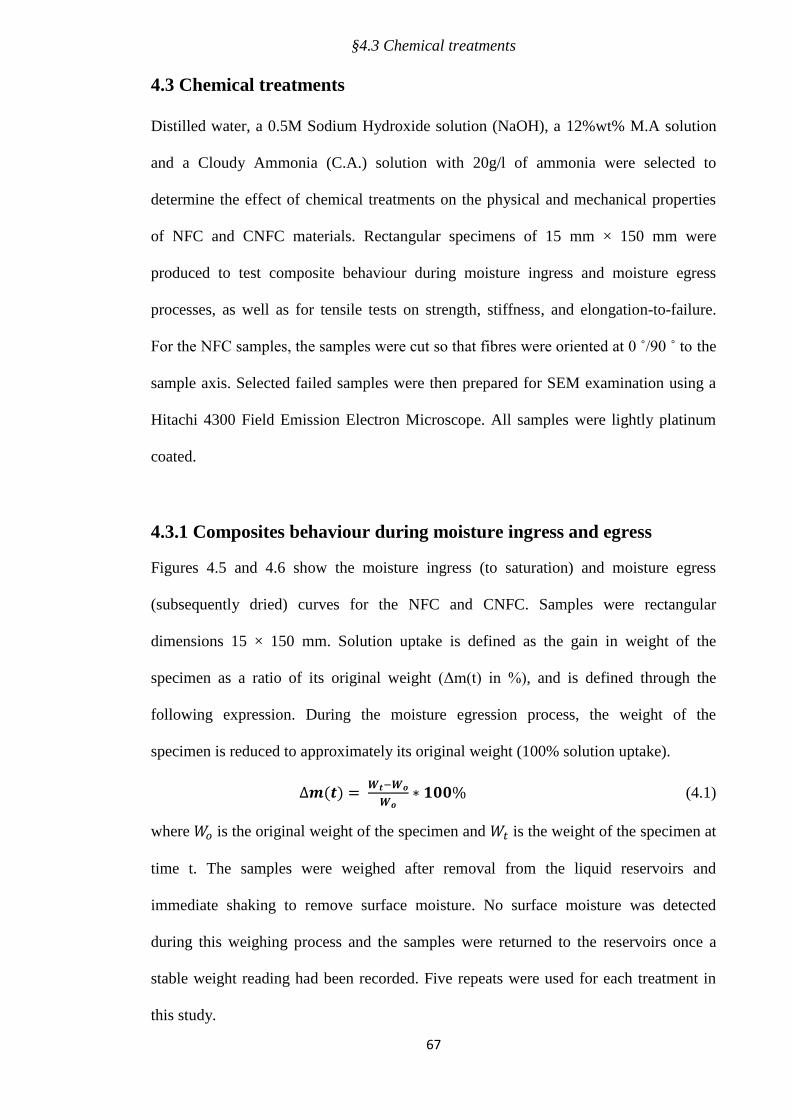
§4.3 Chemical treatments
67
4.3 Chemical treatments
Distilled water, a 0.5M Sodium Hydroxide solution (NaOH), a 12%wt% M.A solution
and a Cloudy Ammonia (C.A.) solution with 20g/l of ammonia were selected to
determine the effect of chemical treatments on the physical and mechanical properties
of NFC and CNFC materials. Rectangular specimens of 15 mm × 150 mm were
produced to test composite behaviour during moisture ingress and moisture egress
processes, as well as for tensile tests on strength, stiffness, and elongation-to-failure.
For the NFC samples, the samples were cut so that fibres were oriented at 0 ˚/90 ˚ to the
sample axis. Selected failed samples were then prepared for SEM examination using a
Hitachi 4300 Field Emission Electron Microscope. All samples were lightly platinum
coated.
4.3.1 Composites behaviour during moisture ingress and egress
Figures 4.5 and 4.6 show the moisture ingress (to saturation) and moisture egress
(subsequently dried) curves for the NFC and CNFC. Samples were rectangular
dimensions 15 × 150 mm. Solution uptake is defined as the gain in weight of the
specimen as a ratio of its original weight (Δm(t) in %), and is defined through the
following expression. During the moisture egression process, the weight of the
specimen is reduced to approximately its original weight (100% solution uptake).
∆𝒎(𝒕) = 𝑾𝒕−𝑾𝒐
𝑾𝒐∗ 𝟏𝟎𝟎% (4.1)
where 𝑊𝑜 is the original weight of the specimen and 𝑊𝑡 is the weight of the specimen at
time t. The samples were weighed after removal from the liquid reservoirs and
immediate shaking to remove surface moisture. No surface moisture was detected
during this weighing process and the samples were returned to the reservoirs once a
stable weight reading had been recorded. Five repeats were used for each treatment in
this study.
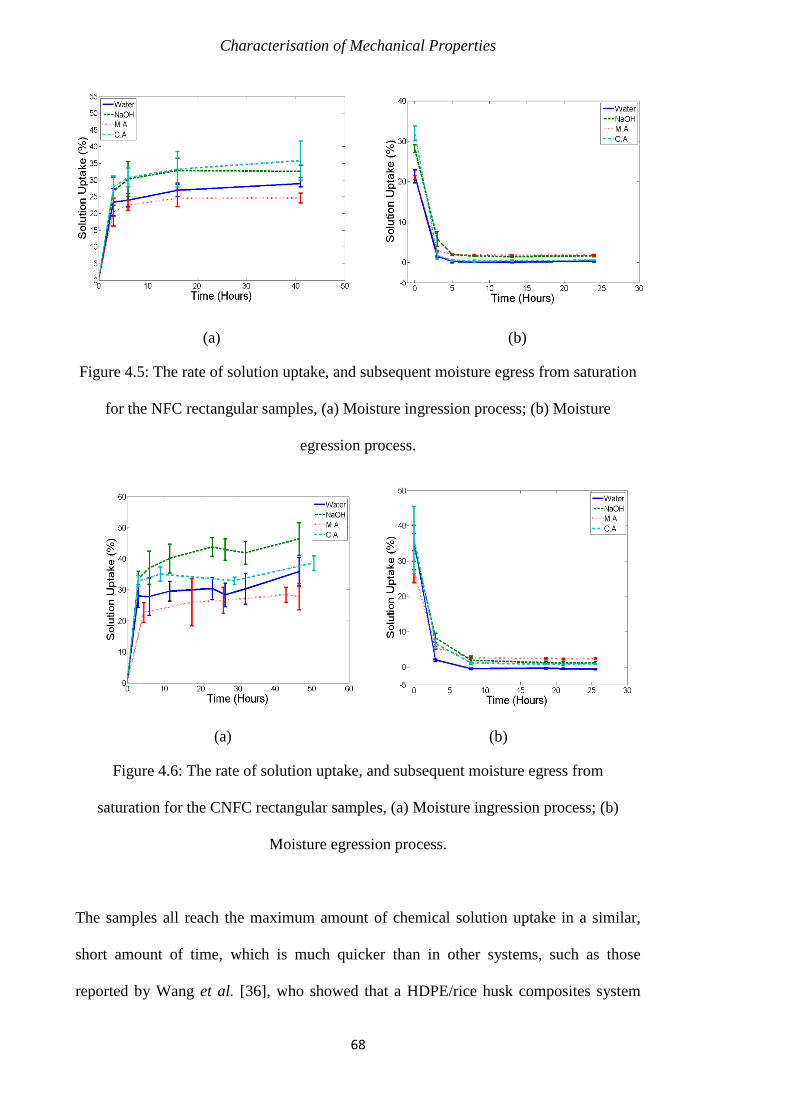
Characterisation of Mechanical Properties
68
(a) (b)
Figure 4.5: The rate of solution uptake, and subsequent moisture egress from saturation
for the NFC rectangular samples, (a) Moisture ingression process; (b) Moisture
egression process.
(a) (b)
Figure 4.6: The rate of solution uptake, and subsequent moisture egress from
saturation for the CNFC rectangular samples, (a) Moisture ingression process; (b)
Moisture egression process.
The samples all reach the maximum amount of chemical solution uptake in a similar,
short amount of time, which is much quicker than in other systems, such as those
reported by Wang et al. [36], who showed that a HDPE/rice husk composites system
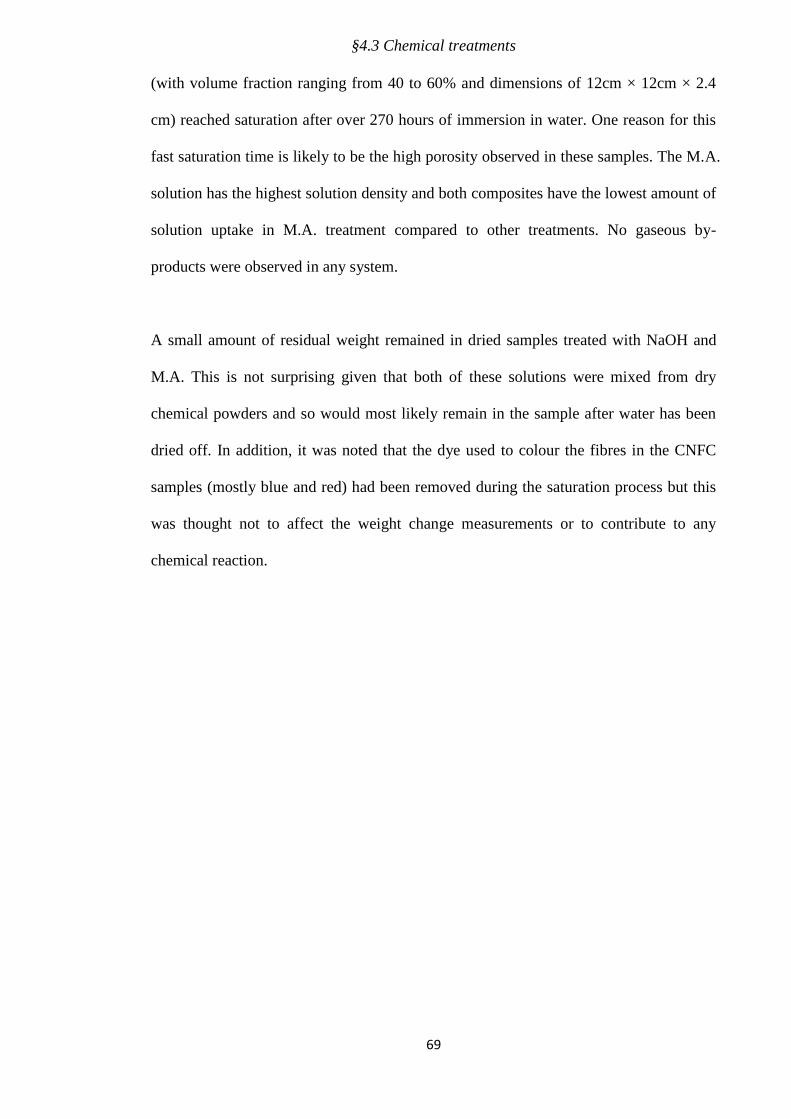
§4.3 Chemical treatments
69
(with volume fraction ranging from 40 to 60% and dimensions of 12cm × 12cm × 2.4
cm) reached saturation after over 270 hours of immersion in water. One reason for this
fast saturation time is likely to be the high porosity observed in these samples. The M.A.
solution has the highest solution density and both composites have the lowest amount of
solution uptake in M.A. treatment compared to other treatments. No gaseous by-
products were observed in any system.
A small amount of residual weight remained in dried samples treated with NaOH and
M.A. This is not surprising given that both of these solutions were mixed from dry
chemical powders and so would most likely remain in the sample after water has been
dried off. In addition, it was noted that the dye used to colour the fibres in the CNFC
samples (mostly blue and red) had been removed during the saturation process but this
was thought not to affect the weight change measurements or to contribute to any
chemical reaction.
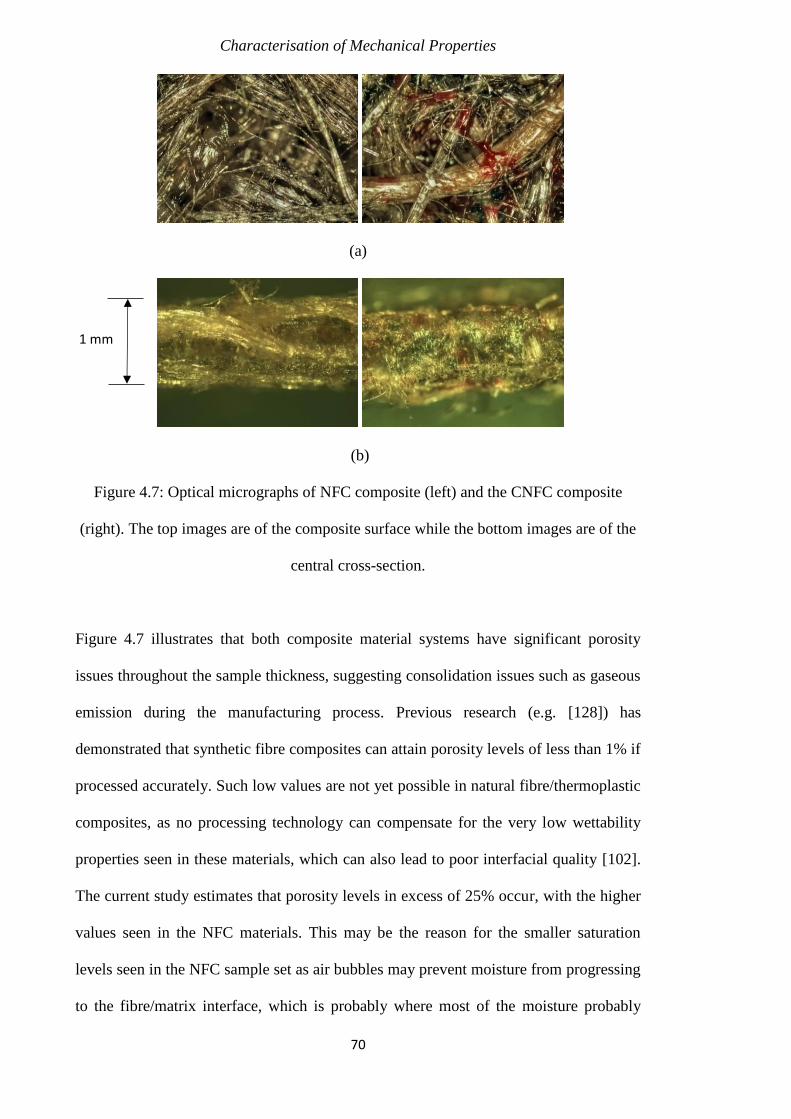
Characterisation of Mechanical Properties
70
(a)
(b)
Figure 4.7: Optical micrographs of NFC composite (left) and the CNFC composite
(right). The top images are of the composite surface while the bottom images are of the
central cross-section.
Figure 4.7 illustrates that both composite material systems have significant porosity
issues throughout the sample thickness, suggesting consolidation issues such as gaseous
emission during the manufacturing process. Previous research (e.g. [128]) has
demonstrated that synthetic fibre composites can attain porosity levels of less than 1% if
processed accurately. Such low values are not yet possible in natural fibre/thermoplastic
composites, as no processing technology can compensate for the very low wettability
properties seen in these materials, which can also lead to poor interfacial quality [102].
The current study estimates that porosity levels in excess of 25% occur, with the higher
values seen in the NFC materials. This may be the reason for the smaller saturation
levels seen in the NFC sample set as air bubbles may prevent moisture from progressing
to the fibre/matrix interface, which is probably where most of the moisture probably
1 mm
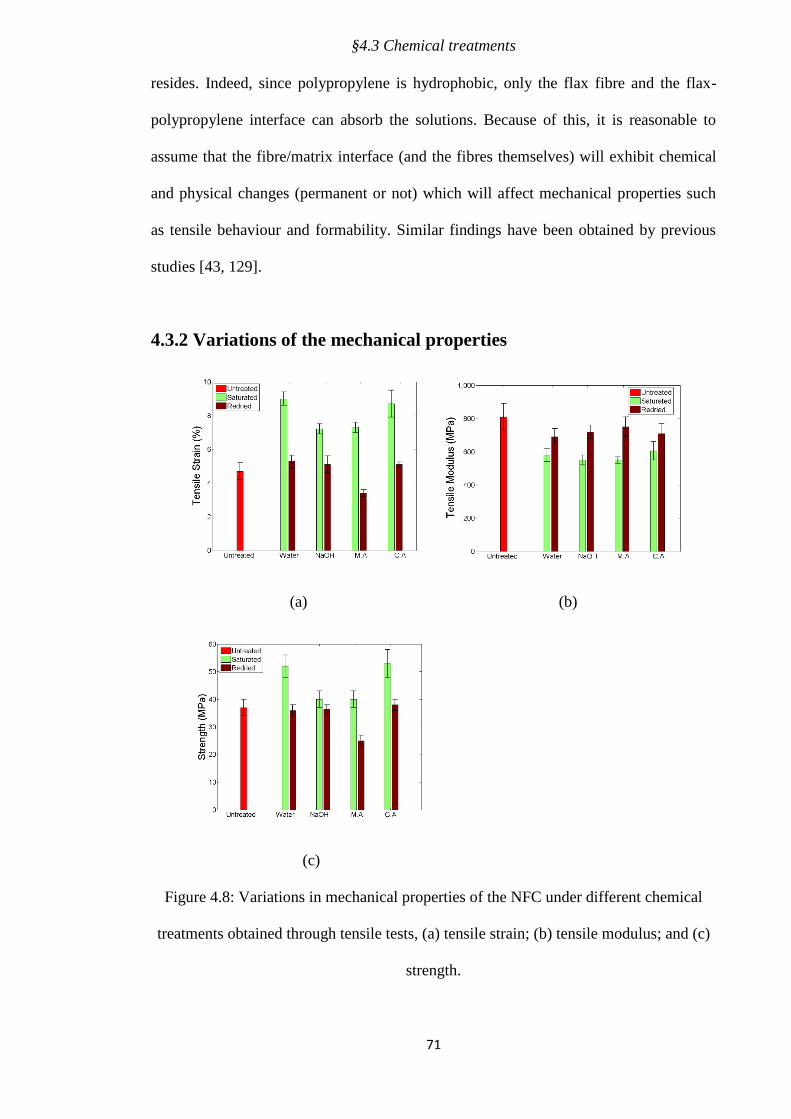
§4.3 Chemical treatments
71
resides. Indeed, since polypropylene is hydrophobic, only the flax fibre and the flax-
polypropylene interface can absorb the solutions. Because of this, it is reasonable to
assume that the fibre/matrix interface (and the fibres themselves) will exhibit chemical
and physical changes (permanent or not) which will affect mechanical properties such
as tensile behaviour and formability. Similar findings have been obtained by previous
studies [43, 129].
4.3.2 Variations of the mechanical properties
(a) (b)
(c)
Figure 4.8: Variations in mechanical properties of the NFC under different chemical
treatments obtained through tensile tests, (a) tensile strain; (b) tensile modulus; and (c)
strength.
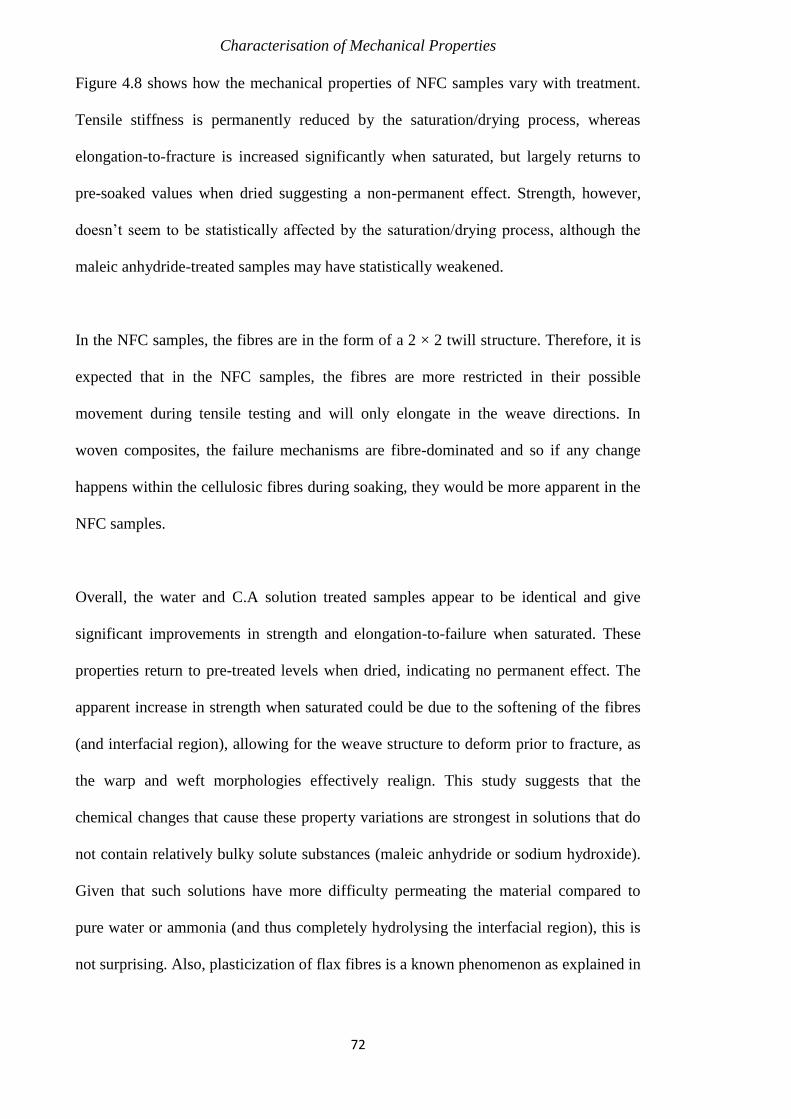
Characterisation of Mechanical Properties
72
Figure 4.8 shows how the mechanical properties of NFC samples vary with treatment.
Tensile stiffness is permanently reduced by the saturation/drying process, whereas
elongation-to-fracture is increased significantly when saturated, but largely returns to
pre-soaked values when dried suggesting a non-permanent effect. Strength, however,
doesn’t seem to be statistically affected by the saturation/drying process, although the
maleic anhydride-treated samples may have statistically weakened.
In the NFC samples, the fibres are in the form of a 2 × 2 twill structure. Therefore, it is
expected that in the NFC samples, the fibres are more restricted in their possible
movement during tensile testing and will only elongate in the weave directions. In
woven composites, the failure mechanisms are fibre-dominated and so if any change
happens within the cellulosic fibres during soaking, they would be more apparent in the
NFC samples.
Overall, the water and C.A solution treated samples appear to be identical and give
significant improvements in strength and elongation-to-failure when saturated. These
properties return to pre-treated levels when dried, indicating no permanent effect. The
apparent increase in strength when saturated could be due to the softening of the fibres
(and interfacial region), allowing for the weave structure to deform prior to fracture, as
the warp and weft morphologies effectively realign. This study suggests that the
chemical changes that cause these property variations are strongest in solutions that do
not contain relatively bulky solute substances (maleic anhydride or sodium hydroxide).
Given that such solutions have more difficulty permeating the material compared to
pure water or ammonia (and thus completely hydrolysing the interfacial region), this is
not surprising. Also, plasticization of flax fibres is a known phenomenon as explained in
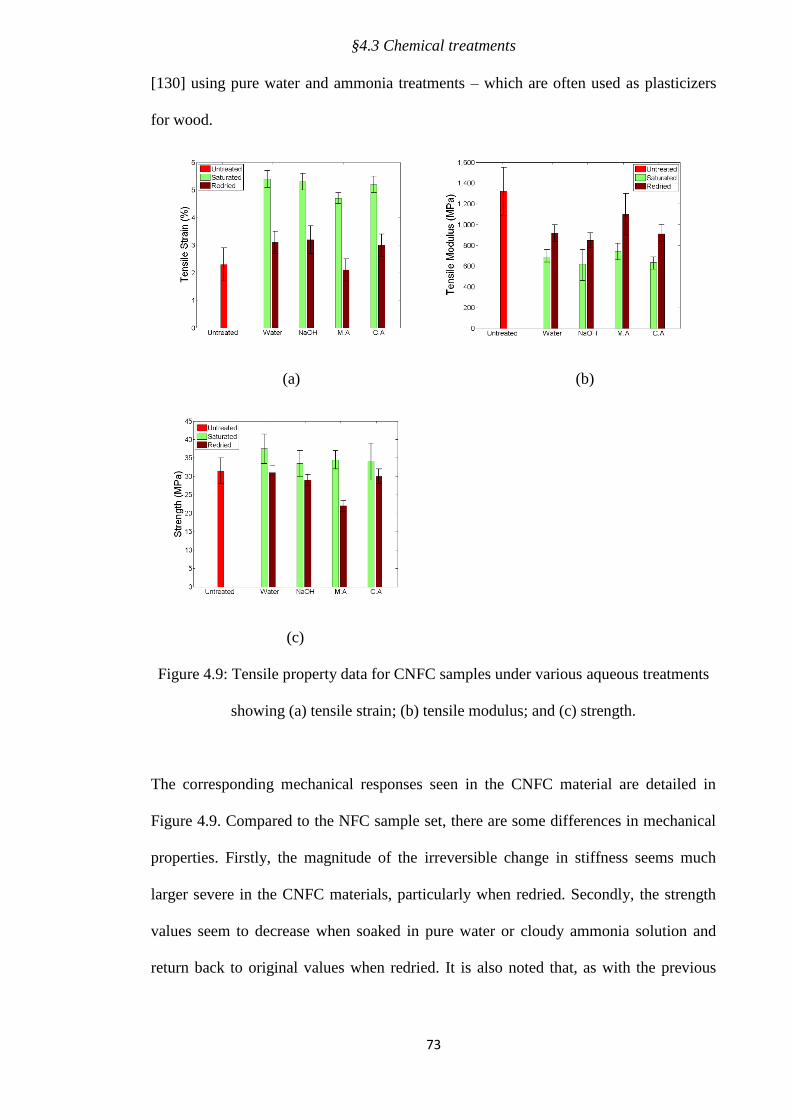
§4.3 Chemical treatments
73
[130] using pure water and ammonia treatments – which are often used as plasticizers
for wood.
(a) (b)
(c)
Figure 4.9: Tensile property data for CNFC samples under various aqueous treatments
showing (a) tensile strain; (b) tensile modulus; and (c) strength.
The corresponding mechanical responses seen in the CNFC material are detailed in
Figure 4.9. Compared to the NFC sample set, there are some differences in mechanical
properties. Firstly, the magnitude of the irreversible change in stiffness seems much
larger severe in the CNFC materials, particularly when redried. Secondly, the strength
values seem to decrease when soaked in pure water or cloudy ammonia solution and
return back to original values when redried. It is also noted that, as with the previous
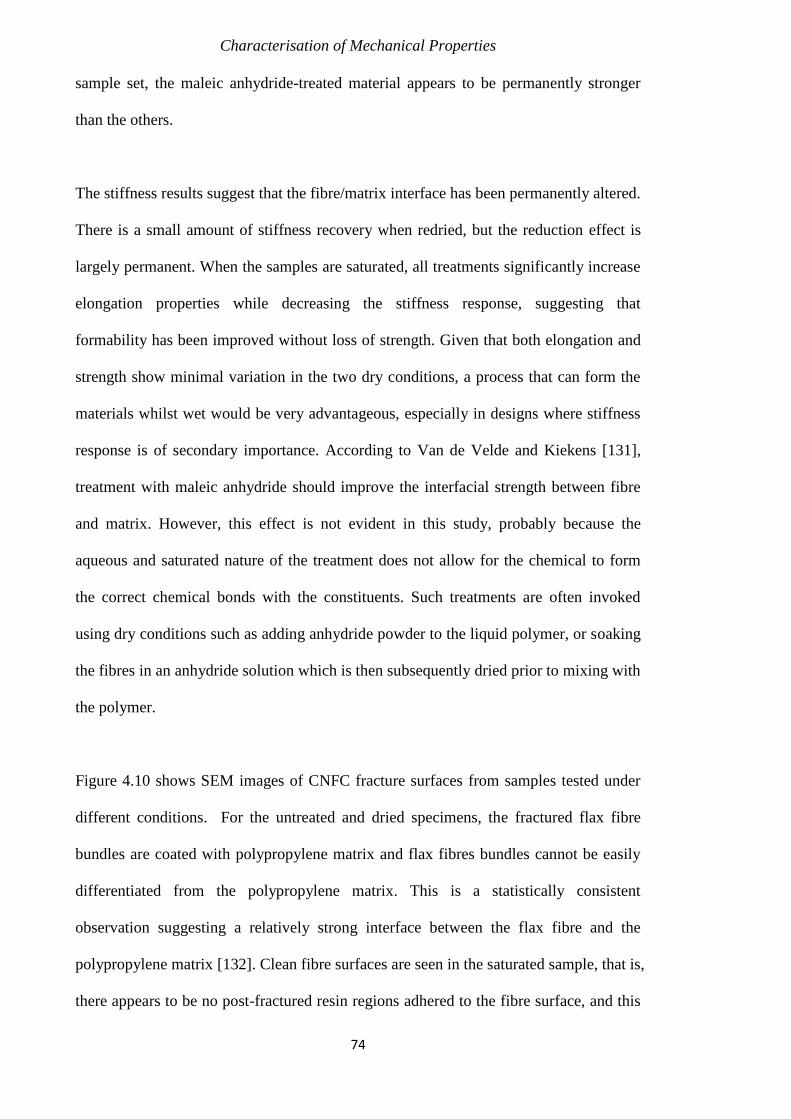
Characterisation of Mechanical Properties
74
sample set, the maleic anhydride-treated material appears to be permanently stronger
than the others.
The stiffness results suggest that the fibre/matrix interface has been permanently altered.
There is a small amount of stiffness recovery when redried, but the reduction effect is
largely permanent. When the samples are saturated, all treatments significantly increase
elongation properties while decreasing the stiffness response, suggesting that
formability has been improved without loss of strength. Given that both elongation and
strength show minimal variation in the two dry conditions, a process that can form the
materials whilst wet would be very advantageous, especially in designs where stiffness
response is of secondary importance. According to Van de Velde and Kiekens [131],
treatment with maleic anhydride should improve the interfacial strength between fibre
and matrix. However, this effect is not evident in this study, probably because the
aqueous and saturated nature of the treatment does not allow for the chemical to form
the correct chemical bonds with the constituents. Such treatments are often invoked
using dry conditions such as adding anhydride powder to the liquid polymer, or soaking
the fibres in an anhydride solution which is then subsequently dried prior to mixing with
the polymer.
Figure 4.10 shows SEM images of CNFC fracture surfaces from samples tested under
different conditions. For the untreated and dried specimens, the fractured flax fibre
bundles are coated with polypropylene matrix and flax fibres bundles cannot be easily
differentiated from the polypropylene matrix. This is a statistically consistent
observation suggesting a relatively strong interface between the flax fibre and the
polypropylene matrix [132]. Clean fibre surfaces are seen in the saturated sample, that is,
there appears to be no post-fractured resin regions adhered to the fibre surface, and this
§4.3 Chemical treatments
75
is indicative of a much weaker fibre-matrix interface when hydrolysed. It has been
reported [43] that when solutions are absorbed by the fibre/matrix interface, the
cellulosic fibres tend to swell which favours fibre debonding and weakens the
fibre/matrix interface leading to tensile property variations. This would appear to be the
case for the current study, as the interfacial properties (stiffness and elongation) are
significantly changed when wet. In addition, the strength of the materials appears
remain largely independent of the saturation and redrying process and no significant
changes to fibre fracture morphology was detected during the fractographic study.
Therefore, if the cellulosic fibres swell during the saturation process, they remain
chemically unchanged, whilst initiating changes at the interfacial region. On drying, the
fibre-matrix integrity seems to return, but there is a permanent reduction in composite
stiffness. This could suggest the presence of an interphase region which remains
permanently weakened from the saturation process. Thus when dried, the samples retain
strength (no fibre changes observed), and regain their interfacial characteristics (as per
the SEM observations) whilst maintaining a reduced stiffness through mechanical
weakness in the interphase region, which may be pre-existing, or may have formed as a
result of the saturation process. Mishra and Sain [133] documented a similar finding
that the stiffness of natural fibre composite did not fully recover after drying the
samples, and this permanent damage to the fibre was attributed to the interfacial
degradation and structure breakdown of the cell wall in natural fibres. A possible
exception to these trends is the maleic anhydride-treated material, where strength seems
to be permanently reduced once the samples are dried. This could be due to chemical
ingress of the anhydride solution into the cellulosic fibres which when dried, cause
chemical changes that permanently weaken the fibres, although this was not detected
during fractographic examination.
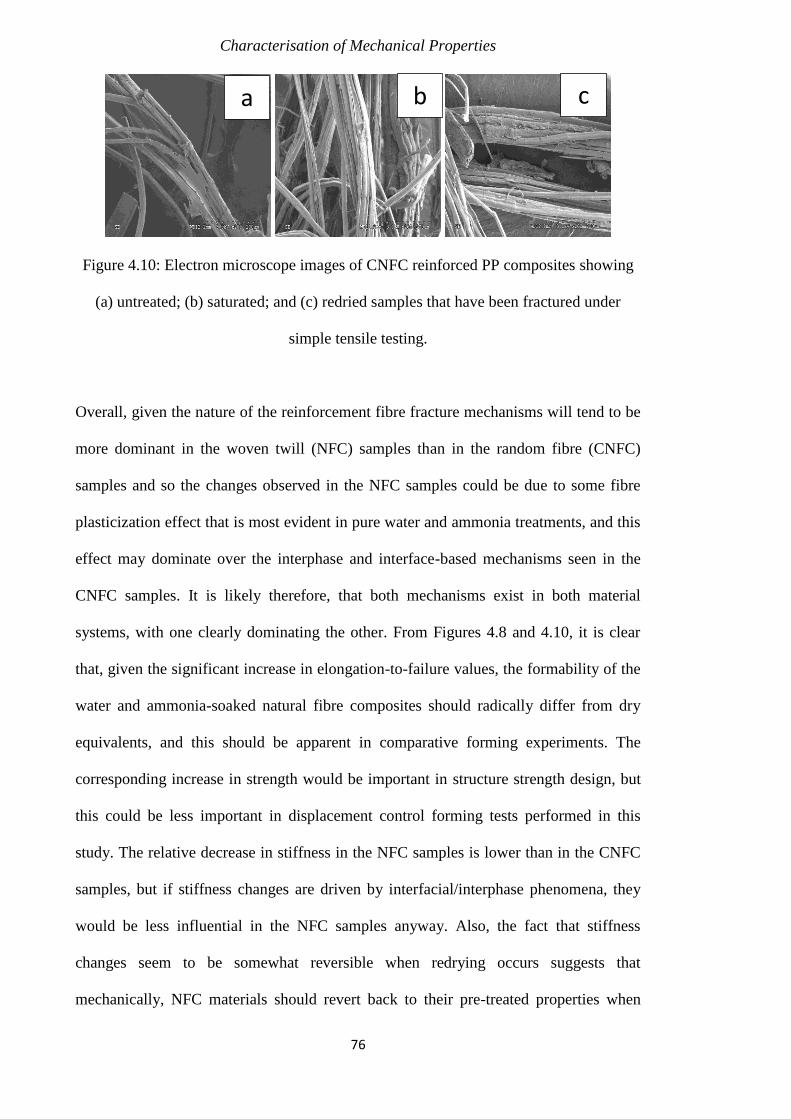
Characterisation of Mechanical Properties
76
Figure 4.10: Electron microscope images of CNFC reinforced PP composites showing
(a) untreated; (b) saturated; and (c) redried samples that have been fractured under
simple tensile testing.
Overall, given the nature of the reinforcement fibre fracture mechanisms will tend to be
more dominant in the woven twill (NFC) samples than in the random fibre (CNFC)
samples and so the changes observed in the NFC samples could be due to some fibre
plasticization effect that is most evident in pure water and ammonia treatments, and this
effect may dominate over the interphase and interface-based mechanisms seen in the
CNFC samples. It is likely therefore, that both mechanisms exist in both material
systems, with one clearly dominating the other. From Figures 4.8 and 4.10, it is clear
that, given the significant increase in elongation-to-failure values, the formability of the
water and ammonia-soaked natural fibre composites should radically differ from dry
equivalents, and this should be apparent in comparative forming experiments. The
corresponding increase in strength would be important in structure strength design, but
this could be less important in displacement control forming tests performed in this
study. The relative decrease in stiffness in the NFC samples is lower than in the CNFC
samples, but if stiffness changes are driven by interfacial/interphase phenomena, they
would be less influential in the NFC samples anyway. Also, the fact that stiffness
changes seem to be somewhat reversible when redrying occurs suggests that
mechanically, NFC materials should revert back to their pre-treated properties when
a b c
§4.4 Summary
77
dried. This makes them quite attractive as a material for structures where significant
drawing is required, so long as they can be processed when wet.
4.4 Summary
This Chapter has studied the mechanical behaviour of natural fibre composites at
elevated temperatures, as well as in different conditions of water treatment. Both
composites were stretched at a constant rate until failure at different temperatures
varying from room temperature to 160˚C. The experimental results show that preheating
treatment can help natural fibre composites exhibit an increased elongation-to-failure, as
well as a reduced stiffness. Composites were also stretched in different conditions of
water treatment, including the untreated, water-treated and redried conditions.
Observations suggest that it is very advantageous to process this class of material
system in the wet condition, especially since the mechanical properties can be largely
returned to the untreated levels after redrying. Based on SEM examinations on the
fractured surfaces, the dominating mechanisms behind the variations of mechanical
properties have been determined to be softening in fibre-matrix interface (for the CNFC
materials) and fibre plasticization (for NFC materials). Preheating is usually required to
improve the formability of material in rapid forming, and the chemical treatments
performed in this study were far more effective than preheating in terms of improving
the mechanical responses of composite materials in simple forming conditions. Chapters
5 and 6 investigate whether such major breakthrough could be translated to a superior
formability of this class of material system in more complicated forming situations.

Characterisation of Mechanical Properties
78
79
Chapter 5
Stretch Forming Tests
5.1 Introduction
This Chapter details the stretch forming experiments conducted, and investigates the
failure behaviour of the composites through examining displacement and strain
deformation captured by a real-time strain measurement, the ARAMIS™ system. The
key finding of the current work is that it proposes an innovative failure criterion for
woven composites, called a “new FLC”, which uses fibre strain and strain ratio as
key parameters. This new failure criterion is more effective than the conventional
FLC in detecting the failure in woven natural fibre composites as it can successfully
eliminate the path dependency effect. This innovative method of examining failure can
be applied to engineering structural design and analysis of different woven composite
systems as long as the failure mechanism is dominated by fibre fracture. The previous
Chapter has proved that pure water and C.A produce the greatest improvement on the
failure elongation of both composites in the saturation condition than other chemicals
and the conventional preheating method. Part of the scope of this investigation is
therefore to examine the forming limits of composites in three conditions of water
treatment: untreated, water-treated and redried. FEA simulations are an essential tool in
engineering structural design and analysis, and the development of the new FLC would
be much less useful if this failure criterion could not be implemented in FEA models.
Here, FEA models are developed to simulate the stretch forming process of composites
in different conditions, and to compare the new FLC with existing failure criteria in
predicting the onset of failure in stretch forming tests.
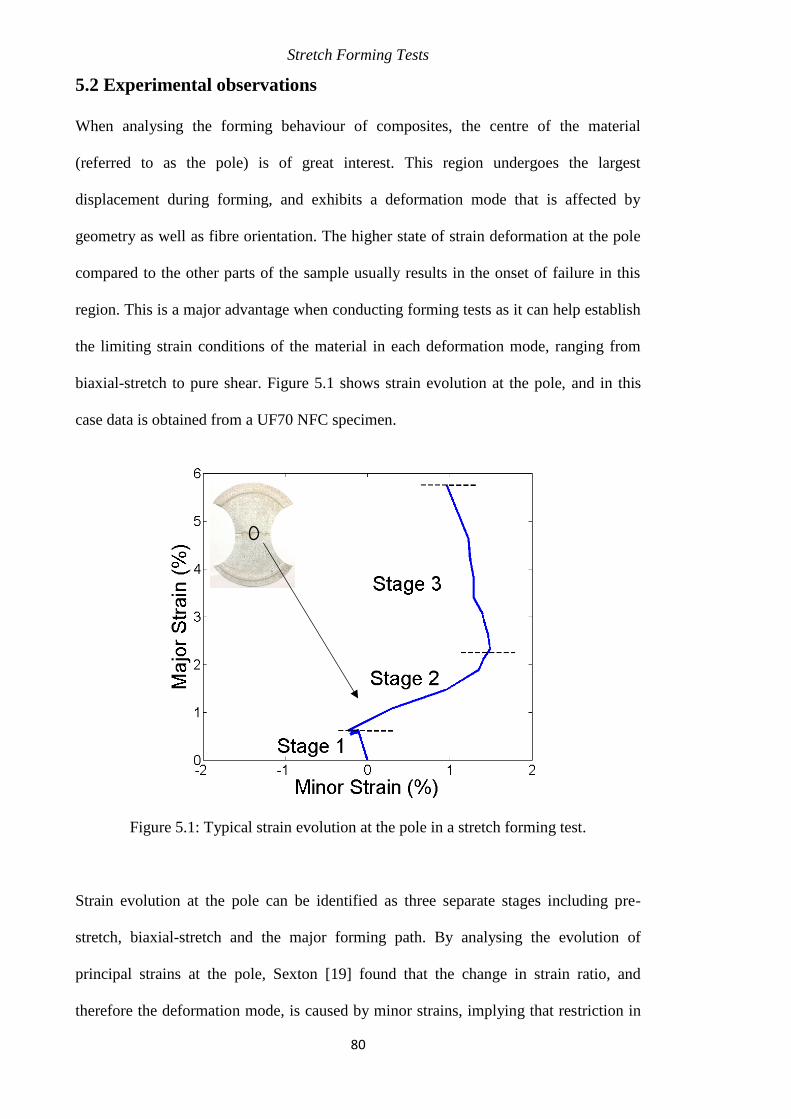
Stretch Forming Tests
80
5.2 Experimental observations
When analysing the forming behaviour of composites, the centre of the material
(referred to as the pole) is of great interest. This region undergoes the largest
displacement during forming, and exhibits a deformation mode that is affected by
geometry as well as fibre orientation. The higher state of strain deformation at the pole
compared to the other parts of the sample usually results in the onset of failure in this
region. This is a major advantage when conducting forming tests as it can help establish
the limiting strain conditions of the material in each deformation mode, ranging from
biaxial-stretch to pure shear. Figure 5.1 shows strain evolution at the pole, and in this
case data is obtained from a UF70 NFC specimen.
Figure 5.1: Typical strain evolution at the pole in a stretch forming test.
Strain evolution at the pole can be identified as three separate stages including pre-
stretch, biaxial-stretch and the major forming path. By analysing the evolution of
principal strains at the pole, Sexton [19] found that the change in strain ratio, and
therefore the deformation mode, is caused by minor strains, implying that restriction in
§5.2 Experimental observations
81
the lateral direction is a key factor for changes in strain ratio. Specimens are fixed to the
blank-holder through tightening six M12 bolts with a torque of 15 kN.m on the lock
ring mounted beneath. This pre-stretch process results in initial strain deformation, the
details of which are explained later. A composite exhibits a forming mode of biaxial
stretch when it establishes initial contact with the punch. At this stage, only a small
region at the pole deforms and the rest of the material surface can be considered as fixed,
resulting in the forming mode of biaxial stretch during this period. As soon as the lateral
restriction starts to disappear, bi-axial stretch behaviour ends and the third stage starts.
At this stage, the composite is allowed to be drawn into the die cavity in the lateral
direction due to the lack of restriction in this direction. The strain information at failure
can therefore be obtained by the ARAMIS system, and used for constructing Forming
Limit Curve, the details of which are described in Sections 5.2.1.4 and 5.2.2.2.
5.2.1 NFC materials
The benefit of conducting stretch forming tests is to find out the forming limits in
different deformation modes. To examine the changes in deformation modes during
stretch forming tests, the evolution of surface strain ratio is studied at the end of each of
the three stages. The relationship between deformation modes and strain ratios is
illustrated in Table 2.2 of Chapter 2. The ARAMIS™ system does not have built-in
algorithms to provide information on strain ratio, so a Python script is developed to
calculate this. To avoid illegal floating point issues, the script deals specifically with the
situation when the ARAMIS™ system reports a major strain of 0. In such cases, a strain
ratio of 0 is reported, instead of taking the ratio between the principal strains. It is noted
that prior to forming, a lock-ring was used to fix specimens completely, avoiding
materials at the flange regions from drawing into the die cavity. Too large or too small
tightening torque leads to either premature failure when the composite fails during pre-
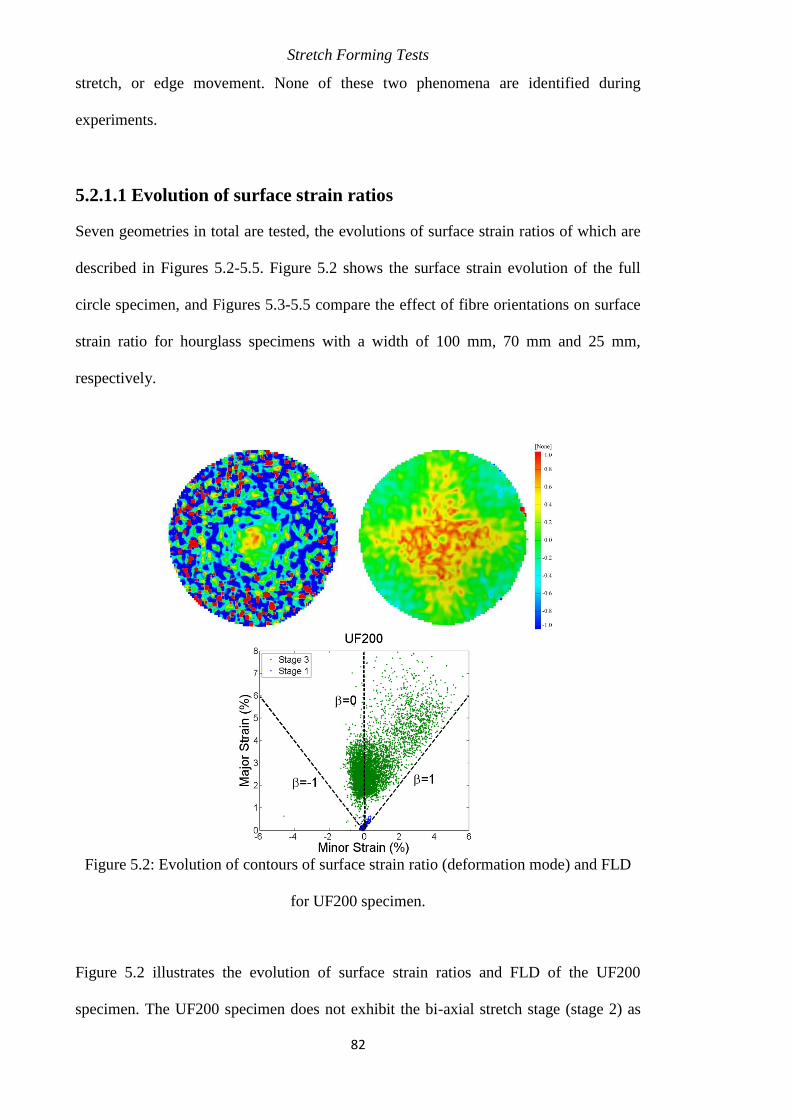
Stretch Forming Tests
82
stretch, or edge movement. None of these two phenomena are identified during
experiments.
5.2.1.1 Evolution of surface strain ratios
Seven geometries in total are tested, the evolutions of surface strain ratios of which are
described in Figures 5.2-5.5. Figure 5.2 shows the surface strain evolution of the full
circle specimen, and Figures 5.3-5.5 compare the effect of fibre orientations on surface
strain ratio for hourglass specimens with a width of 100 mm, 70 mm and 25 mm,
respectively.
Figure 5.2: Evolution of contours of surface strain ratio (deformation mode) and FLD
for UF200 specimen.
Figure 5.2 illustrates the evolution of surface strain ratios and FLD of the UF200
specimen. The UF200 specimen does not exhibit the bi-axial stretch stage (stage 2) as
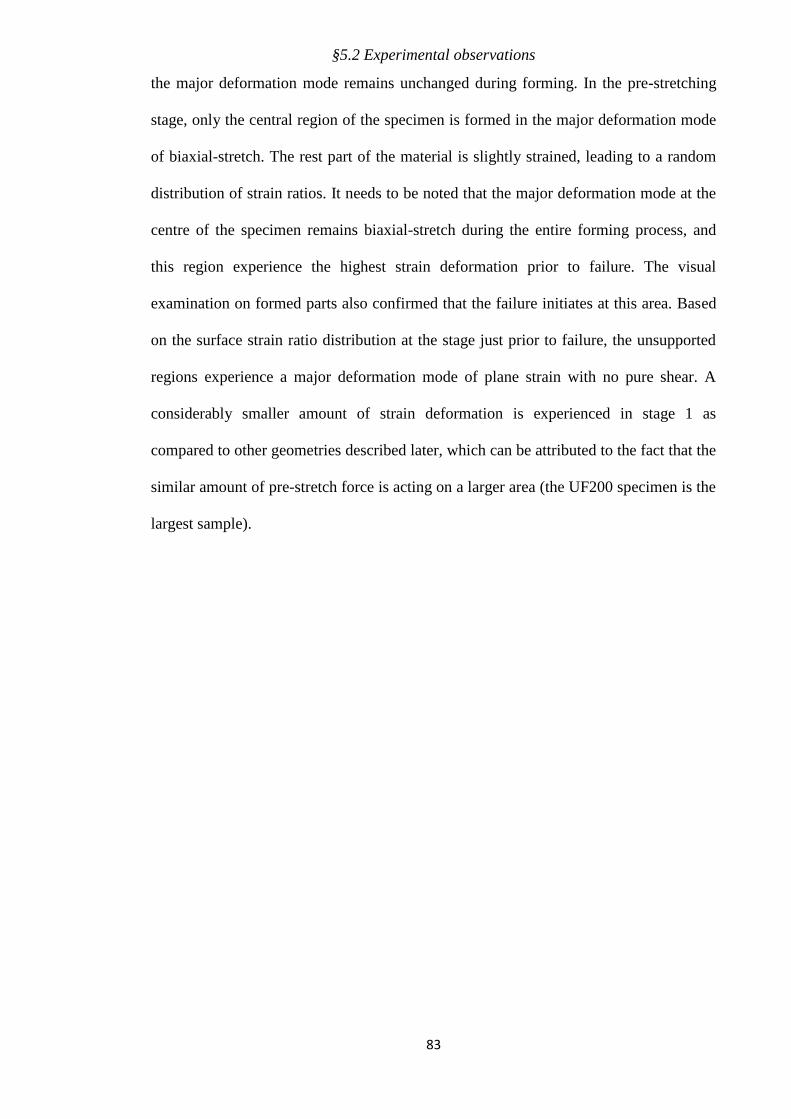
§5.2 Experimental observations
83
the major deformation mode remains unchanged during forming. In the pre-stretching
stage, only the central region of the specimen is formed in the major deformation mode
of biaxial-stretch. The rest part of the material is slightly strained, leading to a random
distribution of strain ratios. It needs to be noted that the major deformation mode at the
centre of the specimen remains biaxial-stretch during the entire forming process, and
this region experience the highest strain deformation prior to failure. The visual
examination on formed parts also confirmed that the failure initiates at this area. Based
on the surface strain ratio distribution at the stage just prior to failure, the unsupported
regions experience a major deformation mode of plane strain with no pure shear. A
considerably smaller amount of strain deformation is experienced in stage 1 as
compared to other geometries described later, which can be attributed to the fact that the
similar amount of pre-stretch force is acting on a larger area (the UF200 specimen is the
largest sample).
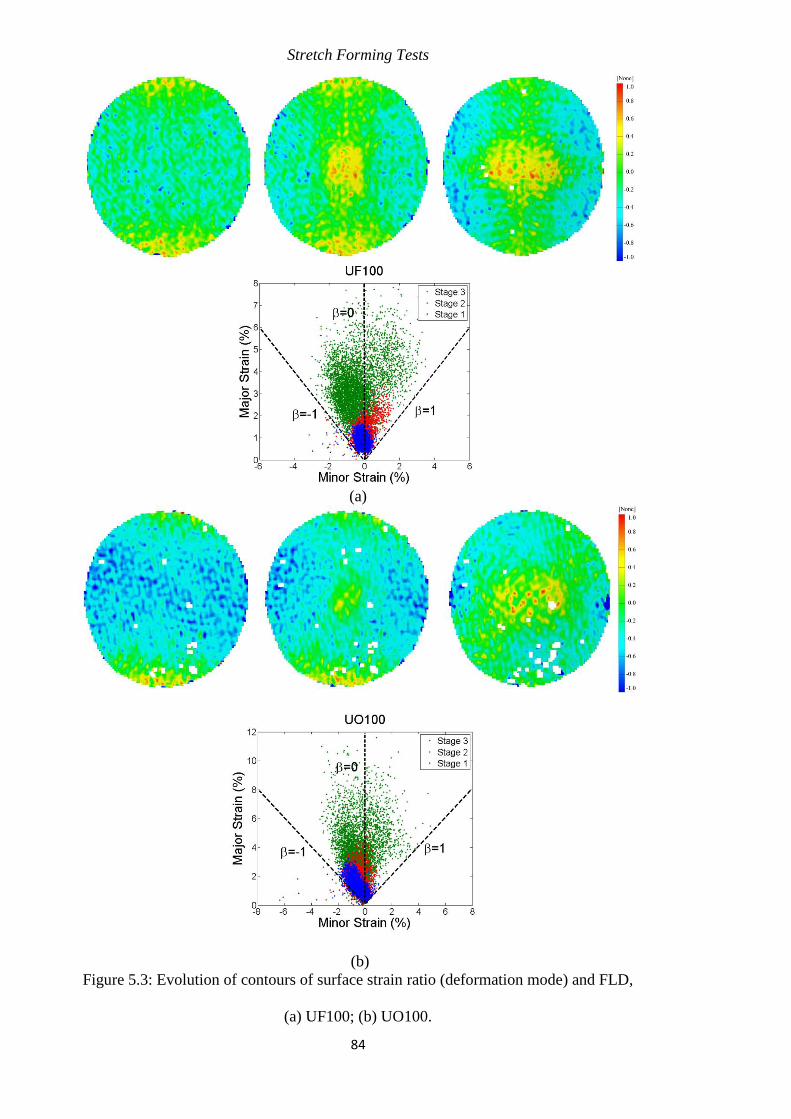
Stretch Forming Tests
84
(a)
(b)
Figure 5.3: Evolution of contours of surface strain ratio (deformation mode) and FLD,
(a) UF100; (b) UO100.
§5.2 Experimental observations
85
Figure 5.3 compares the surface strain evolutions of the UF100 and UO100 specimens.
It is clear to note that the hourglass samples with a width of 100 mm is able to withstand
a much larger strain deformation, from less than 8% to more than 10%, if the stretch
direction changes from 0˚/90˚ to 45˚/-45˚ to the fibre directions. This observation is also
obtained in other hourglass geometries, which can be attributed to the trellising
behaviour of woven composites. The flax fibres tend to rotate over each other under
trellising such that they are no longer perpendicular to each other. This leads to the
reduction on the amount of strain acting along the fibres, and therefore helps the
composite withstand a larger strain deformation. Although the 45˚/-45˚ specimens
experience a much larger strain deformation compared to the 0˚/90˚ equivalent
composite, the major deformation modes are similar to both samples. In the biaxial-
stretch stage, a clear trend of an almost equal increase in major strain and minor strain at
the pole is observed. It needs to be recognised that regions other than the pole
experience little change in strain deformation at this stage, indicating that the centre of
the specimen is deformed to a much greater extent than other areas. This observation is
clear and consistent for hourglass samples with a width of 100 mm and 70 mm.
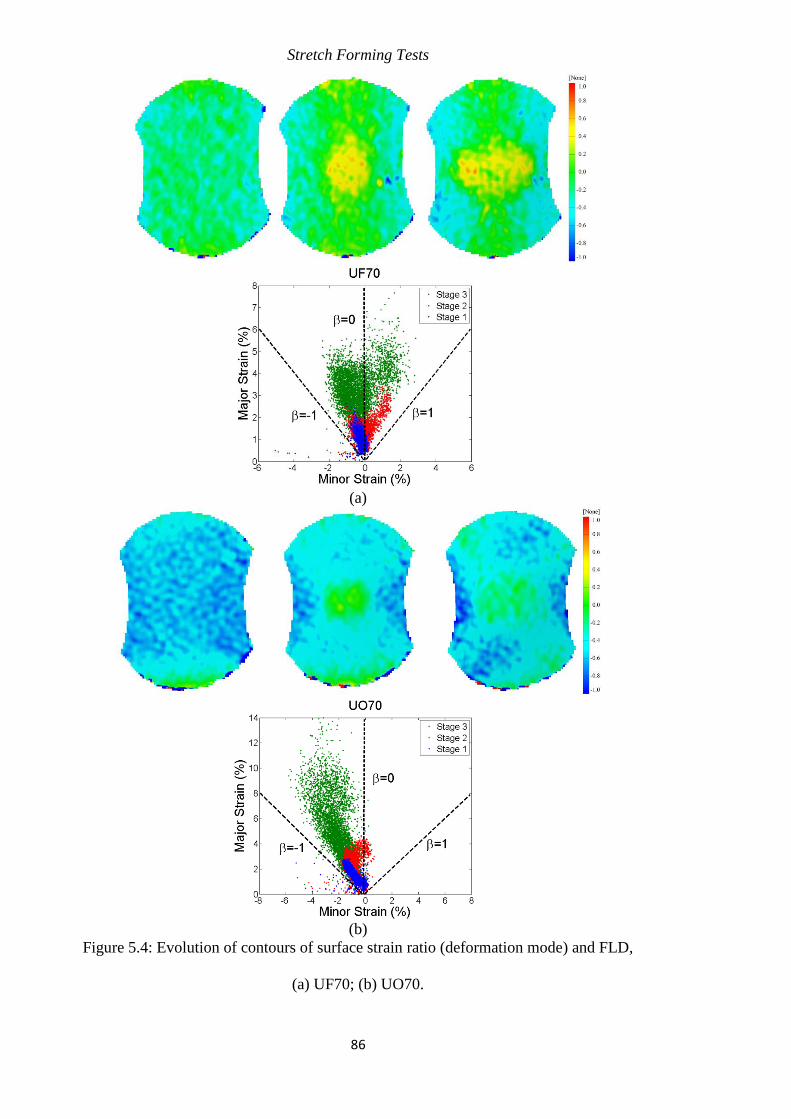
Stretch Forming Tests
86
(a)
(b)
Figure 5.4: Evolution of contours of surface strain ratio (deformation mode) and FLD,
(a) UF70; (b) UO70.
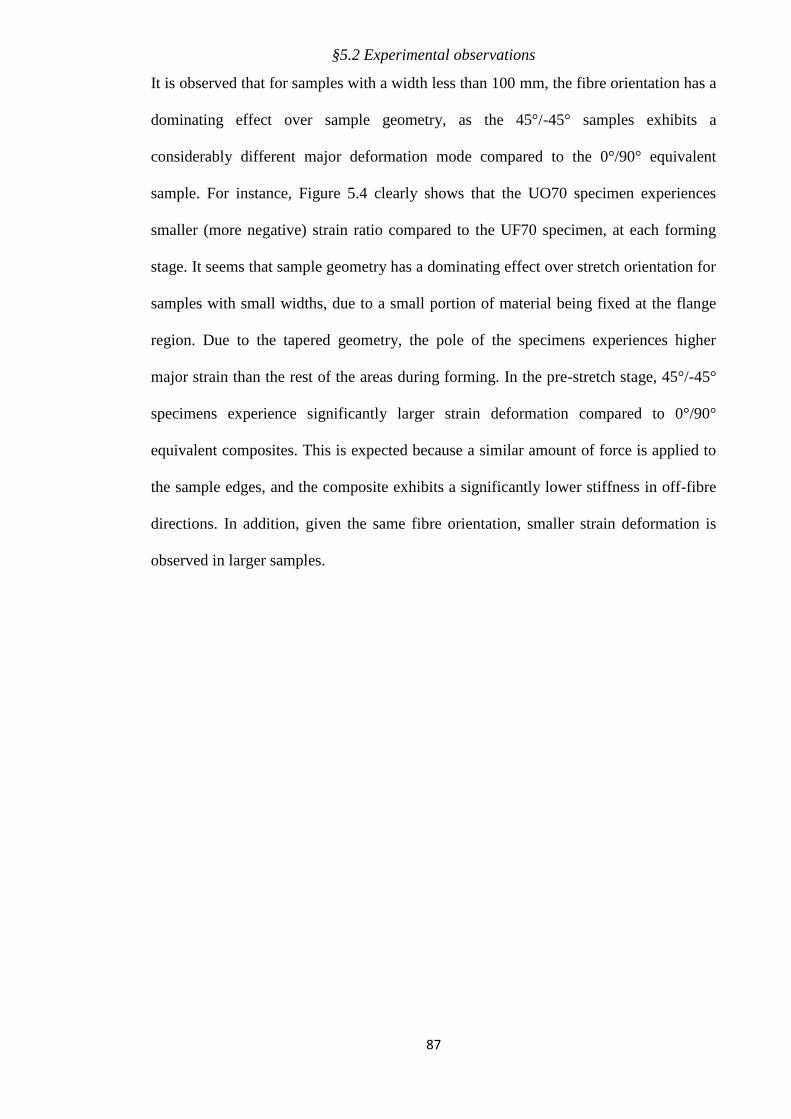
§5.2 Experimental observations
87
It is observed that for samples with a width less than 100 mm, the fibre orientation has a
dominating effect over sample geometry, as the 45°/-45° samples exhibits a
considerably different major deformation mode compared to the 0°/90° equivalent
sample. For instance, Figure 5.4 clearly shows that the UO70 specimen experiences
smaller (more negative) strain ratio compared to the UF70 specimen, at each forming
stage. It seems that sample geometry has a dominating effect over stretch orientation for
samples with small widths, due to a small portion of material being fixed at the flange
region. Due to the tapered geometry, the pole of the specimens experiences higher
major strain than the rest of the areas during forming. In the pre-stretch stage, 45°/-45°
specimens experience significantly larger strain deformation compared to 0°/90°
equivalent composites. This is expected because a similar amount of force is applied to
the sample edges, and the composite exhibits a significantly lower stiffness in off-fibre
directions. In addition, given the same fibre orientation, smaller strain deformation is
observed in larger samples.
Stretch Forming Tests
88
(a)
(b)
Figure 5.5: Evolution of contours of surface strain ratio (deformation mode) and FLD,
(a) UF25; (b) UO25.
§5.2 Experimental observations
89
It is important to notice that the NFC materials exhibit different major deformation
modes in 25 mm hourglass samples when the fibre orientation changes from 0˚/90˚ to
45˚/-45˚. The UF25 specimen experiences small deformation in the pre-stretch state,
followed by a noticeable amount of biaxial stretch in stage two, and finally fails in the
deformation mode close to uniaxial tension. It is observed that the UO25 sample could
withstand major strains higher than 20% just prior to failure, which is significantly
higher compared to the other samples, especially those formed with the 0°/90° fibre
orientation. This specimen also experiences very little variation of the FLD during the
bi-axial stretch behaviour. The restriction along the lateral direction vanishes quickly,
and as it does in the bi-axial stretch stage.
For 0˚/90˚ hourglass usually experiencing stretching in stretch forming tests, while the
dominating deformation mode of 45˚/-45˚ hourglass samples is shear, especially those
with smaller widths. The woven structure can help NFC samples exhibit pure shear
when off-fibre hourglass samples are formed in which the flax fibres rotate over each
other within the ply without being significantly stretched. This trellising behaviour
could help this class of material systems to exhibit a significant amount of strain
deformation prior to failure. 0˚/90˚ NFC samples, on the contrary, is dominated by
stretching during forming, leading to failure caused by fibre fracture at smaller forming
depths.
This section has shown that the experimental setup of the stretch forming tests
conducted in this work could help woven composite materials experience different
deformation mode during forming, and more importantly fail at different forming
modes. This is essential when validating the efficiency of failure criterion as an
effective one should be able to predict the failure initiated in different forming modes.
Stretch Forming Tests
90
5.2.1.2 Fibre strain calculations
For the NFC materials investigated in this study, the major failure mechanism is
identified as fibre fracture. This is a consistent observation obtained from both visual
observations and microscopic examinations of tested composite samples, and the details
of this are described in Section 6.2.1.1 and 6.2.2.1. One of the key contributions of the
current work is that it proposes an innovative failure criterion for woven composites
which are dominated by fibre fractures. This new failure criterion uses fibre strain as
the key parameter, and therefore requires tracking the evolution of the flax fibres
during forming, especially when composites trellis under shear deformation. This
section explains the kinematics used to track the evolution of fibre movements as well
as to calculate fibre strains, followed by the development of an algorithm used in the
ARAMIS system to compute fibre strains.
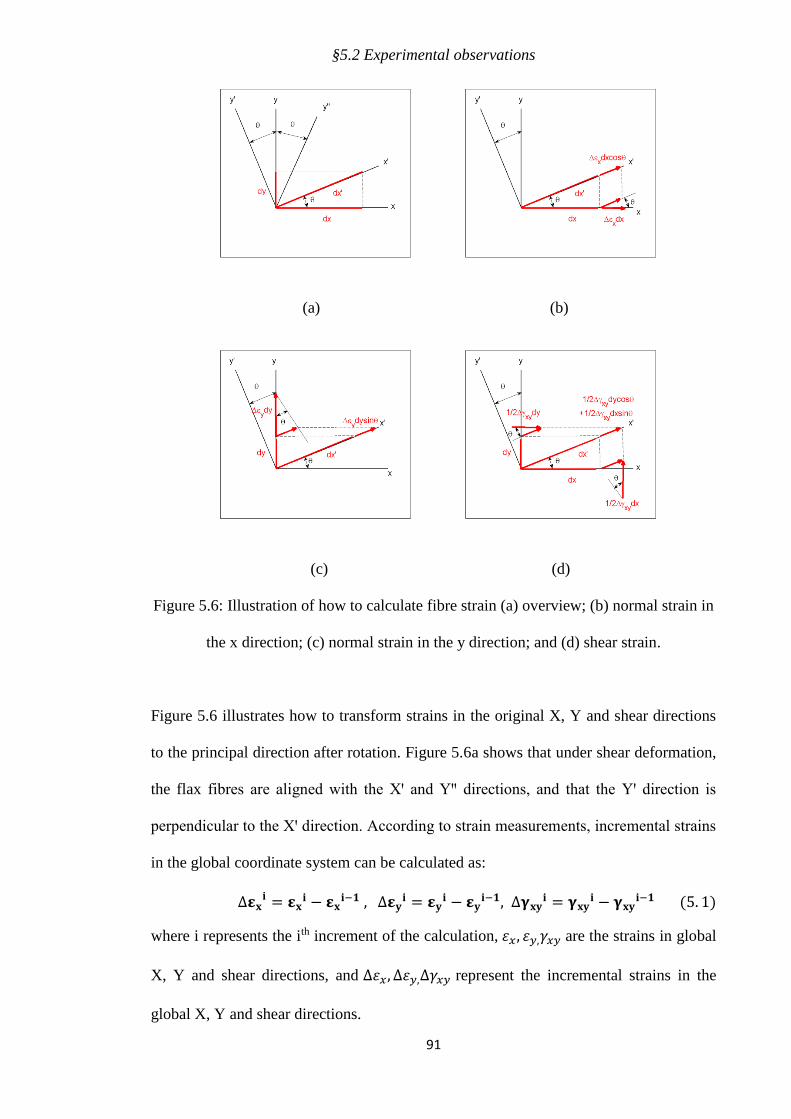
§5.2 Experimental observations
91
(a) (b)
(c) (d)
Figure 5.6: Illustration of how to calculate fibre strain (a) overview; (b) normal strain in
the x direction; (c) normal strain in the y direction; and (d) shear strain.
Figure 5.6 illustrates how to transform strains in the original X, Y and shear directions
to the principal direction after rotation. Figure 5.6a shows that under shear deformation,
the flax fibres are aligned with the Xꞌ and Yꞌꞌ directions, and that the Yꞌ direction is
perpendicular to the Xꞌ direction. According to strain measurements, incremental strains
in the global coordinate system can be calculated as:
∆𝛆𝐱𝐢 = 𝛆𝐱
𝐢 − 𝛆𝐱𝐢−𝟏 , ∆𝛆𝐲
𝐢 = 𝛆𝐲𝐢 − 𝛆𝐲
𝐢−𝟏, ∆𝛄𝐱𝐲𝐢 = 𝛄𝐱𝐲
𝐢 − 𝛄𝐱𝐲𝐢−𝟏 (5. 1)
where i represents the ith increment of the calculation, 휀𝑥, 휀𝑦,𝛾𝑥𝑦 are the strains in global
X, Y and shear directions, and ∆휀𝑥, ∆휀𝑦,∆𝛾𝑥𝑦 represent the incremental strains in the
global X, Y and shear directions.
Stretch Forming Tests
92
The elongation along the Xꞌ direction is computed first, and its components along the X
and Y directions can be calculated as:
𝒅𝒙′,𝒊 = 𝒅𝒙/ 𝐜𝐨𝐬 𝜽𝒊, 𝒅𝒙′,𝒊 = 𝒅𝒚/ 𝐬𝐢𝐧 𝜽𝒊 (5. 2)
where 𝑑𝑥, 𝑑𝑦, 𝑑𝑥′,𝑖 correspond to the elongations along the X, Y and Xꞌ directions,
respectively, and 𝜃𝑖 represents the angle of rotation.
The resultant incremental elongation along the Xꞌ direction is the sum of components
from the normal strain in the X direction, the normal strain in the Y direction and shear
strain (as described in Figures 5.6 b-d).
𝜹𝒙′,𝒊 = ∆𝜺𝒙𝒊𝒅𝒙𝐜𝐨𝐬 𝜽𝒊 + ∆𝜺𝒚
𝒊 𝒅𝒚𝐬𝐢𝐧 𝜽𝒊
+𝟏/𝟐 ∗ ∆𝜸𝒙𝒚𝒊∆𝜺𝒚
𝒊 𝐜𝐨𝐬 𝜽𝒊+𝟏/𝟐 ∗ ∆𝜸𝒙𝒚𝒊∆𝜺𝒙
𝒊 𝐬𝐢𝐧𝜽𝒊 (5. 3)
∆𝜺𝒙′,𝒊 = 𝜹𝜺𝒙
′,𝒊/𝒅𝒙′,𝒊 (5. 4)
∆ 𝜺𝒙′,𝒊 = ∆𝜺𝒙
𝒊 𝐜𝐨𝐬𝟐 𝜽𝒊 + ∆𝜺𝒚𝒊 𝐬𝐢𝐧𝟐 𝜽𝒊 + ∆𝜸𝒙𝒚
𝒊 𝐬𝐢𝐧 𝜽𝒊 𝐜𝐨𝐬 𝜽𝒊 (5. 5)
where 𝛿𝑥′,𝑖 is the resultant incremental elongation along the Xꞌ direction, and ∆ 휀𝑥′,𝑖
is
the incremental strain along the Xꞌ direction.
The incremental strain along the Xꞌ direction in Equation 5.5 can be simplified to the
expression shown in Equation 5.6 based on trigonometric identities.
∆ 𝜺𝒙′,𝒊 =
∆𝜺𝒙𝒊+∆𝜺𝒚
𝒊
𝟐+∆𝜺𝒙𝒊−∆𝜺𝒚
𝒊
𝟐𝐜𝐨𝐬 𝟐𝜽𝒊 +
∆𝜸𝒙𝒚𝒊
𝟐𝒔𝒊𝒏𝟐𝜽𝒊 (5. 6)
The incremental elongation and incremental strain along the Yꞌ direction can be
obtained by substituting (90+𝜃𝑖) for 𝜃𝑖 in Equations 5.3 and 5.6.
𝜹𝒚′,𝒊 = −∆𝜺𝒙𝒊𝒅𝒙𝒔𝒊𝒏𝜽𝒊 + ∆𝜺𝒚
𝒊 𝒅𝒚𝐜𝐨𝐬 𝜽𝒊
−𝟏/𝟐 ∗ ∆𝜸𝒙𝒚𝒊∆𝜺𝒚
𝒊 𝒔𝒊𝒏𝜽𝒊+𝟏/𝟐 ∗ ∆𝜸𝒙𝒚𝒊∆𝜺𝒙
𝒊 𝐜𝐨𝐬𝜽𝒊 (5. 7)
∆𝜺𝒚′,𝒊 =
∆𝜺𝒙𝒊+∆𝜺𝒚
𝒊
𝟐−∆𝜺𝒙𝒊−∆𝜺𝒚
𝒊
𝟐𝐜𝐨𝐬 𝟐𝜽𝒊 −
∆𝜸𝒙𝒚𝒊
𝟐𝒔𝒊𝒏𝟐𝜽𝒊 (5. 8)
§5.2 Experimental observations
93
where 𝛿𝑦′,𝑖 is the resultant incremental elongation along the Yꞌ direction, and ∆ 휀𝑦′,𝑖
is
the incremental strain along the Yꞌ direction.
The incremental angle of rotation is then calculated.
∆𝛄𝐱𝐲′,𝐢 = 𝛅𝐲′,𝐢/𝐝𝐱′,𝐢 + 𝛅𝐱′,𝐢/𝐝𝐲′,𝐢 (5. 9)
𝜹𝒚′,𝒊/𝒅𝒙′,𝒊 = (−∆𝜺𝒙𝒊 + ∆𝜺𝒚
𝒊) 𝐬𝐢𝐧 𝜽𝒊 𝐜𝐨𝐬 𝜽𝒊 − ∆𝜸𝒙𝒚𝒊 𝐬𝐢𝐧𝟐 𝜽𝒊 (5. 10)
𝜹𝒙′,𝒊/𝒅𝒚′,𝒊 = (−∆𝜺𝒙𝒊 +−∆𝜺𝒚
𝒊 ) 𝐬𝐢𝐧 𝜽𝒊 𝐜𝐨𝐬𝜽𝒊 + ∆𝜸𝒙𝒚𝒊 𝐜𝐨𝐬𝟐 𝜽𝒊 (5. 11)
∆𝛄𝐱𝐲′,𝐢 = −(∆𝛆𝐱
𝐢 − ∆𝛆𝐲𝐢)𝐬𝐢𝐧𝟐𝛉𝐢 + ∆𝛄𝐱𝐲
𝐢𝐜𝐨𝐬𝟐𝛉𝐢 (5. 12)
Where ∆𝛾𝑥𝑦′,𝑖 is the incremental angle of rotation.
Incremental strain along another fibre direction (the Y’’ direction) can be computed by
substituting (90-𝜃𝑖) for 𝜃𝑖 in Equation 5.8.
∆ 𝛆𝐲′′,𝐢 =
∆𝛆𝟏𝐢 +∆𝛆𝟐
𝐢
𝟐−∆𝛆𝟏𝐢 −∆𝛆𝟐
𝐢
𝟐𝐜𝐨𝐬 𝟐𝛉𝐢 +
∆𝛄𝟏𝟐𝐢
𝟐𝐬𝐢𝐧𝟐𝛉𝐢 (5.13)
Where ∆ 휀𝑦′′,𝑖
is the incremental strain along the Yꞌꞌ direction.
Fibre strains in both directions are then updated accordingly. The maximum of these
two strain values is used to represent fibre strain at this point when establishing the new
FLC.
𝛆𝐗𝐢 = 𝛆𝐗
𝐢−𝟏 + ∆𝛆𝐱′,𝐢
(5.14)
𝛆𝐘𝐢 = 𝛆𝐘
𝐢−𝟏 + ∆𝛆𝐲′′,𝐢
(5.15)
𝛆𝐟𝐢𝐛𝐫𝐞𝐢 = 𝐦𝐚𝐱𝐢𝐦𝐮𝐦(𝛆𝐗
𝐢, 𝛆𝐘𝐢) (5.16)
Where 휀𝑋𝑖 and 휀𝑌
𝑖 represent the strain along the fibre directions, and 휀𝑓𝑖𝑏𝑟𝑒𝑖 is the fibre
strain used in the new FLC.
At the end of each increment, the angle of rotation should also be updated and is given
by the following expression.
𝛉𝐢+𝟏 = 𝛉𝐢 + ∆𝛄𝐱𝐲′,𝐢 (5. 17)
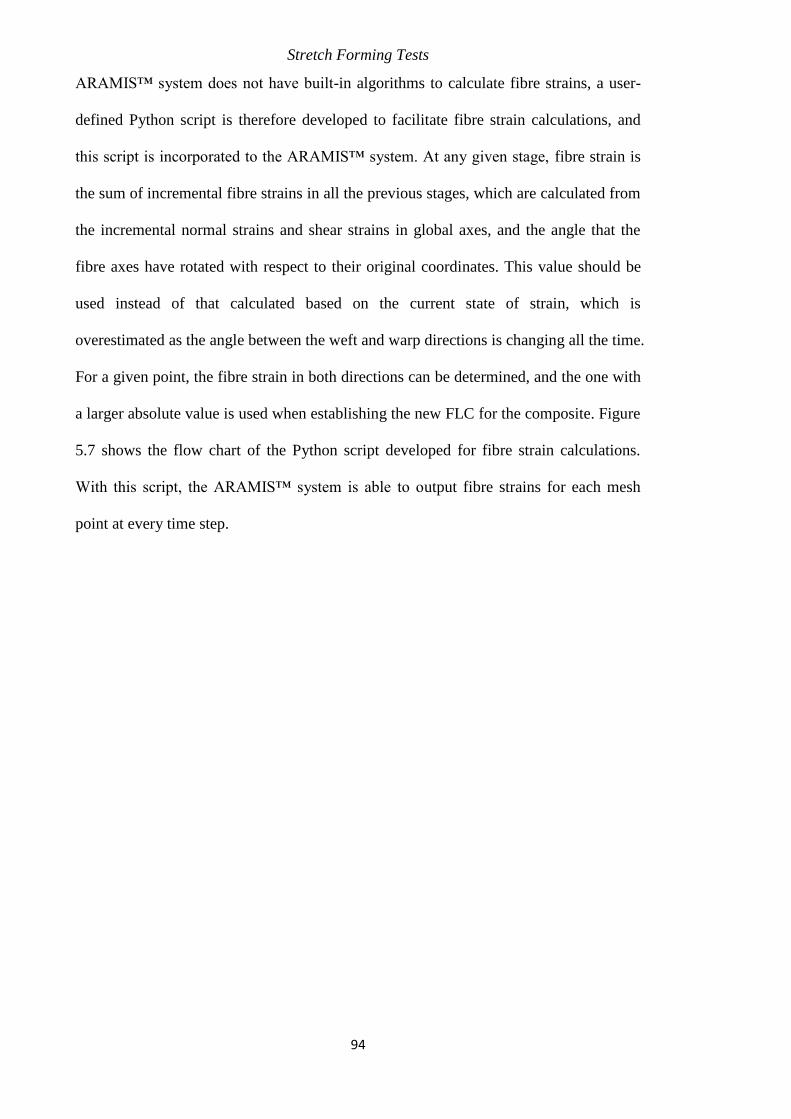
Stretch Forming Tests
94
ARAMIS™ system does not have built-in algorithms to calculate fibre strains, a user-
defined Python script is therefore developed to facilitate fibre strain calculations, and
this script is incorporated to the ARAMIS™ system. At any given stage, fibre strain is
the sum of incremental fibre strains in all the previous stages, which are calculated from
the incremental normal strains and shear strains in global axes, and the angle that the
fibre axes have rotated with respect to their original coordinates. This value should be
used instead of that calculated based on the current state of strain, which is
overestimated as the angle between the weft and warp directions is changing all the time.
For a given point, the fibre strain in both directions can be determined, and the one with
a larger absolute value is used when establishing the new FLC for the composite. Figure
5.7 shows the flow chart of the Python script developed for fibre strain calculations.
With this script, the ARAMIS™ system is able to output fibre strains for each mesh
point at every time step.
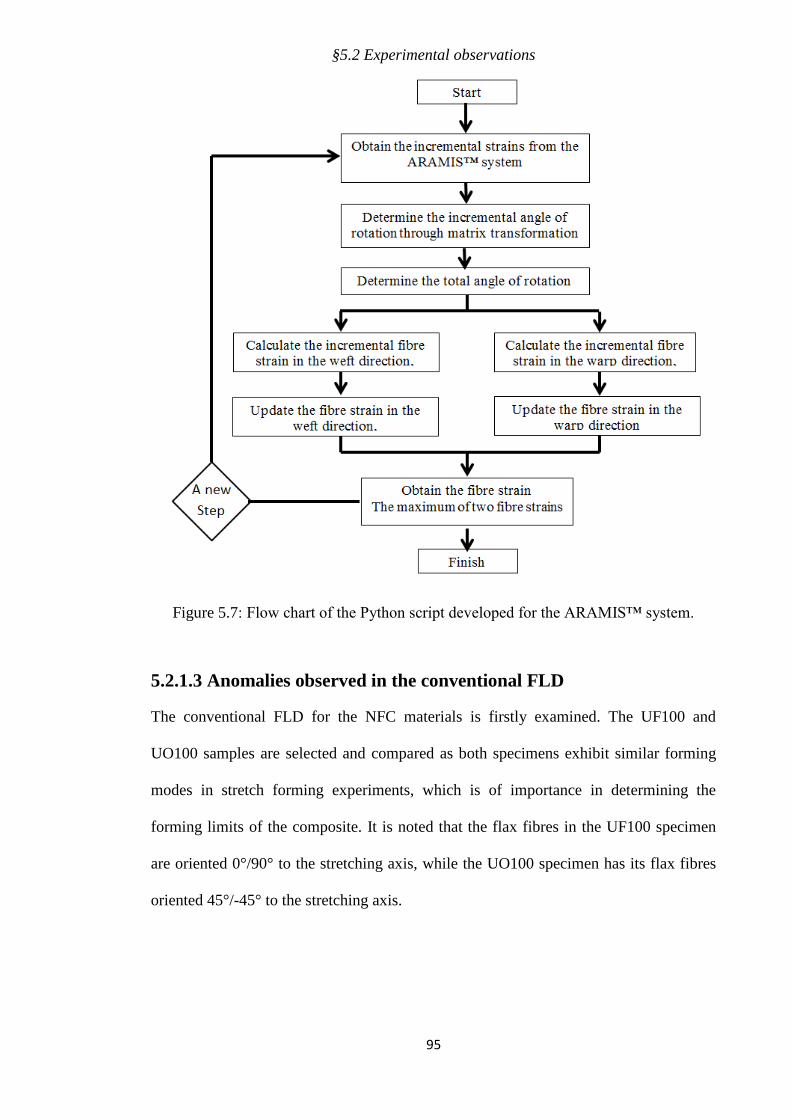
§5.2 Experimental observations
95
Figure 5.7: Flow chart of the Python script developed for the ARAMIS™ system.
5.2.1.3 Anomalies observed in the conventional FLD
The conventional FLD for the NFC materials is firstly examined. The UF100 and
UO100 samples are selected and compared as both specimens exhibit similar forming
modes in stretch forming experiments, which is of importance in determining the
forming limits of the composite. It is noted that the flax fibres in the UF100 specimen
are oriented 0°/90° to the stretching axis, while the UO100 specimen has its flax fibres
oriented 45°/-45° to the stretching axis.
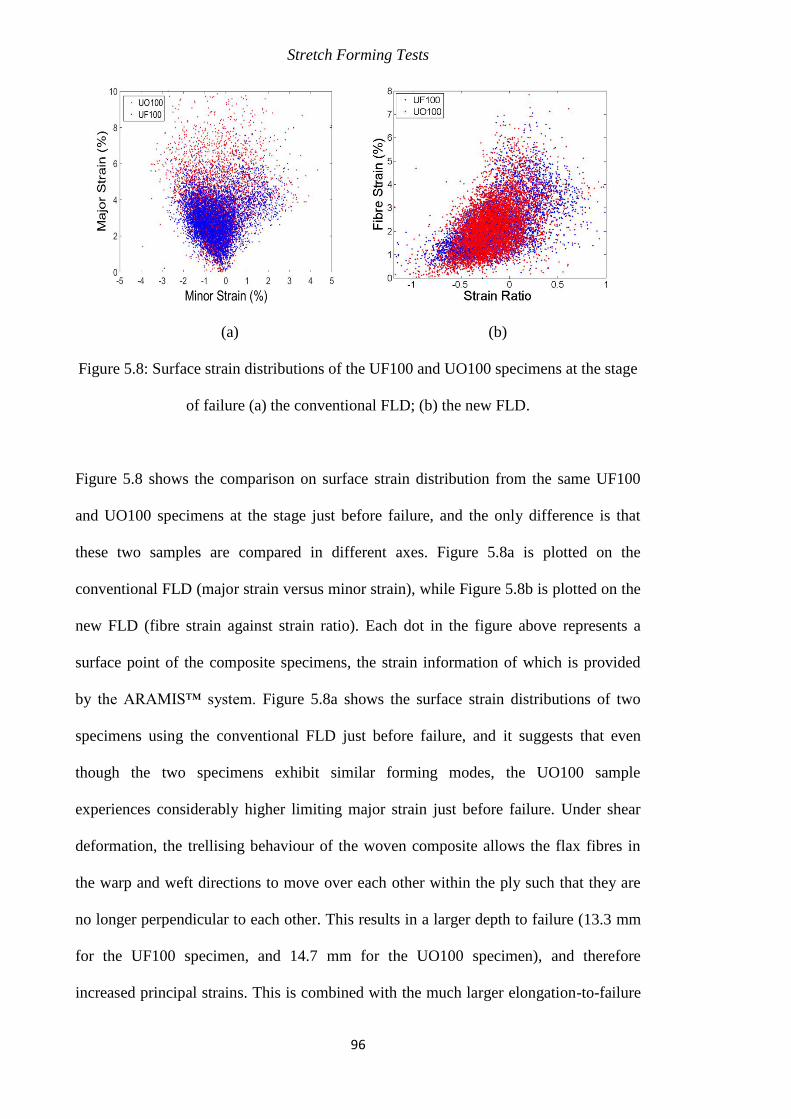
Stretch Forming Tests
96
(a) (b)
Figure 5.8: Surface strain distributions of the UF100 and UO100 specimens at the stage
of failure (a) the conventional FLD; (b) the new FLD.
Figure 5.8 shows the comparison on surface strain distribution from the same UF100
and UO100 specimens at the stage just before failure, and the only difference is that
these two samples are compared in different axes. Figure 5.8a is plotted on the
conventional FLD (major strain versus minor strain), while Figure 5.8b is plotted on the
new FLD (fibre strain against strain ratio). Each dot in the figure above represents a
surface point of the composite specimens, the strain information of which is provided
by the ARAMIS™ system. Figure 5.8a shows the surface strain distributions of two
specimens using the conventional FLD just before failure, and it suggests that even
though the two specimens exhibit similar forming modes, the UO100 sample
experiences considerably higher limiting major strain just before failure. Under shear
deformation, the trellising behaviour of the woven composite allows the flax fibres in
the warp and weft directions to move over each other within the ply such that they are
no longer perpendicular to each other. This results in a larger depth to failure (13.3 mm
for the UF100 specimen, and 14.7 mm for the UO100 specimen), and therefore
increased principal strains. This is combined with the much larger elongation-to-failure
§5.2 Experimental observations
97
of the polypropylene matrix compared to the flax fibres, as described in the previous
section. Based on the strain distributions, the limiting principal strain defined by one of
these two specimens is not applicable to the other. This observation would indicate that
the composite exhibits varying limiting principal strains at the same forming mode,
implying that the conventional FLC is not suitable for describing the failure behaviour
of this class of material system.
In metal forming, it is customary to discuss major strain and minor strain. In woven
composites, however, the strain acting on the fibres and the matrix should be considered
due to the difference in mechanical properties. The current work found that the flax
fibre reinforced polypropylene composite exhibits a major failure mechanism of fibre
fracture at room temperature. For the composite analysed in the current study, the flax
fibres are the limiting factors for elongation of the composite due to the significantly
lower elongation-to-failure of the flax fibres compared to that of the polypropylene
matrix. Figure 5.8b shows that on the plot of fibre strain against strain ratio, both
specimens exhibit a very similar distribution. Even though the UF100 and UO100
specimens are formed to different depths, the flax fibres are strained to a similar extent
at failure; the difference observed in principal strains is attributed to the strain acting on
the polypropylene matrix which contributes little to the composite failure. This further
highlights the possibility of establishing the new FLC for the natural fibre composite
using fibre strain and strain ratio. In the work conducted by Zanjani et al. [73], a self-
reinforced polypropylene composite exhibited a failure behaviour induced by both the
fibres and the matrix. The amount of strain acting on the matrix thus contributed to the
onset of failure in the composite, validating the application of conventional FLC to the
composite in this case.
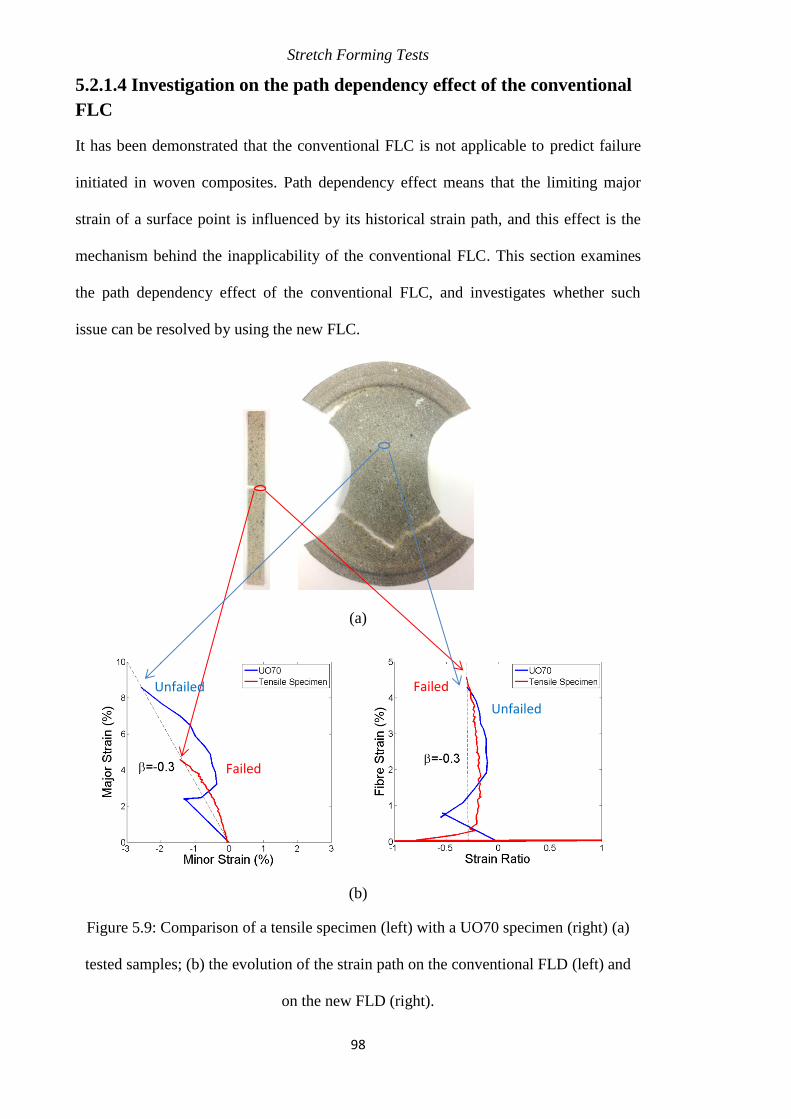
Stretch Forming Tests
98
5.2.1.4 Investigation on the path dependency effect of the conventional
FLC
It has been demonstrated that the conventional FLC is not applicable to predict failure
initiated in woven composites. Path dependency effect means that the limiting major
strain of a surface point is influenced by its historical strain path, and this effect is the
mechanism behind the inapplicability of the conventional FLC. This section examines
the path dependency effect of the conventional FLC, and investigates whether such
issue can be resolved by using the new FLC.
(a)
(b)
Figure 5.9: Comparison of a tensile specimen (left) with a UO70 specimen (right) (a)
tested samples; (b) the evolution of the strain path on the conventional FLD (left) and
on the new FLD (right).
Failed
Failed Unfailed
Unfailed
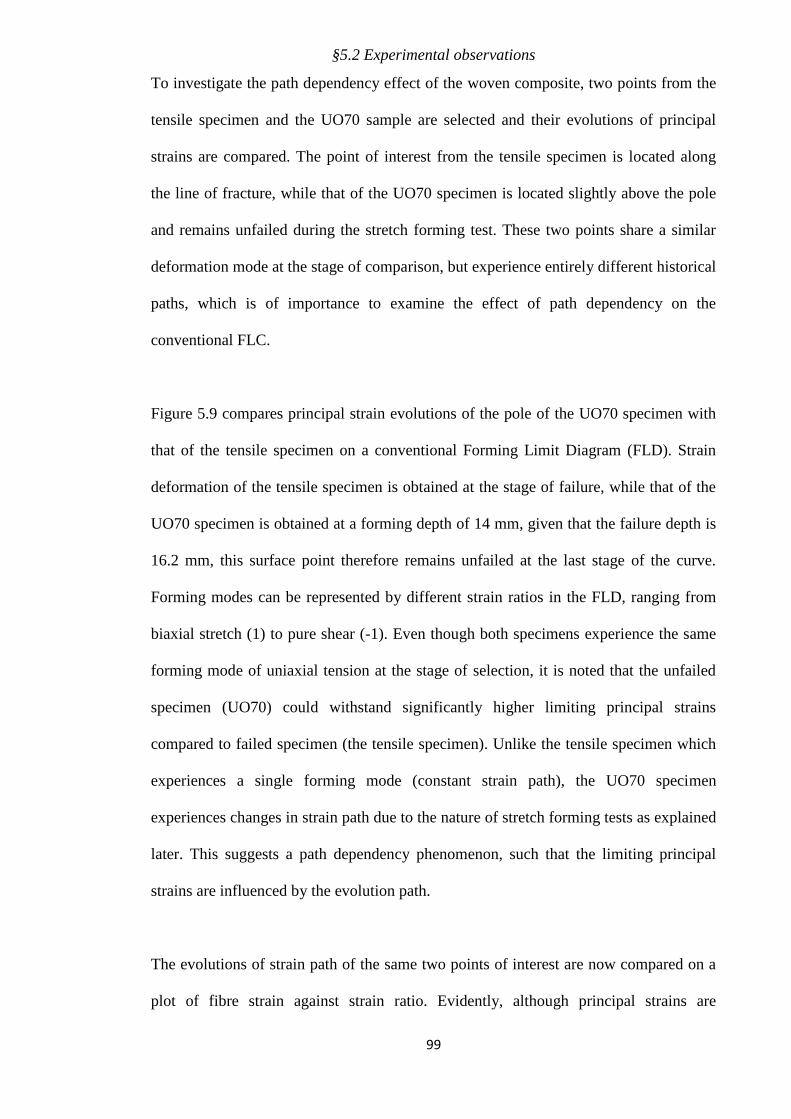
§5.2 Experimental observations
99
To investigate the path dependency effect of the woven composite, two points from the
tensile specimen and the UO70 sample are selected and their evolutions of principal
strains are compared. The point of interest from the tensile specimen is located along
the line of fracture, while that of the UO70 specimen is located slightly above the pole
and remains unfailed during the stretch forming test. These two points share a similar
deformation mode at the stage of comparison, but experience entirely different historical
paths, which is of importance to examine the effect of path dependency on the
conventional FLC.
Figure 5.9 compares principal strain evolutions of the pole of the UO70 specimen with
that of the tensile specimen on a conventional Forming Limit Diagram (FLD). Strain
deformation of the tensile specimen is obtained at the stage of failure, while that of the
UO70 specimen is obtained at a forming depth of 14 mm, given that the failure depth is
16.2 mm, this surface point therefore remains unfailed at the last stage of the curve.
Forming modes can be represented by different strain ratios in the FLD, ranging from
biaxial stretch (1) to pure shear (-1). Even though both specimens experience the same
forming mode of uniaxial tension at the stage of selection, it is noted that the unfailed
specimen (UO70) could withstand significantly higher limiting principal strains
compared to failed specimen (the tensile specimen). Unlike the tensile specimen which
experiences a single forming mode (constant strain path), the UO70 specimen
experiences changes in strain path due to the nature of stretch forming tests as explained
later. This suggests a path dependency phenomenon, such that the limiting principal
strains are influenced by the evolution path.
The evolutions of strain path of the same two points of interest are now compared on a
plot of fibre strain against strain ratio. Evidently, although principal strains are
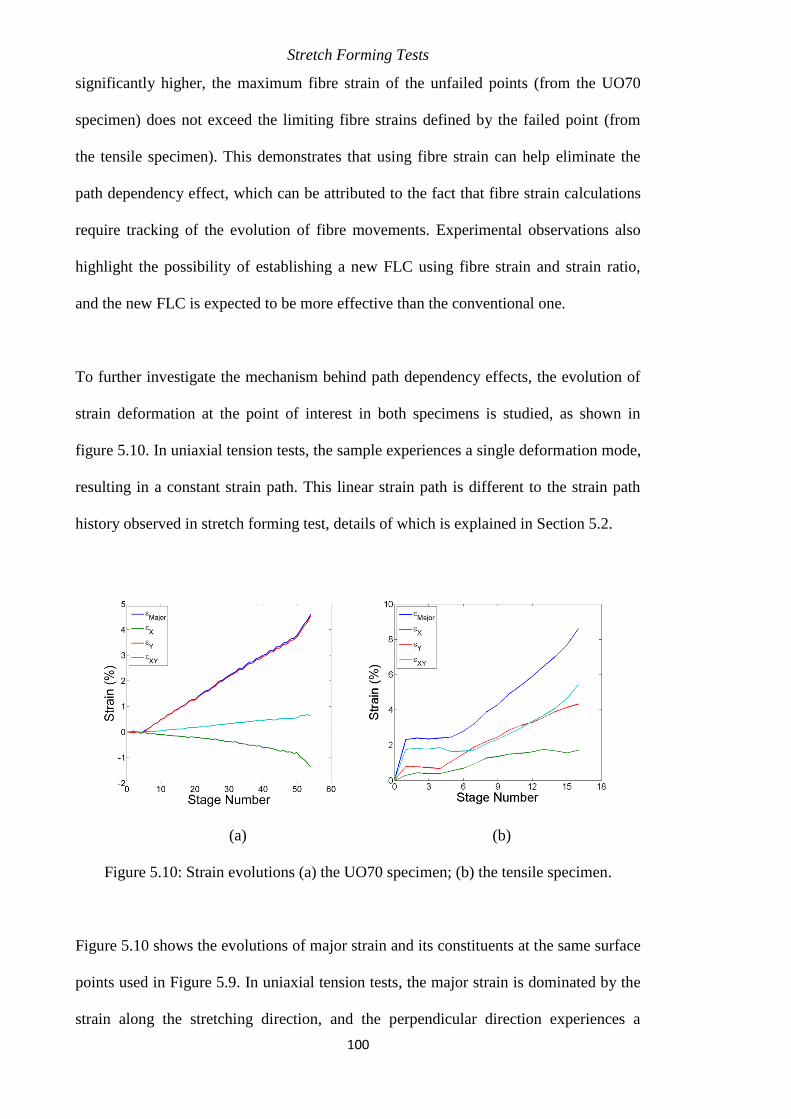
Stretch Forming Tests
100
significantly higher, the maximum fibre strain of the unfailed points (from the UO70
specimen) does not exceed the limiting fibre strains defined by the failed point (from
the tensile specimen). This demonstrates that using fibre strain can help eliminate the
path dependency effect, which can be attributed to the fact that fibre strain calculations
require tracking of the evolution of fibre movements. Experimental observations also
highlight the possibility of establishing a new FLC using fibre strain and strain ratio,
and the new FLC is expected to be more effective than the conventional one.
To further investigate the mechanism behind path dependency effects, the evolution of
strain deformation at the point of interest in both specimens is studied, as shown in
figure 5.10. In uniaxial tension tests, the sample experiences a single deformation mode,
resulting in a constant strain path. This linear strain path is different to the strain path
history observed in stretch forming test, details of which is explained in Section 5.2.
(a) (b)
Figure 5.10: Strain evolutions (a) the UO70 specimen; (b) the tensile specimen.
Figure 5.10 shows the evolutions of major strain and its constituents at the same surface
points used in Figure 5.9. In uniaxial tension tests, the major strain is dominated by the
strain along the stretching direction, and the perpendicular direction experiences a
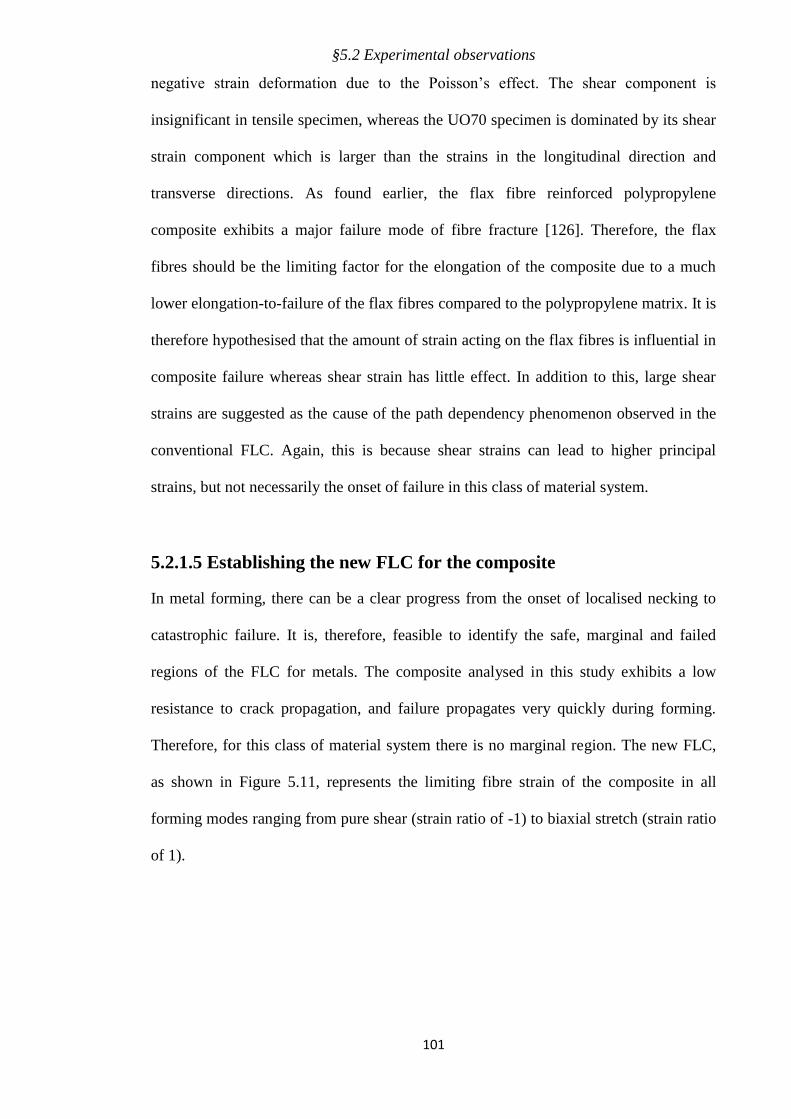
§5.2 Experimental observations
101
negative strain deformation due to the Poisson’s effect. The shear component is
insignificant in tensile specimen, whereas the UO70 specimen is dominated by its shear
strain component which is larger than the strains in the longitudinal direction and
transverse directions. As found earlier, the flax fibre reinforced polypropylene
composite exhibits a major failure mode of fibre fracture [126]. Therefore, the flax
fibres should be the limiting factor for the elongation of the composite due to a much
lower elongation-to-failure of the flax fibres compared to the polypropylene matrix. It is
therefore hypothesised that the amount of strain acting on the flax fibres is influential in
composite failure whereas shear strain has little effect. In addition to this, large shear
strains are suggested as the cause of the path dependency phenomenon observed in the
conventional FLC. Again, this is because shear strains can lead to higher principal
strains, but not necessarily the onset of failure in this class of material system.
5.2.1.5 Establishing the new FLC for the composite
In metal forming, there can be a clear progress from the onset of localised necking to
catastrophic failure. It is, therefore, feasible to identify the safe, marginal and failed
regions of the FLC for metals. The composite analysed in this study exhibits a low
resistance to crack propagation, and failure propagates very quickly during forming.
Therefore, for this class of material system there is no marginal region. The new FLC,
as shown in Figure 5.11, represents the limiting fibre strain of the composite in all
forming modes ranging from pure shear (strain ratio of -1) to biaxial stretch (strain ratio
of 1).
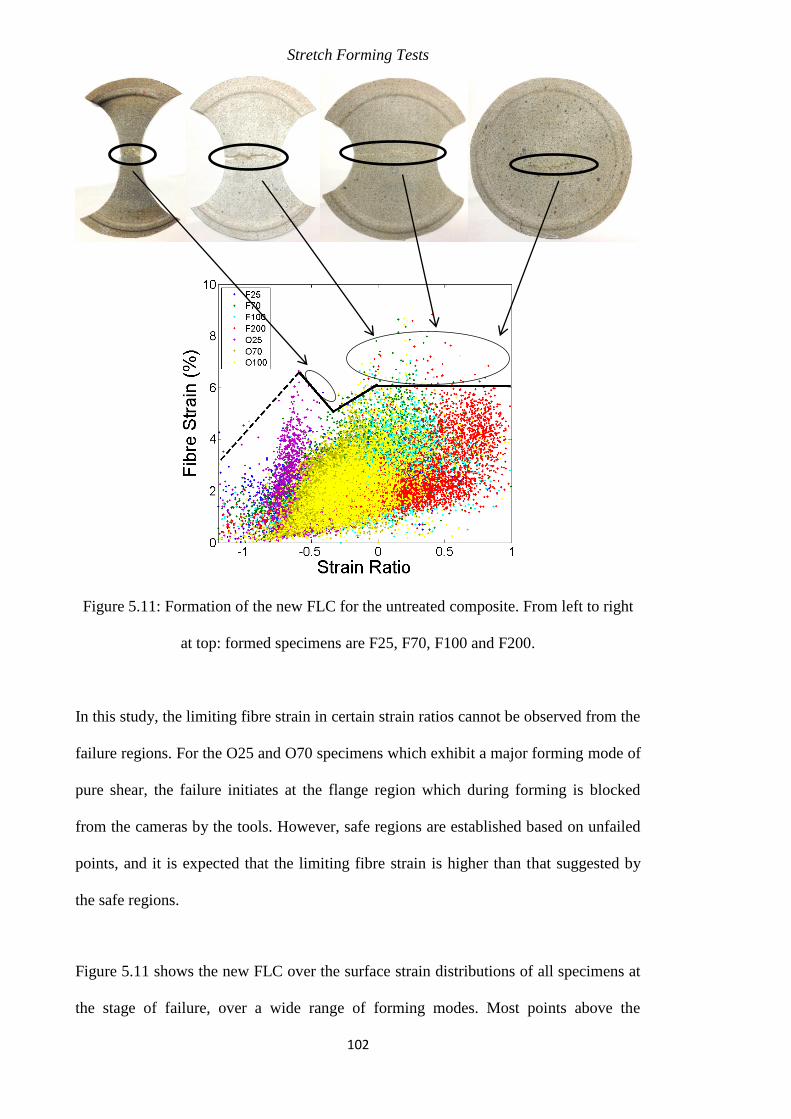
Stretch Forming Tests
102
Figure 5.11: Formation of the new FLC for the untreated composite. From left to right
at top: formed specimens are F25, F70, F100 and F200.
In this study, the limiting fibre strain in certain strain ratios cannot be observed from the
failure regions. For the O25 and O70 specimens which exhibit a major forming mode of
pure shear, the failure initiates at the flange region which during forming is blocked
from the cameras by the tools. However, safe regions are established based on unfailed
points, and it is expected that the limiting fibre strain is higher than that suggested by
the safe regions.
Figure 5.11 shows the new FLC over the surface strain distributions of all specimens at
the stage of failure, over a wide range of forming modes. Most points above the
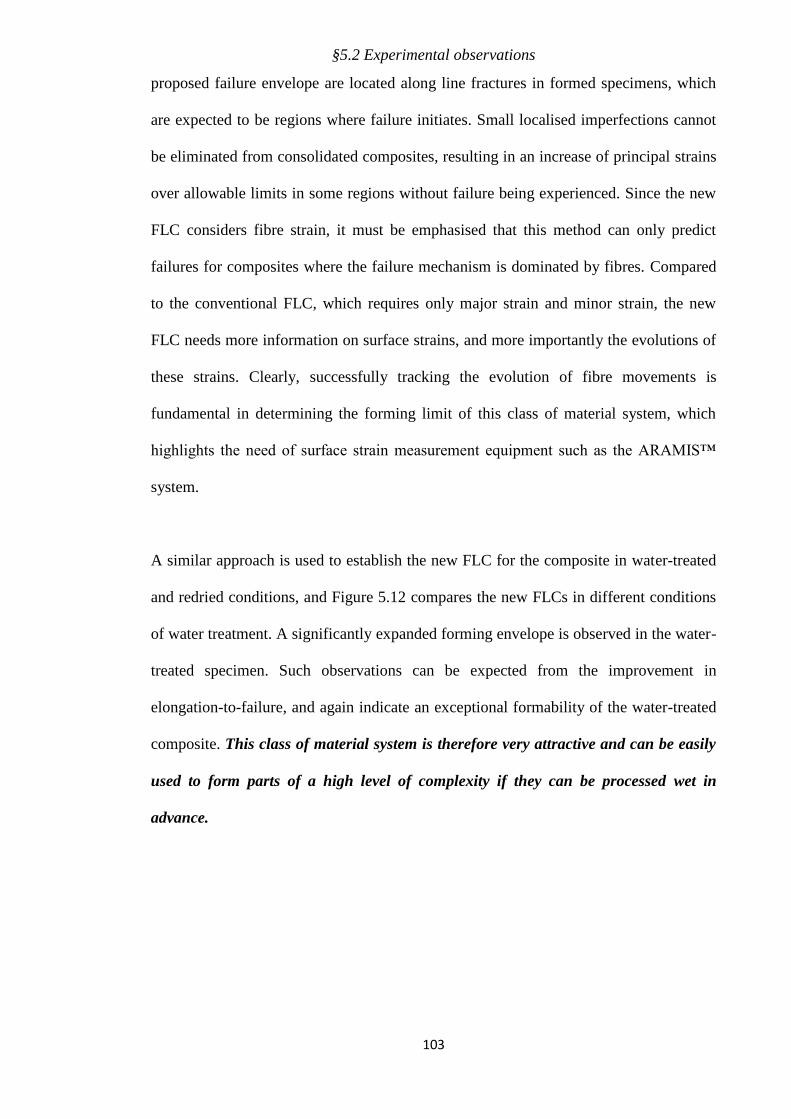
§5.2 Experimental observations
103
proposed failure envelope are located along line fractures in formed specimens, which
are expected to be regions where failure initiates. Small localised imperfections cannot
be eliminated from consolidated composites, resulting in an increase of principal strains
over allowable limits in some regions without failure being experienced. Since the new
FLC considers fibre strain, it must be emphasised that this method can only predict
failures for composites where the failure mechanism is dominated by fibres. Compared
to the conventional FLC, which requires only major strain and minor strain, the new
FLC needs more information on surface strains, and more importantly the evolutions of
these strains. Clearly, successfully tracking the evolution of fibre movements is
fundamental in determining the forming limit of this class of material system, which
highlights the need of surface strain measurement equipment such as the ARAMIS™
system.
A similar approach is used to establish the new FLC for the composite in water-treated
and redried conditions, and Figure 5.12 compares the new FLCs in different conditions
of water treatment. A significantly expanded forming envelope is observed in the water-
treated specimen. Such observations can be expected from the improvement in
elongation-to-failure, and again indicate an exceptional formability of the water-treated
composite. This class of material system is therefore very attractive and can be easily
used to form parts of a high level of complexity if they can be processed wet in
advance.
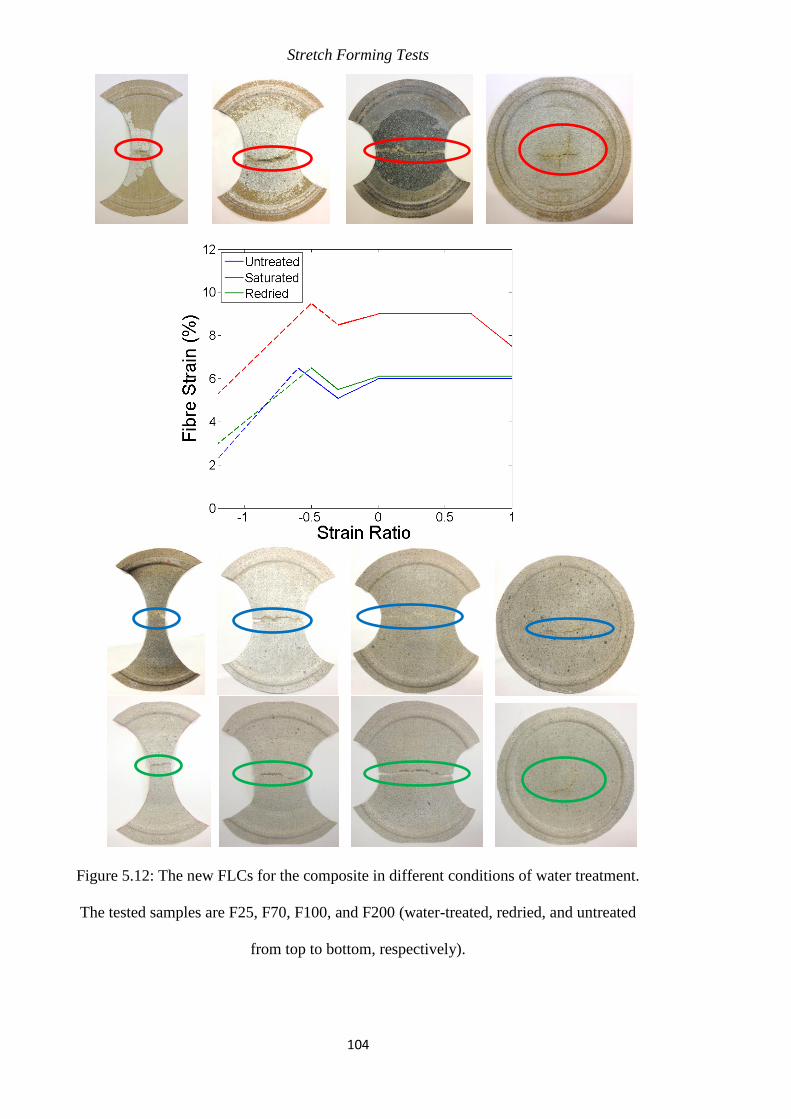
Stretch Forming Tests
104
Figure 5.12: The new FLCs for the composite in different conditions of water treatment.
The tested samples are F25, F70, F100, and F200 (water-treated, redried, and untreated
from top to bottom, respectively).
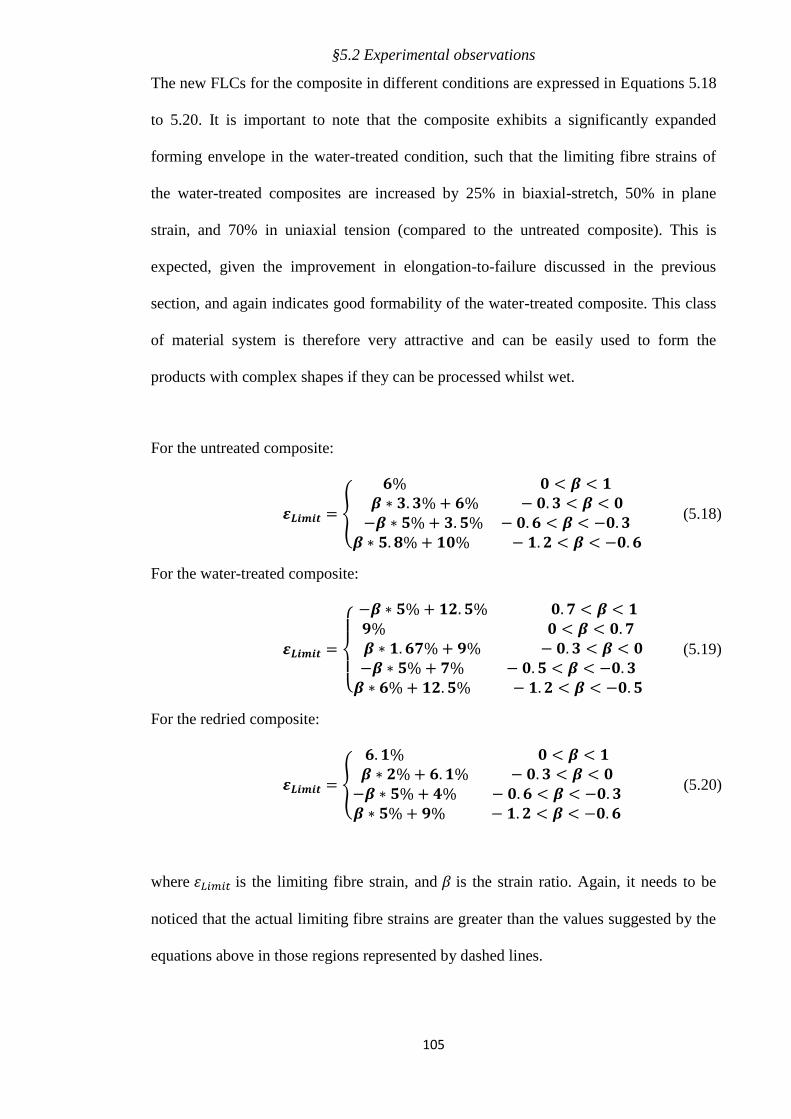
§5.2 Experimental observations
105
The new FLCs for the composite in different conditions are expressed in Equations 5.18
to 5.20. It is important to note that the composite exhibits a significantly expanded
forming envelope in the water-treated condition, such that the limiting fibre strains of
the water-treated composites are increased by 25% in biaxial-stretch, 50% in plane
strain, and 70% in uniaxial tension (compared to the untreated composite). This is
expected, given the improvement in elongation-to-failure discussed in the previous
section, and again indicates good formability of the water-treated composite. This class
of material system is therefore very attractive and can be easily used to form the
products with complex shapes if they can be processed whilst wet.
For the untreated composite:
𝜺𝑳𝒊𝒎𝒊𝒕 = {
𝟔% 𝟎 < 𝜷 < 𝟏𝜷 ∗ 𝟑. 𝟑% + 𝟔% − 𝟎. 𝟑 < 𝜷 < 𝟎−𝜷 ∗ 𝟓%+ 𝟑. 𝟓% − 𝟎. 𝟔 < 𝜷 < −𝟎. 𝟑
𝜷 ∗ 𝟓. 𝟖% + 𝟏𝟎% − 𝟏. 𝟐 < 𝜷 < −𝟎. 𝟔
(5.18)
For the water-treated composite:
𝜺𝑳𝒊𝒎𝒊𝒕 =
{
−𝜷 ∗ 𝟓%+ 𝟏𝟐. 𝟓% 𝟎. 𝟕 < 𝜷 < 𝟏𝟗% 𝟎 < 𝜷 < 𝟎. 𝟕 𝜷 ∗ 𝟏. 𝟔𝟕% + 𝟗% − 𝟎. 𝟑 < 𝜷 < 𝟎−𝜷 ∗ 𝟓%+ 𝟕% − 𝟎. 𝟓 < 𝜷 < −𝟎. 𝟑𝜷 ∗ 𝟔%+ 𝟏𝟐. 𝟓% − 𝟏. 𝟐 < 𝜷 < −𝟎. 𝟓
(5.19)
For the redried composite:
𝜺𝑳𝒊𝒎𝒊𝒕 = {
𝟔. 𝟏% 𝟎 < 𝜷 < 𝟏𝜷 ∗ 𝟐%+ 𝟔. 𝟏% − 𝟎. 𝟑 < 𝜷 < 𝟎−𝜷 ∗ 𝟓%+ 𝟒% − 𝟎. 𝟔 < 𝜷 < −𝟎. 𝟑𝜷 ∗ 𝟓%+ 𝟗% − 𝟏. 𝟐 < 𝜷 < −𝟎. 𝟔
(5.20)
where 휀𝐿𝑖𝑚𝑖𝑡 is the limiting fibre strain, and 𝛽 is the strain ratio. Again, it needs to be
noticed that the actual limiting fibre strains are greater than the values suggested by the
equations above in those regions represented by dashed lines.
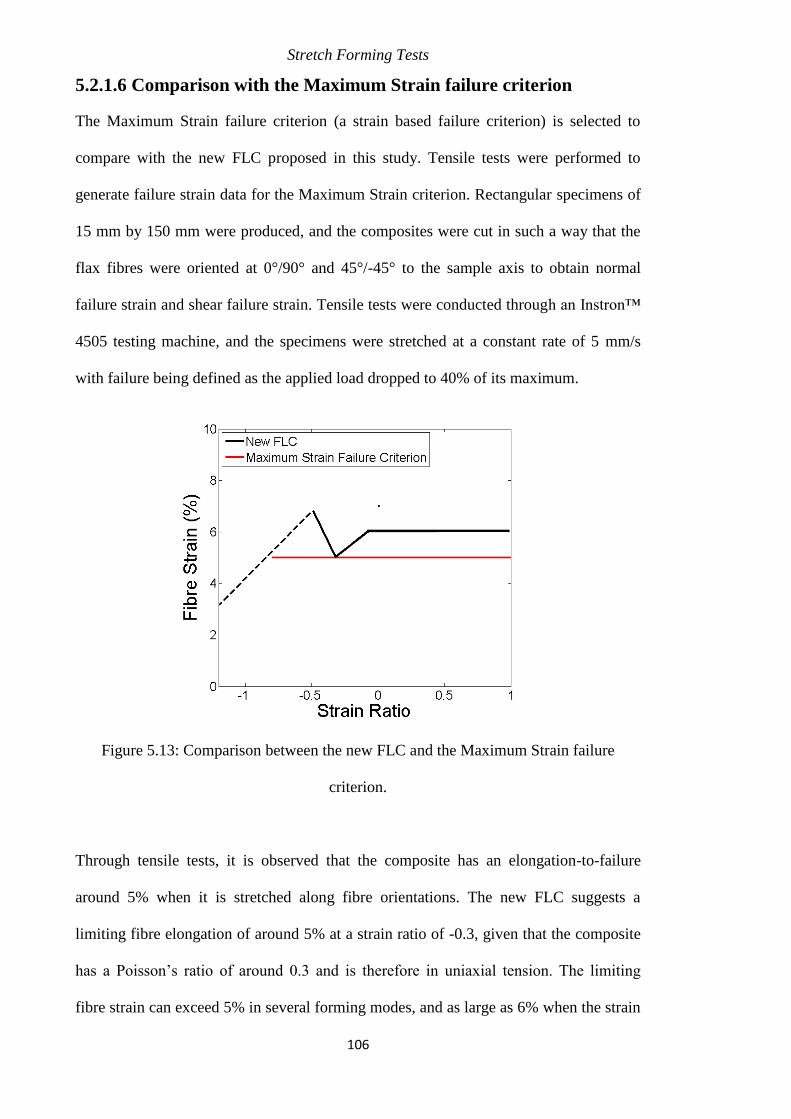
Stretch Forming Tests
106
5.2.1.6 Comparison with the Maximum Strain failure criterion
The Maximum Strain failure criterion (a strain based failure criterion) is selected to
compare with the new FLC proposed in this study. Tensile tests were performed to
generate failure strain data for the Maximum Strain criterion. Rectangular specimens of
15 mm by 150 mm were produced, and the composites were cut in such a way that the
flax fibres were oriented at 0°/90° and 45°/-45° to the sample axis to obtain normal
failure strain and shear failure strain. Tensile tests were conducted through an Instron™
4505 testing machine, and the specimens were stretched at a constant rate of 5 mm/s
with failure being defined as the applied load dropped to 40% of its maximum.
Figure 5.13: Comparison between the new FLC and the Maximum Strain failure
criterion.
Through tensile tests, it is observed that the composite has an elongation-to-failure
around 5% when it is stretched along fibre orientations. The new FLC suggests a
limiting fibre elongation of around 5% at a strain ratio of -0.3, given that the composite
has a Poisson’s ratio of around 0.3 and is therefore in uniaxial tension. The limiting
fibre strain can exceed 5% in several forming modes, and as large as 6% when the strain
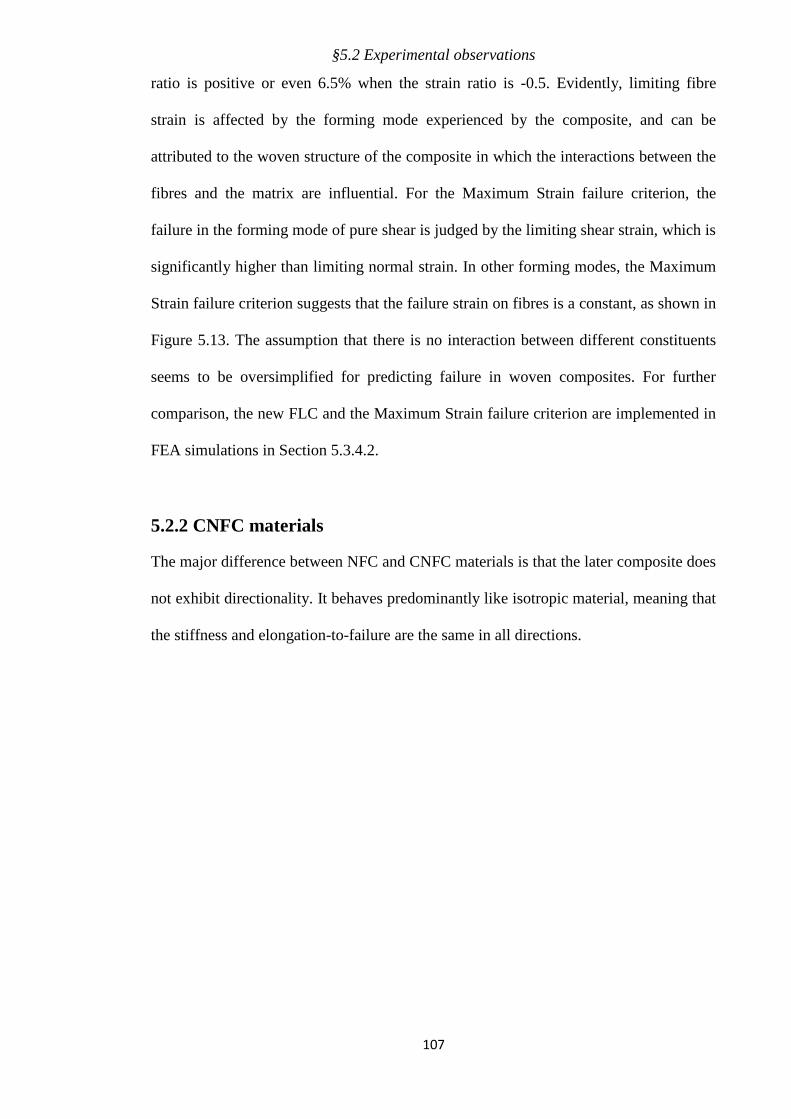
§5.2 Experimental observations
107
ratio is positive or even 6.5% when the strain ratio is -0.5. Evidently, limiting fibre
strain is affected by the forming mode experienced by the composite, and can be
attributed to the woven structure of the composite in which the interactions between the
fibres and the matrix are influential. For the Maximum Strain failure criterion, the
failure in the forming mode of pure shear is judged by the limiting shear strain, which is
significantly higher than limiting normal strain. In other forming modes, the Maximum
Strain failure criterion suggests that the failure strain on fibres is a constant, as shown in
Figure 5.13. The assumption that there is no interaction between different constituents
seems to be oversimplified for predicting failure in woven composites. For further
comparison, the new FLC and the Maximum Strain failure criterion are implemented in
FEA simulations in Section 5.3.4.2.
5.2.2 CNFC materials
The major difference between NFC and CNFC materials is that the later composite does
not exhibit directionality. It behaves predominantly like isotropic material, meaning that
the stiffness and elongation-to-failure are the same in all directions.
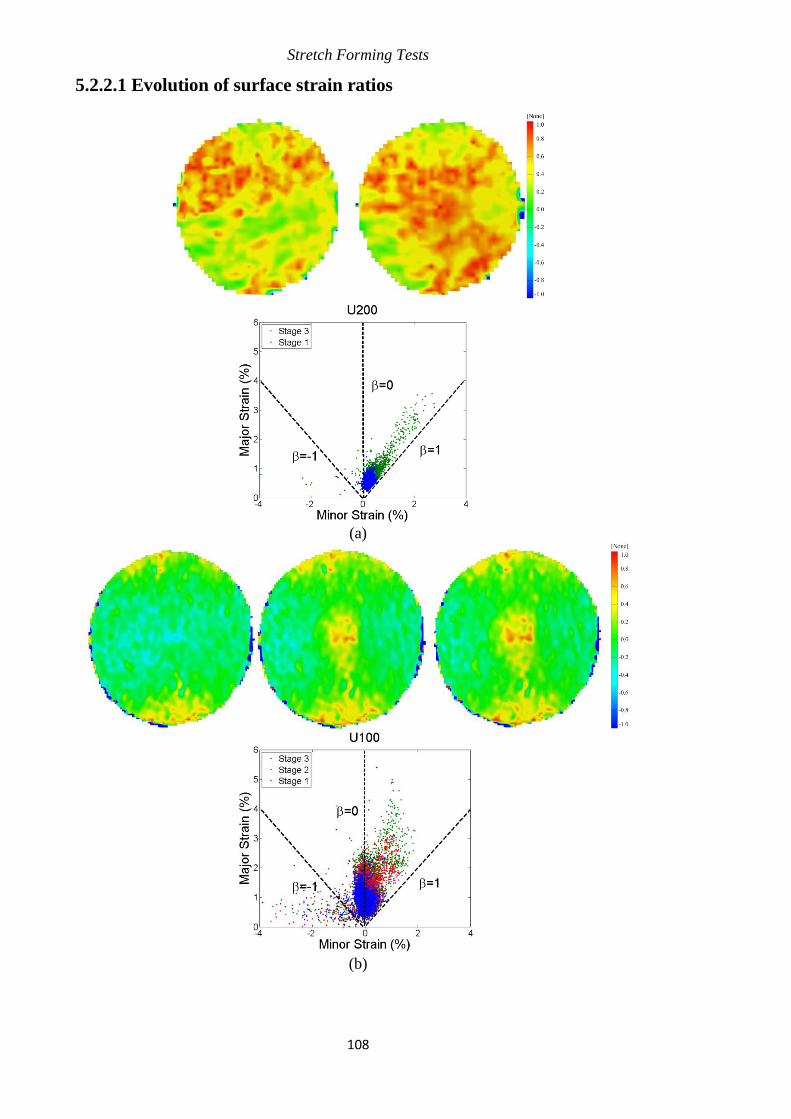
Stretch Forming Tests
108
5.2.2.1 Evolution of surface strain ratios
(a)
(b)
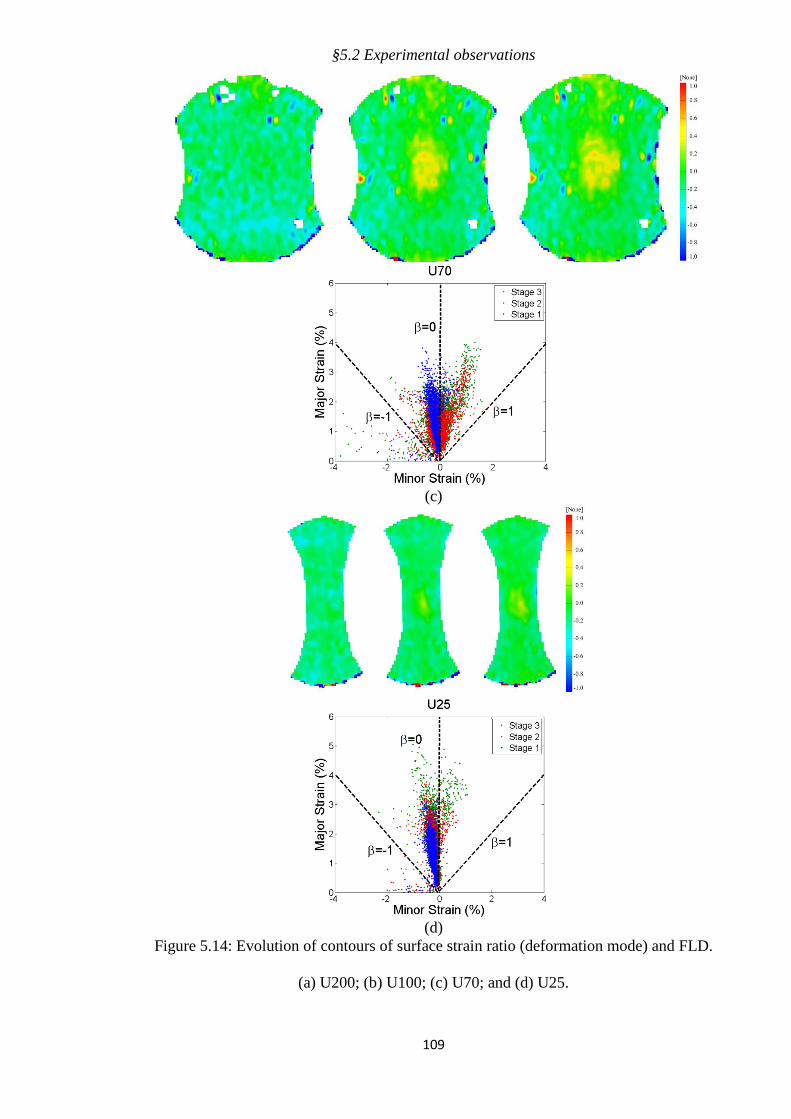
§5.2 Experimental observations
109
(c)
(d)
Figure 5.14: Evolution of contours of surface strain ratio (deformation mode) and FLD.
(a) U200; (b) U100; (c) U70; and (d) U25.
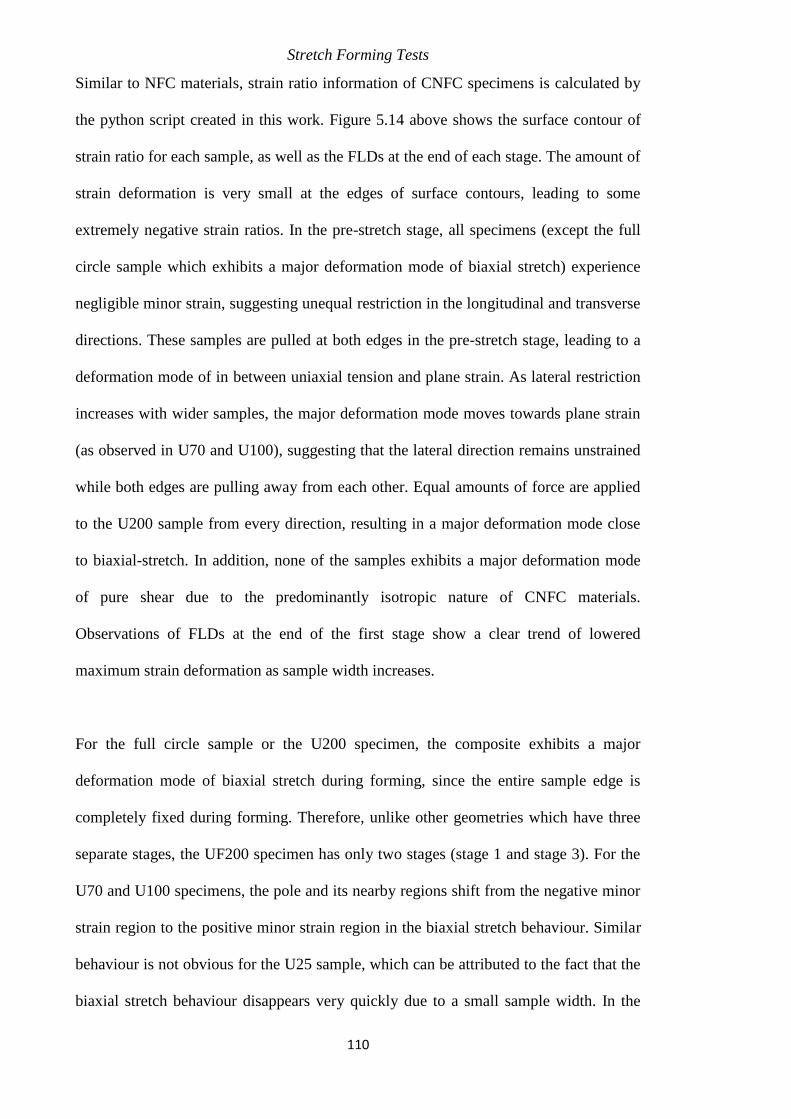
Stretch Forming Tests
110
Similar to NFC materials, strain ratio information of CNFC specimens is calculated by
the python script created in this work. Figure 5.14 above shows the surface contour of
strain ratio for each sample, as well as the FLDs at the end of each stage. The amount of
strain deformation is very small at the edges of surface contours, leading to some
extremely negative strain ratios. In the pre-stretch stage, all specimens (except the full
circle sample which exhibits a major deformation mode of biaxial stretch) experience
negligible minor strain, suggesting unequal restriction in the longitudinal and transverse
directions. These samples are pulled at both edges in the pre-stretch stage, leading to a
deformation mode of in between uniaxial tension and plane strain. As lateral restriction
increases with wider samples, the major deformation mode moves towards plane strain
(as observed in U70 and U100), suggesting that the lateral direction remains unstrained
while both edges are pulling away from each other. Equal amounts of force are applied
to the U200 sample from every direction, resulting in a major deformation mode close
to biaxial-stretch. In addition, none of the samples exhibits a major deformation mode
of pure shear due to the predominantly isotropic nature of CNFC materials.
Observations of FLDs at the end of the first stage show a clear trend of lowered
maximum strain deformation as sample width increases.
For the full circle sample or the U200 specimen, the composite exhibits a major
deformation mode of biaxial stretch during forming, since the entire sample edge is
completely fixed during forming. Therefore, unlike other geometries which have three
separate stages, the UF200 specimen has only two stages (stage 1 and stage 3). For the
U70 and U100 specimens, the pole and its nearby regions shift from the negative minor
strain region to the positive minor strain region in the biaxial stretch behaviour. Similar
behaviour is not obvious for the U25 sample, which can be attributed to the fact that the
biaxial stretch behaviour disappears very quickly due to a small sample width. In the
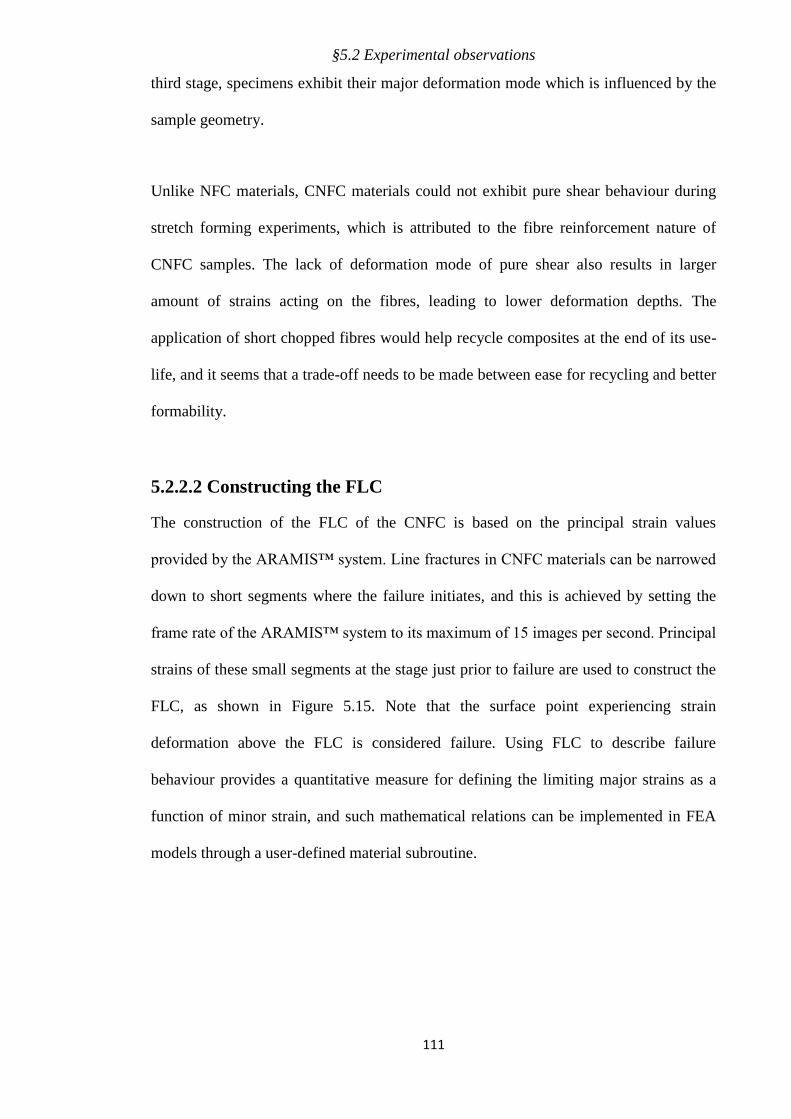
§5.2 Experimental observations
111
third stage, specimens exhibit their major deformation mode which is influenced by the
sample geometry.
Unlike NFC materials, CNFC materials could not exhibit pure shear behaviour during
stretch forming experiments, which is attributed to the fibre reinforcement nature of
CNFC samples. The lack of deformation mode of pure shear also results in larger
amount of strains acting on the fibres, leading to lower deformation depths. The
application of short chopped fibres would help recycle composites at the end of its use-
life, and it seems that a trade-off needs to be made between ease for recycling and better
formability.
5.2.2.2 Constructing the FLC
The construction of the FLC of the CNFC is based on the principal strain values
provided by the ARAMIS™ system. Line fractures in CNFC materials can be narrowed
down to short segments where the failure initiates, and this is achieved by setting the
frame rate of the ARAMIS™ system to its maximum of 15 images per second. Principal
strains of these small segments at the stage just prior to failure are used to construct the
FLC, as shown in Figure 5.15. Note that the surface point experiencing strain
deformation above the FLC is considered failure. Using FLC to describe failure
behaviour provides a quantitative measure for defining the limiting major strains as a
function of minor strain, and such mathematical relations can be implemented in FEA
models through a user-defined material subroutine.
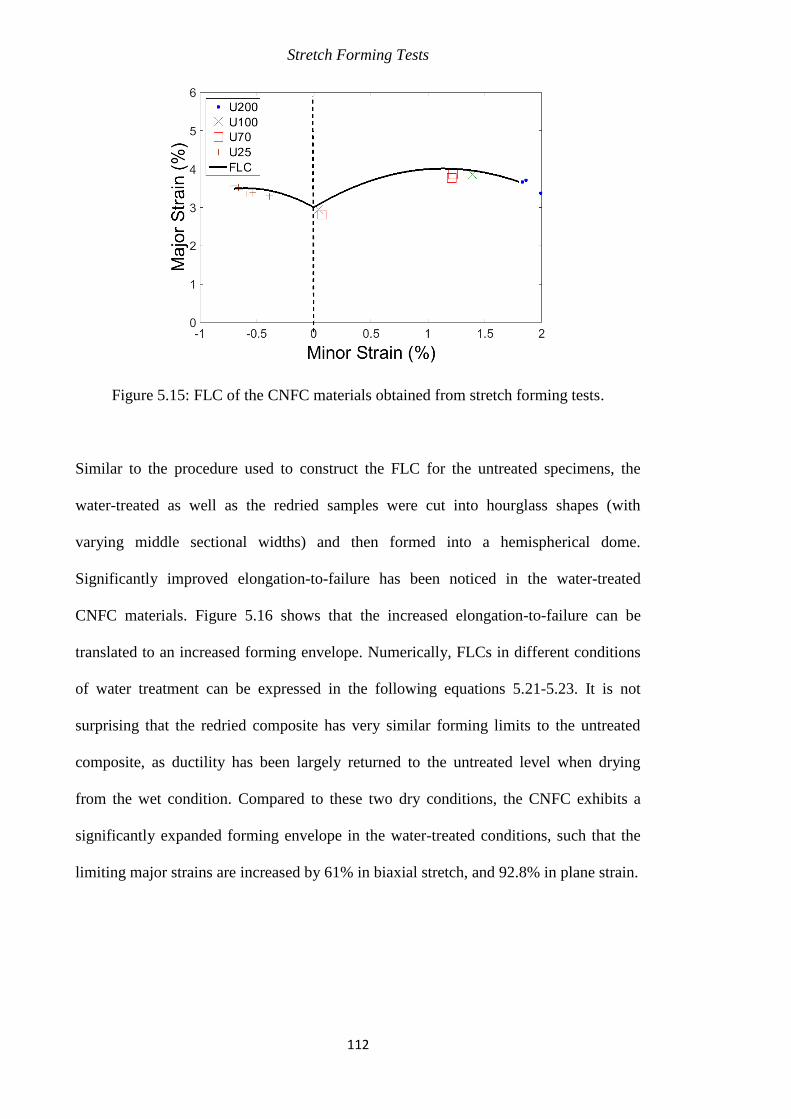
Stretch Forming Tests
112
Figure 5.15: FLC of the CNFC materials obtained from stretch forming tests.
Similar to the procedure used to construct the FLC for the untreated specimens, the
water-treated as well as the redried samples were cut into hourglass shapes (with
varying middle sectional widths) and then formed into a hemispherical dome.
Significantly improved elongation-to-failure has been noticed in the water-treated
CNFC materials. Figure 5.16 shows that the increased elongation-to-failure can be
translated to an increased forming envelope. Numerically, FLCs in different conditions
of water treatment can be expressed in the following equations 5.21-5.23. It is not
surprising that the redried composite has very similar forming limits to the untreated
composite, as ductility has been largely returned to the untreated level when drying
from the wet condition. Compared to these two dry conditions, the CNFC exhibits a
significantly expanded forming envelope in the water-treated conditions, such that the
limiting major strains are increased by 61% in biaxial stretch, and 92.8% in plane strain.
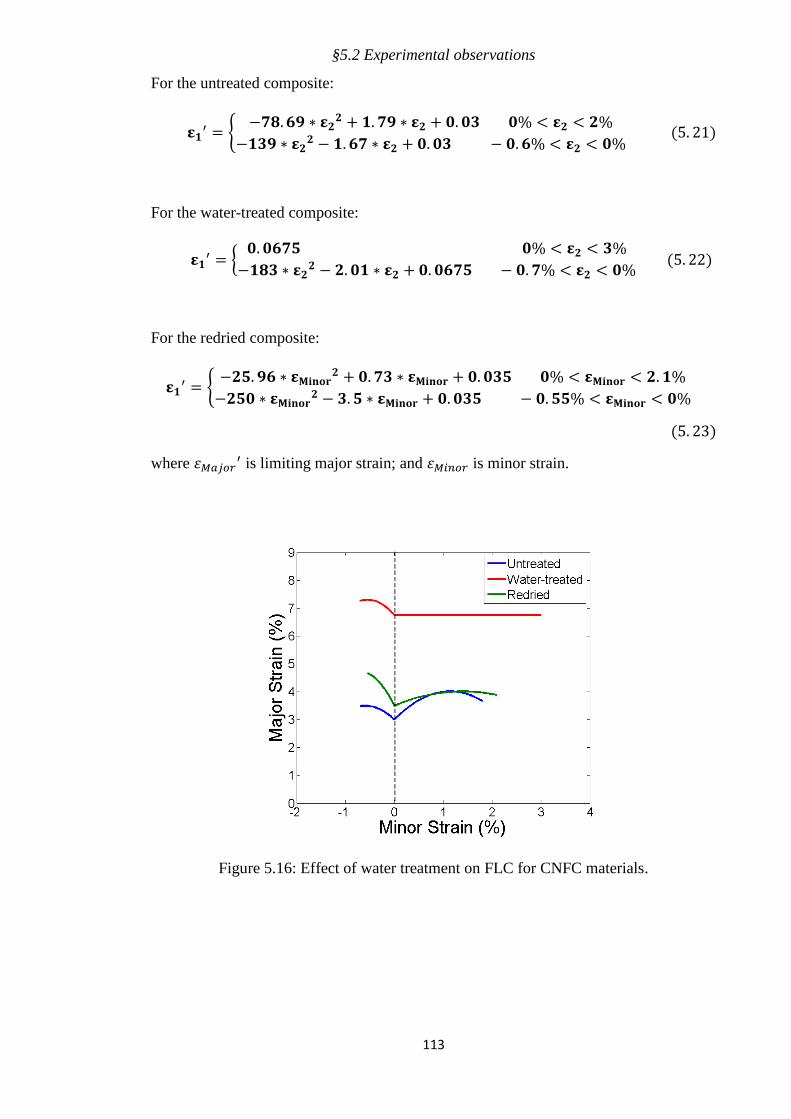
§5.2 Experimental observations
113
For the untreated composite:
𝛆𝟏′ = {
−𝟕𝟖. 𝟔𝟗 ∗ 𝛆𝟐𝟐 + 𝟏. 𝟕𝟗 ∗ 𝛆𝟐 + 𝟎. 𝟎𝟑 𝟎% < 𝛆𝟐 < 𝟐%
−𝟏𝟑𝟗 ∗ 𝛆𝟐𝟐 − 𝟏. 𝟔𝟕 ∗ 𝛆𝟐 + 𝟎. 𝟎𝟑 − 𝟎. 𝟔% < 𝛆𝟐 < 𝟎%
(5. 21)
For the water-treated composite:
𝛆𝟏′ = {
𝟎. 𝟎𝟔𝟕𝟓 𝟎% < 𝛆𝟐 < 𝟑%
−𝟏𝟖𝟑 ∗ 𝛆𝟐𝟐 − 𝟐. 𝟎𝟏 ∗ 𝛆𝟐 + 𝟎. 𝟎𝟔𝟕𝟓 − 𝟎. 𝟕% < 𝛆𝟐 < 𝟎%
(5. 22)
For the redried composite:
𝛆𝟏′ = {
−𝟐𝟓. 𝟗𝟔 ∗ 𝛆𝐌𝐢𝐧𝐨𝐫𝟐 + 𝟎. 𝟕𝟑 ∗ 𝛆𝐌𝐢𝐧𝐨𝐫 + 𝟎. 𝟎𝟑𝟓 𝟎% < 𝛆𝐌𝐢𝐧𝐨𝐫 < 𝟐. 𝟏%
−𝟐𝟓𝟎 ∗ 𝛆𝐌𝐢𝐧𝐨𝐫𝟐 − 𝟑. 𝟓 ∗ 𝛆𝐌𝐢𝐧𝐨𝐫 + 𝟎. 𝟎𝟑𝟓 − 𝟎. 𝟓𝟓% < 𝛆𝐌𝐢𝐧𝐨𝐫 < 𝟎%
(5. 23)
where 휀𝑀𝑎𝑗𝑜𝑟′ is limiting major strain; and 휀𝑀𝑖𝑛𝑜𝑟 is minor strain.
Figure 5.16: Effect of water treatment on FLC for CNFC materials.
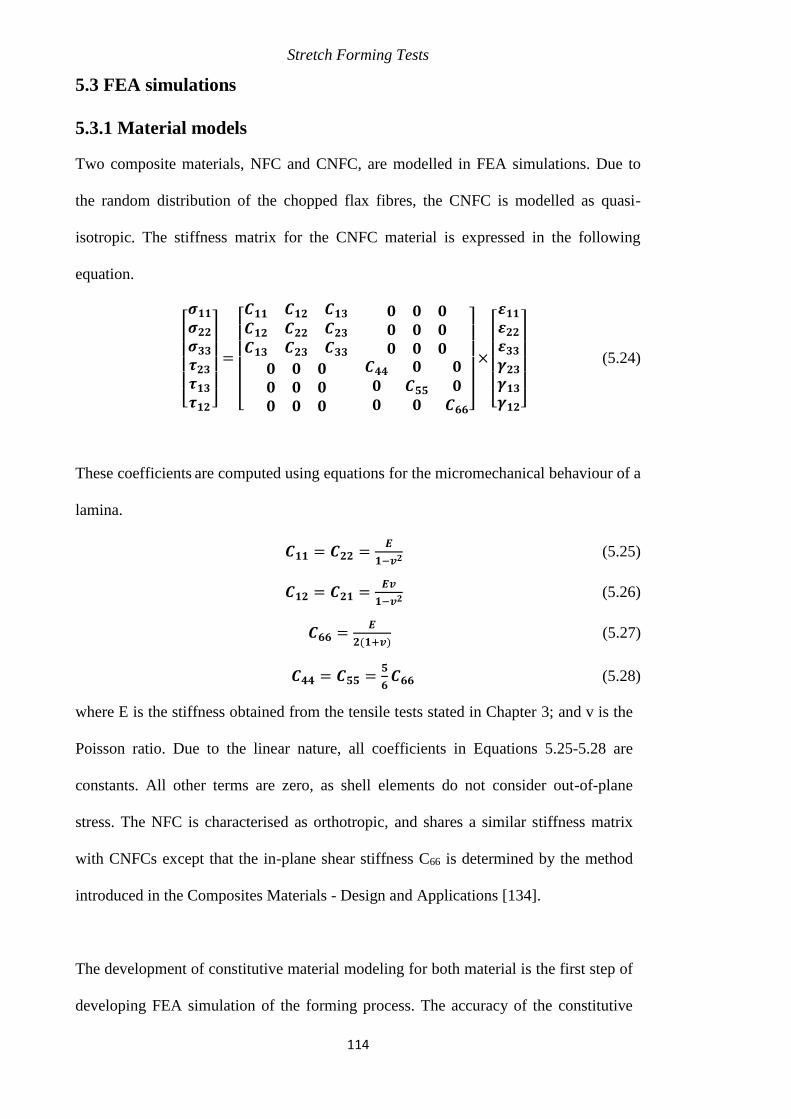
Stretch Forming Tests
114
5.3 FEA simulations
5.3.1 Material models
Two composite materials, NFC and CNFC, are modelled in FEA simulations. Due to
the random distribution of the chopped flax fibres, the CNFC is modelled as quasi-
isotropic. The stiffness matrix for the CNFC material is expressed in the following
equation.
[ 𝝈𝟏𝟏𝝈𝟐𝟐𝝈𝟑𝟑𝝉𝟐𝟑𝝉𝟏𝟑𝝉𝟏𝟐 ]
=
[ 𝑪𝟏𝟏 𝑪𝟏𝟐 𝑪𝟏𝟑𝑪𝟏𝟐 𝑪𝟐𝟐 𝑪𝟐𝟑𝑪𝟏𝟑 𝑪𝟐𝟑 𝑪𝟑𝟑
𝟎 𝟎 𝟎𝟎 𝟎 𝟎𝟎 𝟎 𝟎
𝟎 𝟎 𝟎𝟎 𝟎 𝟎𝟎 𝟎 𝟎
𝑪𝟒𝟒 𝟎 𝟎𝟎 𝑪𝟓𝟓 𝟎𝟎 𝟎 𝑪𝟔𝟔]
×
[ 𝜺𝟏𝟏𝜺𝟐𝟐𝜺𝟑𝟑𝜸𝟐𝟑𝜸𝟏𝟑𝜸𝟏𝟐]
(5.24)
These coefficients are computed using equations for the micromechanical behaviour of a
lamina.
𝑪𝟏𝟏 = 𝑪𝟐𝟐 =𝑬
𝟏−𝒗𝟐 (5.25)
𝑪𝟏𝟐 = 𝑪𝟐𝟏 =𝑬𝒗
𝟏−𝒗𝟐 (5.26)
𝑪𝟔𝟔 =𝑬
𝟐(𝟏+𝒗) (5.27)
𝑪𝟒𝟒 = 𝑪𝟓𝟓 =𝟓
𝟔𝑪𝟔𝟔 (5.28)
where E is the stiffness obtained from the tensile tests stated in Chapter 3; and v is the
Poisson ratio. Due to the linear nature, all coefficients in Equations 5.25-5.28 are
constants. All other terms are zero, as shell elements do not consider out-of-plane
stress. The NFC is characterised as orthotropic, and shares a similar stiffness matrix
with CNFCs except that the in-plane shear stiffness C66 is determined by the method
introduced in the Composites Materials - Design and Applications [134].
The development of constitutive material modeling for both material is the first step of
developing FEA simulation of the forming process. The accuracy of the constitutive
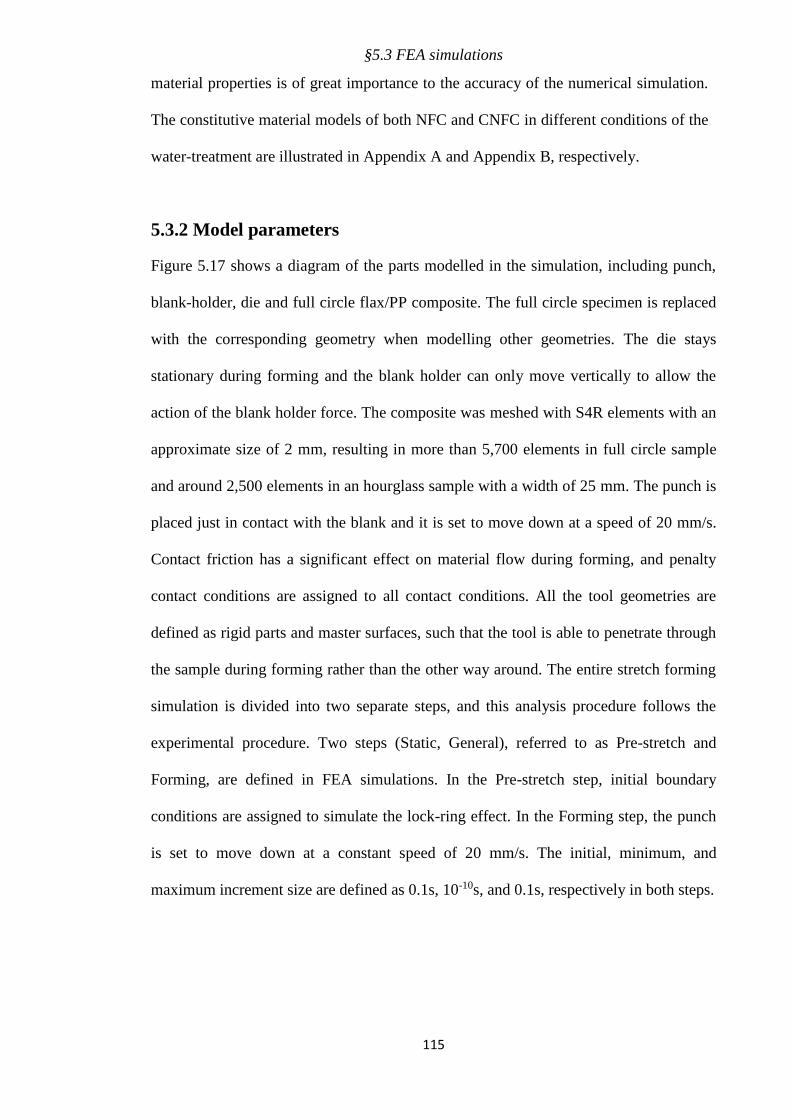
§5.3 FEA simulations
115
material properties is of great importance to the accuracy of the numerical simulation.
The constitutive material models of both NFC and CNFC in different conditions of the
water-treatment are illustrated in Appendix A and Appendix B, respectively.
5.3.2 Model parameters
Figure 5.17 shows a diagram of the parts modelled in the simulation, including punch,
blank-holder, die and full circle flax/PP composite. The full circle specimen is replaced
with the corresponding geometry when modelling other geometries. The die stays
stationary during forming and the blank holder can only move vertically to allow the
action of the blank holder force. The composite was meshed with S4R elements with an
approximate size of 2 mm, resulting in more than 5,700 elements in full circle sample
and around 2,500 elements in an hourglass sample with a width of 25 mm. The punch is
placed just in contact with the blank and it is set to move down at a speed of 20 mm/s.
Contact friction has a significant effect on material flow during forming, and penalty
contact conditions are assigned to all contact conditions. All the tool geometries are
defined as rigid parts and master surfaces, such that the tool is able to penetrate through
the sample during forming rather than the other way around. The entire stretch forming
simulation is divided into two separate steps, and this analysis procedure follows the
experimental procedure. Two steps (Static, General), referred to as Pre-stretch and
Forming, are defined in FEA simulations. In the Pre-stretch step, initial boundary
conditions are assigned to simulate the lock-ring effect. In the Forming step, the punch
is set to move down at a constant speed of 20 mm/s. The initial, minimum, and
maximum increment size are defined as 0.1s, 10-10s, and 0.1s, respectively in both steps.
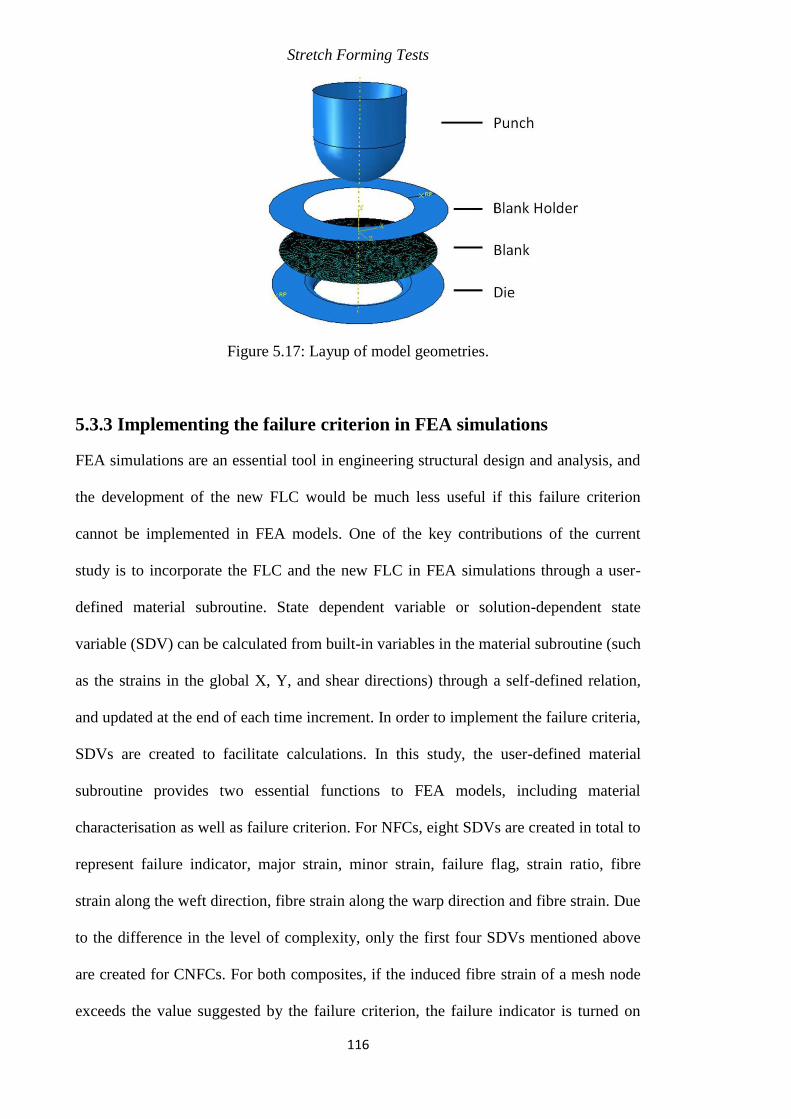
Stretch Forming Tests
116
Figure 5.17: Layup of model geometries.
5.3.3 Implementing the failure criterion in FEA simulations
FEA simulations are an essential tool in engineering structural design and analysis, and
the development of the new FLC would be much less useful if this failure criterion
cannot be implemented in FEA models. One of the key contributions of the current
study is to incorporate the FLC and the new FLC in FEA simulations through a user-
defined material subroutine. State dependent variable or solution-dependent state
variable (SDV) can be calculated from built-in variables in the material subroutine (such
as the strains in the global X, Y, and shear directions) through a self-defined relation,
and updated at the end of each time increment. In order to implement the failure criteria,
SDVs are created to facilitate calculations. In this study, the user-defined material
subroutine provides two essential functions to FEA models, including material
characterisation as well as failure criterion. For NFCs, eight SDVs are created in total to
represent failure indicator, major strain, minor strain, failure flag, strain ratio, fibre
strain along the weft direction, fibre strain along the warp direction and fibre strain. Due
to the difference in the level of complexity, only the first four SDVs mentioned above
are created for CNFCs. For both composites, if the induced fibre strain of a mesh node
exceeds the value suggested by the failure criterion, the failure indicator is turned on
§5.3 FEA simulations
117
and the stiffness in all directions reduces to 0, analogically creating a ‘crack’ so that the
region can withstand applied stress. It is possible in FEA simulations but not reasonable
or realistic, for a mesh node to fail and then to become ‘unfailed’ later during the
forming process. To eliminate this unrealistic situation, a SDV named ‘flag’ is defined
to ensure that once failure initiates at a mesh node, this point remains failed regardless
of the future strain conditions. Figure 5.18 shows the flow chart of the user-defined
material routine developed for NFCs, which is very close to that of CNFCs with a
different stiffness matrix and failure criterion.
Figure 5.18: Flow chart of the user-defined material routine for NFCs.
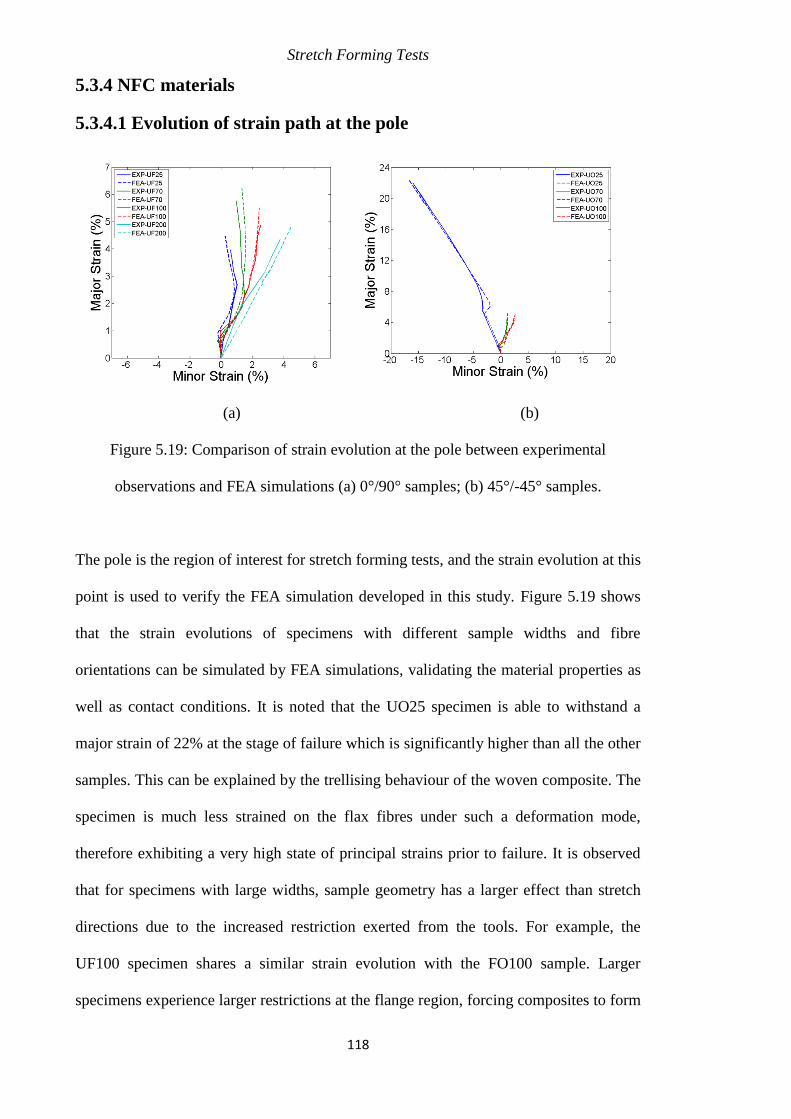
Stretch Forming Tests
118
5.3.4 NFC materials
5.3.4.1 Evolution of strain path at the pole
(a) (b)
Figure 5.19: Comparison of strain evolution at the pole between experimental
observations and FEA simulations (a) 0°/90° samples; (b) 45°/-45° samples.
The pole is the region of interest for stretch forming tests, and the strain evolution at this
point is used to verify the FEA simulation developed in this study. Figure 5.19 shows
that the strain evolutions of specimens with different sample widths and fibre
orientations can be simulated by FEA simulations, validating the material properties as
well as contact conditions. It is noted that the UO25 specimen is able to withstand a
major strain of 22% at the stage of failure which is significantly higher than all the other
samples. This can be explained by the trellising behaviour of the woven composite. The
specimen is much less strained on the flax fibres under such a deformation mode,
therefore exhibiting a very high state of principal strains prior to failure. It is observed
that for specimens with large widths, sample geometry has a larger effect than stretch
directions due to the increased restriction exerted from the tools. For example, the
UF100 specimen shares a similar strain evolution with the FO100 sample. Larger
specimens experience larger restrictions at the flange region, forcing composites to form
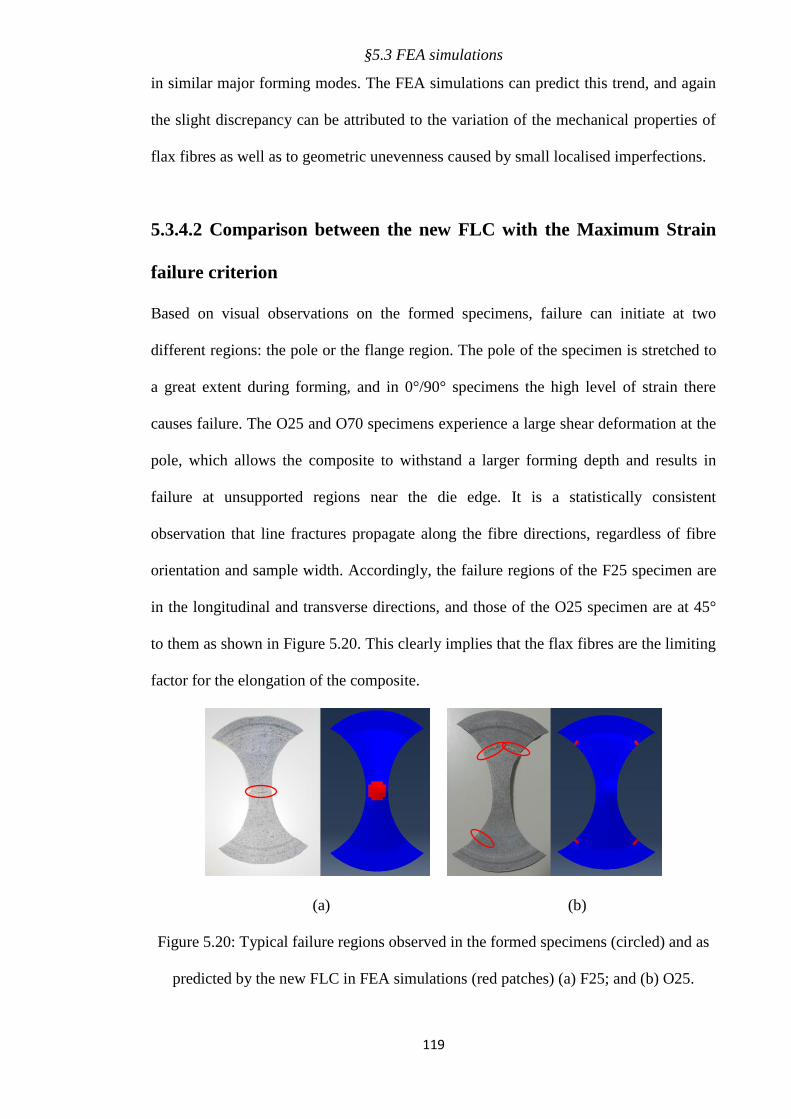
§5.3 FEA simulations
119
in similar major forming modes. The FEA simulations can predict this trend, and again
the slight discrepancy can be attributed to the variation of the mechanical properties of
flax fibres as well as to geometric unevenness caused by small localised imperfections.
5.3.4.2 Comparison between the new FLC with the Maximum Strain
failure criterion
Based on visual observations on the formed specimens, failure can initiate at two
different regions: the pole or the flange region. The pole of the specimen is stretched to
a great extent during forming, and in 0°/90° specimens the high level of strain there
causes failure. The O25 and O70 specimens experience a large shear deformation at the
pole, which allows the composite to withstand a larger forming depth and results in
failure at unsupported regions near the die edge. It is a statistically consistent
observation that line fractures propagate along the fibre directions, regardless of fibre
orientation and sample width. Accordingly, the failure regions of the F25 specimen are
in the longitudinal and transverse directions, and those of the O25 specimen are at 45°
to them as shown in Figure 5.20. This clearly implies that the flax fibres are the limiting
factor for the elongation of the composite.
(a) (b)
Figure 5.20: Typical failure regions observed in the formed specimens (circled) and as
predicted by the new FLC in FEA simulations (red patches) (a) F25; and (b) O25.
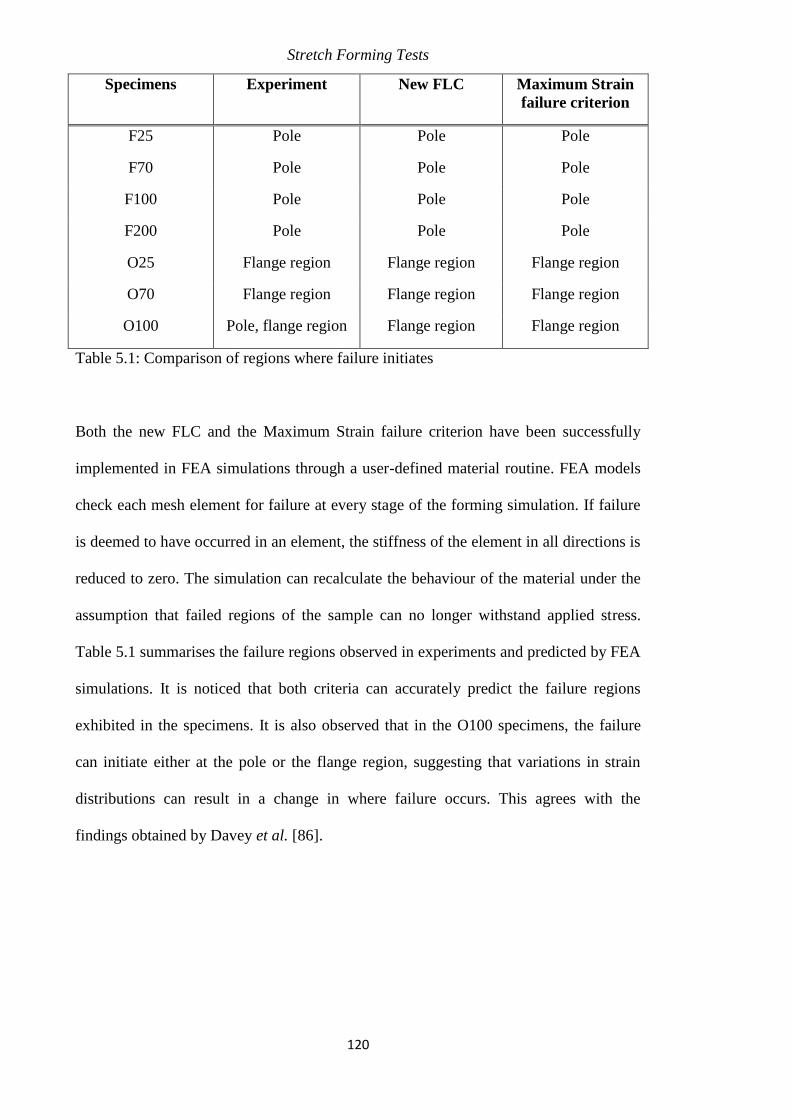
Stretch Forming Tests
120
Specimens Experiment New FLC Maximum Strain
failure criterion
F25 Pole Pole Pole
F70 Pole Pole Pole
F100 Pole Pole Pole
F200 Pole Pole Pole
O25 Flange region Flange region Flange region
O70 Flange region Flange region Flange region
O100 Pole, flange region Flange region Flange region
Table 5.1: Comparison of regions where failure initiates
Both the new FLC and the Maximum Strain failure criterion have been successfully
implemented in FEA simulations through a user-defined material routine. FEA models
check each mesh element for failure at every stage of the forming simulation. If failure
is deemed to have occurred in an element, the stiffness of the element in all directions is
reduced to zero. The simulation can recalculate the behaviour of the material under the
assumption that failed regions of the sample can no longer withstand applied stress.
Table 5.1 summarises the failure regions observed in experiments and predicted by FEA
simulations. It is noticed that both criteria can accurately predict the failure regions
exhibited in the specimens. It is also observed that in the O100 specimens, the failure
can initiate either at the pole or the flange region, suggesting that variations in strain
distributions can result in a change in where failure occurs. This agrees with the
findings obtained by Davey et al. [86].
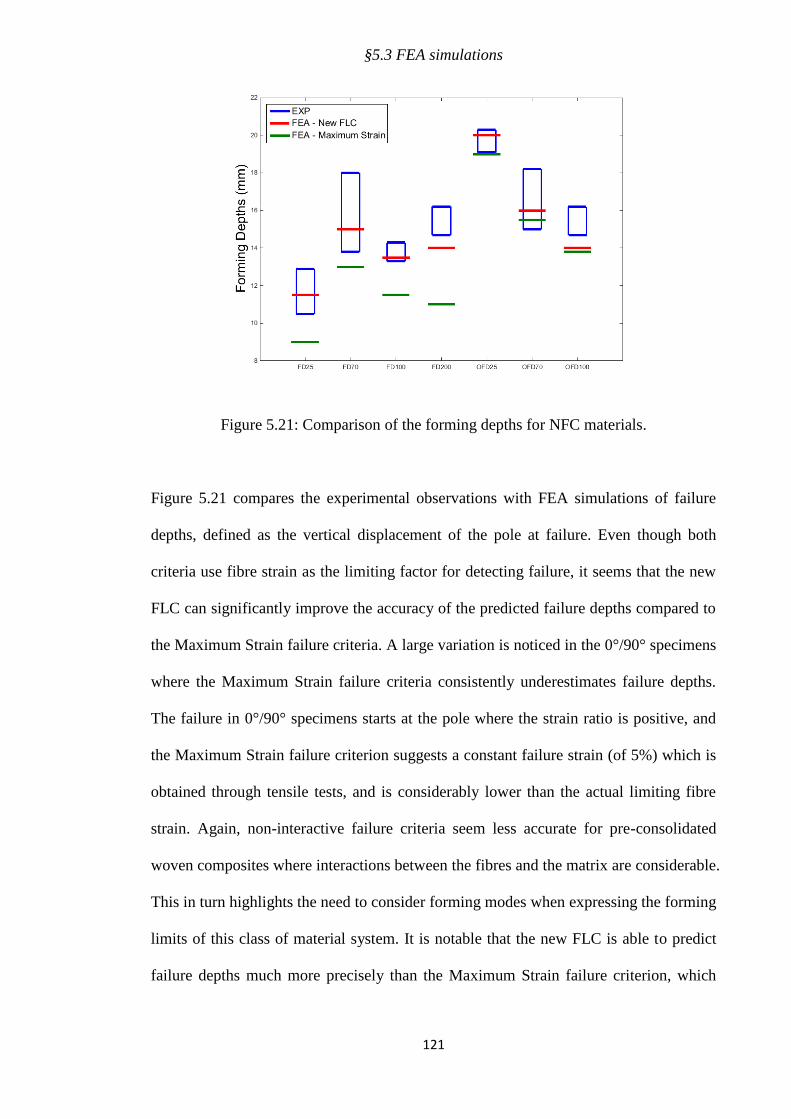
§5.3 FEA simulations
121
Figure 5.21: Comparison of the forming depths for NFC materials.
Figure 5.21 compares the experimental observations with FEA simulations of failure
depths, defined as the vertical displacement of the pole at failure. Even though both
criteria use fibre strain as the limiting factor for detecting failure, it seems that the new
FLC can significantly improve the accuracy of the predicted failure depths compared to
the Maximum Strain failure criteria. A large variation is noticed in the 0°/90° specimens
where the Maximum Strain failure criteria consistently underestimates failure depths.
The failure in 0°/90° specimens starts at the pole where the strain ratio is positive, and
the Maximum Strain failure criterion suggests a constant failure strain (of 5%) which is
obtained through tensile tests, and is considerably lower than the actual limiting fibre
strain. Again, non-interactive failure criteria seem less accurate for pre-consolidated
woven composites where interactions between the fibres and the matrix are considerable.
This in turn highlights the need to consider forming modes when expressing the forming
limits of this class of material system. It is notable that the new FLC is able to predict
failure depths much more precisely than the Maximum Strain failure criterion, which
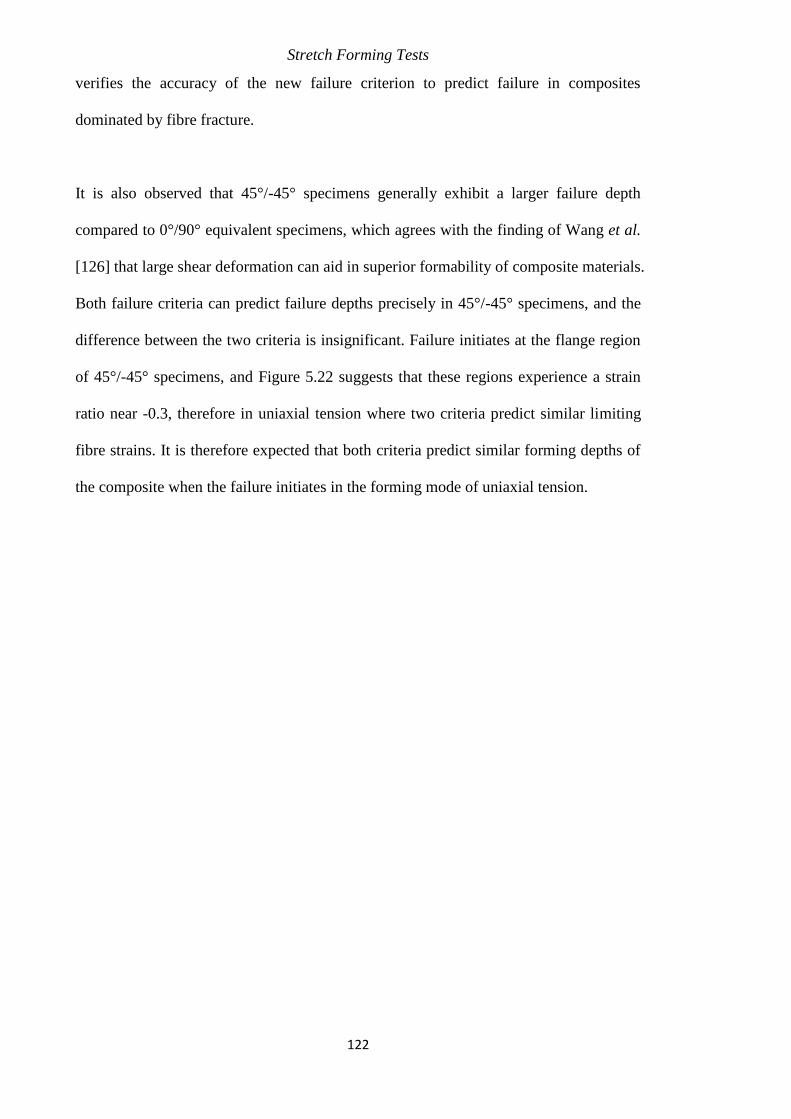
Stretch Forming Tests
122
verifies the accuracy of the new failure criterion to predict failure in composites
dominated by fibre fracture.
It is also observed that 45°/-45° specimens generally exhibit a larger failure depth
compared to 0°/90° equivalent specimens, which agrees with the finding of Wang et al.
[126] that large shear deformation can aid in superior formability of composite materials.
Both failure criteria can predict failure depths precisely in 45°/-45° specimens, and the
difference between the two criteria is insignificant. Failure initiates at the flange region
of 45°/-45° specimens, and Figure 5.22 suggests that these regions experience a strain
ratio near -0.3, therefore in uniaxial tension where two criteria predict similar limiting
fibre strains. It is therefore expected that both criteria predict similar forming depths of
the composite when the failure initiates in the forming mode of uniaxial tension.
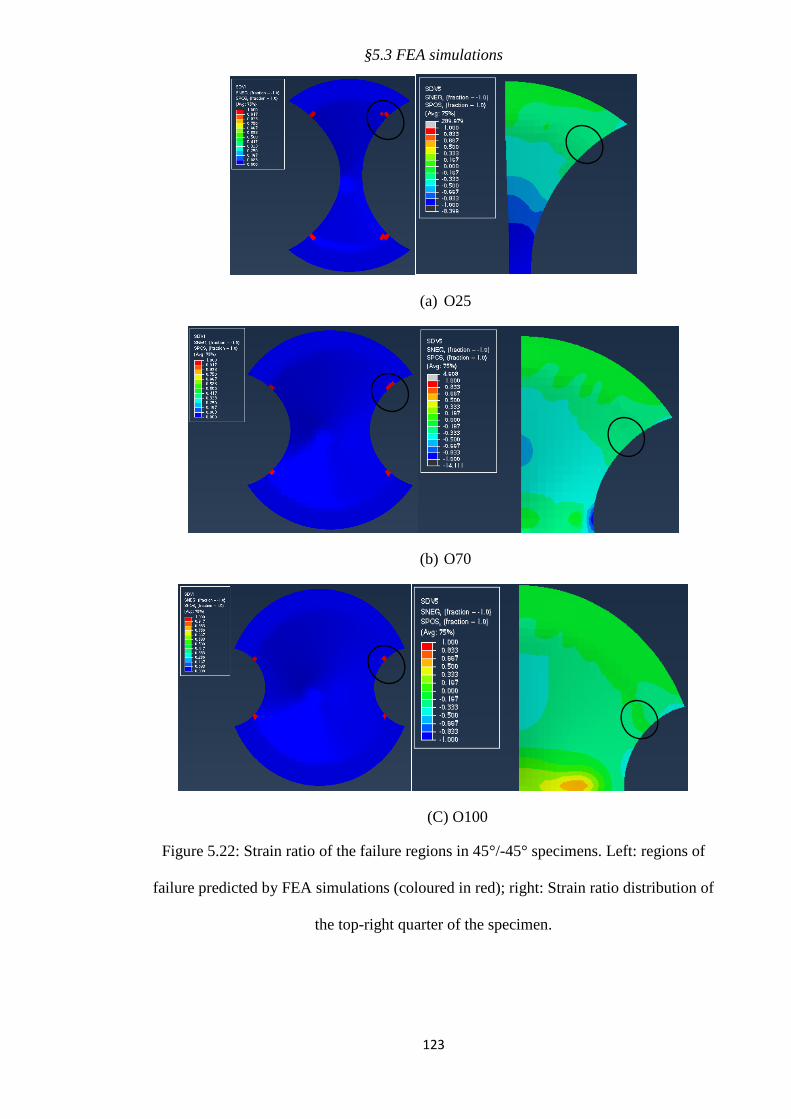
§5.3 FEA simulations
123
(a) O25
(b) O70
(C) O100
Figure 5.22: Strain ratio of the failure regions in 45°/-45° specimens. Left: regions of
failure predicted by FEA simulations (coloured in red); right: Strain ratio distribution of
the top-right quarter of the specimen.
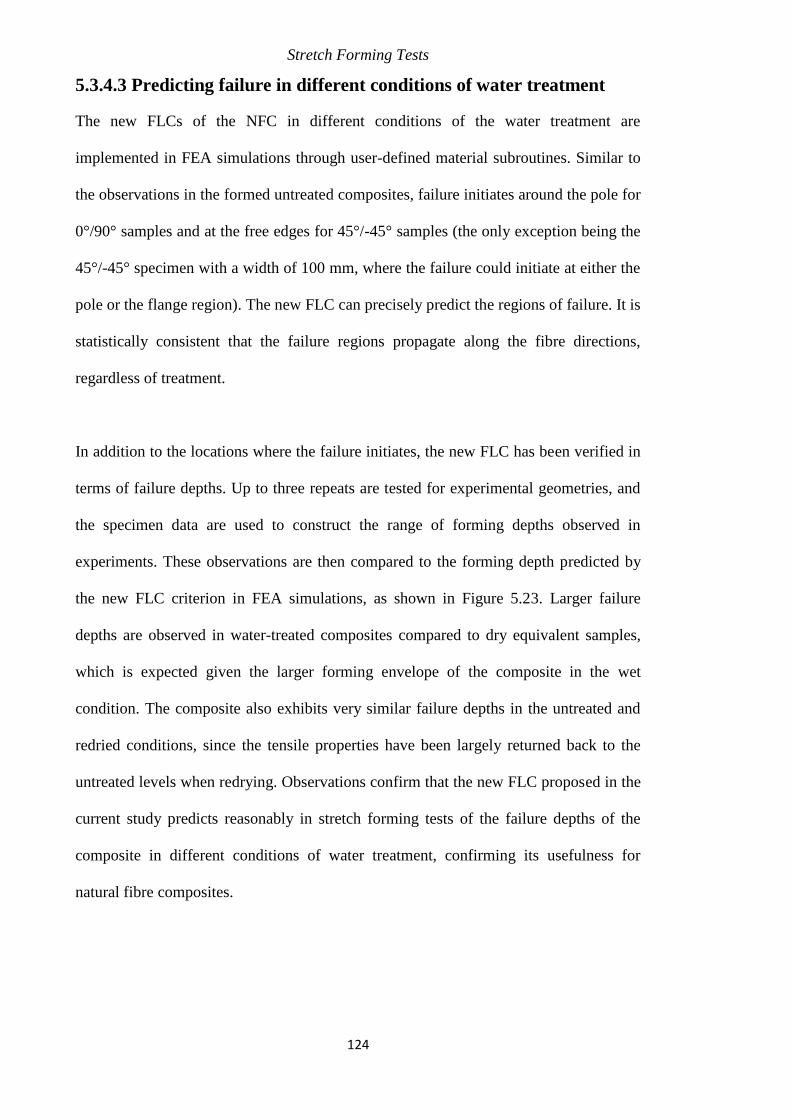
Stretch Forming Tests
124
5.3.4.3 Predicting failure in different conditions of water treatment
The new FLCs of the NFC in different conditions of the water treatment are
implemented in FEA simulations through user-defined material subroutines. Similar to
the observations in the formed untreated composites, failure initiates around the pole for
0°/90° samples and at the free edges for 45°/-45° samples (the only exception being the
45°/-45° specimen with a width of 100 mm, where the failure could initiate at either the
pole or the flange region). The new FLC can precisely predict the regions of failure. It is
statistically consistent that the failure regions propagate along the fibre directions,
regardless of treatment.
In addition to the locations where the failure initiates, the new FLC has been verified in
terms of failure depths. Up to three repeats are tested for experimental geometries, and
the specimen data are used to construct the range of forming depths observed in
experiments. These observations are then compared to the forming depth predicted by
the new FLC criterion in FEA simulations, as shown in Figure 5.23. Larger failure
depths are observed in water-treated composites compared to dry equivalent samples,
which is expected given the larger forming envelope of the composite in the wet
condition. The composite also exhibits very similar failure depths in the untreated and
redried conditions, since the tensile properties have been largely returned back to the
untreated levels when redrying. Observations confirm that the new FLC proposed in the
current study predicts reasonably in stretch forming tests of the failure depths of the
composite in different conditions of water treatment, confirming its usefulness for
natural fibre composites.
§5.3 FEA simulations
125
Figure 5.23: Comparison of forming depths observed in experiments, and as predicted
by the FEA simulations.
5.3.5 CNFC materials
5.3.5.1 Evolution of strain path at the pole
Figure 5.24: Strain evolution of the pole for untreated CNFCs.
Figures 5.24 shows a comparison between experimental observations and FEA
simulations of strain evolutions at the pole for untreated specimens with various middle-
section widths. It is clear that varying the sample geometry can change the deformation
mode of the composite at failure: the composites exhibit a strain ratio of 0.13, 0.19, 0.52
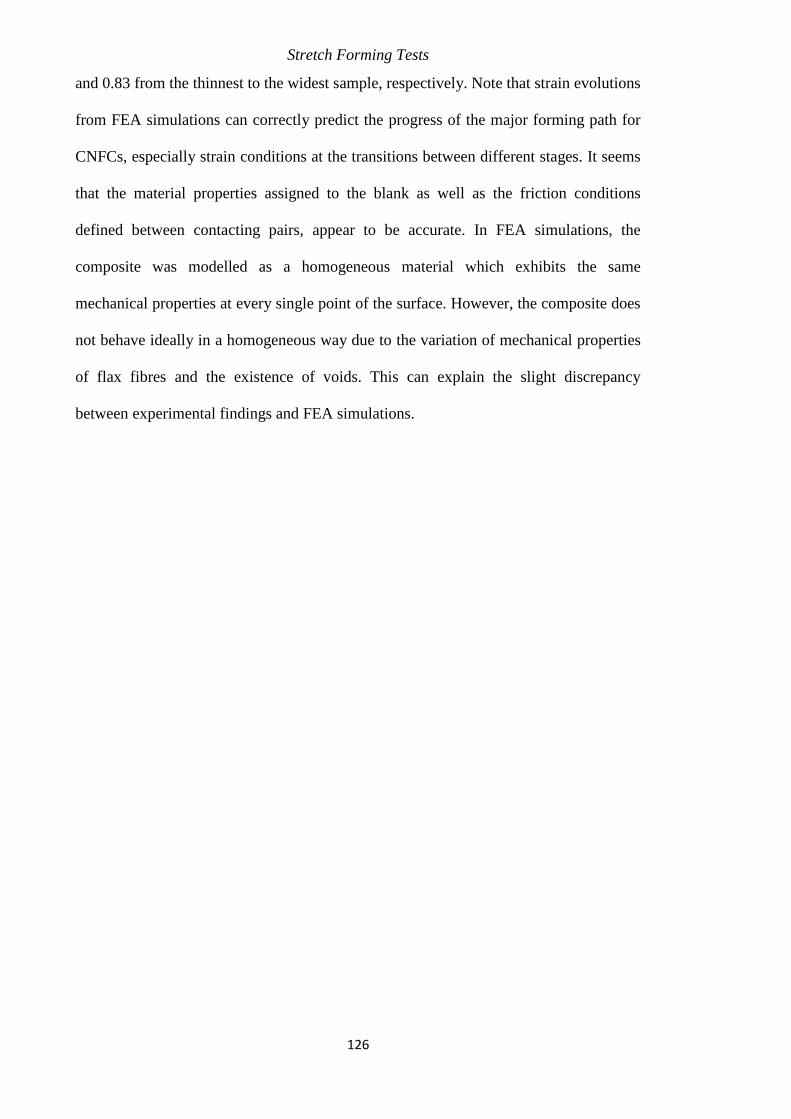
Stretch Forming Tests
126
and 0.83 from the thinnest to the widest sample, respectively. Note that strain evolutions
from FEA simulations can correctly predict the progress of the major forming path for
CNFCs, especially strain conditions at the transitions between different stages. It seems
that the material properties assigned to the blank as well as the friction conditions
defined between contacting pairs, appear to be accurate. In FEA simulations, the
composite was modelled as a homogeneous material which exhibits the same
mechanical properties at every single point of the surface. However, the composite does
not behave ideally in a homogeneous way due to the variation of mechanical properties
of flax fibres and the existence of voids. This can explain the slight discrepancy
between experimental findings and FEA simulations.
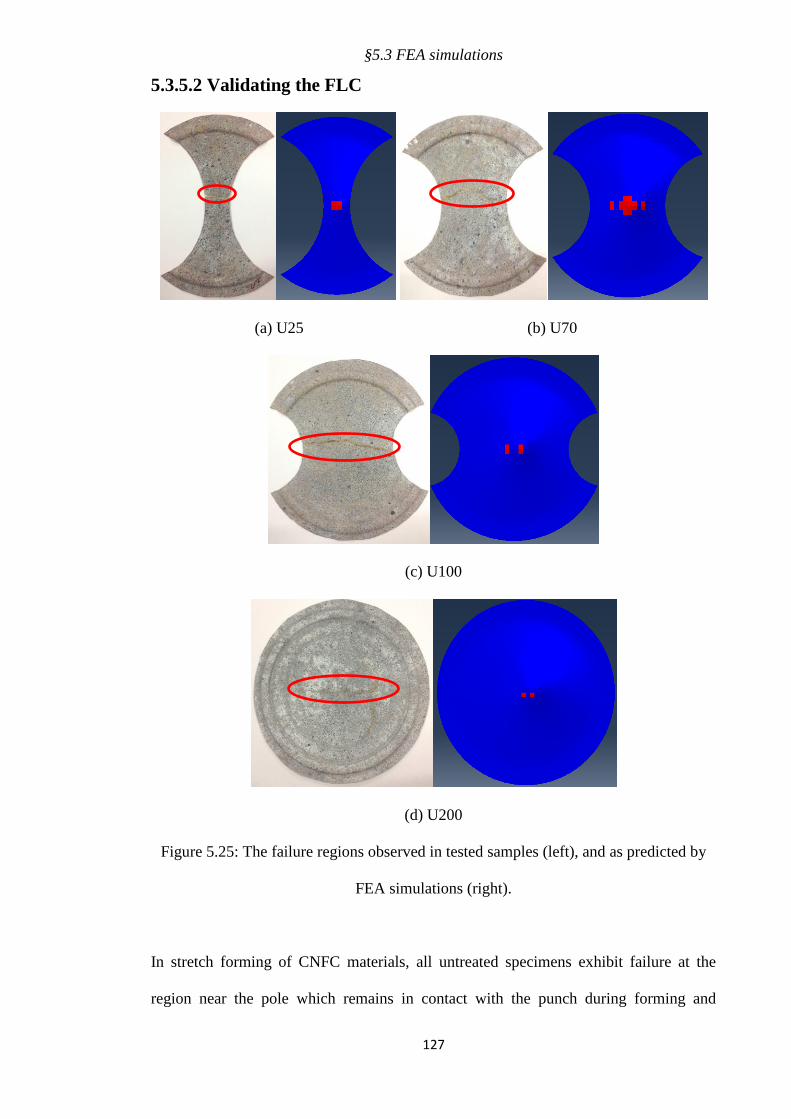
§5.3 FEA simulations
127
5.3.5.2 Validating the FLC
(a) U25 (b) U70
(c) U100
(d) U200
Figure 5.25: The failure regions observed in tested samples (left), and as predicted by
FEA simulations (right).
In stretch forming of CNFC materials, all untreated specimens exhibit failure at the
region near the pole which remains in contact with the punch during forming and
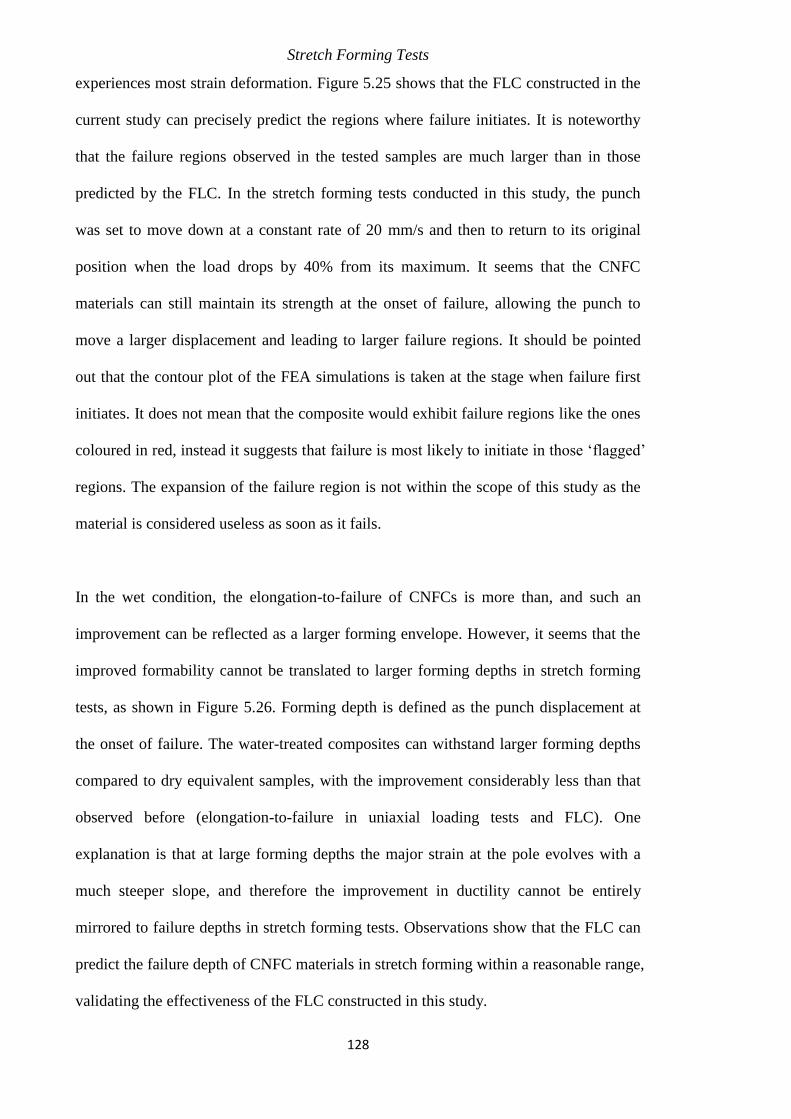
Stretch Forming Tests
128
experiences most strain deformation. Figure 5.25 shows that the FLC constructed in the
current study can precisely predict the regions where failure initiates. It is noteworthy
that the failure regions observed in the tested samples are much larger than in those
predicted by the FLC. In the stretch forming tests conducted in this study, the punch
was set to move down at a constant rate of 20 mm/s and then to return to its original
position when the load drops by 40% from its maximum. It seems that the CNFC
materials can still maintain its strength at the onset of failure, allowing the punch to
move a larger displacement and leading to larger failure regions. It should be pointed
out that the contour plot of the FEA simulations is taken at the stage when failure first
initiates. It does not mean that the composite would exhibit failure regions like the ones
coloured in red, instead it suggests that failure is most likely to initiate in those ‘flagged’
regions. The expansion of the failure region is not within the scope of this study as the
material is considered useless as soon as it fails.
In the wet condition, the elongation-to-failure of CNFCs is more than, and such an
improvement can be reflected as a larger forming envelope. However, it seems that the
improved formability cannot be translated to larger forming depths in stretch forming
tests, as shown in Figure 5.26. Forming depth is defined as the punch displacement at
the onset of failure. The water-treated composites can withstand larger forming depths
compared to dry equivalent samples, with the improvement considerably less than that
observed before (elongation-to-failure in uniaxial loading tests and FLC). One
explanation is that at large forming depths the major strain at the pole evolves with a
much steeper slope, and therefore the improvement in ductility cannot be entirely
mirrored to failure depths in stretch forming tests. Observations show that the FLC can
predict the failure depth of CNFC materials in stretch forming within a reasonable range,
validating the effectiveness of the FLC constructed in this study.
§5.4 Summary
129
Figure 5.26: Comparison of the failure depths for CNFC materials.
5.4 Summary
This Chapter has studied the forming behaviour of composite materials in stretch
forming tests, and determined the forming limits for both NFC and CNFC materials.
Composites are cut into hourglass shapes with various middle sectional width as well as
fibre orientation to examine different forming modes. The stretch forming process can
be identified as three separate stages based on changes in the major deformation mode,
including: firstly pre-stretch, secondly bi-axial stretch and finally the major forming
path. It is found that the woven structure of the NFC can help exhibit an additional
deformation mode of pure shear compared to the CNFC. More importantly, under this
deformation mode the NFC specimen is able to withstand much larger strain
deformation, which agrees with the findings obtained by Wang et al. [126] that shear
deformation can aid in superior formability for woven composites. It is also observed
that for specimens with large widths, sample width has a dominating effect over stretch
directions due to the increased restriction exerted by the tools.
Stretch Forming Tests
130
The major reason to conduct stretch forming tests is to determine the forming limits of
composite materials. This section has shown that the conventional FLC, which has been
widely applied to metal forming, is a valid tool to express the forming envelope of
CNFC materials. This is because CNFCs behave predominantly like an isotropic
material. Based on the principal strain deformation provided by the ARAMIS system at
the surface points where failure initiates, FLCs are constructed for CNFC materials in
different conditions of water treatment. However, due to the path dependency effect,
this conventional method is found incapable of accurately describing the forming limits
of NFC materials. As a result, unfailed surface points are found to exhibit higher
principal strains compared to failed ones when both points experience an identical
deformation mode. A consistent observation is that the major failure mechanism of NFC
materials is fibre fracture. By analysing the evolution of major strain and its Cartesian
components, it has found that the path dependency is caused by the effect of strain
deformation acting on the polypropylene matrix, which contributes little to composite
failure. An innovative failure criterion, named the new FLC, is proposed which uses
fibre strain and strain ratio as key parameters, and this new failure criterion can
successfully eliminate path dependency as it tracks the evolution of fibre movements. In
addition, the new FLC is considered more precise than the Maximum Strain failure
criterion, which assumes that there is no interaction between different components of
the composite. This assumption is clearly oversimplified for woven composites.
FEA models are developed to simulate the forming process of both composites. From
the way strain path evolves at the pole, it seems that the material properties and friction
conditions for contact pairs appear to be accurate. One of contributions of the current
work is that it creates material subroutines for examining the accuracy of failure criteria
in FEA models. To facilitate this process, SDVs have been defined to determine if there
§5.4 Summary
131
are any surface points experiencing strain deformation higher than the values suggested
by the failure criteria. It is observed that the new FLC is much more accurate than the
Maximum Strain failure criterion, especially for samples with a fibre orientation of
0°/90°. By comparing FEA simulations with experimental observations, it is shown that
the FLC and the new FLC can predict failure regions and failure depths of both
composites in different conditions of water treatment. This Chapter has shown that the
new FLC is superior to other strain-based failure criteria (the Maximum Strain failure
criterion as well the conventional FLC), and this criterion should be applicable to any
other woven composite systems as long as the dominating failure mechanism is fibre
fracture.
It is important to note that this failure criterion provides a new angle to view the failure
theory of composite materials. This Chapter has proved that for composite materials,
especially those with inextensible fibres, fibre strain should be focused on when
studying the failure behaviour. By doing this, the path dependency issue observed in
conventional FLC can be eliminated successfully. Although there are existing failure
criteria, such as the Maximum Strain failure criterion, which consider the amount of
strain acting on the fibres separately from the total strain deformation. It is confirmed
that the limiting fibre strain is influenced by the deformation mode, and therefore
should be expressed as a function of strain ratio. The new FLC defines a new method to
examine/predict the failure of woven composites, which has the potential to be widely
applied in failure study of composite materials.

Stretch Forming Tests
132
133
Chapter 6
Dome Forming Tests
6.1 Introduction
When circular samples were formed into a dome structure with the edges not being
fixed completely, they will experience a combination of drawing and stretching. This
Chapter compares the forming behaviour of composites when different treatments are
applied, including preheating, water treatment and tailored blanks. By taking into
account the thermal degradation of the composites, the optimal forming temperature
windows are determined for this class of material system. Preheating has been widely
used to improve the formability of material in rapid forming processes, and the water
treatment performed in this study is found to almost double the forming depth of
preheated equivalent samples. This important breakthrough in improving the
formability of natural fibre composites can aid in rapid forming of this class of material
system. Compared to the circular samples used in preheating and those which are given
water treatment, tailored blanks suggest an innovative shape of composite in which four
portions of material are cut out at the edges of 0°, 90°, 180° and 270° positions. The
application of this experimental geometry encourages materials to be drawn into the die
cavity during forming, and therefore helps achieve a larger forming depth. Based on
strain deformation data provided by the ARAMIS™ system, the major mechanisms
behind the improved formability of the treated composites have been determined. The
FLC and the new FLC are constructed from stretch forming tests, and this Chapter
validates the effectiveness of each of these two failure criteria in dome forming.
Dome Forming Tests
134
6.2 Experimental observations
It is concluded from Chapter 4 that the water treatment can improve the ductility of
natural fibre composites more effectively than preheating. The scope of this section is
therefore to determine if the improved ductility can be reflected on increased
formability in complicated forming conditions such as dome forming where specimens
experience a combination of stretching and drawing. In dome forming all samples are
cut into a circular shape with a diameter of 180 mm, and formed into a hemispherical
dome structure at a punch rate of 20 mm/s. The amount of blank-holder force, ranging
from 0 to 14 kN, can be pre-set via the computer connecting to the stamping press
machine. A BHF of 7 kN is applied to the samples formed at different temperatures and
conditions of water treatment. For the tests performed at elevated temperatures, samples
are preheated to 15 ˚C above the forming temperature (to compensate for the
temperature drop during transferring samples from the heat press machine to the
stamping machine). The required adjustment is verified through temperature
observations during the experimental process. In additional to high temperatures, the
composites are formed in three different conditions of the water treatment: the untreated,
water-treated and redried. The untreated samples are cut and tested as received from the
material supplier without additional chemical treatments; the water-treated samples are
formed at the maximum saturation level of the water solution; and the redried samples
are saturated and then subsequently redried completely before forming. All tailored
composites were cut by the mechanical scissor, and then formed at room temperature
without the water treatment.
6.2.1 NFC materials
This section investigates the forming behaviour of NFC materials in dome forming tests.
NFC materials exhibit a significantly increased formability when specimens are
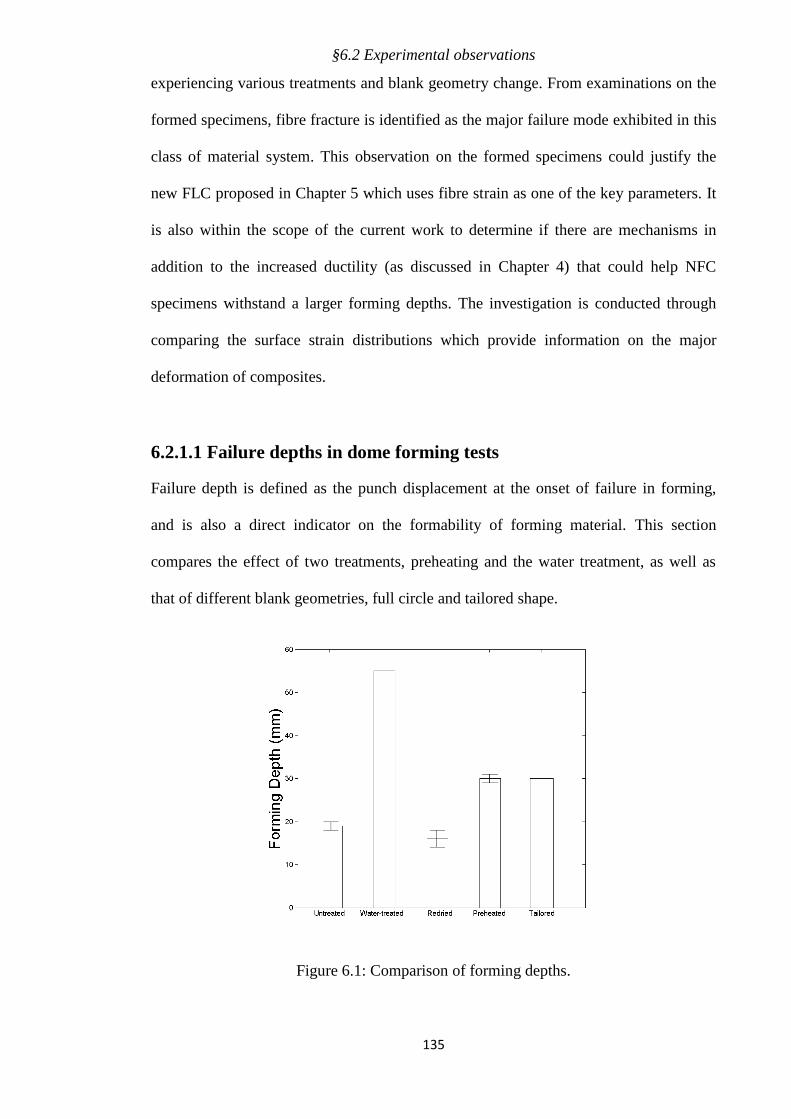
§6.2 Experimental observations
135
experiencing various treatments and blank geometry change. From examinations on the
formed specimens, fibre fracture is identified as the major failure mode exhibited in this
class of material system. This observation on the formed specimens could justify the
new FLC proposed in Chapter 5 which uses fibre strain as one of the key parameters. It
is also within the scope of the current work to determine if there are mechanisms in
addition to the increased ductility (as discussed in Chapter 4) that could help NFC
specimens withstand a larger forming depths. The investigation is conducted through
comparing the surface strain distributions which provide information on the major
deformation of composites.
6.2.1.1 Failure depths in dome forming tests
Failure depth is defined as the punch displacement at the onset of failure in forming,
and is also a direct indicator on the formability of forming material. This section
compares the effect of two treatments, preheating and the water treatment, as well as
that of different blank geometries, full circle and tailored shape.
Figure 6.1: Comparison of forming depths.
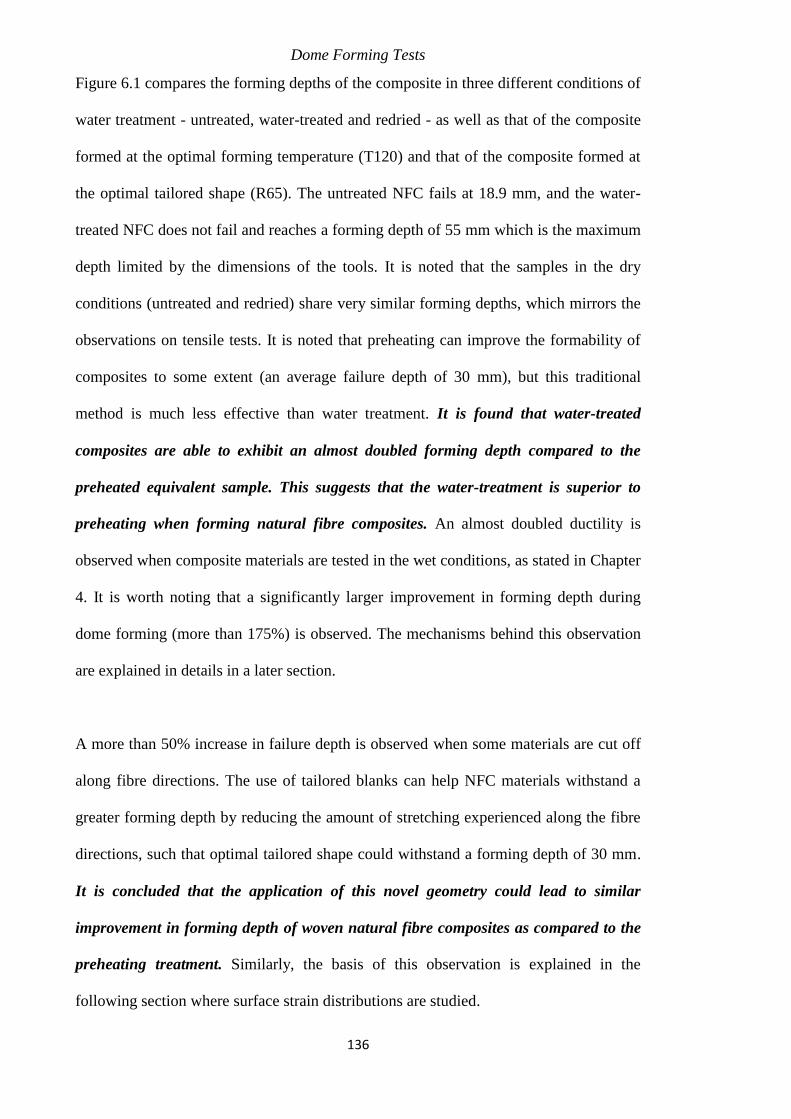
Dome Forming Tests
136
Figure 6.1 compares the forming depths of the composite in three different conditions of
water treatment - untreated, water-treated and redried - as well as that of the composite
formed at the optimal forming temperature (T120) and that of the composite formed at
the optimal tailored shape (R65). The untreated NFC fails at 18.9 mm, and the water-
treated NFC does not fail and reaches a forming depth of 55 mm which is the maximum
depth limited by the dimensions of the tools. It is noted that the samples in the dry
conditions (untreated and redried) share very similar forming depths, which mirrors the
observations on tensile tests. It is noted that preheating can improve the formability of
composites to some extent (an average failure depth of 30 mm), but this traditional
method is much less effective than water treatment. It is found that water-treated
composites are able to exhibit an almost doubled forming depth compared to the
preheated equivalent sample. This suggests that the water-treatment is superior to
preheating when forming natural fibre composites. An almost doubled ductility is
observed when composite materials are tested in the wet conditions, as stated in Chapter
4. It is worth noting that a significantly larger improvement in forming depth during
dome forming (more than 175%) is observed. The mechanisms behind this observation
are explained in details in a later section.
A more than 50% increase in failure depth is observed when some materials are cut off
along fibre directions. The use of tailored blanks can help NFC materials withstand a
greater forming depth by reducing the amount of stretching experienced along the fibre
directions, such that optimal tailored shape could withstand a forming depth of 30 mm.
It is concluded that the application of this novel geometry could lead to similar
improvement in forming depth of woven natural fibre composites as compared to the
preheating treatment. Similarly, the basis of this observation is explained in the
following section where surface strain distributions are studied.
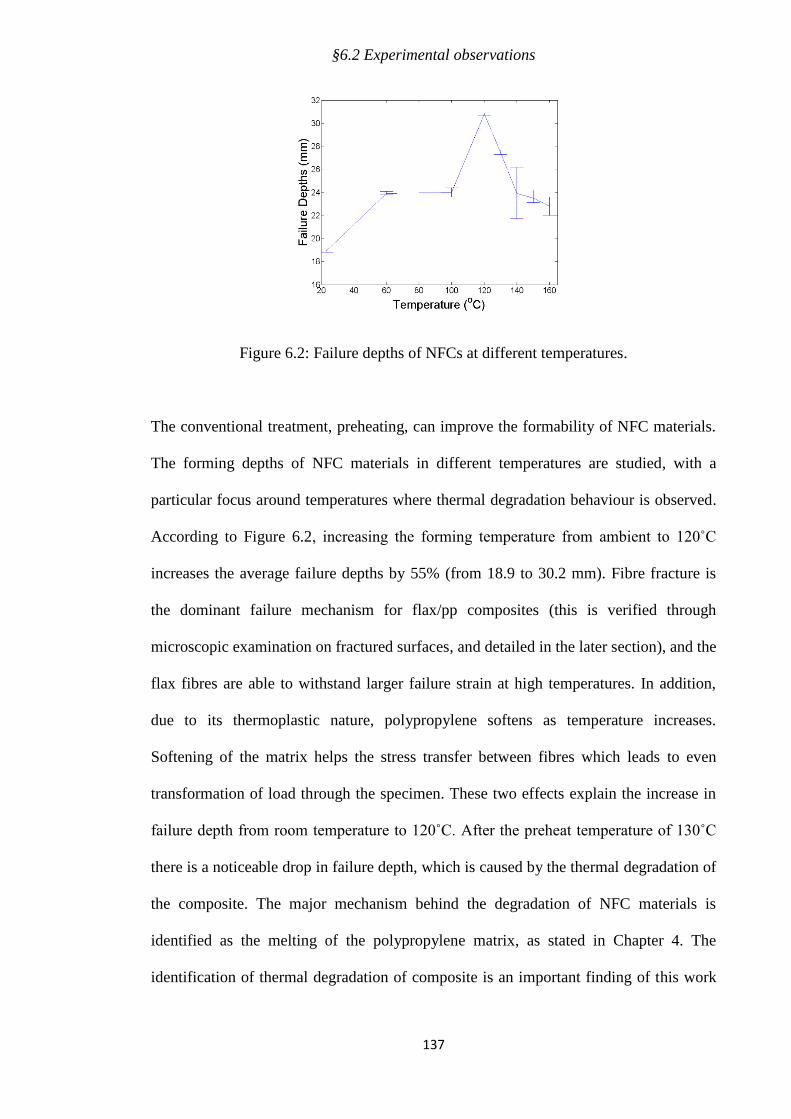
§6.2 Experimental observations
137
Figure 6.2: Failure depths of NFCs at different temperatures.
The conventional treatment, preheating, can improve the formability of NFC materials.
The forming depths of NFC materials in different temperatures are studied, with a
particular focus around temperatures where thermal degradation behaviour is observed.
According to Figure 6.2, increasing the forming temperature from ambient to 120˚C
increases the average failure depths by 55% (from 18.9 to 30.2 mm). Fibre fracture is
the dominant failure mechanism for flax/pp composites (this is verified through
microscopic examination on fractured surfaces, and detailed in the later section), and the
flax fibres are able to withstand larger failure strain at high temperatures. In addition,
due to its thermoplastic nature, polypropylene softens as temperature increases.
Softening of the matrix helps the stress transfer between fibres which leads to even
transformation of load through the specimen. These two effects explain the increase in
failure depth from room temperature to 120˚C. After the preheat temperature of 130˚C
there is a noticeable drop in failure depth, which is caused by the thermal degradation of
the composite. The major mechanism behind the degradation of NFC materials is
identified as the melting of the polypropylene matrix, as stated in Chapter 4. The
identification of thermal degradation of composite is an important finding of this work
Dome Forming Tests
138
as it identifies the existence of an optimal forming temperature window for this class of
material systems.
However, there is no obvious reduction in the elongation-to-failure of the composites in
the tensile tests performed at elevated temperatures. There are two reasons for the
significant reduction in the forming depths of NFC materials at high temperatures:
firstly, stiffness is reduced along fibre directions when the composite is preheated to
high temperatures, which leads to more stretching, and in turn, results in larger strains
acting on the composite. Secondly, the composite experiences two major deformation
mechanisms of drawing and stretching during dome forming tests. According to the
findings obtained by Venkatesan [18] who compared the formability of two woven
composites with the same matrix material but different fibres in dome forming tests, a
woven composite system with a smaller difference between stiffness in the fibre and
shear directions experiences larger surface strains, especially along the fibre directions.
It is therefore very likely that the composite would behave closer to an isotropic
material at high temperatures as the fibre stiffness reduces and becomes closer to that in
shear directions. Based on the Python script described in Chapter 5, fibre strains can be
determined from the ARAMIS system at every stage of the forming process. Figure 6.3
shows surface fibre strain deformation of 120˚C and 150˚C experimental cases. The
comparison is obtained at a forming depth of 23 mm where the latter is just prior to
failure, despite that the 120˚C experimental case could form to a larger depth. It is found
that the 150 ˚C experimental case experiences much higher fibre strains over the surface,
suggesting a possible combination of reduced stiffness and a forming behaviour closer
to that of an isotropic material.
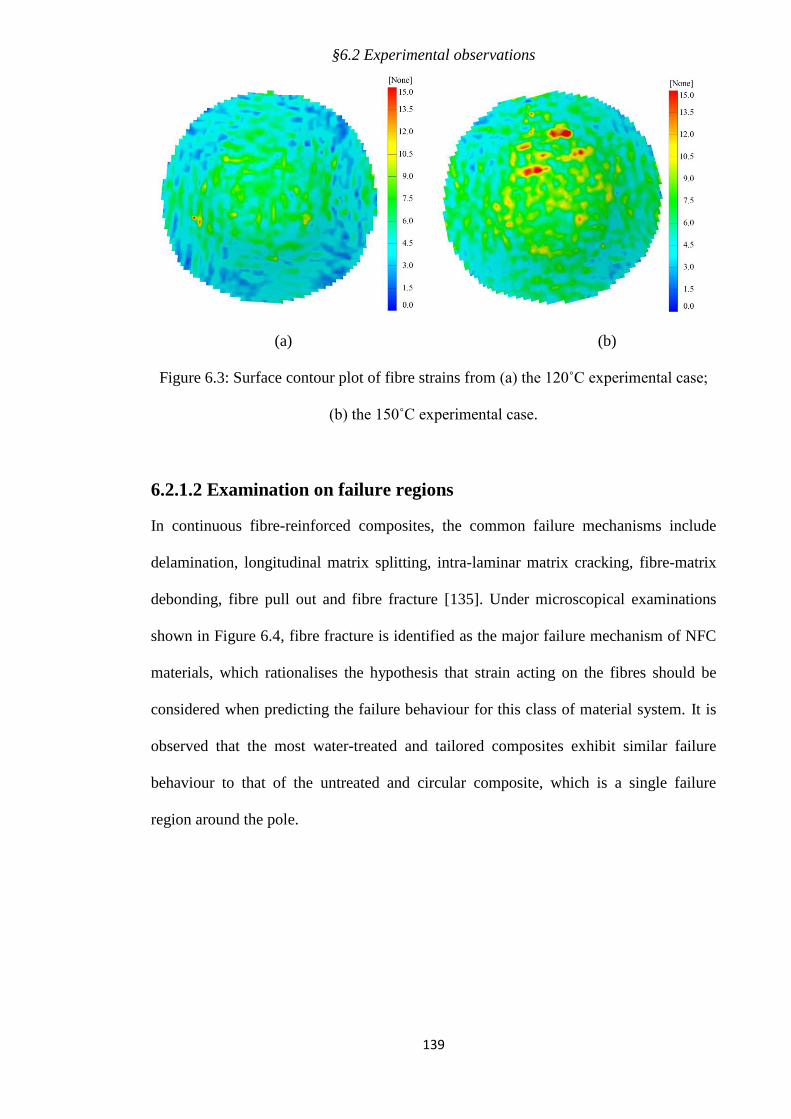
§6.2 Experimental observations
139
(a) (b)
Figure 6.3: Surface contour plot of fibre strains from (a) the 120˚C experimental case;
(b) the 150˚C experimental case.
6.2.1.2 Examination on failure regions
In continuous fibre-reinforced composites, the common failure mechanisms include
delamination, longitudinal matrix splitting, intra-laminar matrix cracking, fibre-matrix
debonding, fibre pull out and fibre fracture [135]. Under microscopical examinations
shown in Figure 6.4, fibre fracture is identified as the major failure mechanism of NFC
materials, which rationalises the hypothesis that strain acting on the fibres should be
considered when predicting the failure behaviour for this class of material system. It is
observed that the most water-treated and tailored composites exhibit similar failure
behaviour to that of the untreated and circular composite, which is a single failure
region around the pole.
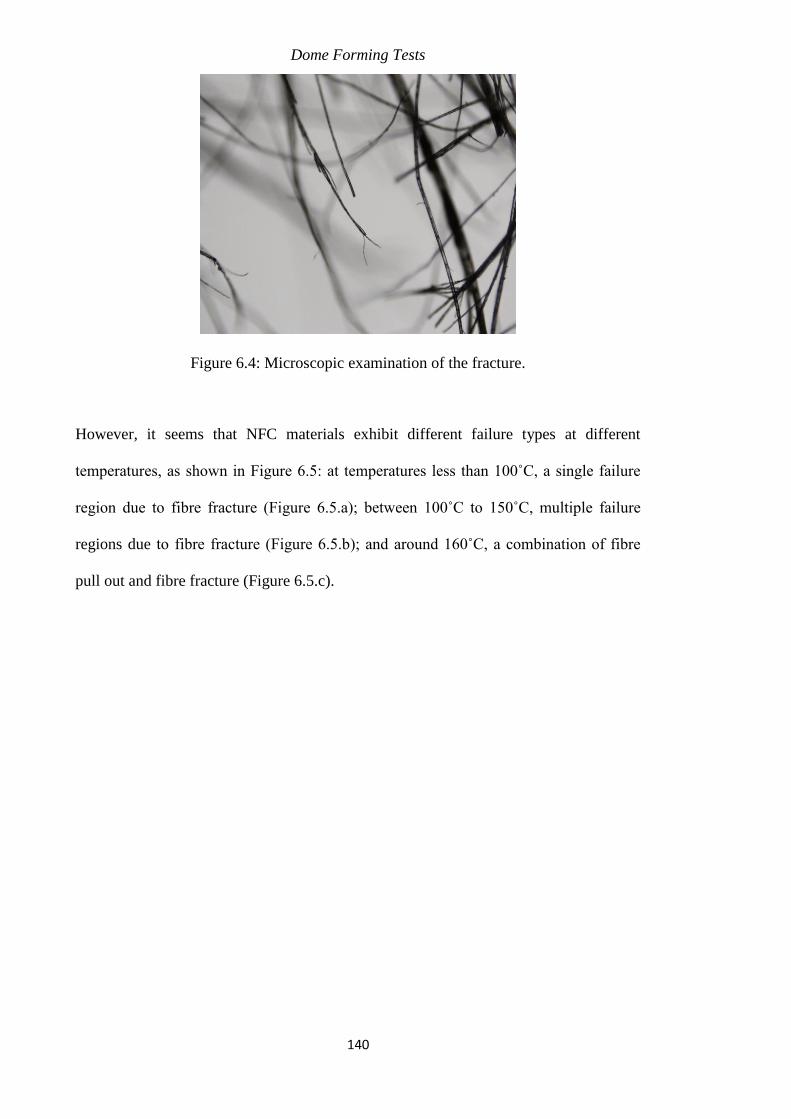
Dome Forming Tests
140
Figure 6.4: Microscopic examination of the fracture.
However, it seems that NFC materials exhibit different failure types at different
temperatures, as shown in Figure 6.5: at temperatures less than 100˚C, a single failure
region due to fibre fracture (Figure 6.5.a); between 100˚C to 150˚C, multiple failure
regions due to fibre fracture (Figure 6.5.b); and around 160˚C, a combination of fibre
pull out and fibre fracture (Figure 6.5.c).
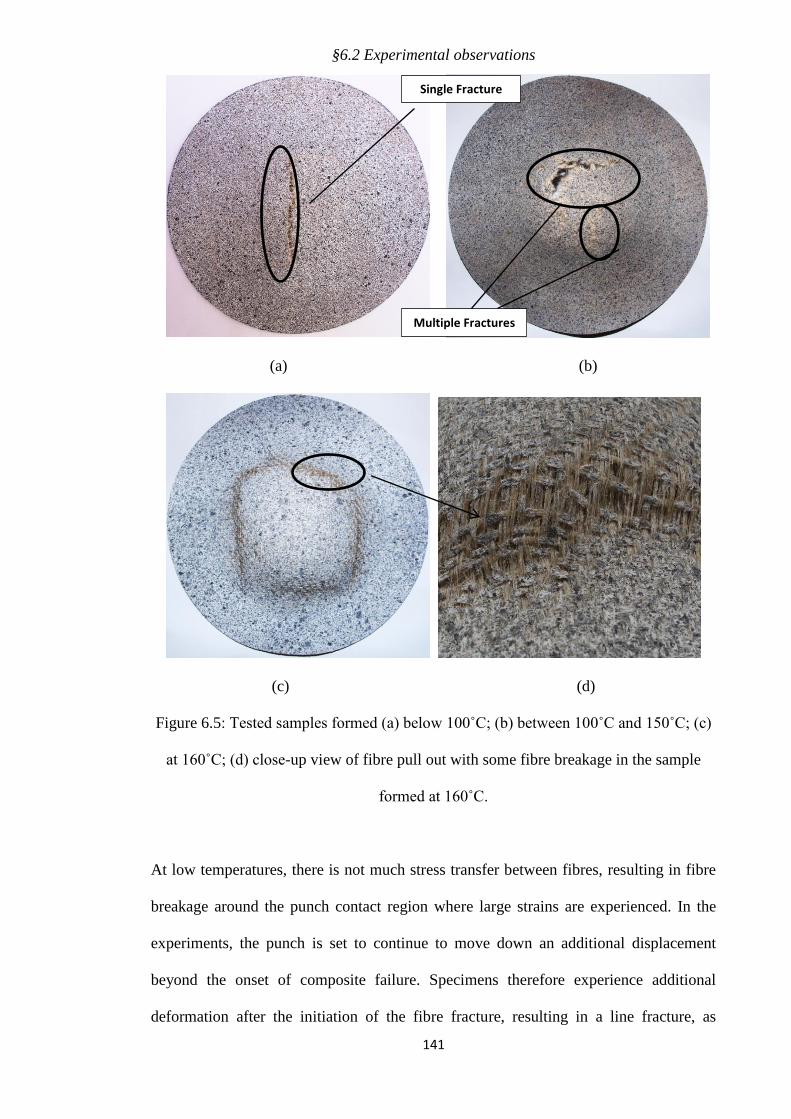
§6.2 Experimental observations
141
(a) (b)
(c) (d)
Figure 6.5: Tested samples formed (a) below 100˚C; (b) between 100˚C and 150˚C; (c)
at 160˚C; (d) close-up view of fibre pull out with some fibre breakage in the sample
formed at 160˚C.
At low temperatures, there is not much stress transfer between fibres, resulting in fibre
breakage around the punch contact region where large strains are experienced. In the
experiments, the punch is set to continue to move down an additional displacement
beyond the onset of composite failure. Specimens therefore experience additional
deformation after the initiation of the fibre fracture, resulting in a line fracture, as
Single Fracture
Multiple Fractures
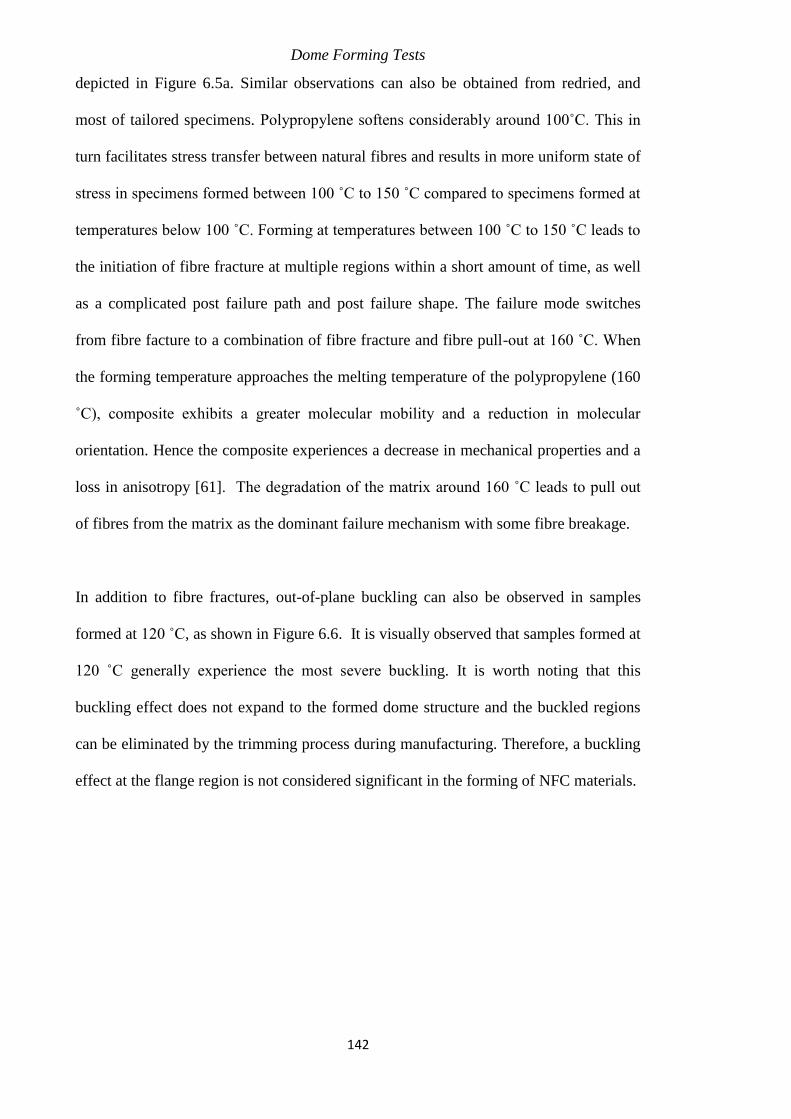
Dome Forming Tests
142
depicted in Figure 6.5a. Similar observations can also be obtained from redried, and
most of tailored specimens. Polypropylene softens considerably around 100˚C. This in
turn facilitates stress transfer between natural fibres and results in more uniform state of
stress in specimens formed between 100 ˚C to 150 ˚C compared to specimens formed at
temperatures below 100 ˚C. Forming at temperatures between 100 ˚C to 150 ˚C leads to
the initiation of fibre fracture at multiple regions within a short amount of time, as well
as a complicated post failure path and post failure shape. The failure mode switches
from fibre facture to a combination of fibre fracture and fibre pull-out at 160 ˚C. When
the forming temperature approaches the melting temperature of the polypropylene (160
˚C), composite exhibits a greater molecular mobility and a reduction in molecular
orientation. Hence the composite experiences a decrease in mechanical properties and a
loss in anisotropy [61]. The degradation of the matrix around 160 ˚C leads to pull out
of fibres from the matrix as the dominant failure mechanism with some fibre breakage.
In addition to fibre fractures, out-of-plane buckling can also be observed in samples
formed at 120 ˚C, as shown in Figure 6.6. It is visually observed that samples formed at
120 ˚C generally experience the most severe buckling. It is worth noting that this
buckling effect does not expand to the formed dome structure and the buckled regions
can be eliminated by the trimming process during manufacturing. Therefore, a buckling
effect at the flange region is not considered significant in the forming of NFC materials.
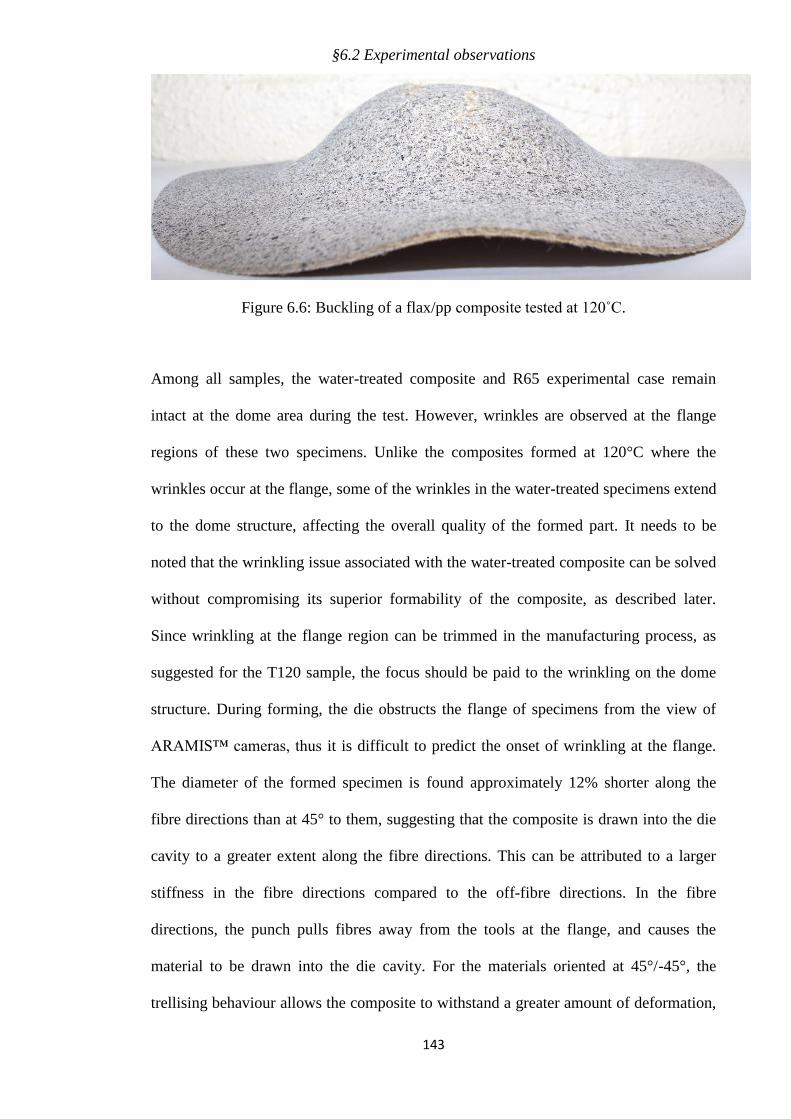
§6.2 Experimental observations
143
Figure 6.6: Buckling of a flax/pp composite tested at 120˚C.
Among all samples, the water-treated composite and R65 experimental case remain
intact at the dome area during the test. However, wrinkles are observed at the flange
regions of these two specimens. Unlike the composites formed at 120°C where the
wrinkles occur at the flange, some of the wrinkles in the water-treated specimens extend
to the dome structure, affecting the overall quality of the formed part. It needs to be
noted that the wrinkling issue associated with the water-treated composite can be solved
without compromising its superior formability of the composite, as described later.
Since wrinkling at the flange region can be trimmed in the manufacturing process, as
suggested for the T120 sample, the focus should be paid to the wrinkling on the dome
structure. During forming, the die obstructs the flange of specimens from the view of
ARAMIS™ cameras, thus it is difficult to predict the onset of wrinkling at the flange.
The diameter of the formed specimen is found approximately 12% shorter along the
fibre directions than at 45° to them, suggesting that the composite is drawn into the die
cavity to a greater extent along the fibre directions. This can be attributed to a larger
stiffness in the fibre directions compared to the off-fibre directions. In the fibre
directions, the punch pulls fibres away from the tools at the flange, and causes the
material to be drawn into the die cavity. For the materials oriented at 45°/-45°, the
trellising behaviour allows the composite to withstand a greater amount of deformation,
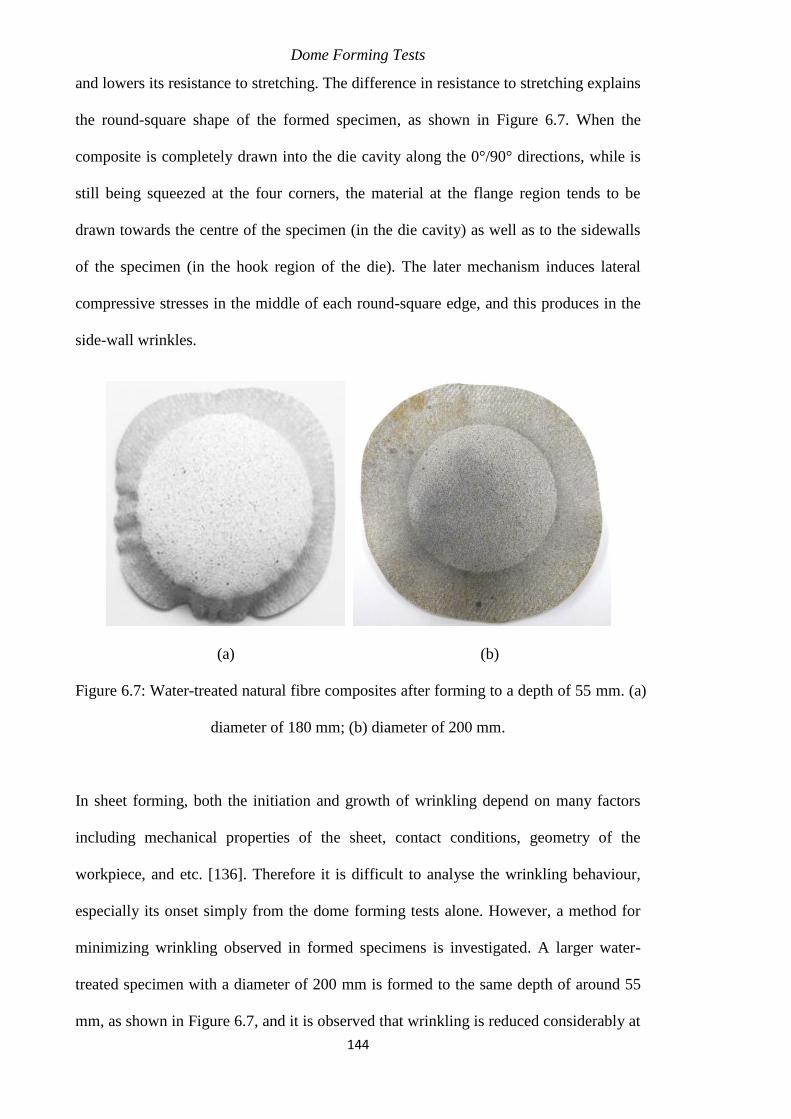
Dome Forming Tests
144
and lowers its resistance to stretching. The difference in resistance to stretching explains
the round-square shape of the formed specimen, as shown in Figure 6.7. When the
composite is completely drawn into the die cavity along the 0°/90° directions, while is
still being squeezed at the four corners, the material at the flange region tends to be
drawn towards the centre of the specimen (in the die cavity) as well as to the sidewalls
of the specimen (in the hook region of the die). The later mechanism induces lateral
compressive stresses in the middle of each round-square edge, and this produces in the
side-wall wrinkles.
(a) (b)
Figure 6.7: Water-treated natural fibre composites after forming to a depth of 55 mm. (a)
diameter of 180 mm; (b) diameter of 200 mm.
In sheet forming, both the initiation and growth of wrinkling depend on many factors
including mechanical properties of the sheet, contact conditions, geometry of the
workpiece, and etc. [136]. Therefore it is difficult to analyse the wrinkling behaviour,
especially its onset simply from the dome forming tests alone. However, a method for
minimizing wrinkling observed in formed specimens is investigated. A larger water-
treated specimen with a diameter of 200 mm is formed to the same depth of around 55
mm, as shown in Figure 6.7, and it is observed that wrinkling is reduced considerably at
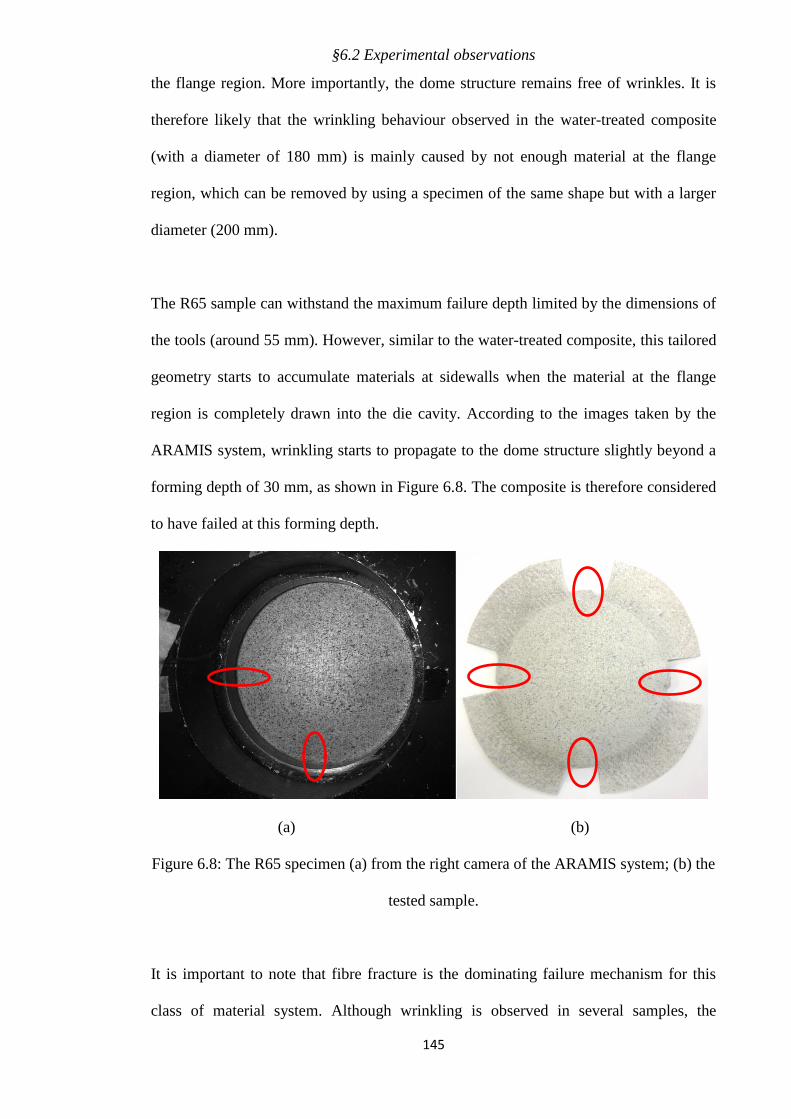
§6.2 Experimental observations
145
the flange region. More importantly, the dome structure remains free of wrinkles. It is
therefore likely that the wrinkling behaviour observed in the water-treated composite
(with a diameter of 180 mm) is mainly caused by not enough material at the flange
region, which can be removed by using a specimen of the same shape but with a larger
diameter (200 mm).
The R65 sample can withstand the maximum failure depth limited by the dimensions of
the tools (around 55 mm). However, similar to the water-treated composite, this tailored
geometry starts to accumulate materials at sidewalls when the material at the flange
region is completely drawn into the die cavity. According to the images taken by the
ARAMIS system, wrinkling starts to propagate to the dome structure slightly beyond a
forming depth of 30 mm, as shown in Figure 6.8. The composite is therefore considered
to have failed at this forming depth.
(a) (b)
Figure 6.8: The R65 specimen (a) from the right camera of the ARAMIS system; (b) the
tested sample.
It is important to note that fibre fracture is the dominating failure mechanism for this
class of material system. Although wrinkling is observed in several samples, the
Dome Forming Tests
146
wrinkling effect is not considered as the major failure mode. Because it can either be
removed from trimming process (the T120 sample), or eliminated by using a larger
sample geometry (the water-treated sample). For tailored shapes, the failure mode
would switch from fibre fracture to wrinkling when the inner radius is reduced to 65
mm, as a result of less amount of material to be stretched at the flange region.
6.2.1.3 Effect of treatments on forming modes
Increased formability of a treated NFC is expected because of the increase in ductility.
This section investigates whether there any other mechanisms exist besides the increase
in elongation-to-failure. The forming modes experienced by a composite can be
illustrated by its FLD. The use of the ARAMIS™ system facilitates surface strain
measurements which can provide insights into the forming behaviour of composites at
each time step of the forming process. Strain distributions over the entire surface can be
compared using FLD. All strain distributions can be enveloped by strain ratios of -1,
and 1, which is anticipated in typical dome forming experiments.
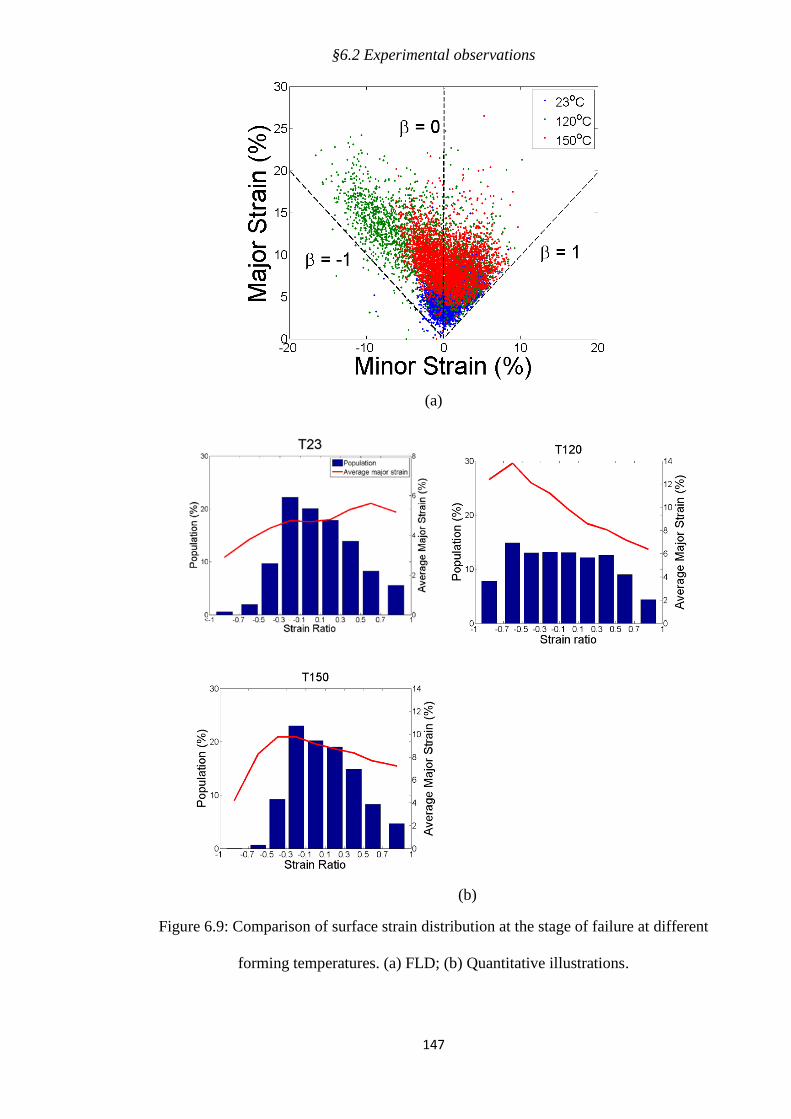
§6.2 Experimental observations
147
(a)
(b)
Figure 6.9: Comparison of surface strain distribution at the stage of failure at different
forming temperatures. (a) FLD; (b) Quantitative illustrations.
Dome Forming Tests
148
Figure 6.9 shows the surface strain distributions of samples tested at 23˚C, 120˚C and
150˚C, respectively at the stage just prior to failure. It shows that forming at room
temperature results in the least amount of formability in terms of forming depth. Around
120˚C is shown to be the optimal temperature window for forming flax/pp composites.
When the forming temperature is increased to 150 ˚C, a significant reduction in shear
deformation is observed as a result of the thermal degradation of the composite.
At ambient temperature, surface strain is mainly distributed as biaxial stretch and plain
strain. When the polypropylene matrix is not soft, the composite exhibits an
insignificant amount of shear deformation. Flax/pp composites have a much higher
failure strain in the shear direction than in the fibre direction. Less than 5% of the
surface points have a strain ratio less than -0.5, and the strain deformation in the shear
direction is also much lower than in other deformation modes. The insignificant shear
deformation at low temperature forming can be attributed to the low forming depths. By
increasing the forming temperature to 120˚C, there is a significant increase (from less
than 5% to approximately 25%) in the number of surface points experiencing the
deformation mode of pure shear. In addition, at high temperatures strain deformation in
the shear direction is also higher than that in other deformation modes. These
observations suggest there is a change in major deformation modes when forming
occurs at high temperatures. The effect of temperature is much more substantial in
regions not in contact with the punch (regions experiencing forming modes of plane
strain and pure shear) than in punch contact regions (regions experiencing biaxial
stretch). This phenomenon suggests that at elevated temperatures, greater forming
depths are permitted due to additional deformation in unsupported regions.
§6.2 Experimental observations
149
Compared to T120, there is a significant reduction in shear deformation for the samples
formed at 150˚C. This in turn leads to a significant drop in forming depth. The drop in
shear deformation can be attributed to the degradation of the composite, leading to the
conclusion that by allowing the shear deformation to be the dominant forming mode,
the optimal formability can be achieved for this class of composite materials. Even
though both the T23 and T150 samples share a very similar population distribution, the
latter sample experiences much higher strain values in almost every deformation mode.
Again, the reasons are the significantly reduced stiffness and the behaviour closer to
isotropic material system.
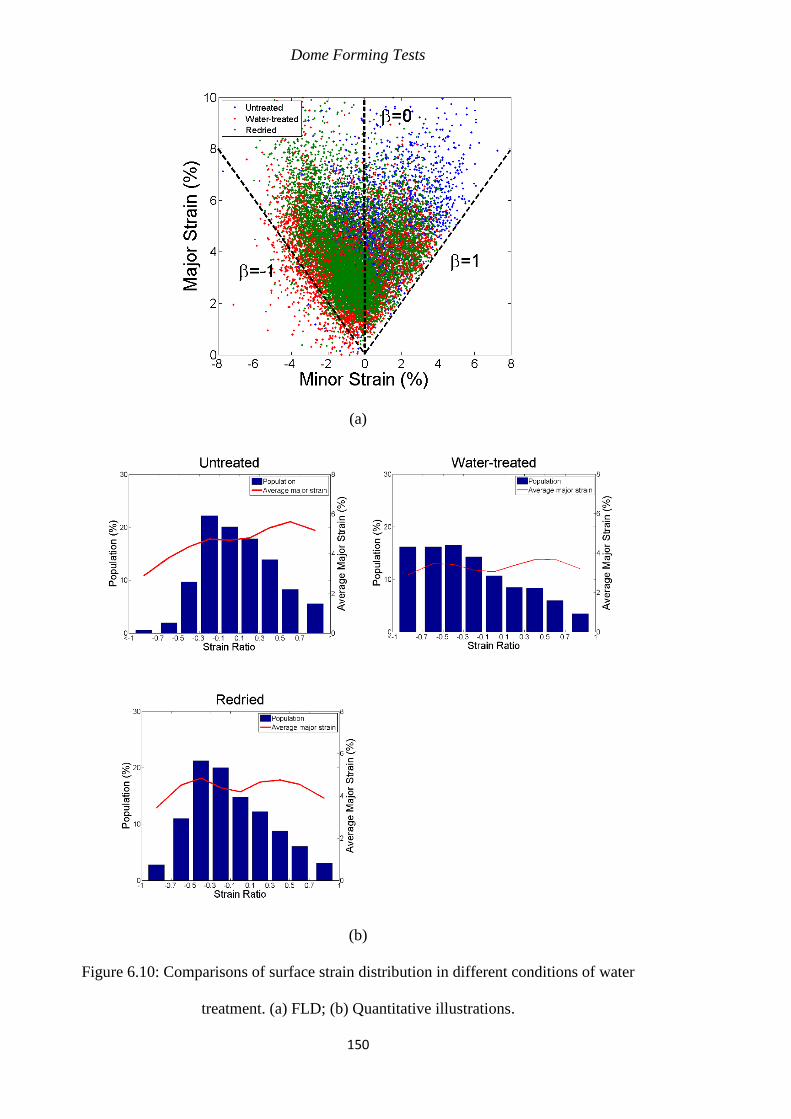
Dome Forming Tests
150
(a)
(b)
Figure 6.10: Comparisons of surface strain distribution in different conditions of water
treatment. (a) FLD; (b) Quantitative illustrations.
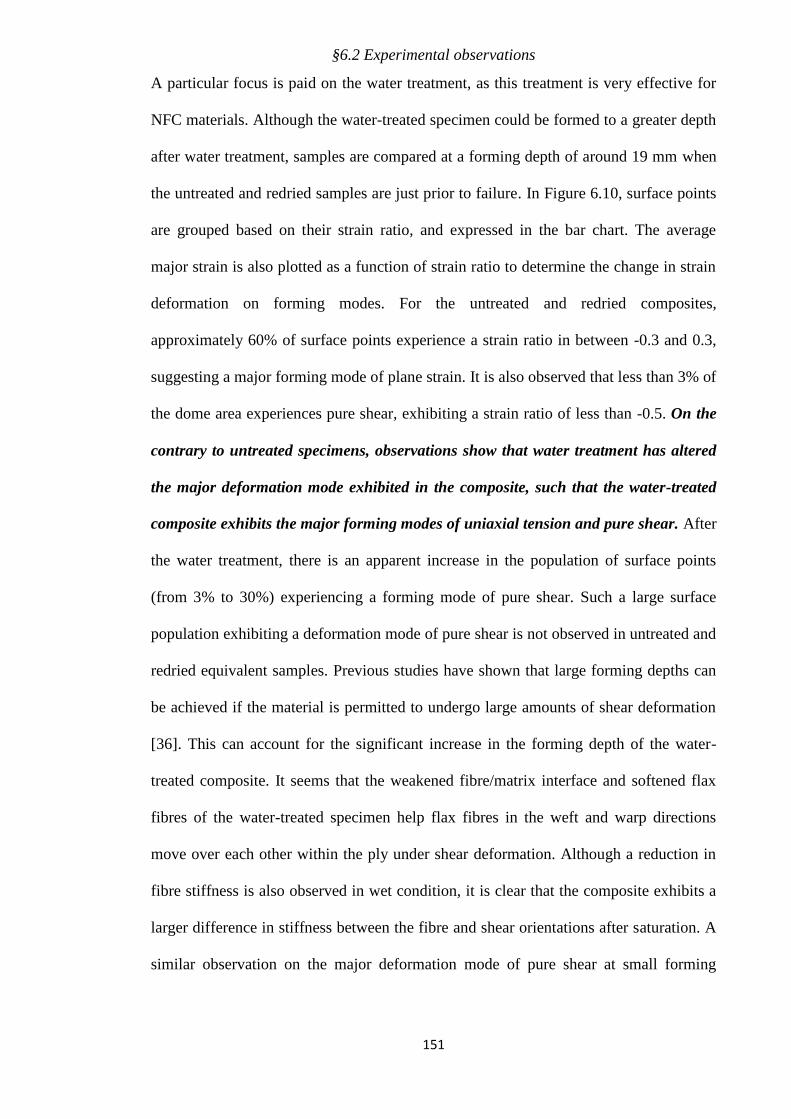
§6.2 Experimental observations
151
A particular focus is paid on the water treatment, as this treatment is very effective for
NFC materials. Although the water-treated specimen could be formed to a greater depth
after water treatment, samples are compared at a forming depth of around 19 mm when
the untreated and redried samples are just prior to failure. In Figure 6.10, surface points
are grouped based on their strain ratio, and expressed in the bar chart. The average
major strain is also plotted as a function of strain ratio to determine the change in strain
deformation on forming modes. For the untreated and redried composites,
approximately 60% of surface points experience a strain ratio in between -0.3 and 0.3,
suggesting a major forming mode of plane strain. It is also observed that less than 3% of
the dome area experiences pure shear, exhibiting a strain ratio of less than -0.5. On the
contrary to untreated specimens, observations show that water treatment has altered
the major deformation mode exhibited in the composite, such that the water-treated
composite exhibits the major forming modes of uniaxial tension and pure shear. After
the water treatment, there is an apparent increase in the population of surface points
(from 3% to 30%) experiencing a forming mode of pure shear. Such a large surface
population exhibiting a deformation mode of pure shear is not observed in untreated and
redried equivalent samples. Previous studies have shown that large forming depths can
be achieved if the material is permitted to undergo large amounts of shear deformation
[36]. This can account for the significant increase in the forming depth of the water-
treated composite. It seems that the weakened fibre/matrix interface and softened flax
fibres of the water-treated specimen help flax fibres in the weft and warp directions
move over each other within the ply under shear deformation. Although a reduction in
fibre stiffness is also observed in wet condition, it is clear that the composite exhibits a
larger difference in stiffness between the fibre and shear orientations after saturation. A
similar observation on the major deformation mode of pure shear at small forming
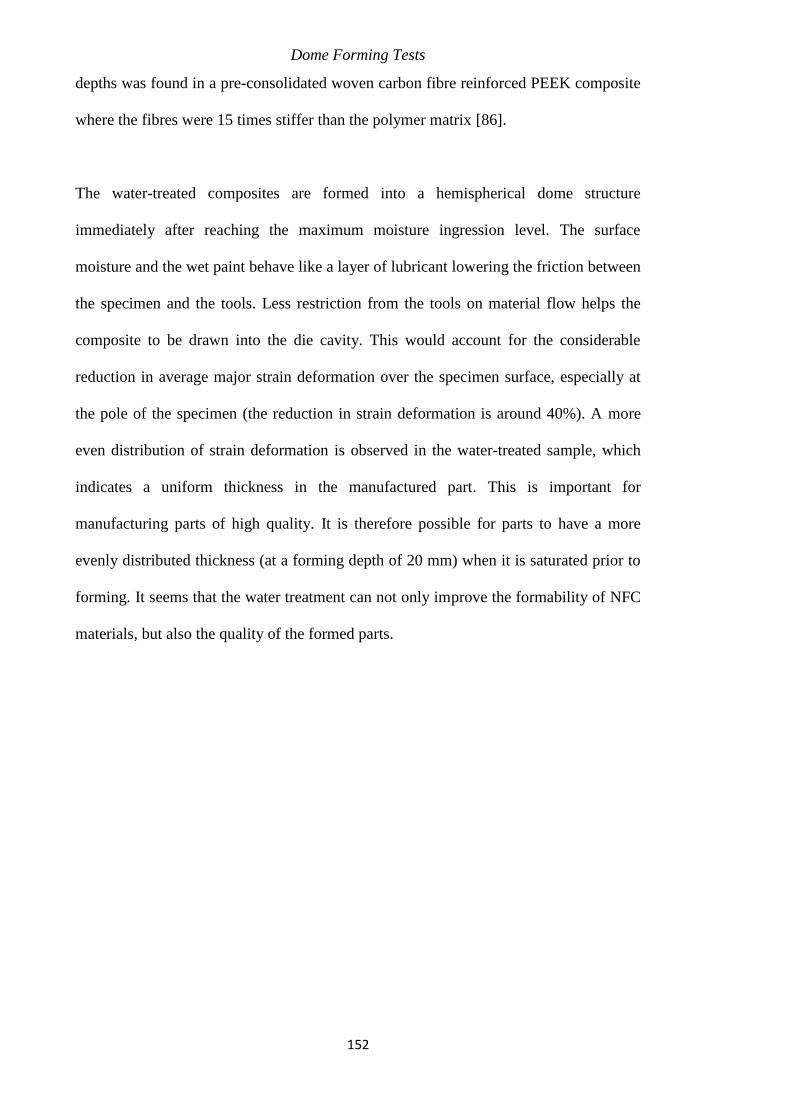
Dome Forming Tests
152
depths was found in a pre-consolidated woven carbon fibre reinforced PEEK composite
where the fibres were 15 times stiffer than the polymer matrix [86].
The water-treated composites are formed into a hemispherical dome structure
immediately after reaching the maximum moisture ingression level. The surface
moisture and the wet paint behave like a layer of lubricant lowering the friction between
the specimen and the tools. Less restriction from the tools on material flow helps the
composite to be drawn into the die cavity. This would account for the considerable
reduction in average major strain deformation over the specimen surface, especially at
the pole of the specimen (the reduction in strain deformation is around 40%). A more
even distribution of strain deformation is observed in the water-treated sample, which
indicates a uniform thickness in the manufactured part. This is important for
manufacturing parts of high quality. It is therefore possible for parts to have a more
evenly distributed thickness (at a forming depth of 20 mm) when it is saturated prior to
forming. It seems that the water treatment can not only improve the formability of NFC
materials, but also the quality of the formed parts.
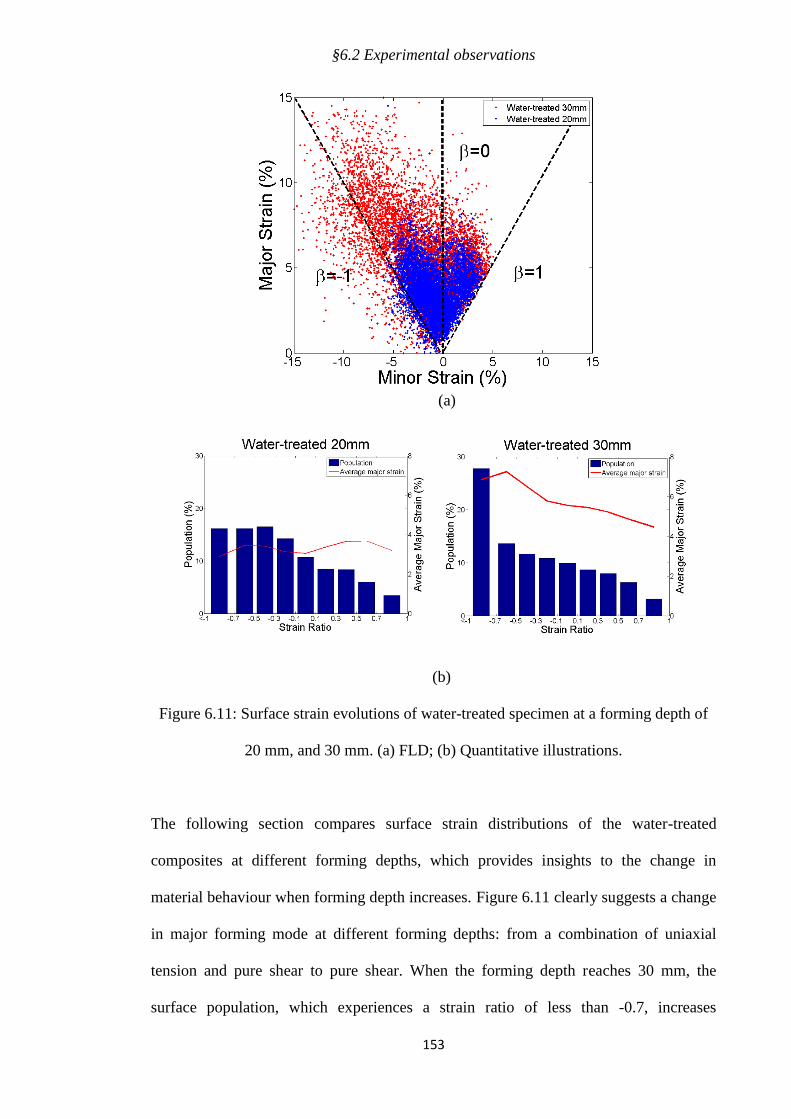
§6.2 Experimental observations
153
(a)
(b)
Figure 6.11: Surface strain evolutions of water-treated specimen at a forming depth of
20 mm, and 30 mm. (a) FLD; (b) Quantitative illustrations.
The following section compares surface strain distributions of the water-treated
composites at different forming depths, which provides insights to the change in
material behaviour when forming depth increases. Figure 6.11 clearly suggests a change
in major forming mode at different forming depths: from a combination of uniaxial
tension and pure shear to pure shear. When the forming depth reaches 30 mm, the
surface population, which experiences a strain ratio of less than -0.7, increases
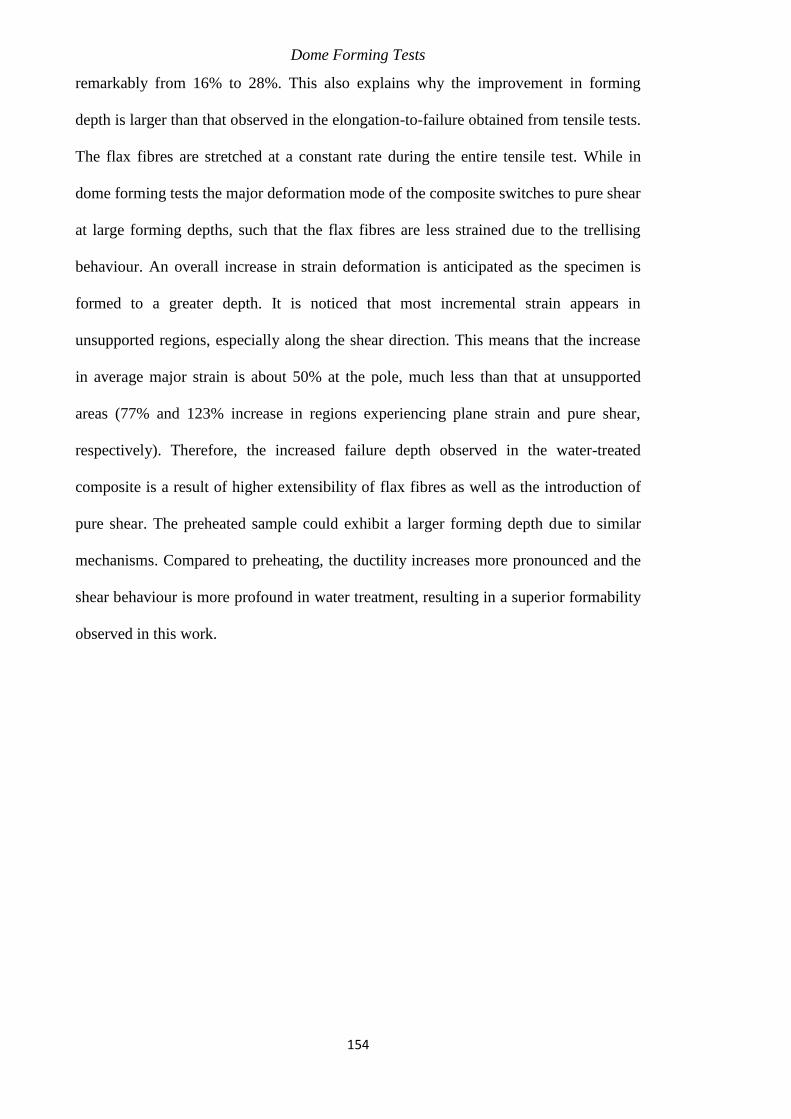
Dome Forming Tests
154
remarkably from 16% to 28%. This also explains why the improvement in forming
depth is larger than that observed in the elongation-to-failure obtained from tensile tests.
The flax fibres are stretched at a constant rate during the entire tensile test. While in
dome forming tests the major deformation mode of the composite switches to pure shear
at large forming depths, such that the flax fibres are less strained due to the trellising
behaviour. An overall increase in strain deformation is anticipated as the specimen is
formed to a greater depth. It is noticed that most incremental strain appears in
unsupported regions, especially along the shear direction. This means that the increase
in average major strain is about 50% at the pole, much less than that at unsupported
areas (77% and 123% increase in regions experiencing plane strain and pure shear,
respectively). Therefore, the increased failure depth observed in the water-treated
composite is a result of higher extensibility of flax fibres as well as the introduction of
pure shear. The preheated sample could exhibit a larger forming depth due to similar
mechanisms. Compared to preheating, the ductility increases more pronounced and the
shear behaviour is more profound in water treatment, resulting in a superior formability
observed in this work.
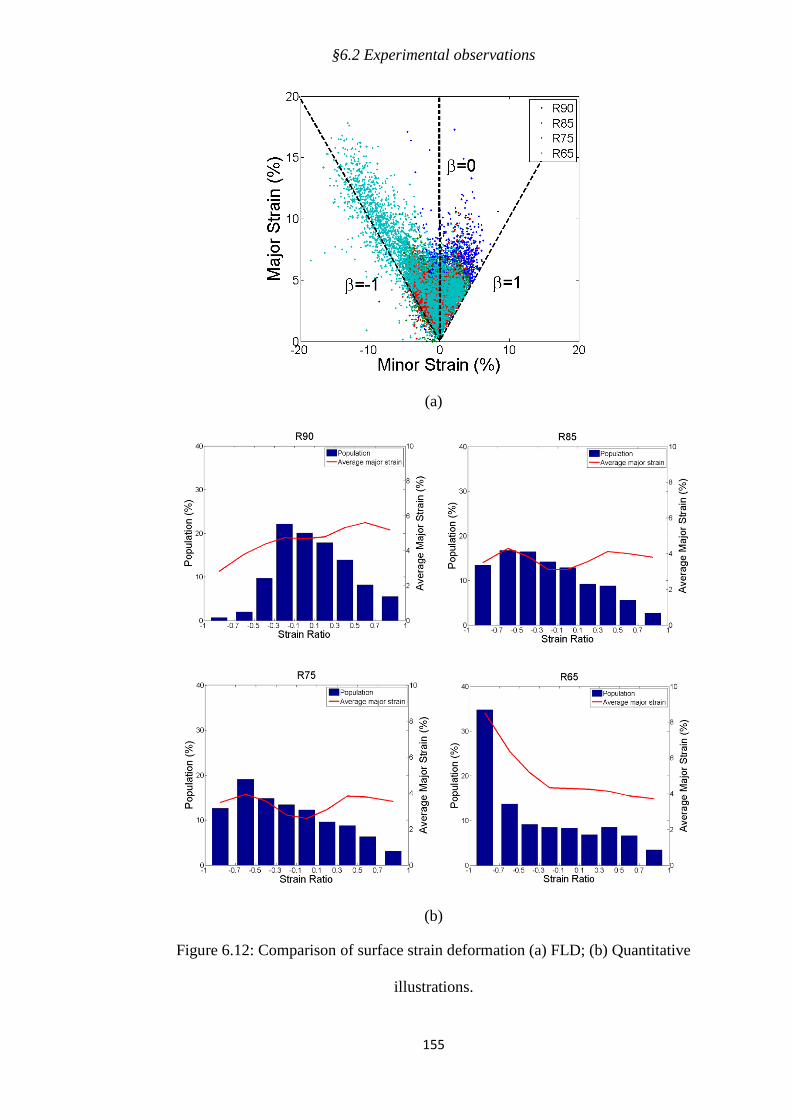
§6.2 Experimental observations
155
(a)
(b)
Figure 6.12: Comparison of surface strain deformation (a) FLD; (b) Quantitative
illustrations.
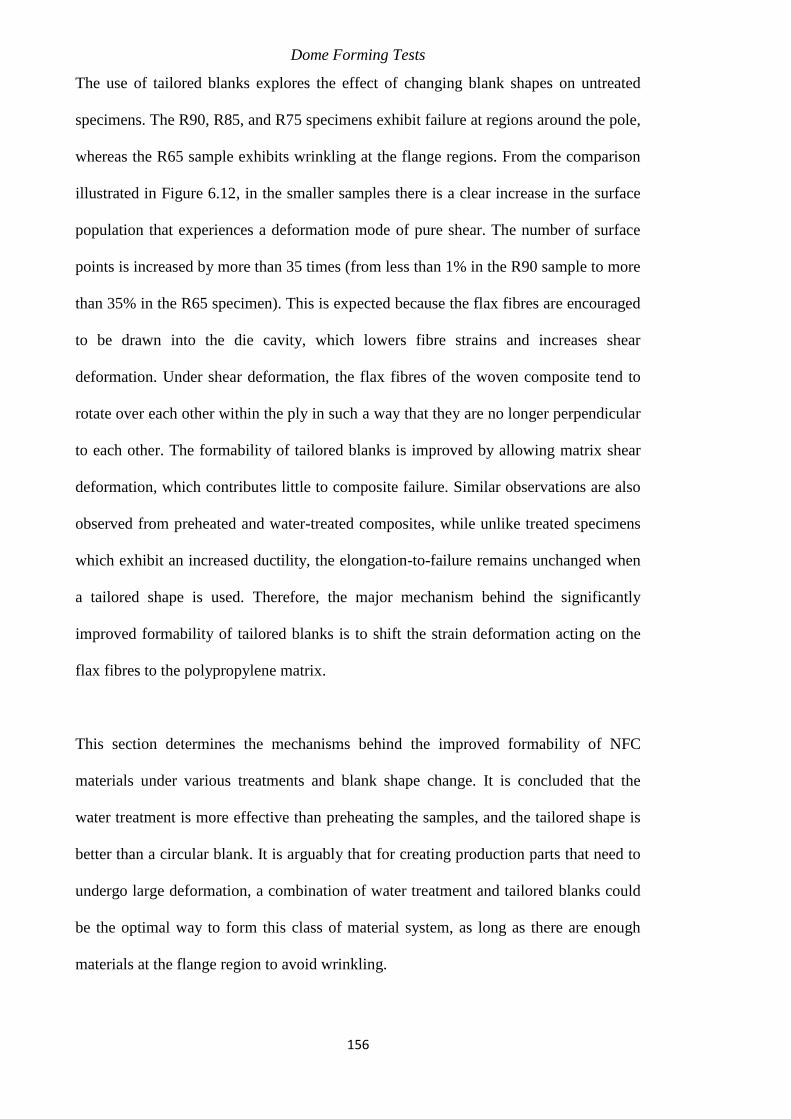
Dome Forming Tests
156
The use of tailored blanks explores the effect of changing blank shapes on untreated
specimens. The R90, R85, and R75 specimens exhibit failure at regions around the pole,
whereas the R65 sample exhibits wrinkling at the flange regions. From the comparison
illustrated in Figure 6.12, in the smaller samples there is a clear increase in the surface
population that experiences a deformation mode of pure shear. The number of surface
points is increased by more than 35 times (from less than 1% in the R90 sample to more
than 35% in the R65 specimen). This is expected because the flax fibres are encouraged
to be drawn into the die cavity, which lowers fibre strains and increases shear
deformation. Under shear deformation, the flax fibres of the woven composite tend to
rotate over each other within the ply in such a way that they are no longer perpendicular
to each other. The formability of tailored blanks is improved by allowing matrix shear
deformation, which contributes little to composite failure. Similar observations are also
observed from preheated and water-treated composites, while unlike treated specimens
which exhibit an increased ductility, the elongation-to-failure remains unchanged when
a tailored shape is used. Therefore, the major mechanism behind the significantly
improved formability of tailored blanks is to shift the strain deformation acting on the
flax fibres to the polypropylene matrix.
This section determines the mechanisms behind the improved formability of NFC
materials under various treatments and blank shape change. It is concluded that the
water treatment is more effective than preheating the samples, and the tailored shape is
better than a circular blank. It is arguably that for creating production parts that need to
undergo large deformation, a combination of water treatment and tailored blanks could
be the optimal way to form this class of material system, as long as there are enough
materials at the flange region to avoid wrinkling.
§6.2 Experimental observations
157
6.2.2 CNFC materials
The previous section has shown the influence of the treatments and tailored blanks on
forming behaviour of NFC materials, and this section studies whether such observations
can be obtained in CNFC materials.
6.2.2.1 Failure depth in dome forming tests
It is concluded that the significantly improved elongation-to-failure makes it is very
advantageous to process CNFC materials in the wet condition. It is therefore important
to determine if such an increase in formability can also be achieved in dome forming
tests. For CNFC materials, strain concentration is observed prior to catastrophic failure,
and the material is considered to fail at the onset of strain concentration. Details of this
are described later.
Figure 6.13: Comparison of the forming depths of CNFC materials, at the onset of strain
concentration (white bars) and at catastrophic failure (yellow bars).
Figure 6.13 compares the forming depths of the composite in three different conditions
of water treatment (untreated, water-treated and redried), as well as that of the
Dome Forming Tests
158
composite formed at the optimal forming temperature (T130) and that of the composite
formed at the optimal tailored shape (R75). From tensile tests, it is anticipated samples
in the dry conditions (untreated and redried) will exhibit almost identical forming
depths in dome forming tests. Water treatment is much more effective than the
traditional method in terms of improving formability, as the water-treated composite
exhibits a much larger forming depth compared to the preheated equivalent sample. The
effect of the traditional treatment, preheating, is very limited for CNFC materials for
two reasons. Firstly, even though the composite can be stretched to a greater extent at
high temperatures, this improvement is affected in dome forming tests by the reduced
stiffness. Secondly, the material starts to degrade when the forming temperature
approaches the melting temperature of the polypropylene matrix. The failure depth of
the preheated composite (formed at the optimal temperature window of around 130 °C)
is compared with the failure depths of the water-treated samples.
After water treatment, dome forming tests show that there is a better correlation
between the increase in forming depths during dome forming tests and from the
elongation-to-failure obtained in tensile tests, and such increase cannot be achieved
using preheated samples. A reduction in stiffness is noticed for both preheated and
water-treated composites. The water-treated composites are painted and then formed
immediately after reaching the maximum saturation level of the water solution, and the
surface moisture at the flange region lowers friction between the specimen and the tools
(the blank-holder and the die). Due to this effect, the amount of additional strain caused
by reduced stiffness is lowered, resulting in a closer correlation between the increase in
failure depths in dome forming tests and the improvement in the elongation-to-failure. It
needs to be noted that the amount of improvement in elongation-to-failure still cannot
be entirely mirrored in failure depths. Unlike NFC materials, the application of tailored
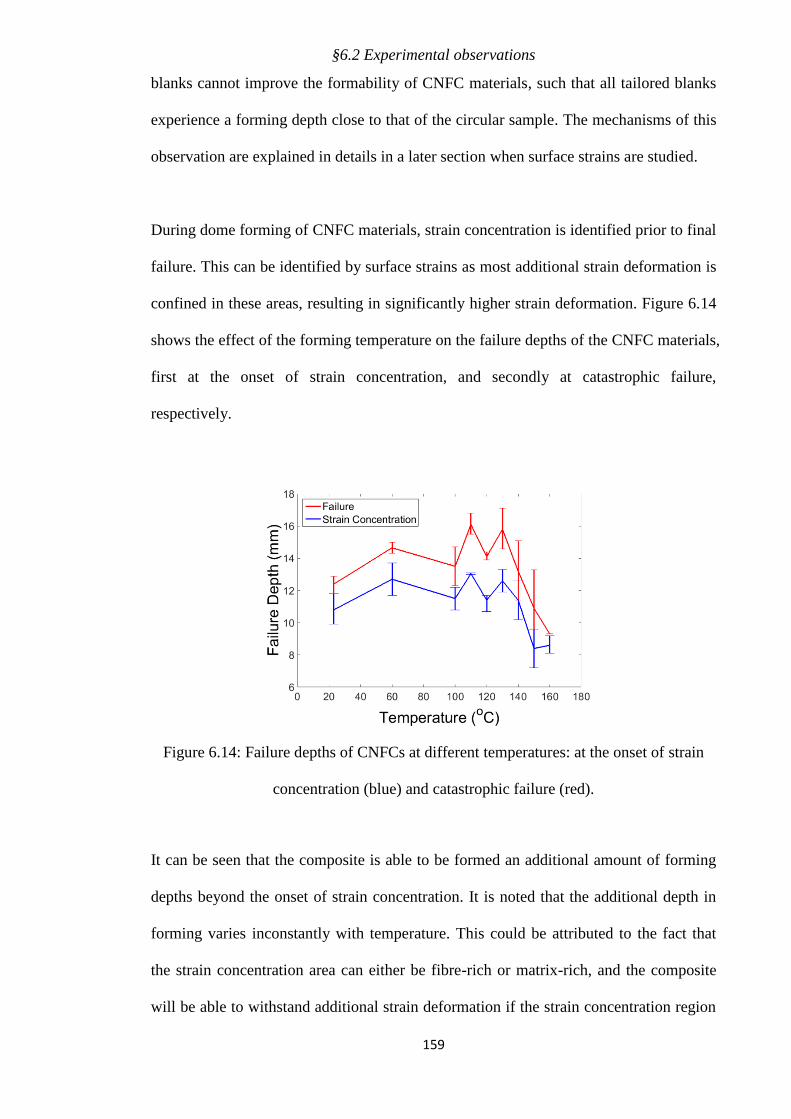
§6.2 Experimental observations
159
blanks cannot improve the formability of CNFC materials, such that all tailored blanks
experience a forming depth close to that of the circular sample. The mechanisms of this
observation are explained in details in a later section when surface strains are studied.
During dome forming of CNFC materials, strain concentration is identified prior to final
failure. This can be identified by surface strains as most additional strain deformation is
confined in these areas, resulting in significantly higher strain deformation. Figure 6.14
shows the effect of the forming temperature on the failure depths of the CNFC materials,
first at the onset of strain concentration, and secondly at catastrophic failure,
respectively.
Figure 6.14: Failure depths of CNFCs at different temperatures: at the onset of strain
concentration (blue) and catastrophic failure (red).
It can be seen that the composite is able to be formed an additional amount of forming
depths beyond the onset of strain concentration. It is noted that the additional depth in
forming varies inconstantly with temperature. This could be attributed to the fact that
the strain concentration area can either be fibre-rich or matrix-rich, and the composite
will be able to withstand additional strain deformation if the strain concentration region
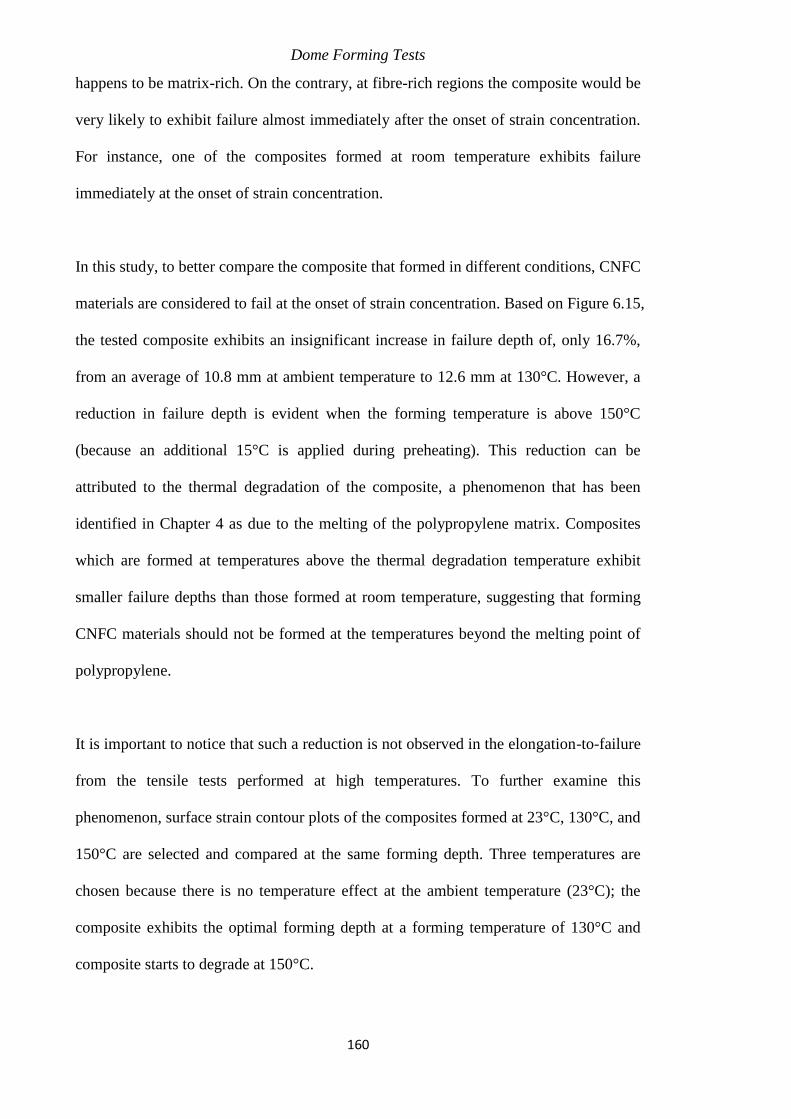
Dome Forming Tests
160
happens to be matrix-rich. On the contrary, at fibre-rich regions the composite would be
very likely to exhibit failure almost immediately after the onset of strain concentration.
For instance, one of the composites formed at room temperature exhibits failure
immediately at the onset of strain concentration.
In this study, to better compare the composite that formed in different conditions, CNFC
materials are considered to fail at the onset of strain concentration. Based on Figure 6.15,
the tested composite exhibits an insignificant increase in failure depth of, only 16.7%,
from an average of 10.8 mm at ambient temperature to 12.6 mm at 130°C. However, a
reduction in failure depth is evident when the forming temperature is above 150°C
(because an additional 15°C is applied during preheating). This reduction can be
attributed to the thermal degradation of the composite, a phenomenon that has been
identified in Chapter 4 as due to the melting of the polypropylene matrix. Composites
which are formed at temperatures above the thermal degradation temperature exhibit
smaller failure depths than those formed at room temperature, suggesting that forming
CNFC materials should not be formed at the temperatures beyond the melting point of
polypropylene.
It is important to notice that such a reduction is not observed in the elongation-to-failure
from the tensile tests performed at high temperatures. To further examine this
phenomenon, surface strain contour plots of the composites formed at 23°C, 130°C, and
150°C are selected and compared at the same forming depth. Three temperatures are
chosen because there is no temperature effect at the ambient temperature (23°C); the
composite exhibits the optimal forming depth at a forming temperature of 130°C and
composite starts to degrade at 150°C.
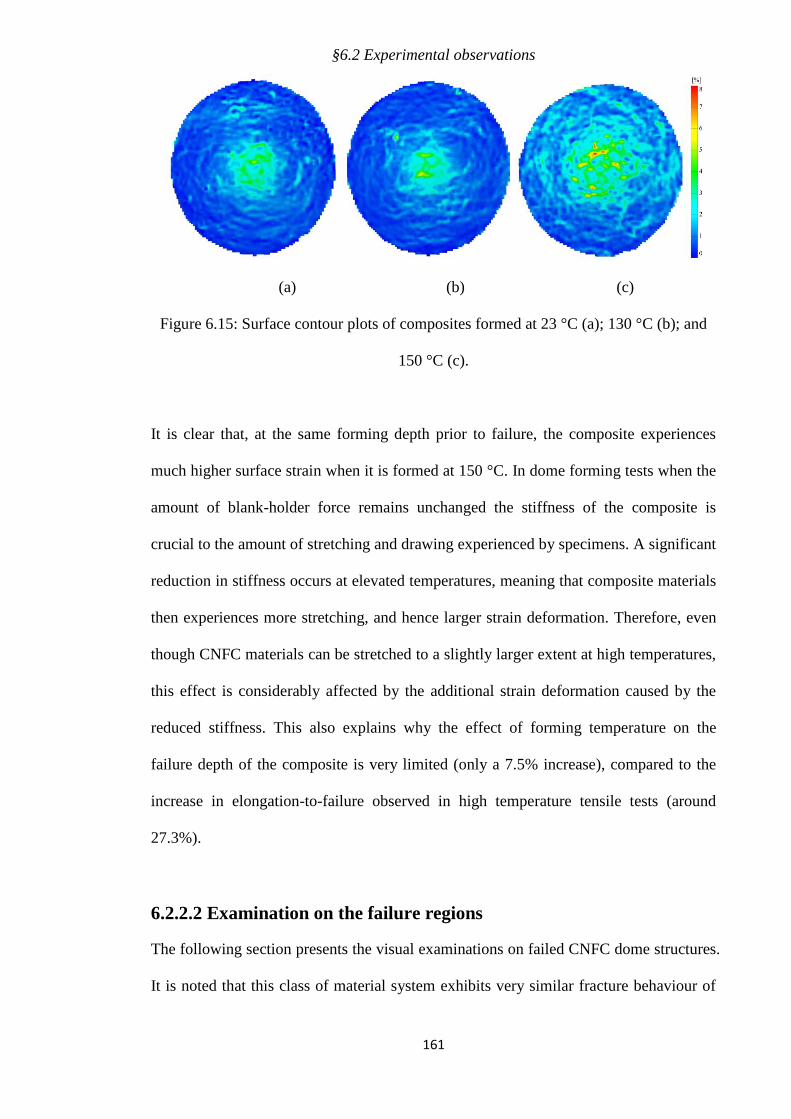
§6.2 Experimental observations
161
(a) (b) (c)
Figure 6.15: Surface contour plots of composites formed at 23 °C (a); 130 °C (b); and
150 °C (c).
It is clear that, at the same forming depth prior to failure, the composite experiences
much higher surface strain when it is formed at 150 °C. In dome forming tests when the
amount of blank-holder force remains unchanged the stiffness of the composite is
crucial to the amount of stretching and drawing experienced by specimens. A significant
reduction in stiffness occurs at elevated temperatures, meaning that composite materials
then experiences more stretching, and hence larger strain deformation. Therefore, even
though CNFC materials can be stretched to a slightly larger extent at high temperatures,
this effect is considerably affected by the additional strain deformation caused by the
reduced stiffness. This also explains why the effect of forming temperature on the
failure depth of the composite is very limited (only a 7.5% increase), compared to the
increase in elongation-to-failure observed in high temperature tensile tests (around
27.3%).
6.2.2.2 Examination on the failure regions
The following section presents the visual examinations on failed CNFC dome structures.
It is noted that this class of material system exhibits very similar fracture behaviour of
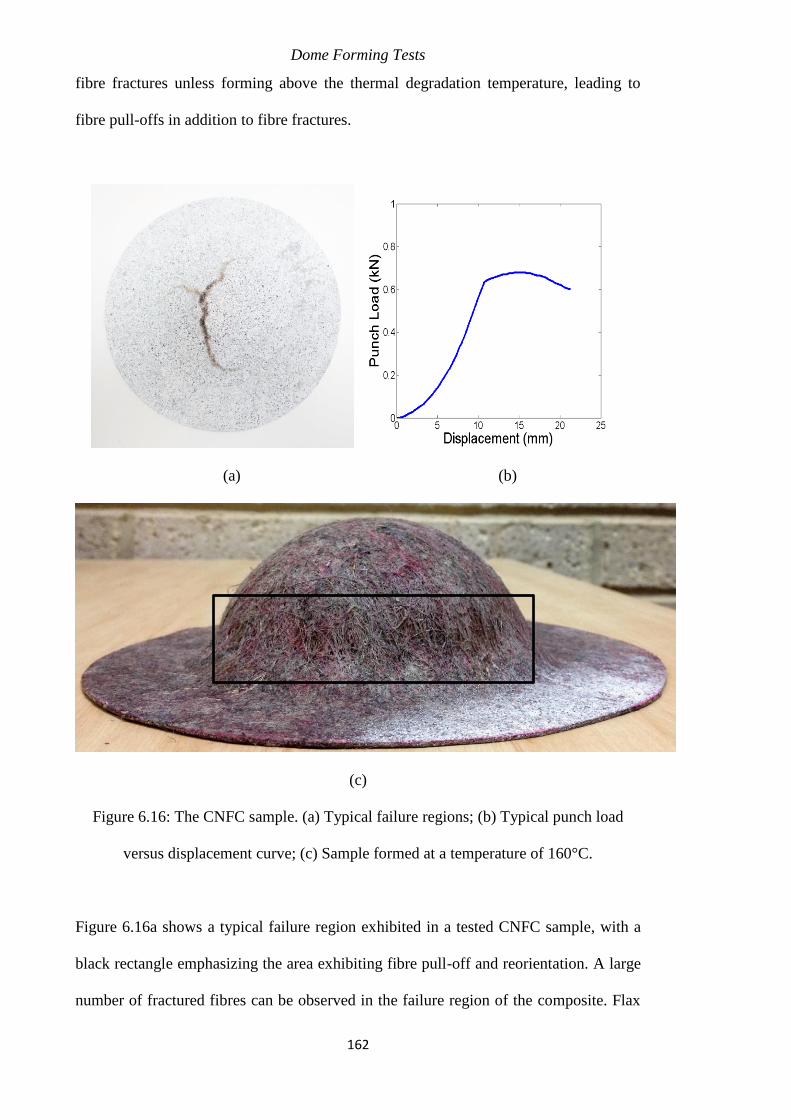
Dome Forming Tests
162
fibre fractures unless forming above the thermal degradation temperature, leading to
fibre pull-offs in addition to fibre fractures.
(a) (b)
(c)
Figure 6.16: The CNFC sample. (a) Typical failure regions; (b) Typical punch load
versus displacement curve; (c) Sample formed at a temperature of 160°C.
Figure 6.16a shows a typical failure region exhibited in a tested CNFC sample, with a
black rectangle emphasizing the area exhibiting fibre pull-off and reorientation. A large
number of fractured fibres can be observed in the failure region of the composite. Flax
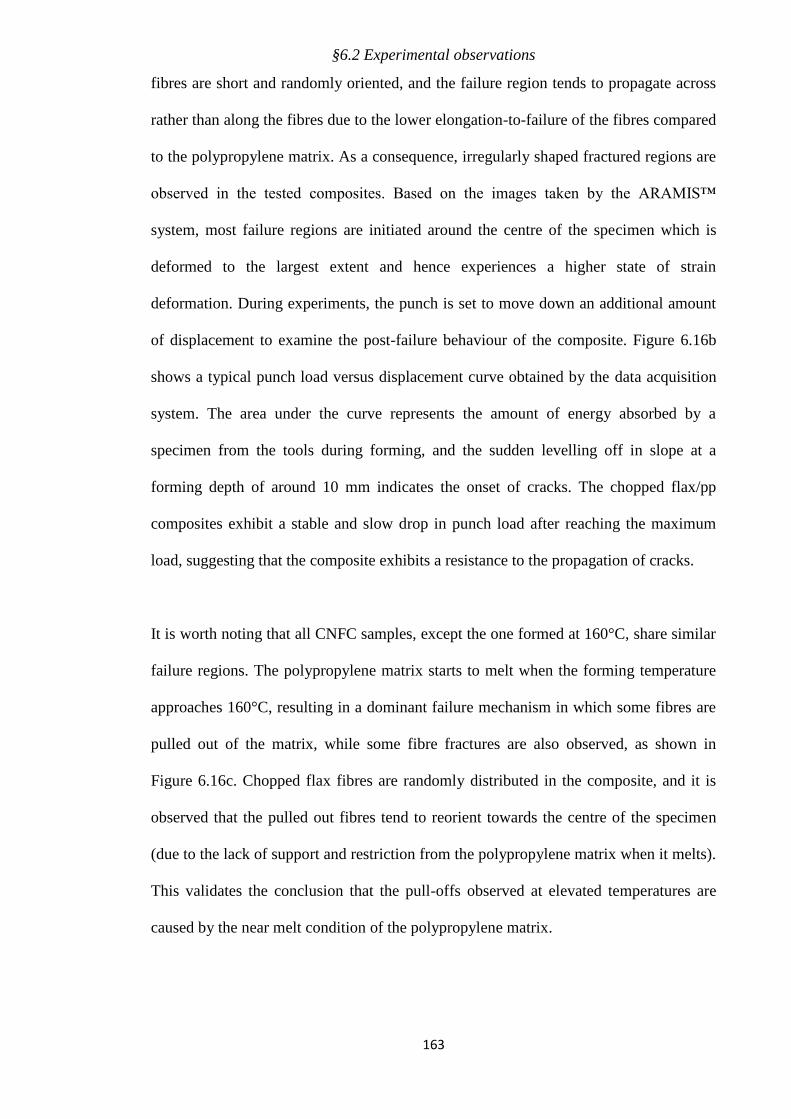
§6.2 Experimental observations
163
fibres are short and randomly oriented, and the failure region tends to propagate across
rather than along the fibres due to the lower elongation-to-failure of the fibres compared
to the polypropylene matrix. As a consequence, irregularly shaped fractured regions are
observed in the tested composites. Based on the images taken by the ARAMIS™
system, most failure regions are initiated around the centre of the specimen which is
deformed to the largest extent and hence experiences a higher state of strain
deformation. During experiments, the punch is set to move down an additional amount
of displacement to examine the post-failure behaviour of the composite. Figure 6.16b
shows a typical punch load versus displacement curve obtained by the data acquisition
system. The area under the curve represents the amount of energy absorbed by a
specimen from the tools during forming, and the sudden levelling off in slope at a
forming depth of around 10 mm indicates the onset of cracks. The chopped flax/pp
composites exhibit a stable and slow drop in punch load after reaching the maximum
load, suggesting that the composite exhibits a resistance to the propagation of cracks.
It is worth noting that all CNFC samples, except the one formed at 160°C, share similar
failure regions. The polypropylene matrix starts to melt when the forming temperature
approaches 160°C, resulting in a dominant failure mechanism in which some fibres are
pulled out of the matrix, while some fibre fractures are also observed, as shown in
Figure 6.16c. Chopped flax fibres are randomly distributed in the composite, and it is
observed that the pulled out fibres tend to reorient towards the centre of the specimen
(due to the lack of support and restriction from the polypropylene matrix when it melts).
This validates the conclusion that the pull-offs observed at elevated temperatures are
caused by the near melt condition of the polypropylene matrix.
Dome Forming Tests
164
6.2.2.3 Effect of treatments on forming modes
As stated in the previous section, failure depths are increased by 16.7% and 87% when
CNFC materials are preheated and water-treated, respectively. The amount of
improvement is less pronounced than the increase in elongation-to-failure observed in
tensile tests (40% in preheated sample and 125% in water-treated sample). It is therefore
important to determine the forming behaviour of CNFC materials during dome forming,
which could provide insights into the reasons why the improvement in elongation-to-
failure cannot be translated to a significantly improved formability in dome forming
tests. To determine this, surface strain deformation of the composites formed in
different conditions is compared. Strain information of all surface points is provided by
the ARAMIS™ system.

§6.2 Experimental observations
165
(a)
(b)
Figure 6.17: Comparison of surface strain distributions of CNFCs at different forming
temperatures, (a) FLD; (b) Quantitative illustrations.
Dome Forming Tests
166
Figure 6.17.a shows the surface strain distributions of composite materials formed at 23
˚C, 130 ˚C, and 150 ˚C at the stage just before failure. The composites experience
similar surface principal strains distribution in FLD. Quantitative representations shown
in Figure 6.17.b are used to help compare the composites formed in different conditions.
All surface points are divided into different groups based on strain ratio. The population
is plotted as a bar chart and the average major strain is expressed in a line. Based on this
quantitative comparison, despite the fact that the T23 experimental case has a relatively
flatter strain distribution, all composites exhibit a major deformation mode of plane
strain regardless of the forming temperature. For example, 52%, 69% and 69% of
surface points experiencing a strain ratio in between -0.3 and 0.3 for the T23, T130 and
T150 sample, respectively. This can be expected from the isotropic nature of the
composites, since the chopped flax fibres are randomly distributed. It seems that
temperature has insignificant influence on the major deformation mode of the composite,
which suggests that the improved formability of the preheated composite is a result of
an increased elongation-to-failure at high temperatures. As a result of reduced stiffness
at high temperatures, T130 and T150 specimens experience higher average surface
strains as well as a very small increase in failure depth (the T23, T130 and T150
samples exhibit strain concentration at forming depths of 11.8 mm, 13.3 mm and 9.6
mm, respectively). The majority of strain deformation is confined to the pole and nearby
regions, regardless of the forming temperatures. At the beginning of the dome forming
test, most strain is confined to the centre of the specimen, and then shifts to nearby
regions at larger forming depths due to the friction between the punch and the specimen.
Surface points in unsupported regions experience plane strain during dome forming
tests, and the amount of strain in this area is closely related to the amount of stretching
experienced by the composite. When the composite degrades at temperatures

§6.2 Experimental observations
167
approaching the melting temperature of polypropylene, the stiffness of the composite is
significantly reduced. This results in more surface points exhibiting plane strain, and
more importantly much higher average major strain in this deformation mode (the
average major strain is almost double that of the composite formed at room
temperature). Observations clearly suggest that preheating is not very effective in
improving the formability of this class of material systems, and that at elevated
temperatures (prior to the thermal degradation of the composite) the increase in failure
depth is dominated by the increase in elongation-to-failure.
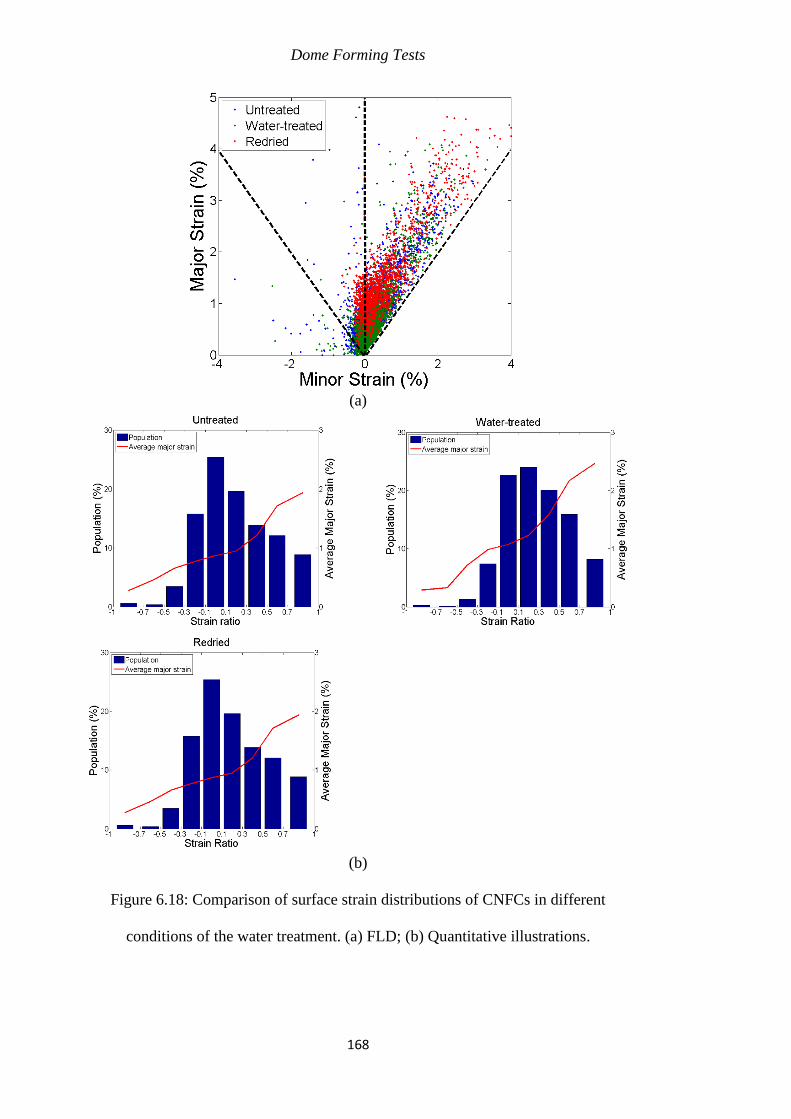
Dome Forming Tests
168
(a)
(b)
Figure 6.18: Comparison of surface strain distributions of CNFCs in different
conditions of the water treatment. (a) FLD; (b) Quantitative illustrations.
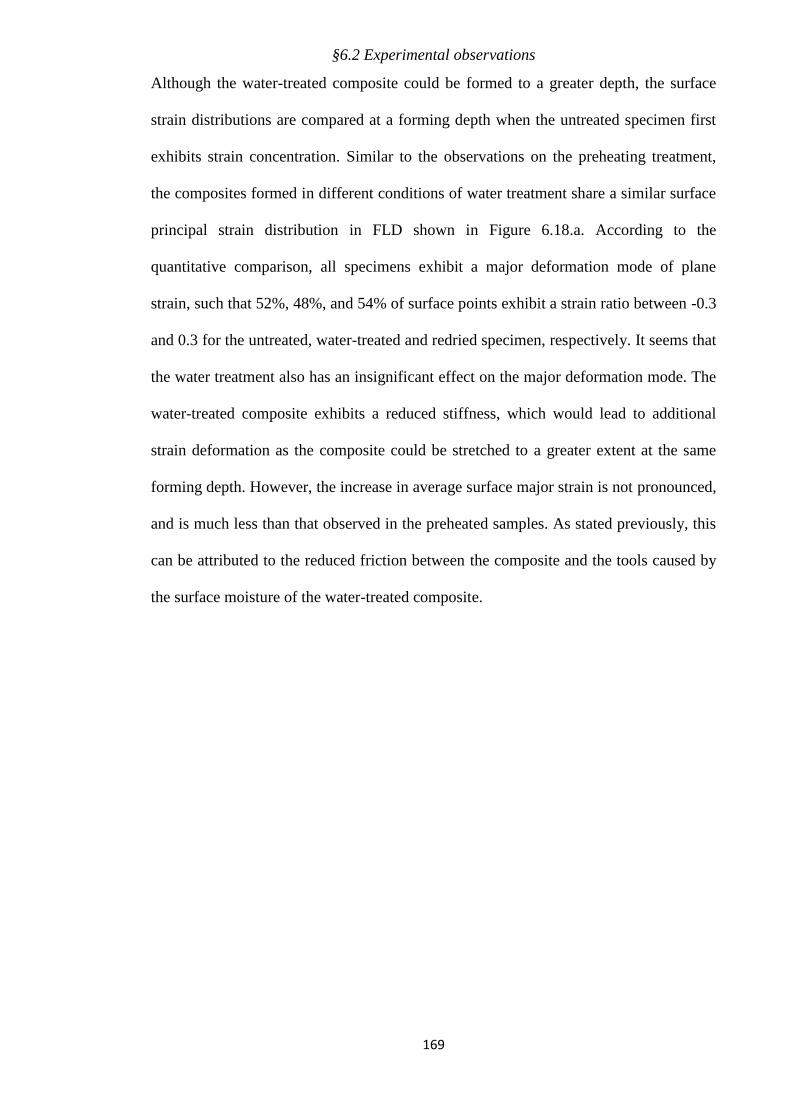
§6.2 Experimental observations
169
Although the water-treated composite could be formed to a greater depth, the surface
strain distributions are compared at a forming depth when the untreated specimen first
exhibits strain concentration. Similar to the observations on the preheating treatment,
the composites formed in different conditions of water treatment share a similar surface
principal strain distribution in FLD shown in Figure 6.18.a. According to the
quantitative comparison, all specimens exhibit a major deformation mode of plane
strain, such that 52%, 48%, and 54% of surface points exhibit a strain ratio between -0.3
and 0.3 for the untreated, water-treated and redried specimen, respectively. It seems that
the water treatment also has an insignificant effect on the major deformation mode. The
water-treated composite exhibits a reduced stiffness, which would lead to additional
strain deformation as the composite could be stretched to a greater extent at the same
forming depth. However, the increase in average surface major strain is not pronounced,
and is much less than that observed in the preheated samples. As stated previously, this
can be attributed to the reduced friction between the composite and the tools caused by
the surface moisture of the water-treated composite.
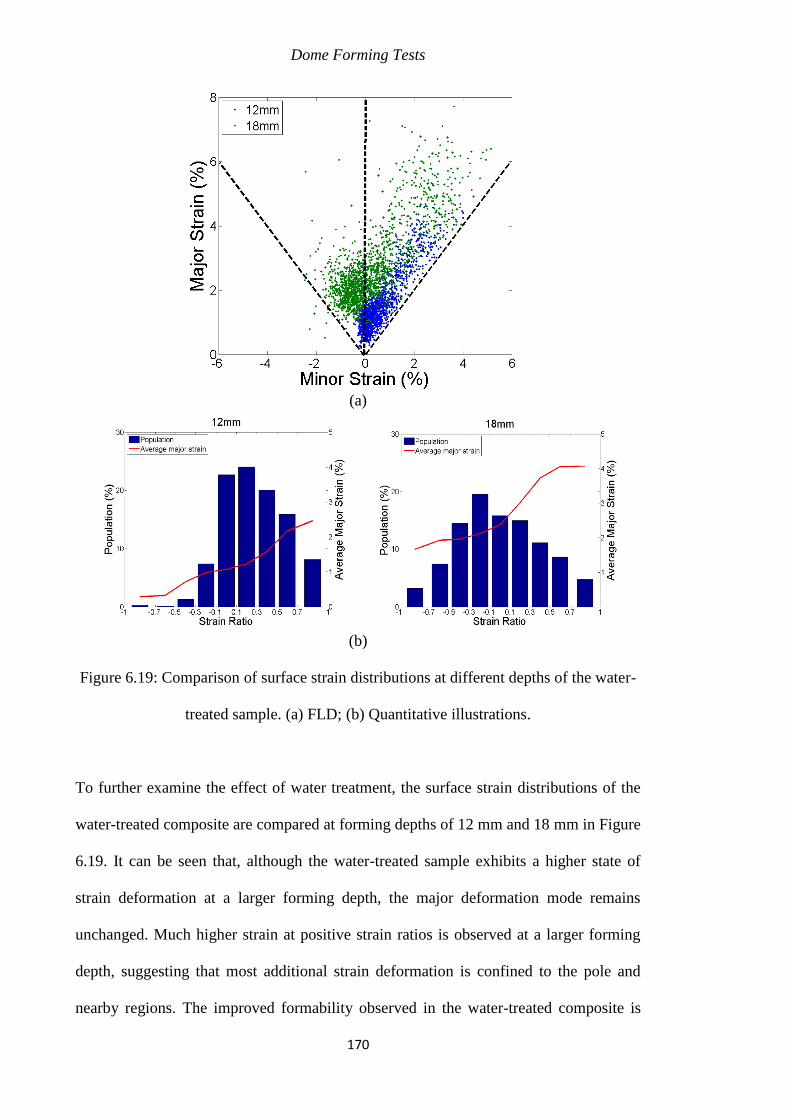
Dome Forming Tests
170
(a)
(b)
Figure 6.19: Comparison of surface strain distributions at different depths of the water-
treated sample. (a) FLD; (b) Quantitative illustrations.
To further examine the effect of water treatment, the surface strain distributions of the
water-treated composite are compared at forming depths of 12 mm and 18 mm in Figure
6.19. It can be seen that, although the water-treated sample exhibits a higher state of
strain deformation at a larger forming depth, the major deformation mode remains
unchanged. Much higher strain at positive strain ratios is observed at a larger forming
depth, suggesting that most additional strain deformation is confined to the pole and
nearby regions. The improved formability observed in the water-treated composite is

§6.2 Experimental observations
171
mainly caused by increased failure strain. In dome forming tests, there are two reasons
why the water treatment is more effective than the preheating: the major reason is that
the water treatment can more effectively improve the elongation-to-failure of the
composite; secondly, the surface moisture of the water-treated composite could reduce
the friction between the contacting tools and the specimen during forming, thereby
lowering strain deformation by encouraging the sample to be drawn into the die cavity.
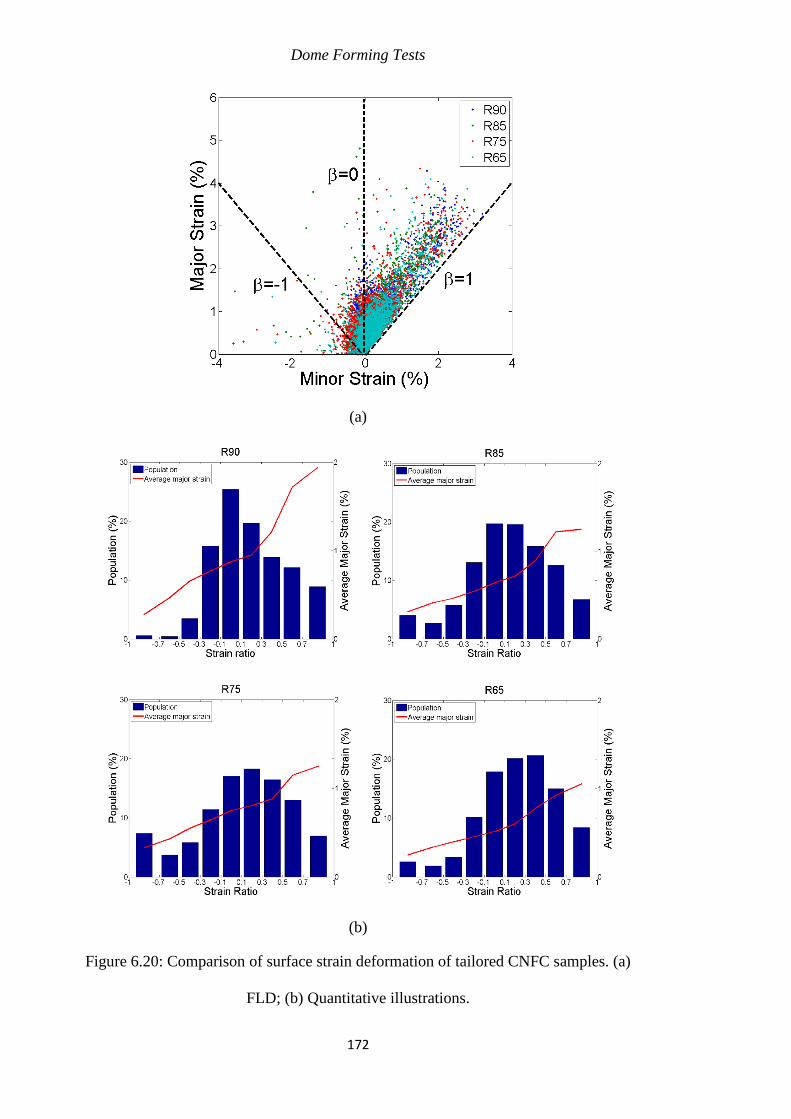
Dome Forming Tests
172
(a)
(b)
Figure 6.20: Comparison of surface strain deformation of tailored CNFC samples. (a)
FLD; (b) Quantitative illustrations.
§6.2 Experimental observations
173
This study also uses a tailored geometry in dome forming tests where circular samples
are tailored in such a way that four areas are cut at 0°, 90°, 180° and 270° from the
sample edge. The application of this geometry is to introduce an imbalance in the way
material flow is restricted (with less restriction along the cutting directions). For all
tailored CNFC specimens, failure initiates at the pole and nearby regions. Figure 6.20
shows clearly that all tailored CNFC materials exhibit very similar surface strain
deformation at the stage of comparison. It is difficult to distinguish one from another
from the FLD. Based on the quantitative representations, the major deformation mode
of composites remains in plane strain, regardless of the geometry of the tailored blanks.
This can be anticipated from the fibre reinforcement nature of CNFC materials. Since
the composite predominantly behaves like an isotropic material due to the random
distribution of the chopped flax fibres, the reduced areas at the flange region can only
contribute a lesser amount of friction along the cutting directions. This effect is limited
as flax fibres at other orientations can still be strained and fractured at a similar forming
depth. Unlike the preheating and the water treatment which increases the failure strain
of the composite, the use of tailored blanks does not alter the limiting strain deformation.
Therefore, in tailored blanks there is very little change in failure depths.
It is seen that the treatments used in this study can improve the formability of CNFC
materials in dome forming tests to some extent. However, the amount of improvement
is less than the increase in failure strain observed in uniaxial loading tests. In addition,
the effect of the novel geometry, tailored blanks, is also not pronounced in dome
forming tests. Unlike NFC materials which exhibit directionality due to its aligned fibre
reinforcement, CNFC behaves predominantly like an isotropic material due to the
randomly distributed chopped flax fibres, resulting in incapacity of introducing shear
behaviour of materials in dome forming. Short fibres are usually used for the sake of
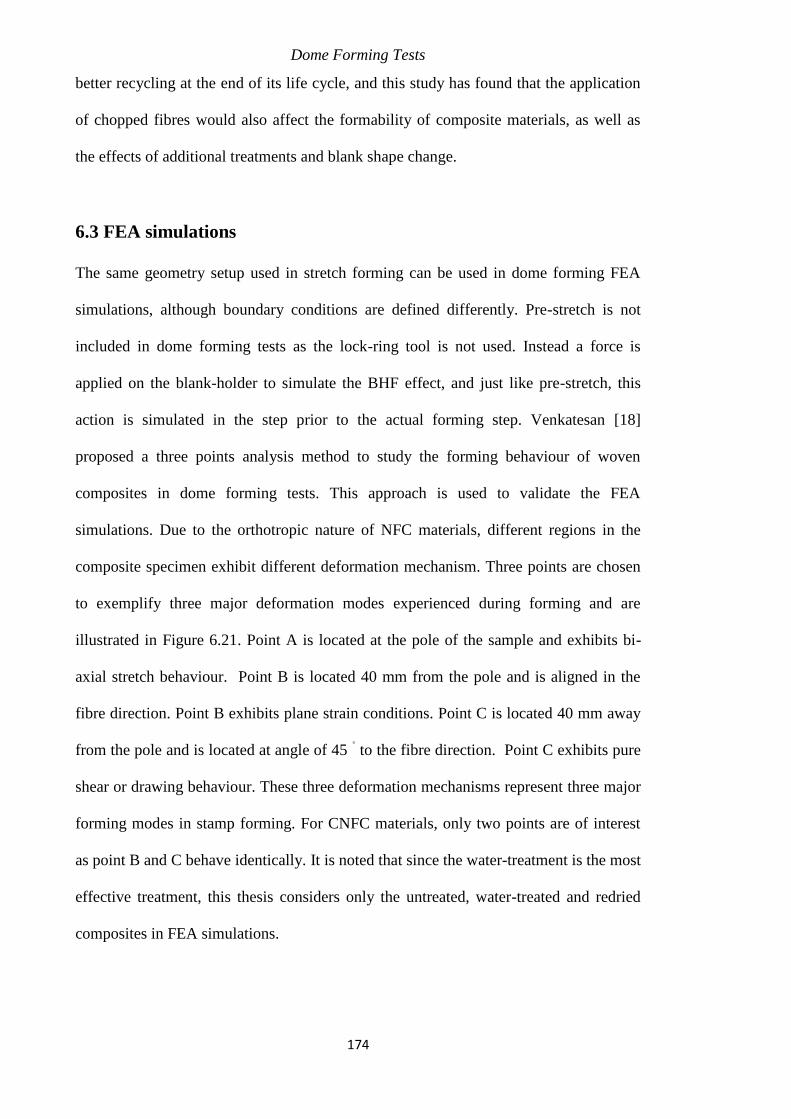
Dome Forming Tests
174
better recycling at the end of its life cycle, and this study has found that the application
of chopped fibres would also affect the formability of composite materials, as well as
the effects of additional treatments and blank shape change.
6.3 FEA simulations
The same geometry setup used in stretch forming can be used in dome forming FEA
simulations, although boundary conditions are defined differently. Pre-stretch is not
included in dome forming tests as the lock-ring tool is not used. Instead a force is
applied on the blank-holder to simulate the BHF effect, and just like pre-stretch, this
action is simulated in the step prior to the actual forming step. Venkatesan [18]
proposed a three points analysis method to study the forming behaviour of woven
composites in dome forming tests. This approach is used to validate the FEA
simulations. Due to the orthotropic nature of NFC materials, different regions in the
composite specimen exhibit different deformation mechanism. Three points are chosen
to exemplify three major deformation modes experienced during forming and are
illustrated in Figure 6.21. Point A is located at the pole of the sample and exhibits bi-
axial stretch behaviour. Point B is located 40 mm from the pole and is aligned in the
fibre direction. Point B exhibits plane strain conditions. Point C is located 40 mm away
from the pole and is located at angle of 45 ˚ to the fibre direction. Point C exhibits pure
shear or drawing behaviour. These three deformation mechanisms represent three major
forming modes in stamp forming. For CNFC materials, only two points are of interest
as point B and C behave identically. It is noted that since the water-treatment is the most
effective treatment, this thesis considers only the untreated, water-treated and redried
composites in FEA simulations.
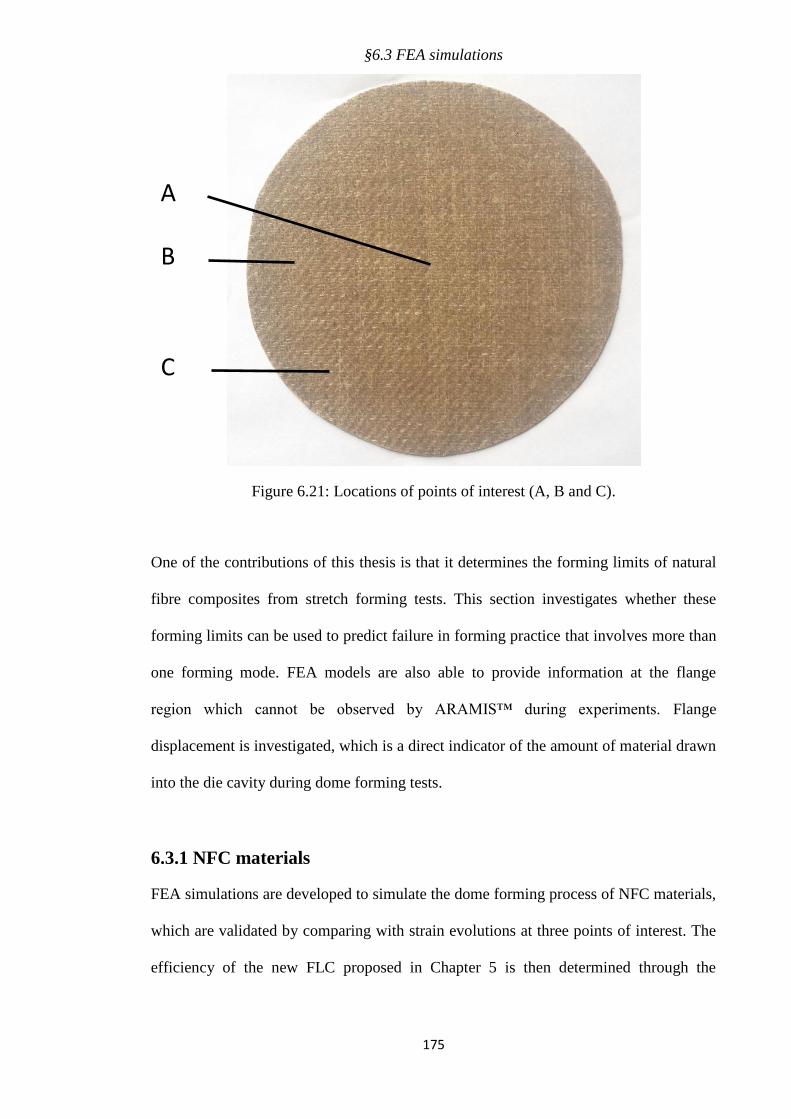
§6.3 FEA simulations
175
Figure 6.21: Locations of points of interest (A, B and C).
One of the contributions of this thesis is that it determines the forming limits of natural
fibre composites from stretch forming tests. This section investigates whether these
forming limits can be used to predict failure in forming practice that involves more than
one forming mode. FEA models are also able to provide information at the flange
region which cannot be observed by ARAMIS™ during experiments. Flange
displacement is investigated, which is a direct indicator of the amount of material drawn
into the die cavity during dome forming tests.
6.3.1 NFC materials
FEA simulations are developed to simulate the dome forming process of NFC materials,
which are validated by comparing with strain evolutions at three points of interest. The
efficiency of the new FLC proposed in Chapter 5 is then determined through the
A
B
C
Dome Forming Tests
176
comparison with failure regions and failure depths observed in FEA simulation and
experiments.
6.3.1.1 Strain evolution at the points of interest
(a) (b)
(c)
Figure 6.22: Strain evolution at points of interest. (a) Untreated; (b) Water-treated; and
(c) Redried.
To obtain an understanding on the forming behaviour of NFC materials in dome
forming tests, the evolution of major strain is analysed at points of interest. For this
comparative study, the NFC is formed in different conditions of water-treatment at a
BHF of 7 kN and a feed rate of 20 mm/s. Figure 6.22 illustrates that greater forming
depths are allowed for the water-treated NFC compared to the dry equivalent samples,
§6.3 FEA simulations
177
which is expected from the significantly increased elongation-to-failure observed in
tensile tests. For the untreated composite, the pole experiences larger strain deformation
compared to unsupported areas. The redried sample shares similar strain evolutions at
the points of interest as the composite exhibits very similar tensile properties. For the
water-treated composite, strain deformation at the pole starts to level out at a forming
depth of 12 mm, while point B rises linearly during forming. Unlike these two points,
point C increases exponentially and then linearly, surpassing point B and A at a forming
depth of 10 mm and 20 mm respectively. This suggests a change in major deformation
mode of the water-treated composite at larger forming depths. The additional strain
deformation shifts from the pole to nearby regions, especially along the 45°/-45°
directions. The greater forming depths observed in the water-treated composite are
permitted due to a large amount of shear deformation, which agrees with the
experimental observations. A reasonable agreement between the experimental outcomes
and FEA simulations is seen, meaning that the biaxial-stretch, plane strain, and pure
shear behaviour of the composites at different locations can be successfully simulated.
Unlike the experiments where the increases and decreases are more rapid, major strain
evolves more gradually in FEA models as a result of the homogenised material
properties in numerical simulations.
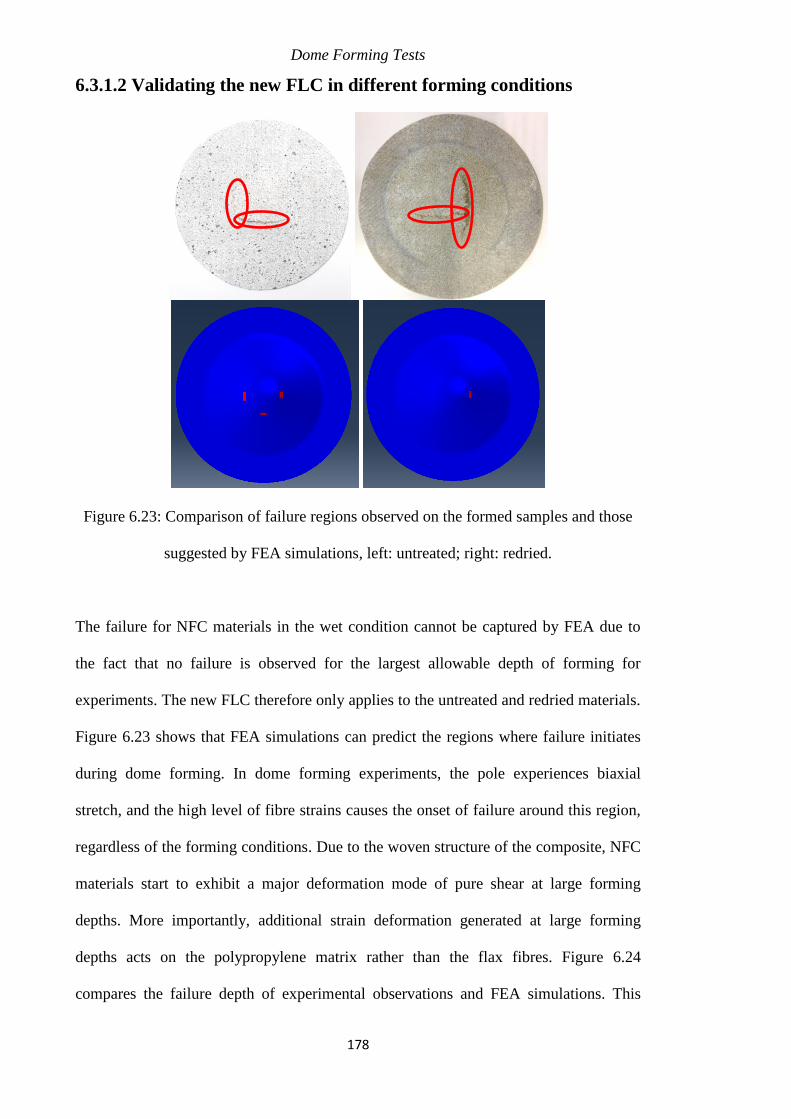
Dome Forming Tests
178
6.3.1.2 Validating the new FLC in different forming conditions
Figure 6.23: Comparison of failure regions observed on the formed samples and those
suggested by FEA simulations, left: untreated; right: redried.
The failure for NFC materials in the wet condition cannot be captured by FEA due to
the fact that no failure is observed for the largest allowable depth of forming for
experiments. The new FLC therefore only applies to the untreated and redried materials.
Figure 6.23 shows that FEA simulations can predict the regions where failure initiates
during dome forming. In dome forming experiments, the pole experiences biaxial
stretch, and the high level of fibre strains causes the onset of failure around this region,
regardless of the forming conditions. Due to the woven structure of the composite, NFC
materials start to exhibit a major deformation mode of pure shear at large forming
depths. More importantly, additional strain deformation generated at large forming
depths acts on the polypropylene matrix rather than the flax fibres. Figure 6.24
compares the failure depth of experimental observations and FEA simulations. This
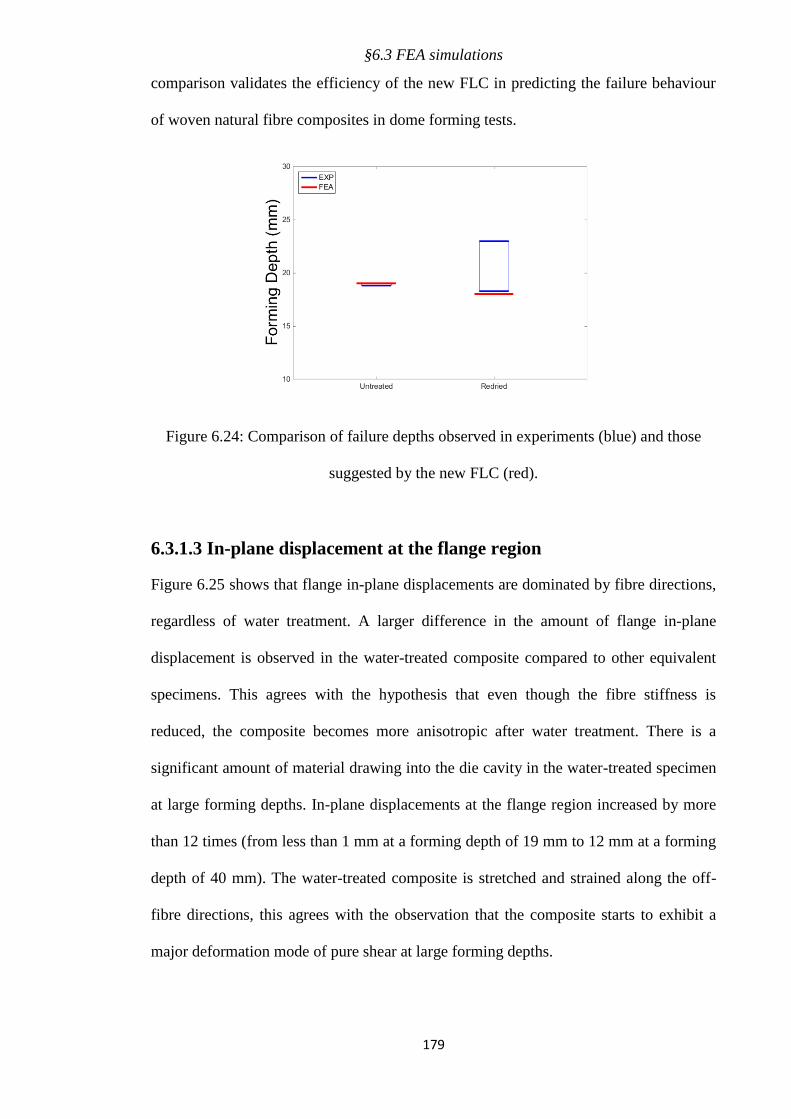
§6.3 FEA simulations
179
comparison validates the efficiency of the new FLC in predicting the failure behaviour
of woven natural fibre composites in dome forming tests.
Figure 6.24: Comparison of failure depths observed in experiments (blue) and those
suggested by the new FLC (red).
6.3.1.3 In-plane displacement at the flange region
Figure 6.25 shows that flange in-plane displacements are dominated by fibre directions,
regardless of water treatment. A larger difference in the amount of flange in-plane
displacement is observed in the water-treated composite compared to other equivalent
specimens. This agrees with the hypothesis that even though the fibre stiffness is
reduced, the composite becomes more anisotropic after water treatment. There is a
significant amount of material drawing into the die cavity in the water-treated specimen
at large forming depths. In-plane displacements at the flange region increased by more
than 12 times (from less than 1 mm at a forming depth of 19 mm to 12 mm at a forming
depth of 40 mm). The water-treated composite is stretched and strained along the off-
fibre directions, this agrees with the observation that the composite starts to exhibit a
major deformation mode of pure shear at large forming depths.
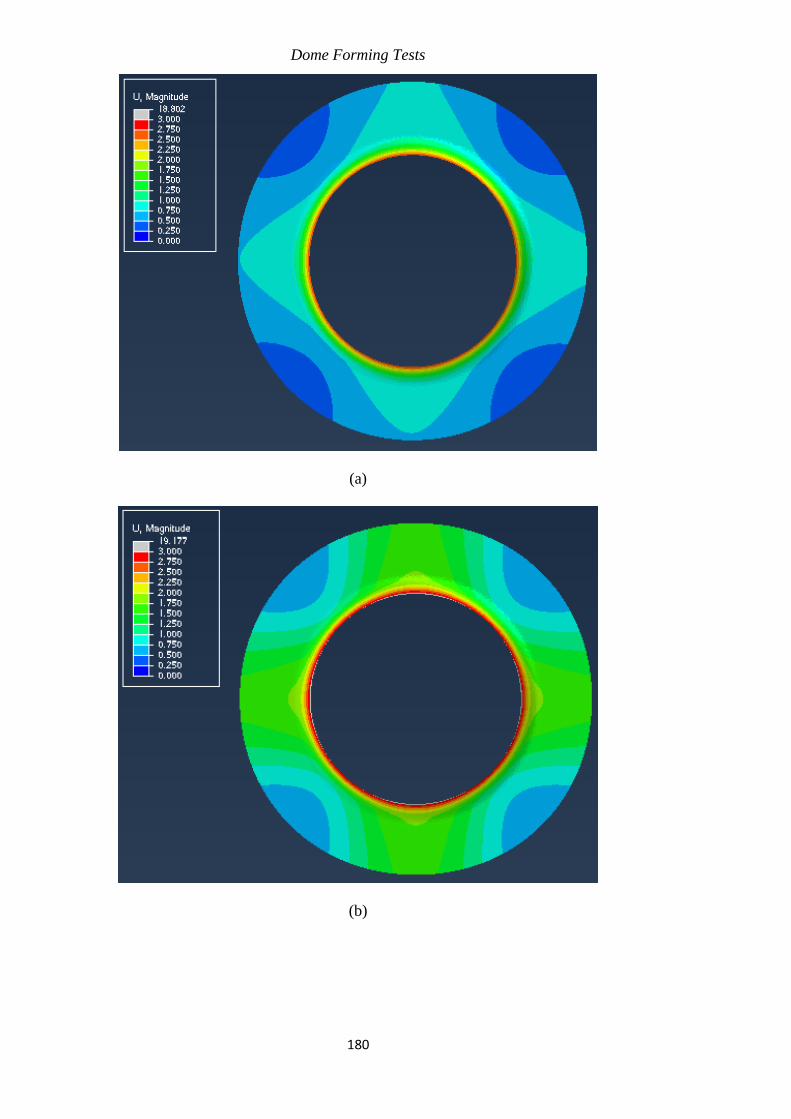
Dome Forming Tests
180
(a)
(b)
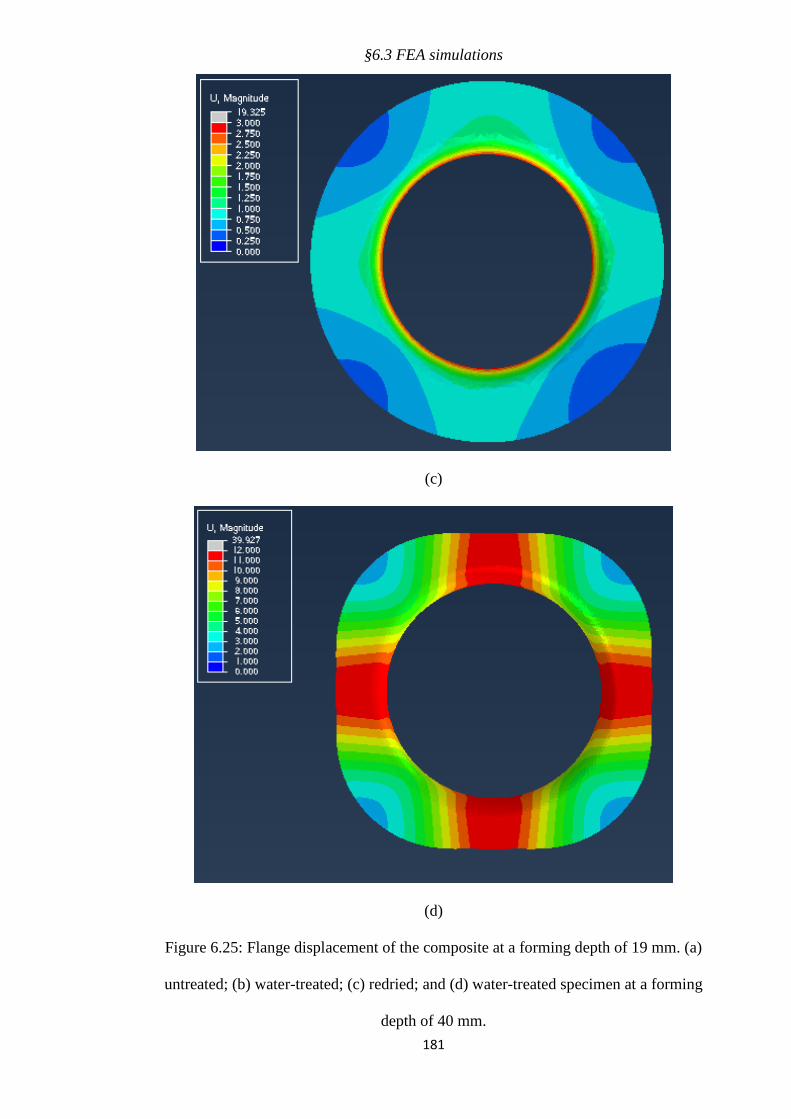
§6.3 FEA simulations
181
(c)
(d)
Figure 6.25: Flange displacement of the composite at a forming depth of 19 mm. (a)
untreated; (b) water-treated; (c) redried; and (d) water-treated specimen at a forming
depth of 40 mm.
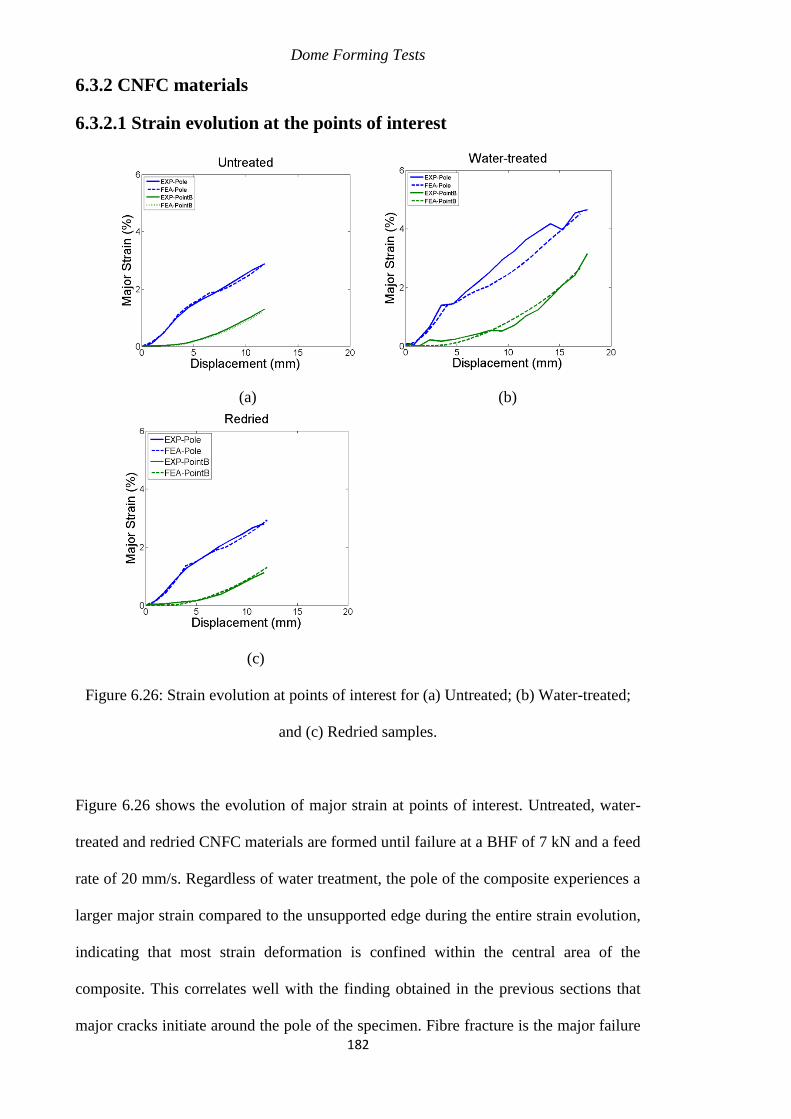
Dome Forming Tests
182
6.3.2 CNFC materials
6.3.2.1 Strain evolution at the points of interest
(a) (b)
(c)
Figure 6.26: Strain evolution at points of interest for (a) Untreated; (b) Water-treated;
and (c) Redried samples.
Figure 6.26 shows the evolution of major strain at points of interest. Untreated, water-
treated and redried CNFC materials are formed until failure at a BHF of 7 kN and a feed
rate of 20 mm/s. Regardless of water treatment, the pole of the composite experiences a
larger major strain compared to the unsupported edge during the entire strain evolution,
indicating that most strain deformation is confined within the central area of the
composite. This correlates well with the finding obtained in the previous sections that
major cracks initiate around the pole of the specimen. Fibre fracture is the major failure
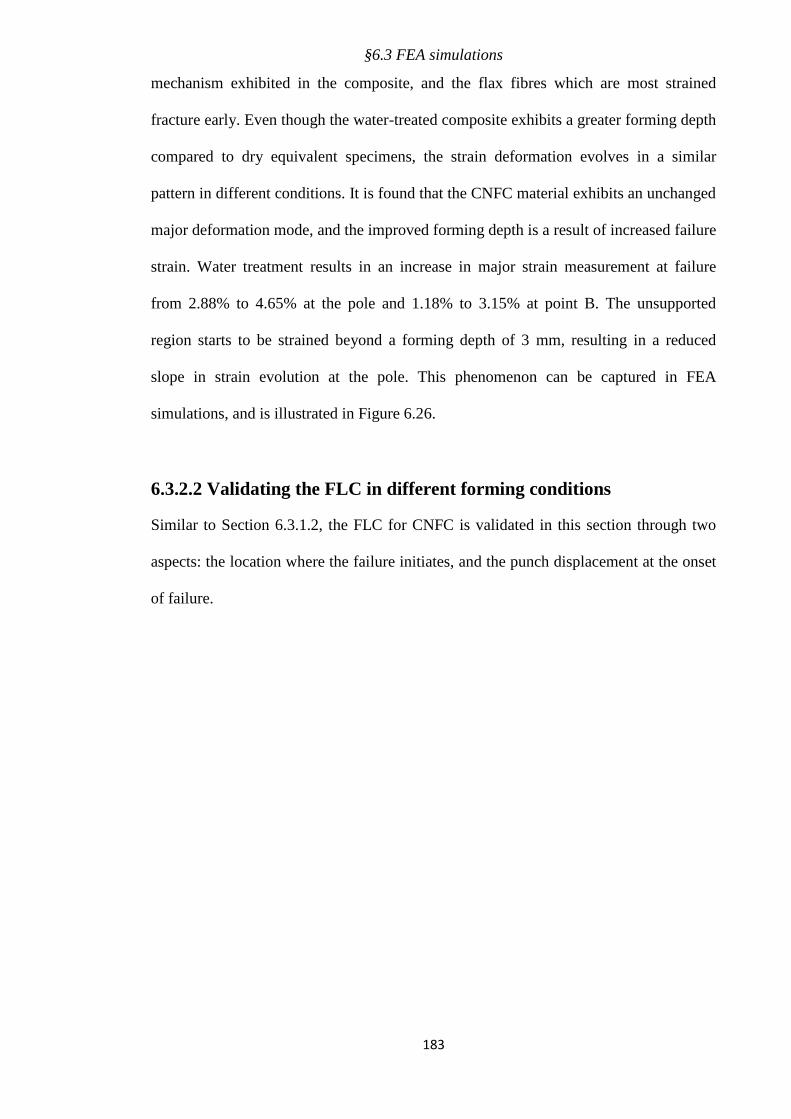
§6.3 FEA simulations
183
mechanism exhibited in the composite, and the flax fibres which are most strained
fracture early. Even though the water-treated composite exhibits a greater forming depth
compared to dry equivalent specimens, the strain deformation evolves in a similar
pattern in different conditions. It is found that the CNFC material exhibits an unchanged
major deformation mode, and the improved forming depth is a result of increased failure
strain. Water treatment results in an increase in major strain measurement at failure
from 2.88% to 4.65% at the pole and 1.18% to 3.15% at point B. The unsupported
region starts to be strained beyond a forming depth of 3 mm, resulting in a reduced
slope in strain evolution at the pole. This phenomenon can be captured in FEA
simulations, and is illustrated in Figure 6.26.
6.3.2.2 Validating the FLC in different forming conditions
Similar to Section 6.3.1.2, the FLC for CNFC is validated in this section through two
aspects: the location where the failure initiates, and the punch displacement at the onset
of failure.
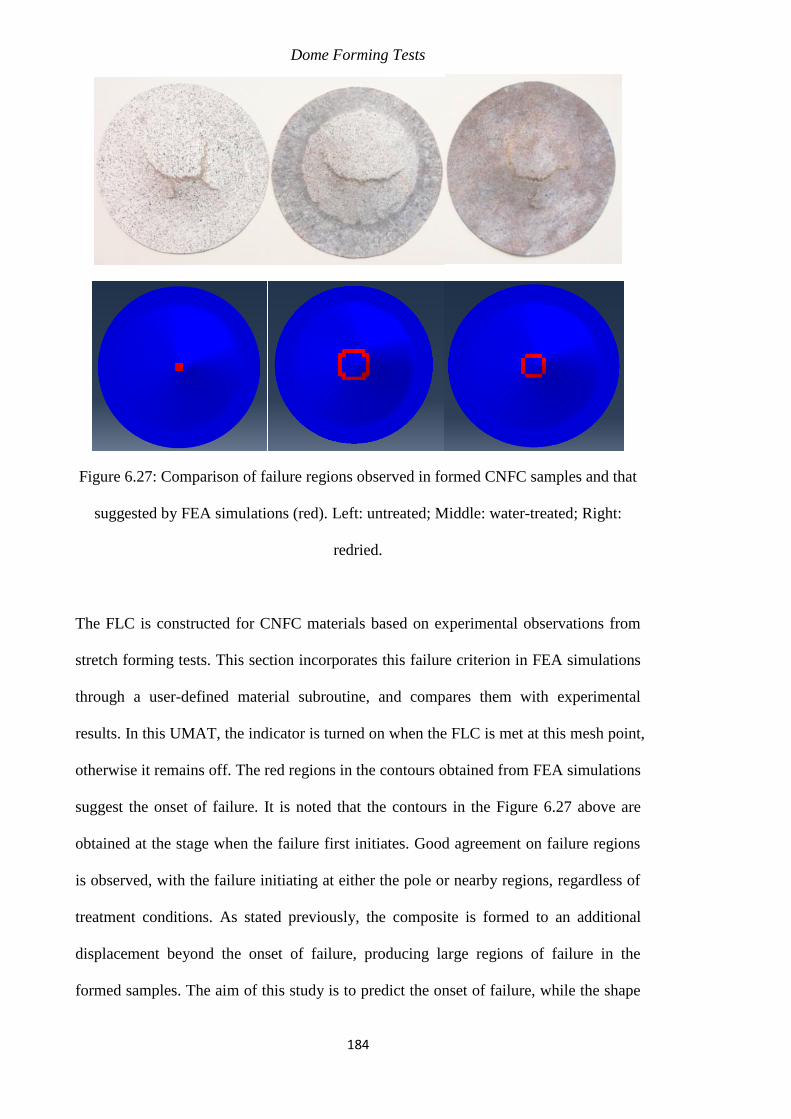
Dome Forming Tests
184
Figure 6.27: Comparison of failure regions observed in formed CNFC samples and that
suggested by FEA simulations (red). Left: untreated; Middle: water-treated; Right:
redried.
The FLC is constructed for CNFC materials based on experimental observations from
stretch forming tests. This section incorporates this failure criterion in FEA simulations
through a user-defined material subroutine, and compares them with experimental
results. In this UMAT, the indicator is turned on when the FLC is met at this mesh point,
otherwise it remains off. The red regions in the contours obtained from FEA simulations
suggest the onset of failure. It is noted that the contours in the Figure 6.27 above are
obtained at the stage when the failure first initiates. Good agreement on failure regions
is observed, with the failure initiating at either the pole or nearby regions, regardless of
treatment conditions. As stated previously, the composite is formed to an additional
displacement beyond the onset of failure, producing large regions of failure in the
formed samples. The aim of this study is to predict the onset of failure, while the shape
§6.3 FEA simulations
185
of the catastrophic failure is not within the scope of this work. In addition to failure
regions, FLC also suggests reasonable forming depths at which the failure initiates.
Overall, good agreement is obtained between the failure depths suggested by the FLC
and that observed in the tested samples, as shown in Figure 6.28.
Figure 6.28: Comparison of forming depths observed in experiments (blue) and those
suggested by FLC (red) in different forming conditions.
6.3.2.3 In-plane displacement at the flange region
FEA simulations are able to provide information about the flange region which cannot
be observed from the ARAMIS™ system during forming, such as the in-plane
displacement at the flange region. This information indicates the amount of material
drawn into the die cavity, which is closely related to the material stiffness, forming
depth, and contact friction.
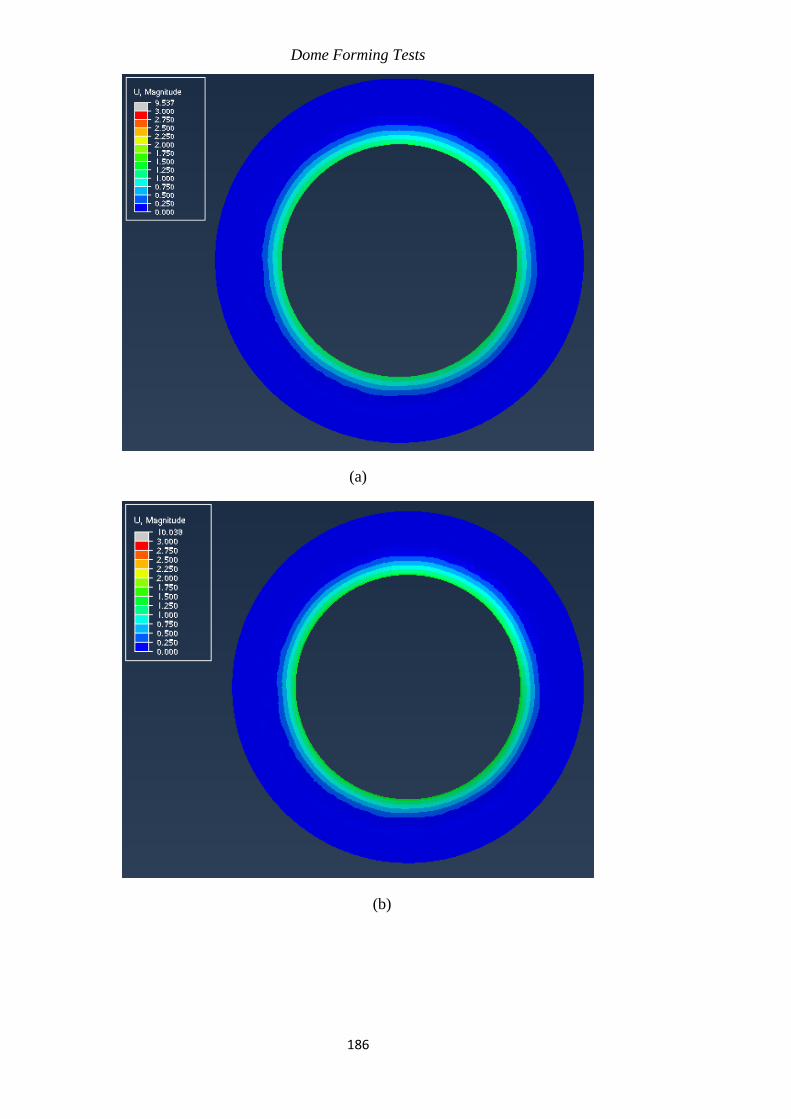
Dome Forming Tests
186
(a)
(b)
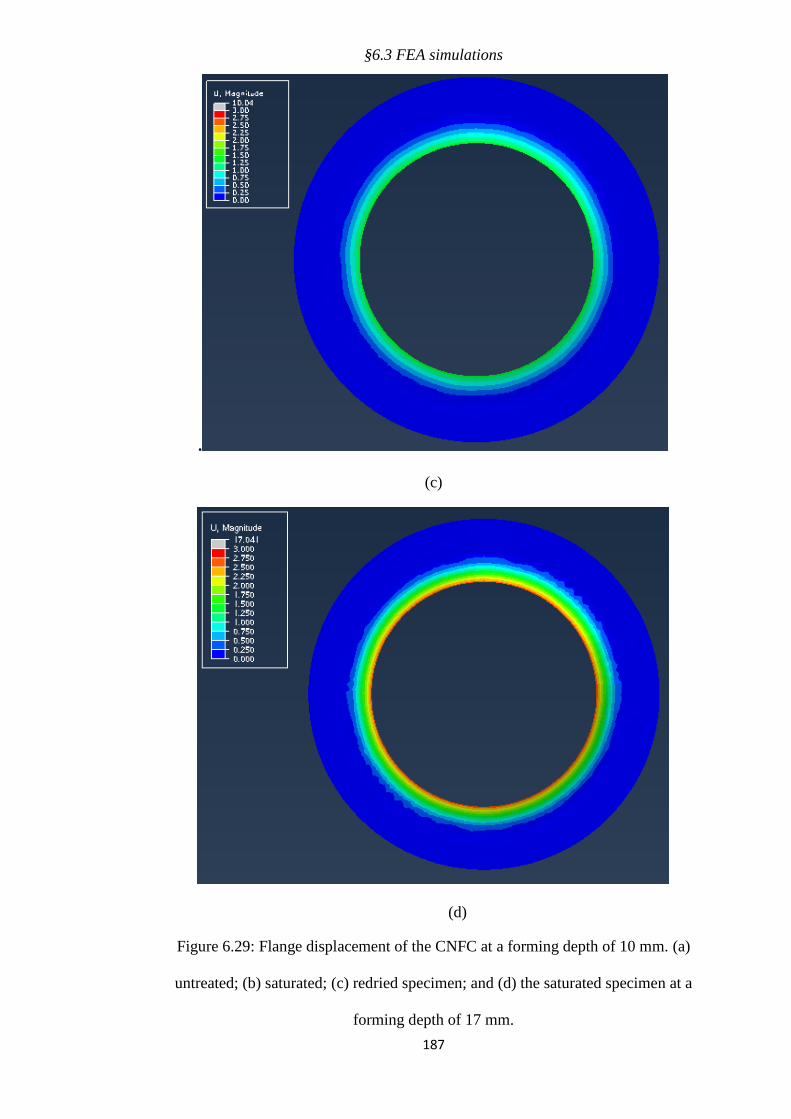
§6.3 FEA simulations
187
.
(c)
(d)
Figure 6.29: Flange displacement of the CNFC at a forming depth of 10 mm. (a)
untreated; (b) saturated; (c) redried specimen; and (d) the saturated specimen at a
forming depth of 17 mm.
Dome Forming Tests
188
Figure 6.29 shows that at small forming depths, composites experience a small amount
of in-plane displacement deformation at the flange region. It is anticipated that
composites formed in dry conditions (untreated and redried) experience a similar
amount of flange displacement, while that of the water-treated composite is not much
different. This can be attributed to the combination of reduced stiffness (to reduce
flange displacements) and lower contact friction caused by surface moisture (to increase
flange displacements). When the forming depth increases from 10 mm to 17 mm, a
slightly larger in-plane displacement at the flange region is observed. This agrees with
the observations obtained earlier that there is no change in major deformation mode of
CNFC materials in dome forming tests. It is also important to note that in-plane
displacement in the flange region exhibits no directionality, and decreases gradually to
the sample edge.
6.4 Summary
This Chapter has investigated the forming behaviour of both NFC and CNFC in dome
forming tests, with a particular focus on the mechanisms behind the improved
formability of preheated and water-treated composites. Specimens experience two major
deformation mechanisms of stretching and drawing. Based on visual observations of the
tested samples and microscopic examinations of fractured surfaces, fibre fracture is
identified as the dominant failure mechanism for both composites. At a forming
temperature of 160 ˚C, fibre pull-out is also observed in addition to fibre fracture. This
study has shown that due to the thermal degradation of composites there is an optimal
temperature window for forming. For CNFC materials, it is found that the specimen
experiences strain concentration prior to catastrophic failure, and the punch
displacement between these two levels can vary from sample to sample based on the
local fibre loading. To better compare specimens formed in different conditions, the
§6.4 Summary
189
CNFC is considered to fail at the onset of strain concentration. One of the key finding of
this study is that water treatment is superior to preheating treatment, with the water-
treated composites withstanding a considerably larger forming depth compared to the
preheated equivalents. These observations suggest that it would be very advantageous to
process natural fibre composites in the wet condition. By studying surface strain
deformation at various forming conditions, it is found that the improved formability of
treated CNFC materials is mainly driven by increased elongation-to-failure. In
additional to the fact that the strain deformation increases with a steeper slope at larger
forming depths, a wider forming envelope of CNFC materials in wet condition could
not be translated to a forming depth with similar improvement. Unlike CNFC materials,
an improved formability of treated NFC materials is due to a combination of increased
ductility as well as the introduction of pure shear. This in turn leads to significantly
increased forming depths in dome forming tests. Novel geometries of natural fibre
composites, where some areas have four cut-outs at the sample edge (at 0˚, 90˚, 180˚
and 270˚), are used in dome forming tests. The tailored shape encourages materials to
draw into the die cavity along the cutting directions. It is found that the effect of tailored
blanks is pronounced for NFC materials, but very limited for CNFC materials. This can
also be attributed to differences in the nature of the fibre reinforcement. It seems a
trade-off needs to be made between better recycling at the end of life cycle (CNFC) and
superior formability (NFC) especially under treatments and blank shape change.
In FEA simulations, a force is set up to act on the blank-holder in a way that simulates
the effect of BHF. By comparing these results with experimental observations, it is
found that the failure criteria obtain in Chapter 5 can predict the region where the failure
initiates as well as the punch depth at the onset of failure. These observations could
verify the failure criteria to predict the onset of failure of this class of material systems
Dome Forming Tests
190
in different forming practices. In addition to validating the failure criteria, FEA models
can also provide information at the flange region which is hidden from view by the die
and blank-holder. For NFC materials, the amount of in-plane displacement depends on
the directions of the fibres, whereas for CNFC materials it is distributed equally in all
directions. Finally, water-treated composites are found to experience significantly more
flange displacement at larger forming depths, suggesting that there is a change in the
major deformation mode to pure shear. This matches with the observations obtained
from ARAMIS™. This Chapter validates the effectiveness of the new FLC for NFC in
dome forming tests where samples could experience more complicated forming modes
(stretching and drawing) than that experienced in stretch forming. This is concluded that
the FLC proposed in this study could be used to effectively predict the failure behaviour
of woven composites in rapid forming processes.
191
Chapter 7
Conclusions and Future Work
7.1 Introduction
This work is designed to answer two key questions regarding the forming of natural
fibre composites. The first one is when does failure initiate in this class of material
systems, and what is the most effective measure for predicting it? To answer this
question, hourglass samples are stretched and then formed through the stamping press
machine. The ARAMIS™ system beneath the press machine provides displacement and
strain deformation which could be used to determine the failure behaviour of the
composites. The second relates to how to improve the formability of natural fibre
composites. The approach here is to perform dome forming tests in different treatment
conditions, namely preheating, water treatment, and tailored blanks.
7.2 Contributions
➢ Significantly improved ductility is observed when natural fibre composites are
saturated with water. Mechanical properties (elongation-to-failure, stiffness, and
strength) can almost retain back to pre-treated levels after dried from wet
condition. This makes it very advantageous to process natural fibre composites
in wet condition. According to the SEM examinations on fractured surfaces, the
changes in tensile properties of the chopped and continuous natural fibre
composites are caused by different mechanisms.
➢ Through stretch forming experiments, it is found that the conventional FLC is
not suitable for predicting the failure initiated in woven natural fibre composite,
as principal strains cannot differentiate the strain on the flax fibres and the
Conclusions and Future Work
192
polypropylene matrix. This work has proposed a new FLC for woven
composites which expresses limiting fibre strain as a function of forming mode
calculated as the ratio of minor strain to major strain. Such a criterion requires
tracking the evolution of fibre movements, and this was achieved using a real-
time strain measurement system (ARAMIS™). The problem with applying the
conventional FLC for predicting the failure behaviour of NFC is that it has path
dependency effect. The new FLC is superior to the conventional FLC because it
can successfully eliminate this path dependency effect. This work has also
demonstrated that the new FLC is more effective than the Maximum Strain
failure criterion, highlighting the importance of the interactions between
different constituents of woven composites. The new FLC will accommodate
different composite material systems as long as the dominating failure
mechanism is fibre fracture.
➢ A key contribution of this study is that it has incorporated failure criteria into
FEA simulations through development of a user-defined material routine. This is
achieved through the application of SDVs in the UMAT. Based on the FEA
models developed in this study, the failure criteria proposed in this study can be
used to predict the onset of failure in natural fibre composites in different
forming practices (stretch forming, dome forming) as well as in different
forming conditions (untreated, water-treated, redried, and tailored blanks).
➢ Preheating is a traditional treatment method usually used to improve the
formability of materials in rapid forming processes. However, it is found that
this conventional method is not very effective for natural fibre composites due to
thermal degradation at high temperatures. It is found that the water-treated
§7.3 Future work
193
composites could exhibit an almost doubled forming depth compared to that of
the preheated equivalents. As well as requiring less energy, water treatment can
be more effective than the conventional method used to form this class of
material system. This fundamental breakthrough in improving the formability of
natural fibre composites can aid in rapid forming of this class of material system.
Due to the directionality of NFCs, improved formability can also be achieved by
cutting some areas of a circular sample in the fibre directions. This reduces the
amount of strain deformation acting on the flax fibres by encouraging the flax
fibres to be drawn into the die cavity in the fibre directions, and hence results in
greater forming depths. This treatment can be as effective as preheating in dome
forming tests.
7.3 Future work
➢ This thesis has looked into the effect of improving formability of natural fibre
composites through varying chemical solutions, and among which the water
solution is found to be the most effective. In the future, it would be valuable to
look for any chemical medium that can potentially improve the formability
beyond what is observed in this study.
➢ For production parts, attention needs to be paid to spring back of natural fibre
composites. It is expected that such composites would experiences a
considerable amount of spring back when an applied load is released, and this is
very likely due to the polypropylene matrix. It is crucial to quantify the amount
of spring back at the end of rapid forming processes, and more importantly to
determine if there are any methods to reduce it.
Conclusions and Future Work
194
➢ Fibre-metal laminate (FML) is a sandwich structure consisting of two outer
layers of monolithic metal alloys and a core of composite material. This class of
material system can exhibit superior formability compared to monolithic metal
alloys. The current work has found that, the water treatment is more effective
than other treatments in terms of improving the formability of natural fibre
composites. However, FML layers are glued together by melting adhesives, so
any water treatment prior to FML manufacturing is therefore likely to be much
less effective. In addition, the composite layer of FML can hardly absorb
moisture when the entire sandwich structure is merged in water. Therefore,
research effort is required to investigate how the formability of natural fibre
composites based FMLs might be improved. Tailored blanks may be useful to
the FML structure, but again this needs to be verified through experiments.
195
Bibliography
[1] A. Shalwan and B.F. Yousif, “In State of Art: Mechanical and tribological
behaviour of polymeric composites based on natural fibres”, Material and
Design vol. 48, pp. 14-24, 2013.
[2] N. Saba, M. Jawaid, O.Y. Alothman, and M.T. Paridah, “A review on dynamic
mechanical properties of natural fibre reinforced polymer composites”,
Construction and Building Materials, vol. 106, pp. 149-159, 2016.
[3] V.K. Thakur, and M.K. Thakur, “Processing and characterization of natural
cellulose fibers/thermoset polymer composites”, Carbohydrate Polymers, vol.
109, pp. 102-117, 2014.
[4] W. Xu, and L. Zhang, “Mechanics of fibre deformation and fracture in vibration-
assisted cutting of unidirectional fibre-reinforced polymer composites”,
International Journal of Machine Tools and Manufacture, vol. 103, pp. 40-52,
2016.
[5] M.J.M. Ridzuan, M.S. Abdul Majid, M. Afendi, S.N. Aqmariah Kanafiah, J.M.
Zahri, and A.G. Gibson, “Characterisation of natural cellulosic fibre from
Pennisetum purpureum stem as potential reinforcement of polymer composites”,
Materials & Design, vol. 89, pp. 839-847, 2016.
[6] Y. Xie, C.A.S. Hill, Z. Xiao, H. Militz and C. Mai, “Silane coupling agents used
for natural fiber/polymer composites: A review”, Composites Part A: Applied
Science and Manufacturing, vol. 41, no. 7, pp. 806-819, 2010.
[7] A.C.N. Singletona, C.A. Baillie, P.W.R Beaumonta, and T. Peijs, “On the
mechanical properties, deformation and fracture of a natural fibre/recycled
polymer composite”, Composites: Part B Engineering vol. 34, pp. 519-526,
2003.
[8] O. Faruk, A.K. Bledzki, H.-P. Fink, and M. Sain, “Biocomposites reinforced
with natural fibers: 2000–2010”, Progress in Polymer Science, vol. 37, no. 11,
pp. 1552-1596, 2012.
[9] Lucintel, “Opportunities in natural fibre composites”, March 2011. Available at:
http://www.lucintel.com/lucintelbrief/potentialofnaturalfibercomposites-final.pdf.
[10] J. Holbery and D. Houston, “Natural-Fiber-Reinforced Polymer Composites in
Automotive Applications”, Low-Cost Composites in Vehicle Manufacture, vol.
58, no. 11, 2006.
[11] A. Belaadi, A. Bezazi, M. Bourchak, F. Scarpa, and C. Zhu, “Thermochemical
and statistical mechanical properties of natural sisal fibres”, Composites Part B:
Engineering, vol. 67, pp. 481-489, 2014.
[12] L. Mosse, “Stamp Forming of Fibre-Metal Laminates”, 2006. PhD Thesis, The
Australian National University.
Bibliography
196
[13] American Chemistry Council - Plastic Division, “Plastics and Polymer
Composites for Automotive Markets” TECHNOLOGY ROADMAP, 2014.
[14] E. Ghassemieh, “Materials in Automotive Application, State of the Art and
Prospects” Chapter 20, pp. 365-395, 2011.
[15] M. Pervaiz, and M.M. Sain, “Carbon storage potential in natural fiber
composites”, Resources, Conservation and Recycling, vol. 39, no. 4, pp. 325-
340, 2003.
[16] M.J. John, and S. Thomas, “Biofibres and biocomposites”, Carbohydrate
Polymers, vol. 71, no. 3, pp. 343-364, 2008.
[17] Z. N. Azwa, B. F. Yousif, A.C. Manalo, and W. Karunasena, “A review on the
degradability of polymeric composites based on natural fibres”, Materials &
Design, vol. 47, pp. 424-442, 2013.
[18] S. Venkatesan, “Stamp Forming of Composite Materials: An Experimental and
Analytical Study”, 2012. PhD Thesis, The Australian National University.
[19] A. Sexton, “Stretch forming of thermo-plastic fibre metal laminates”, 2014. PhD
Thesis, The Australian National University.
[20] S. Advani and K.T. Hsiao, “Manufacturing Techniques for Polymer Matrix
Composites (PMCs)”, 2012, Woodhead Publishing.
[21] K. Liu, H. Takagi, R. Osugi, and Z. Yang, “Effect of lumen size on the effective
transverse thermal conductivity of unidirectional natural fiber composites”,
Composites Science and Technology, vol. 72, no. 5, pp. 633-639, 2012.
[22] P. Methacanon, U. Weerawatsophon, N. Sumransin, C. Prahsarn, and D.T.
Bergado, “Properties and potential application of the selected natural fibers as
limited life geotextiles”, Carbohydrate Polymers, vol. 82, no. 4, pp. 1090-1096,
2010.
[23] M.D.H. Beg, and K.L. Pickering, “Accelerated weathering of unbleached and
bleached Kraft wood fibre reinforced polypropylene composites”, Polymer
Degradation and Stability, vol. 93, no. 10, pp. 1939-1946, 2008.
[24] D.B. Dittenber, and H.V.S. GangaRao, “Critical review of recent publications on
use of natural composites in infrastructure”, Composites Part A: Applied Science
and Manufacturing, vol. 43, no. 8, pp. 1419-1429, 2012.
[25] C. Baley, “Analysis of the flax fibres tensile behaviour and analysis of the
tensile stiffness increase”, Composites Part A: Applied Science and
Manufacturing, vol. 33, no. 7, pp. 939-948, 2002.
[26] A. Le Duigou, L. Pillin, A. Bourmaud, P. Davies, and C. Baley. "Effect of
recycling on mechanical behaviour of biocompostable flax/poly(l-lactide)
composites." Composites Part A: Applied Science and Manufacturing, vol. 39,
no. 9, pp. 1471-1478, 2008.
197
[27] A. Bourmaud, A. Le Duigou, and C. Baley, "What is the technical and
environmental interest in reusing a recycled polypropylene–hemp fibre
composite?" Polymer Degradation and Stability, vol. 96, no. 10, pp. 1732-1739.
2011
[28] A. Bourmaud, and C. Baley. "Rigidity analysis of polypropylene/vegetal fibre
composites after recycling". Polymer Degradation and Stability, vol. 94, no 3,
pp. 297-305. 2009.
[29] V. Srebrenkoska, G.B. Gaceva, and D. Dimeski, "Preparation and recycling of
polymer eco-composites I. Comparison of the conventional molding techniques
for preparation of polymer eco-composites". Macedonian Source, vol. 28, no. 1,
pp. 99-109. 2009.
[30] V. Srebrenkoska, G.B. Gaceva, M. Avella, M.E. Ericco, and G. Gentile.
"Recycling of polypropylene-based eco-composites". Polymer International, vol.
57, no. 11, pp. 1252-1257. 2008.
[31] S.F. Hwang and K.J. Hwang, “Stamp forming of locally heated thermoplastic
composites”, Composites Part A: Applied Science and Manufacturing, vol. 33,
no. 5, pp. 669-676, 2002.
[32] F. Yao, Q. Wu, Y. Lei, W. Guo, and Y. Xu. “Thermal decomposition kinetics of
natural fibers: Activation energy with dynamic thermogravimetric analysis”,
Polymer Degradation and Stability, vol. 93, no. 1, pp. 90-98, 2008.
[33] P.V. Joseph, K. Joseph, S. Thomas, C.K.S. Pillai, V.S. Prasad, G. Groeninckx,
and M. Sarkissova, “The thermal and crystallisation studies of short sisal fibre
reinforced polypropylene composites”, Composites Part A: Applied Science and
Manufacturing, vol. 34, no. 3, pp. 253-266, 2003.
[34] L.B. Manfredi, E.S. Rodríguez, M. Wladyka-Przybylak, and A. Vazquez,
“Thermal degradation and fire resistance of unsaturated polyester, modified
acrylic resins and their composites with natural fibres”, Polymer Degradation
and Stability, vol. 91, no. 2, pp. 255-261, 2006.
[35] A. Athijayamani, M. Thiruchitrambalam, U. Natarajan, and B. Pazhanivel,
“Effect of moisture absorption on the mechanical properties of randomly
oriented natural fibers/polyester hybrid composite”, Materials Science and
Engineering: A, vol. 517, no. 1–2, pp. 344-353, 2009.
[36] W. Wang, M. Sain, and P.A. Cooper, “Study of moisture absorption in natural
fiber plastic composites”, Composites Science and Technology, vol. 66, no. 3–4,
pp. 379-386, 2006.
[37] P.V. Joseph, M.S. Rabello, L.H.C. Mattoso, K. Joseph, and S. Thomas,
“Environmental effects on the degradation behaviour of sisal fibre reinforced
polypropylene composites”, Composites Science and Technology, vol. 62, no.
10–11, pp. 1357-1372, 2002.
Bibliography
198
[38] A. Le Duigou, A. Bourmaud, P. Davies, and C. Baley, “Long term immersion in
natural seawater of Flax/PLA biocomposite”, Ocean Engineering, vol. 90, pp.
140-148, 2014.
[39] C.P.L. Chow, X.S. Xing, and R.K.Y. Li, “Moisture absorption studies of sisal
fibre reinforced polypropylene composites”, Composites Science and
Technology, vol. 67, no. 2, pp. 306-313, 2007.
[40] K Goda, M.S. Sreekala, A Gomes, T Kaji, and J Ohgi, "." Composites Part A:
Applied Science and Manufacturing, vol. 37, no. 12, pp. 2213-2220, 2006.
[41] D. Ray, B. K. Sarkar, A. K. Rana, and N.R. Bose, “The mechanical properties of
vinylester resin matrix composites reinforced with alkali-treated jute fibres”,
Composites Part A: Applied Science and Manufacturing, vol. 32, no. 1, pp. 119-
127, 2001.
[42] H. Chen, M. Miao, and X. Ding, “Influence of moisture absorption on the
interfacial strength of bamboo/vinyl ester composites”, Composites Part A:
Applied Science and Manufacturing, vol. 40, no. 12, pp. 2013-2019, 2009.
[43] A. Espert, F. Vilaplana, and S. Karlsson, “Comparison of water absorption in
natural cellulosic fibres from wood and one-year crops in polypropylene
composites and its influence on their mechanical properties”, Composites Part A:
Applied Science and Manufacturing, vol. 35, no. 11, pp. 1267-1276, 2004.
[44] Y. Xu, S. Kawata, K. Hosoi, T. Kawai, and S. Kuroda, “Thermomechanical
properties of the silanized-kenaf/polystyrene composites”, eXPRESS Polymer
Letters vol. 3, no. 10, pp. 657-664, 2009.
[45] L.A. Pothan, and S. Thomas, “Polarity parameters and dynamic mechanical
behaviour of chemically modified banana fiber reinforced polyester composites”,
Composites Science and Technology, vol. 63, no. 9, pp. 1231-1240, 2003.
[46]. P. Kiekens and K.V.D. Velde, “Influence of Fiber Surface Characteristics on the
Flax/Polypropylene Interface”, Journal of Thermoplastic Composite Materials,
vol. 14, pp. 244-260, 2001.
[47] N.A. Zanjani and S. Kalyanasundaram, “A Comparison between Forming
Behaviours of Two Pre-Consolidated Woven Thermoplastic Composites”,
Journal of Materials Science and Chemical Engineering, vol. 3, no. 7, pp. 180-
189, 2015.
[48] N.A. Zanjani and S. Kalyanasundaram, “Stretch Forming Simulation of Woven
Composites Based on an Orthotropic Non-Linear Material Model”, Journal of
Materials Science and Chemical Engineering, vol. 3, no. 7, pp. 168-179, 2015.
[49] L. Mosse, P. Compston, W. J. Cantwell, M. Cardew-Hall, and S.
Kalyanasyndaram, “The effect of process temperature on the formability of
polypropylene based fibre–metal laminates”, Composites Part A: Applied
Science and Manufacturing, vol. 36, no. 8, pp. 1158-1166, 2005.
199
[50] L. Mosse, P. Compston, W. J. Cantwell, M. Cardew-Hall, and S.
Kalyanasundaram, “The development of a finite element model for simulating
the stamp forming of fibre–metal laminates”, Composite Structures, vol. 75, no.
1–4, pp. 298-304, 2006.
[51] S. Kalyanasundaram, S. DharMalingam, S. Venkatesan, and A. Sexton, “Effect
of process parameters during forming of self reinforced – PP based Fiber Metal
Laminate”, Composite Structures, vol. 97, pp. 332-337, 2013.
[52] J.S. Lee, S.J. Hong, W.R. Yu, and T.J. Kang, “The effect of blank holder force
on the stamp forming behavior of non-crimp fabric with a chain stitch”,
Composites Science and Technology, vol. 67, no. 3–4, pp. 357-366, 2007.
[53] P. Ouagne, D. Soulat, J. Moothoo, E. Capelle, and S. Gueret, “Complex shape
forming of a flax woven fabric; analysis of the tow buckling and misalignment
defect”, Composites Part A: Applied Science and Manufacturing, vol. 51, pp. 1-
10, 2013.
[54] J. Cao, R. Akkeman, P. Boisse, J. Chen, H.S. Cheng, E.F. de Graaf, J.L.
Gorczyca, P. Harrison, G. Hivet, J. Launay, W. Lee, L. Liu, S.V. Lomov, A.
Long, E. de Luycker, F. Morestin, J. Padvoiskis, X.Q Peng, J. Sherwood, Tz.
Stoilova, X.M. Tao, I. Verpoest, A. Willems, J. Wiggers, T.X. Yu, and B. Zhu,
"Characterization of mechanical behavior of woven fabrics: Experimental
methods and benchmark results". Composites Part A: Applied Science and
Manufacturing, Vol. 39, no. 6, pp. 1037-1053, 2008.
[55] M. Hou, “Stamp forming of continuous glass fibre reinforced polypropylene”,
Composites Part A: Applied Science and Manufacturing, vol. 28, no. 8, pp. 695-
702, 1997.
[56] K. Friedrich, and M. Hou, "On stamp forming of curved and flexible geometry
components from continuous glass fibre/polypropylene composites". Composites:
Part A: Applied Science and Manufacturing. vol. 29, no. 3, pp. 217-226, 1998.
[57] M. Sadighi, E. Rabizadeh, and F. Kermansaravi, "Effects of laminate sequencing
on thermoforming of thermoplastic matrix composites", Journal of Materials
Processing Technology, vol. 201, pp. 725-730, 2008.
[58] M. Hou, L. Ye, and Y.W. Mai, “Review – advances in processing of continuous
fibre reinforced composites with thermoplastic matrix”, Plastics, Rubber
Composites Processing Application, vol. 23, pp. 279-293, 1995.
[59] D. Trudel-Boucher, B. Fisa, J. Denault, and P. Gagnon, “Experimental
investigation of stamp forming of unconsolidated commingled E-
glass/polypropylene fabrics”, Composites Science and Technology, vol. 66, no.
3–4, pp. 555-570, 2006.
Bibliography
200
[60] M.D. Wakeman, T.A. Cain, C.D. Rudd, R. Brooks and A.C. Long,
“Compression moulding of glass and polypropylene composites for optimised
macro- and micro- mechanical properties—1 commingled glass and
polypropylene”, Composites Science and Technology, vol. 58, no. 12, pp. 1879-
1898, 1998.
[61] N.O. Cabrera, C.T. Reynolds, B. Alcock, and T. Peijs, “Non-isothermal stamp
forming of continuous tape reinforced all-polypropylene composite sheet”,
Composites Part A: Applied Science and Manufacturing, vol. 39, no. 9, pp.
1455-1466, 2008.
[62] R. Esmaeilizadeh, K. Khalili, and B. Mohammadsadeghi, "Simulated and
experimental investigation of stretch sheet forming of commercial AA1200
aluminum alloy". Transactions of Nonferrous Metals Society of China, vol. 24,
no. 2, pp. 484-490, 2014.
[63] Y. Dewang, M.S. Hora, and S.K. Panthi, "Influence of Blank Holding Force on
Stretch Flange Forming of Aluminum Alloy". Materials Today: Proceedings,
vol. 2, no. 4, pp. 1934-1941, 2015.
[64] D. He, D. Li, X. Li, and C. Jun. "Optimization on springback reduction in cold
stretch forming of titanium-alloy aircraft skin". Transactions of Nonferrous
Metals Society of China, vol. 20, no. 12, pp. 2350-2357, 2010.
[65] S.K. Panda, and D. Ravi Kumar, "Experimental and numerical studies on the
forming behavior of tailor welded steel sheets in biaxial stretch forming".
Materials & Design, Vol. 31, no. 3, pp. 1365-1383, 2010.
[66] B. Kinsey, Z. Liu, and J. Cao, "A novel forming technology for tailor-welded
blanks". Journal of Materials Processing Technology, vol. 99, pp. 145-153,
2000.
[67] S.M. Chan, L.C. Chan, and T.C. Lee, "Tailor-welded blanks of different
thickness ratios effects on forming limit diagrams". Journal of Materials
Processing Technology, vol. 132, pp. 95-101, 2003.
[68] A. Sexton, W. Cantwell, and S. Kalyanasundaram, "Stretch forming studies on a
fibre metal laminate based on a self-reinforcing polypropylene composite".
Composite Structures, Vol. 94, pp. 431-437, 2012.
[69] N. Asnafi, G Langstedt, C.H. Andersson, N. Ostergren, and T. Hakansson. "A
new lightweight metal-composite-metal panel for applications in the automotive
and other industries". Thin-Walled Structures, vol. 36, no. 4, pp. 289-310, 2000.
[70] G. Reyes and H. Kang. "Mechanical behavior of lightweight thermoplastic
fiber–metal laminates". Journal of Materials Processing Technology, vol. 186,
no. 1–3, pp. 284-290, 2007.
[71] K.J. Kim, D. Kim, S.H. Choi, K. Chung, K.S. Shin, F. Barlat, K.H. Oh, and J.R.
Youn. "Formability of AA5182/polypropylene/AA5182 sandwich sheets".
Journal of Materials Processing Technology, vol. 139, no. 1–3, pp. 1-7, 2003.
201
[72] O.A. Sokolova, A. Carradò, and H. Palkowski, "Metal–polymer–metal
sandwiches with local metal reinforcements: A study on formability by deep
drawing and bending". Composite Structures, vol. 94, no. 1, pp. 1-7. 2011.
[73] N.A. Zanjani, A. Sexton, and S. Kalyanasundaram, “Induced forming modes in
a pre-consolidated woven polypropylene composite during stretch forming
process at room temperature: I. Experimental studies”, Composites Part A:
Applied Science and Manufacturing, vol. 68, pp. 251-263, 2015.
[74] K. Nakazima, T. Kikuma, and K. Asuka, “Study on the formability of steel
sheets”, Yawata Technical Report, No.264 (1968) September.
[75] K.S. Raghavan, “A simple technique to generate in-plane forming limit curves
and selected applications”, Metallurgical and Materials Transactions A, vol.
26A, pp. 2075-2084, 1995.
[76] L. Gorbatikh, and S.V. Lomov, "3 - Damage accumulation in textile composites,
in Modeling Damage, Fatigue and Failure of Composite Materials". Woodhead
Publishing. pp. 41-59, 2016.
[77] N. De Greef, L. Gorbatikh, A. Gordara, L. Mezzo, S.V. Lomov, and I. Verpoest,
"The effect of carbon nanotubes on the damage development in carbon
fibre/epoxy composites". Carbon, vol. 49, pp. 4650-4664, 2011.
[78] E. Bogdanovich, M. Karahan, S.V. Lomov, and I. Verpoest, "Quasi-static tensile
behaviour and progressive damage in carbon/epoxy composite reinforced with
3D non-crimp orthogonal woven fabric". Mechanics of Materials, vol. 62, pp.
14-31, 2013.
[79] M. Kersani, S.V. Lomov, A.W. Van Vuure, A. Bouabdallah, and I. Verpoest,
"Damage in flax/epoxy quasi unidirectional woven laminates under quasi-static
tension". Journal of Composite Materials, vol. 49, pp. 403-413, 2015.
[80] W. Roundi, A.E. Mahi, A.E. Gharad, and J.L. Rebiere, "Experimental and
numerical investigation of the effects of stacking sequence and stress ratio on
fatigue damage of glass/epoxy composites", Composites Part B: Engineering,
vol. 109, pp. 64-71, 2017.
[81] Y. Ma, M. Ueda, T. Yokozeki, T. Sugahara, Y. Yang, and H. Hamada, "A
comparative study of the mechanical properties and failure behavior of carbon
fiber/epoxy and carbon fiber/polyamide 6 unidirectional composites", Composite
Structures, vol. 160, pp. 89-99, 2017.
[82] J. Mayen, A. Abundez, E. Alcudia, J.A. Arellano, J. Colin, I. Pereyra, and I.P.
Lee, "Fractographic relation between progressive failure and strain measurement
techniques for recently developed configuration of carbon fiber/epoxy laminate",
Polymer Testing, vol. 57: pp. 156-164, 2017.
[83] C. Wang, X. Ji, A. Roy, V.V. Silberschmidt, and Z. Chen, "Shear strength and
fracture toughness of carbon fibre/epoxy interface: effect of surface treatment",
Materials & Design, vol. 85, pp. 800-807, 2015.
Bibliography
202
[84] M. Nourjani Pourmoghadam, R. Shahrokh Esfahani, M. R. Morovvati, and B.
Nekooei Rizi, “Bifurcation analysis of plastic wrinkling formation for
anisotropic laminated sheets (AA2024–Polyamide–AA2024)”, Computational
Materials Science, vol. 77, pp. 35-43, 2013.
[85] G. Romhany, T. Barany, T. Czigany, and J. Karger-Kocsis. "Fracture and failure
behavior of fabric-reinforced all-poly(propylene) composite". Polymers for
Advanced Technologies, vol. 18, pp. 90–96, 2007.
[86] S. Davey, R. Das, W. J. Cantwell, and S. Kalyanasundaram. “Forming studies of
carbon fibre composite sheets in dome forming processes”, Composite
Structures, vol. 97, pp. 310-316, 2013.
[87] O.M.L. Asumani, R.G. Reid, and R. Paskaramoorthy, "The effects of alkali–
silane treatment on the tensile and flexural properties of short fibre non-woven
kenaf reinforced polypropylene composites", Composites Part A: Applied
Science and Manufacturing, vol. 43, pp. 1431-1440, 2012.
[88] J. Aboudi, S. Arnold, and B. Bednarcyk, "Micromechanics of Composite
Materials". pp. 61, Charpter 2, 2013.
[89] L.J. Hart-Smith, “The truncated maximum strain composite failure model”,
Composites, vol. 24, no. 7, pp. 587-591, 1993.
[90] L.J. Hart-Smith, “Predictions of the original and truncated maximum-strain
failure models for certain fibrous composite laminates”, Composites Science and
Technology, vol. 58, no. 7, pp. 1151-1178, 1998.
[91] S.W. Tsai and E.M. Wu, “A General Theory of Strength for Anisotropic
Materials”, Journal of Composite Materials, vol. 5, pp. 58-80, 1971.
[92] K. Rohwer, “Predicting fibre composite damage and failure”, Journal of
Composite Materials, vol. 49, no. 21, pp. 1-11, 2014.
[93] A. Rotem, "Prediction of laminate failure with the Rotem failure criterion",
Composites Science and Technology, vol. 58, pp. 1083-1094, 1998.
[94] Z. Hashin, and A. Rotem, "A fatigue failure criterion for fibre reinforced
materials", Journal of Composite Materials, vol. 7, pp. 448-464, 1973.
[95] A. Rotem, and Z. Hashin, "Failure modes of angle ply laminates", Journal of
Composite Materials, vol. 9, pp. 191-206, 1975.
[96] A. Rotem, and H.G. Nelson, "Fatigue behavior of graphite–epoxy laminate at
elevated temperatures", Fatigue of Fibrous Composite Materials. ASTM
International, 1981.
[97] A. Rotem, "The Rotem failure criterion: theory and practice", Composites
Science and Technology, vol. 62, pp. 1663-1671, 2002.
203
[98] E.C. Edge, "Stress-Based Grant-Sanders Method for Predicting Failure of
Composite Laminates", Composites Science and Technology, vol. 58, pp. 1033-
1041, 1998.
[99] W.E. Wolfe, and T.S. Butalia, "A strain-energy based failure criterion for non-
linear analysis of composite laminates subjected to biaxial loading", Composites
Science and Technology,vol. 58, pp. 1107-1124, 1998.
[100] R.S. Sandhu, "Ultimate Strength Analysis of Symmetric Laminates", No.
AFFDL-TR-73-137. AIR FORCE FLIGHT DYNAMICS LAB WRIGHT-
PATTERSON AFB OHIO, 1974.
[101] D. Willats, "Advances in the use of high performance continuous fibre
reinforced thermoplastics", SAMPE Journal, 1984.
[102] B. Madsen and H. Lilholt, “Physical and mechanical properties of unidirectional
plant fibre composites—an evaluation of the influence of porosity”, Composites
Science and Technology, vol. 63, no. 9, pp. 1265-1272, 2003.
[103] H.B. Campos, M.C. Butuc, J.J. Grácio, and L.M.F. Duarte, “Theorical and
experimental determination of the forming limit diagram for the AISI 304
stainless steel”, Journal of Materials Processing Technology, vol. 179, no. 1–3,
pp. 56-60, 2006.
[104] S.B. Kim, H. Huh, H.H. Bok, and M.B. Moon, “Forming limit diagram of auto-
body steel sheets for high-speed sheet metal forming”, Journal of Materials
Processing Technology, vol. 211, no. 5, pp. 851-862, 2011.
[105] V. Uthaisangsuk, U. Prahl, and W. Bleck, "Stress based failure criterion for
formability characterisation of metastable steels". Computational Materials
Science, vol. 39, no. 1, pp. 43-48, 2007.
[106] M.C. Butuc, J.J. Gracio, and A. Barata da Rocha, "An experimental and
theoretical analysis on the application of stress-based forming limit criterion".
International Journal of Mechanical Sciences, vol. 48, no. 4, pp. 414-429. 2006.
[107] B.S. Levy, and C.J. Van Tyne, "An approach to predicting the forming limit
stress components from mechanical properties". Journal of Materials Processing
Technology, vol. 229, pp. 758-768, 2016.
[108] S. Panich, F. Barlat, V. Uthaisangsuk, S. Suranuntchai, and S. Jirathearanat,
"Experimental and theoretical formability analysis using strain and stress based
forming limit diagram for advanced high strength steels". Materials & Design,
vol. 51, pp. 756-766, 2013.
[109] W.M. Sing, and K.P. Rao, "Study of sheet metal failure mechanisms based on
stress-state conditions". Journal of Materials Processing Technology, vol. 67, no.
1, pp. 201-206, 1997.
[110] R. Arrieux, C. Bedrin, and M. Boivin., "Determination of an intrinsic forming
limit stress diagram for isotropic sheets". In: Proceedings of the 12th IDDRG
congress, Santa Margherita, Ligure, pp. 61-71, 1982.
Bibliography
204
[111] H. Lin, J. Wang, A.C. Long, M.J. Clifford, and P. Harrison, “Predictive
modelling for optimization of textile composite forming”, Composites Science
and Technology, vol. 67, no. 15–16, pp. 3242-3252, 2007.
[112] P.F. Liu, Z.P. Gu, Y.H. Yang, and X.Q. Peng, “A nonlocal finite element model
for progressive failure analysis of composite laminates”, Composites Part B:
Engineering, vol. 86, pp. 178-196, 2016.
[113] S. Liu, C. Liu, Y. Hu, S. Gao, Y. Wang, and H. Zhang, “Fatigue life assessment
of centrifugal compressor impeller based on FEA”, Engineering Failure
Analysis, vol. 60, pp. 383-390, 2016.
[114] M. Penasa, L. Argani, D. Misseroni,F. Dal Corso, M. Cova and A. Piccolroaz,
“Computational modelling and experimental validation of industrial forming
processes by cold pressing of aluminum silicate powder”, Journal of the
European Ceramic Society. vol. 36, pp. 2351-2362, 2016.
[115] F.J. Harewood, and P.E. McHugh, “Comparison of the implicit and explicit
finite element methods using crystal plasticity”, Computational Materials
Science, vol. 39, no. 2, pp. 481-494, 2007.
[116] Obtained from
http://mashayekhi.iut.ac.ir/sites/mashayekhi.iut.ac.ir/files//u32/presentation4.pdf,
Viewed on the 11th of March, 2015.
[117] Abaqus Theory Manual.
[118] P. Boisse, B. Zouari, and A. Gasser, “A mesoscopic approach for the simulation
of woven fibre composite forming”, Composites Science and Technology, vol.
65, no. 3–4, pp. 429-436, 2005.
[119] K. Vanclooster, S.V. Lomov, and I. Verpoest, “Experimental validation of
forming simulations of fabric reinforced polymers using an unsymmetrical
mould configuration”, Composites Part A: Applied Science and Manufacturing,
vol. 40, no. 4, pp. 530-539, 2009.
[120] J.H. Lee, J.H. Vogel, and K.Y. Rhee, "An analysis of stretch forming of
thermoplastic composites". Polymer Composites, Vol. 23, pp. 442-453. 2002.
[121] P. Badel, S. Gauthier, E. Vidal_Salle, and P. Boisse. "Rate constitutive equations
for computational analyses of textile composite reinforcement mechanical
behaviour during forming". Composites Part A: Applied Science and
Manufacturing, Vol. 40, no. 8, pp. 997-1007. 2009.
[122] Z. Marciniak, J.L. Duncan, and S.J. Hu, “Mechanics of Sheet Metal Forming”,
2002.
[123] P. Harrison, R.H.W.T Thije, R. Akkeman, and A.C Long, “Characterisation and
modelling friction at the tool–ply interface for thermoplastic woven composites”,
In: NATO Advanced Research Workshop: Use of Textile Composites
Technology for Safer Vehicles, Kiev, Ukraine, 18-21 May, 2009.
205
[124] P. Harrison, R. Gomes, and N. Curado-Correia, “Press forming a 0/90 cross-ply
advanced thermoplastic composite using the double-dome benchmark geometry”,
Composites Part A: Applied Science and Manufacturing, vol. 54, pp. 56-69,
2013.
[125] M. Benítez-Guerrero, J. López-Beceiro, P.E. Sánchez-Jiménez, and J. Pascual-
Cosp, “Comparison of thermal behavior of natural and hot-washed sisal fibers
based on their main components: Cellulose, xylan and lignin. TG-FTIR analysis
of volatile products”, Thermochimica Acta, vol. 581, pp. 70-86, 2014.
[126] W. Wang, A Lowe, and S Kalyanasundaram, “A study on continuous flax fibre
reinforced polypropylene composite in stamp forming process”, Advanced
Composites Letters, vol. 22, pp. 86-89, 2013.
[127] G. Lebrun, M.N. Bureau and J. Denault, “Thermoforming stamping of
continuous glass fiber/polypropylene composites: interlaminar and tool-laminate
shear properties”, Journal of Thermoplastic Composite Materials, 2004.
[128] J.A.E. Manson, M. Wakeman, and N. Bernet, “Composite processing and
manufacturing - An overview”, Comprehensive Composite Materials, vol. 2, pp.
577-607, 2000.
[129] M.S. Meon, M.F. Othman, H. Husain, M.F. Remeli, and M.S.M. Syawal.
“Improving tensile properties of kenaf fibres treated with sodium hydroxide”. In
Proceedings of the International Symposium on Robotics and Intelligent Sensors
2012 (IRIS 2012), Kuching, Sarawak, Malaysia, vol. 41, pp/1587–1592, 2012.
[130] C. Schuerch, M.P. Burdick, and M. Mahdalik “Liquid ammonia-solvent
combinations in wood plasticization”, Chemical Treatment, vol. 5, pp. 101, 1966.
[131] K. Van De Velde and P. Kiekens, “Influence of fibre surface characteristics on
the flax/polypropylene interface”, Journal of Composite Materials, vol. 14, pp.
244-260, 2001.
[132] A. Arbelaiz, B. Fernández, G. Cantero, R. Llano-Ponte, A. Valea, and I.
Mondragon. “Mechanical properties of flax fibre/polypropylene composites.
Influence of fibre/matrix modification and glass fibre hybridization”,
Composites Part A: Applied Science and Manufacturing, vol. 36, no. 12, pp.
1637-1644, 2005.
[133] S. Mishra and M. Sain “Long-term performance of natural fibre composites”, In
Properties and Performance of Natural-Fibre Composites; Pickering, K.L., Ed.;
Woodhead Publishing: Cambridge, UK, pp. 461-502, 2008.
[134] D. Gay, S.W. Tsai and S.V. Hoa “Composites Materials - Design and
Applications”, Chapter 18, pp 442, 2003.
[135] W. J. Cantwell, and J. Morton, “The impact resistance of composite materials —
a review”, Composites, vol. 22, no. 5, pp. 347-362, 1991.
Bibliography
206
[136] E. Bayraktar, N. Isac, and G. Arnold, “Buckling limit diagrams (BLDs) of
interstitial free steels (IFS): Comparison of experimental and finite element
analysis”, Journal of Materials Processing Technology, vol. 164–165, pp. 1487-
1494, 2005.

207
Appendix A
Stress-strain behaviour of NFC materials in different
conditions of the water treatment
Untreated:
𝐸1 = 916 − 8013 ∗ 𝐴𝑏𝑠(휀1)
𝐸2 = 916 − 8013 ∗ 𝐴𝑏𝑠(휀2)
𝐺 = 30 + 200 ∗ 𝐸𝑥𝑝(−10 ∗ 𝐴𝑏𝑠(휀3))
Water-treated:
𝐸1 = 551 + 1112 ∗ 𝐴𝑏𝑠(휀1)
𝐸2 = 551 + 1112 ∗ 𝐴𝑏𝑠(휀2)
𝐺 = −631 ∗ (𝐴𝑏𝑠(휀3))3+ 826 ∗ (𝐴𝑏𝑠(휀3))
2− 360 ∗ 𝐴𝑏𝑠(휀3)
Redried:
𝐸1 = 895 − 8674 ∗ 𝐴𝑏𝑠(휀1)
𝐸2 = 895 − 8674 ∗ 𝐴𝑏𝑠(휀2)
𝐺 = 30 + 200 ∗ 𝐸𝑥𝑝(−10 ∗ 𝐴𝑏𝑠(휀3))

Stress-strain behaviour of NFC materials in different conditions of the water treatment
208
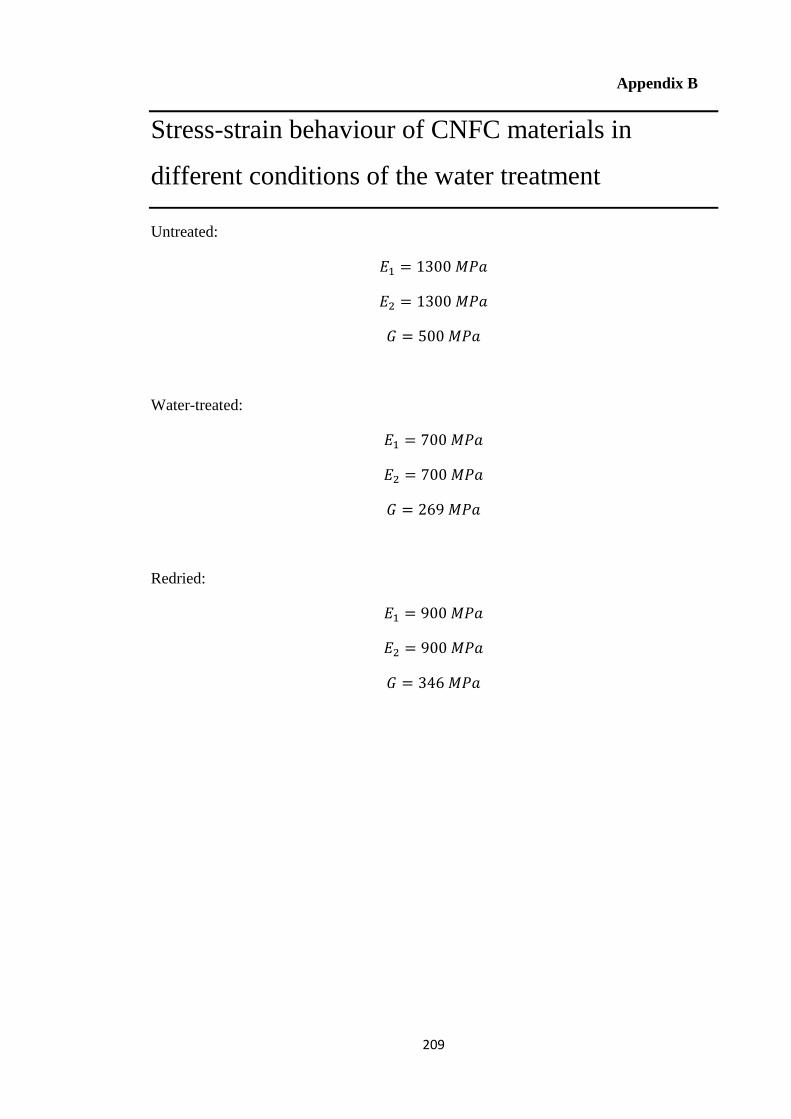
209
Appendix B
Stress-strain behaviour of CNFC materials in
different conditions of the water treatment
Untreated:
𝐸1 = 1300 𝑀𝑃𝑎
𝐸2 = 1300 𝑀𝑃𝑎
𝐺 = 500 𝑀𝑃𝑎
Water-treated:
𝐸1 = 700 𝑀𝑃𝑎
𝐸2 = 700 𝑀𝑃𝑎
𝐺 = 269 𝑀𝑃𝑎
Redried:
𝐸1 = 900 𝑀𝑃𝑎
𝐸2 = 900 𝑀𝑃𝑎
𝐺 = 346 𝑀𝑃𝑎

Stress-strain behaviour of CNFC materials in different conditions of the water
treatment
210