Formatvorlage für Diplomarbeiten
88
Transcript of Formatvorlage für Diplomarbeiten

II
III
Table of contents
1 Introduction ......................................................................................... 1
1.1 Overview ................................................................................................. 1
1.2 Problem Statement ................................................................................. 1
1.3 Goals ....................................................................................................... 3
2 Portrayal of relevant Assistance Systems ........................................ 4
2.1 The Driving Task .................................................................................... 4
2.2 Purpose of Assistance Systems ........................................................... 5
2.3 Automation Level ................................................................................... 6
2.4 Information Flow based Approach ....................................................... 7
2.5 Current Driver Assistance Systems ..................................................... 8
2.5.1 Sight Enhancing Systems ....................................................................... 8
2.5.1.1 Assistance Demand ......................................................................... 8
2.5.1.2 Assistance Goal ............................................................................... 8
2.5.1.3 Functional Task ............................................................................... 8
a Assisting Light Distribution ............................................................. 9
b Adaptive Light Distribution ............................................................. 9
c Night Vision Systems ..................................................................... 9
2.5.2 Parking Assistance ................................................................................ 10
2.5.2.1 Assistance Demand ....................................................................... 10
2.5.2.2 Assistance Goal ............................................................................. 10
2.5.2.3 Functional Task ............................................................................. 11
a Purely Informational Parking Assistance ...................................... 11
b Guided Parking Assistance .......................................................... 11
c Semi-Automatic Parking (Transversal Automation) ..................... 11
d Fully Automatic Parking (Transversal and Longitudinal Automation) ..................................................................................................... 12
e Fully Automatic Parking with Automatic Parking Spot Search ..... 12
IV
2.5.3 Active Cruise Control ............................................................................ 12
2.5.3.1 Assistance Demand ....................................................................... 12
2.5.3.2 Assistance Goal ............................................................................. 12
2.5.3.3 Functional Task ............................................................................. 12
2.5.4 Front Collision Mitigation (Avoidance) Systems ................................ 13
2.5.4.1 Assistance Demand ....................................................................... 13
2.5.4.2 Assistance Goal ............................................................................. 13
2.5.4.3 Functional Task ............................................................................. 13
2.5.5 Lane Departure Warning and Lane Keeping Support ......................... 14
2.5.5.1 Assistance Demand ....................................................................... 14
2.5.5.2 Assistance Goal ............................................................................. 14
2.5.5.3 Functional Task ............................................................................. 14
2.5.6 Lane Change Assistance ...................................................................... 15
2.5.6.1 Assistance Demand ....................................................................... 15
2.5.6.2 Assistance Goal ............................................................................. 15
2.5.6.3 Functional Task ............................................................................. 15
2.5.7 Junction Assistance .............................................................................. 16
2.5.7.1 Assistance Demand ....................................................................... 16
2.5.7.2 Assistance Goal ............................................................................. 16
2.5.7.3 Functional Task ............................................................................. 16
2.6 Select Topics on the Future of Assistance Systems ........................ 18
2.6.1 Car to Car (C2C) and Car to Infrastructure Communication (C2I) ..... 18
2.6.2 Autonomous Driving ............................................................................. 19
3 Environment Sensors for ADAS Functions .................................... 21
3.1 Ultrasonic Sensors ............................................................................... 21
3.1.1 Physical Measurement Principle .......................................................... 21
3.1.2 Informationflow and -processing ......................................................... 22
3.1.3 Measurement Errors .............................................................................. 22
3.1.4 Implications for a Stimulation System ................................................. 22
3.2 Radar ..................................................................................................... 22
3.2.1 Physical Measurement Principle .......................................................... 23
3.2.1.1 Reflexion Cross Section (RCS) ..................................................... 23
3.2.1.2 Distance Measurement .................................................................. 23
3.2.1.3 Doppler Effect ................................................................................ 24
V
3.2.1.4 Angular Measurement ................................................................... 24
3.2.1.5 Scanning........................................................................................ 25
3.2.1.6 Monopuls ....................................................................................... 25
3.2.1.7 Mulitbeam ...................................................................................... 26
3.2.1.8 Other Developments ...................................................................... 26
3.2.2 Informationflow and -processing ......................................................... 26
3.2.3 Measurement Errors .............................................................................. 26
3.2.4 Implications for a Stimulation System ................................................. 27
3.3 Lidar ....................................................................................................... 28
3.3.1 Physical Measurement Principle .......................................................... 28
3.3.1.1 Distance Measurement .................................................................. 29
3.3.1.2 Velocity and Acceleration .............................................................. 29
3.3.1.3 Scanning........................................................................................ 29
3.3.1.4 Multibeam ...................................................................................... 29
3.3.2 Informationflow and -processing ......................................................... 30
3.3.3 Measurement Errors .............................................................................. 30
3.3.4 Implications for a Stimulation System ................................................. 31
3.4 3D Time of Flight/ Range Imager ........................................................ 31
3.4.1 Physical Measurement Principle .......................................................... 32
3.4.2 Informationflow and -processing ......................................................... 32
3.4.3 Measurement Errors .............................................................................. 33
3.4.4 Implications for a Stimulation System ................................................. 33
3.5 Camera .................................................................................................. 34
3.5.1 Physical Measurement Principle .......................................................... 34
3.5.2 Informationflow and -processing ......................................................... 35
3.5.3 Measurement Errors .............................................................................. 36
3.5.4 Implications for a Stimulation System ................................................. 36
3.6 GPS ........................................................................................................ 36
4 Stimulation and Simulation for ADAS on HiL and ViL Level.......... 38
5 Ultrasonic Stimulation System ........................................................ 40
5.1 The Parking Assistance System ......................................................... 41
VI
5.1.1 Functionality .......................................................................................... 42
5.1.2 Measurement Process ........................................................................... 43
5.1.3 Signal Generation .................................................................................. 43
5.1.4 Ultrasonic Sensor Characterization ..................................................... 45
5.1.5 Hardware Requirements ....................................................................... 51
5.2 Ultrasonic Emulation Unit ................................................................... 52
5.2.1 Signal Generation .................................................................................. 52
5.2.2 Signal Conditioning ............................................................................... 53
5.3 Signal Processing Unit ........................................................................ 55
5.3.1 Detection ................................................................................................ 55
5.3.2 Signal Generation Activation ................................................................ 56
5.3.3 Calculation / Real Time Environment ................................................... 56
5.3.4 Timing and Resolution Analysis .......................................................... 58
5.4 Simulation Environment CarMaker..................................................... 63
6 Discussion and Outlook ................................................................... 72
7 Bibliography ...................................................................................... 73
8 Table of Figures ................................................................................ 75
9 Appendix ........................................................................................... 78
Introduction - Overview
1
1 Introduction
1.1 Overview
This thesis deals with Advanced Driver Assistance Systems (ADAS) and their environment
sensors in the light of requirements for sensor stimulation systems. For these topics the
books “Handbuch Fahrerassistenzsysteme” [1] by Winner et al. and the “Fahrstabilisier-
ungssysteme und Fahrerassistenzsysteme” [10] by Reif have been the main sources for
information about the state of the art. For one such environment sensing principle, ultrason-
ic sensors, a proof of concept sensor stimulation is presented. In chapter 1 the current state
of the art and the motivation for this thesis are presented. Chapter 2 portrays the core as-
pects of relevant ADAS and in chapter 3 an overview about the environment sensing sys-
tems for ADAS is given. Chapter 4 discusses the core aspects for the design of sensor
stimulation based test systems. Chapter 5 deals with the realization of a proof of concept
for an ultrasonic stimulation system. Finally, the concluding chapter 6 gives a discussion
and outlook on what will be done next.
1.2 Problem Statement
The costs of sensors for ADAS have been continuously declining, while their capabilities
have been improving. This is a driving factor behind the continuous movement of ADAS into
the mass market [4]. In terms of Passive Safety in automobiles the development process
has come very close to its full potential, further gains can therefore only be achieved with
huge effort. Active Safety is the next step to reduce the risks drivers are exposed to in traffic
[1]. A data analysis, conducted by Treat and his coworkers, of 2258 accident reports inves-
tigated the causes of accidents. They found that human failure as accident cause was pre-
sent in 93%, environmental factors as cause were present in 34% and vehicle factors were
present in 14% of all accidents [5]. Despite the problems with defining the term “cause”
these results suggest that ADAS can potentially improve the consequences of the majority
of accidents. The introduction of the Breaking Assistance System (BAS) by Mercedes Benz
reinforces this perspective as the amount of rear shunt accidents by newly registered cars
dropped from 10.5 per 100000 newly registered cars in 1998 to 9.7 in 2000. The BAS rec-
ognizes when a driver breaks in an emergency situation. In this situation the brakes are
used immediately at their maximum capacity, whereas the average driver brakes a little,
Introduction - Problem Statement
2
realizes that his breaking is not sufficient and only then brakes at maximum capacity [6].
Assistance systems such as these have come a long way since then and can now warn the
driver of an impending collision and will even initiate a partial brake to reduce damage and
grab the drivers’ attention. Volvo and Daimler amongst others have pledged to offer cars on
the market by 2020 that will not cause accidents by themselves. A goal which is only
achievable through ADAS [3][4].
Current ADAS sense their environment and process this information in order to inform the
driver and/ or to make decisions and act upon those decisions, influencing the driving pro-
cess as a result. Through this co-influence on the driving task all situations which driver and
automobile experience become relevant test situations, making it hard to fully test ADAS.
The effective development of ADAS requires testing on each stage of development to gain
information about whether the ADAS are functioning as expected and how well the interac-
tion between humans and ADAS works. These tests need to be as reproducible and relia-
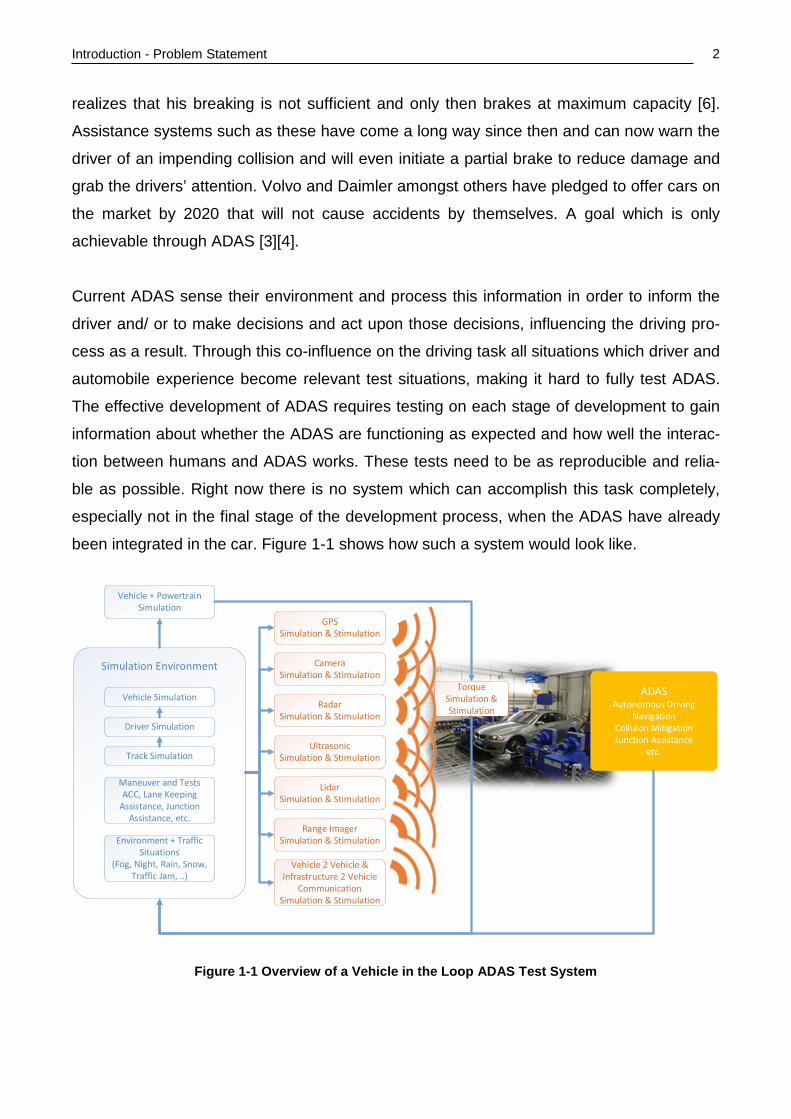
ble as possible. Right now there is no system which can accomplish this task completely,
especially not in the final stage of the development process, when the ADAS have already
been integrated in the car. Figure 1-1 shows how such a system would look like.
Simulation Environment
Track Simulation
Driver Simulation
Vehicle Simulation
Environment + Traffic Situations
(Fog, Night, Rain, Snow, Traffic Jam, ..)
Maneuver and TestsACC, Lane Keeping
Assistance, Junction Assistance, etc.
Vehicle + Powertrain Simulation
Camera Simulation & Stimulation
Radar Simulation & Stimulation
Ultrasonic Simulation & Stimulation
Lidar Simulation & Stimulation
Range Imager Simulation & Stimulation
Vehicle 2 Vehicle & Infrastructure 2 Vehicle
Communication Simulation & Stimulation
Torque Simulation & Stimulation
GPS Simulation & Stimulation
ADASAutonomous Driving
NavigationCollision MitigationJunction Assistance
etc.
Figure 1-1 Overview of a Vehicle in the Loop ADAS Test System

Introduction - Goals
3
1.3 Goals
This thesis aims at achieving two goals. Firstly, the frame in which Advanced Driver Assis-
tance Systems and their sensors are used, will be established and the requirements a
Software in the Loop (SiL) or Vehicle in the Loop (ViL) test system would have to fulfill in
order to be an essential component throughout the ADAS development process will be de-
duced from that. Secondly a proof of concept system for ultrasonic stimulation will be creat-
ed.
Portrayal of Relevant Assistance Systems - The Driving Task
4
2 Portrayal of Relevant Assistance Systems
In order to decide which capabilities a test system for assistance systems needs, it is nec-
essary to know the frame into which the characteristics of assistance systems fit. In order
to gain this scope the assistance systems need to be described. Every assistance system
has been implemented by different manufacturers in multiple ways. Tests will have to be
tailored to each specific implementation. Discussing all currently existing versions would
exceed the size of this document by far, but there are several angles from which one type
of assistance system has common attributes with its siblings. Every assistance system has
a purpose which is aimed at serving needs by improving or taking over, either in part or in
full, aspects of the driving task. Also, they achieve different levels of automation which
come with different demands on error-free function, error detection and behavior during
failure. Additionally, each assistance system makes decisions based on information which
have undergone processing at several layers before being used. The assistance systems
will be viewed through these lenses to keep their characterization short.
2.1 The Driving Task
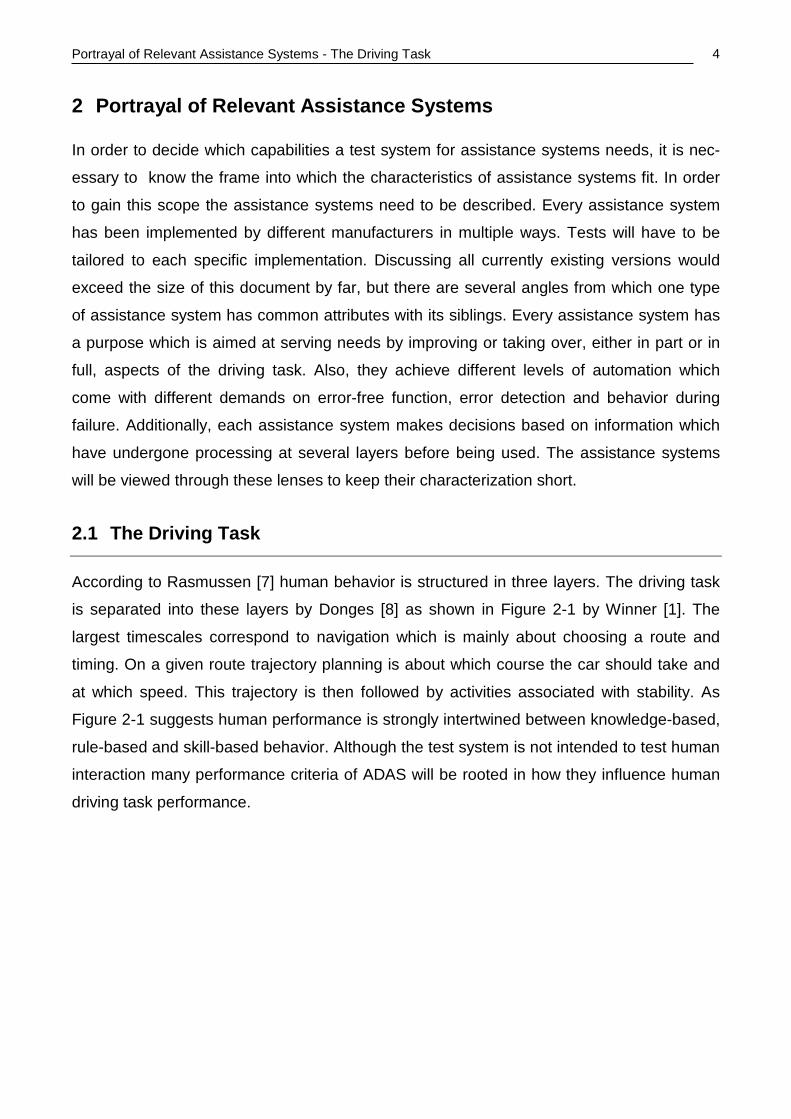
According to Rasmussen [7] human behavior is structured in three layers. The driving task
is separated into these layers by Donges [8] as shown in Figure 2-1 by Winner [1]. The
largest timescales correspond to navigation which is mainly about choosing a route and
timing. On a given route trajectory planning is about which course the car should take and
at which speed. This trajectory is then followed by activities associated with stability. As
Figure 2-1 suggests human performance is strongly intertwined between knowledge-based,
rule-based and skill-based behavior. Although the test system is not intended to test human
interaction many performance criteria of ADAS will be rooted in how they influence human
driving task performance.
Portrayal of Relevant Assistance Systems - Purpose of Assistance Systems
5
Automobile
EnvironmentDriverKnowledge Based Behaviour
Identification Decision Making Planning
Rule Based Behaviour
RecognitionAssociation
and Attribution
Repertoire of Behavior rules
Skill Based Behaviour
Filtering for Characteristics
Stimulus – Reaction
automatisms
Sensory Information Signals Motoric
actions
Navigation
Steering
Stabilization
Longitudinal and
Transversal dynamics
Road Surface
Driving Sphere(Street and
Traffic)
Road Network
Actual trajectory and actual velocityRange of safe control variables
Alternative Routes
Driving Task
Chosen Route and Schedule
Chosen Control Variables:
target trajectory target velocity
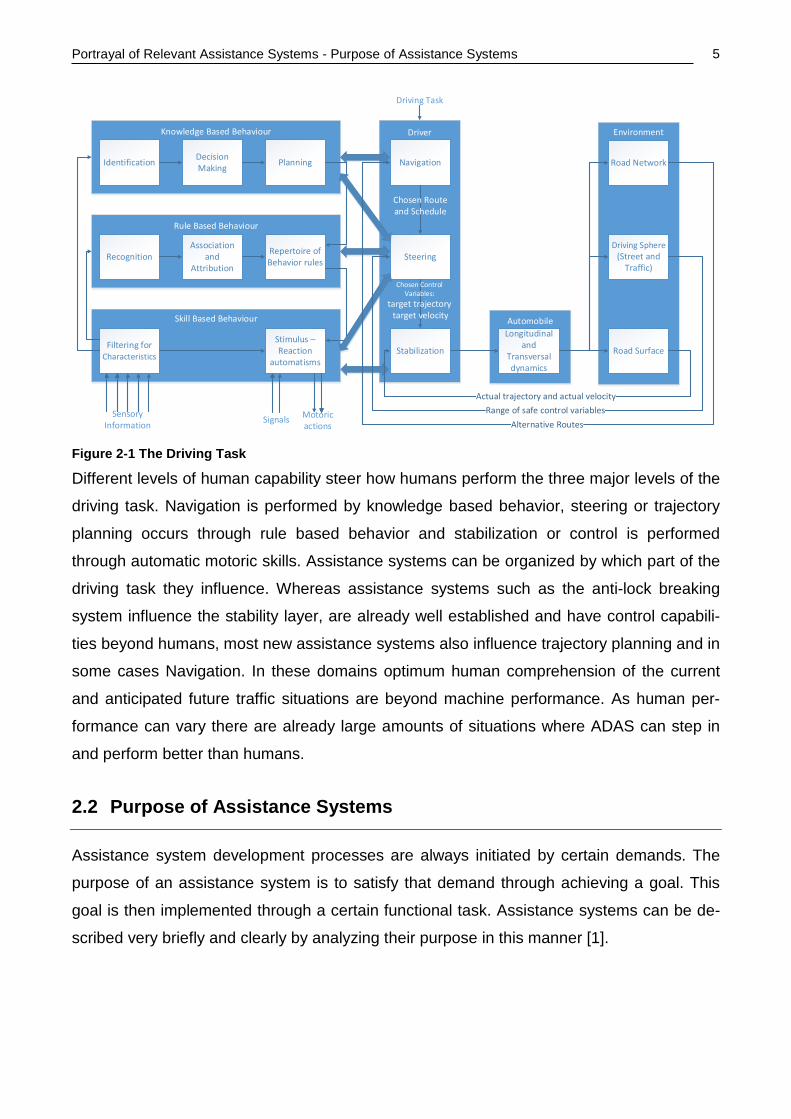
Figure 2-1 The Driving Task
Different levels of human capability steer how humans perform the three major levels of the
driving task. Navigation is performed by knowledge based behavior, steering or trajectory
planning occurs through rule based behavior and stabilization or control is performed
through automatic motoric skills. Assistance systems can be organized by which part of the
driving task they influence. Whereas assistance systems such as the anti-lock breaking
system influence the stability layer, are already well established and have control capabili-
ties beyond humans, most new assistance systems also influence trajectory planning and in
some cases Navigation. In these domains optimum human comprehension of the current
and anticipated future traffic situations are beyond machine performance. As human per-
formance can vary there are already large amounts of situations where ADAS can step in
and perform better than humans.
2.2 Purpose of Assistance Systems
Assistance system development processes are always initiated by certain demands. The
purpose of an assistance system is to satisfy that demand through achieving a goal. This
goal is then implemented through a certain functional task. Assistance systems can be de-
scribed very briefly and clearly by analyzing their purpose in this manner [1].
Portrayal of Relevant Assistance Systems - Automation Level
6
Assistance Demand
In order to develop an assistance system there must be a demand. This demand is usually
related to safety or to comfort. The developed assistance system is always aimed to satisfy
one or both needs.
Assistance Goal
The goal states how the assistance system can improve the user’s satisfaction of their
needs. The formulation of the goal focuses on what change in the user’s experience is sup-
posed to happen.
Functional Task
The functional task describes which capabilities the assistance system needs in order to
improve user satisfaction. The formulation of the functional task focuses on what the end
result of the assistance function should be. The functional task does not describe the whole
function of the assistance system. Usually, any realization of a functional task requires a
large amount of additional details on lower level functionality.
2.3 Automation Level
The automation level describes to which extent the assistance system influences the driving
task. Five different levels are discerned. Depending on which level of automation an assis-
tance system reaches different legislation and safety requirements apply. The Automotive
Safety Integrity Level (ASIL) of ISO 26262 is established by performing a risk analysis of a
potential hazard by looking at the severity, exposure and controllability of the vehicle oper-
ating scenario. The safety goal for that hazard in turn carries the ASIL requirements [16].
With increasing automation the projected safety risks also increase, raising the required
amount of verification and validation. The description and amount of levels can change be-
tween nations and geographic regions. The Society of Automotive Engineers International
(SAE International) provides an overview of the most prominent categorizations [16] includ-
ing the categorization given here by the German Federal Highway Research Institute
(Deutsches Bundesanstalt für Straßenwesen (BASt)) (Appendix A)
L0 Driver only
The driver permanently performs all transversal and longitudinal control even when en-
hanced by warning or intervention systems.
Portrayal of Relevant Assistance Systems - Information Flow based Approach
7
L1 Driver Assistance
The driver permanently has control. Only one task can be automated to a certain extent.
L2 Partly automated
The system takes over one or more parts of the driving task. The driver has to permanently
monitor the system and be prepared to take over control at any time.
L3 Highly automated
The system takes over one or more parts of the driving task, in case of a take-over request
the driver must take-over control within a certain time buffer.
L4 Fully automated
The system takes over one or more parts of the driving task and in the case of an unan-
swered take over request the system returns to the minimal risk condition itself.
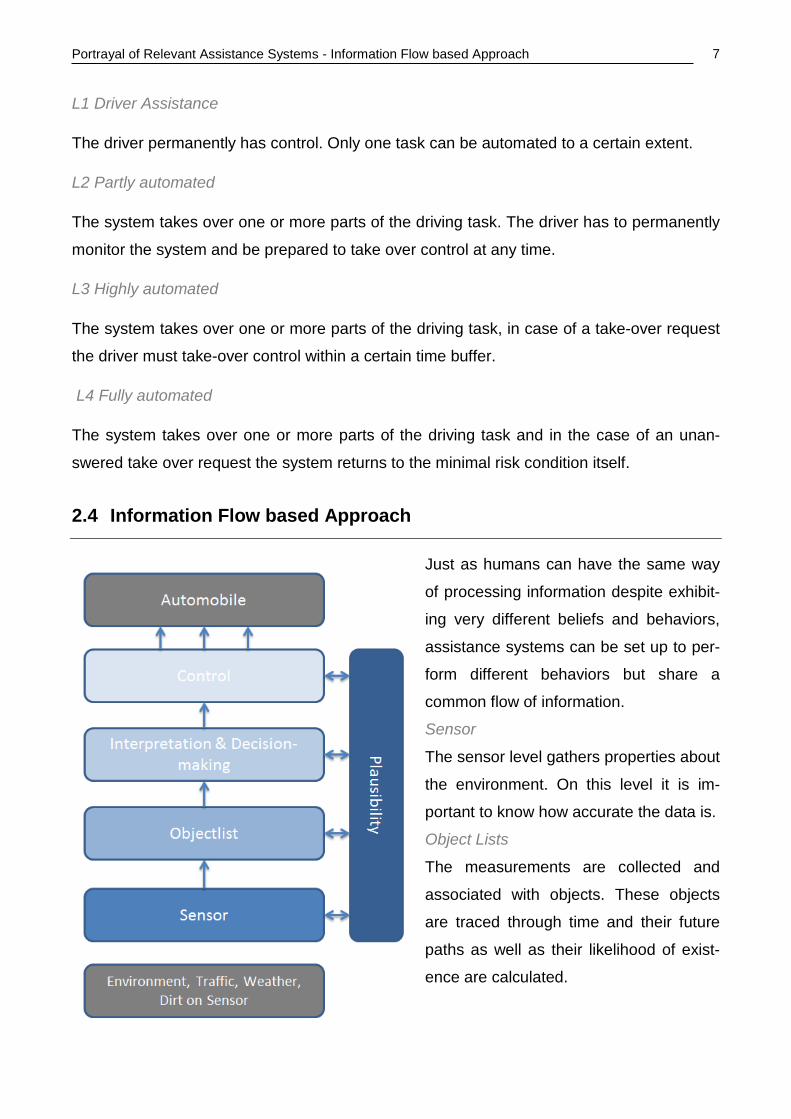
2.4 Information Flow based Approach
Just as humans can have the same way
of processing information despite exhibit-
ing very different beliefs and behaviors,
assistance systems can be set up to per-
form different behaviors but share a
common flow of information.
Sensor
The sensor level gathers properties about
the environment. On this level it is im-
portant to know how accurate the data is.
Object Lists
The measurements are collected and
associated with objects. These objects
are traced through time and their future
paths as well as their likelihood of exist-
ence are calculated.

Portrayal of Relevant Assistance Systems - Current Driver Assistance Systems
8
Interpretation and Decision Making
Based on the position and predicted path of relevant surrounding objects the situation is
identified and based on this identification decisions for control are made.
Control
Control is the regulation of actuators in the car to keep the actual variables as close as pos-
sible to the target values set by the decision level.
Although they share their flow of information the amount of levels and the style of pro-
cessing may vary. As this is an important part of testing great effort, despite their differ-
ences, is necessary to specifically define criteria and test situations for each device under
test. In this document the sensors used for perception will be mentioned. The lower levels
of information processing are addressed together with environment sensing systems in
chapter 3.
2.5 Current Driver Assistance Systems
2.5.1 Sight Enhancing Systems
2.5.1.1 Assistance Demand
The driver’s perceptive abilities are impaired if visibility is reduced. This happens during
night, fog, heavy rain, blinding sunlight and through blinding headlights at night increasing
the risk for accidents. While night accidents have been steadily declining [9] they still com-
prise 41% of deaths and 32% of heavy injuries compared to total injuries per year.
2.5.1.2 Assistance Goal
As implied by their name the goal of sight enhancing systems is to improve the driver’s per-
ception.
2.5.1.3 Functional Task
There are several systems which aim to achieve this goal:
• Assisting Light Distribution
• Adaptive Light Distribution
• Night Vision Systems
Portrayal of Relevant Assistance Systems - Current Driver Assistance Systems
9
Collision warning systems which also include the improvement of driver’s perception will be
discussed separately in chapter 2.5.4.
a Assisting Light Distribution
The functional task of assisting light distribution is to change the light density distribution of
dimmed and upper lights according to four environments for which different light settings
have been defined. These are city, autobahn, country road and upper lights. Curve light is
also attributed to assisting light distribution [1].
As its name suggests assisting light distribution is within the lowest level of automation –
L1. These features are achievable with information available within the car, but if available,
environment sensors can be used to improve functionality.
b Adaptive Light Distribution
The functional task of adaptive light distribution is to change the light density distribution
according to the general environment (as assisting light distribution) and also according to
other traffic participants and obstacles such as deer.
A marking light is used to highlight obstacles such as deer with additional light density. The
lower and upper beam range is adapted in order to ensure oncoming traffic is not blinded
whilst maximizing the sight distance.
These features require sensors which measure the relevant surroundings with enough spa-
tial and temporal resolution to allow for object recognition and tracking [1]. Also light
sources which allow for dynamic changes in light distribution are required. As environment
sensors cameras, Lidar, Radar, range imager and night vision systems are qualified. For
this system automation level L1 applies as well.
c Night Vision Systems
The functional task of night vision systems is to extend the perception capabilities of the
driver by using sensors which can gather more information than the human eye [10]. This
information is then either displayed to the driver or used to draw the driver’s attention to a
relevant object. Night vision systems are based on Near Infrared (NIR) or Far Infrared (FIR)
Portrayal of Relevant Assistance Systems - Current Driver Assistance Systems
10
and have a larger vision range than the human eye. They are also belong to the automation
level L1 category.
FIR
The Far Infrared system is a passive system which measures the heat radiation of objects
at wavelengths between 8µm and 12µm. As this radiation is blocked by glass and most
other solids, these systems are quite expensive and the representation on a display does
not resemble what objects in visible light look like.
NIR
The NIR systems are called near infrared because the measured wavelengths are close to
the visible light spectrum between 800 and 1100nm [10]. NIR systems are active systems
that send a beam of infrared waves out and detect what is reflected back. Pictures meas-
ured with these systems are very similar to what objects in visible light look like. The disad-
vantage of their proximity to light is that the power of the measurement beam is restricted to
prevent any danger to human eyes.
2.5.2 Parking Assistance
2.5.2.1 Assistance Demand
Due to aerodynamics and other factors most cars end up with a slight chock shape. Be-
cause of this the closest line to the ground is 8–10m behind the car. This limits transversal
view whilst driving backwards and poses a problem which is perceived as discomfort in re-
gard to trajectory planning and control [10].
2.5.2.2 Assistance Goal
Parking assistants aim to increase driver comfort by easing decision making and perception
as well as trajectory planning.
Portrayal of Relevant Assistance Systems - Current Driver Assistance Systems
11
2.5.2.3 Functional Task
The functional task of parking assistance systems (PAS) is intertwined with their level of
automation. A variety of parking assistants already exist which fulfill the assistance goals to
different extents:
• Purely informational parking assistance • Guided parking assistance • Semi-automatic parking (transversal automation) • Fully automatic parking (transversal and longitudinal automation) • Fully automatic parking with automatic parking spot search
a Purely Informational Parking Assistance
The functional task of purely informational parking assistance is to provide the driver with
additional visual and/or distance information without any advanced information processing.
The data from a camera and or ultrasonic sensors is communicated to the driver. Automa-
tion level L1 applies. The used sensors are camera and ultrasonic.
b Guided Parking Assistance
The functional task of guided parking assistance is to provide the driver with visual and dis-
tance information as well as providing help for trajectory planning. The system is aware of
the position of the car and of relevant objects and uses this knowledge to show the driver
the current car trajectory as well as the optimum trajectory. The trajectory is either drawn
into the camera video or into an abstract scenery. Automation level L1 applies. Used sen-
sors are near Radar, range imager, ultrasonic sensors and cameras.
c Semi-Automatic Parking (Transversal Automation)
The functional task of semi automatic parking builds on its predecessor by performing the
trajectory planning task. In this case the calculated optimum trajectory is acted upon by the
assistance system. The longitudinal driving is assisted through directions. This assistance
system takes over a part of the driving task and is therefore partly automated – L2. The
used sensors are the same as previous but in addition a steering angle sensor and actua-
tors are required.
Portrayal of Relevant Assistance Systems - Current Driver Assistance Systems
12
d Fully Automatic Parking (Transversal and Longitudinal Automation)
The functional task of automatic parking builds upon its prior level of automation by also
taking up the longitudinal task. Depending on the version the driver has to press a button in
order for the system to proceed. Whether the driver has to press a button in order for the
system to proceed or not, determines if the system is fully automated – L4 or highly auto-
mated – L3. The sensors and actuators used for this system are the same as for previous
systems, but with each level of automation additional sensor signal quality and improved
plausibility checks are required. Systems on this level must use multiple sensor types to
ensure correct function.
e Fully Automatic Parking with Automatic Parking Spot Search
Basically this is an autonomous parking system with autonomous driving. The parking sys-
tem has further increased requirements for parking spot detection. The autonomous driving
could, if function is limited to the same parking area, work without the full requirements of
autonomous driving.
Fully automated parking as well as automatic parking spot search are not yet on the market
but are already being developed in research [1].
2.5.3 Active Cruise Control
2.5.3.1 Assistance Demand
Active cruise control (ACC) shares its assistance demand with common cruise control sys-
tems: Driving long distances whilst keeping a constant speed is strenuous.
2.5.3.2 Assistance Goal
The goal of cruise control is to increase driver comfort. Active cruise control has been de-
signed to satisfy this demand to a greater extent than cruise control.
2.5.3.3 Functional Task
The functional task of active cruise control includes the capabilities of cruise control and
also allows following a vehicle at a set distance from speed zero (traffic jam) up to the set
Portrayal of Relevant Assistance Systems - Current Driver Assistance Systems
13
cruise velocity. Active cruise control only influences the longitudinal aspect of the driving
task and only performs a part of this task. It is designed to require human intervention on a
regular basis to prevent a false feeling of safety. Due to that ACC falls into automation level
L2. The used sensors are Radar, Lidar and ultrasound (in traffic jams). Because the ACC
influences acceleration as well as breaking it has to interact with most of the control units in
the power train. Ensuring that this interaction is failure safe is subject to extensive testing.
2.5.4 Front Collision Mitigation (Avoidance) Systems
2.5.4.1 Assistance Demand
The demand for front collision mitigation systems is safety. The driver’s capability to react to
foreseeable dangerous situations varies [1]. Attention can be bound by something non-
driving task related, visibility of the danger source can be reduced and in the case of
“looked but failed to see” hazard recognition simply fails. In these situations there is a clear
need for front collision mitigation systems.
2.5.4.2 Assistance Goal
The goal of collision mitigation systems is to reduce the driver’s reaction time to dangers
and in the absence of human reaction to take over longitudinal and in some cases longitu-
dinal as well as transversal steering.
2.5.4.3 Functional Task
The functional task of front collision mitigation systems is to detect objects on a collision
path and to warn the driver with sound and haptic signals, e.g. by vibrating the steering
wheel. As soon as an object on collision path is detected the car is prepared for impact.
This includes preloading the breaking system as well as tightening the safety belts. If no
reaction follows, further behavior depends on the automation level of the ADAS. There are
systems which have been tailored to meet automation level L2 and will only start breaking
when impact is unavoidable in order to reduce the severity of impact. There are systems in
development which initiate breaking at an earlier point in order to avoid impact altogether.
These systems also take over transversal control for this time and are therefore in the au-
tomation level L4 category. In most European countries such autonomous breaking sys-
Portrayal of Relevant Assistance Systems - Current Driver Assistance Systems
14
tems will only be possible, if the currently valid law according to the Convention on Traffic
Roads (Wiener Übereinkommen über den Straßenverkehr) [11] is modified. This treaty
states that every vehicle must have a driver which must be a person and that this driver
must always be able to control the vehicle. Another situation in which front collision avoid-
ance systems can take action is when a pedestrian unexpectedly enters the driving trajecto-
ry. In this case the L4 system takes over longitudinal and transversal control to evade the
pedestrian. The ADAS can outperform humans in this scenario by distinctively controlling
the brakes via EPS to guide the car along a trajectory which would otherwise be hard to
follow. Front collision systems use environment sensors such as Radar, Lidar, range im-
ager and cameras.
2.5.5 Lane Departure Warning and Lane Keeping Support
2.5.5.1 Assistance Demand
Keeping a car within a given lane is mainly a safety concern. The demand for such a func-
tion can be drawn from traffic accident statistics. Over a third of all fatal road accidents re-
sults from lane changes or unwanted lane departures which indicates a clear demand for a
system aiming at the prevention of such accidents [1]. There are several systems which
interact with the driver’s task to steer.
2.5.5.2 Assistance Goal
The safety goal of lane keeping assistance systems is to reduce the risk of unwanted lane
departures. Furthermore the comfort goal of lane keeping assistance is to make transversal
steering less challenging.
2.5.5.3 Functional Task
The functional task of lane keeping support is to apply an additional moment onto the steer-
ing wheel in order to keep the car in the middle of the driving lane. This can be configured
in order to provide comfort or to only be activated before an impending unwanted lane de-
parture.
The functional task of departure warning/prevention is to warn the diver of an impending
unwanted lane departure and, in the case of prevention, to steer the car back onto the driv-
Portrayal of Relevant Assistance Systems - Current Driver Assistance Systems
15
ing lane, if the driver shows no reaction. This can be achieved for example through ESP
breaking.
Combinations of the above presented functional tasks are also possible. With a single func-
tional task these systems do not exceed automation level L2. For lane keeping with steering
and breaking capabilities automation level L3 or L4 applies.
In order for these systems to function properly the driver’s intention recognition is very im-
portant, “unwanted lane departure” needs to be discerned from “wanted lane departure”.
The driver’s intention recognition gains further predictability, if data from vigilance detection
is available. An optical system is required to sense and recognize the driving lane. Mainly
cameras provide the lane perception capabilities, but some Lidar and range imager sys-
tems can also be used.
2.5.6 Lane Change Assistance
2.5.6.1 Assistance Demand
According to the German In-Depth Accident Study (GIDAS) between 1985 and 1999 [12] on
average 5% of all accidents occurred during a lane change maneuver. These statistics pro-
vide the motivation to design a system which may help to decrease this amount and to im-
prove safety.
2.5.6.2 Assistance Goal
The goal of lane change assistants is to warn or to prevent lane changes in dangerous situ-
ations.
2.5.6.3 Functional Task
The functional task of lane change assistants is to perceive the relevant surrounding for a
lane change/–overtake maneuver and to issue warning signals or to prevent a lane change,
if the intended action is dangerous. This function exists to different extents. Systems which
only warn the driver are part of automation level L1 and systems which actively take over
part of the driving task can be designed to be part of automation level L2–L4. This task re-
quires sensors which monitor the blind spot on each side of the car. Also, oncoming traffic
Portrayal of Relevant Assistance Systems - Current Driver Assistance Systems
16
needs to be recognized. Fast approaching traffic from the rear side and driver intention
monitoring systems improve the functionality of this system. For such a system cameras,
and mostly Radar but also Lidar or range imagers are used.
2.5.7 Junction Assistance
2.5.7.1 Assistance Demand
Again, junction assistance serves the need for further safety. Mastering junction assistance
will be key for autonomous driving. Junctions are information dense environments where
correct interpretation of the situation and recognition of all relevant factors is at times hard
to achieve. Due to the complexity of a junction, assistance is split into different scenarios. In
each of these scenarios drivers are at times subject to perception or interpretation errors
which lead to flawed decisions. Typical errors include the misinterpretation of the velocity of
other traffic participants.
2.5.7.2 Assistance Goal
The goal of junction assistance is to improve decision making and information availability
for drivers. In order for the assistance functions to be an improvement they have to excel at
handling the “Warning Dilemma” [1]. This is the tradeoff between warning at the latest pos-
sible time and the expectable amount of false warnings. Due to the multiplicity of situations
and driver behavior which will differ from regulations if a situation allows, mastering the
“Warning Dilemma” is the most important obstacle to overcome for these functions to find
good acceptance.
2.5.7.3 Functional Task
The functional tasks will be discussed separately. Junction assistance consists of:
• Stop sign assistance
• Traffic light assistance
• Entering or crossing a junction assistance
• Left turn assistance
Portrayal of Relevant Assistance Systems - Current Driver Assistance Systems
17
Stop Sign Assistance
The functional task of Stop sign assistance is to prevent unwanted rolling over the stopping
line by bringing the car to a standstill right at the stopping line. This system only acts, if it
interprets stopping as the driver’s intention, but does not so if the driver plans only on signif-
icantly reducing his speed.
Traffic Light Assistance
In traffic light assistance two cases are the main source of accidents: Transversal traffic
accidents, which are usually happening due to red light violation, and rear-shunt accidents.
The functional task of traffic light assistance is to warn, if red light violations are impending
and to support the starting of traffic after a red phase.
Entering or Crossing a Junction
In this case the driver only has to stop if transversal traffic is present. The functional task for
entering or crossing a junction is to detect, whether transversal traffic is present or not and
to issue warning signals and/or to prevent the car from entering or crossing. The assistance
system needs information about the transversal traffic to support the driver whilst approach-
ing the junction.
Left turn Assistance
This system aims to help the driver when leaving a road with a left turn. Despite the multi-
tude of left turn accidents the most important one is where the left turning car crashes with
oncoming traffic. The functional task of left turn assistance is to detect oncoming traffic and
warn the driver, if the maneuver is dangerous.
With sensors and information gathering of the environment only from within the car, junction
assistance has to face a tradeoff between safety and convenience. Assisted and autono-
mous cars need additional time, e.g. right at the junction to sense whether transversal traffic
is oncoming or not. Due to this Car to Car (C2C) and Car to Infrastructure (C2I) are viable
options to achieve both safety and comfort. Right now in Europe Car to Car and Car to In-
frastructure systems are only subject to research. In Japan a C2I system – the Vehicle In-
formation and Communication System (VICS) was implemented nationwide in 2003. C2C
and C2I will be discussed in the outlook on future ADAS. Also future sensor systems might
be capable of providing junction assistance functionality without a tradeoff between safety
Portrayal of Relevant Assistance Systems - Select Topics on the Future of Assistance Systems
18
and convenience (speed). For all these assistance functions driver intention recognition is
very important and can be improved by driver monitoring systems. Separate functions can
be implemented on an automation level of L1 and L2, but full capability requires automation
level L3 and L4.
2.6 Select Topics on the Future of Assistance Systems
The development of assistance systems serves to increase safety and comfort by optimiz-
ing the capabilities of the car-driver-system and by improving assistance systems them-
selves to the point where they are able to take over parts of the driving task.
These two trends will lead to safer traffic and, if enough parts of the driving task are mas-
tered, to autonomous driving. Every system profits from further information about the envi-
ronment and the driver. Due to that sensor fusion, where the information of all environment
sensors is gathered, merged and made available for all assistance systems, will become
the dominant form of information processing. At the point where a significant portion (over
5%) of the traffic is equipped with advanced driving assistance systems communication be-
tween cars and between cars and infrastructure can serve as an additional performance
boost for assistance systems. The redundancy requirements for autonomous driving could
be met a lot easier, if every car was equipped with a unit which broadcasts its current posi-
tion and velocity. Interconnecting the traffic participants may also help to improve overall
traffic flow. These promises drive the motivation to develop such systems.
2.6.1 Car to Car (C2C) and Car to Infrastructure Communication (C2I)
Radio is the current main technology over which Information about traffic flow and unusual
dangers such as wrong-way drivers is transmitted. Car to Car and Car to Infrastructure
communication will allow more information to be transmitted in a more specific way [13].
The possible applications are numerous, for example traffic lights could transmit the re-
maining duration of their green phase which would allow ADAS to give more specific rec-
ommendations about the velocity to approach the lights. Also traffic monitoring systems at
junctions could deliver the required information about transversal traffic to Junction Assis-
tance. With C2C communication platooning, where cars are grouped together at one veloci-
ty and drive with less distance between them acting as a single entity and harnessing the
fuel savings of reduced air resistance, becomes possible. Information about accidents, traf-
Portrayal of Relevant Assistance Systems - Select Topics on the Future of Assistance Systems
19
fic jams and construction sites could be transmitted immediately after formation and data
about the time delay caused by a traffic jam would be available firsthand. Assistance Sys-
tems such as Blind Spot Detection and Lane Change Assistance would gain reliability. Traf-
fic jams without accidents or construction sites occur at speeds over 85km/h and above a
certain occupancy rate of a highway. These jams form due to large velocity disparities and
over-reactive breaking. Car to Car communication may allow Assistance Systems to reduce
this effect and thus increase the maximum throughput of highway systems.
2.6.2 Autonomous Driving
With improving performance at falling costs for sensors and computing power combined
and with the ongoing electrification of formerly mechanical systems, such as e-brakes and
e-steering, autonomous driving has come within the range of feasibility. Unprecedented
speed in the development of new assistance systems with growing functionality and in-
creasing numbers of proof of concept autonomous cars make the question about autono-
mous driving about when, rather than about whether they are possible or not.
Autonomous driving offers the promise of reduced fatal road accidents, increased traffic
throughput and improved individual mobility despite any disability. There are still obstacles
to overcome in order to make autonomous driving a reality.
Assistance systems already require additional operational skills. The driver needs to know
which state the assistance systems are currently in – this is called mode awareness. Fur-
thermore, he needs to know how the assistance system signals information and how it be-
haves in any situation. In addition, if an advanced assistance system issues a takeover re-
quest, the driver needs to know in which situation he is in, otherwise he will not be able to
perform the best choice of actions. For autonomous systems which allow for different de-
grees of automation and for pre-stages in which they are only able to operate autonomously
in parts of the traffic, network concepts allowing the driver to easily predict the behavior of
the autonomous system will be necessary. Any driver encountering an autonomous car will
face the same problems. In order to ensure wide acceptance, concepts to make autono-
mous cars easily predictable for other traffic participants will be required.
Currently, autonomous cars cannot be licensed due to law. Also the question of liability for
accidents has not been answered. Even if the “Wiener Übereinkommen” is modified and
liability is regulated similarly to the aviation industry any autonomous system may not in-
Portrayal of Relevant Assistance Systems - Select Topics on the Future of Assistance Systems
20
crease risk for any traffic participant group. Providing proof for that will be difficult. An Au-
tonomous System would at least have to show that the amount of severe accidents is lower
than the best relevant comparison group. On German highways e.g. every 5 million kilome-
ters one severe accident happens. With an expectation of risk reduction of 5% this would
require 100 million kilometers to reach 5% significance as also stated by Winner and
Wachenfeld: “Recent scientific publications predict that more than 100 Mio km of road driving are
required for fully automatic vehicle release” [18]. This alone would cost hundreds of millions of
euros and any change in the autonomous system would require the same test again [1].
This makes clear that new testing methods will need to be developed which have the capa-
bility to test performance without blowing up cost. A test system capable of simulating real
driving environments to a sufficient extent may be a key ingredient to the solution for this
problem.
Autonomous driving will evolve from current assistance systems step by step. The first au-
tonomous system will be capable of handling the highway environment. After sufficient de-
velopment of overtake assistance, junction assistance and obstacle evasion autonomous
land road systems will become possible. The last step will involve handling the urban envi-
ronment.
With increasing capabilities any test system will also need to evolve. There will have to be a
large library of test cases to simulate all relevant situations. Traffic simulation and validation
methods will be required in order to ensure the test system resembles reality enough to test
real performance. Sensor stimulation will need to improve with environment sensor capabili-
ties. Lastly, the requirements for a test system might change along the development pro-
cess of autonomous systems. The market will therefore need to be closely monitored in
order to react to future requirements in advance.
Environment Sensors for ADAS Functions - Ultrasonic Sensors
21
3 Environment Sensors for ADAS Functions
Each sensor system for ADAS functions has been subject to a long research and develop-
ment process. As a result, there are great complexity and variety within these systems. The
following chapter gives an overview of commonly used principles.
3.1 Ultrasonic Sensors
Ultrasonic sensors are used to measure distances. While distances can, among others, be
measured trough lasers, Radar, or through capacitance, sealed piezoelectric ultrasonic
sensors are the de facto standard for parking assistance systems. To keep this document
dense with relevant information only the piezoelectric sensor principle will be discussed.
3.1.1 Physical Measurement Principle
At the heart of an ultrasonic sensor lies a piezoelectric crystal. This crystal can convert
electrical energy to mechanical energy and vice versa through the piezoelectric effect [20].
This effect occurs in crystals where the arrangement of atoms in their lattice is such that the
charges in the lattice are distributed asymmetrically which creates an electric dipole poten-
tial. These dipole potentials build domains of uniform polarization. By applying a strong
electric field the polarization of these domains can be aligned. A deformation of the lattice in
the direction of the dipole potential will then generate a voltage proportional to the amount
of deformation [1]. In turn, applying voltage to the crystal causes the lattice structure to de-
form accordingly. This property can be used to generate or receive mechanical oscillations.
In the case of automotive ultrasonic sensors the oscillations have a frequency between
40 kHz and 50 kHz. The mechanical deformation of the crystal is too weak to generate a
strong coupling between air and the crystal. A membrane is used to amplify the effect at the
resonant frequency. In the automotive industry metal membranes are used to increase du-
rability. Due to the metal membrane Ultrasonic sensors require driving voltages of up to
160V. The sound wave which is generated by the sensor radiates outward until it hits an-
other surface of which it is reflected. Due to the low density of air in relation to solids the
reflection is very close to a total reflection. The receding sound wave sets the sensor into
motion again which in turn causes a detectable electric signal.
Environment Sensors for ADAS Functions - Radar
22
3.1.2 Information Flow and Processing
Signal generation and detection are performed with hardware. After an echo is detected the
distance of the respective object is determined by the time it took the sound wave to travel
to the object and back. Systems which use one sending sensor and multiple receiving sen-
sors can improve the accuracy of the system by applying triangulation with respect to the
spatial positions of the receiving sensors; this is called cross-detection. The calculated dis-
tances are checked for plausibility and multiple measurements are made in order to get in-
formation about distance as well as velocity.
3.1.3 Measurement Errors
Sound travels at different speeds through air according to humidity, temperature and air
pressure. The accuracy of distance calculation depends on how accurate these parameters
are measured and compensated. The reflectiveness of objects to detect depends on their
geometry: planes normal to the expanding ultrasonic wave reflect the best, planes in a 45
degree angle to the sensor reflect the worst. Due to the large difference in density between
air and solids ultrasonic waves are mostly reflected totally; only vegetation and clothing re-
flect less. The wheel house can generate multiple false echoes. Systems without cross-
detection will detect the same distance for all objects lying on the surface of a sphere with
the detected distance. This can lead to false errors and it limits the accuracy as the desired
variable is the closest distance between car and object.
3.1.4 Implications for a Stimulation System
For ultrasonic sensors an external stimulation without changes in the measurement system
is achievable. Due to the slow propagation of sound waves in the air the constraints for the
stimulation system can be met with currently available equipment as demonstrated in chap-
ter 5.
3.2 Radar
Radar was first developed for military use and has recently become cheap and compact
enough for use in cars. Radar systems measure distance and speed with high accuracy.
Their spatial information is less accurate. Radar antennas can be set up in various different
Environment Sensors for ADAS Functions - Radar
23
ways to measure the angular position of objects in elevation (horizontal angle) and azi-
muthal (vertical angle) direction. The advantage of Radar over other distance measurement
systems is that while distance is measured through time of flight and/or triangulation, speed
is measured via the Doppler Effect. Radar uses electromagnetic waves with a frequency
between 300 MHz and 100 GHz. For use in the automotive sector four frequency bands are
currently available (24.0–24.25 GHz, 76–77 GHz, 77–81 GHz and 21.65–26.65 GHz) [15].
3.2.1 Physical Measurement Principle
Radar systems send out electromagnetic waves and measure the receding waves. A local
oscillator is used to generate the desired frequency which is then emitted through antennas.
The shape of the antenna determines which shape the Radar beam has. Focused beams
with widths between 4° and 30° are currently possible [1]. When the Radar signal hits an
object and is reflected it undergoes a Doppler Shift proportional to the relative speed be-
tween Radar sensor and object. The measured signal echo is then measured and the dis-
tance and speed of the detected objects are determined.
3.2.1.1 Radar Cross Section (RCS)
The RCS describes how much an object reflects back in terms of a sphere with radius a. A
product of the RCS with the squared wavelength 𝜎𝜆2 describes how much of a homoge-
nous incoming radar wave is reflected in a spatial angle. The unit of the Radar Cross Sec-
tion is 𝑚2 and relevant objects on the street have RCS ranging from 1 to 10,000𝑚2. This
leads to high constraints on the dynamic of the detection path.
3.2.1.2 Distance Measurement
Distance is mainly measured by time of flight. Unlike ultrasonic distance measurement, Ra-
dar systems rely on sophisticated signal processing. To properly describe this signal pro-
cessing would exceed the scope of this thesis. The techniques used include Frequency
Shift Keying (FSK), Linear Frequency Modulation Shift Keying (LFMCW/FMSK/FSK), Fre-
quency Modulated Continuous Wave (FMCW) and Chirp Sequence Modulation.
For systems with multiple detection antennas triangulation in combination with multipath
discrimination methods improve the measurement.
Environment Sensors for ADAS Functions - Radar
24
3.2.1.3 Doppler Effect
Christian Doppler predicted in 1848 that electromagnetic waves are subject to frequency
shifts according to relative speed. Moving towards or away from the source of a wave will
shift the perceived frequency. This shift is proportional to the relative speed between source
and observer and also proportional to the reciprocal value of the frequency’s wavelength 𝑓0𝑐 .
With 𝑐 being the speed of light and 𝑟 the distance between the radar system and the reflect-
ing object:
𝑓𝐷𝐷𝐷𝐷𝐷𝐷𝐷 = −2�̇�𝜆
= −2�̇�𝑓0𝑐
( 3-1 )
At a carrier frequency of 24 GHz a relative speed of -90m/s = 324 km/h (oncoming traffic)
would lead to a Doppler Shift of:
𝑓𝐷𝐷𝐷𝐷𝐷𝐷𝐷 = −2�̇�𝑓0𝑐
= −2 ∗ 90𝑚𝑠 ∗ 24 𝐺𝐺𝐺
299792458𝑚𝑠= 14,4𝑘𝐺𝐺 ( 3-2 )
Although also present in the carrier frequency the Doppler Effect only leads to a frequency
change of a millionth here. The effect becomes well measurable through the lower frequen-
cy of the measurement signal modulated onto the carrier frequency.
3.2.1.4 Angular Measurement
For most Angular Measurement principles a narrow beam is required for high angular reso-
lution. The shape of the radiated wave depends on the shape of the antenna. The radiated
frequency and the shape of the antenna interact to form radiation densities which are simi-
lar to those of an interference pattern, in which the power is spatially distributed in areas
with maxima and minima. The main maxima in the center is called the main lobe, all other
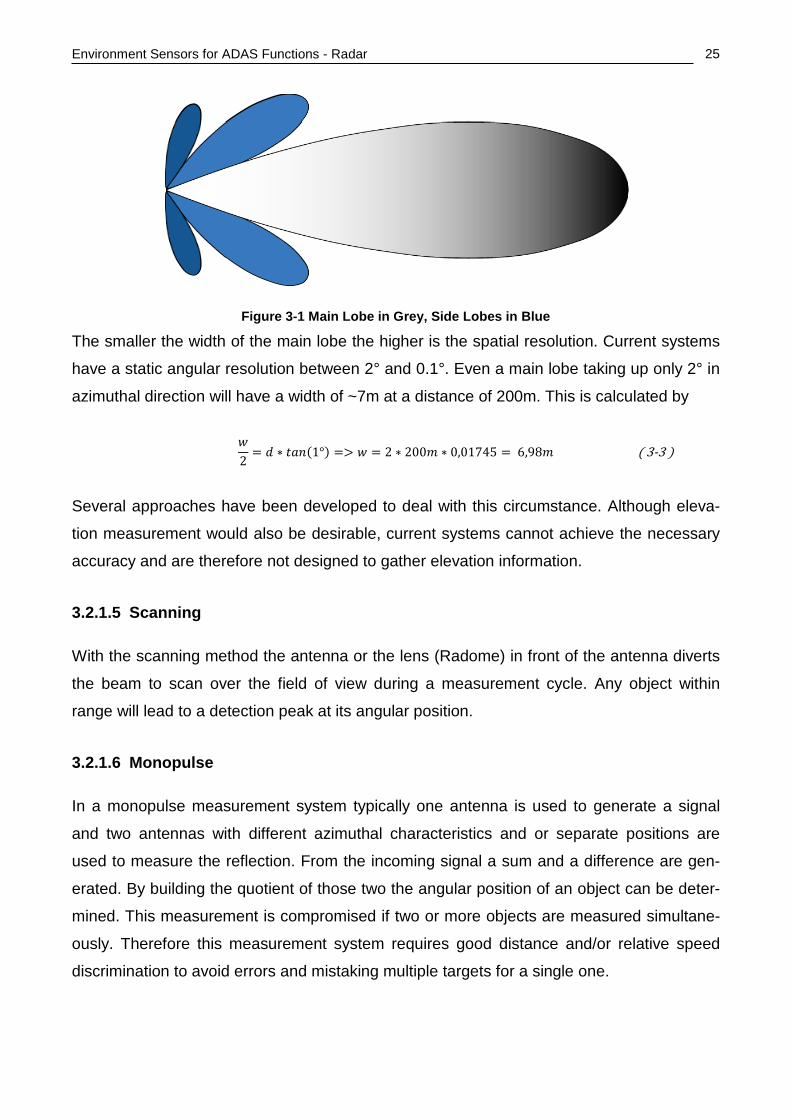
maxima are “side lobes” as shown in Figure 3-1.
Environment Sensors for ADAS Functions - Radar
25
Figure 3-1 Main Lobe in Grey, Side Lobes in Blue
The smaller the width of the main lobe the higher is the spatial resolution. Current systems
have a static angular resolution between 2° and 0.1°. Even a main lobe taking up only 2° in
azimuthal direction will have a width of ~7m at a distance of 200m. This is calculated by
𝑤2
= 𝑑 ∗ 𝑡𝑡𝑡(1°) => 𝑤 = 2 ∗ 200𝑚 ∗ 0,01745 = 6,98𝑚 ( 3-3 )
Several approaches have been developed to deal with this circumstance. Although eleva-
tion measurement would also be desirable, current systems cannot achieve the necessary
accuracy and are therefore not designed to gather elevation information.
3.2.1.5 Scanning
With the scanning method the antenna or the lens (Radome) in front of the antenna diverts
the beam to scan over the field of view during a measurement cycle. Any object within
range will lead to a detection peak at its angular position.
3.2.1.6 Monopulse
In a monopulse measurement system typically one antenna is used to generate a signal
and two antennas with different azimuthal characteristics and or separate positions are
used to measure the reflection. From the incoming signal a sum and a difference are gen-
erated. By building the quotient of those two the angular position of an object can be deter-
mined. This measurement is compromised if two or more objects are measured simultane-
ously. Therefore this measurement system requires good distance and/or relative speed
discrimination to avoid errors and mistaking multiple targets for a single one.
Environment Sensors for ADAS Functions - Radar
26
3.2.1.7 Mulitbeam
Multibeam is an improvement of the monopulse measurement system. Due to additional
antennas a larger azimuthal observation angle is possible. Multitarget discrimination be-
comes easier as well.
3.2.1.8 Other Developments
There are systems which use the first side lobe to increase the azimuthal measurement
angle for short distances.
3.2.2 Information Flow and Processing
Despite the multitude of different approaches information processing follows a similar se-
quence.
The first step is signal generation. This includes modulation of the carrier with the meas-
urement signal and spatial beam shaping. The detected signal is demodulated, amplified
and digitized. The digital signal undergoes a Fourier transform where the complex ampli-
tude and frequency provide information about distance, speed and azimuthal angle. The
frequency spectrum is analyzed to detect peaks. These peaks are then matched to corre-
late them to an object. Additional signal processing extracts the azimuthal information from
the amplitudes and the antenna characteristics. The detections which are likely to fit to-
gether are merged to one object. The last step is tracking. Here the objects measured in the
past and their current positions based on trajectories are compared to the newly detected
objects. After a filtering mechanism which estimates the likelihood of whether objects exist
or not and where their current position is, a prediction for their future position is made.
3.2.3 Measurement Errors
Environmental factors can influence the quality of measurements. Rain raises the noise
level and water spouts can lead to ghost detections. The increased noise level decreases
the Signal/Noise Ratio (SNR) and with that the maximum range of the Radar system. An
inhomogeneous water film on the surface of the Radome can diffract mm waves to a large
degree and degrade azimuthal resolution. Metallic varnish cannot be used on Radomes as
it changes the shape of the beam. Additional coatings of regular varnish can also pose a
Environment Sensors for ADAS Functions - Radar
27
problem. Metallic layers significantly thinner than the penetration depth (<1µm) can become
transparent to mm waves while maintaining their properties towards visible light. In general
any contamination of the Radome by e.g. ice, snow or dirt may lead to measurement deg-
radation. Some Radar systems have a heating system and a separate wiper to maintain
working conditions for the Radar system. Additional sources of systematic errors are azi-
muthal and elevation mounting errors. Some systems provide calibration methods to reduce
or adapt the system to these errors.
On the information processing side multipath propagation, standing objects and multiple
targets pose error sources. In addition to these, typical sensor errors for distance, velocity
and azimuthal angle apply.
3.2.4 Implications for a Stimulation System
Stimulation for Radar is achieved easiest on the object level. Due to the multitude of physi-
cal implementations, signal processing techniques and used frequency spectra it is likely
that no single stimulation system is possible for all systems.
In order to achieve a complete physical stimulation system four different frequency bands
would have to be mastered. An angular resolution of 0.1° would be required. Further
thought will need to go into requirements regarding the shape of the radiation and arrange-
ment of antennas. In order to simulate mountain and valley scenarios the system should be
capable of elevation changes by roughly ±10%. A sophisticated signal generation unit is
required to generate signals which resemble a Doppler Shift and to replicate the various
different approaches to signal generation. Along with the challenges to signal generation
synchronization seems to be the biggest problem. Electromagnetic Radar waves in the air
propagate nearly at the speed of light. For the stimulation system to be fast enough to mim-
ic a radar echo it has to be prepared to generate the desired signal and only be triggered by
the measurement pulse. The delay between trigger and signal generation is set by the sim-
ulation according to the desired object distance, but must be stored in a part of the circuit.
Some of the Radar systems emit a continuous Radar wave onto which during a measure-
ment cycle the measurement signal is modulated. In this case a demodulation as it is per-
formed within the Radar system would take too much time. It is possible that a circuit built
solely to detect whether an impulse has been sent or not might suffice to time constraints.
As signal generation is under such tight timing constraints the detection should have a sep-
Environment Sensors for ADAS Functions - Lidar
28
arate antenna. For short distances instead of signal generation, analog modification of the
measurement signal and delay according to the desired distance might be the only possible
implementation.
The time delay between new calculations by the environment simulation and their update to
the stimulation system should not exceed several milliseconds. It is unlikely that with cur-
rent computing capacity any full scale simulation of radiation propagation would be fast
enough to serve as basis of the stimulation. Due to that only a behavioral stimulation is fea-
sible. Behavioral stimulation means that a model is built which predicts what a Radar sys-
tem would measure based on generalizations of the system. If the software model is suffi-
cient there is no significant difference in any criteria and in any test between the model and
a real Radar system. The stimulation would then extend this model by stimulating the real
radar system in such a way that there is no significant difference in any criteria in any test
between the real test situation and the simulated test situation.
3.3 Lidar
Light Detection and Ranging (Lidar) systems resemble Radar systems where the electro-
magnetic waves used are in the near infrared with 800 to 1000nm wavelength instead of
the micrometer range. LIDAR is superior to RADAR in terms of azimuthal discrimination as
a resolution in the cm range is possible [10]. This advantage is opposed by two disad-
vantages. Since the frequencies used are so close to visible light Lidar systems have to
fulfill laser safety regulations. For Lidar systems laser safety class 1 applies. These systems
are designed to ensure that the human eye cannot be harmed by any amount of exposure
to the system which limits the maximum energy of Lidar. The second disadvantage is the
systems susceptibility to weather conditions. Fog and heavy rain significantly decrease
range. This poses a problem if Lidar is used for safety functions.
3.3.1 Physical Measurement Principle
For Lidar Near Infrared (NIR) electromagnetic waves are used. Due to the high frequency
this technology does not require large antennas. High-power light emitting diodes are used
to generate the beam. The light emitting diode has the structure of a laser to generate a
highly focused light beam. This light beam propagates though air, is reflected and is then
detected by a light detecting diode. For light propagating across two different media three
Environment Sensors for ADAS Functions - Lidar
29
factors come into play: attenuation, diffraction and reflection. As light travels through the air
a part is reflected by elements within the atmosphere as water or dust particles, an addi-
tional part is absorbed. As the light hits an object only a part of it is reflected. Depending on
how focused the beam is the light is either reflected in a wide angle or narrowly. Highly fo-
cused beams have the disadvantage that they can be reflected away from the sensor. The
light detecting diode is operated with a large pre-resistor and in reverse. Due to the high
field strength a single photon is enough to cause an avalanche. The large resistor prevents
the diode from remaining in reverse conducting mode. This process is self-perpetuating and
allows for measurement frequencies of up to 100 MHz [1].
3.3.1.1 Distance Measurement
Lidar is a time of flight measurement system. Due to its high frequency modulation of a car-
rier frequency with a measurement signal is not possible. Therefore the carrier signal has to
be modulated. Rectangular, sine and pulse -modulation would be feasible. Due to the limi-
tations on emitted energy pulse modulation is used in most Lidar systems. In order to
achieve a high spatial resolution the pulses should be as short as possible. With pulse du-
rations on the magnitude of nanoseconds a typical pulse takes up about 1m.
3.3.1.2 Velocity and Acceleration
The Doppler Effect could theoretically be used to determine relative speed. Due to the limi-
tations in frequency modulation this effect cannot be harnessed currently. Thus, velocity
and acceleration are determined by differentiation. This is possible without large errors be-
cause of the high spatial resolution and measurement speed of Lidar.
3.3.1.3 Scanning
Scanning is one of two main principles to gain azimuthal and elevation information. This
technique uses a lens or mirror to guide the beam through the field of measurement. Me-
chanical scanning works best for single beam systems.
3.3.1.4 Multibeam
In multibeam systems, as the name suggests, spatial information is gained by using multi-
ple signal transmission units.
Environment Sensors for ADAS Functions - Lidar
30
Combinations of the two techniques are also possible. An advantage of a multibeam sweep
is that whilst simultaneously gaining a large amount of information, by scanning the azi-
muthal size of objects can be estimated. This is viable information for object tracking and
assistance systems.
3.3.2 Information Flow and Processing
As the length of a single pulse is around 1m further signal processing is required to improve
accuracy. The detected signal is filtered, amplified and digitally stored in the form of range
gates. These range gates correspond roughly to the size of an impulse. By addition of mul-
tiple pulse detections measured distances in range gates resemble a Gauss curve. By re-
constructing the peak of that curve spatial resolution within the cm range is possible. The
accuracy of the system can be adjusted by the amount of pulses per measurement cycle. If
accounted for Lidar is also capable of multi-target-tracking.
After a measurement cycle the peaks in the range gate register are related to objects. Ve-
locity, acceleration, azimuthal and elevation are attributed to these objects.
The position of these objects is then compared to the predicted position of objects detected
in the past. A Kalman filter is used to incorporate the newly measured information into past
measurement events. The current most likely position of objects is calculated and their po-
sition during the next measurement cycle is predicted. This information constitutes the out-
put of Lidar systems.
3.3.3 Measurement Errors
As discussed in the beginning of this chapter, Lidar is strongly influenced by weather condi-
tions. Rain, snow, fog decrease the range of the system, also any dirt on the cover limits
function. Due to the reflection off of these disturbances Lidar is capable of detecting wheth-
er it is compromised or not. This allows Lidar to be used to determine how visibility for the
driver is. The detection path of the Lidar system requires a great dynamic range as the sun
emits infrared light in much greater quantities than the Lidar system. There are very efficient
techniques to filter the sunlight out, and also allow the Lidar system to detect whether it is
day or night. For highly focused Lidar systems total reflection is a source of possible meas-
urement errors.
Environment Sensors for ADAS Functions - 3D Time of Flight/ Range Imager
31
Due to their high spatial resolution modern Lidar systems are capable of tracking up to 20
objects on and off the street. How the Kalman-filter is adjusted greatly determines how ac-
curate and error-prone the Lidar system is.
3.3.4 Implications for a Stimulation System
Due to the large variety of Lidar systems stimulation on the object level is the most feasible.
Again a complete simulation of the measurement cycle and an according stimulation sur-
passes the available time budget. If a physical stimulation system were to be designed ei-
ther a huge array of Laser diodes or multiple micro-electromechanical mirrors in combina-
tion with a constant Laser source could be used to emulate the infrared echoes. This time
due to the limitations in signal modulation, synchronization might be easier to achieve and a
proper detection system should be easier to build. The high spatial resolution and the ca-
pability of tracking up to 20 objects requires a stimulation system with a large amount of
sources. Further thought will have to go into whether multiple diodes or micro-
electromechanical mirrors are easier to build. The time delays between detection and
stimulation would again need a place to be stored in hardware. Due to the high frequency
and extremely short pulse durations reproducing the probabilistic range gate measurement
cycle might pose a problem.
It is possible that the stimulation system is detected by the self-diagnosis function of the
Lidar system, in which case self-diagnosis might need to be disabled on a software level.
3.4 3D Time of Flight/ Range Imager
Range imagers fulfill the function of a camera combined with a Lidar system. Each pixel
measures the brightness and distance of the closest object in the line of sight. Photonic
Mixing Devices (PMD) are the most prominent and promising technology for range imaging.
As Lidar PMD uses near infrared light for measurement, current PMD’s, compared to cam-
eras, have a fairly low resolution between 1024 and 65536 pixels [10]. Their low resolution
is a negative consequence of their big advantage over other measurement systems: The
distance is measured right at the pixel level and no processing power is required for calcu-
lation.
Environment Sensors for ADAS Functions - 3D Time of Flight/ Range Imager
32
At this point PMDs have a tradeoff between transversal and longitudinal accuracy, the larg-
er a pixel the better the statistical certainty and thus the higher the quality of depth infor-
mation. The smaller the pixels the more lateral information the PMD can deliver. This
tradeoff translates into short range versions with high transversal accuracy and mid-range
systems (up to 70m) with lower transversal accuracy. For short ranges a longitudinal accu-
racy within mm is possible.
For short ranges, PMDs which use the regular daytime running lights as source may be
possible in the future.
3.4.1 Physical Measurement Principle
Photonic mixing devices use a Laser diode to generate near infrared light. This light is then
modulated at typically over 10MHz. After reflection the light enters the PMD pixel. This pixel
consists of two photo gate strips between two diodes. The diodes are connected in reverse
and the reverse current is a measure of the amount of photons currently being detected.
The voltage applied to the two photo gates determines the direction in which electrons gen-
erated from the incoming photons take. This voltage is modulated in exactly the same way
as the laser diode. Ambient light will stimulate both photo gates equally and as it has no
modulation end up generating the same amount of reverse current on both diodes. The
modulated light however will generate reverse currents in relation to the phase shift be-
tween itself and the outgoing light. This phase shift relates to the distance which light has
travelled. Light travels at 300m/µs and therefore a modulation which is capable of discern-
ing objects up to 150m would need a periodicity of 1µs. If the difference between the re-
verse currents is integrated over time, it yields a direct measure of the phase shift. Based
on the continuous current generated by ambient light the Suppression of Background Illu-
mination (SBI) adjusts the voltage in the space charge region which allows the system to
keep the sensitivity high in every lighting situation. Also, the continuous current is the
measure for the brightness of the pixel.
3.4.2 Information Flow and Processing
The quality of measurement of PMS’s as with other light based measurement systems re-
lies on statistical certainty. Current systems provide an output of 100 measurements per
second. Each measurement consists of multiple measurement cycles. Due to the layout of
Environment Sensors for ADAS Functions - 3D Time of Flight/ Range Imager
33
the PMD each measurement also provides a measure for the Signal/Noise Ratio in the
measurement by comparing the amplitude of the alternating reverse current (measure for
the detected active light) to the amount of continuous current (measure for ambient light).
The information processing consists of calculating the statistically most probable distance,
then grouping pixels together to objects which are then tracked.
3.4.3 Measurement Errors
The biggest source of error is the shot noise from sunlight. In general any environmental
factor which decreases visibility also impairs quality of measurement. Fog and rain are the
most prominent threats as they reflect light at shorter distances which has a smaller phase
shift and clouds the original measurement. Any dirt or ice on the cover will prevent the sys-
tem from working. In this case the system is capable of recognizing whether it is functional
or not. For single pixels multipath propagation and two objects at different distances within
the measurement field can lead to errors. Due to the high scattering of near infrared, multi-
path propagation is unlikely to be a major concern.
3.4.4 Implications for a Stimulation System
As with other advanced measurement systems stimulation on the object level would be the
easiest to build. If a physical stimulation were to be designed the continuous measurement
beam used to determine the distance poses a problem to the physical design of a stimula-
tion system because its reflection is likely to be detected by the PMD. Also the high spatial
resolution limits the feasibility of distinct stimulation sources. Given that the modulation al-
gorithm is known a system of mirrors might be the best choice for stimulation. The source
beam is directed into the stimulation device and either used to synchronize the stimulation
or used directly as source for the feedback signals. This source would then be split into the
required amount of signals and each be delayed by the required amount of time. This delay
may either be achieved through a mirror system or by generating signals with the desired
delay. Building this mechanism would be the core challenge for a stimulation system. After
creating the array of beams with the required delays they would be damped to match the
desired brightness by an adjustable semitransparent material. The array of beams would
then have to be focused on the PMD lens by another set of microelectromechanical-mirrors.
Environment Sensors for ADAS Functions - Camera
34
3.5 Camera
Camera systems have undergone a constant process of improvement throughout the last
years. Current systems with a monochrome 8bit VGA resolution of 640x480 pixels and
25 Hz frame rate generate a data stream of over 60 Mbit/s and with the trend going towards
megapixel cameras this amount is certainly going to increase [1]. These usually contain by
far the largest amount of processing power of all automotive signal processing units. This
stems from their use as source of machine vision. Sophisticated multilayered processes
provide object recognition and tracking information. Camera systems provide a 2D projec-
tion of their 3D field of view. Their measurement principle makes them scale-blind. Recov-
ering the loss of depth information is one large contributor to the demand in processing
power.
From all environment sensors presented camera systems are the only passive system. This
is an advantage as no legislation is required to allow their integration into the automobile.
Unfortunately this also means that any stimulation system will introduce some amount of
delay compared to reality. Although at a rate of 25 Hz/40ms per frame it should still be pos-
sible to make stimulation significantly faster than the measurement period.
The traffic system is designed for the human eye. The great advantage of camera systems
is that they are able to tap into the efforts which are undertaken to provide visual infor-
mation and guidance for humans. Also, camera systems are unparalleled in their transver-
sal accuracy.
3.5.1 Physical Measurement Principle
The two main technologies for imaging are Charge Coupled Devices (CCD) and Comple-
mentary Metal-Oxide-Semiconductors (CMOS), which are also used in the automotive sec-
tor. Both techniques take advantage of the photoelectric effect. This effect describes how a
photon lifts an electron from the valence band to the conduction band, freeing it up for
movement. CCDs collect all electrons generated in one pixel during a given time span and
then serially measure the resulting voltage of each pixel row. CCD sensors have a higher
sensitivity compared to CMOS but require more noise compensation and power.
CMOS is the leading technology for integrated circuits and has also become the dominating
technology for imaging. CMOS based cameras mainly use a photoelectric diode operated in
Environment Sensors for ADAS Functions - Camera
35
reverse. At the start of measurement the reverse voltage is set to a defined level. During
measurement the capacity of the depletion region is discharged by the photoelectric cur-
rent. The reverse voltage drops accordingly. The reverse voltage at the end of a measure-
ment cycle is then amplified and digitalized.
3.5.2 Information Flow and Processing
In order to cope with the large amount of data, the images are generalized in a number of
ways. First, lens errors are corrected. This allows for the following algorithms to use the
model of a pinhole camera. The corrections include astigmatism, coma, vignetting and dis-
tortion.
The next level uses filters and other operations to highlight relevant characteristics of the
picture. Point operations manipulate the brightness of single pixels, such as histogram
broadening, equalizing and threshold procedures. Local operators calculate the new value
of a pixel according to its neighbors. These operations include smoothing with Gauss or
binomial filters and morphological filters. Global operators take the whole image into ac-
count for the manipulation of a single pixel, such as Fourier transform or Hough transform.
Geometric operators do not change the brightness of the picture but manipulate the whole
picture; those include rotation, mirroring and scaling.
After picture improvement, relevant characteristics are extracted from the picture. For high-
er level processing only the extracted characteristics are used. There are two types of
characteristics: Single picture characteristics which analyze single frames and correspond-
ence characteristics which analyze the change between frames. Single picture characteris-
tics include rims and corners for which special algorithms based on gradient search are
used. Correspondence characteristics analyze the change between pictures in order to de-
tect movement and also as basis for motion-stereo 3D reconstruction.
For systems with two or more cameras a 3D reconstruction for each frame is possible. Sys-
tems with only one camera can take advantage of the motion of the camera in order to re-
construct the 3D scene. This works best with a static environment and loses accuracy with
movement.
Environment Sensors for ADAS Functions - GPS
36
Based on these extracted characteristics object detection and tracking is possible. Two al-
gorithms are mainly used for this purpose: Kalman filters or Bayesian particle filters. One
possible application is lane marker detection.
Based on detected objects the lane detection algorithm produces predictions as to where
the next objects should be detectable. These predictions are then used to verify the current
quality of function. Additional research is going into improving the use of general knowledge
such as traffic laws, situational driver behavior to improve predictability. Other top level
analysis methods include pedestrian detection.
3.5.3 Measurement Errors
On a physical level measurement errors are shared with other visible light spectrum based
systems – fog, rain and dirt reduce the quality of measurement. The measurement principle
has been developed to such an extent that the accuracy of a measurement is not signifi-
cantly affected by environmental changes apart from the changes in visibility. Due to the
complex analysis of the data stream it is hard to define the situations for which the analysis
will work or fail for sure.
3.5.4 Implications for a Stimulation System
Stimulation at the object level might be easier but due to the large amount of processing it
would be hard to ensure that the stimulated objects represent what a real camera system
would detect. As mentioned in the introduction a stimulation system will need to be as fast
as possible to make sure the scenery is shown correctly for most of the measurement peri-
od. Although even then, without synchronization, a single frame delay is possible. As any
delay from the simulation and other aspects also add to the total delay such a system would
require a validation that its delay does not significantly reduce the performance of the
ADAS.
3.6 GPS
The Global Positioning System (GPS) allows the car to identify its position within a digital
roadmap. GPS has become a base technology and its use has expanded far beyond its
original use in the US military. Consumer electronic navigation systems for automobiles
Environment Sensors for ADAS Functions - GPS
37
provide position data solely based on GPS data and in some cases a barometer for height
measurement. Navigation systems built into cars provide additional accuracy by including
data from odometers and other available information within the car such as steering angle
and yaw rate. Aside from navigation functions, data from digital maps can also be used for
efficient battery management and to improve plausibility checks on object tracking. GPS
receivers require three satellite sources in order to determine their position. GPS has an
accuracy of 10m but this accuracy can be improved by additional information sources such
as the already stated odometry. A system to generate virtual satellite signals for the civil
used L1 GPS frequency 1575.42 MHz already exists. Test benches are located indoors
which shuts out the original GPS signals and therefore allow the GPS stimulation to be im-
plemented without further obstacles. Due to this circumstance the specifics of GPS need
not to be discussed.
Stimulation and Simulation for ADAS on HiL and ViL Level - GPS
38
4 Stimulation and Simulation for ADAS on HiL and ViL Level
As discussed in previous chapters every sensor system and ADAS comes with a unique set
of requirements for testing. Although in HiL and ViL the focus is on testing the integrated
unit as a whole the quality of this test relies on the quality of the stimulation system and the
quality of the simulation environment.
The stimulation system intercepts at the point between the Device under Test (DUT) and its
environment. Ideally it generates the same physical echoes as a real environment would.
The second point where stimulation can intercept is at the output of a sensor. The ad-
vantages and disadvantages of the two methods for each sensor system were discussed in
chapter 3.
In general, the overall validity of the stimulation determines which method is the better
choice. Stimulation which aims to generate the same physical echoes as a real environ-
ment is usually more effort but requires fewer adaptations between sensor systems. A
stimulation which intercepts at the point of object lists emulating the output of a sensor sys-
tem is generally less effort, but requires more adaptations between different systems and
separate validation. For a sensor system which measures in one or two dimensions such as
ultrasonic systems and cameras a stimulation through generation of physical signals is
achievable with reasonable effort. Stimulation of systems with 3D spatial recognition and
large multipath propagation pose a harder problem for stimulation.
The basis of a successful stimulation system is the simulation environment behind it.
Whether the sensor is stimulated or the output of the sensor is simulated, the source must
be realistic. The stimulation can only be as good as the underlying model of reality. Any
simulation uses generalizations which pose possible sources of error. In the case of the
CarMaker1 software used as environment simulation and ultrasonic sensor perception
simulation the vertical shapes of objects are dismissed, the differences in reflectivity of sur-
faces are not considered and irregular surfaces of objects such as trees will not be taken
into account. A further improvement of CarMaker or an additional simulation is required, if
the stimulation should include these factors. Stimulation of systems with 3D spatial recogni-
tion and large multipath propagation pose a harder problem and will also require an addi-
tional simulation on the basis of the 3D environment provided by CarMaker. In order to pro- 1 IPG Automotive GmbH, www.ipg.de

Stimulation and Simulation for ADAS on HiL and ViL Level - GPS
39
vide real-time testing of ADAS the simulation and stimulation have to fulfill harsh time con-
straints. Stimulation on the object level as well as on the sensor level can significantly im-
prove the testing procedures for ADAS. Proofing the validity of these methods will be the
cornerstone of this improvement.
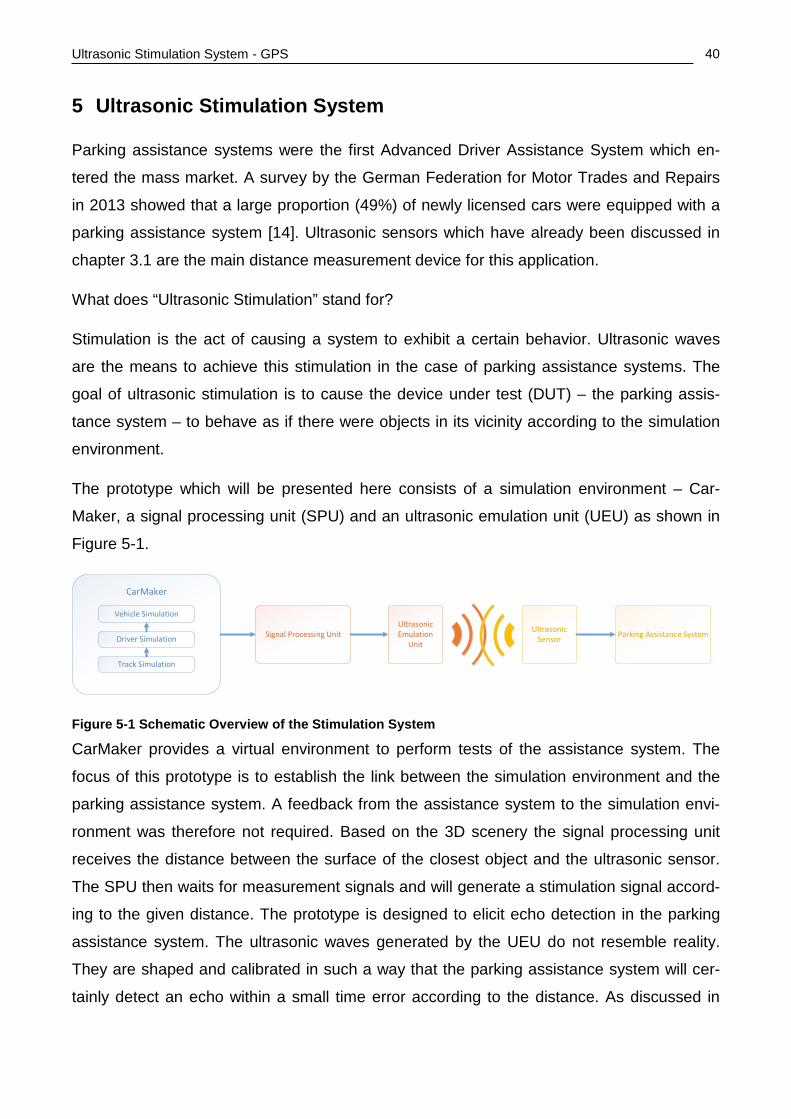
Ultrasonic Stimulation System - GPS
40
5 Ultrasonic Stimulation System
Parking assistance systems were the first Advanced Driver Assistance System which en-
tered the mass market. A survey by the German Federation for Motor Trades and Repairs
in 2013 showed that a large proportion (49%) of newly licensed cars were equipped with a
parking assistance system [14]. Ultrasonic sensors which have already been discussed in
chapter 3.1 are the main distance measurement device for this application.
What does “Ultrasonic Stimulation” stand for?
Stimulation is the act of causing a system to exhibit a certain behavior. Ultrasonic waves
are the means to achieve this stimulation in the case of parking assistance systems. The
goal of ultrasonic stimulation is to cause the device under test (DUT) – the parking assis-
tance system – to behave as if there were objects in its vicinity according to the simulation
environment.
The prototype which will be presented here consists of a simulation environment – Car-
Maker, a signal processing unit (SPU) and an ultrasonic emulation unit (UEU) as shown in
Figure 5-1.
Figure 5-1 Schematic Overview of the Stimulation System
CarMaker provides a virtual environment to perform tests of the assistance system. The
focus of this prototype is to establish the link between the simulation environment and the
parking assistance system. A feedback from the assistance system to the simulation envi-
ronment was therefore not required. Based on the 3D scenery the signal processing unit
receives the distance between the surface of the closest object and the ultrasonic sensor.
The SPU then waits for measurement signals and will generate a stimulation signal accord-
ing to the given distance. The prototype is designed to elicit echo detection in the parking
assistance system. The ultrasonic waves generated by the UEU do not resemble reality.
They are shaped and calibrated in such a way that the parking assistance system will cer-
tainly detect an echo within a small time error according to the distance. As discussed in
UltrasonicEmulation
UnitParking Assistance SystemSignal Processing Unit Ultrasonic
Sensor
CarMaker
Track Simulation
Driver Simulation
Vehicle Simulation
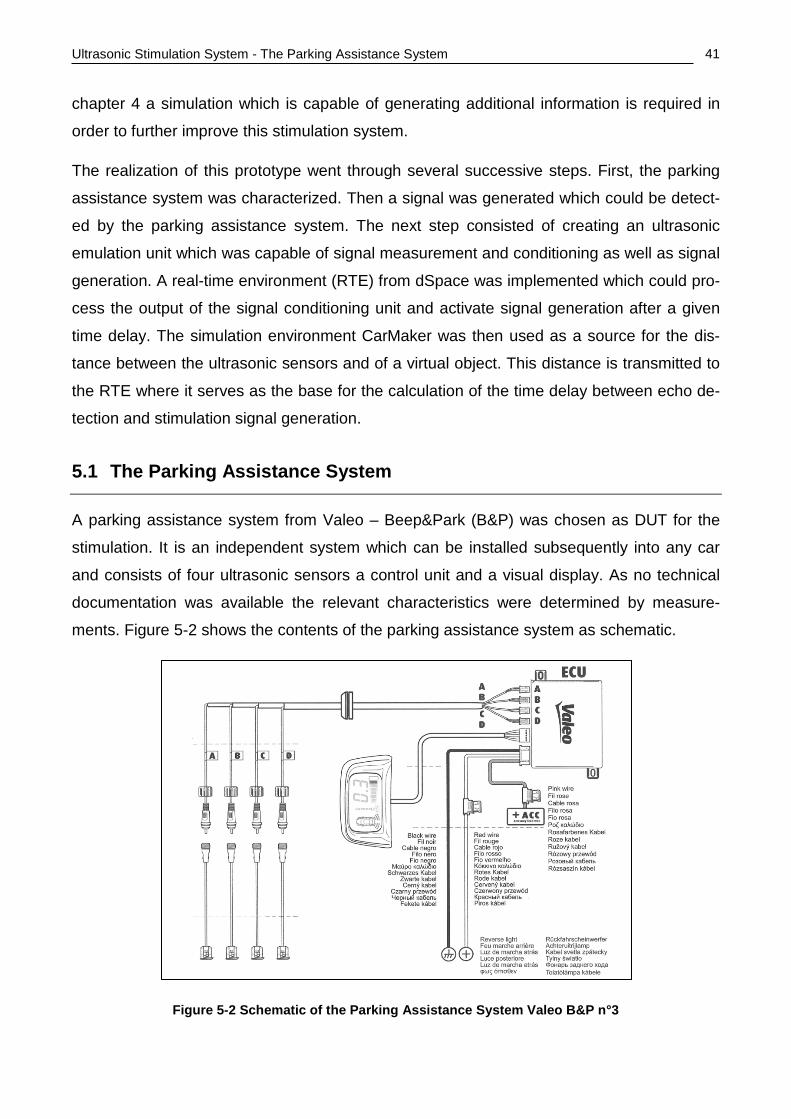
Ultrasonic Stimulation System - The Parking Assistance System
41
chapter 4 a simulation which is capable of generating additional information is required in
order to further improve this stimulation system.
The realization of this prototype went through several successive steps. First, the parking
assistance system was characterized. Then a signal was generated which could be detect-
ed by the parking assistance system. The next step consisted of creating an ultrasonic
emulation unit which was capable of signal measurement and conditioning as well as signal
generation. A real-time environment (RTE) from dSpace was implemented which could pro-
cess the output of the signal conditioning unit and activate signal generation after a given
time delay. The simulation environment CarMaker was then used as a source for the dis-
tance between the ultrasonic sensors and of a virtual object. This distance is transmitted to
the RTE where it serves as the base for the calculation of the time delay between echo de-
tection and stimulation signal generation.
5.1 The Parking Assistance System
A parking assistance system from Valeo – Beep&Park (B&P) was chosen as DUT for the
stimulation. It is an independent system which can be installed subsequently into any car
and consists of four ultrasonic sensors a control unit and a visual display. As no technical
documentation was available the relevant characteristics were determined by measure-
ments. Figure 5-2 shows the contents of the parking assistance system as schematic.
Figure 5-2 Schematic of the Parking Assistance System Valeo B&P n°3
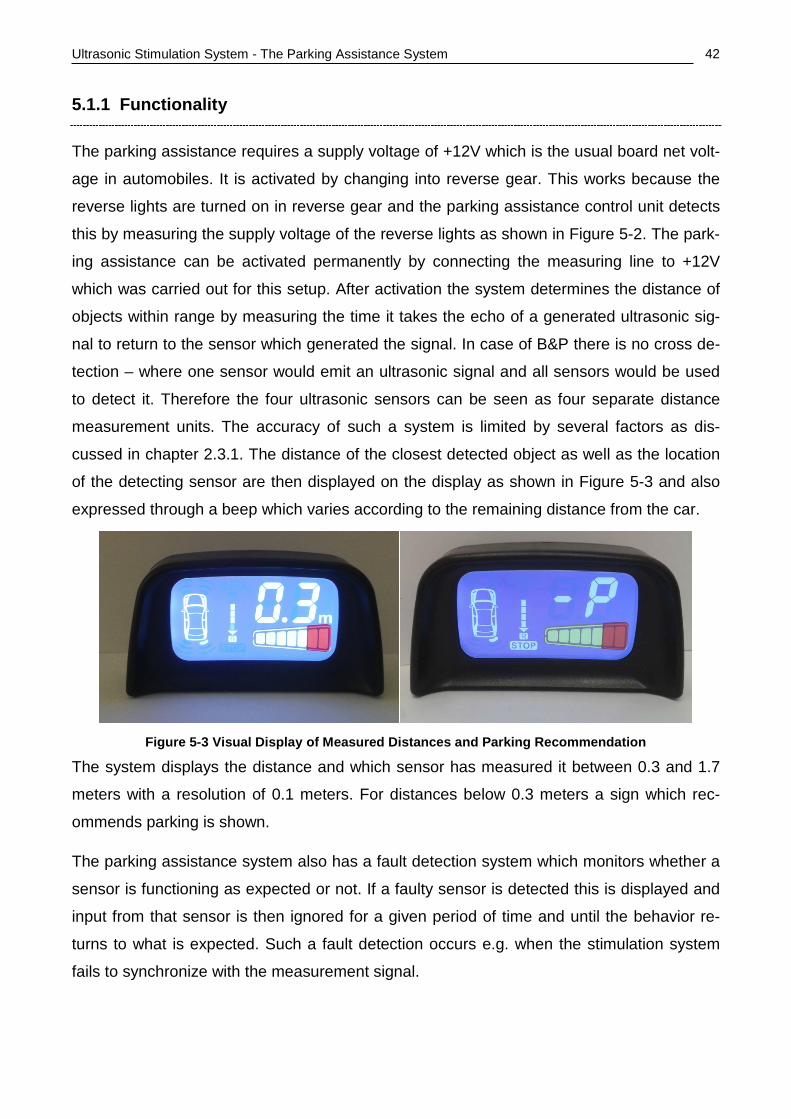
Ultrasonic Stimulation System - The Parking Assistance System
42
5.1.1 Functionality
The parking assistance requires a supply voltage of +12V which is the usual board net volt-
age in automobiles. It is activated by changing into reverse gear. This works because the
reverse lights are turned on in reverse gear and the parking assistance control unit detects
this by measuring the supply voltage of the reverse lights as shown in Figure 5-2. The park-
ing assistance can be activated permanently by connecting the measuring line to +12V
which was carried out for this setup. After activation the system determines the distance of
objects within range by measuring the time it takes the echo of a generated ultrasonic sig-
nal to return to the sensor which generated the signal. In case of B&P there is no cross de-
tection – where one sensor would emit an ultrasonic signal and all sensors would be used
to detect it. Therefore the four ultrasonic sensors can be seen as four separate distance
measurement units. The accuracy of such a system is limited by several factors as dis-
cussed in chapter 2.3.1. The distance of the closest detected object as well as the location
of the detecting sensor are then displayed on the display as shown in Figure 5-3 and also
expressed through a beep which varies according to the remaining distance from the car.
Figure 5-3 Visual Display of Measured Distances and Parking Recommendation
The system displays the distance and which sensor has measured it between 0.3 and 1.7
meters with a resolution of 0.1 meters. For distances below 0.3 meters a sign which rec-
ommends parking is shown.
The parking assistance system also has a fault detection system which monitors whether a
sensor is functioning as expected or not. If a faulty sensor is detected this is displayed and
input from that sensor is then ignored for a given period of time and until the behavior re-
turns to what is expected. Such a fault detection occurs e.g. when the stimulation system
fails to synchronize with the measurement signal.
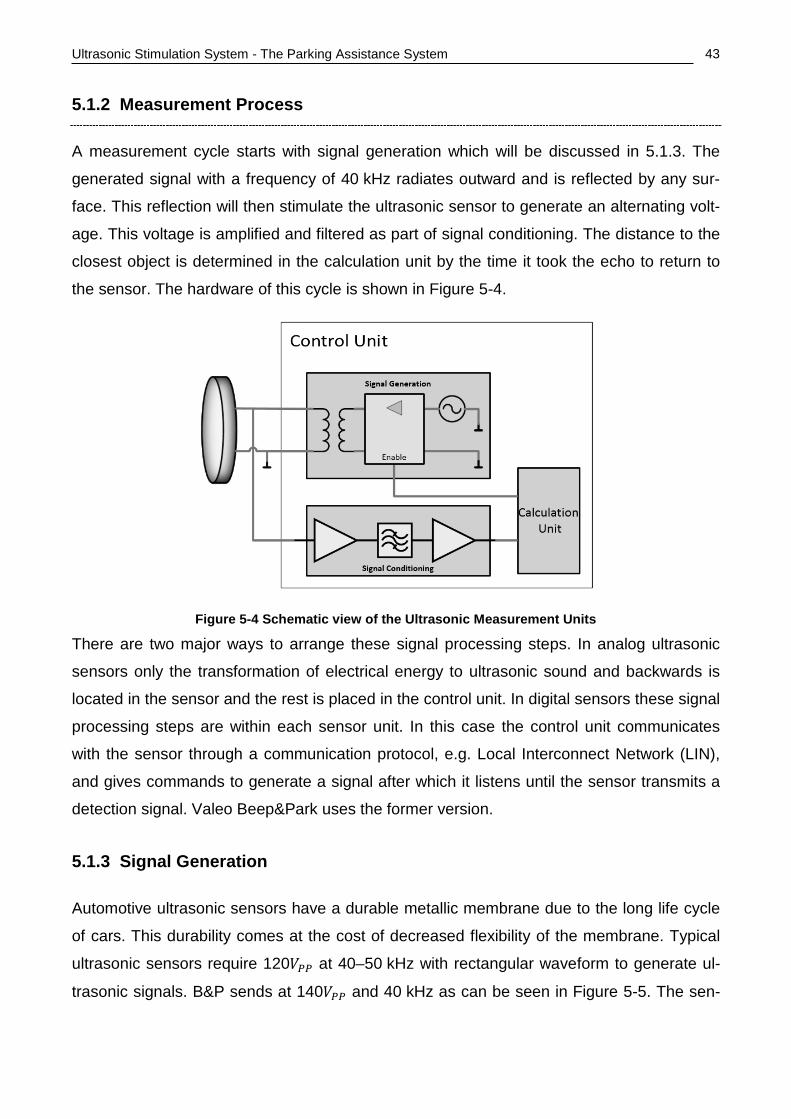
Ultrasonic Stimulation System - The Parking Assistance System
43
5.1.2 Measurement Process
A measurement cycle starts with signal generation which will be discussed in 5.1.3. The
generated signal with a frequency of 40 kHz radiates outward and is reflected by any sur-
face. This reflection will then stimulate the ultrasonic sensor to generate an alternating volt-
age. This voltage is amplified and filtered as part of signal conditioning. The distance to the
closest object is determined in the calculation unit by the time it took the echo to return to
the sensor. The hardware of this cycle is shown in Figure 5-4.
Figure 5-4 Schematic view of the Ultrasonic Measurement Units
There are two major ways to arrange these signal processing steps. In analog ultrasonic
sensors only the transformation of electrical energy to ultrasonic sound and backwards is
located in the sensor and the rest is placed in the control unit. In digital sensors these signal
processing steps are within each sensor unit. In this case the control unit communicates
with the sensor through a communication protocol, e.g. Local Interconnect Network (LIN),
and gives commands to generate a signal after which it listens until the sensor transmits a
detection signal. Valeo Beep&Park uses the former version.
5.1.3 Signal Generation
Automotive ultrasonic sensors have a durable metallic membrane due to the long life cycle
of cars. This durability comes at the cost of decreased flexibility of the membrane. Typical
ultrasonic sensors require 120𝑉𝑃𝑃 at 40–50 kHz with rectangular waveform to generate ul-
trasonic signals. B&P sends at 140𝑉𝑃𝑃 and 40 kHz as can be seen in Figure 5-5. The sen-
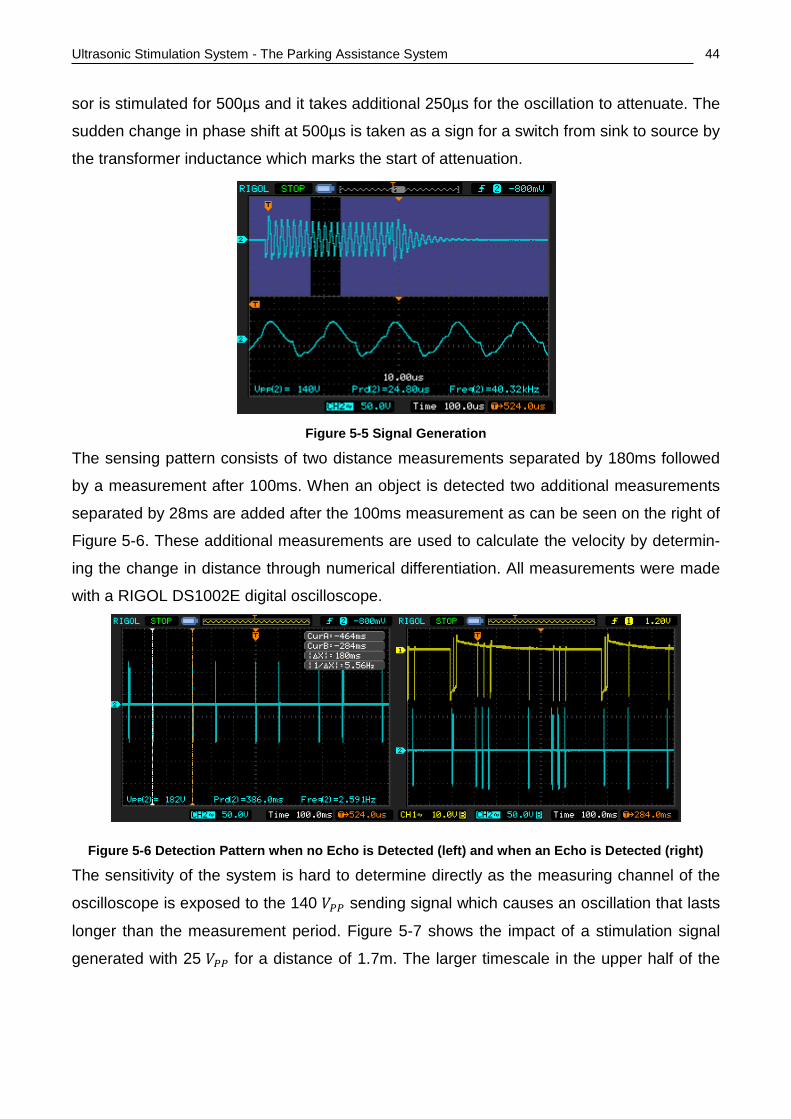
Ultrasonic Stimulation System - The Parking Assistance System
44
sor is stimulated for 500µs and it takes additional 250µs for the oscillation to attenuate. The
sudden change in phase shift at 500µs is taken as a sign for a switch from sink to source by
the transformer inductance which marks the start of attenuation.
Figure 5-5 Signal Generation
The sensing pattern consists of two distance measurements separated by 180ms followed
by a measurement after 100ms. When an object is detected two additional measurements
separated by 28ms are added after the 100ms measurement as can be seen on the right of
Figure 5-6. These additional measurements are used to calculate the velocity by determin-
ing the change in distance through numerical differentiation. All measurements were made
with a RIGOL DS1002E digital oscilloscope.
Figure 5-6 Detection Pattern when no Echo is Detected (left) and when an Echo is Detected (right)
The sensitivity of the system is hard to determine directly as the measuring channel of the
oscilloscope is exposed to the 140 𝑉𝑃𝑃 sending signal which causes an oscillation that lasts
longer than the measurement period. Figure 5-7 shows the impact of a stimulation signal
generated with 25 𝑉𝑃𝑃 for a distance of 1.7m. The larger timescale in the upper half of the
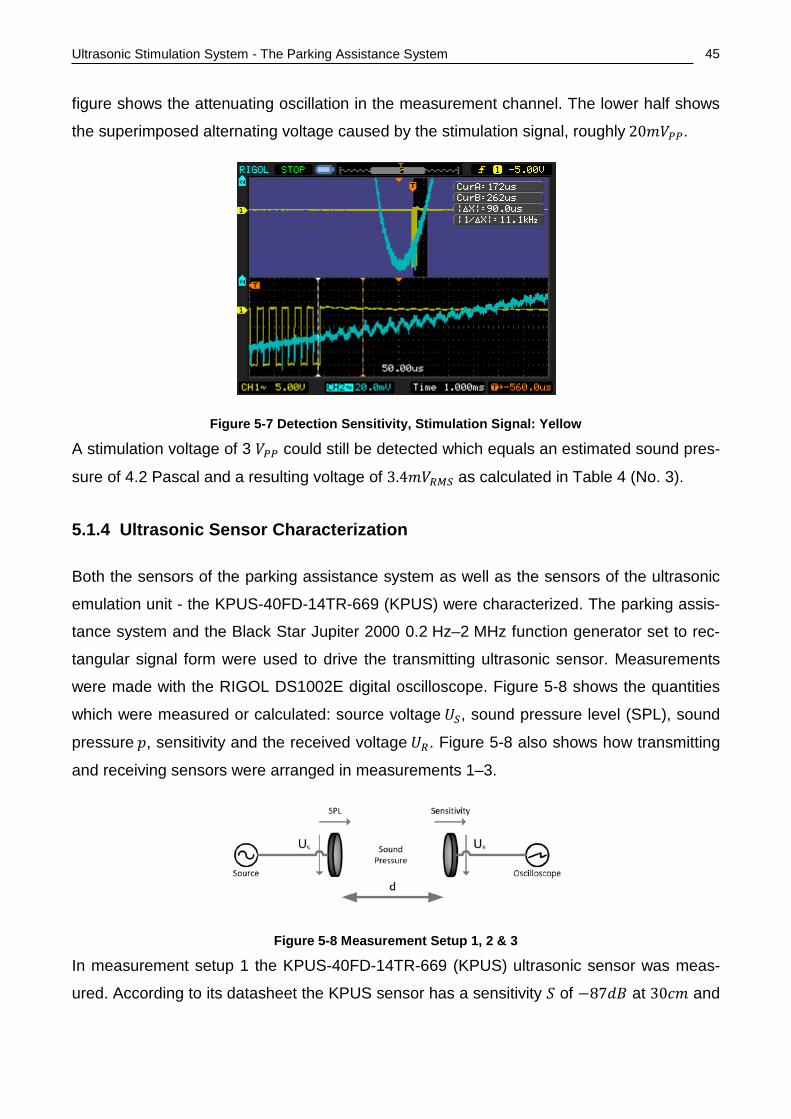
Ultrasonic Stimulation System - The Parking Assistance System
45
figure shows the attenuating oscillation in the measurement channel. The lower half shows
the superimposed alternating voltage caused by the stimulation signal, roughly 20𝑚𝑉𝑃𝑃.
Figure 5-7 Detection Sensitivity, Stimulation Signal: Yellow
A stimulation voltage of 3 𝑉𝑃𝑃 could still be detected which equals an estimated sound pres-
sure of 4.2 Pascal and a resulting voltage of 3.4𝑚𝑉𝑅𝑅𝑅 as calculated in Table 4 (No. 3).
5.1.4 Ultrasonic Sensor Characterization
Both the sensors of the parking assistance system as well as the sensors of the ultrasonic
emulation unit - the KPUS-40FD-14TR-669 (KPUS) were characterized. The parking assis-
tance system and the Black Star Jupiter 2000 0.2 Hz–2 MHz function generator set to rec-
tangular signal form were used to drive the transmitting ultrasonic sensor. Measurements
were made with the RIGOL DS1002E digital oscilloscope. Figure 5-8 shows the quantities
which were measured or calculated: source voltage 𝑈𝑅, sound pressure level (SPL), sound
pressure 𝑝, sensitivity and the received voltage 𝑈𝑅. Figure 5-8 also shows how transmitting
and receiving sensors were arranged in measurements 1–3.
Figure 5-8 Measurement Setup 1, 2 & 3
In measurement setup 1 the KPUS-40FD-14TR-669 (KPUS) ultrasonic sensor was meas-
ured. According to its datasheet the KPUS sensor has a sensitivity 𝑆 of −87𝑑𝑑 at 30𝑐𝑚 and
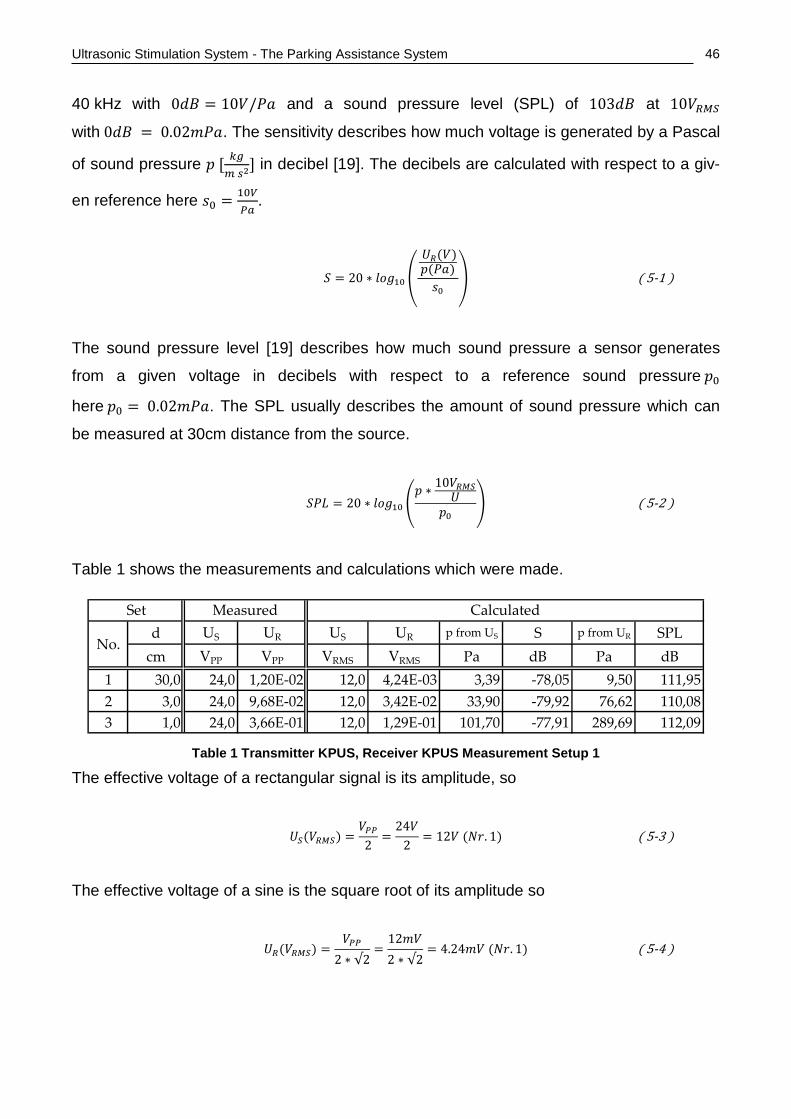
Ultrasonic Stimulation System - The Parking Assistance System
46
40 kHz with 0𝑑𝑑 = 10𝑉/𝑃𝑡 and a sound pressure level (SPL) of 103𝑑𝑑 at 10𝑉𝑅𝑅𝑅
with 0𝑑𝑑 = 0.02𝑚𝑃𝑡. The sensitivity describes how much voltage is generated by a Pascal
of sound pressure 𝑝 [ 𝑘𝑘𝑚 𝑠2
] in decibel [19]. The decibels are calculated with respect to a giv-
en reference here 𝑠0 = 10𝑉𝑃𝑃
.
𝑆 = 20 ∗ 𝑙𝑙𝑙10 �
𝑈𝑅(𝑉)𝑝(𝑃𝑡)𝑠0
� ( 5-1 )
The sound pressure level [19] describes how much sound pressure a sensor generates
from a given voltage in decibels with respect to a reference sound pressure 𝑝0
here 𝑝0 = 0.02𝑚𝑃𝑡. The SPL usually describes the amount of sound pressure which can
be measured at 30cm distance from the source.
𝑆𝑃𝑆 = 20 ∗ 𝑙𝑙𝑙10 �𝑝 ∗ 10𝑉𝑅𝑅𝑅
𝑈𝑝0
� ( 5-2 )
Table 1 shows the measurements and calculations which were made.
d US UR US UR p from US S p from UR SPLcm VPP VPP VRMS VRMS Pa dB Pa dB
1 30,0 24,0 1,20E-02 12,0 4,24E-03 3,39 -78,05 9,50 111,952 3,0 24,0 9,68E-02 12,0 3,42E-02 33,90 -79,92 76,62 110,083 1,0 24,0 3,66E-01 12,0 1,29E-01 101,70 -77,91 289,69 112,09
No.
Set Measured Calculated
Table 1 Transmitter KPUS, Receiver KPUS Measurement Setup 1
The effective voltage of a rectangular signal is its amplitude, so
𝑈𝑅(𝑉𝑅𝑅𝑅) =𝑉𝑃𝑃
2=
24𝑉2
= 12𝑉 (𝑁𝑟. 1) ( 5-3 )
The effective voltage of a sine is the square root of its amplitude so
𝑈𝑅(𝑉𝑅𝑅𝑅) =𝑉𝑃𝑃
2 ∗ √2=
12𝑚𝑉2 ∗ √2
= 4.24𝑚𝑉 (𝑁𝑟. 1) ( 5-4 )
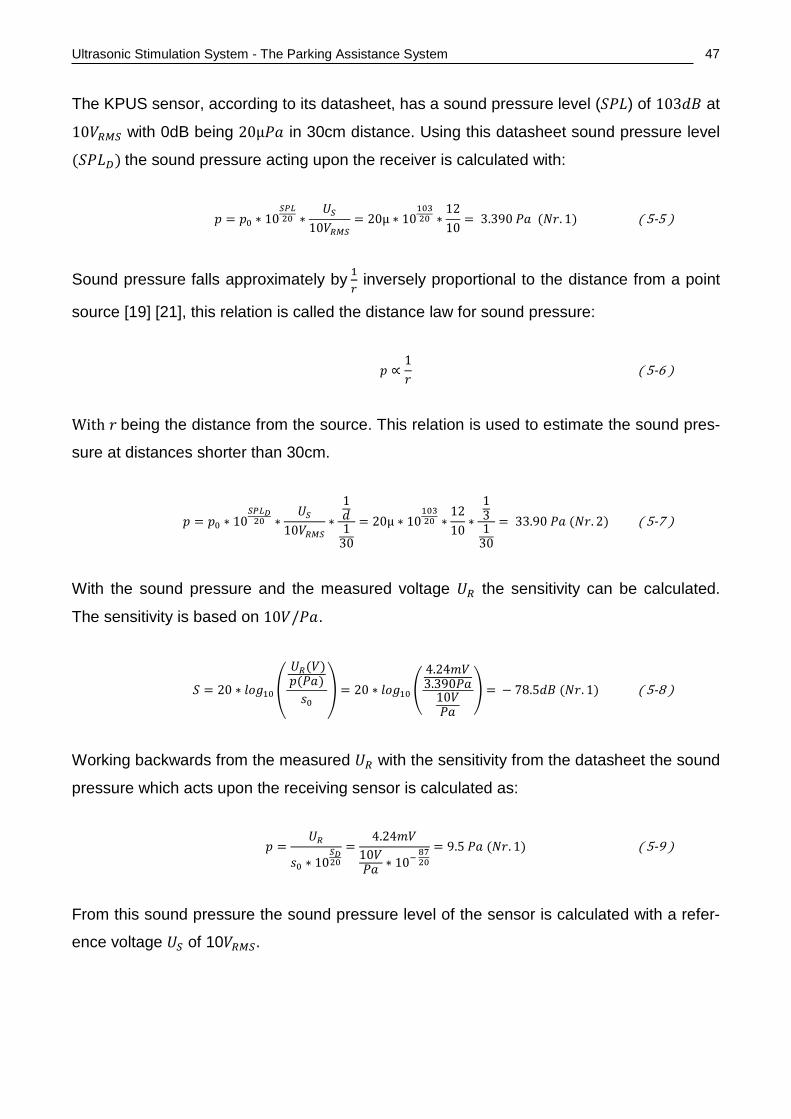
Ultrasonic Stimulation System - The Parking Assistance System
47
The KPUS sensor, according to its datasheet, has a sound pressure level (𝑆𝑃𝑆) of 103𝑑𝑑 at
10𝑉𝑅𝑅𝑅 with 0dB being 20µ𝑃𝑡 in 30cm distance. Using this datasheet sound pressure level
(𝑆𝑃𝑆𝐷) the sound pressure acting upon the receiver is calculated with:
𝑝 = 𝑝0 ∗ 10𝑅𝑃𝑆20 ∗
𝑈𝑅10𝑉𝑅𝑅𝑅
= 20µ ∗ 1010320 ∗
1210
= 3.390 𝑃𝑡 (𝑁𝑟. 1) ( 5-5 )
Sound pressure falls approximately by 1𝐷 inversely proportional to the distance from a point
source [19] [21], this relation is called the distance law for sound pressure:
𝑝 ∝1𝑟
( 5-6 )
With 𝑟 being the distance from the source. This relation is used to estimate the sound pres-
sure at distances shorter than 30cm.
𝑝 = 𝑝0 ∗ 10𝑅𝑃𝑆𝐷20 ∗
𝑈𝑅10𝑉𝑅𝑅𝑅
∗1𝑑1
30= 20µ ∗ 10
10320 ∗
1210
∗131
30= 33.90 𝑃𝑡 (𝑁𝑟. 2) ( 5-7 )
With the sound pressure and the measured voltage 𝑈𝑅 the sensitivity can be calculated.
The sensitivity is based on 10𝑉/𝑃𝑡.
𝑆 = 20 ∗ 𝑙𝑙𝑙10 �
𝑈𝑅(𝑉)𝑝(𝑃𝑡)𝑠0
� = 20 ∗ 𝑙𝑙𝑙10 �4.24𝑚𝑉3.390𝑃𝑡
10𝑉𝑃𝑡
� = − 78.5𝑑𝑑 (𝑁𝑟. 1) ( 5-8 )
Working backwards from the measured 𝑈𝑅 with the sensitivity from the datasheet the sound
pressure which acts upon the receiving sensor is calculated as:
𝑝 =𝑈𝑅
𝑠0 ∗ 10𝑅𝐷20
=4.24𝑚𝑉
10𝑉𝑃𝑡 ∗ 10− 8720
= 9.5 𝑃𝑡 (𝑁𝑟. 1) ( 5-9 )
From this sound pressure the sound pressure level of the sensor is calculated with a refer-
ence voltage 𝑈𝑅 of 10𝑉𝑅𝑅𝑅.
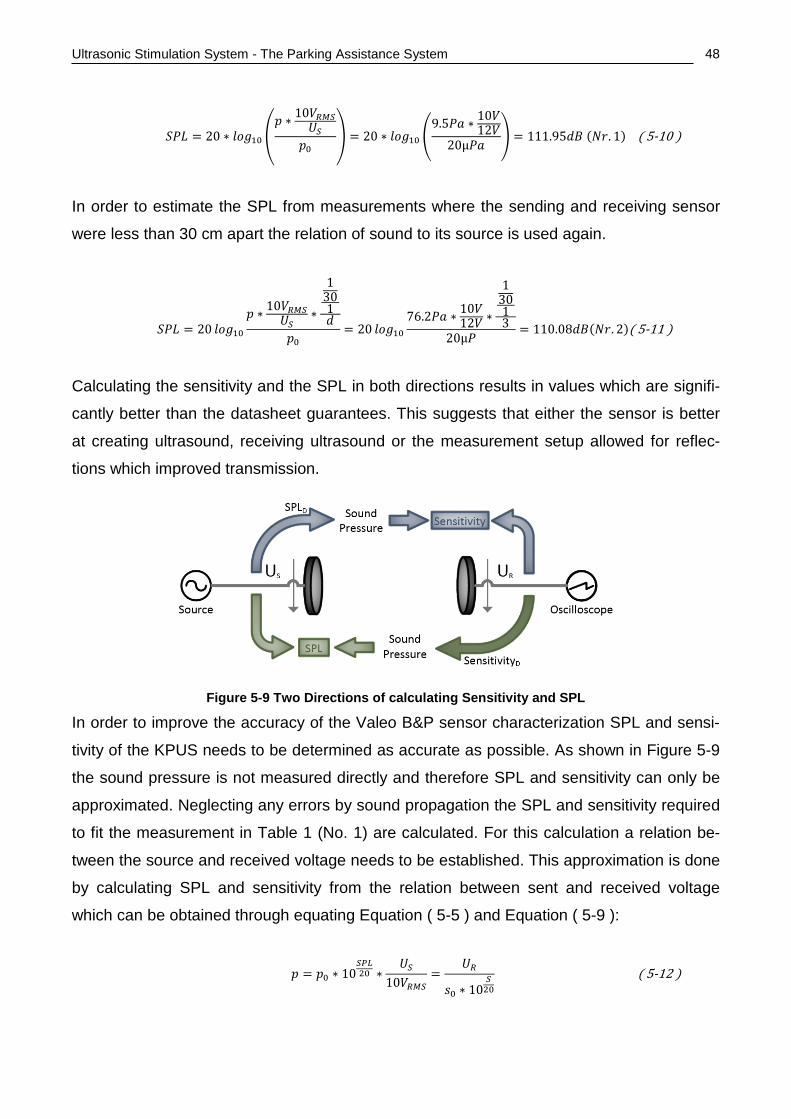
Ultrasonic Stimulation System - The Parking Assistance System
48
𝑆𝑃𝑆 = 20 ∗ 𝑙𝑙𝑙10 �𝑝 ∗ 10𝑉𝑅𝑅𝑅
𝑈𝑅𝑝0
� = 20 ∗ 𝑙𝑙𝑙10 �9.5𝑃𝑡 ∗ 10𝑉
12𝑉20µ𝑃𝑡
� = 111.95𝑑𝑑 (𝑁𝑟. 1) ( 5-10 )
In order to estimate the SPL from measurements where the sending and receiving sensor
were less than 30 cm apart the relation of sound to its source is used again.
𝑆𝑃𝑆 = 20 𝑙𝑙𝑙10𝑝 ∗ 10𝑉𝑅𝑅𝑅
𝑈𝑅∗
1301𝑑
𝑝0= 20 𝑙𝑙𝑙10
76.2𝑃𝑡 ∗ 10𝑉12𝑉 ∗
13013
20µ𝑃= 110.08𝑑𝑑(𝑁𝑟. 2)( 5-11 )
Calculating the sensitivity and the SPL in both directions results in values which are signifi-
cantly better than the datasheet guarantees. This suggests that either the sensor is better
at creating ultrasound, receiving ultrasound or the measurement setup allowed for reflec-
tions which improved transmission.
Figure 5-9 Two Directions of calculating Sensitivity and SPL
In order to improve the accuracy of the Valeo B&P sensor characterization SPL and sensi-
tivity of the KPUS needs to be determined as accurate as possible. As shown in Figure 5-9
the sound pressure is not measured directly and therefore SPL and sensitivity can only be
approximated. Neglecting any errors by sound propagation the SPL and sensitivity required
to fit the measurement in Table 1 (No. 1) are calculated. For this calculation a relation be-
tween the source and received voltage needs to be established. This approximation is done
by calculating SPL and sensitivity from the relation between sent and received voltage
which can be obtained through equating Equation ( 5-5 ) and Equation ( 5-9 ):
𝑝 = 𝑝0 ∗ 10𝑅𝑃𝑆20 ∗
𝑈𝑅10𝑉𝑅𝑅𝑅
=𝑈𝑅
𝑠0 ∗ 10𝑅20
( 5-12 )
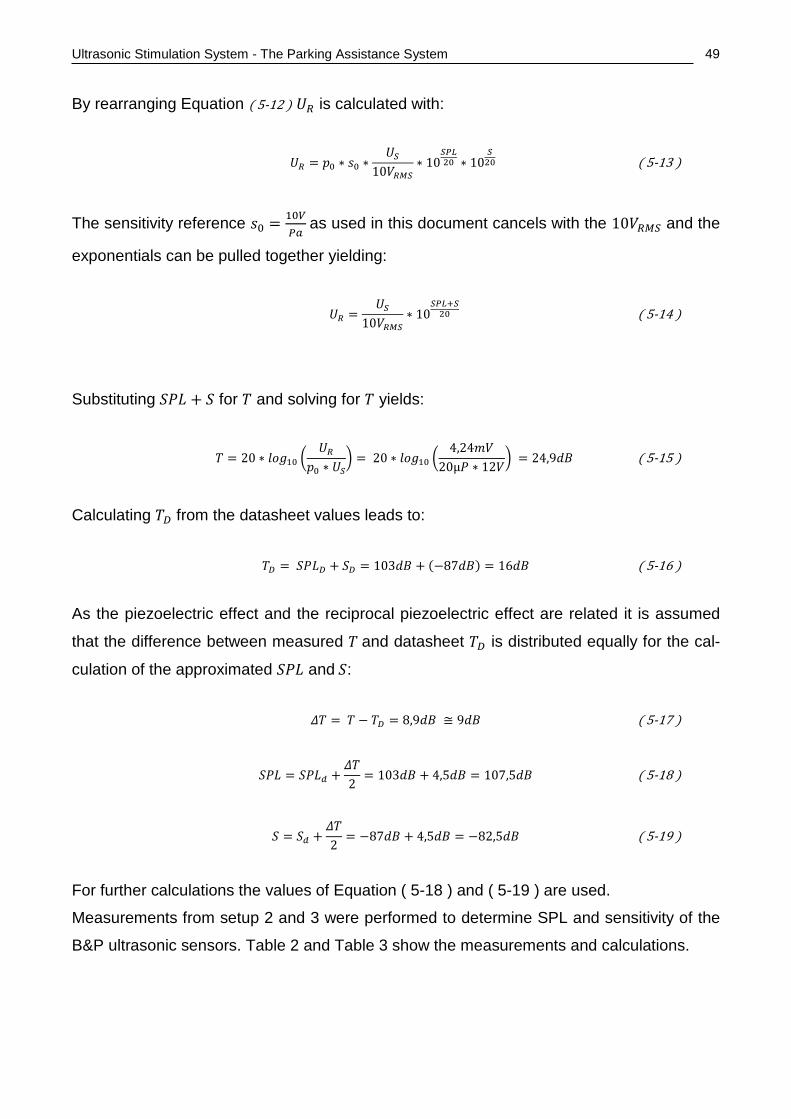
Ultrasonic Stimulation System - The Parking Assistance System
49
By rearranging Equation ( 5-12 ) 𝑈𝑅 is calculated with:
𝑈𝑅 = 𝑝0 ∗ 𝑠0 ∗𝑈𝑅
10𝑉𝑅𝑅𝑅∗ 10
𝑅𝑃𝑆20 ∗ 10
𝑅20 ( 5-13 )
The sensitivity reference 𝑠0 = 10𝑉𝑃𝑃
as used in this document cancels with the 10𝑉𝑅𝑅𝑅 and the
exponentials can be pulled together yielding:
𝑈𝑅 =𝑈𝑅
10𝑉𝑅𝑅𝑅∗ 10
𝑅𝑃𝑆+𝑅20 ( 5-14 )
Substituting 𝑆𝑃𝑆 + 𝑆 for 𝑇 and solving for 𝑇 yields:
𝑇 = 20 ∗ 𝑙𝑙𝑙10 �𝑈𝑅
𝑝0 ∗ 𝑈𝑅� = 20 ∗ 𝑙𝑙𝑙10 �
4,24𝑚𝑉20µ𝑃 ∗ 12𝑉
� = 24,9𝑑𝑑 ( 5-15 )
Calculating 𝑇𝐷 from the datasheet values leads to:
𝑇𝐷 = 𝑆𝑃𝑆𝐷 + 𝑆𝐷 = 103𝑑𝑑 + (−87𝑑𝑑) = 16𝑑𝑑 ( 5-16 )
As the piezoelectric effect and the reciprocal piezoelectric effect are related it is assumed
that the difference between measured 𝑇 and datasheet 𝑇𝐷 is distributed equally for the cal-
culation of the approximated 𝑆𝑃𝑆 and 𝑆:
𝛥𝑇 = 𝑇 − 𝑇𝐷 = 8,9𝑑𝑑 ≅ 9𝑑𝑑 ( 5-17 )
𝑆𝑃𝑆 = 𝑆𝑃𝑆𝑑 +𝛥𝑇2
= 103𝑑𝑑 + 4,5𝑑𝑑 = 107,5𝑑𝑑 ( 5-18 )
𝑆 = 𝑆𝑑 +𝛥𝑇2
= −87𝑑𝑑 + 4,5𝑑𝑑 = −82,5𝑑𝑑 ( 5-19 )
For further calculations the values of Equation ( 5-18 ) and ( 5-19 ) are used.
Measurements from setup 2 and 3 were performed to determine SPL and sensitivity of the
B&P ultrasonic sensors. Table 2 and Table 3 show the measurements and calculations.
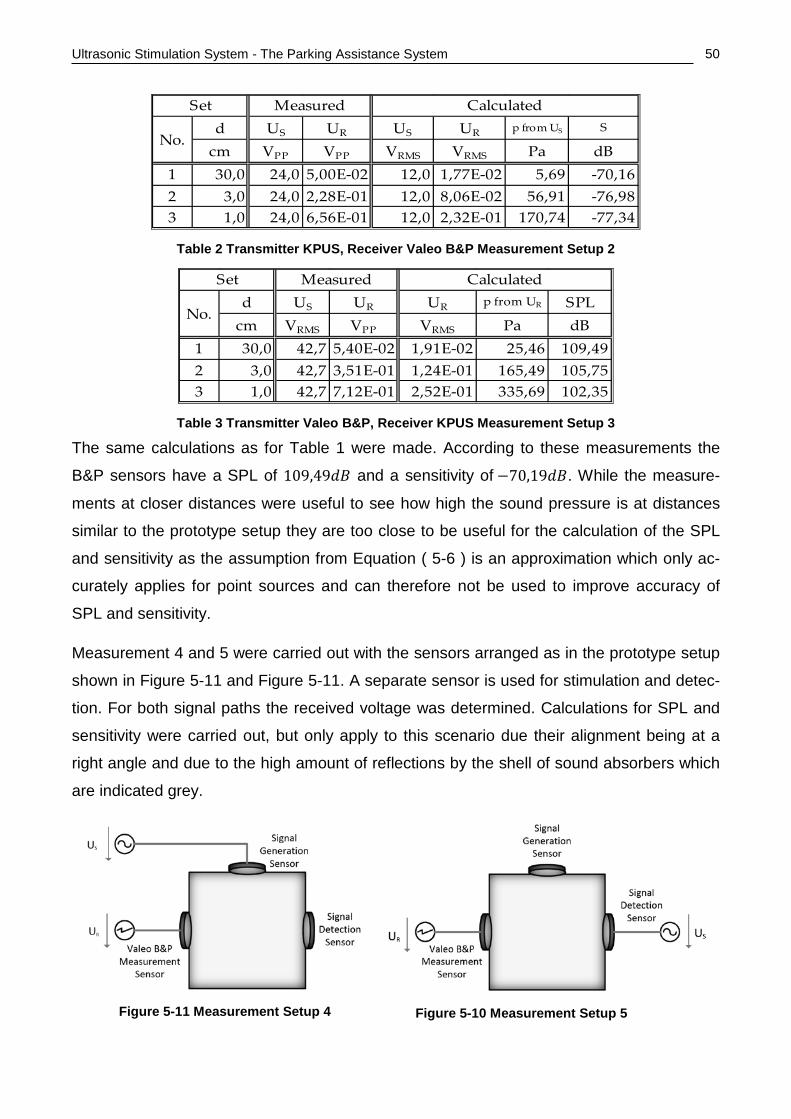
Ultrasonic Stimulation System - The Parking Assistance System
50
d US UR US UR p from US S
cm VPP VPP VRMS VRMS Pa dB1 30,0 24,0 5,00E-02 12,0 1,77E-02 5,69 -70,162 3,0 24,0 2,28E-01 12,0 8,06E-02 56,91 -76,983 1,0 24,0 6,56E-01 12,0 2,32E-01 170,74 -77,34
No.
Set Measured Calculated
Table 2 Transmitter KPUS, Receiver Valeo B&P Measurement Setup 2
d US UR UR p from UR SPLcm VRMS VPP VRMS Pa dB
1 30,0 42,7 5,40E-02 1,91E-02 25,46 109,492 3,0 42,7 3,51E-01 1,24E-01 165,49 105,753 1,0 42,7 7,12E-01 2,52E-01 335,69 102,35
No.
Set Measured Calculated
Table 3 Transmitter Valeo B&P, Receiver KPUS Measurement Setup 3
The same calculations as for Table 1 were made. According to these measurements the
B&P sensors have a SPL of 109,49𝑑𝑑 and a sensitivity of −70,19𝑑𝑑. While the measure-
ments at closer distances were useful to see how high the sound pressure is at distances
similar to the prototype setup they are too close to be useful for the calculation of the SPL
and sensitivity as the assumption from Equation ( 5-6 ) is an approximation which only ac-
curately applies for point sources and can therefore not be used to improve accuracy of
SPL and sensitivity.
Measurement 4 and 5 were carried out with the sensors arranged as in the prototype setup
shown in Figure 5-11 and Figure 5-11. A separate sensor is used for stimulation and detec-
tion. For both signal paths the received voltage was determined. Calculations for SPL and
sensitivity were carried out, but only apply to this scenario due their alignment being at a
right angle and due to the high amount of reflections by the shell of sound absorbers which
are indicated grey.
Figure 5-11 Measurement Setup 4 Figure 5-10 Measurement Setup 5
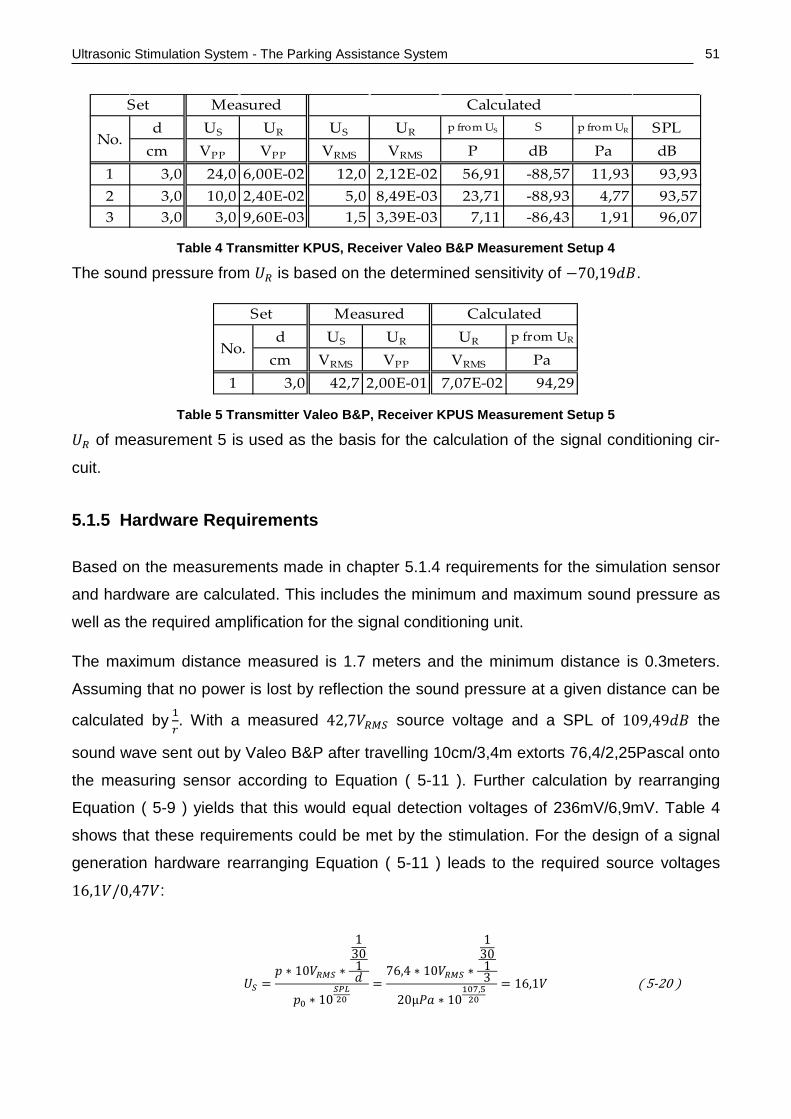
Ultrasonic Stimulation System - The Parking Assistance System
51
d US UR US UR p from US S p from UR SPLcm VPP VPP VRMS VRMS P dB Pa dB
1 3,0 24,0 6,00E-02 12,0 2,12E-02 56,91 -88,57 11,93 93,932 3,0 10,0 2,40E-02 5,0 8,49E-03 23,71 -88,93 4,77 93,573 3,0 3,0 9,60E-03 1,5 3,39E-03 7,11 -86,43 1,91 96,07
No.
Set Measured Calculated
Table 4 Transmitter KPUS, Receiver Valeo B&P Measurement Setup 4
The sound pressure from 𝑈𝑅 is based on the determined sensitivity of −70,19𝑑𝑑.
d US UR UR p from UR
cm VRMS VPP VRMS Pa1 3,0 42,7 2,00E-01 7,07E-02 94,29
No.
Set Measured Calculated
Table 5 Transmitter Valeo B&P, Receiver KPUS Measurement Setup 5
𝑈𝑅 of measurement 5 is used as the basis for the calculation of the signal conditioning cir-
cuit.
5.1.5 Hardware Requirements
Based on the measurements made in chapter 5.1.4 requirements for the simulation sensor
and hardware are calculated. This includes the minimum and maximum sound pressure as
well as the required amplification for the signal conditioning unit.
The maximum distance measured is 1.7 meters and the minimum distance is 0.3meters.
Assuming that no power is lost by reflection the sound pressure at a given distance can be
calculated by 1𝐷. With a measured 42,7𝑉𝑅𝑅𝑅 source voltage and a SPL of 109,49𝑑𝑑 the
sound wave sent out by Valeo B&P after travelling 10cm/3,4m extorts 76,4/2,25Pascal onto
the measuring sensor according to Equation ( 5-11 ). Further calculation by rearranging
Equation ( 5-9 ) yields that this would equal detection voltages of 236mV/6,9mV. Table 4
shows that these requirements could be met by the stimulation. For the design of a signal
generation hardware rearranging Equation ( 5-11 ) leads to the required source voltages
16,1𝑉/0,47𝑉:
𝑈𝑅 =𝑝 ∗ 10𝑉𝑅𝑅𝑅 ∗
1301𝑑
𝑝0 ∗ 10𝑅𝑃𝑆20
=76,4 ∗ 10𝑉𝑅𝑅𝑅 ∗
13013
20µ𝑃𝑡 ∗ 10107,520
= 16,1𝑉 ( 5-20 )
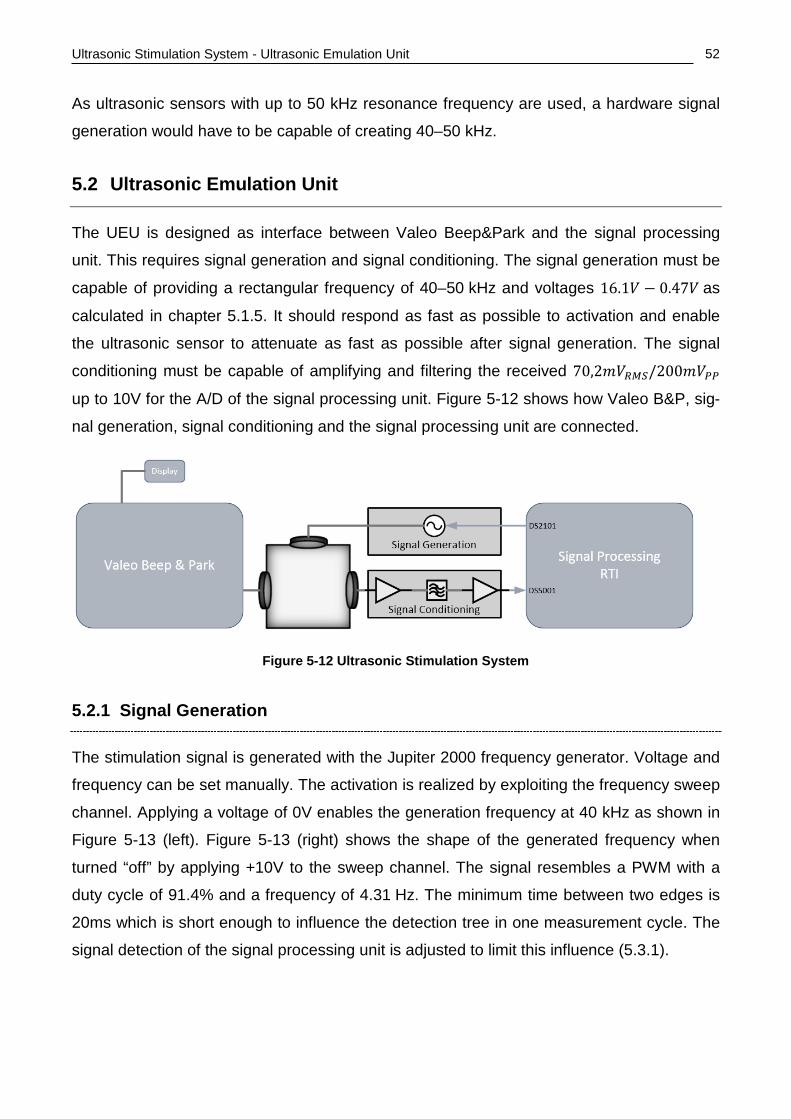
Ultrasonic Stimulation System - Ultrasonic Emulation Unit
52
As ultrasonic sensors with up to 50 kHz resonance frequency are used, a hardware signal
generation would have to be capable of creating 40–50 kHz.
5.2 Ultrasonic Emulation Unit
The UEU is designed as interface between Valeo Beep&Park and the signal processing
unit. This requires signal generation and signal conditioning. The signal generation must be
capable of providing a rectangular frequency of 40–50 kHz and voltages 16.1𝑉 − 0.47𝑉 as
calculated in chapter 5.1.5. It should respond as fast as possible to activation and enable
the ultrasonic sensor to attenuate as fast as possible after signal generation. The signal
conditioning must be capable of amplifying and filtering the received 70,2𝑚𝑉𝑅𝑅𝑅/200𝑚𝑉𝑃𝑃
up to 10V for the A/D of the signal processing unit. Figure 5-12 shows how Valeo B&P, sig-
nal generation, signal conditioning and the signal processing unit are connected.
Figure 5-12 Ultrasonic Stimulation System
5.2.1 Signal Generation
The stimulation signal is generated with the Jupiter 2000 frequency generator. Voltage and
frequency can be set manually. The activation is realized by exploiting the frequency sweep
channel. Applying a voltage of 0V enables the generation frequency at 40 kHz as shown in
Figure 5-13 (left). Figure 5-13 (right) shows the shape of the generated frequency when
turned “off” by applying +10V to the sweep channel. The signal resembles a PWM with a
duty cycle of 91.4% and a frequency of 4.31 Hz. The minimum time between two edges is
20ms which is short enough to influence the detection tree in one measurement cycle. The
signal detection of the signal processing unit is adjusted to limit this influence (5.3.1).
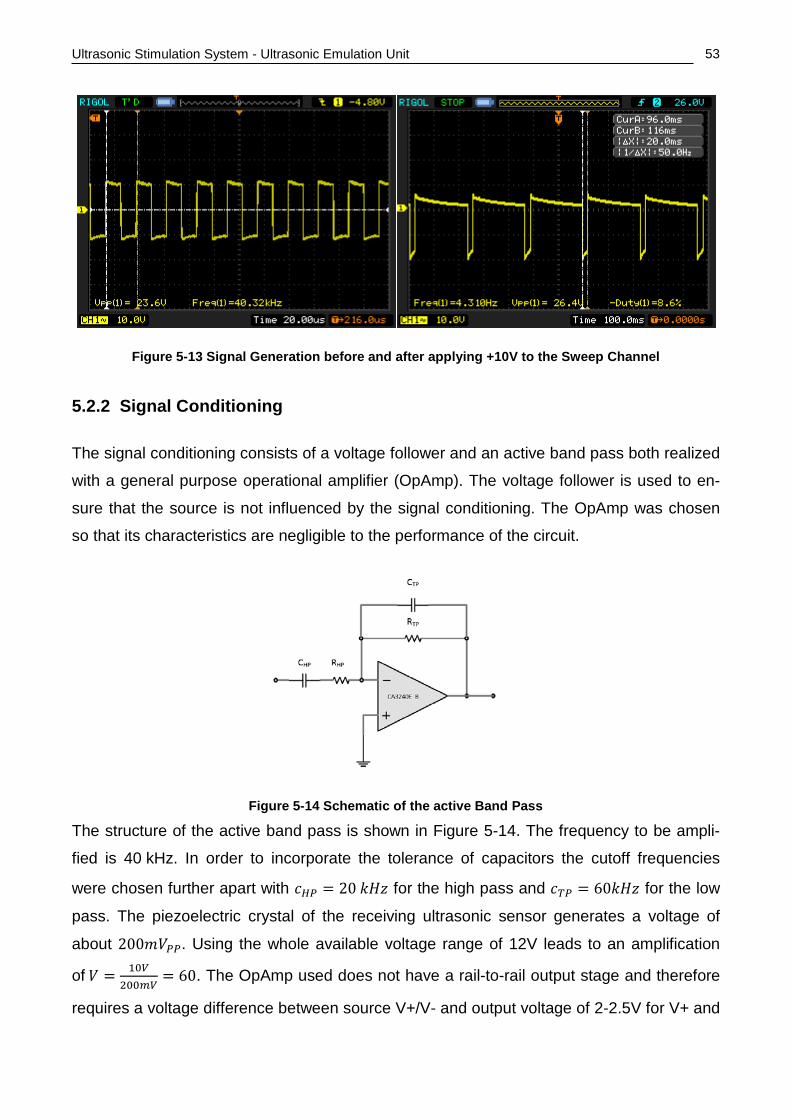
Ultrasonic Stimulation System - Ultrasonic Emulation Unit
53
Figure 5-13 Signal Generation before and after applying +10V to the Sweep Channel
5.2.2 Signal Conditioning
The signal conditioning consists of a voltage follower and an active band pass both realized
with a general purpose operational amplifier (OpAmp). The voltage follower is used to en-
sure that the source is not influenced by the signal conditioning. The OpAmp was chosen
so that its characteristics are negligible to the performance of the circuit.
Figure 5-14 Schematic of the active Band Pass
The structure of the active band pass is shown in Figure 5-14. The frequency to be ampli-
fied is 40 kHz. In order to incorporate the tolerance of capacitors the cutoff frequencies
were chosen further apart with 𝑐𝐻𝑃 = 20 𝑘𝐺𝐺 for the high pass and 𝑐𝑇𝑃 = 60𝑘𝐺𝐺 for the low
pass. The piezoelectric crystal of the receiving ultrasonic sensor generates a voltage of
about 200𝑚𝑉𝑃𝑃. Using the whole available voltage range of 12V leads to an amplification
of 𝑉 = 10𝑉200𝑚𝑉
= 60. The OpAmp used does not have a rail-to-rail output stage and therefore
requires a voltage difference between source V+/V- and output voltage of 2-2.5V for V+ and
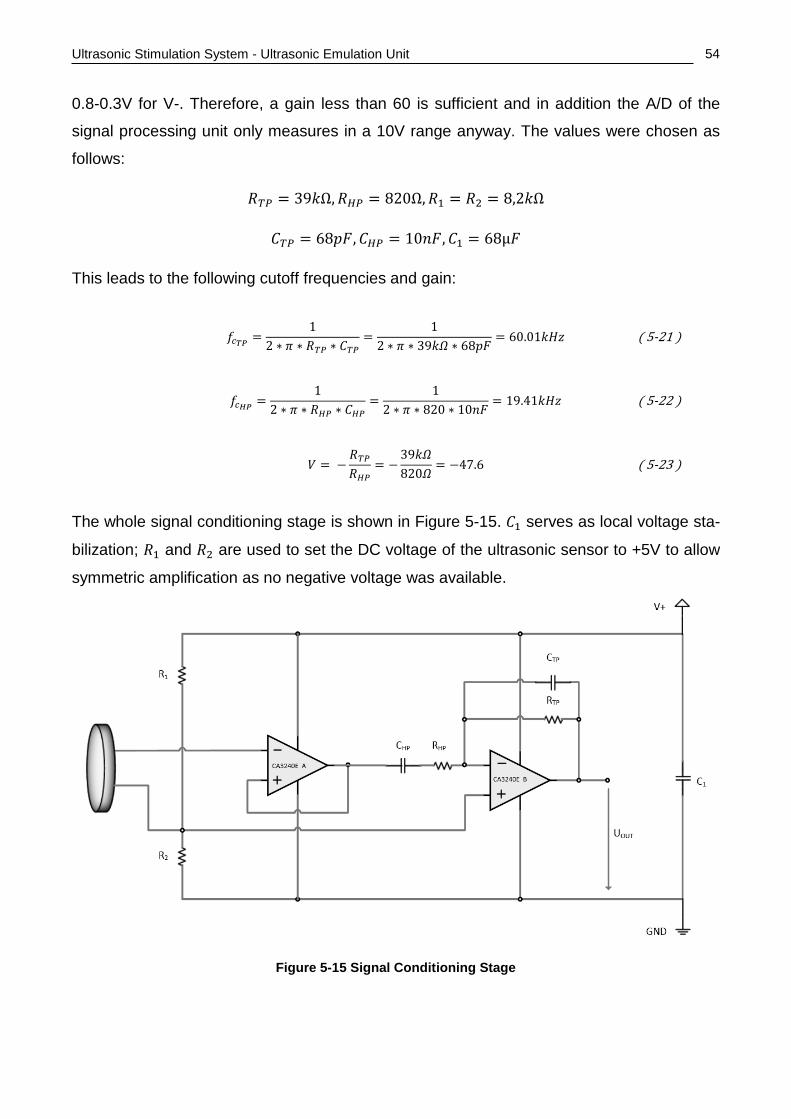
Ultrasonic Stimulation System - Ultrasonic Emulation Unit
54
0.8-0.3V for V-. Therefore, a gain less than 60 is sufficient and in addition the A/D of the
signal processing unit only measures in a 10V range anyway. The values were chosen as
follows:
𝑅𝑇𝑃 = 39𝑘Ω,𝑅𝐻𝑃 = 820Ω,𝑅1 = 𝑅2 = 8,2𝑘Ω
𝐶𝑇𝑃 = 68𝑝𝑝,𝐶𝐻𝑃 = 10𝑡𝑝,𝐶1 = 68µ𝑝
This leads to the following cutoff frequencies and gain:
𝑓𝑐𝑇𝑇 =1
2 ∗ 𝜋 ∗ 𝑅𝑇𝑃 ∗ 𝐶𝑇𝑃=
12 ∗ 𝜋 ∗ 39𝑘𝑘 ∗ 68𝑝𝑝
= 60.01𝑘𝐺𝐺 ( 5-21 )
𝑓𝑐𝐻𝑇 =1
2 ∗ 𝜋 ∗ 𝑅𝐻𝑃 ∗ 𝐶𝐻𝑃=
12 ∗ 𝜋 ∗ 820 ∗ 10𝑡𝑝
= 19.41𝑘𝐺𝐺 ( 5-22 )
𝑉 = −𝑅𝑇𝑃𝑅𝐻𝑃
= −39𝑘𝑘820𝑘
= −47.6 ( 5-23 )
The whole signal conditioning stage is shown in Figure 5-15. 𝐶1 serves as local voltage sta-
bilization; 𝑅1 and 𝑅2 are used to set the DC voltage of the ultrasonic sensor to +5V to allow
symmetric amplification as no negative voltage was available.
Figure 5-15 Signal Conditioning Stage
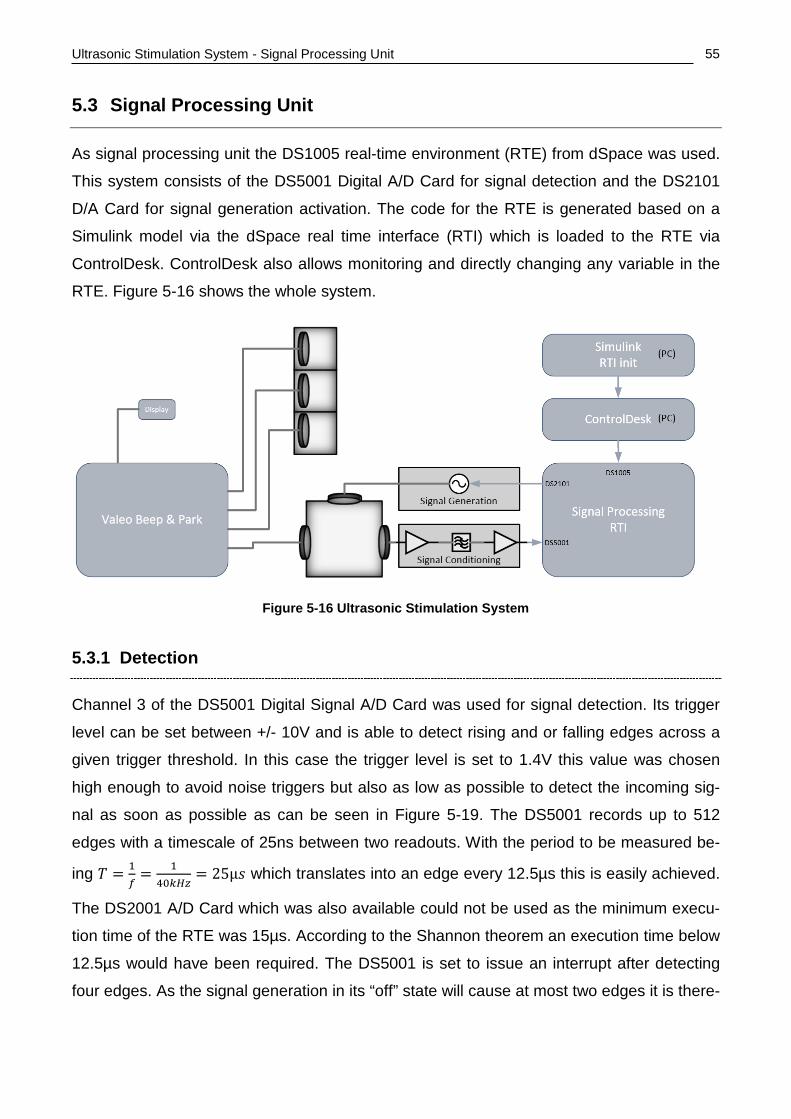
Ultrasonic Stimulation System - Signal Processing Unit
55
5.3 Signal Processing Unit
As signal processing unit the DS1005 real-time environment (RTE) from dSpace was used.
This system consists of the DS5001 Digital A/D Card for signal detection and the DS2101
D/A Card for signal generation activation. The code for the RTE is generated based on a
Simulink model via the dSpace real time interface (RTI) which is loaded to the RTE via
ControlDesk. ControlDesk also allows monitoring and directly changing any variable in the
RTE. Figure 5-16 shows the whole system.
Figure 5-16 Ultrasonic Stimulation System
5.3.1 Detection
Channel 3 of the DS5001 Digital Signal A/D Card was used for signal detection. Its trigger
level can be set between +/- 10V and is able to detect rising and or falling edges across a
given trigger threshold. In this case the trigger level is set to 1.4V this value was chosen
high enough to avoid noise triggers but also as low as possible to detect the incoming sig-
nal as soon as possible as can be seen in Figure 5-19. The DS5001 records up to 512
edges with a timescale of 25ns between two readouts. With the period to be measured be-
ing 𝑇 = 1𝑓
= 140𝑘𝐻𝑘
= 25µ𝑠 which translates into an edge every 12.5µs this is easily achieved.
The DS2001 A/D Card which was also available could not be used as the minimum execu-
tion time of the RTE was 15µs. According to the Shannon theorem an execution time below
12.5µs would have been required. The DS5001 is set to issue an interrupt after detecting
four edges. As the signal generation in its “off” state will cause at most two edges it is there-
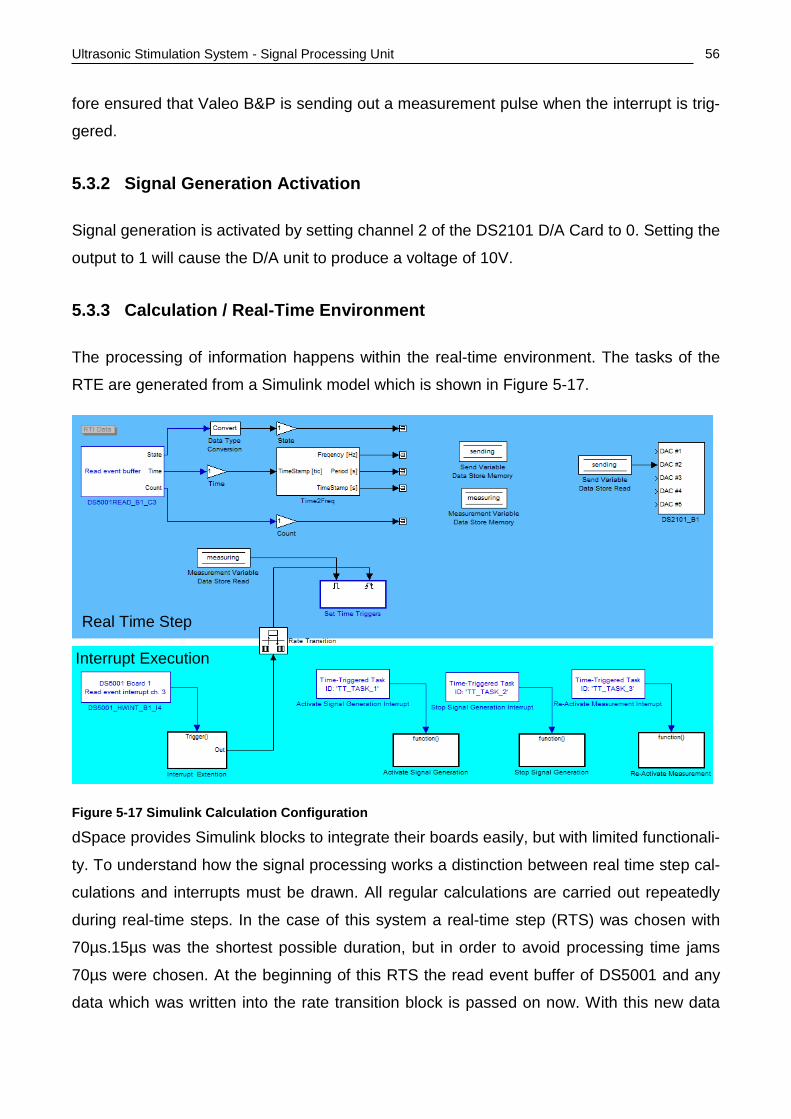
Ultrasonic Stimulation System - Signal Processing Unit
56
fore ensured that Valeo B&P is sending out a measurement pulse when the interrupt is trig-
gered.
5.3.2 Signal Generation Activation
Signal generation is activated by setting channel 2 of the DS2101 D/A Card to 0. Setting the
output to 1 will cause the D/A unit to produce a voltage of 10V.
5.3.3 Calculation / Real-Time Environment
The processing of information happens within the real-time environment. The tasks of the
RTE are generated from a Simulink model which is shown in Figure 5-17.
Figure 5-17 Simulink Calculation Configuration
dSpace provides Simulink blocks to integrate their boards easily, but with limited functionali-
ty. To understand how the signal processing works a distinction between real time step cal-
culations and interrupts must be drawn. All regular calculations are carried out repeatedly
during real-time steps. In the case of this system a real-time step (RTS) was chosen with
70µs.15µs was the shortest possible duration, but in order to avoid processing time jams
70µs were chosen. At the beginning of this RTS the read event buffer of DS5001 and any
data which was written into the rate transition block is passed on now. With this new data
Real Time Step
Interrupt Execution
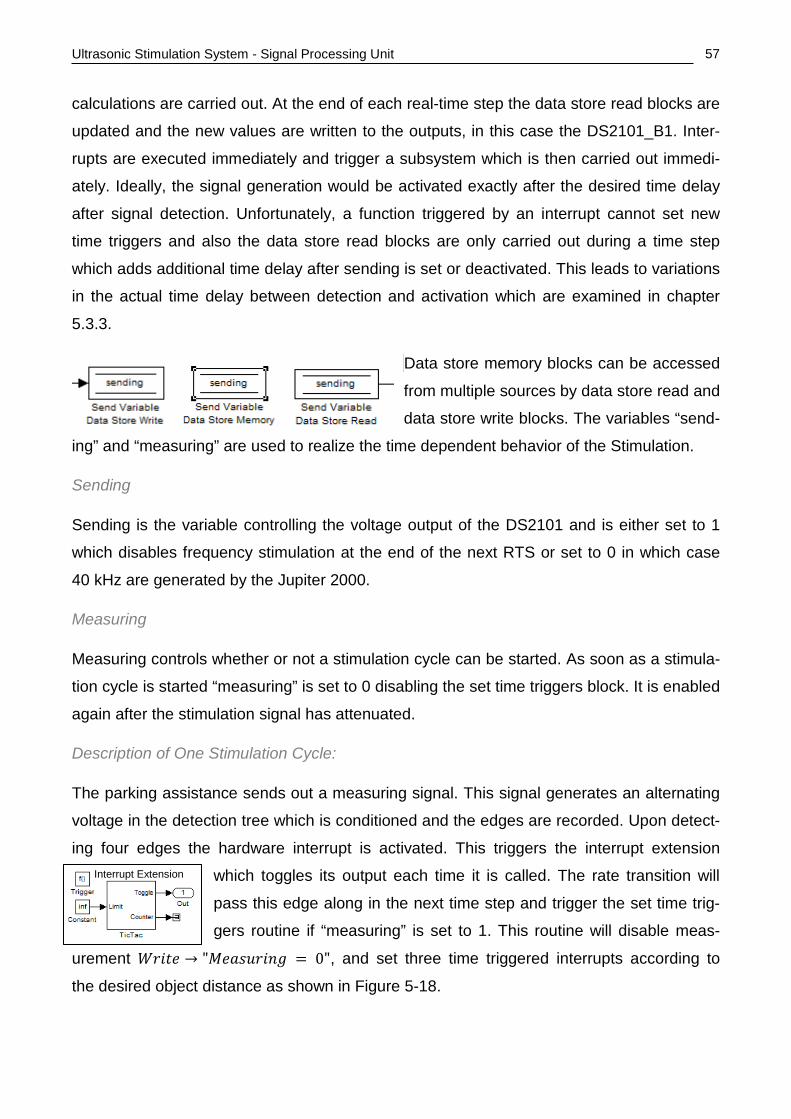
Ultrasonic Stimulation System - Signal Processing Unit
57
calculations are carried out. At the end of each real-time step the data store read blocks are
updated and the new values are written to the outputs, in this case the DS2101_B1. Inter-
rupts are executed immediately and trigger a subsystem which is then carried out immedi-
ately. Ideally, the signal generation would be activated exactly after the desired time delay
after signal detection. Unfortunately, a function triggered by an interrupt cannot set new
time triggers and also the data store read blocks are only carried out during a time step
which adds additional time delay after sending is set or deactivated. This leads to variations
in the actual time delay between detection and activation which are examined in chapter
5.3.3.
Data store memory blocks can be accessed
from multiple sources by data store read and
data store write blocks. The variables “send-
ing” and “measuring” are used to realize the time dependent behavior of the Stimulation.
Sending
Sending is the variable controlling the voltage output of the DS2101 and is either set to 1
which disables frequency stimulation at the end of the next RTS or set to 0 in which case
40 kHz are generated by the Jupiter 2000.
Measuring
Measuring controls whether or not a stimulation cycle can be started. As soon as a stimula-
tion cycle is started “measuring” is set to 0 disabling the set time triggers block. It is enabled
again after the stimulation signal has attenuated.
Description of One Stimulation Cycle:
The parking assistance sends out a measuring signal. This signal generates an alternating
voltage in the detection tree which is conditioned and the edges are recorded. Upon detect-
ing four edges the hardware interrupt is activated. This triggers the interrupt extension
which toggles its output each time it is called. The rate transition will
pass this edge along in the next time step and trigger the set time trig-
gers routine if “measuring” is set to 1. This routine will disable meas-
urement 𝑊𝑟𝑊𝑡𝑊 → "𝑀𝑊𝑡𝑠𝑀𝑟𝑊𝑡𝑙 = 0", and set three time triggered interrupts according to
the desired object distance as shown in Figure 5-18.
Interrupt Extension
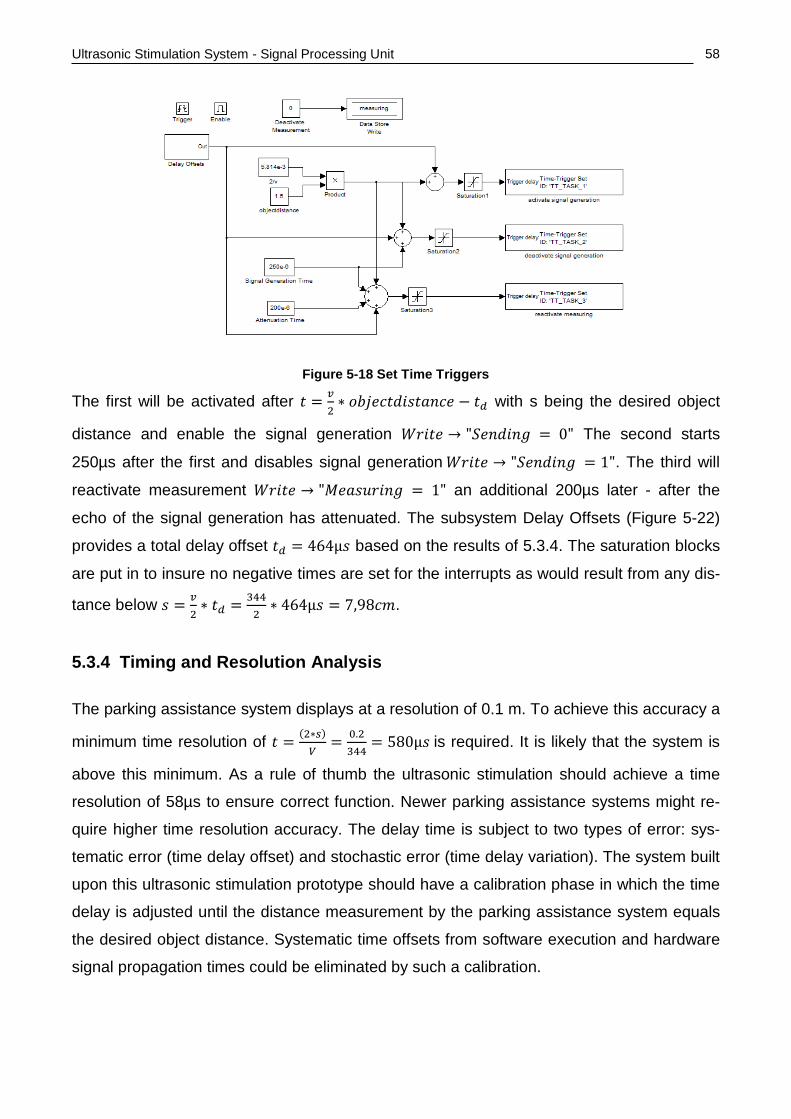
Ultrasonic Stimulation System - Signal Processing Unit
58
Figure 5-18 Set Time Triggers
The first will be activated after 𝑡 = 𝑣2∗ 𝑙𝑜𝑜𝑊𝑐𝑡𝑑𝑊𝑠𝑡𝑡𝑡𝑐𝑊 − 𝑡𝑑 with s being the desired object
distance and enable the signal generation 𝑊𝑟𝑊𝑡𝑊 → "𝑆𝑊𝑡𝑑𝑊𝑡𝑙 = 0" The second starts
250µs after the first and disables signal generation 𝑊𝑟𝑊𝑡𝑊 → "𝑆𝑊𝑡𝑑𝑊𝑡𝑙 = 1". The third will
reactivate measurement 𝑊𝑟𝑊𝑡𝑊 → "𝑀𝑊𝑡𝑠𝑀𝑟𝑊𝑡𝑙 = 1" an additional 200µs later - after the
echo of the signal generation has attenuated. The subsystem Delay Offsets (Figure 5-22)
provides a total delay offset 𝑡𝑑 = 464µ𝑠 based on the results of 5.3.4. The saturation blocks
are put in to insure no negative times are set for the interrupts as would result from any dis-
tance below 𝑠 = 𝑣2∗ 𝑡𝑑 = 344
2∗ 464µ𝑠 = 7,98𝑐𝑚.
5.3.4 Timing and Resolution Analysis
The parking assistance system displays at a resolution of 0.1 m. To achieve this accuracy a
minimum time resolution of 𝑡 = (2∗𝑠)𝑉
= 0.2344
= 580µ𝑠 is required. It is likely that the system is
above this minimum. As a rule of thumb the ultrasonic stimulation should achieve a time
resolution of 58µs to ensure correct function. Newer parking assistance systems might re-
quire higher time resolution accuracy. The delay time is subject to two types of error: sys-
tematic error (time delay offset) and stochastic error (time delay variation). The system built
upon this ultrasonic stimulation prototype should have a calibration phase in which the time
delay is adjusted until the distance measurement by the parking assistance system equals
the desired object distance. Systematic time offsets from software execution and hardware
signal propagation times could be eliminated by such a calibration.
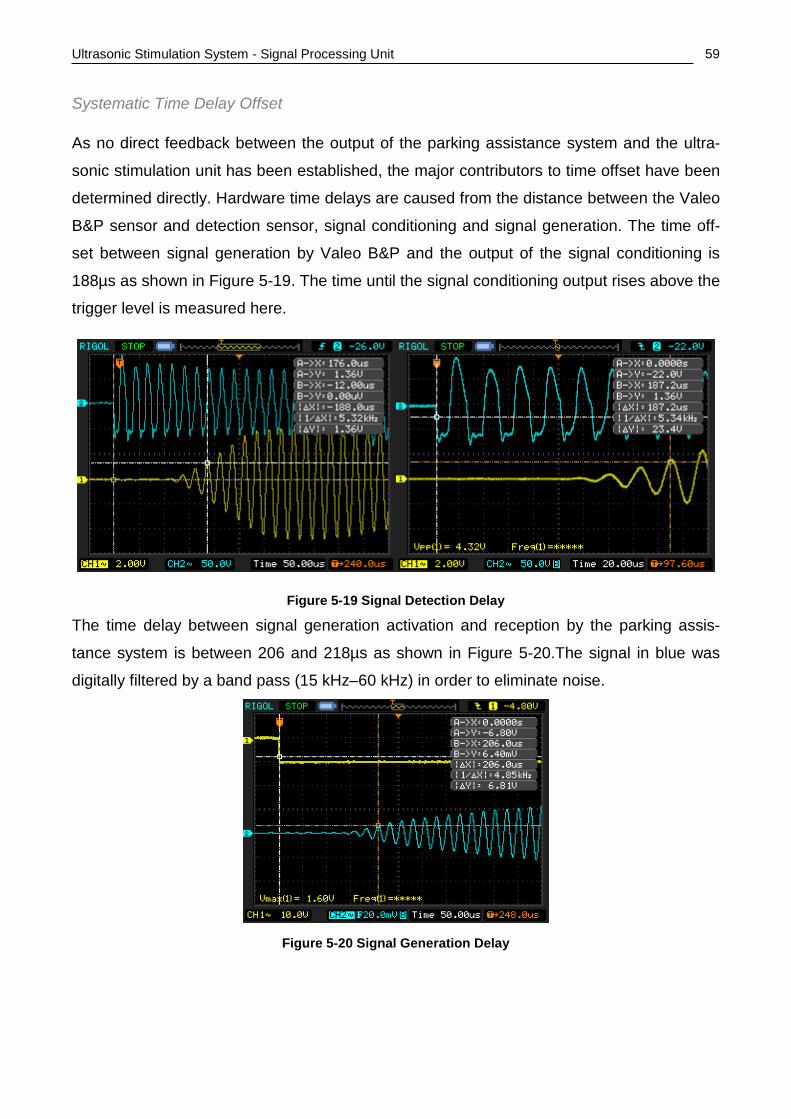
Ultrasonic Stimulation System - Signal Processing Unit
59
Systematic Time Delay Offset
As no direct feedback between the output of the parking assistance system and the ultra-
sonic stimulation unit has been established, the major contributors to time offset have been
determined directly. Hardware time delays are caused from the distance between the Valeo
B&P sensor and detection sensor, signal conditioning and signal generation. The time off-
set between signal generation by Valeo B&P and the output of the signal conditioning is
188µs as shown in Figure 5-19. The time until the signal conditioning output rises above the
trigger level is measured here.
Figure 5-19 Signal Detection Delay
The time delay between signal generation activation and reception by the parking assis-
tance system is between 206 and 218µs as shown in Figure 5-20.The signal in blue was
digitally filtered by a band pass (15 kHz–60 kHz) in order to eliminate noise.
Figure 5-20 Signal Generation Delay
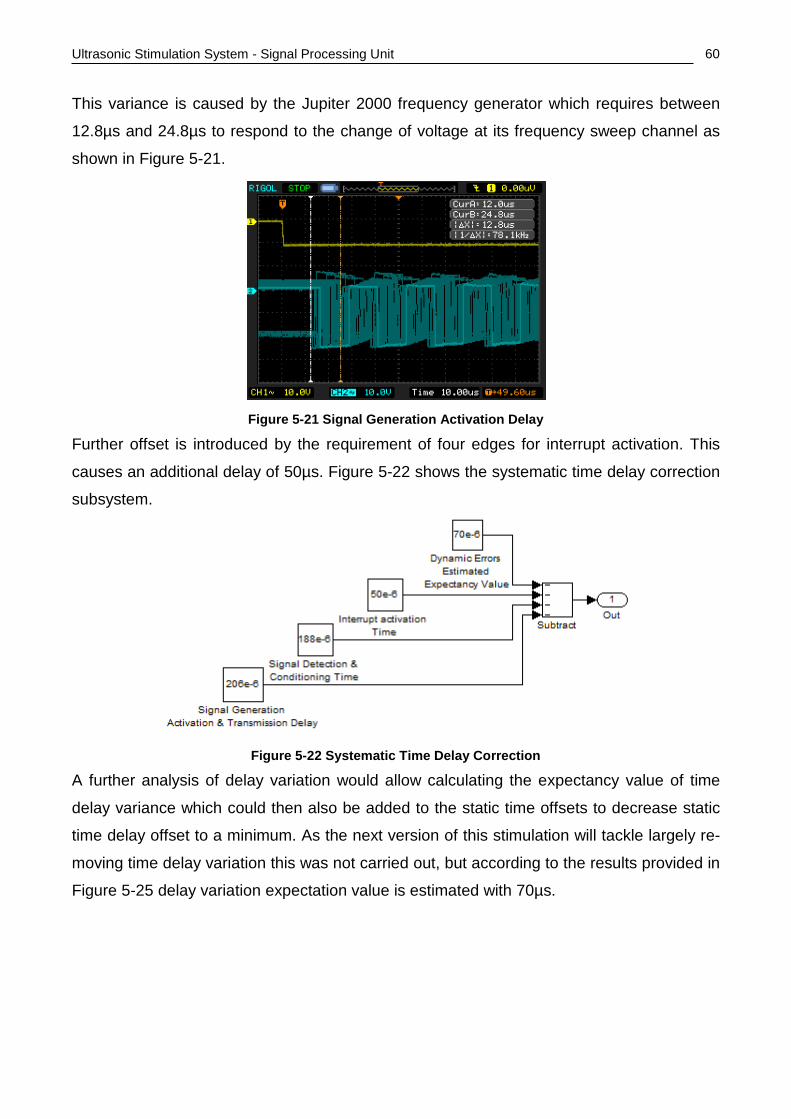
Ultrasonic Stimulation System - Signal Processing Unit
60
This variance is caused by the Jupiter 2000 frequency generator which requires between
12.8µs and 24.8µs to respond to the change of voltage at its frequency sweep channel as
shown in Figure 5-21.
Figure 5-21 Signal Generation Activation Delay
Further offset is introduced by the requirement of four edges for interrupt activation. This
causes an additional delay of 50µs. Figure 5-22 shows the systematic time delay correction
subsystem.
Figure 5-22 Systematic Time Delay Correction
A further analysis of delay variation would allow calculating the expectancy value of time
delay variance which could then also be added to the static time offsets to decrease static
time delay offset to a minimum. As the next version of this stimulation will tackle largely re-
moving time delay variation this was not carried out, but according to the results provided in
Figure 5-25 delay variation expectation value is estimated with 70µs.
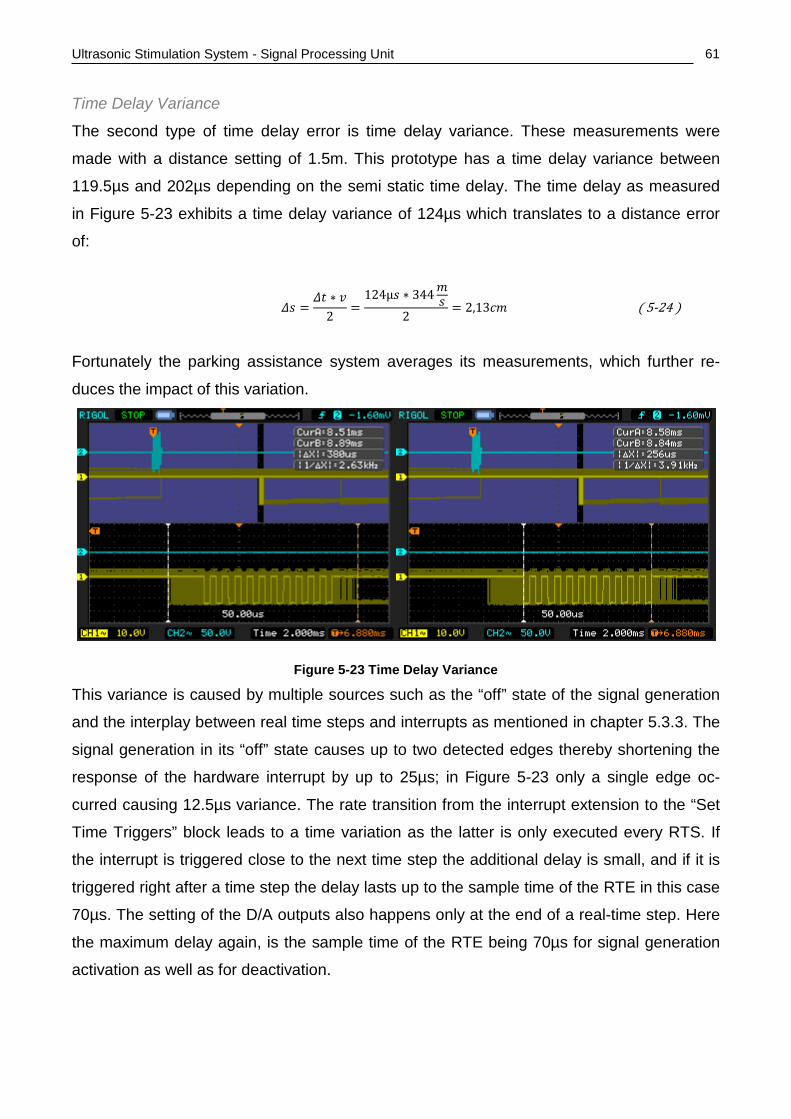
Ultrasonic Stimulation System - Signal Processing Unit
61
Time Delay Variance
The second type of time delay error is time delay variance. These measurements were
made with a distance setting of 1.5m. This prototype has a time delay variance between
119.5µs and 202µs depending on the semi static time delay. The time delay as measured
in Figure 5-23 exhibits a time delay variance of 124µs which translates to a distance error
of:
𝛥𝑠 =𝛥𝑡 ∗ 𝑣
2=124µ𝑠 ∗ 344𝑚𝑠
2= 2,13𝑐𝑚 ( 5-24 )
Fortunately the parking assistance system averages its measurements, which further re-
duces the impact of this variation.
Figure 5-23 Time Delay Variance
This variance is caused by multiple sources such as the “off” state of the signal generation
and the interplay between real time steps and interrupts as mentioned in chapter 5.3.3. The
signal generation in its “off” state causes up to two detected edges thereby shortening the
response of the hardware interrupt by up to 25µs; in Figure 5-23 only a single edge oc-
curred causing 12.5µs variance. The rate transition from the interrupt extension to the “Set
Time Triggers” block leads to a time variation as the latter is only executed every RTS. If
the interrupt is triggered close to the next time step the additional delay is small, and if it is
triggered right after a time step the delay lasts up to the sample time of the RTE in this case
70µs. The setting of the D/A outputs also happens only at the end of a real-time step. Here
the maximum delay again, is the sample time of the RTE being 70µs for signal generation
activation as well as for deactivation.
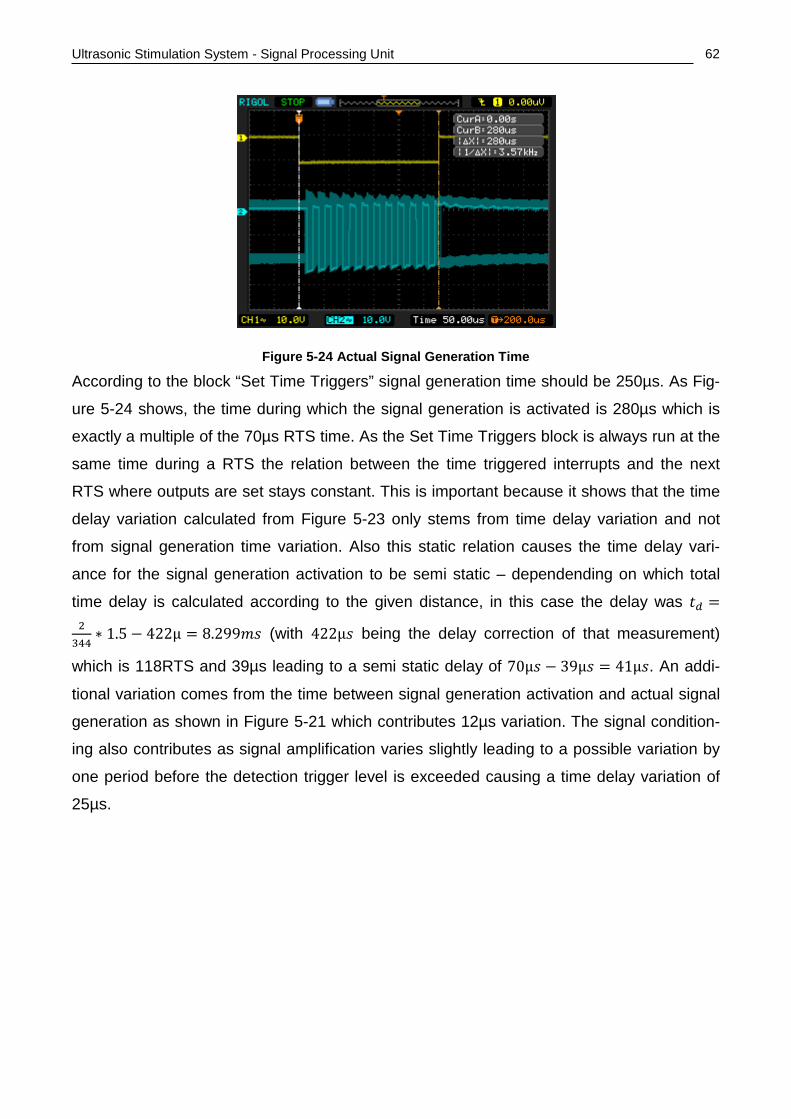
Ultrasonic Stimulation System - Signal Processing Unit
62
Figure 5-24 Actual Signal Generation Time
According to the block “Set Time Triggers” signal generation time should be 250µs. As Fig-
ure 5-24 shows, the time during which the signal generation is activated is 280µs which is
exactly a multiple of the 70µs RTS time. As the Set Time Triggers block is always run at the
same time during a RTS the relation between the time triggered interrupts and the next
RTS where outputs are set stays constant. This is important because it shows that the time
delay variation calculated from Figure 5-23 only stems from time delay variation and not
from signal generation time variation. Also this static relation causes the time delay vari-
ance for the signal generation activation to be semi static – dependending on which total
time delay is calculated according to the given distance, in this case the delay was 𝑡𝑑 =2344
∗ 1.5 − 422µ = 8.299𝑚𝑠 (with 422µ𝑠 being the delay correction of that measurement)
which is 118RTS and 39µs leading to a semi static delay of 70µ𝑠 − 39µ𝑠 = 41µ𝑠. An addi-
tional variation comes from the time between signal generation activation and actual signal
generation as shown in Figure 5-21 which contributes 12µs variation. The signal condition-
ing also contributes as signal amplification varies slightly leading to a possible variation by
one period before the detection trigger level is exceeded causing a time delay variation of
25µs.
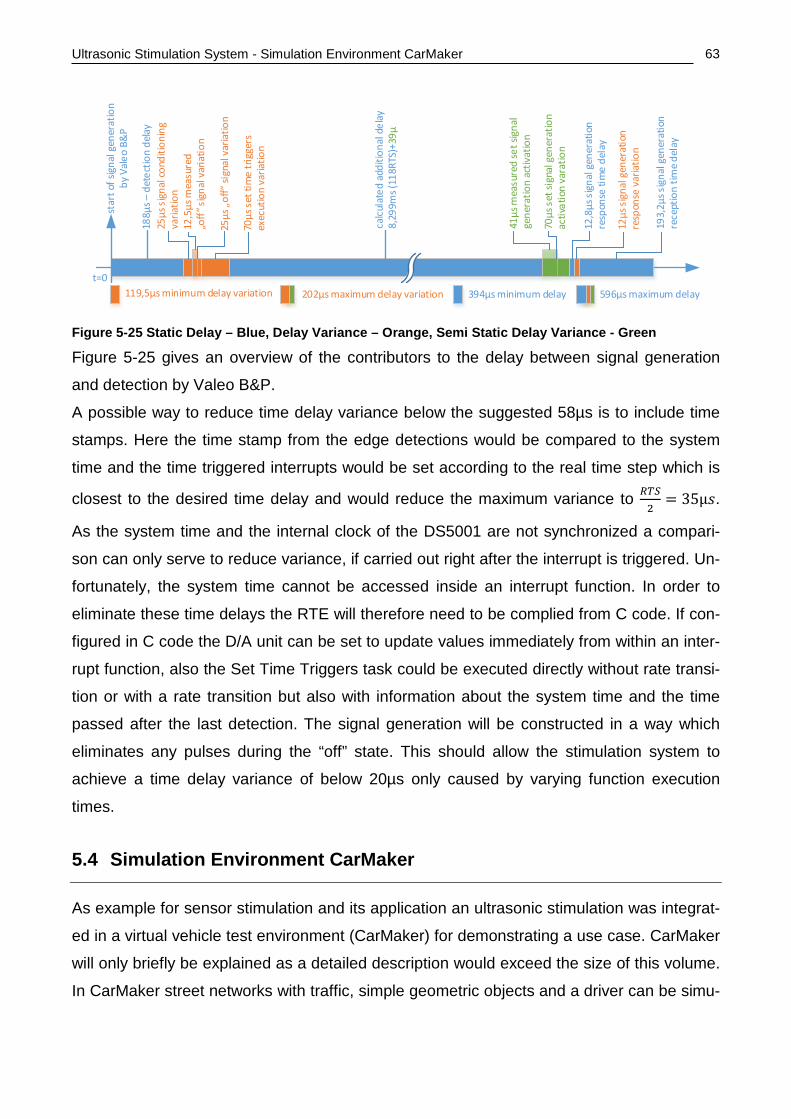
Ultrasonic Stimulation System - Simulation Environment CarMaker
63
Figure 5-25 Static Delay – Blue, Delay Variance – Orange, Semi Static Delay Variance - Green
Figure 5-25 gives an overview of the contributors to the delay between signal generation
and detection by Valeo B&P.
A possible way to reduce time delay variance below the suggested 58µs is to include time
stamps. Here the time stamp from the edge detections would be compared to the system
time and the time triggered interrupts would be set according to the real time step which is
closest to the desired time delay and would reduce the maximum variance to 𝑅𝑇𝑅2
= 35µ𝑠.
As the system time and the internal clock of the DS5001 are not synchronized a compari-
son can only serve to reduce variance, if carried out right after the interrupt is triggered. Un-
fortunately, the system time cannot be accessed inside an interrupt function. In order to
eliminate these time delays the RTE will therefore need to be complied from C code. If con-
figured in C code the D/A unit can be set to update values immediately from within an inter-
rupt function, also the Set Time Triggers task could be executed directly without rate transi-
tion or with a rate transition but also with information about the system time and the time
passed after the last detection. The signal generation will be constructed in a way which
eliminates any pulses during the “off” state. This should allow the stimulation system to
achieve a time delay variance of below 20µs only caused by varying function execution
times.
5.4 Simulation Environment CarMaker
As example for sensor stimulation and its application an ultrasonic stimulation was integrat-
ed in a virtual vehicle test environment (CarMaker) for demonstrating a use case. CarMaker
will only briefly be explained as a detailed description would exceed the size of this volume.
In CarMaker street networks with traffic, simple geometric objects and a driver can be simu-
25µs
sig
nal c
ondi
tioni
ng
varia
tion
188µ
s – d
etec
tion
dela
y
12,5
µs m
easu
red
„off
“ sig
nal v
aria
tion
25µs
„of
f“ si
gnal
var
iatio
n
70µs
set
tim
e tr
igge
rs
exec
utio
n va
riatio
n
calc
ulat
ed a
dditi
onal
del
ay8,
299m
s (11
8RTS
)+39
µ
41µs
mea
sure
d se
t sig
nal
gene
ratio
n ac
tivat
ion
70µs
set
sig
nal g
ener
atio
n ac
tivat
ion
vara
tion
12,8
µs s
igna
l gen
erat
ion
resp
onse
tim
e de
lay
12µs
sig
nal g
ener
atio
n re
spon
se v
aria
tion
t=0
193,
2µs s
igna
l gen
erat
ion
rece
ptio
n tim
e de
lay
star
t of s
igna
l gen
erat
ion
by V
aleo
B&
P
119,5µs minimum delay variation 202µs maximum delay variation 394µs minimum delay 596µs maximum delay
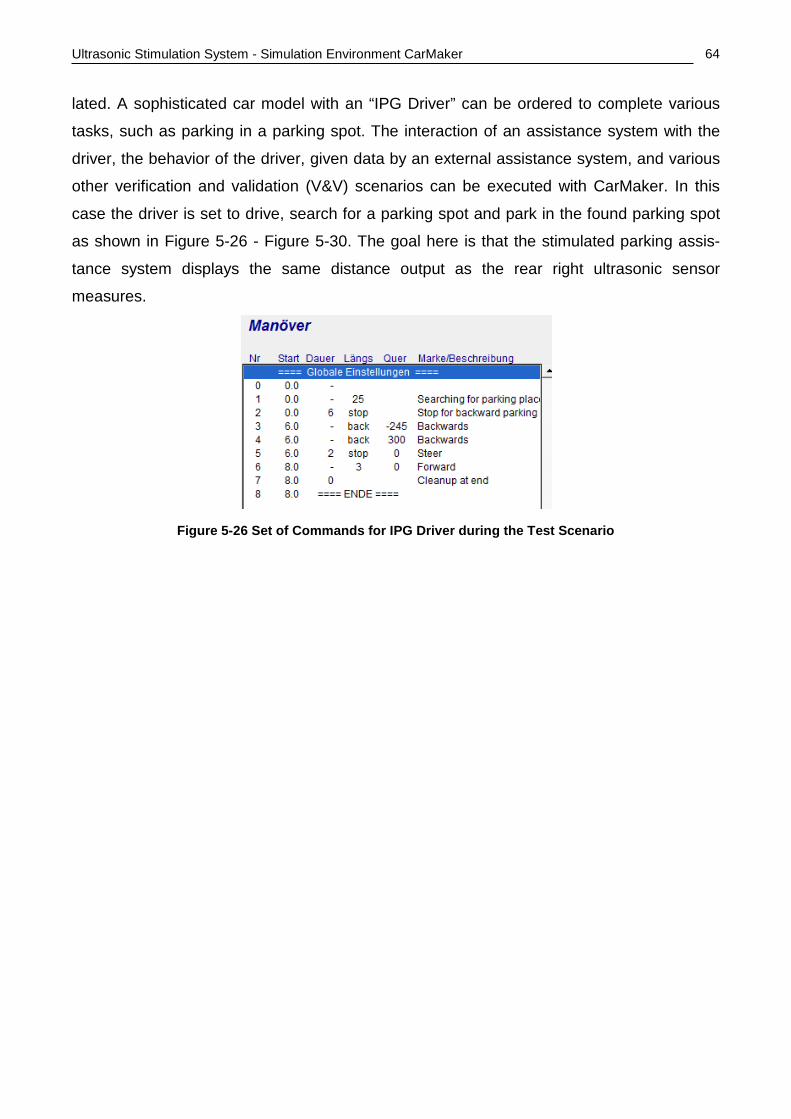
Ultrasonic Stimulation System - Simulation Environment CarMaker
64
lated. A sophisticated car model with an “IPG Driver” can be ordered to complete various
tasks, such as parking in a parking spot. The interaction of an assistance system with the
driver, the behavior of the driver, given data by an external assistance system, and various
other verification and validation (V&V) scenarios can be executed with CarMaker. In this
case the driver is set to drive, search for a parking spot and park in the found parking spot
as shown in Figure 5-26 - Figure 5-30. The goal here is that the stimulated parking assis-
tance system displays the same distance output as the rear right ultrasonic sensor
measures.
Figure 5-26 Set of Commands for IPG Driver during the Test Scenario
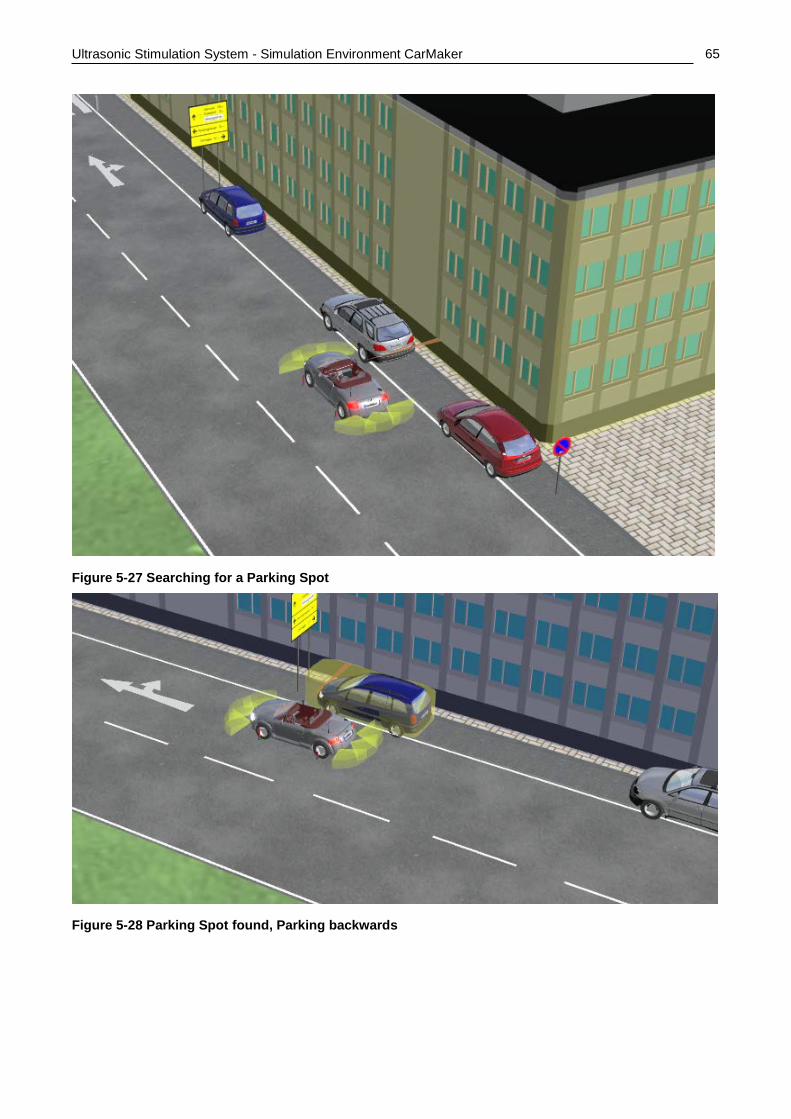
Ultrasonic Stimulation System - Simulation Environment CarMaker
65
Figure 5-27 Searching for a Parking Spot
Figure 5-28 Parking Spot found, Parking backwards
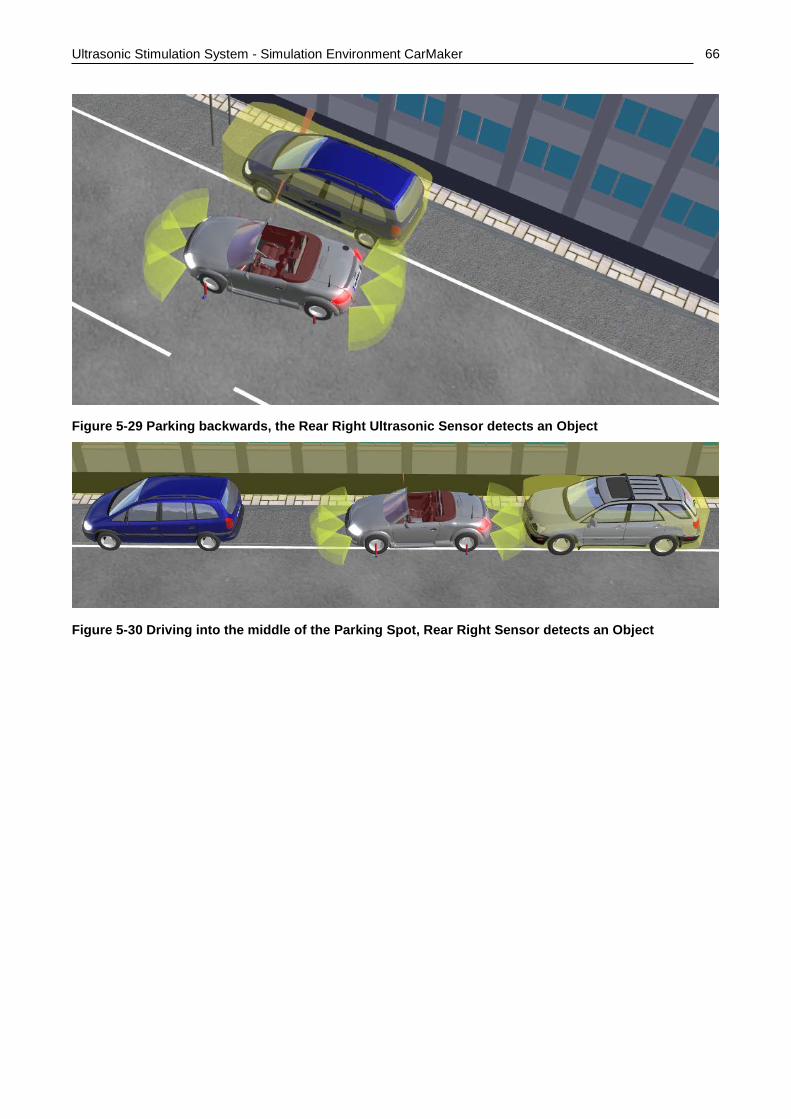
Ultrasonic Stimulation System - Simulation Environment CarMaker
66
Figure 5-29 Parking backwards, the Rear Right Ultrasonic Sensor detects an Object
Figure 5-30 Driving into the middle of the Parking Spot, Rear Right Sensor detects an Object
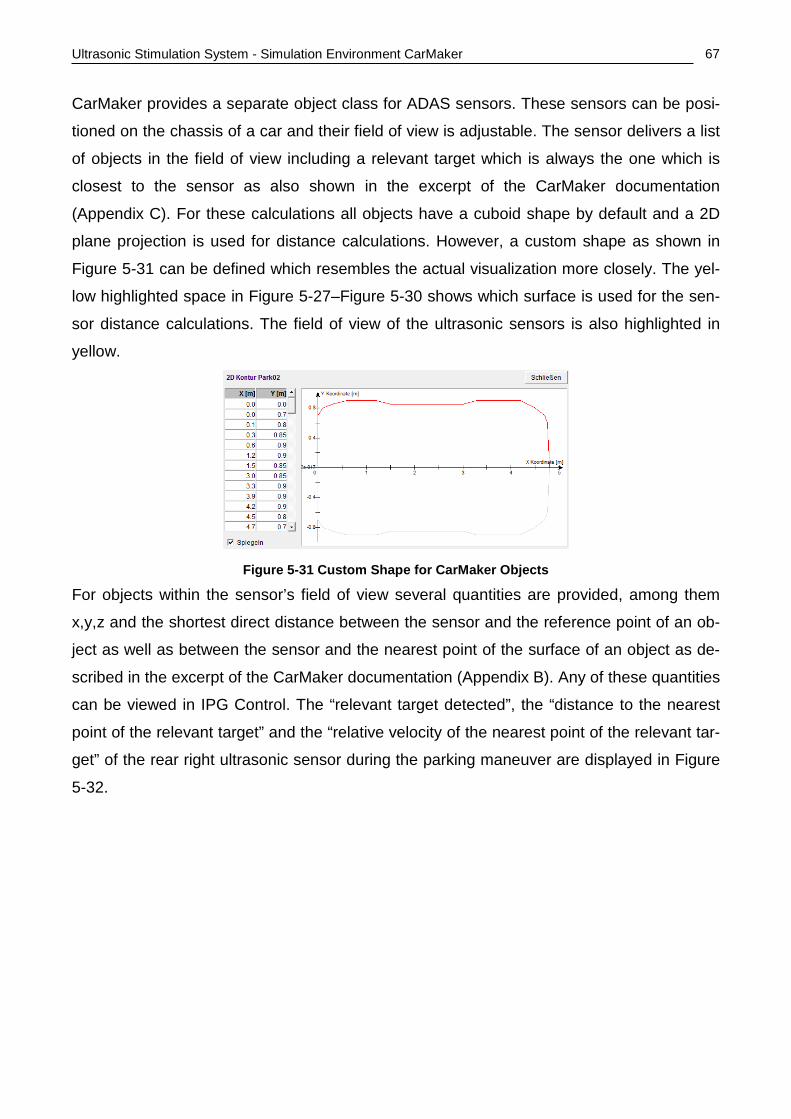
Ultrasonic Stimulation System - Simulation Environment CarMaker
67
CarMaker provides a separate object class for ADAS sensors. These sensors can be posi-
tioned on the chassis of a car and their field of view is adjustable. The sensor delivers a list
of objects in the field of view including a relevant target which is always the one which is
closest to the sensor as also shown in the excerpt of the CarMaker documentation
(Appendix C). For these calculations all objects have a cuboid shape by default and a 2D
plane projection is used for distance calculations. However, a custom shape as shown in
Figure 5-31 can be defined which resembles the actual visualization more closely. The yel-
low highlighted space in Figure 5-27–Figure 5-30 shows which surface is used for the sen-
sor distance calculations. The field of view of the ultrasonic sensors is also highlighted in
yellow.
Figure 5-31 Custom Shape for CarMaker Objects
For objects within the sensor’s field of view several quantities are provided, among them
x,y,z and the shortest direct distance between the sensor and the reference point of an ob-
ject as well as between the sensor and the nearest point of the surface of an object as de-
scribed in the excerpt of the CarMaker documentation (Appendix B). Any of these quantities
can be viewed in IPG Control. The “relevant target detected”, the “distance to the nearest
point of the relevant target” and the “relative velocity of the nearest point of the relevant tar-
get” of the rear right ultrasonic sensor during the parking maneuver are displayed in Figure
5-32.
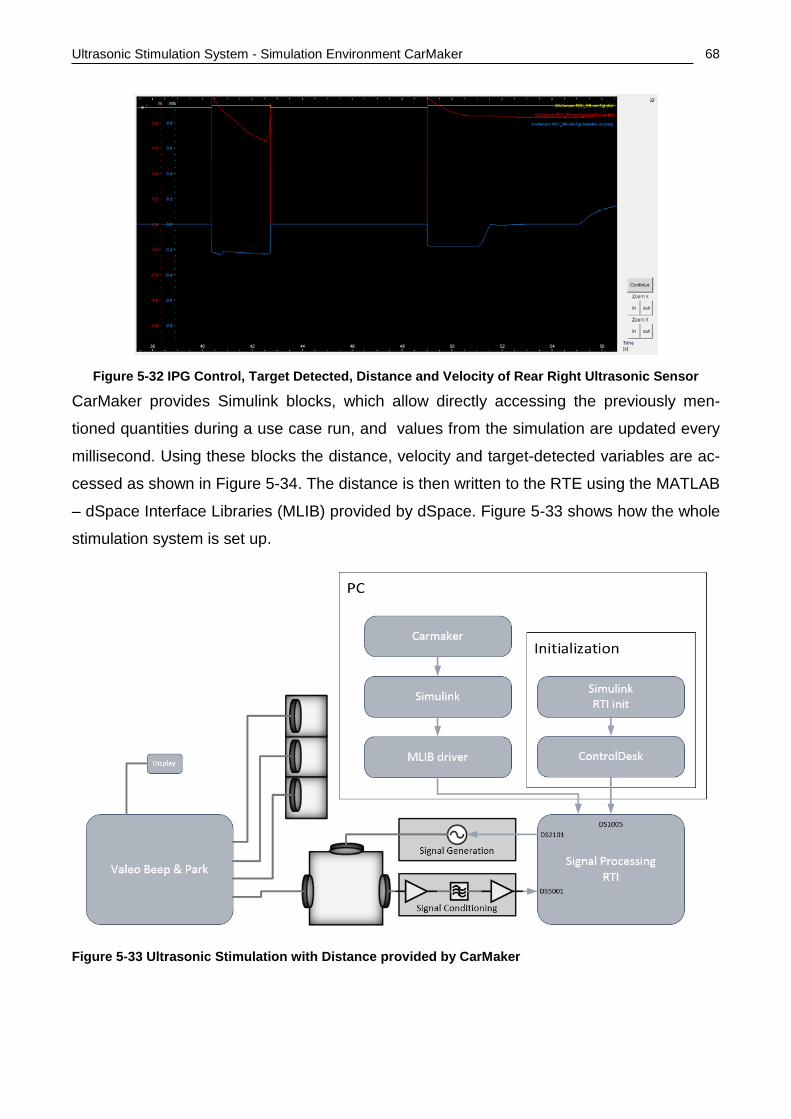
Ultrasonic Stimulation System - Simulation Environment CarMaker
68
Figure 5-32 IPG Control, Target Detected, Distance and Velocity of Rear Right Ultrasonic Sensor
CarMaker provides Simulink blocks, which allow directly accessing the previously men-
tioned quantities during a use case run, and values from the simulation are updated every
millisecond. Using these blocks the distance, velocity and target-detected variables are ac-
cessed as shown in Figure 5-34. The distance is then written to the RTE using the MATLAB
– dSpace Interface Libraries (MLIB) provided by dSpace. Figure 5-33 shows how the whole
stimulation system is set up.
Figure 5-33 Ultrasonic Stimulation with Distance provided by CarMaker
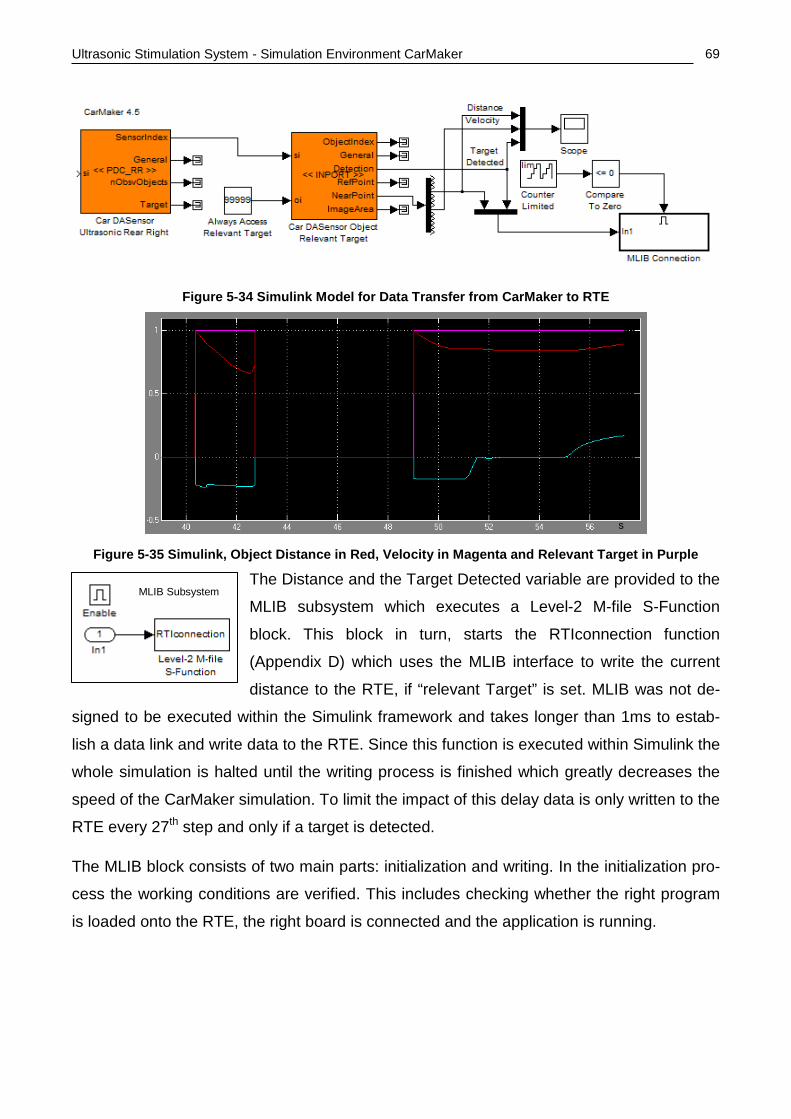
Ultrasonic Stimulation System - Simulation Environment CarMaker
69
Figure 5-34 Simulink Model for Data Transfer from CarMaker to RTE
Figure 5-35 Simulink, Object Distance in Red, Velocity in Magenta and Relevant Target in Purple
The Distance and the Target Detected variable are provided to the
MLIB subsystem which executes a Level-2 M-file S-Function
block. This block in turn, starts the RTIconnection function
(Appendix D) which uses the MLIB interface to write the current
distance to the RTE, if “relevant Target” is set. MLIB was not de-
signed to be executed within the Simulink framework and takes longer than 1ms to estab-
lish a data link and write data to the RTE. Since this function is executed within Simulink the
whole simulation is halted until the writing process is finished which greatly decreases the
speed of the CarMaker simulation. To limit the impact of this delay data is only written to the
RTE every 27th step and only if a target is detected.
The MLIB block consists of two main parts: initialization and writing. In the initialization pro-
cess the working conditions are verified. This includes checking whether the right program
is loaded onto the RTE, the right board is connected and the application is running.
s
MLIB Subsystem
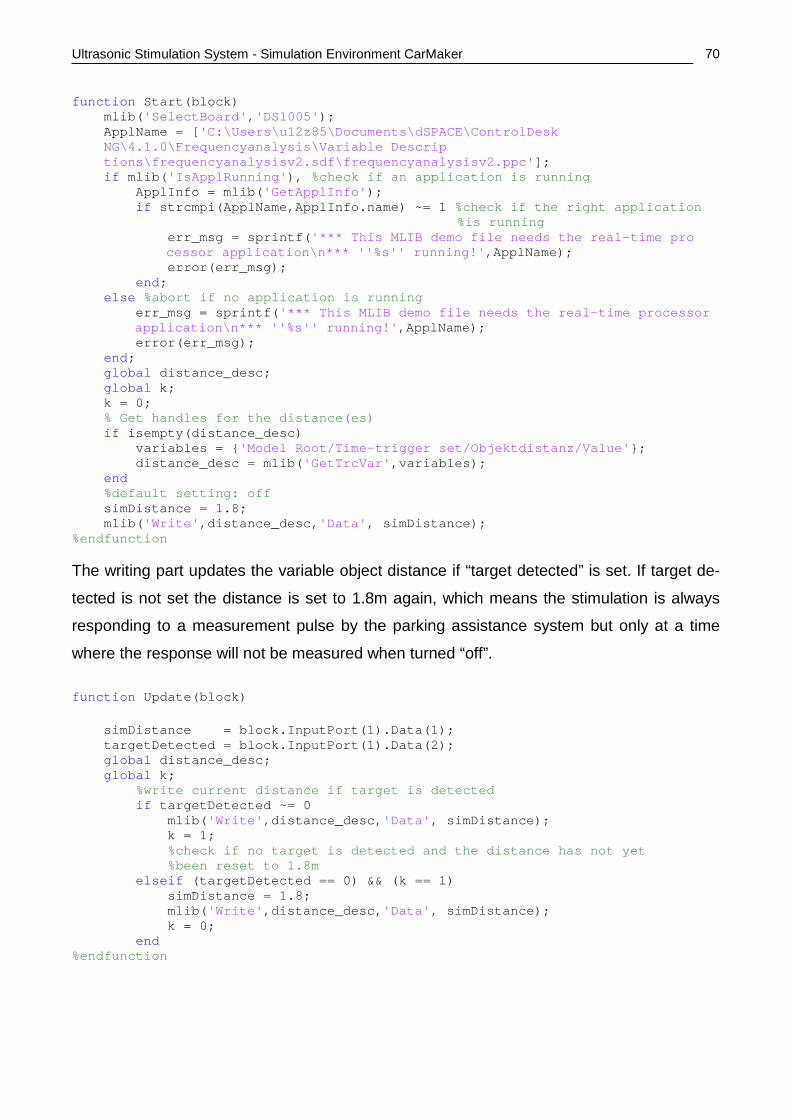
Ultrasonic Stimulation System - Simulation Environment CarMaker
70
function Start(block) mlib('SelectBoard','DS1005'); ApplName = ['C:\Users\u12z85\Documents\dSPACE\ControlDesk NG\4.1.0\Frequencyanalysis\Variable Descrip tions\frequencyanalysisv2.sdf\frequencyanalysisv2.ppc']; if mlib('IsApplRunning'), %check if an application is running ApplInfo = mlib('GetApplInfo'); if strcmpi(ApplName,ApplInfo.name) ~= 1 %check if the right application
%is running err_msg = sprintf('*** This MLIB demo file needs the real-time pro
cessor application\n*** ''%s'' running!',ApplName); error(err_msg); end; else %abort if no application is running err_msg = sprintf('*** This MLIB demo file needs the real-time processor
application\n*** ''%s'' running!',ApplName); error(err_msg); end; global distance_desc; global k; k = 0; % Get handles for the distance(es) if isempty(distance_desc) variables = {'Model Root/Time-trigger set/Objektdistanz/Value'}; distance_desc = mlib('GetTrcVar',variables); end %default setting: off simDistance = 1.8; mlib('Write',distance_desc,'Data', simDistance); %endfunction The writing part updates the variable object distance if “target detected” is set. If target de-
tected is not set the distance is set to 1.8m again, which means the stimulation is always
responding to a measurement pulse by the parking assistance system but only at a time
where the response will not be measured when turned “off”. function Update(block) simDistance = block.InputPort(1).Data(1); targetDetected = block.InputPort(1).Data(2); global distance_desc; global k; %write current distance if target is detected if targetDetected ~= 0 mlib('Write',distance_desc,'Data', simDistance); k = 1; %check if no target is detected and the distance has not yet %been reset to 1.8m elseif (targetDetected == 0) && (k == 1) simDistance = 1.8; mlib('Write',distance_desc,'Data', simDistance); k = 0; end %endfunction
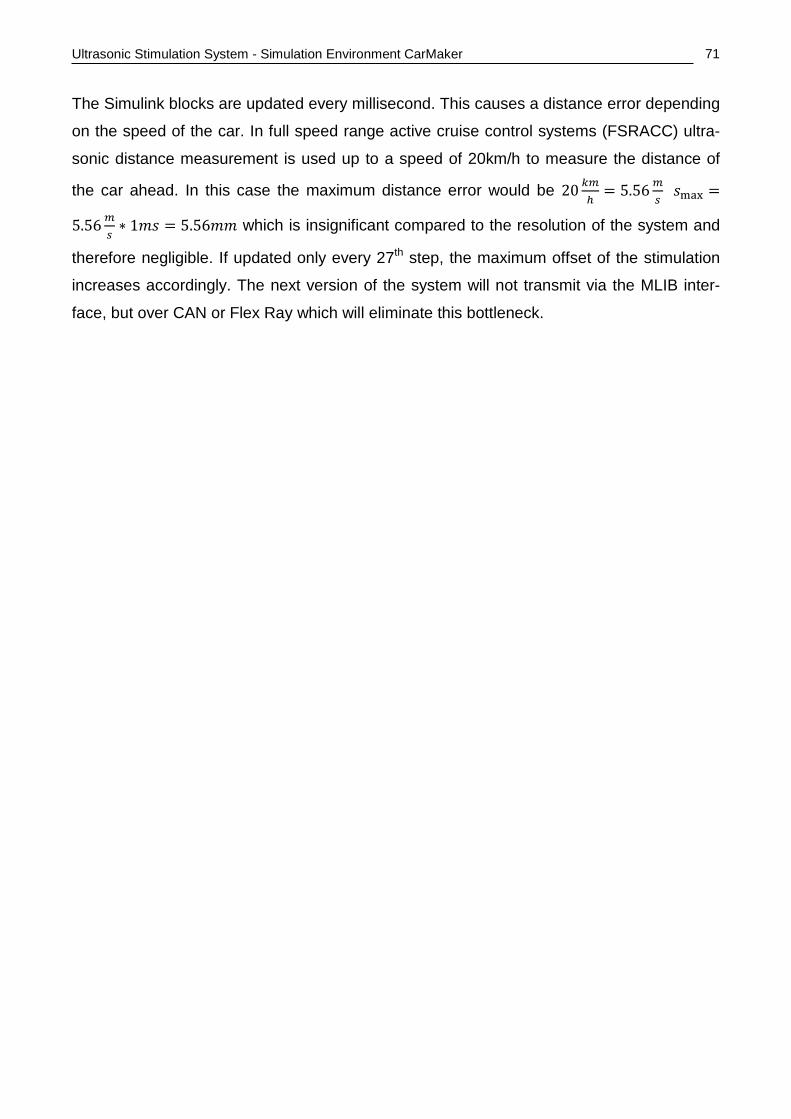
Ultrasonic Stimulation System - Simulation Environment CarMaker
71
The Simulink blocks are updated every millisecond. This causes a distance error depending
on the speed of the car. In full speed range active cruise control systems (FSRACC) ultra-
sonic distance measurement is used up to a speed of 20km/h to measure the distance of
the car ahead. In this case the maximum distance error would be 20 𝑘𝑚ℎ
= 5.56 𝑚𝑠
𝑠max =
5.56 𝑚𝑠∗ 1𝑚𝑠 = 5.56𝑚𝑚 which is insignificant compared to the resolution of the system and
therefore negligible. If updated only every 27th step, the maximum offset of the stimulation
increases accordingly. The next version of the system will not transmit via the MLIB inter-
face, but over CAN or Flex Ray which will eliminate this bottleneck.
Discussion and Outlook - Simulation Environment CarMaker
72
6 Discussion and Outlook
The efforts to improve and make progress towards safety and autonomy of ADAS are cur-
rently increasing on a global scale. The innovations which are to come promise ground-
breaking changes in transportation having the potential to influence our society as a whole.
Test systems which are designed for verification and validation of such systems will gain
importance along with the rising market share of ADAS. The prototype presented in this
thesis will be developed further as part of the effort to establish an all-encompassing sensor
stimulation vehicle in the loop test system. The next version of this prototype will be coded
in C in order to allow the time triggers to be set directly from within the hardware interrupt,
to enable and disable the hardware interrupt instead of setting and clearing the measure-
ment variable and to also set the D/A board outputs directly. Signal generation will be built
in hardware with an additional port to adjust the voltage for the signal generation. During
signal generation the measurement will be disabled by hardware reducing the amount of
computing power and interrupts required. Furthermore, the system will be enhanced in or-
der to be capable of stimulating systems with cross detection capabilities and the MLIB in-
terface will be replaced by CAN or Flex Ray which will allow distance updates every milli-
second. Additionally the system will be expanded to 12 ultrasonic emulation units and a
chassis mounting system will be implemented. To harness the new capabilities of the stimu-
lation system an additional simulation on the basis of the 3D environment of CarMaker will
be subject to research. Moreover, the research for this simulation will focus on providing
amplitude information as well relevant reflections, especially critical measurement impairing
echoes.
Bibliography - Simulation Environment CarMaker
73
7 Bibliography
Provided links tested on 25.9.2014. [1] H. Winner, S. Hakuli und Gabriele Wolf „Handbuch Fahrerassistenzsysteme: Grundlagen, Kom-
ponenten und Systeme für aktive Sicherheit und Komfort“, Vieweg+Teubner, ISBN 978-3-8348-
1457-9, October 2011
[2] W. Cunningham „Volvo sees crash-free car by 2020“, CNET, July 2013
http://www.cnet.com/news/volvo-sees-crash-free-car-by-2020/
[3] I. Preisinger, “Daimler aims to launch self-driving car by 2020”, Reuters, September 2013
http://www.reuters.com/article/2013/09/08/us-autoshow-frankfurt-daimler-selfdrive-
idUSBRE98709A20130908
[4] Strategy Analytics, “Marktvolumen für Fahrerassistenz-Systeme - Prognose bis 2019“, Handels-
blatt, March 2013
[5] J.R. Treat N.S. Tumbas, S.T. McDonald, D. Shinar, R.D. Hume, R.E. Mayer, R.L. Stanisfer,
N.J.Castellan, “Tri-Level Study of the Causes of Traffic Accidents: Final Report”, Institute for Re-
search in Public Safety, Indiana, March 1977
[6] W. Kieswetter, W. Klinkner, W. Reichelt, M. Steiner, „The New Brake Assist of Mercedes-Benz.
Active Support in Emergengy Braking Situations. In: Pauwelussen, J.P: Vehicle Performance.
Tayler & Francis 1999
[7] J. Rasmussen, “Skills, Rules and Knowledge; Signals, Signs and Symbold and other Distinctions
in Human Performance Models. IEEE Transactions on Systems, Man and Cybernetics, Vol. SMC
13, No. 3 (1983), S. 257-266
[8] E. Donges, “Experimentelle Untersuchung und regelungstechnische Modellierung des Lenkver-
haltens von Kraftfahrern bei simulierter Straßenfahrt“, Dissertation TH Darmstadt Juni 1976
[9] M. Lerner, M. Albrecht, C. Evers, „Das Unfallgeschehen bei Nacht. Bericht der Bundesanstalt für
Straßenwesen (BASt), Heft M 172, 2005
[10] K. Reif, “Fahrstabilisierungssysteme und Fahrerassistenzsystme”, Vieweg+Teubner, ISBN-978-3-
8348-1314-5, July 2010
[11] 19. United Nations Conference on Road Traffic, Vienna, November 1968
https://treaties.un.org/doc/Treaties/1977/05/19770524%2000-13%20AM/Ch_XI_B_19.pdf
[12] Accident Database of Volkswagen Accident Research and the GIDAS
[13] Y. Chen, L. Li, “Advances in Intelligent Vehicles”, Zhejiang University Press, ISBN-978-0-1239-
7327-6, May 2014
[14] Zentralverband Deutsches Kraftfahrzeuggewerbe, “Zahlen & Fakten 2013”, ZDK, 2014
http://de.statista.com/statistik/daten/studie/39427/umfrage/verbreitung-ausgewaehlter-pkw-
ausstattung-bei-neu--gebrauchtwagen/
[15] 63. Verordnung der Bundesministerin für Verkehr, Innovation und Technologie betreffend die
Frequenznutzung (Frequenznutzungsverordnung 2013 – FNV 2013), March 2014
http://www.bmvit.gv.at/telekommunikation/recht/aut/verordnungen/downloads/fnv/201463_anhang
2.pdf
Bibliography - Simulation Environment CarMaker
74
[16] Wikipedia, Automotive Safety Integrity Level,
http://en.wikipedia.org/wiki/Automotive_Safety_Integrity_Level
[17] SAE International, “Summary of Levels of Driving Automation for On-Road Vehicles”, May 2013
http://cyberlaw.stanford.edu/blog/2013/12/sae-levels-driving-automation
[18] H. Winner, W. Wachenfeld, „Absicherung automatischen Fahrens“, 6. FAS Tagung, Munich, No-
vember 2013
[19] http://www.sengpielaudio.com/calculator-soundlevel.htm
[20] W. Lehfeldt, „Ultraschall kurz und bündig Physikalische Grundlagen und Anwendungen“, Vogel-
Verlag,ISBN 3-8023-0060-2, 1973
[21] http://en.wikipedia.org/wiki/Sound_pressure
http://de.wikipedia.org/wiki/Schalldruck
Table of Figures - Simulation Environment CarMaker
75
8 Table of Figures
Figure 1-1 Overview of a Vehicle in the Loop ADAS Test System .................................. 2
Figure 2-1 The Driving Task ............................................................................................ 5
Figure 3-1 Main Lobe in Grey, Side Lobes in Blue ........................................................ 25
Figure 5-1 Schematic Overview over the Stimulation System ....................................... 40
Figure 5-2 Schematic of the Parking Assistance System Valeo B&P n°3 ...................... 41
Figure 5-3 Visual Display of Measured Distances and Parking Recommendation ........ 42
Figure 5-4 Schematic view of the Ultrasonic Measurement Units .................................. 43
Figure 5-5 Signal Generation ......................................................................................... 44
Figure 5-6 Detection Pattern when no echo detected (left) and when an echo is detected
(right) .................................................................................................... 44
Figure 5-7 Detection Sensitivity, Stimulation Signal: Yellow .......................................... 45
Figure 5-8 Measurement Setup 1, 2 & 3 ........................................................................ 45
Figure 5-9 Two directions of calculating Sensitivity and SPL......................................... 48
Figure 5-10 Measurement Setup 4 ................................................................................ 50
Figure 5-11 Measurement Setup 5 ................................................................................ 50
Figure 5-12 Ultrasonic Stimulation System .................................................................... 52
Figure 5-13 Signal Generation before and after applying +10V to the Sweep Channel. 53
Figure 5-14 Schematic of the active Band Pass ............................................................ 53
Figure 5-15 Signal Conditioning Stage .......................................................................... 54
Figure 5-16 Ultrasonic Stimulation System .................................................................... 55
Figure 5-17 Simulink Calculation Configuration ............................................................. 56
Figure 5-18 Set Time Triggers ....................................................................................... 58
Figure 5-19 Signal Detection Delay ............................................................................... 59
Figure 5-20 Signal Generation Delay ............................................................................ 59
Figure 5-21 Signal Generation Activation Delay ............................................................ 60
Figure 5-22 Systematic Time Delay Correction ............................................................. 60
Figure 5-23 Time Delay Variance .................................................................................. 61
Figure 5-24 Actual Signal Generation Time ................................................................... 62
Figure 5-25 Static Delay – blue, Delay Variance – orange, semi static delay variance -
green .................................................................................................... 63
Figure 5-26 Set of commands for IPG Driver during the Test Scenario ......................... 64
Figure 5-27 Searching for a Parking Spot...................................................................... 65
Table of Figures - Simulation Environment CarMaker
76
Figure 5-28 Parking Spot found, Parking Backwards .................................................... 65
Figure 5-29 Parking Backwards, The Rear Right Ultrasonic Sensor detects an object . 66
Figure 5-30 Driving into the middle of the Parking Spot, Rear Right Sensor detects an
object .................................................................................................... 66
Figure 5-31 Custom Shape for CarMaker Objects ......................................................... 67
Figure 5-32 IPG Control, Target Detected, Distance and Velocity of Rear Right Ultrasonic
Sensor .................................................................................................. 68
Figure 5-33 Ultrasonic Stimulation with distance provided by Carmaker ....................... 68
Figure 5-34 Simulink Model for Data Transfer from Carmaker to RTE .......................... 69
Figure 5-35 Simulink, Object Distance in Red, Velocity in Magenta and Relevant Target in
Purple ................................................................................................... 69
Table of Tables - Simulation Environment CarMaker
77
9 Table of Tables
Table 1 Transmitter KPUS, Receiver KPUS Measurement Setup 1 .............................. 46
Table 2 Transmitter KPUS, Receiver Valeo B&P Measurement Setup 2 ...................... 50
Table 3 Transmitter Valeo B&P, Receiver KPUS Measurement Setup 3 ...................... 50
Table 4 Transmitter KPUS, Receiver Valeo B&P Measurement Setup 4 ...................... 51
Table 5 Transmitter Valeo B&P, Receiver KPUS Measurement Setup 5 ...................... 51
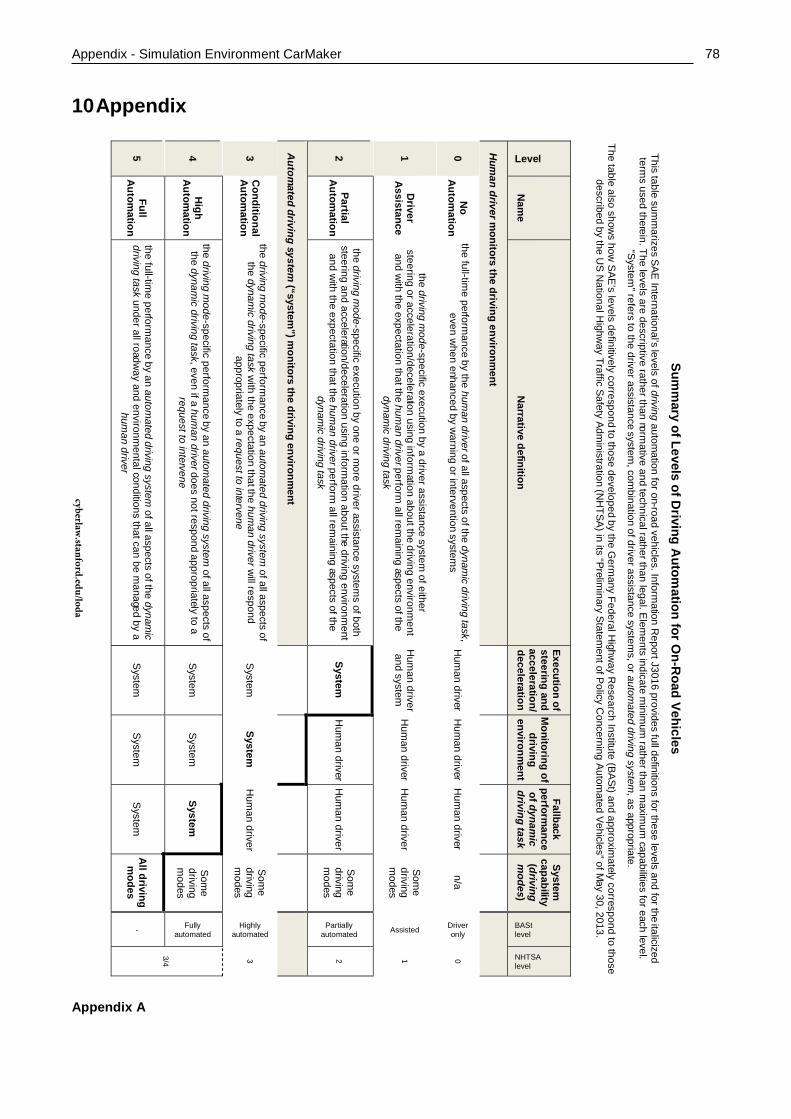
Appendix - Simulation Environment CarMaker
78
10 Appendix
Appendix A
Summ
aryofLevels
ofDriv ing
Autom
ationforO
n-Road
VehiclesThis
tablesum
marizes
SAEInternational’s
levelsofdriving autom
ation for on-roadvehicles. Inform
ation Report J3016
providesfull definitions
for these levels and for theitalicized
terms used therein. The levels are descriptive rather than norm
ative andtechnical ratherthan legal.E
lements
indicatem
inimum
ratherthan maxim
um capabilities
for each level.“S
ystem"refers
to the driver assistancesystem
,combination
ofdriverassistancesystem
s,orautomated
drivingsystem
, as appropriate.
Thetable
alsoshow
show
SAE’slevels
definitivelycorrespond
tothose developed
by theG
ermany
Federal Highw
ayR
esearch Institute (BASt) andapproxim
ately correspond to thosedescribed
by theU
S National H
ighway
TrafficSafety Adm
inistration(N
HTSA
) in its “Preliminary
Statement ofP
olicyC
oncerning Autom
ated Vehicles” of May 30,2013.
Level
Nam
eN
arrativedefinition
Executionof
steering andacceleration/deceleration
Monitoring
ofdriving
environment
Fallbackperform
anceofdynam
icdriving
task
Systemcapability(drivingm
odes)
BAStlevel
NHTSAlevel
Hum
andriverm
onitorsthe
drivingenvironm
ent
0N
oA
utomation
the full-time perform
anceby the
human driverofallaspects
ofthedynam
icdriving
task,even w
hen enhancedby
warning
or interventionsystem
sH
uman driver
Hum
an driverH
uman driver
n/a
Driveronly
0
1D
riverA
ssistance
thedriving
mode-specific execution
by adriverassistance
systemofeither
steering or acceleration/deceleration usinginform
ation about thedriving environm
entand
with the
expectation that thehum
an driver perform all rem
aining aspects ofthedynam
icdriving
task
Hum
an driverand
systemH
uman driver
Hum
an driverS
ome
drivingm
odes
Assisted
1
2Partial
Autom
ation
thedriving
mode-specific execution
by one or more driver assistance
systems of both
steering and acceleration/deceleration usinginform
ation about the driving environment
andw
ith theexpectation that the
human driver perform
all remaining aspects ofthe
dynamic
drivingtask
SystemH
uman driver
Hum
an driverS
ome
drivingm
odes
Partiallyautomated
2
Autom
ateddriving system
(“system”)m
onitors the drivingenvironm
ent
3C
onditionalA
utomation
thedriving
mode-specific perform
anceby an
automated
drivingsystem
ofallaspectsof
thedynam
icdriving
taskw
ith theexpectation thatthe
human
driverwillrespond
appropriately toa
request to interveneS
ystemSystem
Hum
an driverS
ome
drivingm
odes
Highlyautomated
3
4H
ighA
utomation
thedriving
mode-specific perform
anceby an
automated
drivingsystem
ofallaspectsof
thedynam
icdriving
task, even if ahum
an driver does not respondappropriately to a
request to interveneS
ystemS
ystemSystem
Som
edrivingm
odes
Fullyautomated
3/4
5Full
Autom
ationthe full-tim
e performance
by anautom
ateddriving
systemofallaspects
ofthedynam
icdriving
taskunder all roadw
ay and environmental conditions that can be m
anagedby a
human driver
System
System
System
Alldrivingm
odes
-
cyberlaw.stanford.edu/loda
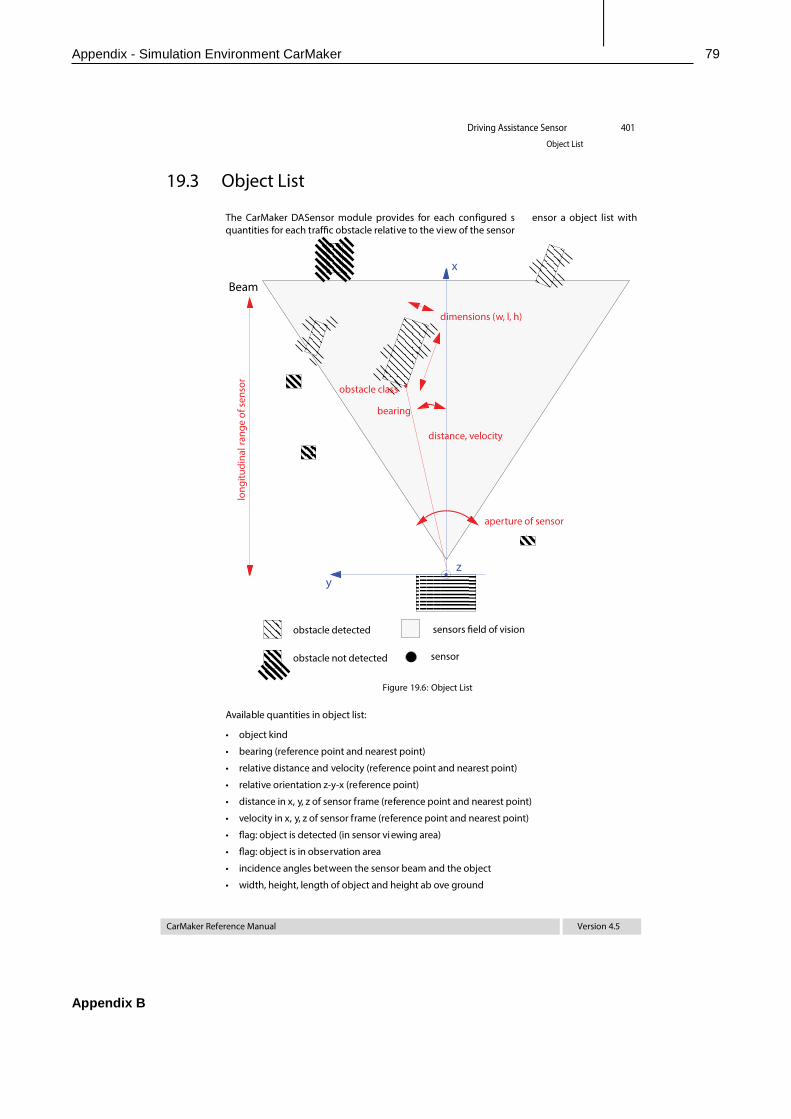
Appendix - Simulation Environment CarMaker
79
Appendix B
401Driving Assistance Sensor
Object List
CarMaker Reference Manual Version 4.5
19.3 Object List
The CarMaker DASensor module provides for each configured s ensor a object list withquantities for each traffic obstacle relative to the view of the sensor
Available quantities in object list:
• object kind
• bearing (reference point and nearest point)
• relative distance and velocity (reference point and nearest point)
• relative orientation z-y-x (reference point)
• distance in x, y, z of sensor frame (reference point and nearest point)
• velocity in x, y, z of sensor frame (reference point and nearest point)
• flag: object is detected (in sensor vi ewing area)
• flag: object is in observation area
• incidence angles between the sensor beam and the object
• width, height, length of object and height ab ove ground
sensorobstacle not detected
long
itudi
nalr
ange
of s
enso
r
obstacle detected sensors field of vision
Beam
aperture of sensor
Figure 19.6: Object List
distance, velocity
dimensions (w, l, h)
obstacle class
x
yz
bearing
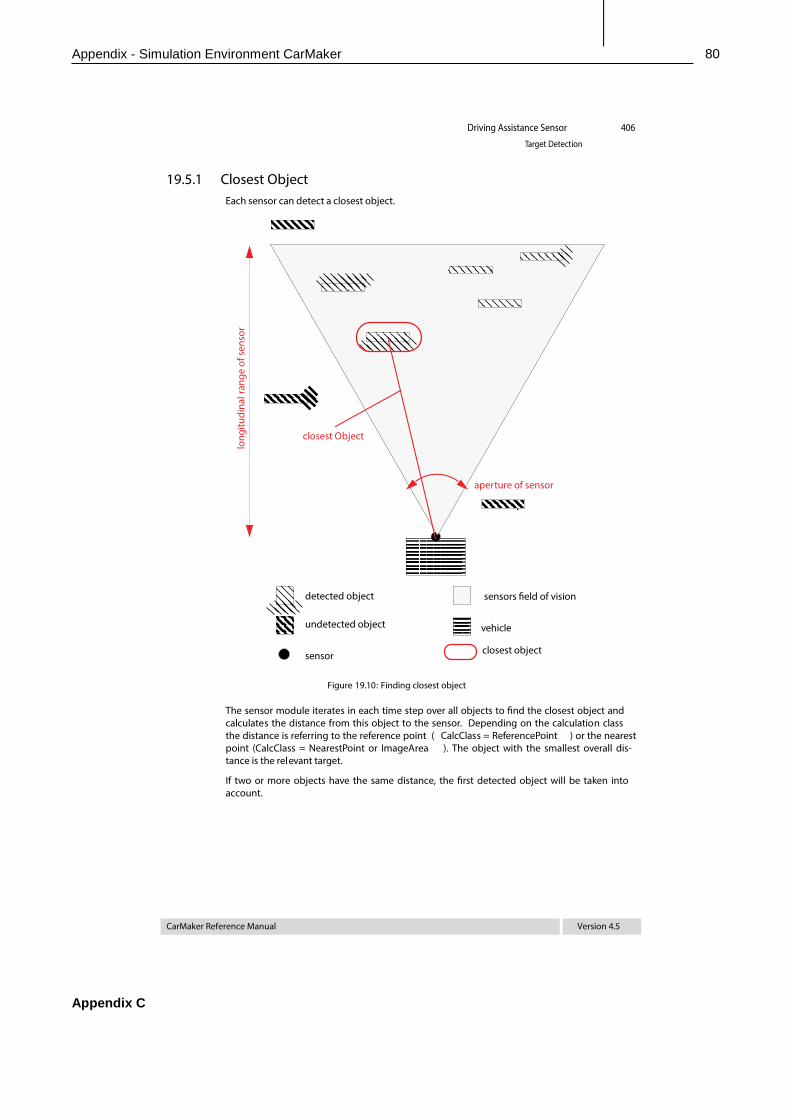
Appendix - Simulation Environment CarMaker
80
Appendix C
406Driving Assistance Sensor
Target Detection
CarMaker Reference Manual Version 4.5
19.5.1 Closest ObjectEach sensor can detect a closest object.
The sensor module iterates in each time step over all objects to find the closest object andcalculates the distance from this object to the sensor. Depending on the calculation classthe distance is referring to the reference point ( CalcClass = ReferencePoint ) or the nearestpoint (CalcClass = NearestPoint or ImageArea ). The object with the smallest overall dis-tance is the relevant target.
If two or more objects have the same distance, the first detected object will be taken intoaccount.
vehicle
sensor
undetected object
long
itudi
nalr
ange
of s
enso
r
detected object sensors field of vision
aperture of sensor
Figure 19.10: Finding closest object
closest Object
closest object
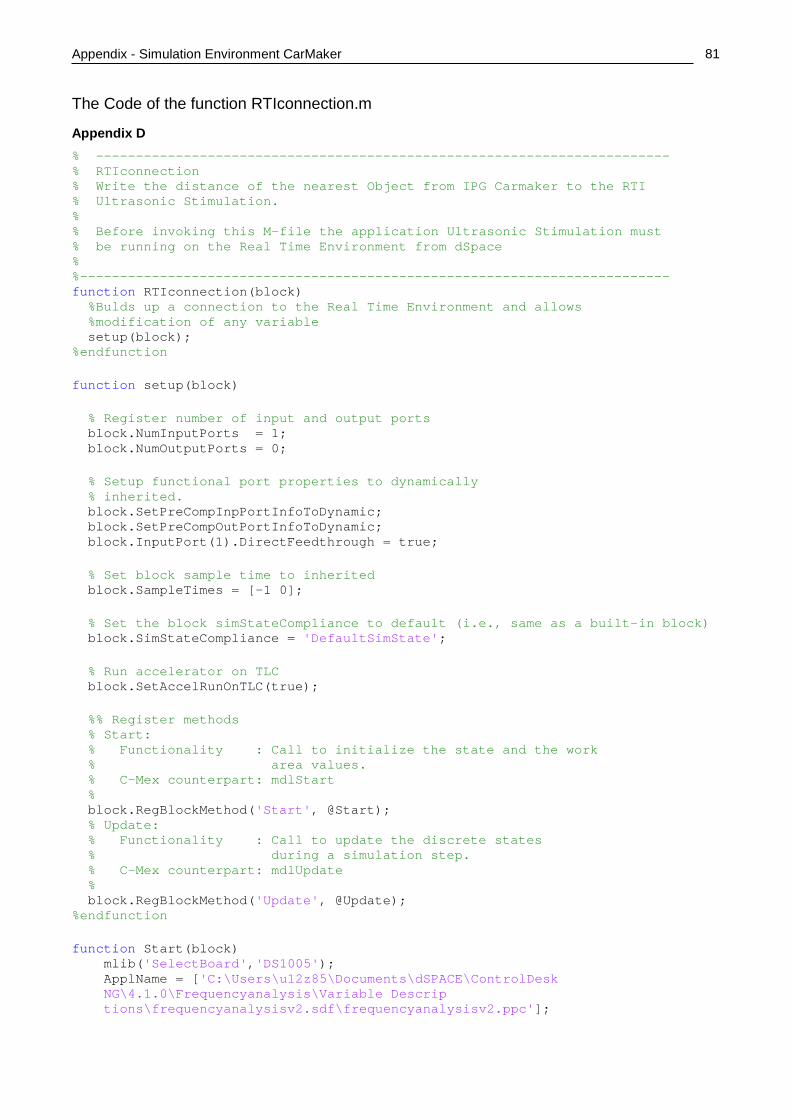
Appendix - Simulation Environment CarMaker
81
The Code of the function RTIconnection.m
Appendix D % ------------------------------------------------------------------------ % RTIconnection % Write the distance of the nearest Object from IPG Carmaker to the RTI % Ultrasonic Stimulation. % % Before invoking this M-file the application Ultrasonic Stimulation must % be running on the Real Time Environment from dSpace % %-------------------------------------------------------------------------- function RTIconnection(block) %Bulds up a connection to the Real Time Environment and allows %modification of any variable setup(block); %endfunction function setup(block) % Register number of input and output ports block.NumInputPorts = 1; block.NumOutputPorts = 0; % Setup functional port properties to dynamically % inherited. block.SetPreCompInpPortInfoToDynamic; block.SetPreCompOutPortInfoToDynamic; block.InputPort(1).DirectFeedthrough = true; % Set block sample time to inherited block.SampleTimes = [-1 0]; % Set the block simStateCompliance to default (i.e., same as a built-in block) block.SimStateCompliance = 'DefaultSimState'; % Run accelerator on TLC block.SetAccelRunOnTLC(true); %% Register methods % Start: % Functionality : Call to initialize the state and the work % area values. % C-Mex counterpart: mdlStart % block.RegBlockMethod('Start', @Start); % Update: % Functionality : Call to update the discrete states % during a simulation step. % C-Mex counterpart: mdlUpdate % block.RegBlockMethod('Update', @Update); %endfunction function Start(block) mlib('SelectBoard','DS1005'); ApplName = ['C:\Users\u12z85\Documents\dSPACE\ControlDesk NG\4.1.0\Frequencyanalysis\Variable Descrip tions\frequencyanalysisv2.sdf\frequencyanalysisv2.ppc'];
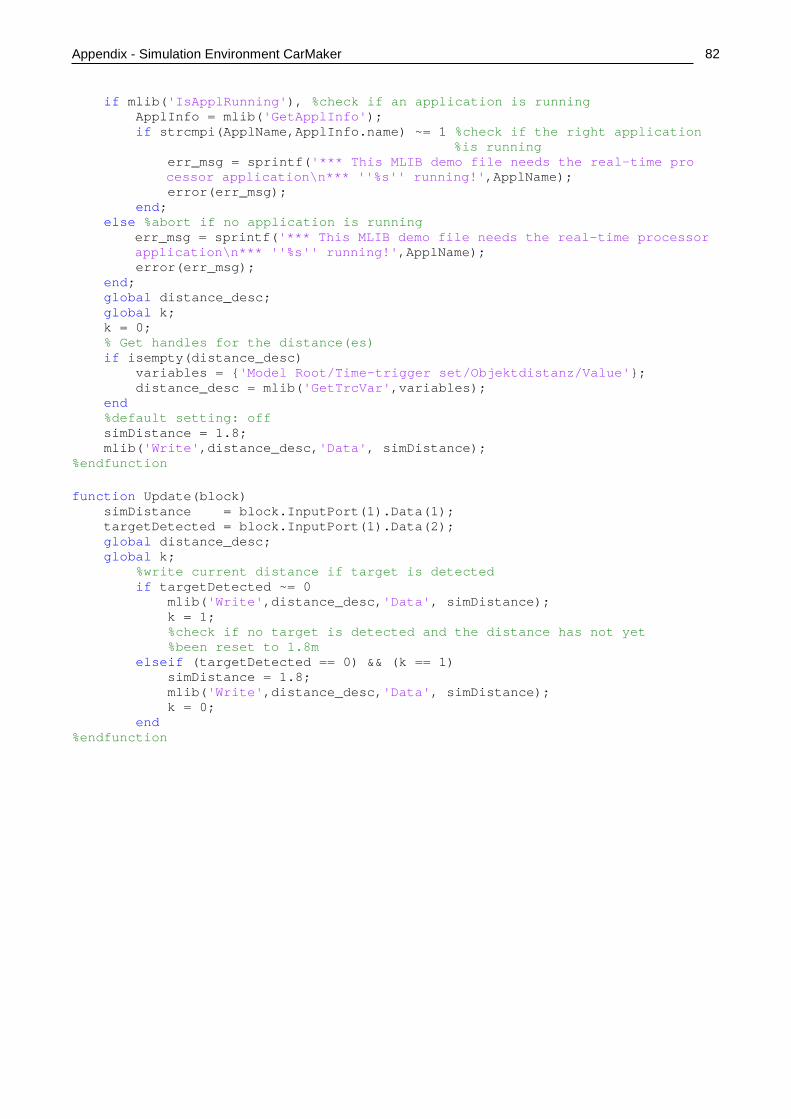
Appendix - Simulation Environment CarMaker
82
if mlib('IsApplRunning'), %check if an application is running ApplInfo = mlib('GetApplInfo'); if strcmpi(ApplName,ApplInfo.name) ~= 1 %check if the right application %is running err_msg = sprintf('*** This MLIB demo file needs the real-time pro
cessor application\n*** ''%s'' running!',ApplName); error(err_msg); end; else %abort if no application is running
err_msg = sprintf('*** This MLIB demo file needs the real-time processor application\n*** ''%s'' running!',ApplName);
error(err_msg); end; global distance_desc; global k; k = 0; % Get handles for the distance(es) if isempty(distance_desc) variables = {'Model Root/Time-trigger set/Objektdistanz/Value'}; distance_desc = mlib('GetTrcVar',variables); end %default setting: off simDistance = 1.8; mlib('Write',distance_desc,'Data', simDistance); %endfunction function Update(block) simDistance = block.InputPort(1).Data(1); targetDetected = block.InputPort(1).Data(2); global distance_desc; global k; %write current distance if target is detected if targetDetected ~= 0 mlib('Write',distance_desc,'Data', simDistance); k = 1; %check if no target is detected and the distance has not yet %been reset to 1.8m elseif (targetDetected == 0) && (k == 1) simDistance = 1.8; mlib('Write',distance_desc,'Data', simDistance); k = 0; end %endfunction